Coles County, IL
Coles County Map
Coles County Overview
47,076
TOTAL POPULATION
23,095
MALE POPULATION
23,981
FEMALE POPULATION
96.31
MALES / 100 FEMALES
103.84
FEMALES / 100 MALES
37.4
MEDIAN AGE
2.7
AVG FAMILY SIZE
2.1
AVG HOUSEHOLD SIZE
$32,395
PER CAPITA INCOME
$68,710
AVG FAMILY INCOME
$53,732
AVG HOUSEHOLD INCOME
22.8%
WAGE / INCOME GAP [ % ]
77.2¢/ $1
WAGE / INCOME GAP [ $ ]
$8,180
FAMILY INCOME DEFICIT
0.47
INEQUALITY / GINI INDEX
25,215
LABOR FORCE [ PEOPLE ]
63.8%
PERCENT IN LABOR FORCE
6.9%
UNEMPLOYMENT RATE
Coles County Area Codes
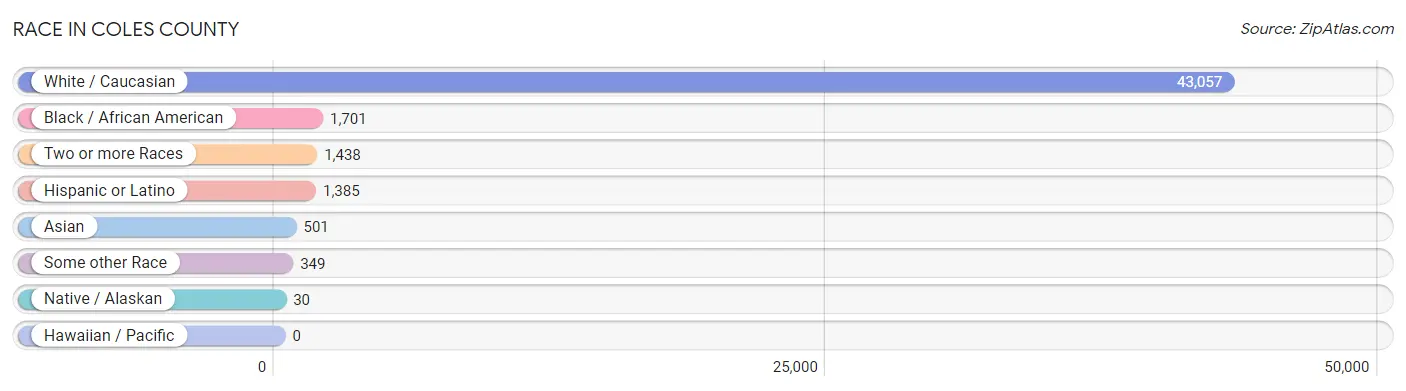
Race in Coles County
The most populous races in Coles County are White / Caucasian (43,057 | 91.5%), Black / African American (1,701 | 3.6%), and Two or more Races (1,438 | 3.0%).
| Race | # Population | % Population |
| Asian | 501 | 1.1% |
| Black / African American | 1,701 | 3.6% |
| Hawaiian / Pacific | 0 | 0.0% |
| Hispanic or Latino | 1,385 | 2.9% |
| Native / Alaskan | 30 | 0.1% |
| White / Caucasian | 43,057 | 91.5% |
| Two or more Races | 1,438 | 3.0% |
| Some other Race | 349 | 0.7% |
| Total | 47,076 | 100.0% |
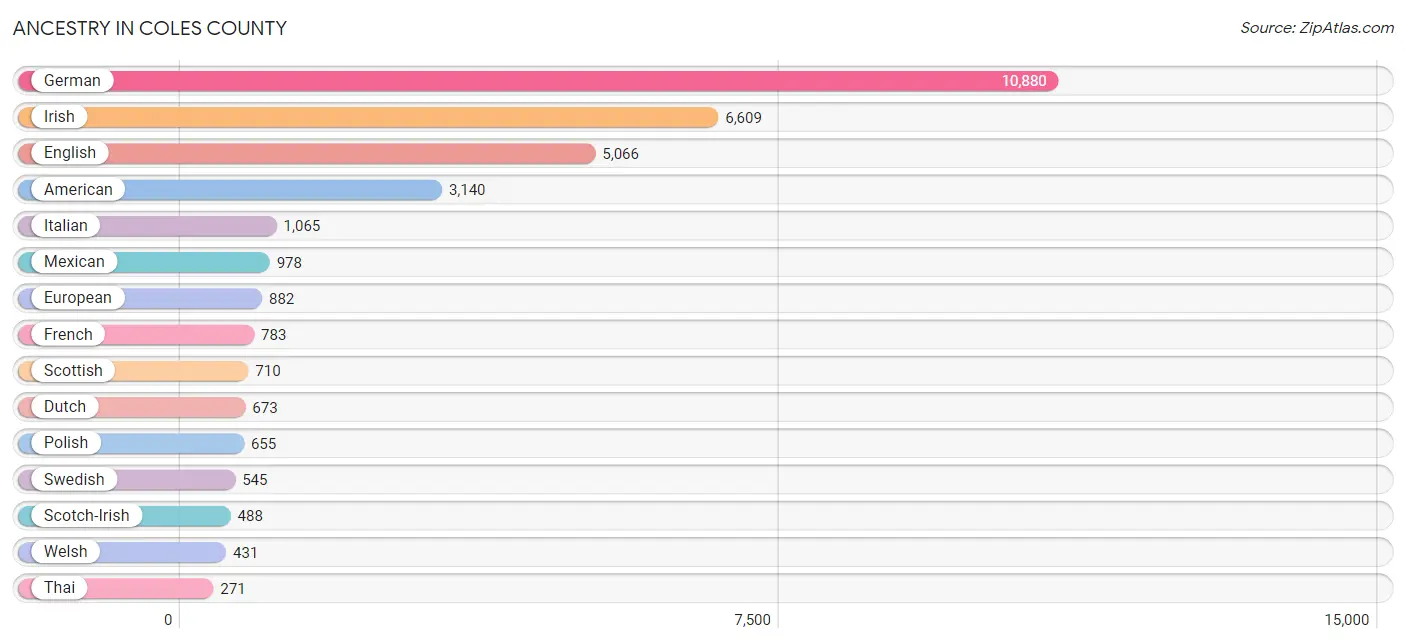
Ancestry in Coles County
The most populous ancestries reported in Coles County are German (10,880 | 23.1%), Irish (6,609 | 14.0%), English (5,066 | 10.8%), American (3,140 | 6.7%), and Italian (1,065 | 2.3%), together accounting for 56.8% of all Coles County residents.
| Ancestry | # Population | % Population |
| African | 173 | 0.4% |
| American | 3,140 | 6.7% |
| Assyrian / Chaldean / Syriac | 93 | 0.2% |
| Austrian | 33 | 0.1% |
| Belgian | 12 | 0.0% |
| Belizean | 11 | 0.0% |
| Bhutanese | 14 | 0.0% |
| Blackfeet | 16 | 0.0% |
| Bolivian | 4 | 0.0% |
| Brazilian | 91 | 0.2% |
| British | 160 | 0.3% |
| Burmese | 25 | 0.1% |
| Canadian | 104 | 0.2% |
| Central American | 62 | 0.1% |
| Cherokee | 162 | 0.3% |
| Cheyenne | 5 | 0.0% |
| Choctaw | 9 | 0.0% |
| Colombian | 65 | 0.1% |
| Croatian | 9 | 0.0% |
| Cuban | 13 | 0.0% |
| Czech | 203 | 0.4% |
| Czechoslovakian | 73 | 0.2% |
| Danish | 100 | 0.2% |
| Dutch | 673 | 1.4% |
| Eastern European | 138 | 0.3% |
| English | 5,066 | 10.8% |
| European | 882 | 1.9% |
| Finnish | 85 | 0.2% |
| French | 783 | 1.7% |
| French Canadian | 224 | 0.5% |
| German | 10,880 | 23.1% |
| Ghanaian | 33 | 0.1% |
| Greek | 94 | 0.2% |
| Guatemalan | 5 | 0.0% |
| Hungarian | 37 | 0.1% |
| Indian (Asian) | 180 | 0.4% |
| Inupiat | 1 | 0.0% |
| Iranian | 25 | 0.1% |
| Irish | 6,609 | 14.0% |
| Italian | 1,065 | 2.3% |
| Jamaican | 21 | 0.0% |
| Japanese | 14 | 0.0% |
| Korean | 200 | 0.4% |
| Lithuanian | 22 | 0.1% |
| Macedonian | 8 | 0.0% |
| Mexican | 978 | 2.1% |
| Native Hawaiian | 9 | 0.0% |
| Navajo | 5 | 0.0% |
| Nigerian | 49 | 0.1% |
| Northern European | 15 | 0.0% |
| Norwegian | 167 | 0.4% |
| Osage | 1 | 0.0% |
| Pakistani | 10 | 0.0% |
| Panamanian | 25 | 0.1% |
| Pennsylvania German | 45 | 0.1% |
| Polish | 655 | 1.4% |
| Portuguese | 113 | 0.2% |
| Potawatomi | 10 | 0.0% |
| Puerto Rican | 135 | 0.3% |
| Russian | 75 | 0.2% |
| Salvadoran | 32 | 0.1% |
| Scandinavian | 83 | 0.2% |
| Scotch-Irish | 488 | 1.0% |
| Scottish | 710 | 1.5% |
| Serbian | 29 | 0.1% |
| Shoshone | 44 | 0.1% |
| Slavic | 3 | 0.0% |
| Slovak | 12 | 0.0% |
| South American | 92 | 0.2% |
| Sri Lankan | 20 | 0.0% |
| Subsaharan African | 261 | 0.5% |
| Sudanese | 6 | 0.0% |
| Swedish | 545 | 1.2% |
| Swiss | 200 | 0.4% |
| Thai | 271 | 0.6% |
| Tongan | 11 | 0.0% |
| Ukrainian | 22 | 0.1% |
| Venezuelan | 23 | 0.1% |
| Welsh | 431 | 0.9% |
| Yugoslavian | 17 | 0.0% | View All 80 Rows |
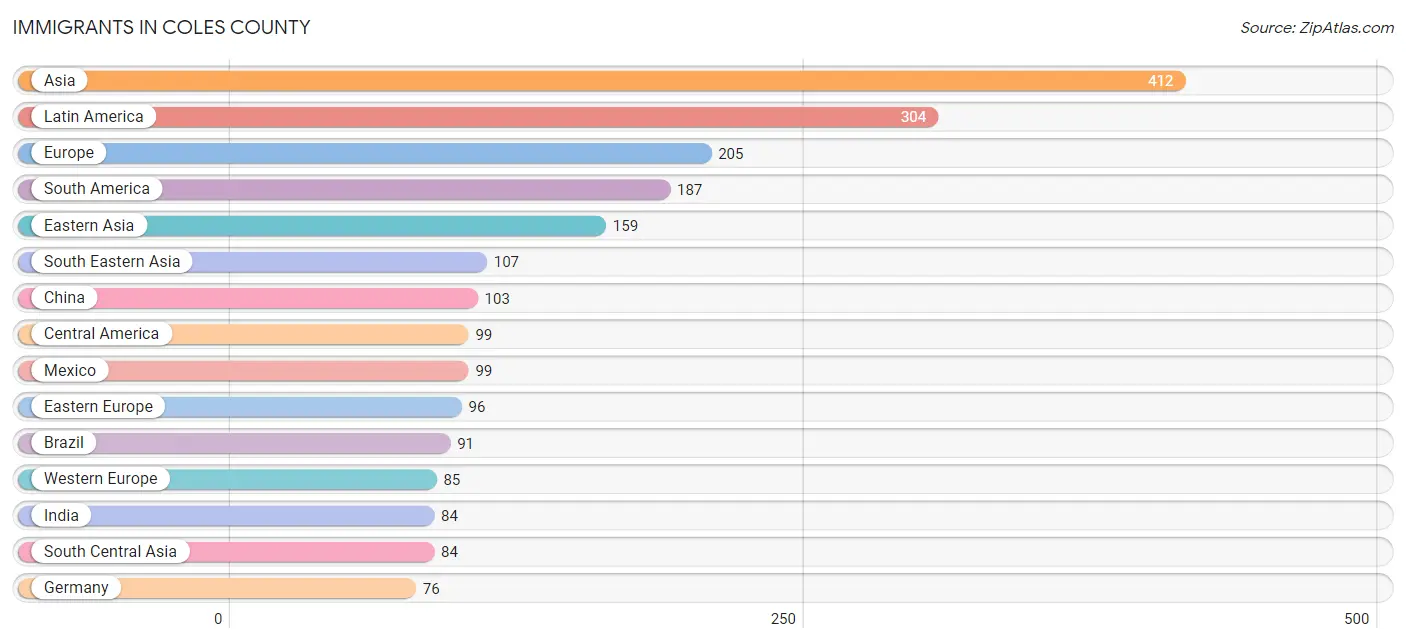
Immigrants in Coles County
The most numerous immigrant groups reported in Coles County came from Asia (412 | 0.9%), Latin America (304 | 0.6%), Europe (205 | 0.4%), South America (187 | 0.4%), and Eastern Asia (159 | 0.3%), together accounting for 2.7% of all Coles County residents.
| Immigration Origin | # Population | % Population |
| Africa | 57 | 0.1% |
| Asia | 412 | 0.9% |
| Bolivia | 4 | 0.0% |
| Brazil | 91 | 0.2% |
| Cambodia | 7 | 0.0% |
| Canada | 24 | 0.1% |
| Caribbean | 18 | 0.0% |
| Central America | 99 | 0.2% |
| China | 103 | 0.2% |
| Colombia | 69 | 0.2% |
| Czechoslovakia | 24 | 0.1% |
| Eastern Africa | 3 | 0.0% |
| Eastern Asia | 159 | 0.3% |
| Eastern Europe | 96 | 0.2% |
| England | 24 | 0.1% |
| Ethiopia | 3 | 0.0% |
| Europe | 205 | 0.4% |
| France | 9 | 0.0% |
| Germany | 76 | 0.2% |
| Ghana | 29 | 0.1% |
| India | 84 | 0.2% |
| Indonesia | 35 | 0.1% |
| Iraq | 62 | 0.1% |
| Jamaica | 18 | 0.0% |
| Japan | 12 | 0.0% |
| Korea | 44 | 0.1% |
| Latin America | 304 | 0.6% |
| Mexico | 99 | 0.2% |
| Middle Africa | 3 | 0.0% |
| Nigeria | 16 | 0.0% |
| North Macedonia | 8 | 0.0% |
| Northern Africa | 6 | 0.0% |
| Northern Europe | 24 | 0.1% |
| Philippines | 39 | 0.1% |
| Russia | 22 | 0.1% |
| Serbia | 10 | 0.0% |
| South America | 187 | 0.4% |
| South Central Asia | 84 | 0.2% |
| South Eastern Asia | 107 | 0.2% |
| Sudan | 6 | 0.0% |
| Thailand | 6 | 0.0% |
| Ukraine | 32 | 0.1% |
| Venezuela | 23 | 0.1% |
| Vietnam | 20 | 0.0% |
| Western Africa | 45 | 0.1% |
| Western Asia | 62 | 0.1% |
| Western Europe | 85 | 0.2% |
| Zaire | 3 | 0.0% | View All 48 Rows |
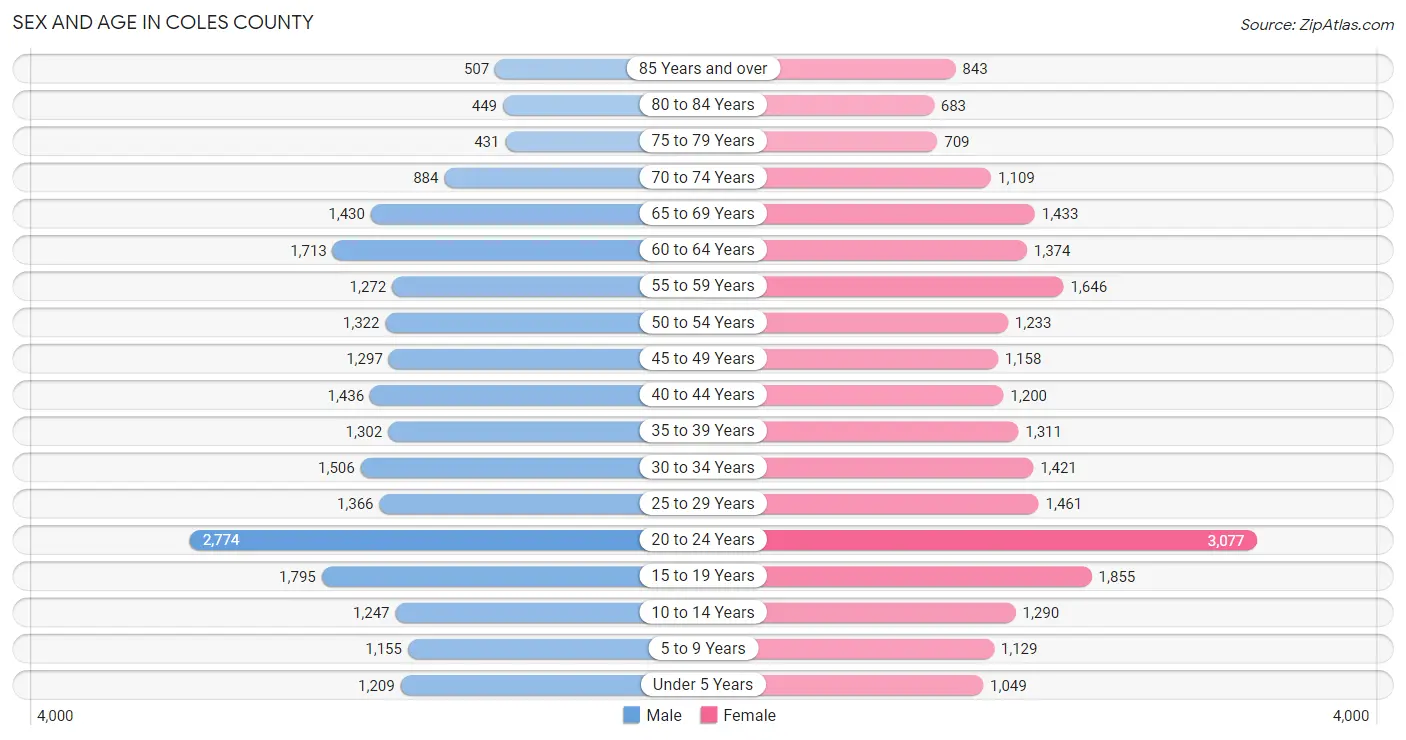
Sex and Age in Coles County
Sex and Age in Coles County
The most populous age groups in Coles County are 20 to 24 Years (2,774 | 12.0%) for men and 20 to 24 Years (3,077 | 12.8%) for women.
| Age Bracket | Male | Female |
| Under 5 Years | 1,209 (5.2%) | 1,049 (4.4%) |
| 5 to 9 Years | 1,155 (5.0%) | 1,129 (4.7%) |
| 10 to 14 Years | 1,247 (5.4%) | 1,290 (5.4%) |
| 15 to 19 Years | 1,795 (7.8%) | 1,855 (7.7%) |
| 20 to 24 Years | 2,774 (12.0%) | 3,077 (12.8%) |
| 25 to 29 Years | 1,366 (5.9%) | 1,461 (6.1%) |
| 30 to 34 Years | 1,506 (6.5%) | 1,421 (5.9%) |
| 35 to 39 Years | 1,302 (5.6%) | 1,311 (5.5%) |
| 40 to 44 Years | 1,436 (6.2%) | 1,200 (5.0%) |
| 45 to 49 Years | 1,297 (5.6%) | 1,158 (4.8%) |
| 50 to 54 Years | 1,322 (5.7%) | 1,233 (5.1%) |
| 55 to 59 Years | 1,272 (5.5%) | 1,646 (6.9%) |
| 60 to 64 Years | 1,713 (7.4%) | 1,374 (5.7%) |
| 65 to 69 Years | 1,430 (6.2%) | 1,433 (6.0%) |
| 70 to 74 Years | 884 (3.8%) | 1,109 (4.6%) |
| 75 to 79 Years | 431 (1.9%) | 709 (3.0%) |
| 80 to 84 Years | 449 (1.9%) | 683 (2.9%) |
| 85 Years and over | 507 (2.2%) | 843 (3.5%) |
| Total | 23,095 (100.0%) | 23,981 (100.0%) |
Families and Households in Coles County
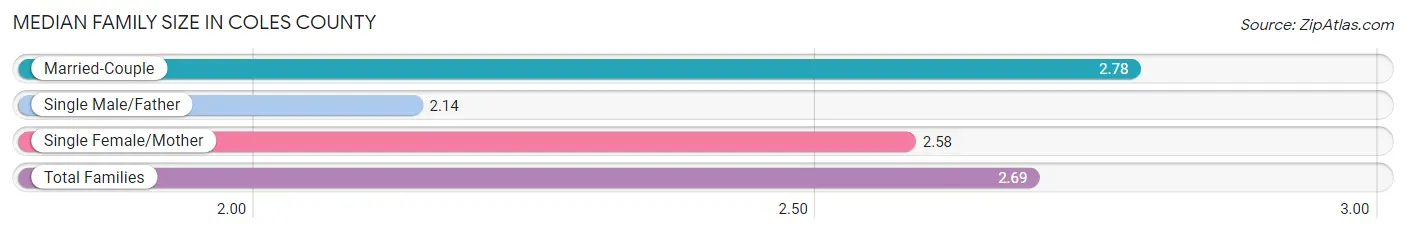
Median Family Size in Coles County
The median family size in Coles County is 2.69 persons per family, with married-couple families (8,373 | 72.5%) accounting for the largest median family size of 2.78 persons per family. On the other hand, single male/father families (1,013 | 8.8%) represent the smallest median family size with 2.14 persons per family.
| Family Type | # Families | Family Size |
| Married-Couple | 8,373 (72.5%) | 2.78 |
| Single Male/Father | 1,013 (8.8%) | 2.14 |
| Single Female/Mother | 2,164 (18.7%) | 2.58 |
| Total Families | 11,550 (100.0%) | 2.69 |
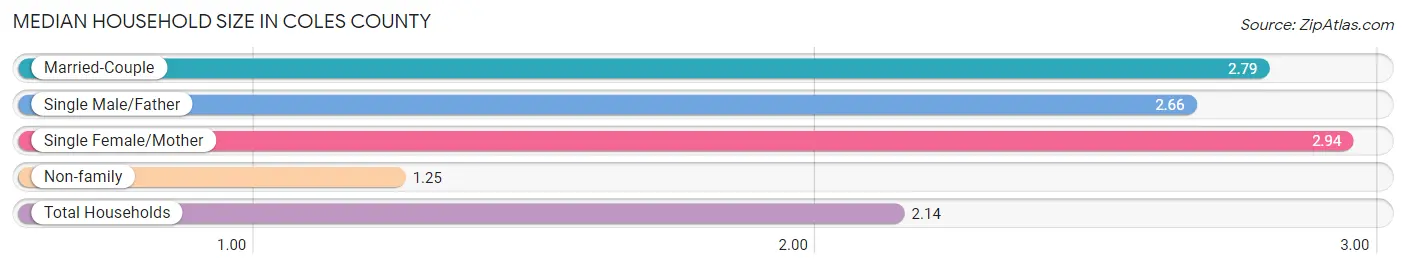
Median Household Size in Coles County
The median household size in Coles County is 2.14 persons per household, with single female/mother households (2,164 | 10.6%) accounting for the largest median household size of 2.94 persons per household. non-family households (8,835 | 43.3%) represent the smallest median household size with 1.25 persons per household.
| Household Type | # Households | Household Size |
| Married-Couple | 8,373 (41.1%) | 2.79 |
| Single Male/Father | 1,013 (5.0%) | 2.66 |
| Single Female/Mother | 2,164 (10.6%) | 2.94 |
| Non-family | 8,835 (43.3%) | 1.25 |
| Total Households | 20,385 (100.0%) | 2.14 |
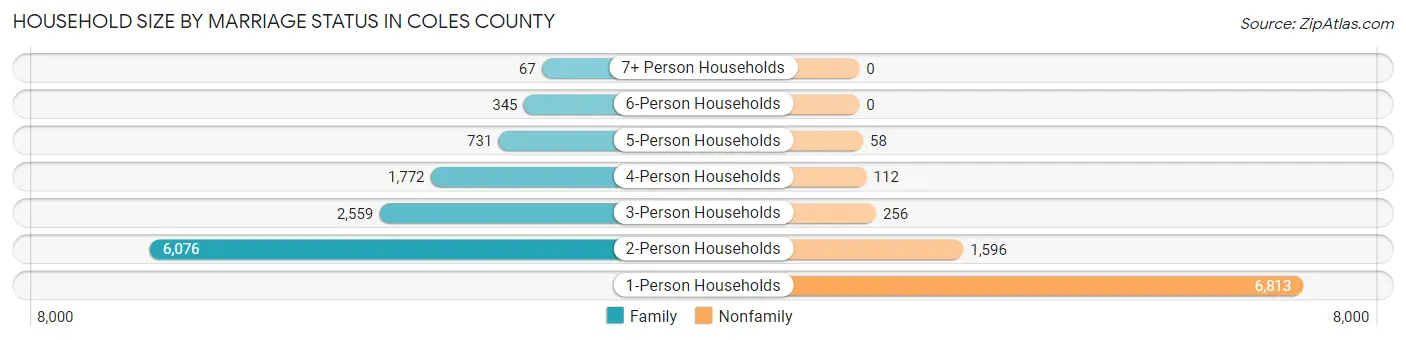
Household Size by Marriage Status in Coles County
Out of a total of 20,385 households in Coles County, 11,550 (56.7%) are family households, while 8,835 (43.3%) are nonfamily households. The most numerous type of family households are 2-person households, comprising 6,076, and the most common type of nonfamily households are 1-person households, comprising 6,813.
| Household Size | Family Households | Nonfamily Households |
| 1-Person Households | - | 6,813 (33.4%) |
| 2-Person Households | 6,076 (29.8%) | 1,596 (7.8%) |
| 3-Person Households | 2,559 (12.6%) | 256 (1.3%) |
| 4-Person Households | 1,772 (8.7%) | 112 (0.5%) |
| 5-Person Households | 731 (3.6%) | 58 (0.3%) |
| 6-Person Households | 345 (1.7%) | 0 (0.0%) |
| 7+ Person Households | 67 (0.3%) | 0 (0.0%) |
| Total | 11,550 (56.7%) | 8,835 (43.3%) |
Female Fertility in Coles County
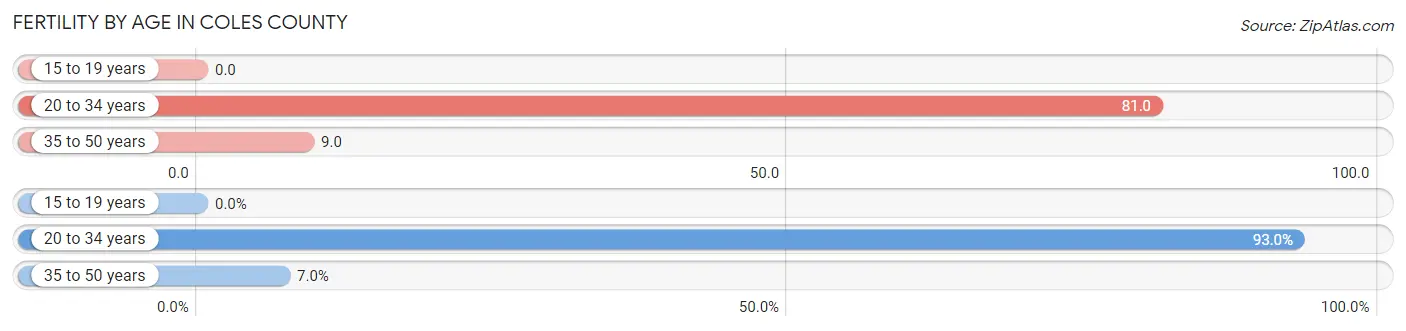
Fertility by Age in Coles County
Average fertility rate in Coles County is 45.0 births per 1,000 women. Women in the age bracket of 20 to 34 years have the highest fertility rate with 81.0 births per 1,000 women. Women in the age bracket of 20 to 34 years acount for 93.0% of all women with births.
| Age Bracket | Women with Births | Births / 1,000 Women |
| 15 to 19 years | 0 (0.0%) | 0.0 |
| 20 to 34 years | 481 (93.0%) | 81.0 |
| 35 to 50 years | 36 (7.0%) | 9.0 |
| Total | 517 (100.0%) | 45.0 |
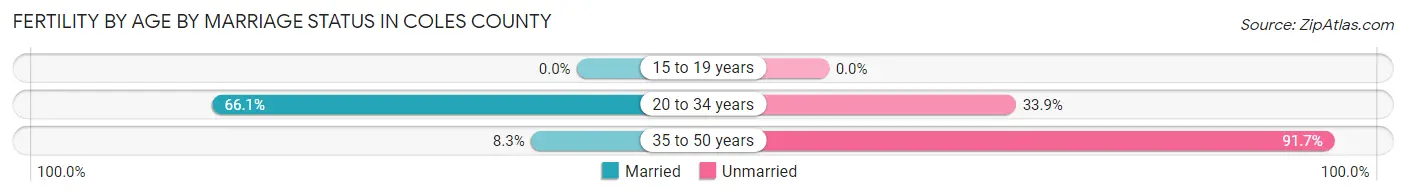
Fertility by Age by Marriage Status in Coles County
62.1% of women with births (517) in Coles County are married. The highest percentage of unmarried women with births falls into 35 to 50 years age bracket with 91.7% of them unmarried at the time of birth, while the lowest percentage of unmarried women with births belong to 20 to 34 years age bracket with 33.9% of them unmarried.
| Age Bracket | Married | Unmarried |
| 15 to 19 years | 0 (0.0%) | 0 (0.0%) |
| 20 to 34 years | 318 (66.1%) | 163 (33.9%) |
| 35 to 50 years | 3 (8.3%) | 33 (91.7%) |
| Total | 321 (62.1%) | 196 (37.9%) |
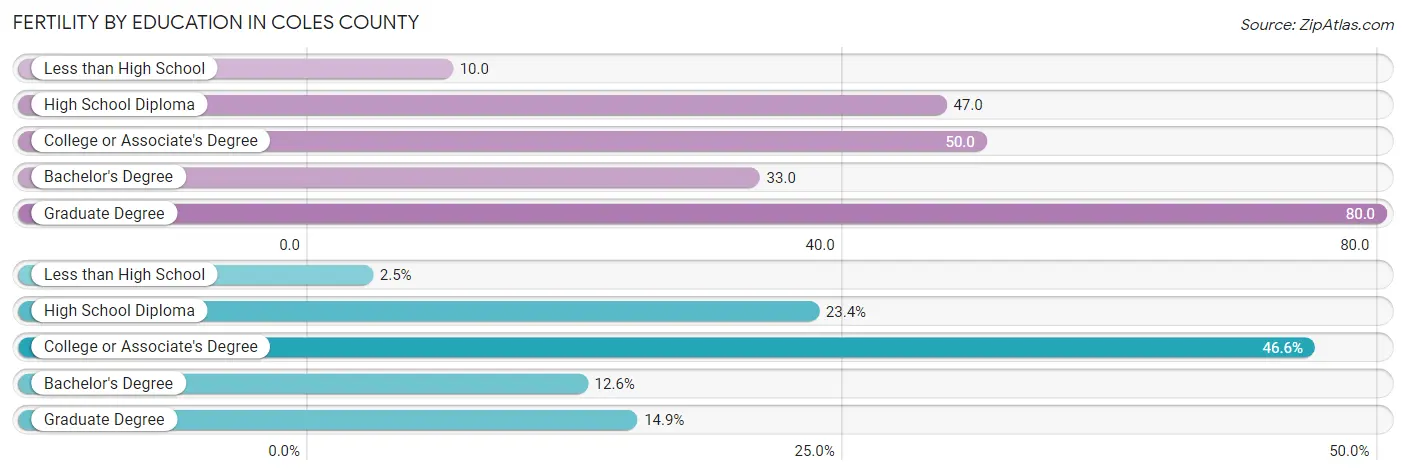
Fertility by Education in Coles County
Average fertility rate in Coles County is 45.0 births per 1,000 women. Women with the education attainment of graduate degree have the highest fertility rate of 80.0 births per 1,000 women, while women with the education attainment of less than high school have the lowest fertility at 10.0 births per 1,000 women. Women with the education attainment of college or associate's degree represent 46.6% of all women with births.
| Educational Attainment | Women with Births | Births / 1,000 Women |
| Less than High School | 13 (2.5%) | 10.0 |
| High School Diploma | 121 (23.4%) | 47.0 |
| College or Associate's Degree | 241 (46.6%) | 50.0 |
| Bachelor's Degree | 65 (12.6%) | 33.0 |
| Graduate Degree | 77 (14.9%) | 80.0 |
| Total | 517 (100.0%) | 45.0 |
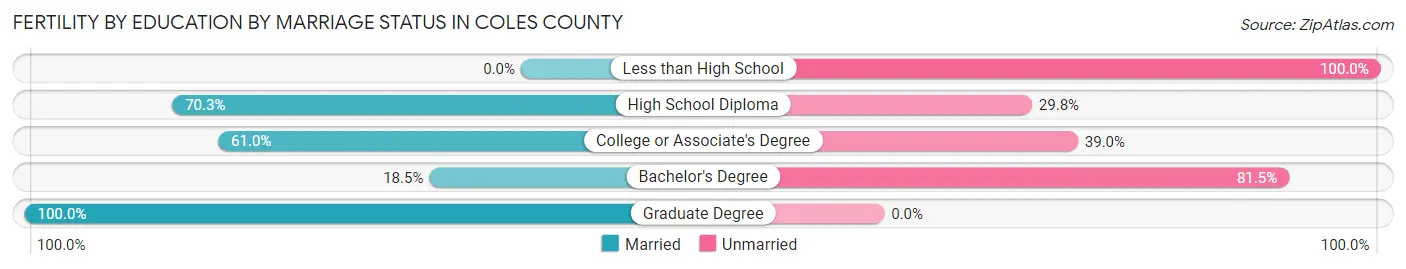
Fertility by Education by Marriage Status in Coles County
37.9% of women with births in Coles County are unmarried. Women with the educational attainment of graduate degree are most likely to be married with 100.0% of them married at childbirth, while women with the educational attainment of less than high school are least likely to be married with 100.0% of them unmarried at childbirth.
| Educational Attainment | Married | Unmarried |
| Less than High School | 0 (0.0%) | 13 (100.0%) |
| High School Diploma | 85 (70.3%) | 36 (29.7%) |
| College or Associate's Degree | 147 (61.0%) | 94 (39.0%) |
| Bachelor's Degree | 12 (18.5%) | 53 (81.5%) |
| Graduate Degree | 77 (100.0%) | 0 (0.0%) |
| Total | 321 (62.1%) | 196 (37.9%) |
Income in Coles County
Income Overview in Coles County
Per Capita Income in Coles County is $32,395, while median incomes of families and households are $68,710 and $53,732 respectively.
| Characteristic | Number | Measure |
| Per Capita Income | 47,076 | $32,395 |
| Median Family Income | 11,550 | $68,710 |
| Mean Family Income | 11,550 | $90,956 |
| Median Household Income | 20,385 | $53,732 |
| Mean Household Income | 20,385 | $74,067 |
| Income Deficit | 11,550 | $8,180 |
| Wage / Income Gap (%) | 47,076 | 22.77% |
| Wage / Income Gap ($) | 47,076 | 77.23¢ per $1 |
| Gini / Inequality Index | 47,076 | 0.47 |
Earnings by Sex in Coles County
Average Earnings in Coles County are $30,602, $34,263 for men and $26,460 for women, a difference of 22.8%.
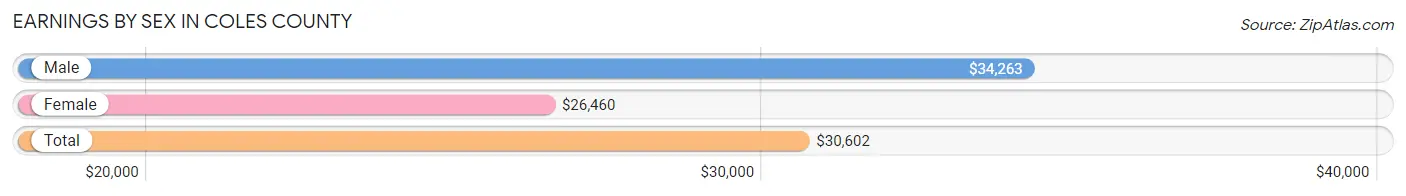
| Sex | Number | Average Earnings |
| Male | 13,821 (52.5%) | $34,263 |
| Female | 12,479 (47.4%) | $26,460 |
| Total | 26,300 (100.0%) | $30,602 |
Earnings by Sex by Income Bracket in Coles County
The most common earnings brackets in Coles County are $75,000 to $99,999 for men (1,526 | 11.0%) and $2,499 or less for women (1,319 | 10.6%).
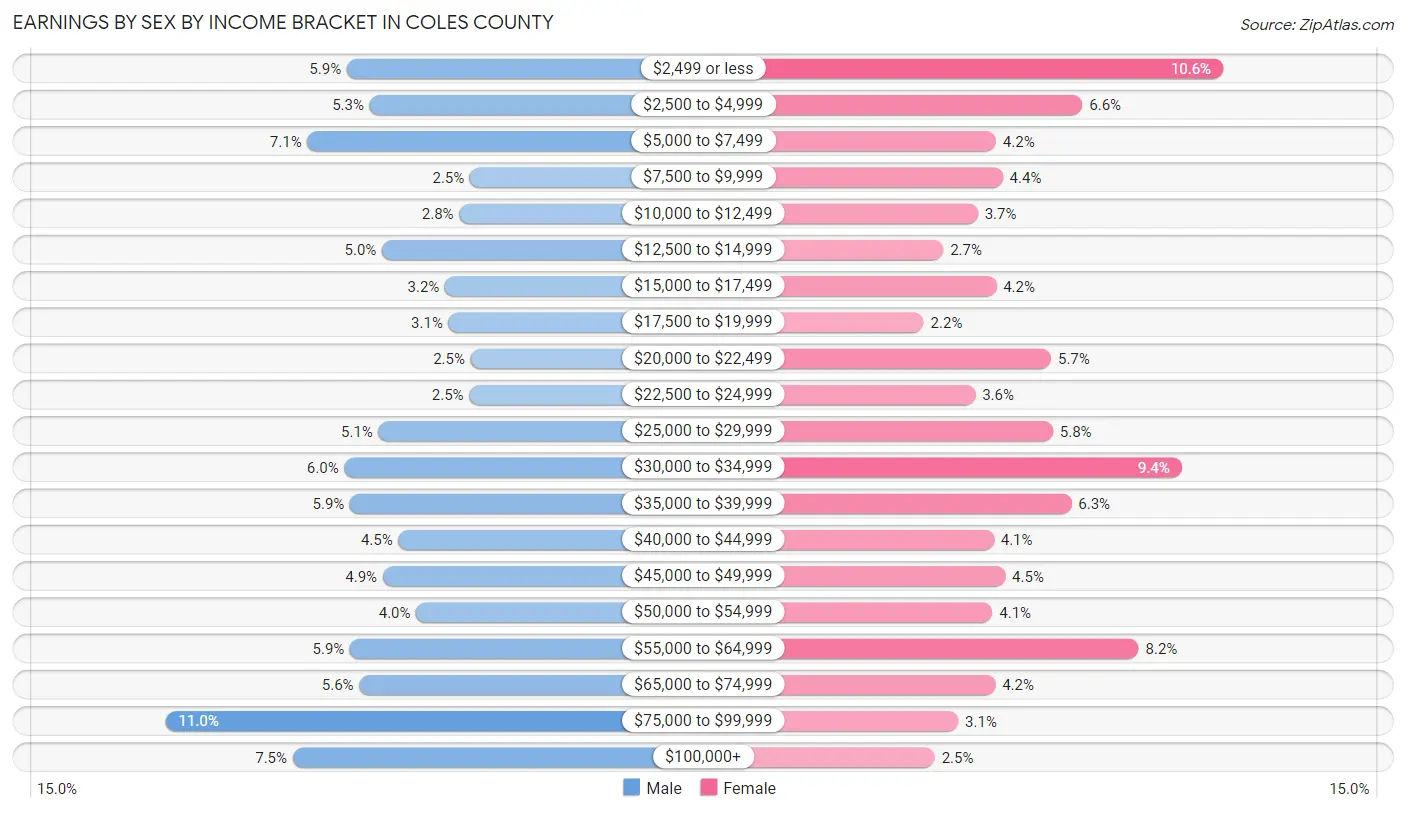
| Income | Male | Female |
| $2,499 or less | 821 (5.9%) | 1,319 (10.6%) |
| $2,500 to $4,999 | 733 (5.3%) | 826 (6.6%) |
| $5,000 to $7,499 | 975 (7.0%) | 523 (4.2%) |
| $7,500 to $9,999 | 343 (2.5%) | 546 (4.4%) |
| $10,000 to $12,499 | 384 (2.8%) | 459 (3.7%) |
| $12,500 to $14,999 | 684 (5.0%) | 338 (2.7%) |
| $15,000 to $17,499 | 440 (3.2%) | 524 (4.2%) |
| $17,500 to $19,999 | 425 (3.1%) | 270 (2.2%) |
| $20,000 to $22,499 | 340 (2.5%) | 716 (5.7%) |
| $22,500 to $24,999 | 345 (2.5%) | 451 (3.6%) |
| $25,000 to $29,999 | 698 (5.1%) | 723 (5.8%) |
| $30,000 to $34,999 | 831 (6.0%) | 1,174 (9.4%) |
| $35,000 to $39,999 | 809 (5.9%) | 787 (6.3%) |
| $40,000 to $44,999 | 620 (4.5%) | 515 (4.1%) |
| $45,000 to $49,999 | 682 (4.9%) | 555 (4.4%) |
| $50,000 to $54,999 | 552 (4.0%) | 511 (4.1%) |
| $55,000 to $64,999 | 809 (5.9%) | 1,023 (8.2%) |
| $65,000 to $74,999 | 773 (5.6%) | 520 (4.2%) |
| $75,000 to $99,999 | 1,526 (11.0%) | 391 (3.1%) |
| $100,000+ | 1,031 (7.5%) | 308 (2.5%) |
| Total | 13,821 (100.0%) | 12,479 (100.0%) |
Earnings by Sex by Educational Attainment in Coles County
Average earnings in Coles County are $44,603 for men and $34,011 for women, a difference of 23.7%. Men with an educational attainment of graduate degree enjoy the highest average annual earnings of $79,597, while those with high school diploma education earn the least with $35,100. Women with an educational attainment of graduate degree earn the most with the average annual earnings of $56,793, while those with high school diploma education have the smallest earnings of $25,928.
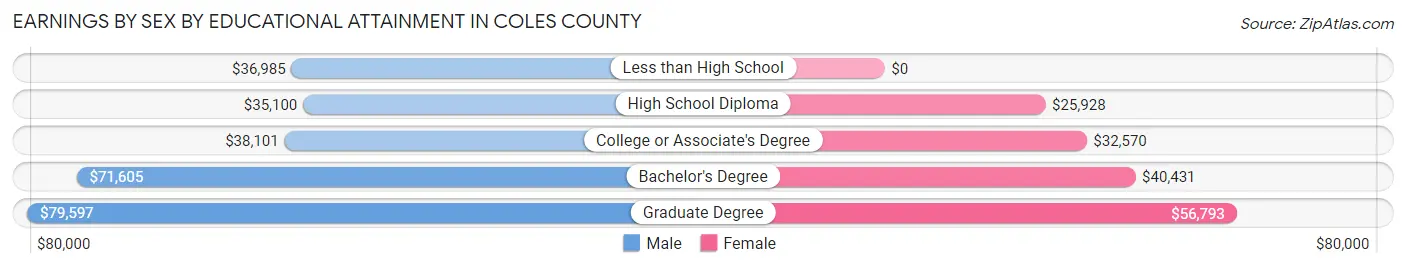
| Educational Attainment | Male Income | Female Income |
| Less than High School | $36,985 | $0 |
| High School Diploma | $35,100 | $25,928 |
| College or Associate's Degree | $38,101 | $32,570 |
| Bachelor's Degree | $71,605 | $40,431 |
| Graduate Degree | $79,597 | $56,793 |
| Total | $44,603 | $34,011 |
Family Income in Coles County
Family Income Brackets in Coles County
According to the Coles County family income data, there are 2,391 families falling into the $50,000 to $74,999 income range, which is the most common income bracket and makes up 20.7% of all families. Conversely, the less than $10,000 income bracket is the least frequent group with only 393 families (3.4%) belonging to this category.
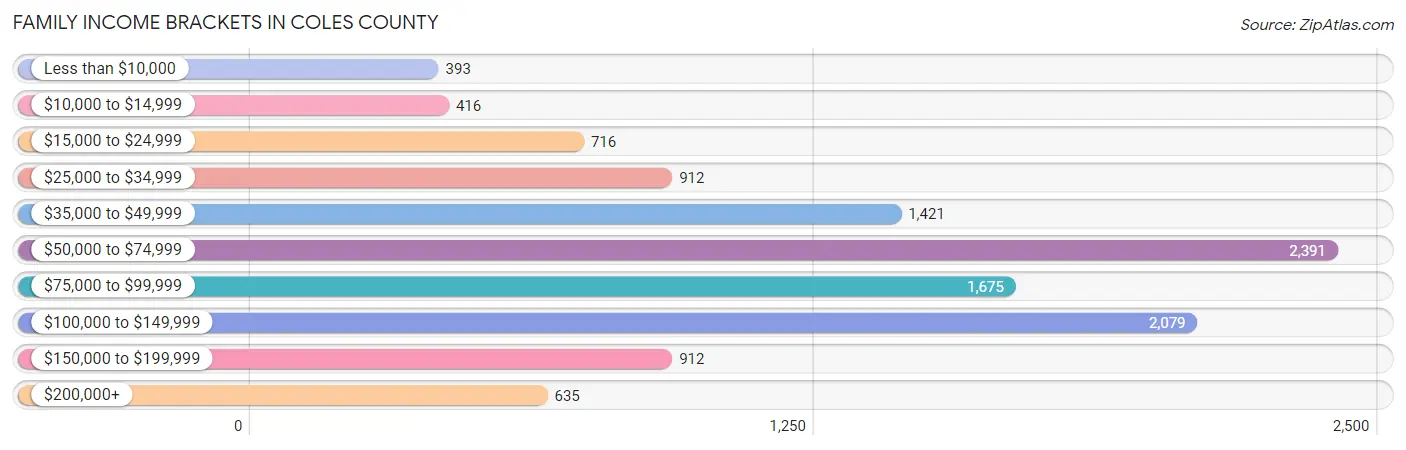
| Income Bracket | # Families | % Families |
| Less than $10,000 | 393 | 3.4% |
| $10,000 to $14,999 | 416 | 3.6% |
| $15,000 to $24,999 | 716 | 6.2% |
| $25,000 to $34,999 | 912 | 7.9% |
| $35,000 to $49,999 | 1,421 | 12.3% |
| $50,000 to $74,999 | 2,391 | 20.7% |
| $75,000 to $99,999 | 1,675 | 14.5% |
| $100,000 to $149,999 | 2,079 | 18.0% |
| $150,000 to $199,999 | 912 | 7.9% |
| $200,000+ | 635 | 5.5% |
Family Income by Famaliy Size in Coles County
4-person families (1,440 | 12.5%) account for the highest median family income in Coles County with $104,041 per family, while 2-person families (6,726 | 58.2%) have the highest median income of $31,647 per family member.
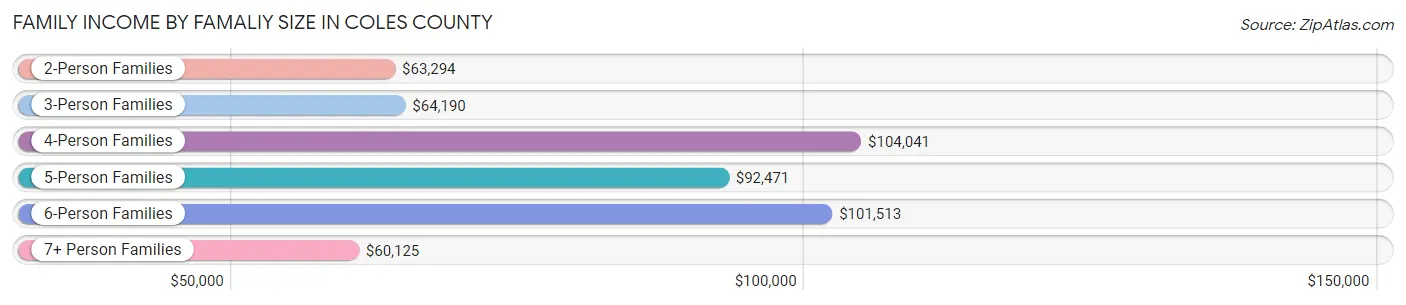
| Income Bracket | # Families | Median Income |
| 2-Person Families | 6,726 (58.2%) | $63,294 |
| 3-Person Families | 2,434 (21.1%) | $64,190 |
| 4-Person Families | 1,440 (12.5%) | $104,041 |
| 5-Person Families | 615 (5.3%) | $92,471 |
| 6-Person Families | 274 (2.4%) | $101,513 |
| 7+ Person Families | 61 (0.5%) | $60,125 |
| Total | 11,550 (100.0%) | $68,710 |
Family Income by Number of Earners in Coles County
The median family income in Coles County is $68,710, with families comprising 3+ earners (892) having the highest median family income of $127,857, while families with no earners (1,749) have the lowest median family income of $40,580, accounting for 7.7% and 15.1% of families, respectively.
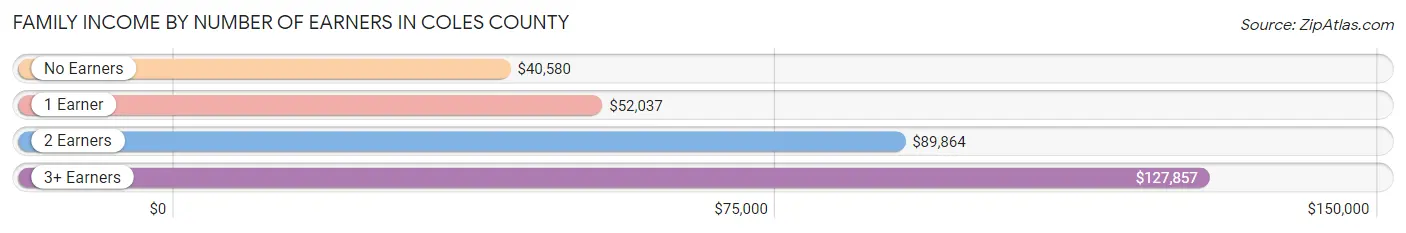
| Number of Earners | # Families | Median Income |
| No Earners | 1,749 (15.1%) | $40,580 |
| 1 Earner | 4,129 (35.7%) | $52,037 |
| 2 Earners | 4,780 (41.4%) | $89,864 |
| 3+ Earners | 892 (7.7%) | $127,857 |
| Total | 11,550 (100.0%) | $68,710 |
Household Income in Coles County
Household Income Brackets in Coles County
With 3,629 households falling in the category, the $50,000 to $74,999 income range is the most frequent in Coles County, accounting for 17.8% of all households. In contrast, only 754 households (3.7%) fall into the $200,000+ income bracket, making it the least populous group.
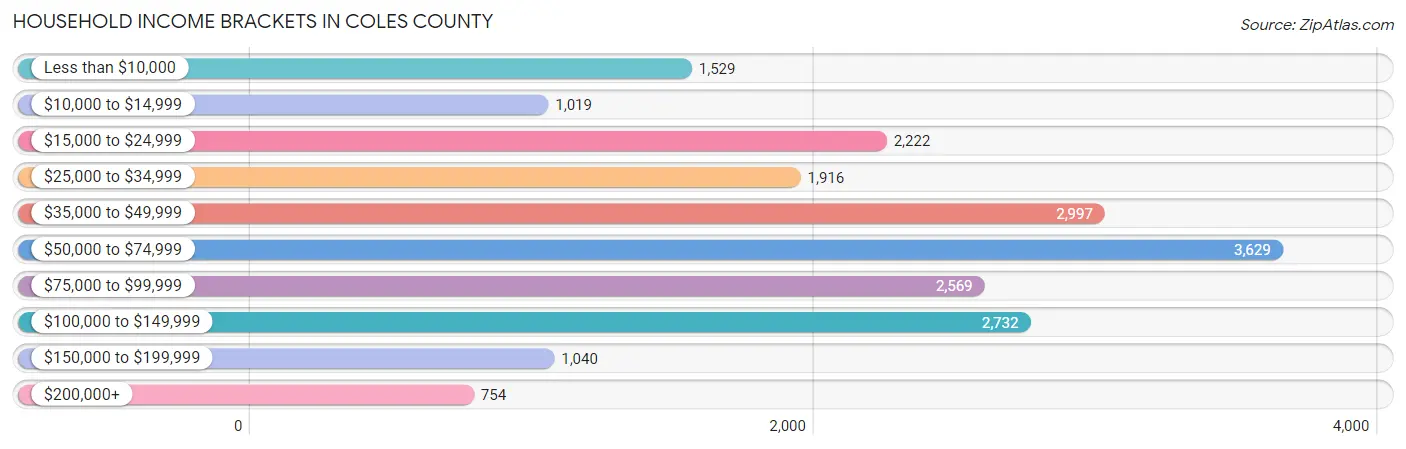
| Income Bracket | # Households | % Households |
| Less than $10,000 | 1,529 | 7.5% |
| $10,000 to $14,999 | 1,019 | 5.0% |
| $15,000 to $24,999 | 2,222 | 10.9% |
| $25,000 to $34,999 | 1,916 | 9.4% |
| $35,000 to $49,999 | 2,997 | 14.7% |
| $50,000 to $74,999 | 3,629 | 17.8% |
| $75,000 to $99,999 | 2,569 | 12.6% |
| $100,000 to $149,999 | 2,732 | 13.4% |
| $150,000 to $199,999 | 1,040 | 5.1% |
| $200,000+ | 754 | 3.7% |
Household Income by Householder Age in Coles County
The median household income in Coles County is $53,732, with the highest median household income of $67,837 found in the 45 to 64 years age bracket for the primary householder. A total of 6,580 households (32.3%) fall into this category. Meanwhile, the 15 to 24 years age bracket for the primary householder has the lowest median household income of $29,365, with 2,347 households (11.5%) in this group.
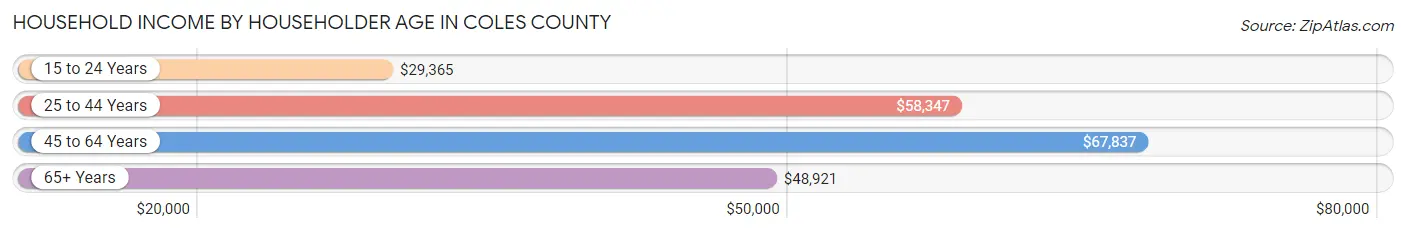
| Income Bracket | # Households | Median Income |
| 15 to 24 Years | 2,347 (11.5%) | $29,365 |
| 25 to 44 Years | 5,942 (29.1%) | $58,347 |
| 45 to 64 Years | 6,580 (32.3%) | $67,837 |
| 65+ Years | 5,516 (27.1%) | $48,921 |
| Total | 20,385 (100.0%) | $53,732 |
Poverty in Coles County
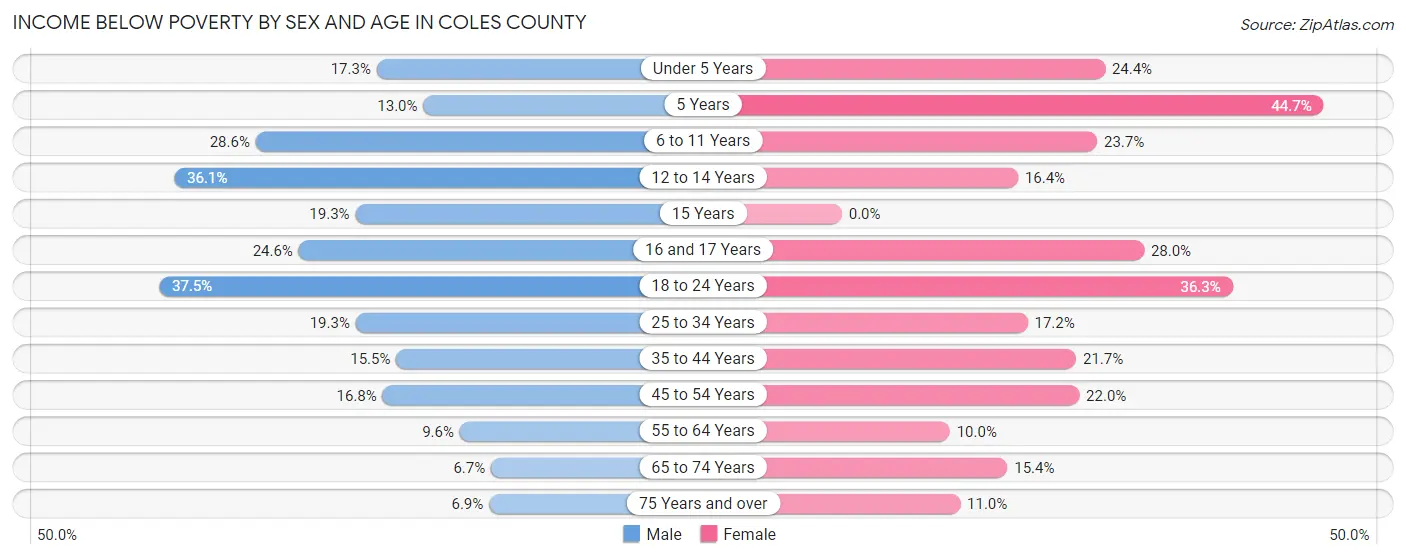
Income Below Poverty by Sex and Age in Coles County
With 18.6% poverty level for males and 20.1% for females among the residents of Coles County, 18 to 24 year old males and 5 year old females are the most vulnerable to poverty, with 1,064 males (37.5%) and 97 females (44.7%) in their respective age groups living below the poverty level.
| Age Bracket | Male | Female |
| Under 5 Years | 190 (17.3%) | 253 (24.4%) |
| 5 Years | 30 (13.0%) | 97 (44.7%) |
| 6 to 11 Years | 386 (28.5%) | 352 (23.7%) |
| 12 to 14 Years | 267 (36.1%) | 103 (16.4%) |
| 15 Years | 55 (19.3%) | 0 (0.0%) |
| 16 and 17 Years | 112 (24.6%) | 136 (28.0%) |
| 18 to 24 Years | 1,064 (37.5%) | 1,037 (36.3%) |
| 25 to 34 Years | 542 (19.3%) | 493 (17.2%) |
| 35 to 44 Years | 420 (15.5%) | 546 (21.7%) |
| 45 to 54 Years | 437 (16.8%) | 526 (22.0%) |
| 55 to 64 Years | 286 (9.6%) | 299 (10.0%) |
| 65 to 74 Years | 152 (6.7%) | 387 (15.4%) |
| 75 Years and over | 87 (6.9%) | 208 (11.0%) |
| Total | 4,028 (18.6%) | 4,437 (20.1%) |
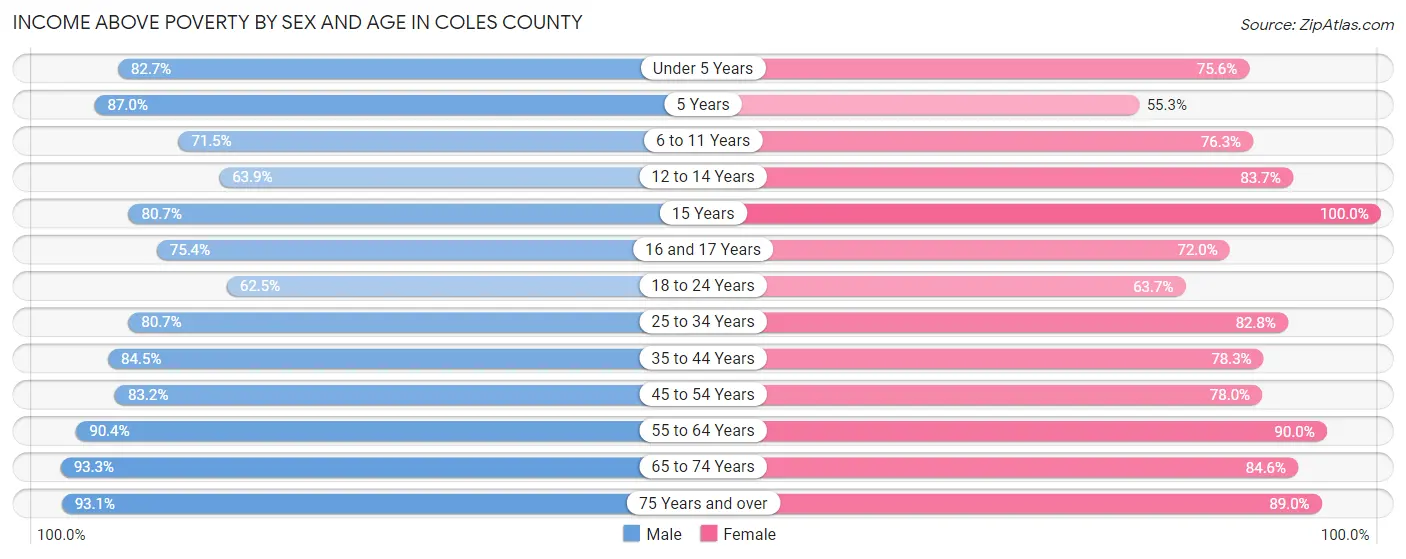
Income Above Poverty by Sex and Age in Coles County
According to the poverty statistics in Coles County, males aged 65 to 74 years and females aged 15 years are the age groups that are most secure financially, with 93.3% of males and 100.0% of females in these age groups living above the poverty line.
| Age Bracket | Male | Female |
| Under 5 Years | 907 (82.7%) | 783 (75.6%) |
| 5 Years | 201 (87.0%) | 120 (55.3%) |
| 6 to 11 Years | 966 (71.5%) | 1,134 (76.3%) |
| 12 to 14 Years | 472 (63.9%) | 527 (83.7%) |
| 15 Years | 230 (80.7%) | 188 (100.0%) |
| 16 and 17 Years | 344 (75.4%) | 349 (72.0%) |
| 18 to 24 Years | 1,771 (62.5%) | 1,823 (63.7%) |
| 25 to 34 Years | 2,270 (80.7%) | 2,367 (82.8%) |
| 35 to 44 Years | 2,289 (84.5%) | 1,965 (78.3%) |
| 45 to 54 Years | 2,167 (83.2%) | 1,862 (78.0%) |
| 55 to 64 Years | 2,690 (90.4%) | 2,684 (90.0%) |
| 65 to 74 Years | 2,113 (93.3%) | 2,133 (84.6%) |
| 75 Years and over | 1,176 (93.1%) | 1,687 (89.0%) |
| Total | 17,596 (81.4%) | 17,622 (79.9%) |
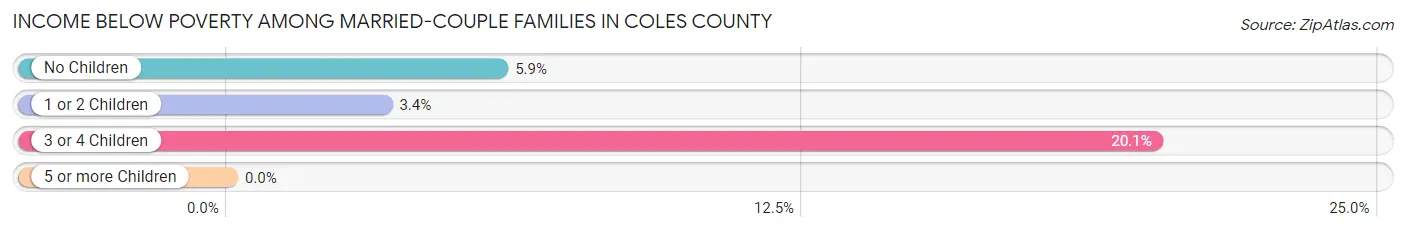
Income Below Poverty Among Married-Couple Families in Coles County
The poverty statistics for married-couple families in Coles County show that 6.1% or 514 of the total 8,373 families live below the poverty line. Families with 3 or 4 children have the highest poverty rate of 20.1%, comprising of 113 families. On the other hand, families with 5 or more children have the lowest poverty rate of 0.0%, which includes 0 families.
| Children | Above Poverty | Below Poverty |
| No Children | 5,190 (94.1%) | 324 (5.9%) |
| 1 or 2 Children | 2,214 (96.6%) | 77 (3.4%) |
| 3 or 4 Children | 448 (79.9%) | 113 (20.1%) |
| 5 or more Children | 7 (100.0%) | 0 (0.0%) |
| Total | 7,859 (93.9%) | 514 (6.1%) |
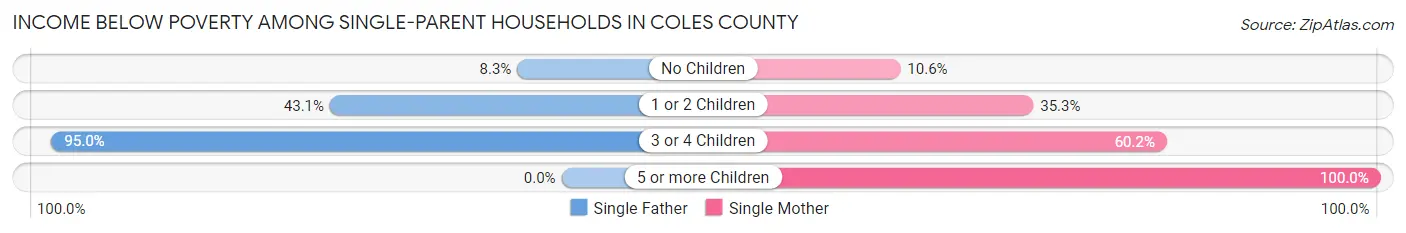
Income Below Poverty Among Single-Parent Households in Coles County
According to the poverty data in Coles County, 30.8% or 312 single-father households and 26.7% or 578 single-mother households are living below the poverty line. Among single-father households, those with 3 or 4 children have the highest poverty rate, with 19 households (95.0%) experiencing poverty. Likewise, among single-mother households, those with 5 or more children have the highest poverty rate, with 14 households (100.0%) falling below the poverty line.
| Children | Single Father | Single Mother |
| No Children | 32 (8.3%) | 96 (10.6%) |
| 1 or 2 Children | 261 (43.1%) | 397 (35.3%) |
| 3 or 4 Children | 19 (95.0%) | 71 (60.2%) |
| 5 or more Children | 0 (0.0%) | 14 (100.0%) |
| Total | 312 (30.8%) | 578 (26.7%) |
Income Below Poverty Among Married-Couple vs Single-Parent Households in Coles County
The poverty data for Coles County shows that 514 of the married-couple family households (6.1%) and 890 of the single-parent households (28.0%) are living below the poverty level. Within the married-couple family households, those with 3 or 4 children have the highest poverty rate, with 113 households (20.1%) falling below the poverty line. Among the single-parent households, those with 5 or more children have the highest poverty rate, with 14 household (100.0%) living below poverty.

| Children | Married-Couple Families | Single-Parent Households |
| No Children | 324 (5.9%) | 128 (9.9%) |
| 1 or 2 Children | 77 (3.4%) | 658 (38.1%) |
| 3 or 4 Children | 113 (20.1%) | 90 (65.2%) |
| 5 or more Children | 0 (0.0%) | 14 (100.0%) |
| Total | 514 (6.1%) | 890 (28.0%) |
Employment Characteristics in Coles County
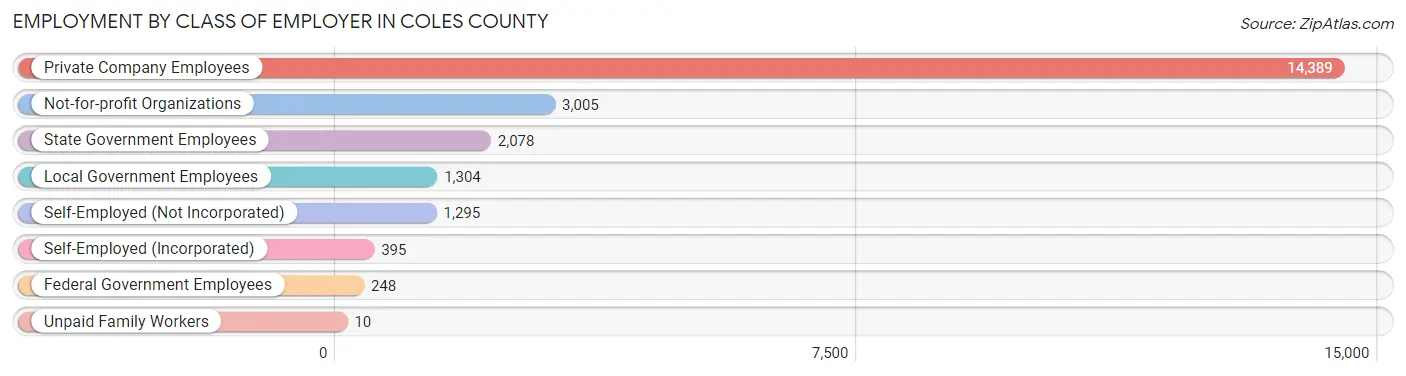
Employment by Class of Employer in Coles County
Among the 22,724 employed individuals in Coles County, private company employees (14,389 | 63.3%), not-for-profit organizations (3,005 | 13.2%), and state government employees (2,078 | 9.1%) make up the most common classes of employment.
| Employer Class | # Employees | % Employees |
| Private Company Employees | 14,389 | 63.3% |
| Self-Employed (Incorporated) | 395 | 1.7% |
| Self-Employed (Not Incorporated) | 1,295 | 5.7% |
| Not-for-profit Organizations | 3,005 | 13.2% |
| Local Government Employees | 1,304 | 5.7% |
| State Government Employees | 2,078 | 9.1% |
| Federal Government Employees | 248 | 1.1% |
| Unpaid Family Workers | 10 | 0.0% |
| Total | 22,724 | 100.0% |
Employment Status by Age in Coles County
According to the labor force statistics for Coles County, out of the total population over 16 years of age (39,522), 63.8% or 25,215 individuals are in the labor force, with 6.9% or 1,740 of them unemployed. The age group with the highest labor force participation rate is 25 to 29 years, with 87.2% or 2,465 individuals in the labor force. Within the labor force, the 16 to 19 years age range has the highest percentage of unemployed individuals, with 11.0% or 201 of them being unemployed.

| Age Bracket | In Labor Force | Unemployed |
| 16 to 19 Years | 1,826 (57.5%) | 201 (11.0%) |
| 20 to 24 Years | 4,927 (84.2%) | 389 (7.9%) |
| 25 to 29 Years | 2,465 (87.2%) | 104 (4.2%) |
| 30 to 34 Years | 2,497 (85.3%) | 107 (4.3%) |
| 35 to 44 Years | 4,372 (83.3%) | 232 (5.3%) |
| 45 to 54 Years | 3,983 (79.5%) | 402 (10.1%) |
| 55 to 59 Years | 2,118 (72.6%) | 150 (7.1%) |
| 60 to 64 Years | 1,686 (54.6%) | 88 (5.2%) |
| 65 to 74 Years | 1,146 (23.6%) | 61 (5.3%) |
| 75 Years and over | 181 (5.0%) | 11 (6.1%) |
| Total | 25,215 (63.8%) | 1,740 (6.9%) |
Employment Status by Educational Attainment in Coles County
According to labor force statistics for Coles County, 77.8% of individuals (17,130) out of the total population between 25 and 64 years of age (22,018) are in the labor force, with 6.3% or 1,079 of them being unemployed. The group with the highest labor force participation rate are those with the educational attainment of bachelor's degree or higher, with 87.0% or 5,414 individuals in the labor force. Within the labor force, individuals with less than high school education have the highest percentage of unemployment, with 20.9% or 213 of them being unemployed.
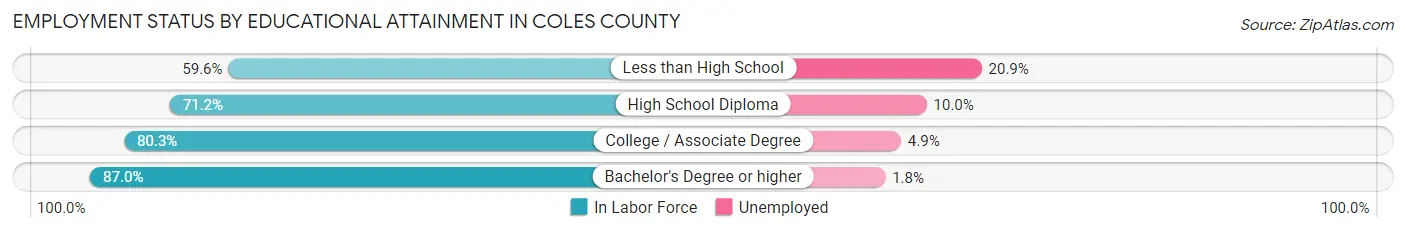
| Educational Attainment | In Labor Force | Unemployed |
| Less than High School | 1,020 (59.6%) | 358 (20.9%) |
| High School Diploma | 4,873 (71.2%) | 684 (10.0%) |
| College / Associate Degree | 5,813 (80.3%) | 355 (4.9%) |
| Bachelor's Degree or higher | 5,414 (87.0%) | 112 (1.8%) |
| Total | 17,130 (77.8%) | 1,387 (6.3%) |
Employment Occupations by Sex in Coles County
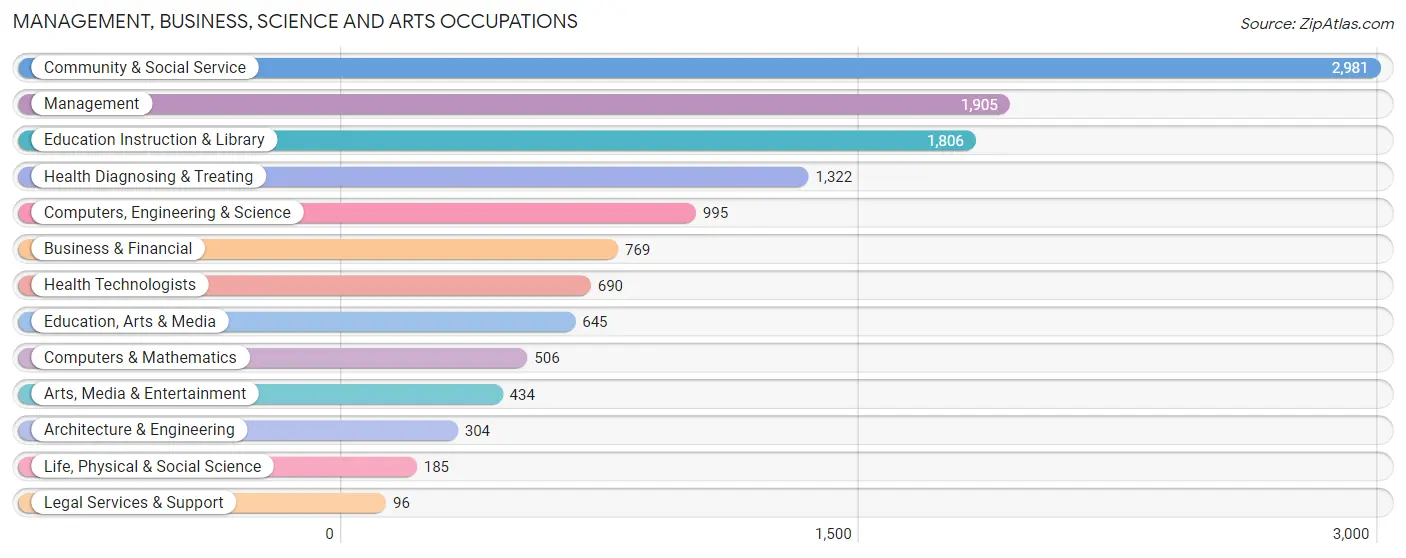
Management, Business, Science and Arts Occupations
The most common Management, Business, Science and Arts occupations in Coles County are Community & Social Service (2,981 | 12.7%), Management (1,905 | 8.1%), Education Instruction & Library (1,806 | 7.7%), Health Diagnosing & Treating (1,322 | 5.7%), and Computers, Engineering & Science (995 | 4.3%).
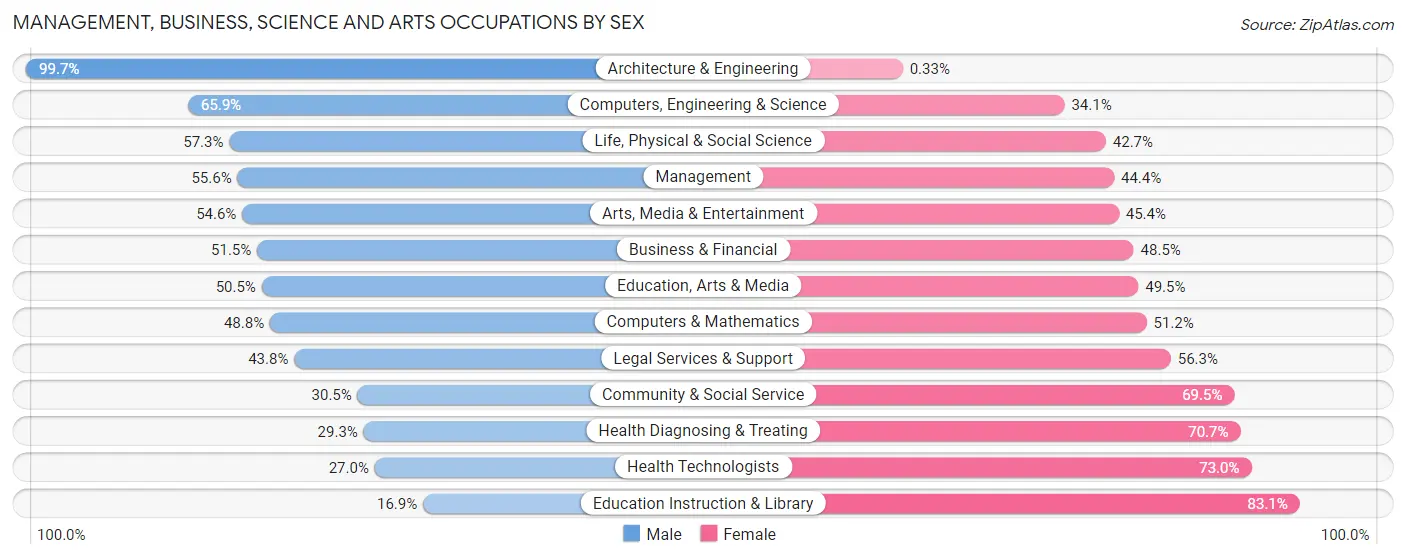
Management, Business, Science and Arts Occupations by Sex
Within the Management, Business, Science and Arts occupations in Coles County, the most male-oriented occupations are Architecture & Engineering (99.7%), Computers, Engineering & Science (65.9%), and Life, Physical & Social Science (57.3%), while the most female-oriented occupations are Education Instruction & Library (83.1%), Health Technologists (73.0%), and Health Diagnosing & Treating (70.7%).
| Occupation | Male | Female |
| Management | 1,059 (55.6%) | 846 (44.4%) |
| Business & Financial | 396 (51.5%) | 373 (48.5%) |
| Computers, Engineering & Science | 656 (65.9%) | 339 (34.1%) |
| Computers & Mathematics | 247 (48.8%) | 259 (51.2%) |
| Architecture & Engineering | 303 (99.7%) | 1 (0.3%) |
| Life, Physical & Social Science | 106 (57.3%) | 79 (42.7%) |
| Community & Social Service | 910 (30.5%) | 2,071 (69.5%) |
| Education, Arts & Media | 326 (50.5%) | 319 (49.5%) |
| Legal Services & Support | 42 (43.8%) | 54 (56.2%) |
| Education Instruction & Library | 305 (16.9%) | 1,501 (83.1%) |
| Arts, Media & Entertainment | 237 (54.6%) | 197 (45.4%) |
| Health Diagnosing & Treating | 387 (29.3%) | 935 (70.7%) |
| Health Technologists | 186 (27.0%) | 504 (73.0%) |
| Total (Category) | 3,408 (42.7%) | 4,564 (57.3%) |
| Total (Overall) | 12,190 (52.1%) | 11,210 (47.9%) |
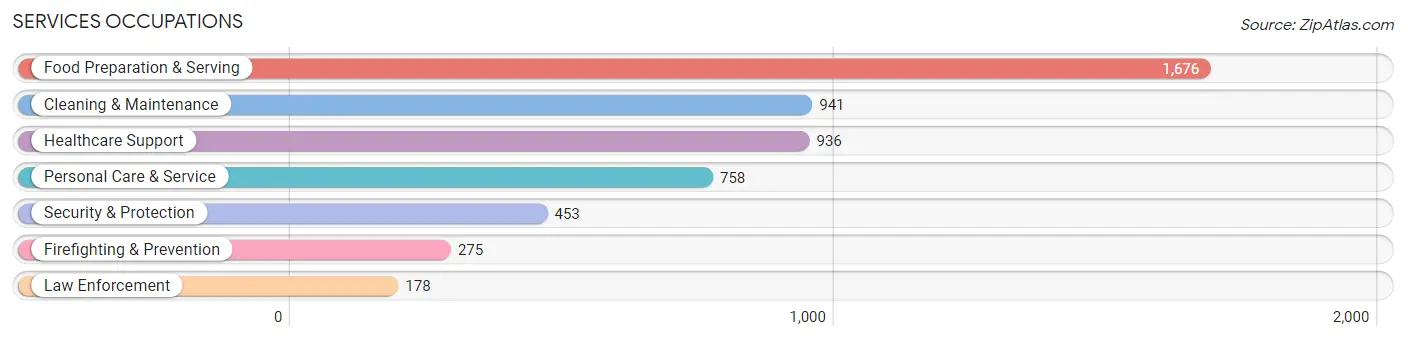
Services Occupations
The most common Services occupations in Coles County are Food Preparation & Serving (1,676 | 7.2%), Cleaning & Maintenance (941 | 4.0%), Healthcare Support (936 | 4.0%), Personal Care & Service (758 | 3.2%), and Security & Protection (453 | 1.9%).
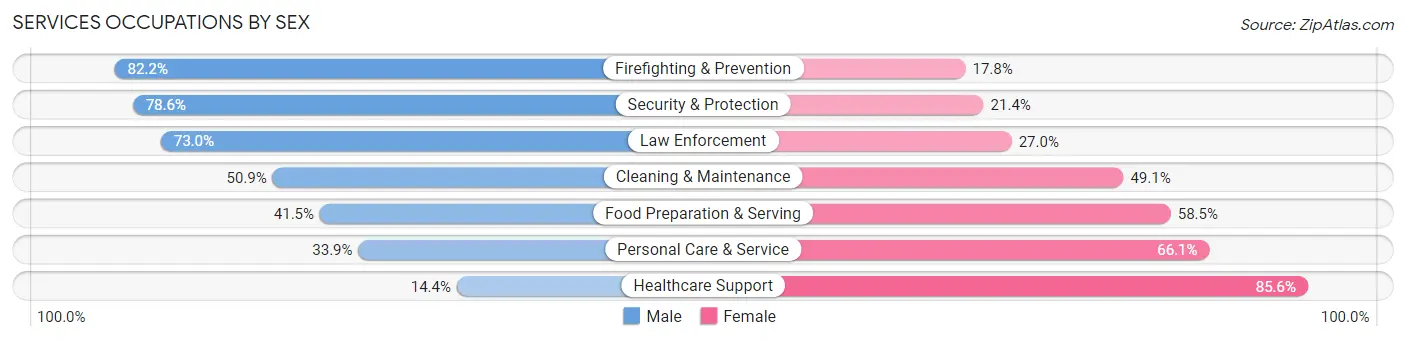
Services Occupations by Sex
Within the Services occupations in Coles County, the most male-oriented occupations are Firefighting & Prevention (82.2%), Security & Protection (78.6%), and Law Enforcement (73.0%), while the most female-oriented occupations are Healthcare Support (85.6%), Personal Care & Service (66.1%), and Food Preparation & Serving (58.5%).
| Occupation | Male | Female |
| Healthcare Support | 135 (14.4%) | 801 (85.6%) |
| Security & Protection | 356 (78.6%) | 97 (21.4%) |
| Firefighting & Prevention | 226 (82.2%) | 49 (17.8%) |
| Law Enforcement | 130 (73.0%) | 48 (27.0%) |
| Food Preparation & Serving | 696 (41.5%) | 980 (58.5%) |
| Cleaning & Maintenance | 479 (50.9%) | 462 (49.1%) |
| Personal Care & Service | 257 (33.9%) | 501 (66.1%) |
| Total (Category) | 1,923 (40.4%) | 2,841 (59.6%) |
| Total (Overall) | 12,190 (52.1%) | 11,210 (47.9%) |
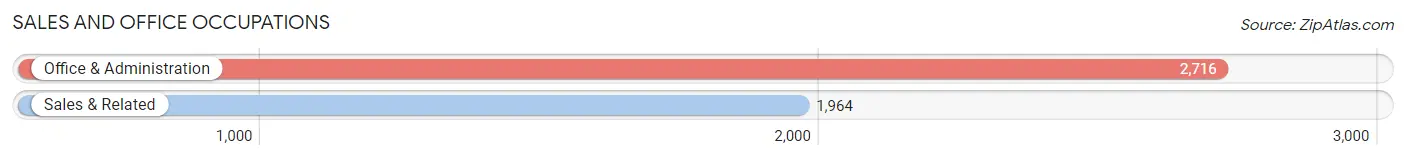
Sales and Office Occupations
The most common Sales and Office occupations in Coles County are Office & Administration (2,716 | 11.6%), and Sales & Related (1,964 | 8.4%).
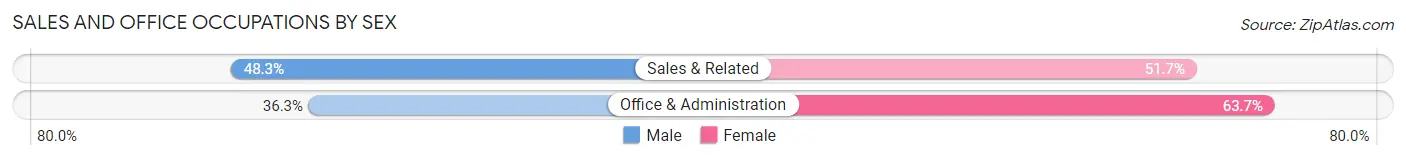
Sales and Office Occupations by Sex
| Occupation | Male | Female |
| Sales & Related | 948 (48.3%) | 1,016 (51.7%) |
| Office & Administration | 985 (36.3%) | 1,731 (63.7%) |
| Total (Category) | 1,933 (41.3%) | 2,747 (58.7%) |
| Total (Overall) | 12,190 (52.1%) | 11,210 (47.9%) |
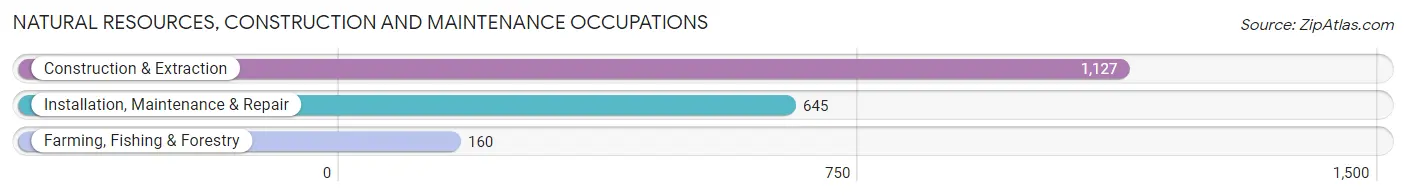
Natural Resources, Construction and Maintenance Occupations
The most common Natural Resources, Construction and Maintenance occupations in Coles County are Construction & Extraction (1,127 | 4.8%), Installation, Maintenance & Repair (645 | 2.8%), and Farming, Fishing & Forestry (160 | 0.7%).
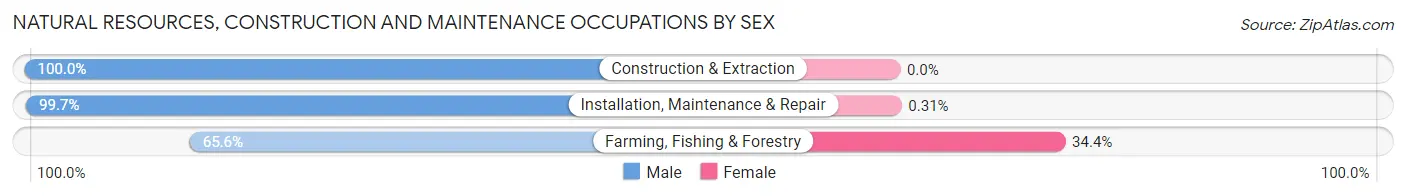
Natural Resources, Construction and Maintenance Occupations by Sex
| Occupation | Male | Female |
| Farming, Fishing & Forestry | 105 (65.6%) | 55 (34.4%) |
| Construction & Extraction | 1,127 (100.0%) | 0 (0.0%) |
| Installation, Maintenance & Repair | 643 (99.7%) | 2 (0.3%) |
| Total (Category) | 1,875 (97.1%) | 57 (2.9%) |
| Total (Overall) | 12,190 (52.1%) | 11,210 (47.9%) |
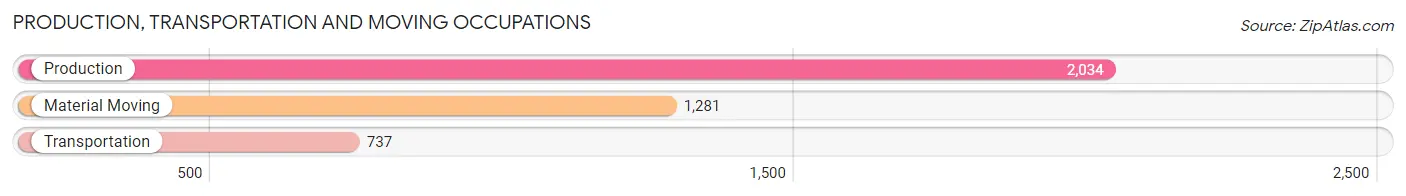
Production, Transportation and Moving Occupations
The most common Production, Transportation and Moving occupations in Coles County are Production (2,034 | 8.7%), Material Moving (1,281 | 5.5%), and Transportation (737 | 3.2%).
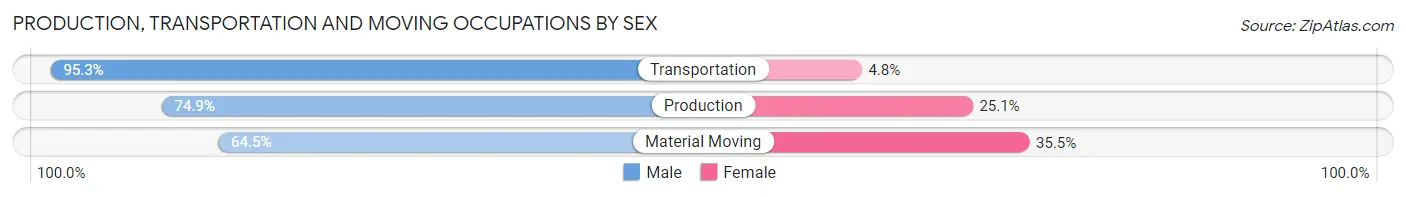
Production, Transportation and Moving Occupations by Sex
| Occupation | Male | Female |
| Production | 1,523 (74.9%) | 511 (25.1%) |
| Transportation | 702 (95.3%) | 35 (4.8%) |
| Material Moving | 826 (64.5%) | 455 (35.5%) |
| Total (Category) | 3,051 (75.3%) | 1,001 (24.7%) |
| Total (Overall) | 12,190 (52.1%) | 11,210 (47.9%) |
Employment Industries by Sex in Coles County
Employment Industries in Coles County
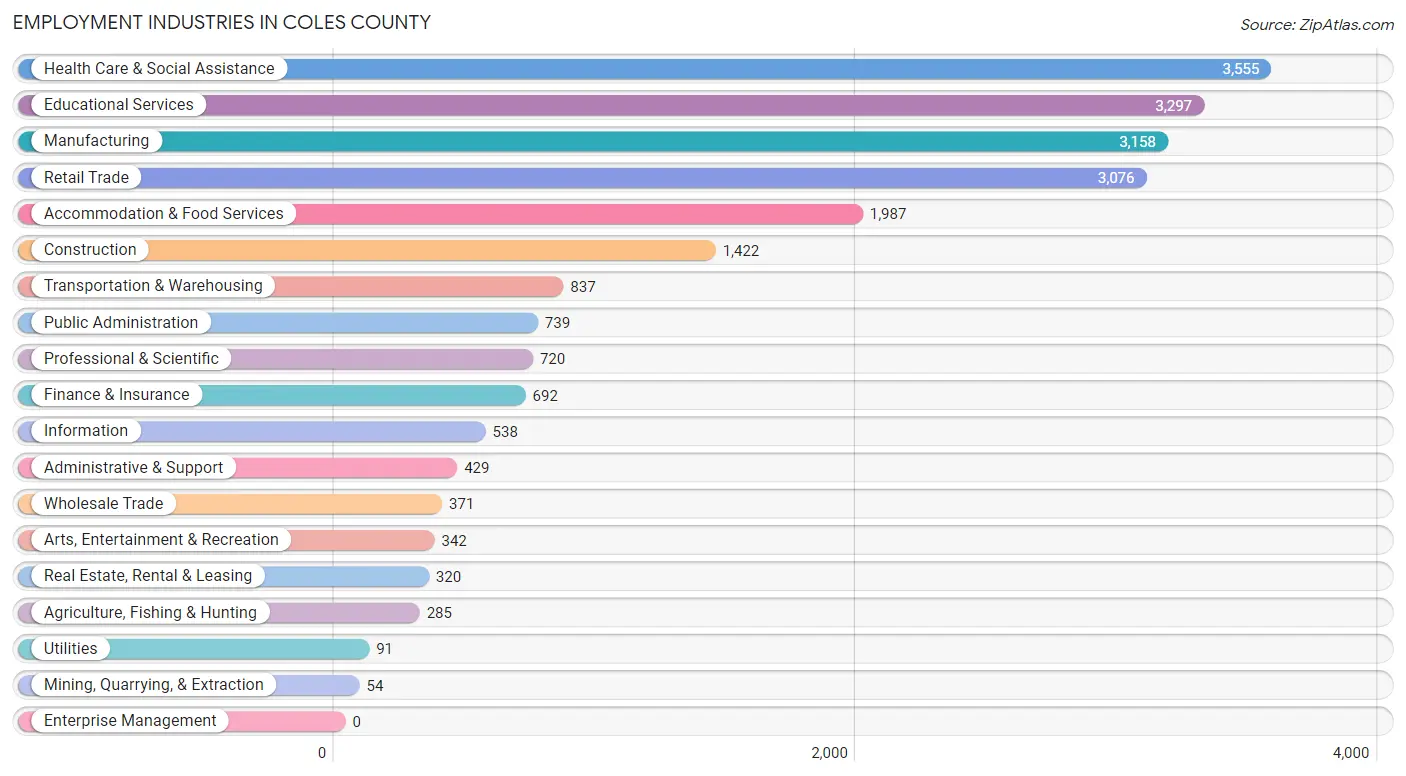
The major employment industries in Coles County include Health Care & Social Assistance (3,555 | 15.2%), Educational Services (3,297 | 14.1%), Manufacturing (3,158 | 13.5%), Retail Trade (3,076 | 13.2%), and Accommodation & Food Services (1,987 | 8.5%).
Employment Industries by Sex in Coles County
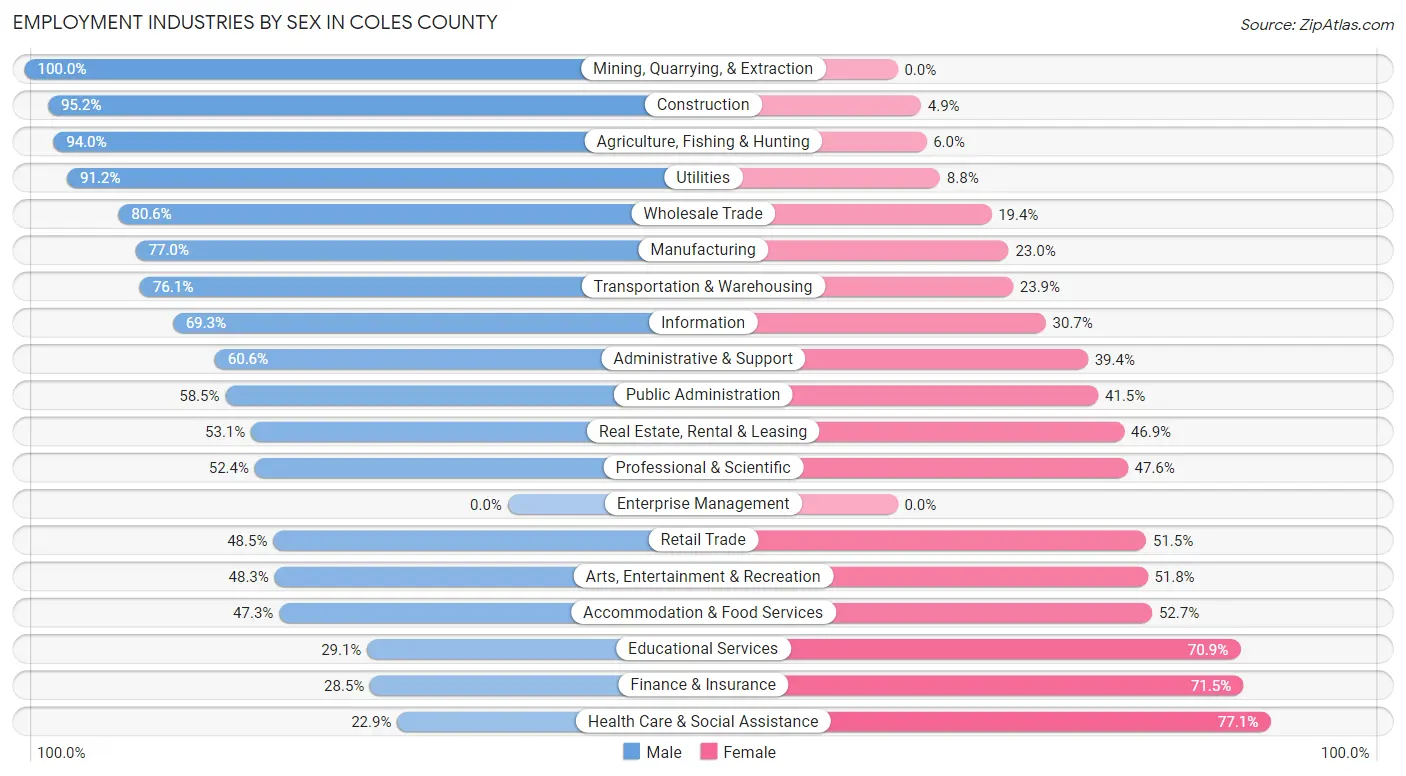
The Coles County industries that see more men than women are Mining, Quarrying, & Extraction (100.0%), Construction (95.2%), and Agriculture, Fishing & Hunting (94.0%), whereas the industries that tend to have a higher number of women are Health Care & Social Assistance (77.1%), Finance & Insurance (71.5%), and Educational Services (70.9%).
| Industry | Male | Female |
| Agriculture, Fishing & Hunting | 268 (94.0%) | 17 (6.0%) |
| Mining, Quarrying, & Extraction | 54 (100.0%) | 0 (0.0%) |
| Construction | 1,353 (95.2%) | 69 (4.9%) |
| Manufacturing | 2,432 (77.0%) | 726 (23.0%) |
| Wholesale Trade | 299 (80.6%) | 72 (19.4%) |
| Retail Trade | 1,493 (48.5%) | 1,583 (51.5%) |
| Transportation & Warehousing | 637 (76.1%) | 200 (23.9%) |
| Utilities | 83 (91.2%) | 8 (8.8%) |
| Information | 373 (69.3%) | 165 (30.7%) |
| Finance & Insurance | 197 (28.5%) | 495 (71.5%) |
| Real Estate, Rental & Leasing | 170 (53.1%) | 150 (46.9%) |
| Professional & Scientific | 377 (52.4%) | 343 (47.6%) |
| Enterprise Management | 0 (0.0%) | 0 (0.0%) |
| Administrative & Support | 260 (60.6%) | 169 (39.4%) |
| Educational Services | 959 (29.1%) | 2,338 (70.9%) |
| Health Care & Social Assistance | 813 (22.9%) | 2,742 (77.1%) |
| Arts, Entertainment & Recreation | 165 (48.2%) | 177 (51.7%) |
| Accommodation & Food Services | 940 (47.3%) | 1,047 (52.7%) |
| Public Administration | 432 (58.5%) | 307 (41.5%) |
| Total | 12,190 (52.1%) | 11,210 (47.9%) |
Education in Coles County
School Enrollment in Coles County
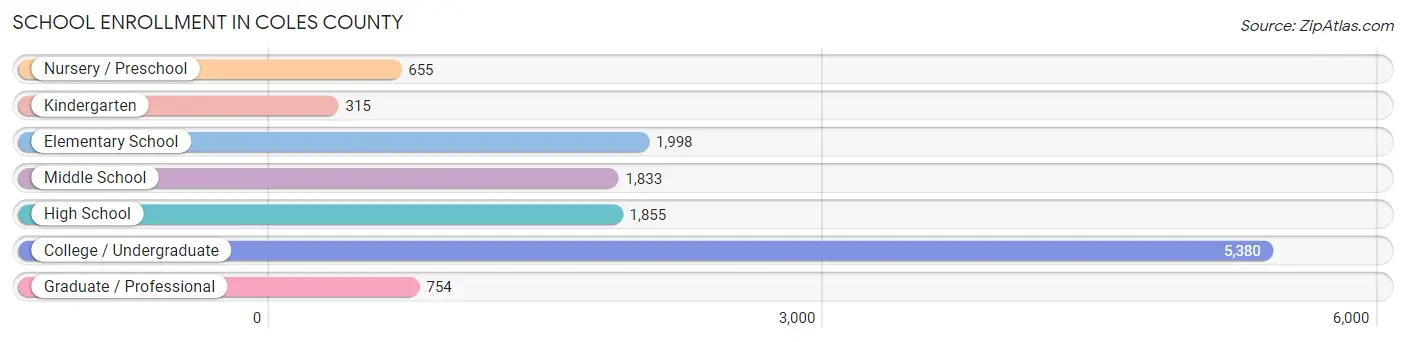
The most common levels of schooling among the 12,790 students in Coles County are college / undergraduate (5,380 | 42.1%), elementary school (1,998 | 15.6%), and high school (1,855 | 14.5%).
| School Level | # Students | % Students |
| Nursery / Preschool | 655 | 5.1% |
| Kindergarten | 315 | 2.5% |
| Elementary School | 1,998 | 15.6% |
| Middle School | 1,833 | 14.3% |
| High School | 1,855 | 14.5% |
| College / Undergraduate | 5,380 | 42.1% |
| Graduate / Professional | 754 | 5.9% |
| Total | 12,790 | 100.0% |
School Enrollment by Age by Funding Source in Coles County
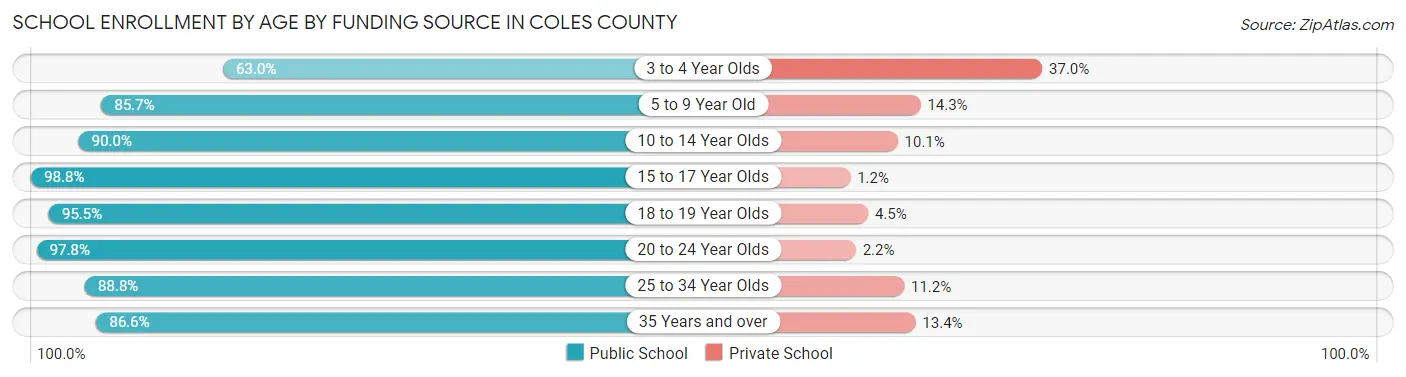
Out of a total of 12,790 students who are enrolled in schools in Coles County, 1,049 (8.2%) attend a private institution, while the remaining 11,741 (91.8%) are enrolled in public schools. The age group of 3 to 4 year olds has the highest likelihood of being enrolled in private schools, with 180 (37.0% in the age bracket) enrolled. Conversely, the age group of 15 to 17 year olds has the lowest likelihood of being enrolled in a private school, with 1,374 (98.8% in the age bracket) attending a public institution.
| Age Bracket | Public School | Private School |
| 3 to 4 Year Olds | 307 (63.0%) | 180 (37.0%) |
| 5 to 9 Year Old | 1,804 (85.7%) | 301 (14.3%) |
| 10 to 14 Year Olds | 2,176 (89.9%) | 243 (10.1%) |
| 15 to 17 Year Olds | 1,374 (98.8%) | 17 (1.2%) |
| 18 to 19 Year Olds | 1,837 (95.5%) | 87 (4.5%) |
| 20 to 24 Year Olds | 3,180 (97.8%) | 73 (2.2%) |
| 25 to 34 Year Olds | 663 (88.8%) | 84 (11.2%) |
| 35 Years and over | 402 (86.6%) | 62 (13.4%) |
| Total | 11,741 (91.8%) | 1,049 (8.2%) |
Educational Attainment by Field of Study in Coles County
Education (1,940 | 21.9%), business (1,324 | 14.9%), science & technology (783 | 8.8%), arts & humanities (767 | 8.7%), and social sciences (686 | 7.7%) are the most common fields of study among 8,860 individuals in Coles County who have obtained a bachelor's degree or higher.
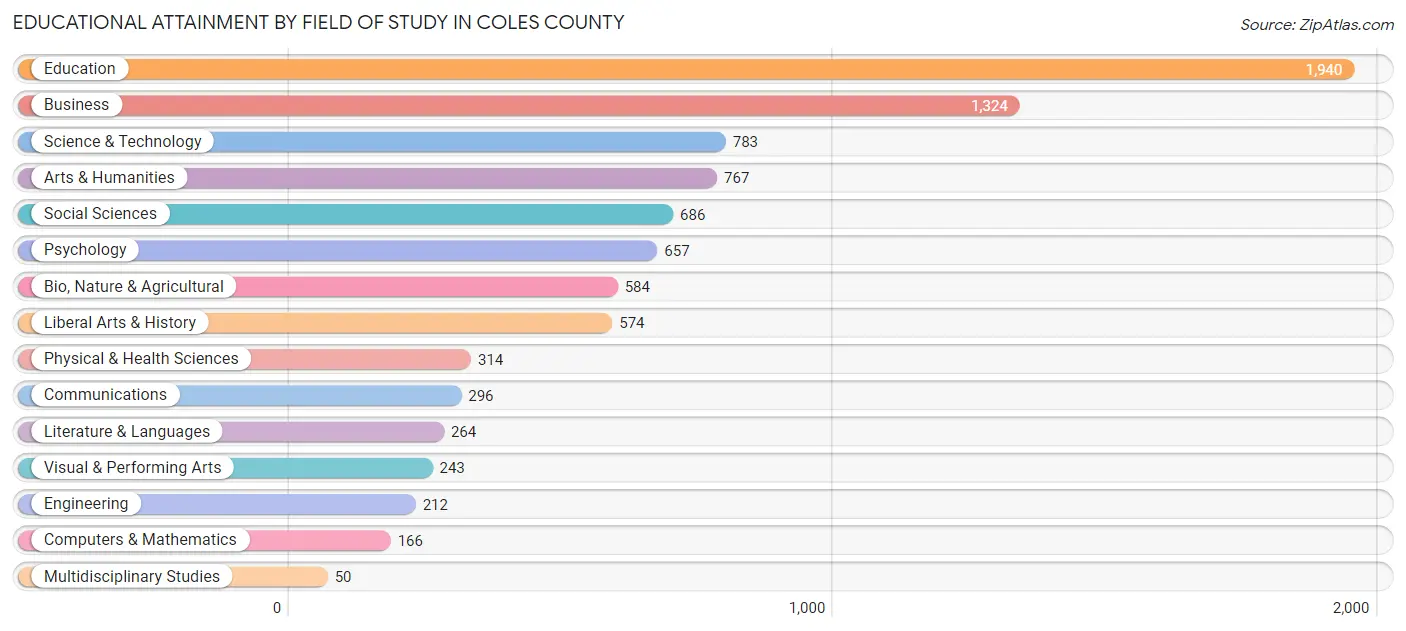
| Field of Study | # Graduates | % Graduates |
| Computers & Mathematics | 166 | 1.9% |
| Bio, Nature & Agricultural | 584 | 6.6% |
| Physical & Health Sciences | 314 | 3.5% |
| Psychology | 657 | 7.4% |
| Social Sciences | 686 | 7.7% |
| Engineering | 212 | 2.4% |
| Multidisciplinary Studies | 50 | 0.6% |
| Science & Technology | 783 | 8.8% |
| Business | 1,324 | 14.9% |
| Education | 1,940 | 21.9% |
| Literature & Languages | 264 | 3.0% |
| Liberal Arts & History | 574 | 6.5% |
| Visual & Performing Arts | 243 | 2.7% |
| Communications | 296 | 3.3% |
| Arts & Humanities | 767 | 8.7% |
| Total | 8,860 | 100.0% |
Transportation & Commute in Coles County
Vehicle Availability by Sex in Coles County
The most prevalent vehicle ownership categories in Coles County are males with 2 vehicles (4,962, accounting for 43.6%) and females with 2 vehicles (4,226, making up 49.0%).
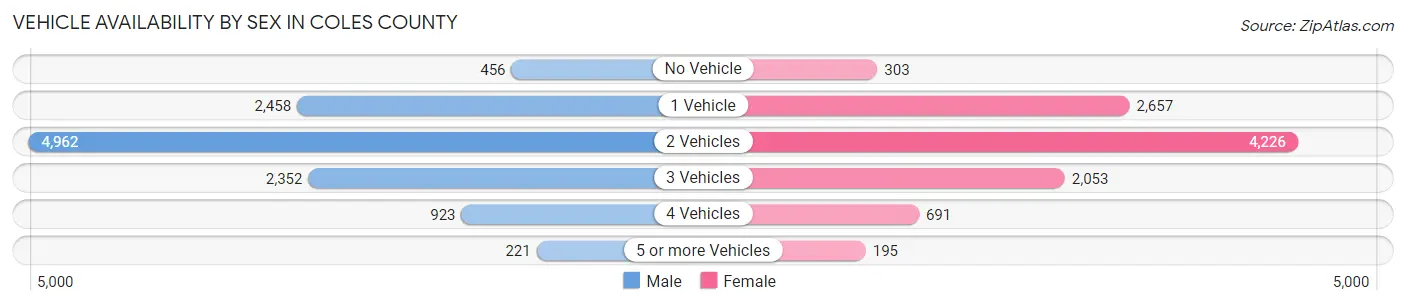
| Vehicles Available | Male | Female |
| No Vehicle | 456 (4.0%) | 303 (3.0%) |
| 1 Vehicle | 2,458 (21.6%) | 2,657 (26.2%) |
| 2 Vehicles | 4,962 (43.6%) | 4,226 (41.7%) |
| 3 Vehicles | 2,352 (20.7%) | 2,053 (20.3%) |
| 4 Vehicles | 923 (8.1%) | 691 (6.8%) |
| 5 or more Vehicles | 221 (1.9%) | 195 (1.9%) |
| Total | 11,372 (100.0%) | 10,125 (100.0%) |
Commute Time in Coles County
The most frequently occuring commute durations in Coles County are 5 to 9 minutes (5,259 commuters, 24.6%), 10 to 14 minutes (3,885 commuters, 18.2%), and 15 to 19 minutes (3,469 commuters, 16.2%).
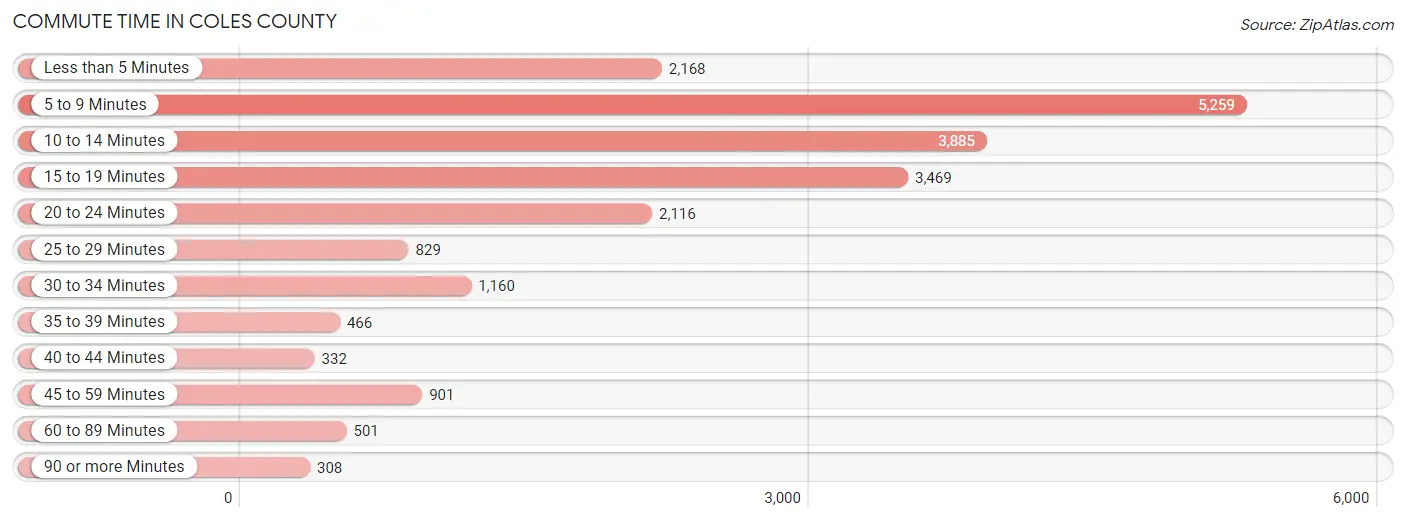
| Commute Time | # Commuters | % Commuters |
| Less than 5 Minutes | 2,168 | 10.1% |
| 5 to 9 Minutes | 5,259 | 24.6% |
| 10 to 14 Minutes | 3,885 | 18.2% |
| 15 to 19 Minutes | 3,469 | 16.2% |
| 20 to 24 Minutes | 2,116 | 9.9% |
| 25 to 29 Minutes | 829 | 3.9% |
| 30 to 34 Minutes | 1,160 | 5.4% |
| 35 to 39 Minutes | 466 | 2.2% |
| 40 to 44 Minutes | 332 | 1.5% |
| 45 to 59 Minutes | 901 | 4.2% |
| 60 to 89 Minutes | 501 | 2.3% |
| 90 or more Minutes | 308 | 1.4% |
Commute Time by Sex in Coles County
The most common commute times in Coles County are 5 to 9 minutes (2,411 commuters, 21.4%) for males and 5 to 9 minutes (2,848 commuters, 28.1%) for females.
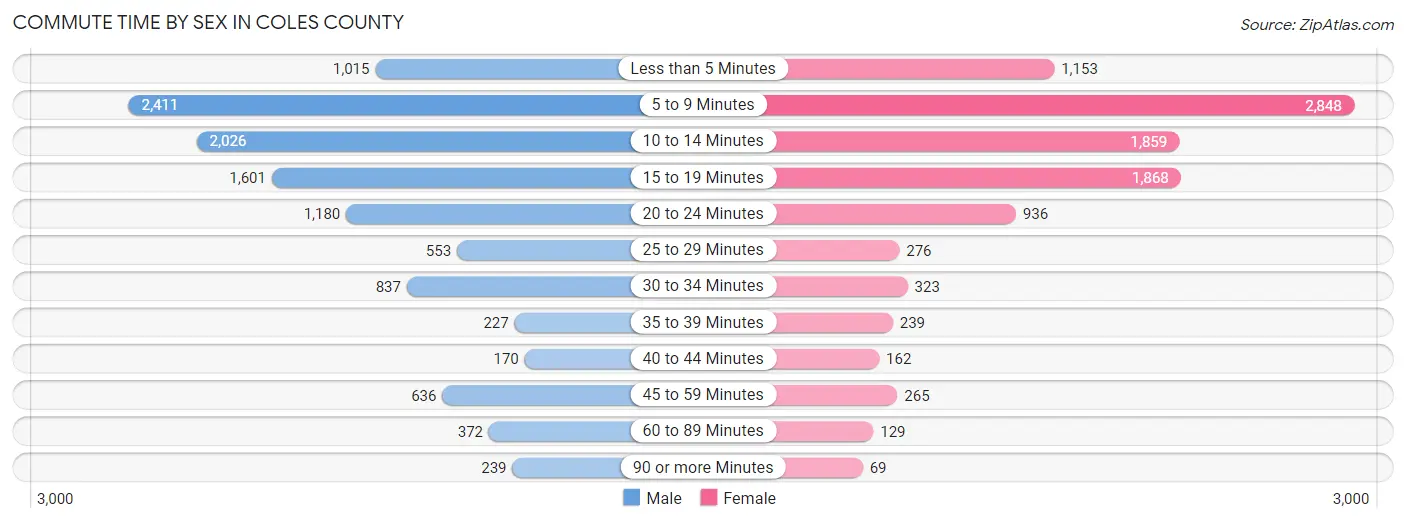
| Commute Time | Male | Female |
| Less than 5 Minutes | 1,015 (9.0%) | 1,153 (11.4%) |
| 5 to 9 Minutes | 2,411 (21.4%) | 2,848 (28.1%) |
| 10 to 14 Minutes | 2,026 (18.0%) | 1,859 (18.4%) |
| 15 to 19 Minutes | 1,601 (14.2%) | 1,868 (18.4%) |
| 20 to 24 Minutes | 1,180 (10.5%) | 936 (9.2%) |
| 25 to 29 Minutes | 553 (4.9%) | 276 (2.7%) |
| 30 to 34 Minutes | 837 (7.4%) | 323 (3.2%) |
| 35 to 39 Minutes | 227 (2.0%) | 239 (2.4%) |
| 40 to 44 Minutes | 170 (1.5%) | 162 (1.6%) |
| 45 to 59 Minutes | 636 (5.6%) | 265 (2.6%) |
| 60 to 89 Minutes | 372 (3.3%) | 129 (1.3%) |
| 90 or more Minutes | 239 (2.1%) | 69 (0.7%) |
Time of Departure to Work by Sex in Coles County
The most frequent times of departure to work in Coles County are 6:00 AM to 6:29 AM (1,265, 11.2%) for males and 7:30 AM to 7:59 AM (1,718, 17.0%) for females.
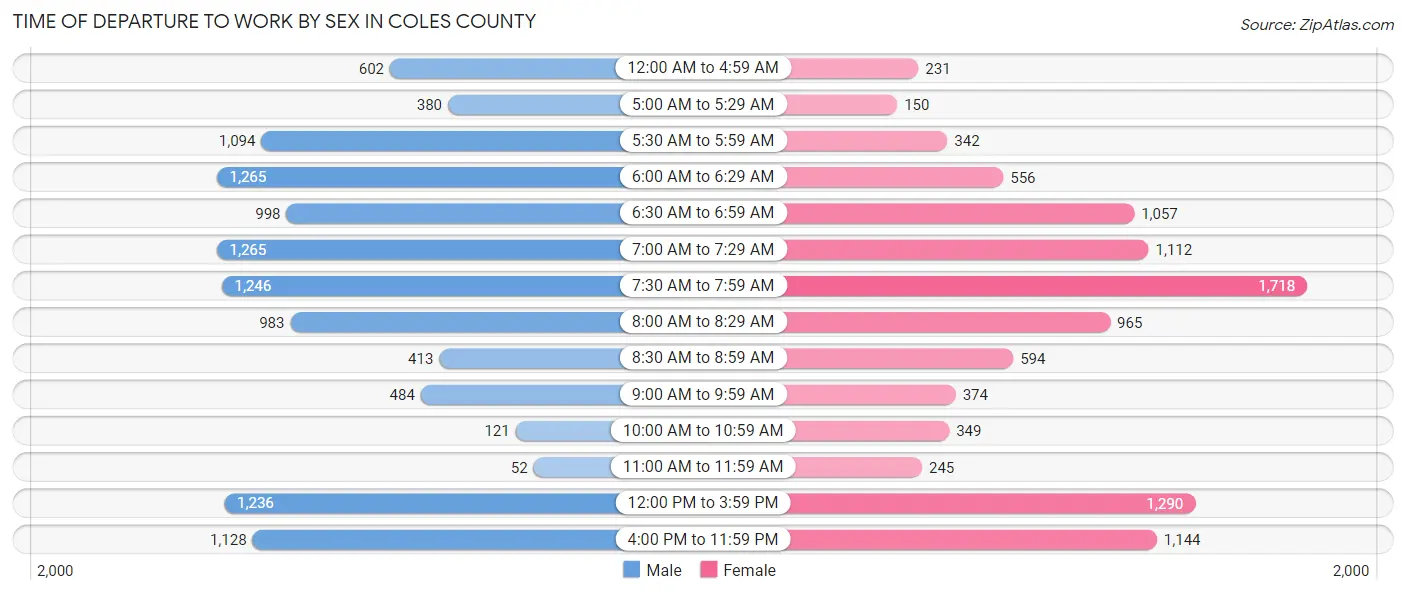
| Time of Departure | Male | Female |
| 12:00 AM to 4:59 AM | 602 (5.3%) | 231 (2.3%) |
| 5:00 AM to 5:29 AM | 380 (3.4%) | 150 (1.5%) |
| 5:30 AM to 5:59 AM | 1,094 (9.7%) | 342 (3.4%) |
| 6:00 AM to 6:29 AM | 1,265 (11.2%) | 556 (5.5%) |
| 6:30 AM to 6:59 AM | 998 (8.9%) | 1,057 (10.4%) |
| 7:00 AM to 7:29 AM | 1,265 (11.2%) | 1,112 (11.0%) |
| 7:30 AM to 7:59 AM | 1,246 (11.1%) | 1,718 (17.0%) |
| 8:00 AM to 8:29 AM | 983 (8.7%) | 965 (9.5%) |
| 8:30 AM to 8:59 AM | 413 (3.7%) | 594 (5.9%) |
| 9:00 AM to 9:59 AM | 484 (4.3%) | 374 (3.7%) |
| 10:00 AM to 10:59 AM | 121 (1.1%) | 349 (3.5%) |
| 11:00 AM to 11:59 AM | 52 (0.5%) | 245 (2.4%) |
| 12:00 PM to 3:59 PM | 1,236 (11.0%) | 1,290 (12.7%) |
| 4:00 PM to 11:59 PM | 1,128 (10.0%) | 1,144 (11.3%) |
| Total | 11,267 (100.0%) | 10,127 (100.0%) |
Housing Occupancy in Coles County
Occupancy by Ownership in Coles County
Of the total 20,385 dwellings in Coles County, owner-occupied units account for 12,238 (60.0%), while renter-occupied units make up 8,147 (40.0%).
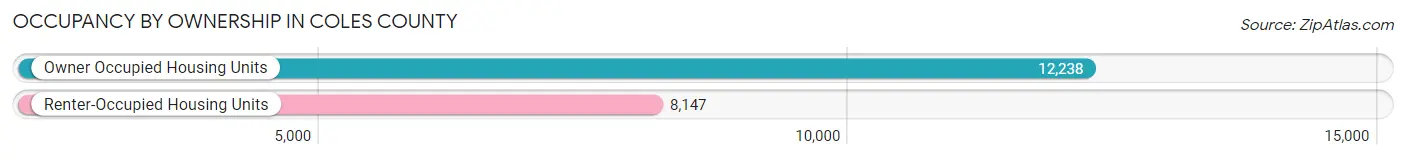
| Occupancy | # Housing Units | % Housing Units |
| Owner Occupied Housing Units | 12,238 | 60.0% |
| Renter-Occupied Housing Units | 8,147 | 40.0% |
| Total Occupied Housing Units | 20,385 | 100.0% |
Occupancy by Household Size in Coles County
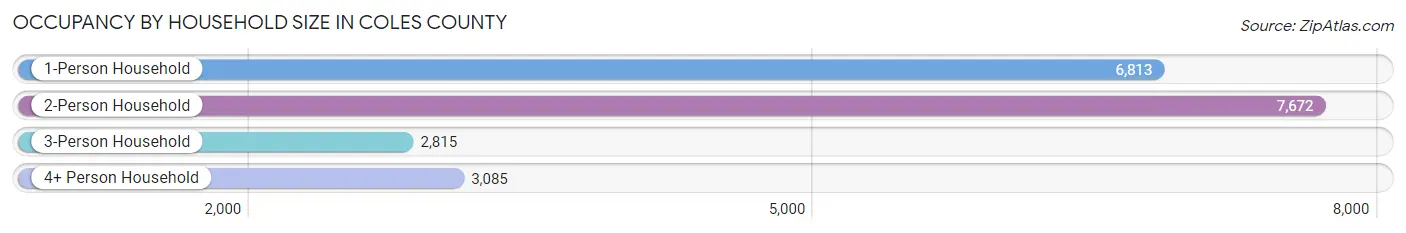
| Household Size | # Housing Units | % Housing Units |
| 1-Person Household | 6,813 | 33.4% |
| 2-Person Household | 7,672 | 37.6% |
| 3-Person Household | 2,815 | 13.8% |
| 4+ Person Household | 3,085 | 15.1% |
| Total Housing Units | 20,385 | 100.0% |
Occupancy by Ownership by Household Size in Coles County
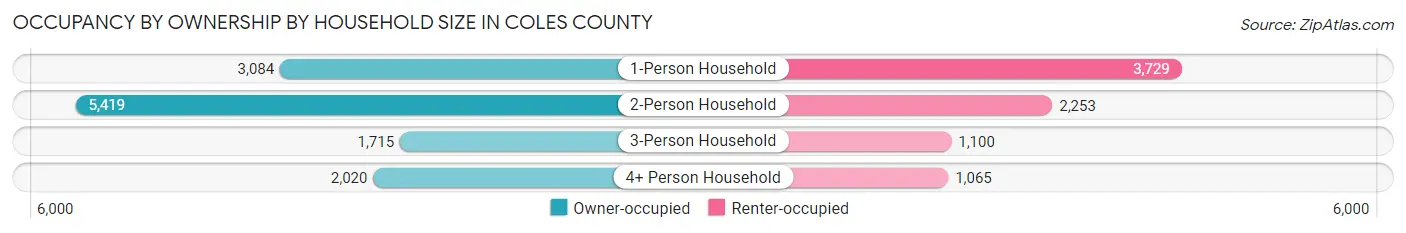
| Household Size | Owner-occupied | Renter-occupied |
| 1-Person Household | 3,084 (45.3%) | 3,729 (54.7%) |
| 2-Person Household | 5,419 (70.6%) | 2,253 (29.4%) |
| 3-Person Household | 1,715 (60.9%) | 1,100 (39.1%) |
| 4+ Person Household | 2,020 (65.5%) | 1,065 (34.5%) |
| Total Housing Units | 12,238 (60.0%) | 8,147 (40.0%) |
Occupancy by Educational Attainment in Coles County
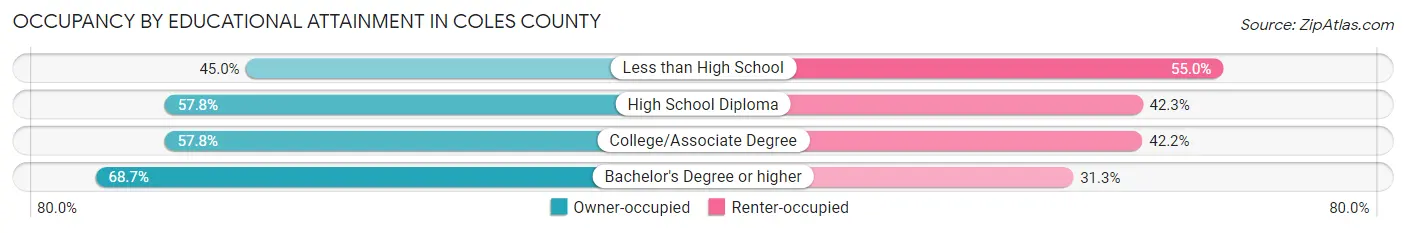
| Household Size | Owner-occupied | Renter-occupied |
| Less than High School | 595 (45.0%) | 728 (55.0%) |
| High School Diploma | 3,362 (57.8%) | 2,460 (42.2%) |
| College/Associate Degree | 4,323 (57.8%) | 3,159 (42.2%) |
| Bachelor's Degree or higher | 3,958 (68.7%) | 1,800 (31.3%) |
Occupancy by Age of Householder in Coles County
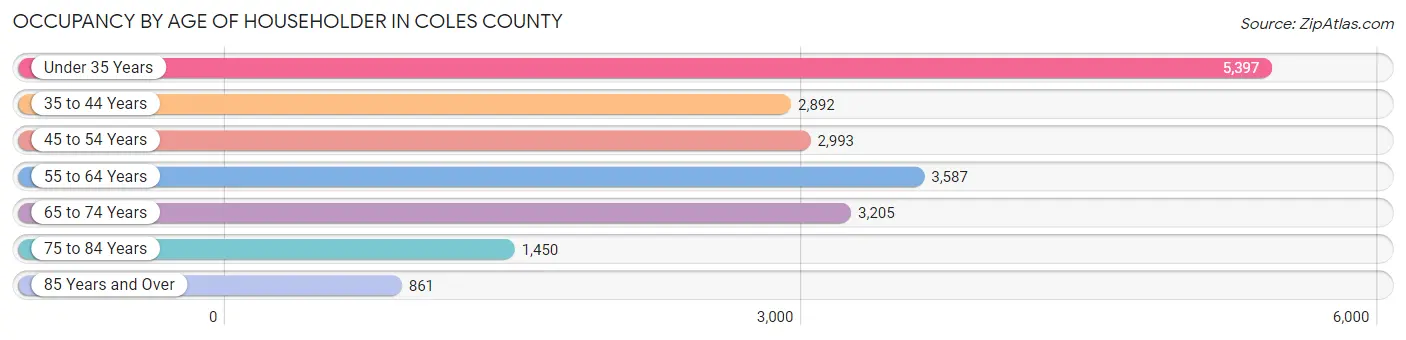
| Age Bracket | # Households | % Households |
| Under 35 Years | 5,397 | 26.5% |
| 35 to 44 Years | 2,892 | 14.2% |
| 45 to 54 Years | 2,993 | 14.7% |
| 55 to 64 Years | 3,587 | 17.6% |
| 65 to 74 Years | 3,205 | 15.7% |
| 75 to 84 Years | 1,450 | 7.1% |
| 85 Years and Over | 861 | 4.2% |
| Total | 20,385 | 100.0% |
Housing Finances in Coles County
Median Income by Occupancy in Coles County
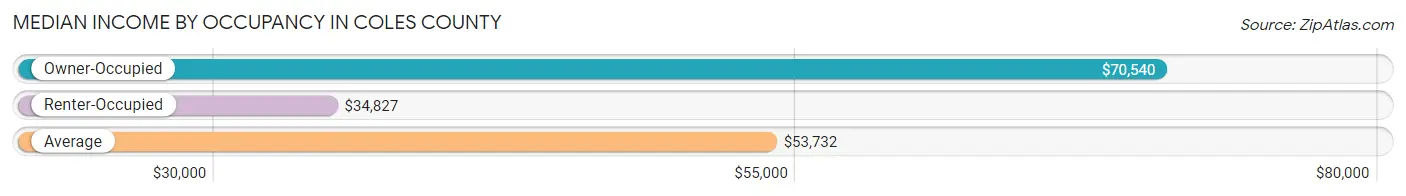
| Occupancy Type | # Households | Median Income |
| Owner-Occupied | 12,238 (60.0%) | $70,540 |
| Renter-Occupied | 8,147 (40.0%) | $34,827 |
| Average | 20,385 (100.0%) | $53,732 |
Occupancy by Householder Income Bracket in Coles County
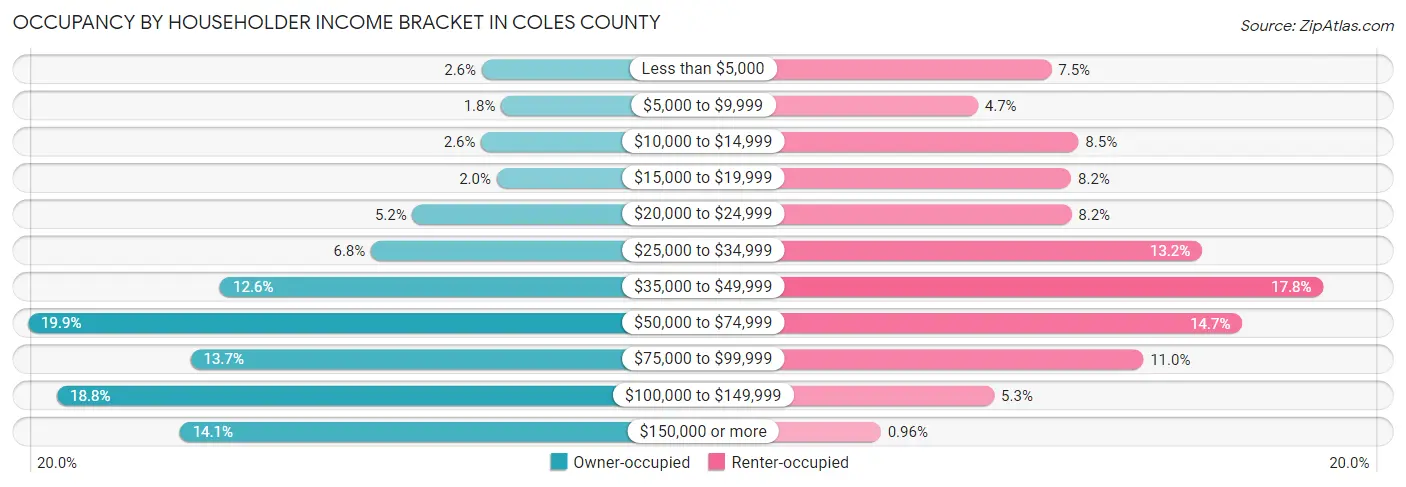
| Income Bracket | Owner-occupied | Renter-occupied |
| Less than $5,000 | 316 (2.6%) | 608 (7.5%) |
| $5,000 to $9,999 | 225 (1.8%) | 380 (4.7%) |
| $10,000 to $14,999 | 318 (2.6%) | 692 (8.5%) |
| $15,000 to $19,999 | 246 (2.0%) | 669 (8.2%) |
| $20,000 to $24,999 | 639 (5.2%) | 670 (8.2%) |
| $25,000 to $34,999 | 832 (6.8%) | 1,075 (13.2%) |
| $35,000 to $49,999 | 1,536 (12.6%) | 1,452 (17.8%) |
| $50,000 to $74,999 | 2,432 (19.9%) | 1,200 (14.7%) |
| $75,000 to $99,999 | 1,674 (13.7%) | 893 (11.0%) |
| $100,000 to $149,999 | 2,296 (18.8%) | 430 (5.3%) |
| $150,000 or more | 1,724 (14.1%) | 78 (1.0%) |
| Total | 12,238 (100.0%) | 8,147 (100.0%) |
Monthly Housing Cost Tiers in Coles County
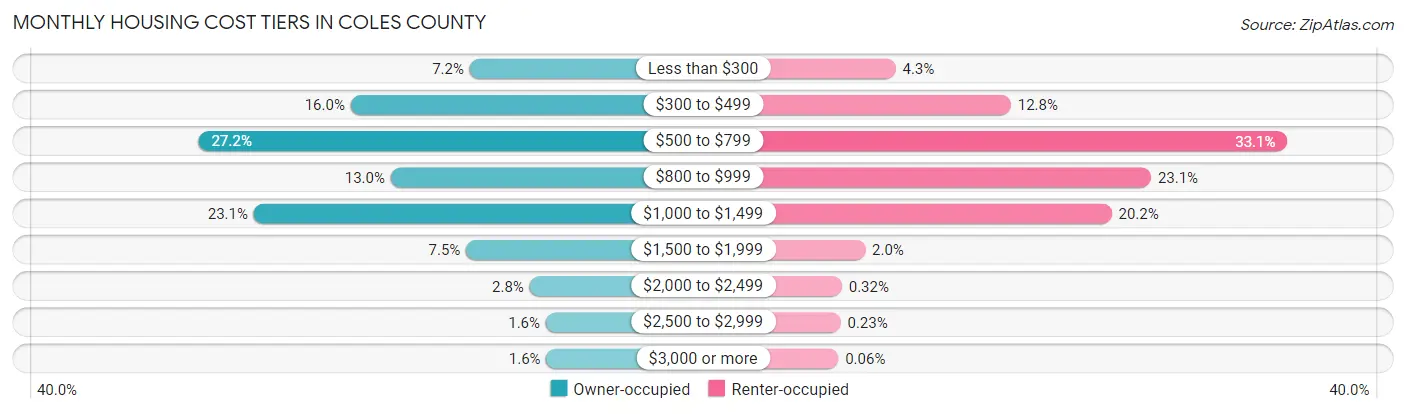
| Monthly Cost | Owner-occupied | Renter-occupied |
| Less than $300 | 882 (7.2%) | 349 (4.3%) |
| $300 to $499 | 1,956 (16.0%) | 1,040 (12.8%) |
| $500 to $799 | 3,328 (27.2%) | 2,699 (33.1%) |
| $800 to $999 | 1,595 (13.0%) | 1,881 (23.1%) |
| $1,000 to $1,499 | 2,829 (23.1%) | 1,645 (20.2%) |
| $1,500 to $1,999 | 916 (7.5%) | 166 (2.0%) |
| $2,000 to $2,499 | 343 (2.8%) | 26 (0.3%) |
| $2,500 to $2,999 | 197 (1.6%) | 19 (0.2%) |
| $3,000 or more | 192 (1.6%) | 5 (0.1%) |
| Total | 12,238 (100.0%) | 8,147 (100.0%) |
Physical Housing Characteristics in Coles County
Housing Structures in Coles County
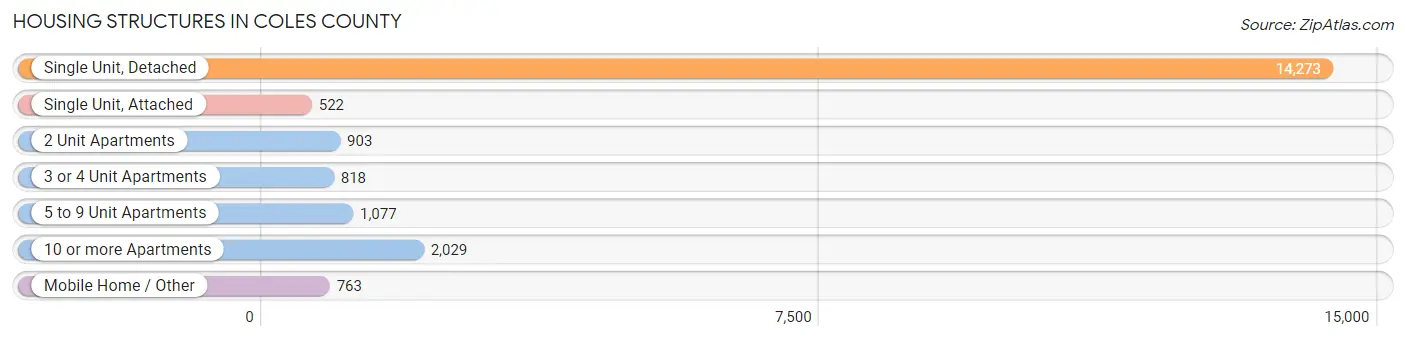
| Structure Type | # Housing Units | % Housing Units |
| Single Unit, Detached | 14,273 | 70.0% |
| Single Unit, Attached | 522 | 2.6% |
| 2 Unit Apartments | 903 | 4.4% |
| 3 or 4 Unit Apartments | 818 | 4.0% |
| 5 to 9 Unit Apartments | 1,077 | 5.3% |
| 10 or more Apartments | 2,029 | 10.0% |
| Mobile Home / Other | 763 | 3.7% |
| Total | 20,385 | 100.0% |
Housing Structures by Occupancy in Coles County
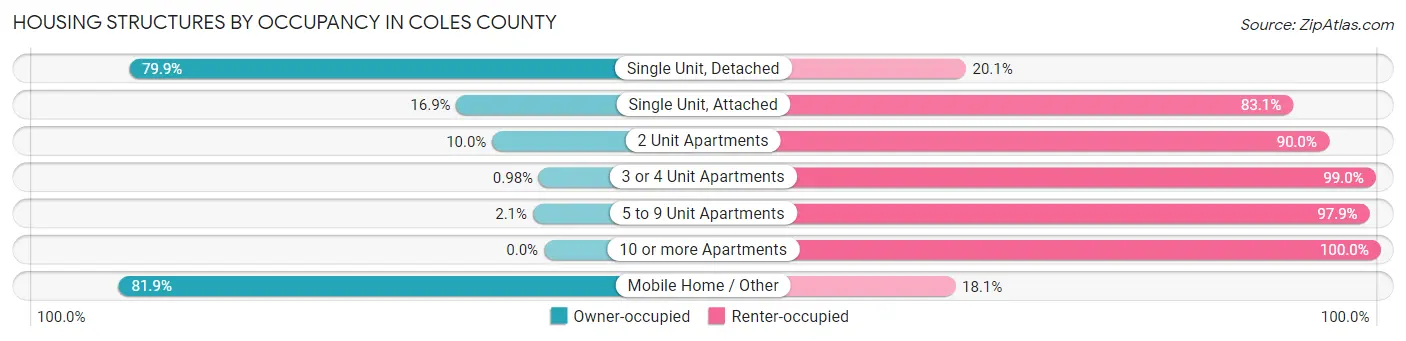
| Structure Type | Owner-occupied | Renter-occupied |
| Single Unit, Detached | 11,404 (79.9%) | 2,869 (20.1%) |
| Single Unit, Attached | 88 (16.9%) | 434 (83.1%) |
| 2 Unit Apartments | 90 (10.0%) | 813 (90.0%) |
| 3 or 4 Unit Apartments | 8 (1.0%) | 810 (99.0%) |
| 5 to 9 Unit Apartments | 23 (2.1%) | 1,054 (97.9%) |
| 10 or more Apartments | 0 (0.0%) | 2,029 (100.0%) |
| Mobile Home / Other | 625 (81.9%) | 138 (18.1%) |
| Total | 12,238 (60.0%) | 8,147 (40.0%) |
Housing Structures by Number of Rooms in Coles County
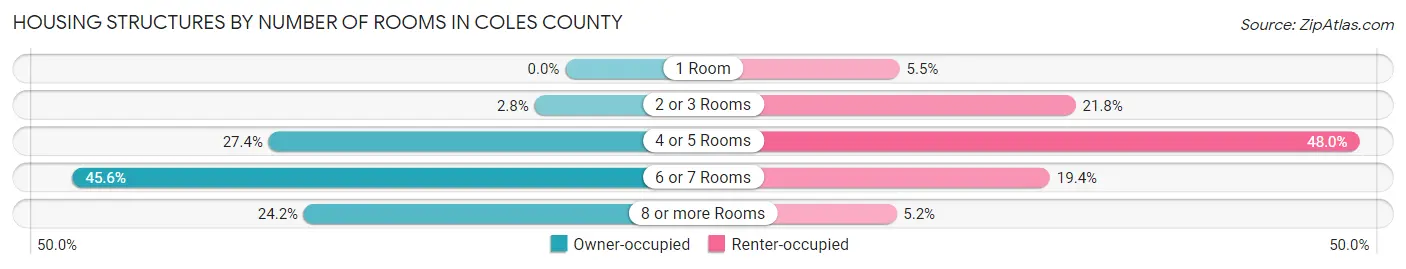
| Number of Rooms | Owner-occupied | Renter-occupied |
| 1 Room | 0 (0.0%) | 450 (5.5%) |
| 2 or 3 Rooms | 348 (2.8%) | 1,776 (21.8%) |
| 4 or 5 Rooms | 3,356 (27.4%) | 3,914 (48.0%) |
| 6 or 7 Rooms | 5,576 (45.6%) | 1,582 (19.4%) |
| 8 or more Rooms | 2,958 (24.2%) | 425 (5.2%) |
| Total | 12,238 (100.0%) | 8,147 (100.0%) |
Housing Structure by Heating Type in Coles County
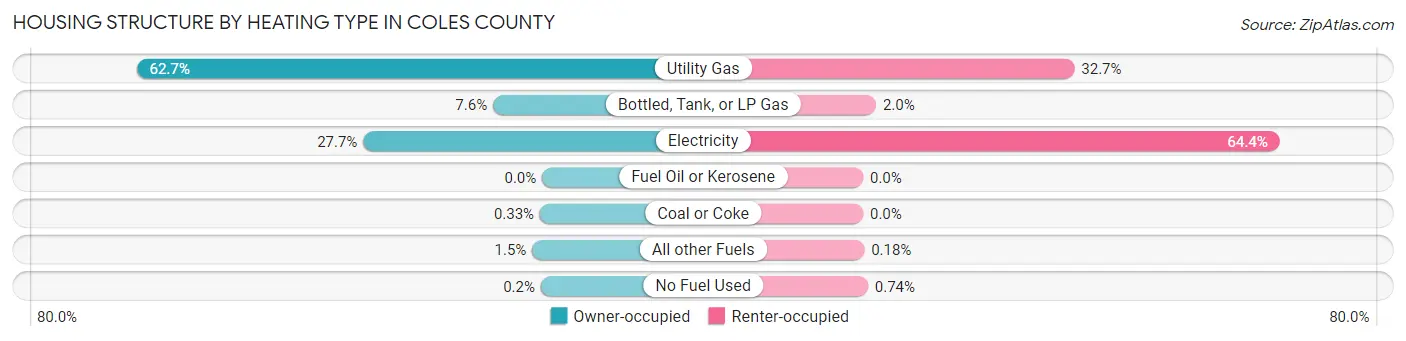
| Heating Type | Owner-occupied | Renter-occupied |
| Utility Gas | 7,672 (62.7%) | 2,662 (32.7%) |
| Bottled, Tank, or LP Gas | 929 (7.6%) | 163 (2.0%) |
| Electricity | 3,385 (27.7%) | 5,247 (64.4%) |
| Fuel Oil or Kerosene | 0 (0.0%) | 0 (0.0%) |
| Coal or Coke | 40 (0.3%) | 0 (0.0%) |
| All other Fuels | 187 (1.5%) | 15 (0.2%) |
| No Fuel Used | 25 (0.2%) | 60 (0.7%) |
| Total | 12,238 (100.0%) | 8,147 (100.0%) |
Household Vehicle Usage in Coles County
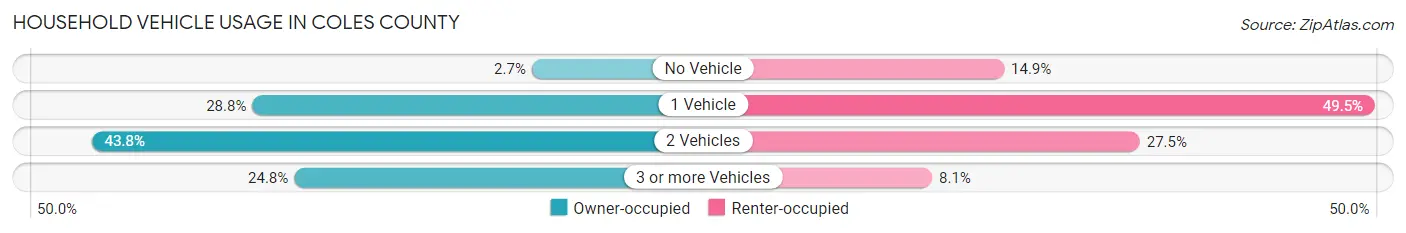
| Vehicles per Household | Owner-occupied | Renter-occupied |
| No Vehicle | 326 (2.7%) | 1,211 (14.9%) |
| 1 Vehicle | 3,518 (28.7%) | 4,030 (49.5%) |
| 2 Vehicles | 5,354 (43.8%) | 2,243 (27.5%) |
| 3 or more Vehicles | 3,040 (24.8%) | 663 (8.1%) |
| Total | 12,238 (100.0%) | 8,147 (100.0%) |
Real Estate & Mortgages in Coles County
Real Estate and Mortgage Overview in Coles County
| Characteristic | Without Mortgage | With Mortgage |
| Housing Units | 6,040 | 6,198 |
| Median Property Value | $106,500 | $118,900 |
| Median Household Income | $58,448 | $859 |
| Monthly Housing Costs | $522 | $160 |
| Real Estate Taxes | $2,109 | $176 |
Property Value by Mortgage Status in Coles County
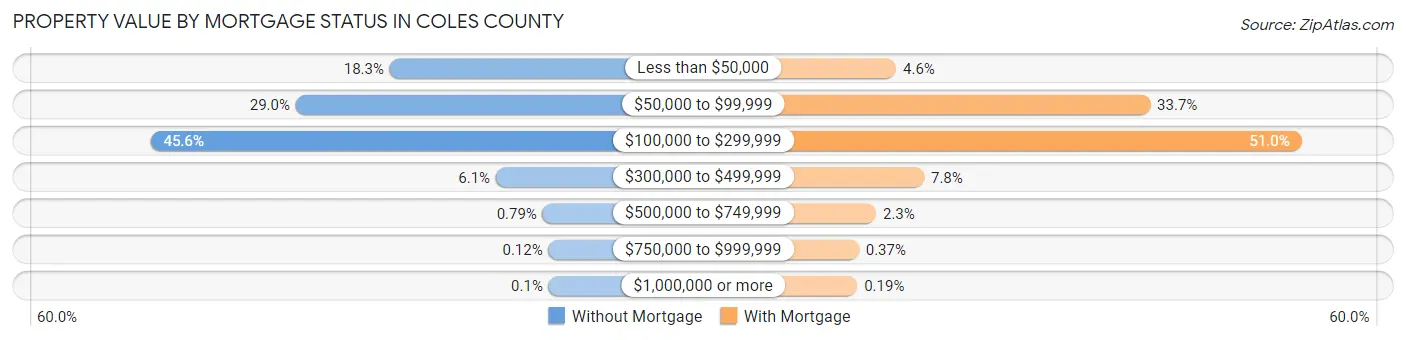
| Property Value | Without Mortgage | With Mortgage |
| Less than $50,000 | 1,103 (18.3%) | 287 (4.6%) |
| $50,000 to $99,999 | 1,752 (29.0%) | 2,087 (33.7%) |
| $100,000 to $299,999 | 2,754 (45.6%) | 3,159 (51.0%) |
| $300,000 to $499,999 | 370 (6.1%) | 485 (7.8%) |
| $500,000 to $749,999 | 48 (0.8%) | 145 (2.3%) |
| $750,000 to $999,999 | 7 (0.1%) | 23 (0.4%) |
| $1,000,000 or more | 6 (0.1%) | 12 (0.2%) |
| Total | 6,040 (100.0%) | 6,198 (100.0%) |
Household Income by Mortgage Status in Coles County
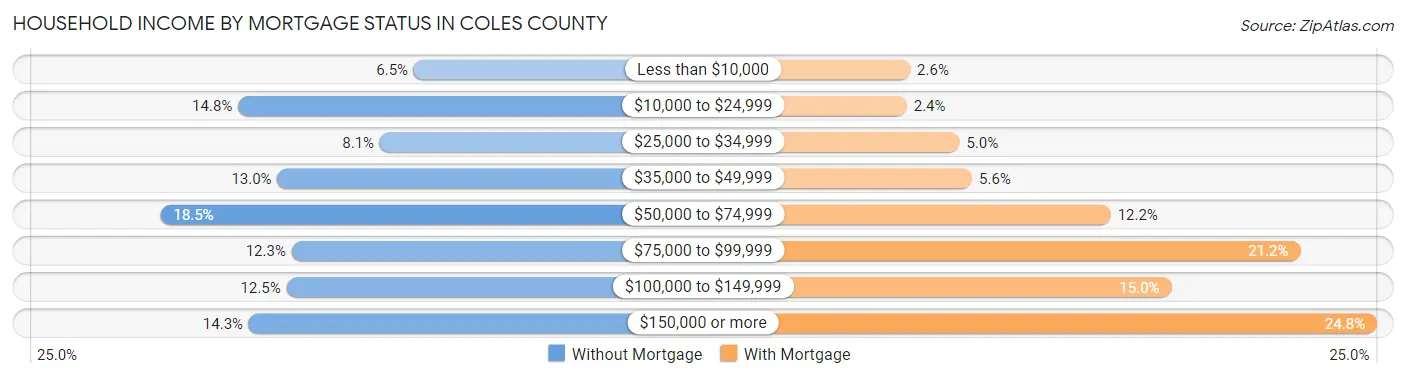
| Household Income | Without Mortgage | With Mortgage |
| Less than $10,000 | 390 (6.5%) | 161 (2.6%) |
| $10,000 to $24,999 | 896 (14.8%) | 151 (2.4%) |
| $25,000 to $34,999 | 488 (8.1%) | 307 (5.0%) |
| $35,000 to $49,999 | 783 (13.0%) | 344 (5.6%) |
| $50,000 to $74,999 | 1,119 (18.5%) | 753 (12.1%) |
| $75,000 to $99,999 | 742 (12.3%) | 1,313 (21.2%) |
| $100,000 to $149,999 | 757 (12.5%) | 932 (15.0%) |
| $150,000 or more | 865 (14.3%) | 1,539 (24.8%) |
| Total | 6,040 (100.0%) | 6,198 (100.0%) |
Property Value to Household Income Ratio in Coles County
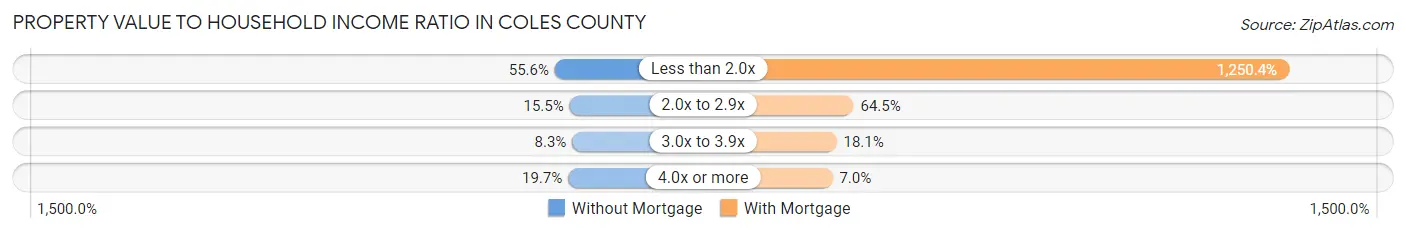
| Value-to-Income Ratio | Without Mortgage | With Mortgage |
| Less than 2.0x | 3,355 (55.5%) | 77,500 (1,250.4%) |
| 2.0x to 2.9x | 933 (15.4%) | 3,995 (64.5%) |
| 3.0x to 3.9x | 500 (8.3%) | 1,119 (18.0%) |
| 4.0x or more | 1,187 (19.7%) | 435 (7.0%) |
| Total | 6,040 (100.0%) | 6,198 (100.0%) |
Real Estate Taxes by Mortgage Status in Coles County
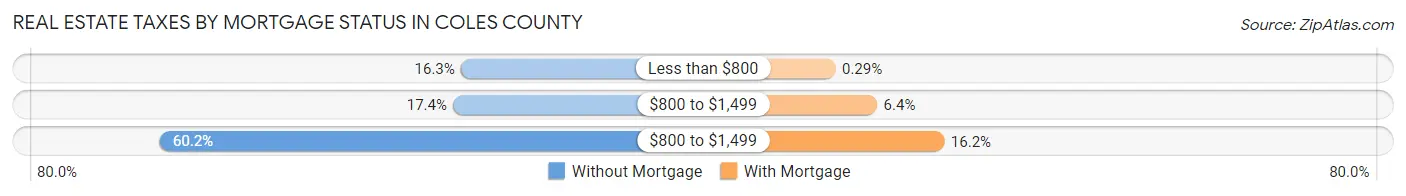
| Property Taxes | Without Mortgage | With Mortgage |
| Less than $800 | 984 (16.3%) | 18 (0.3%) |
| $800 to $1,499 | 1,053 (17.4%) | 395 (6.4%) |
| $800 to $1,499 | 3,637 (60.2%) | 1,004 (16.2%) |
| Total | 6,040 (100.0%) | 6,198 (100.0%) |
Health & Disability in Coles County
Health Insurance Coverage by Age in Coles County
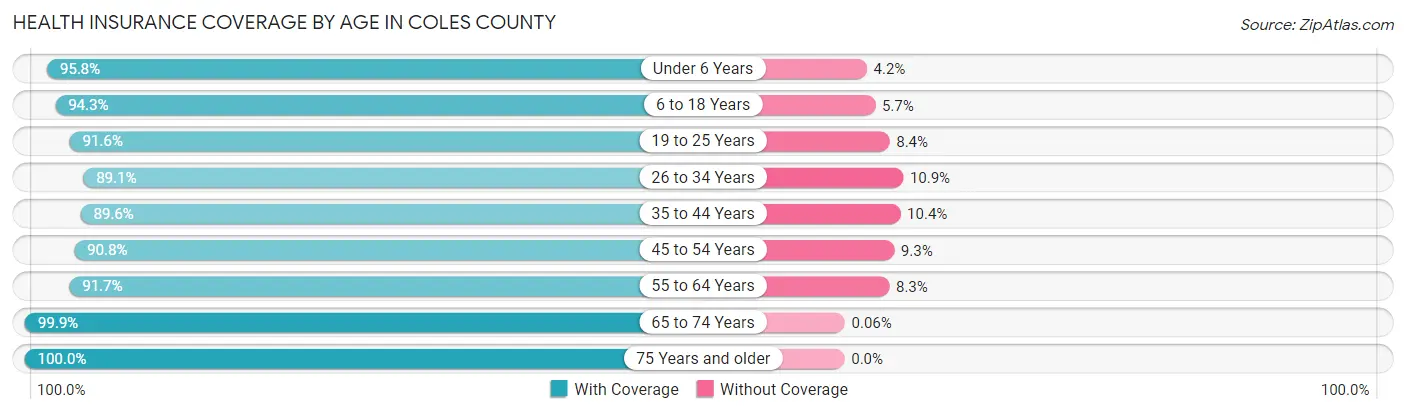
| Age Bracket | With Coverage | Without Coverage |
| Under 6 Years | 2,626 (95.8%) | 114 (4.2%) |
| 6 to 18 Years | 6,365 (94.3%) | 386 (5.7%) |
| 19 to 25 Years | 6,943 (91.6%) | 636 (8.4%) |
| 26 to 34 Years | 4,585 (89.1%) | 563 (10.9%) |
| 35 to 44 Years | 4,679 (89.6%) | 544 (10.4%) |
| 45 to 54 Years | 4,533 (90.7%) | 462 (9.2%) |
| 55 to 64 Years | 5,465 (91.7%) | 497 (8.3%) |
| 65 to 74 Years | 4,782 (99.9%) | 3 (0.1%) |
| 75 Years and older | 3,158 (100.0%) | 0 (0.0%) |
| Total | 43,136 (93.1%) | 3,205 (6.9%) |
Health Insurance Coverage by Citizenship Status in Coles County
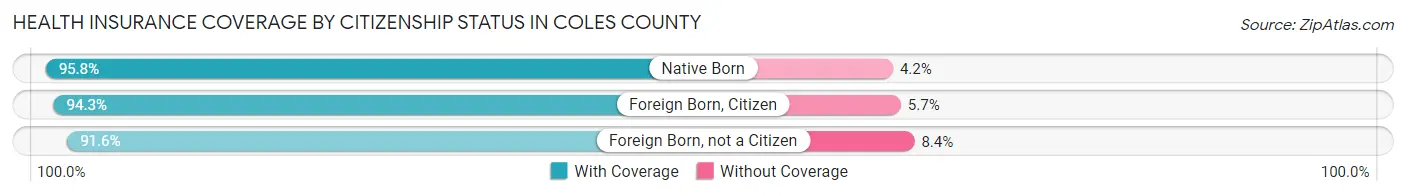
| Citizenship Status | With Coverage | Without Coverage |
| Native Born | 2,626 (95.8%) | 114 (4.2%) |
| Foreign Born, Citizen | 6,365 (94.3%) | 386 (5.7%) |
| Foreign Born, not a Citizen | 6,943 (91.6%) | 636 (8.4%) |
Health Insurance Coverage by Household Income in Coles County
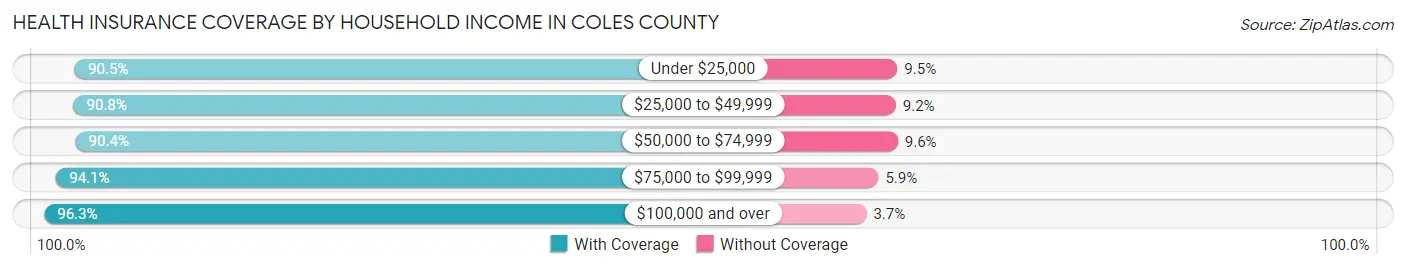
| Household Income | With Coverage | Without Coverage |
| Under $25,000 | 6,692 (90.5%) | 701 (9.5%) |
| $25,000 to $49,999 | 8,742 (90.8%) | 885 (9.2%) |
| $50,000 to $74,999 | 6,981 (90.4%) | 739 (9.6%) |
| $75,000 to $99,999 | 5,697 (94.1%) | 360 (5.9%) |
| $100,000 and over | 12,201 (96.3%) | 468 (3.7%) |
Public vs Private Health Insurance Coverage by Age in Coles County
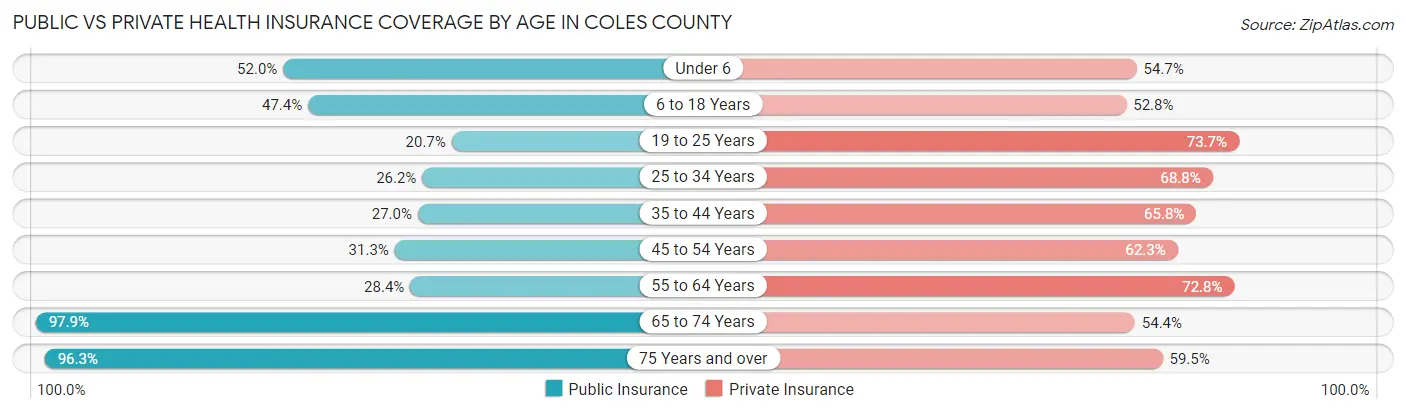
| Age Bracket | Public Insurance | Private Insurance |
| Under 6 | 1,425 (52.0%) | 1,499 (54.7%) |
| 6 to 18 Years | 3,199 (47.4%) | 3,565 (52.8%) |
| 19 to 25 Years | 1,572 (20.7%) | 5,584 (73.7%) |
| 25 to 34 Years | 1,349 (26.2%) | 3,543 (68.8%) |
| 35 to 44 Years | 1,411 (27.0%) | 3,435 (65.8%) |
| 45 to 54 Years | 1,564 (31.3%) | 3,113 (62.3%) |
| 55 to 64 Years | 1,695 (28.4%) | 4,343 (72.8%) |
| 65 to 74 Years | 4,686 (97.9%) | 2,603 (54.4%) |
| 75 Years and over | 3,040 (96.3%) | 1,880 (59.5%) |
| Total | 19,941 (43.0%) | 29,565 (63.8%) |
Disability Status by Sex by Age in Coles County
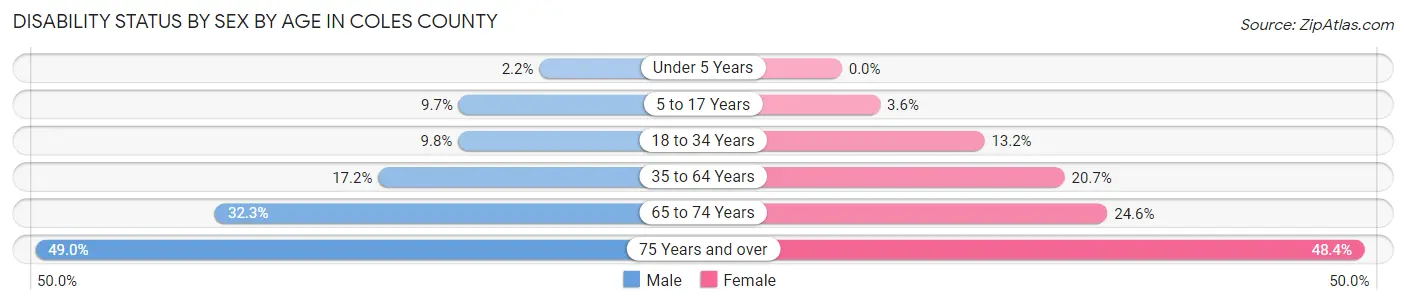
| Age Bracket | Male | Female |
| Under 5 Years | 27 (2.2%) | 0 (0.0%) |
| 5 to 17 Years | 305 (9.7%) | 110 (3.6%) |
| 18 to 34 Years | 647 (9.8%) | 940 (13.2%) |
| 35 to 64 Years | 1,425 (17.2%) | 1,630 (20.7%) |
| 65 to 74 Years | 732 (32.3%) | 621 (24.6%) |
| 75 Years and over | 619 (49.0%) | 918 (48.4%) |
Disability Class by Sex by Age in Coles County
Disability Class: Hearing Difficulty
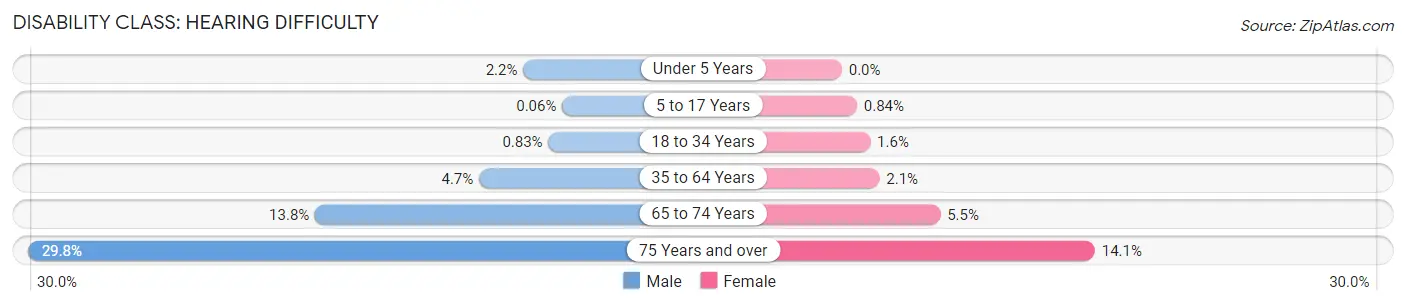
| Age Bracket | Male | Female |
| Under 5 Years | 27 (2.2%) | 0 (0.0%) |
| 5 to 17 Years | 2 (0.1%) | 26 (0.8%) |
| 18 to 34 Years | 55 (0.8%) | 112 (1.6%) |
| 35 to 64 Years | 389 (4.7%) | 165 (2.1%) |
| 65 to 74 Years | 313 (13.8%) | 138 (5.5%) |
| 75 Years and over | 376 (29.8%) | 267 (14.1%) |
Disability Class: Vision Difficulty
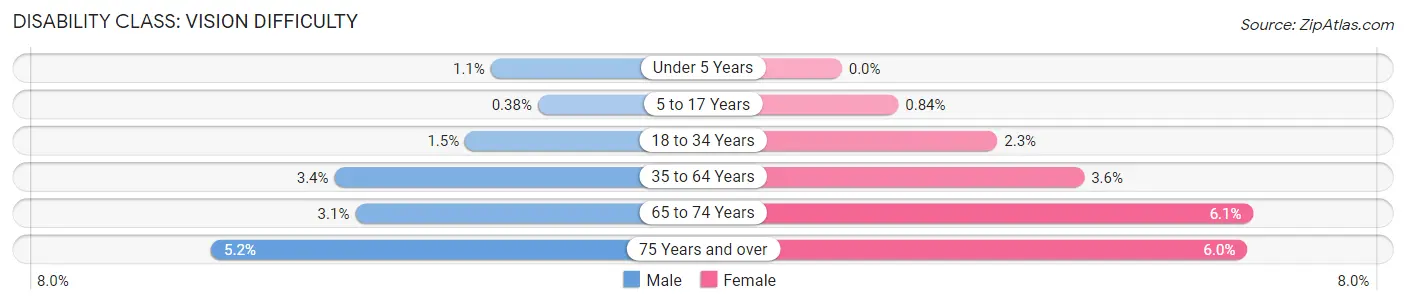
| Age Bracket | Male | Female |
| Under 5 Years | 13 (1.1%) | 0 (0.0%) |
| 5 to 17 Years | 12 (0.4%) | 26 (0.8%) |
| 18 to 34 Years | 97 (1.5%) | 164 (2.3%) |
| 35 to 64 Years | 282 (3.4%) | 284 (3.6%) |
| 65 to 74 Years | 70 (3.1%) | 154 (6.1%) |
| 75 Years and over | 66 (5.2%) | 114 (6.0%) |
Disability Class: Cognitive Difficulty
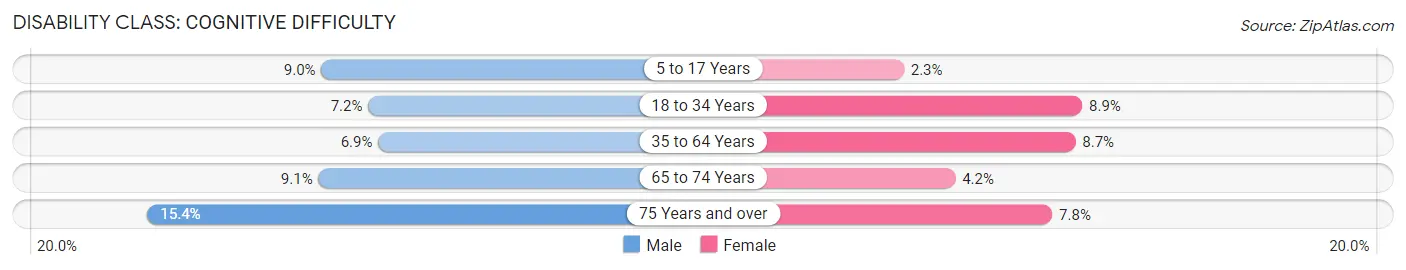
| Age Bracket | Male | Female |
| 5 to 17 Years | 282 (9.0%) | 71 (2.3%) |
| 18 to 34 Years | 480 (7.2%) | 633 (8.9%) |
| 35 to 64 Years | 570 (6.9%) | 684 (8.7%) |
| 65 to 74 Years | 206 (9.1%) | 106 (4.2%) |
| 75 Years and over | 195 (15.4%) | 148 (7.8%) |
Disability Class: Ambulatory Difficulty
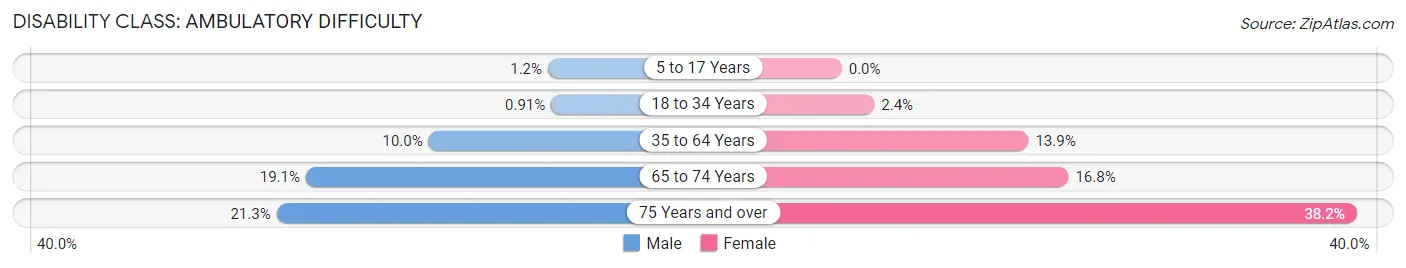
| Age Bracket | Male | Female |
| 5 to 17 Years | 36 (1.1%) | 0 (0.0%) |
| 18 to 34 Years | 60 (0.9%) | 172 (2.4%) |
| 35 to 64 Years | 830 (10.0%) | 1,093 (13.9%) |
| 65 to 74 Years | 433 (19.1%) | 424 (16.8%) |
| 75 Years and over | 269 (21.3%) | 724 (38.2%) |
Disability Class: Self-Care Difficulty
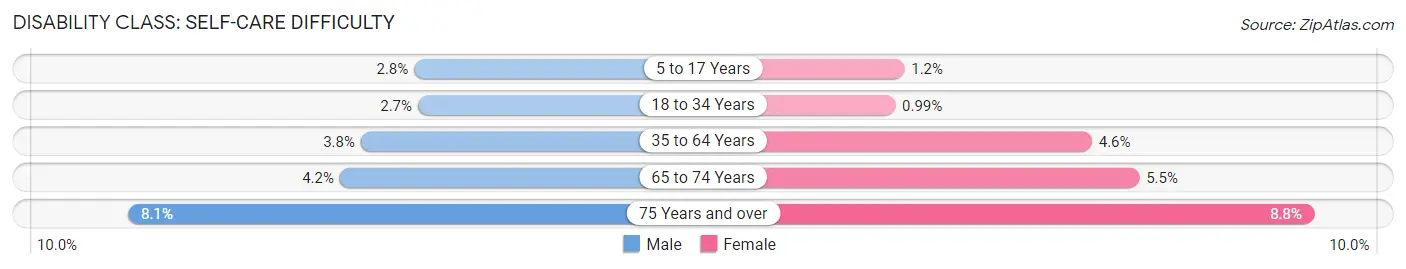
| Age Bracket | Male | Female |
| 5 to 17 Years | 87 (2.8%) | 36 (1.2%) |
| 18 to 34 Years | 179 (2.7%) | 70 (1.0%) |
| 35 to 64 Years | 312 (3.8%) | 366 (4.6%) |
| 65 to 74 Years | 94 (4.2%) | 139 (5.5%) |
| 75 Years and over | 102 (8.1%) | 166 (8.8%) |
Technology Access in Coles County
Computing Device Access in Coles County
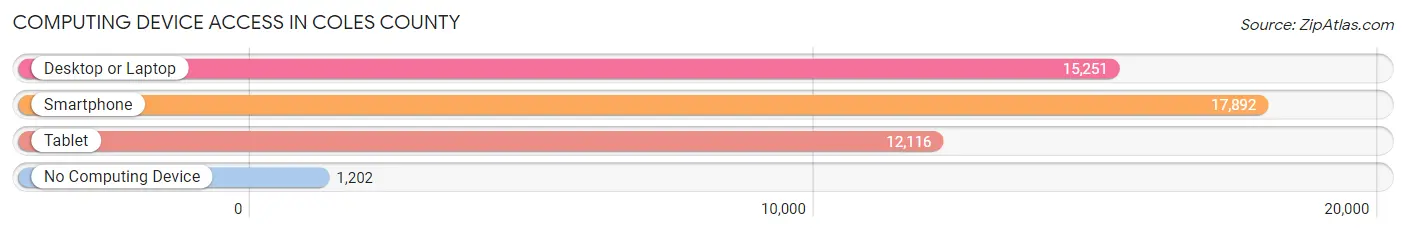
| Device Type | # Households | % Households |
| Desktop or Laptop | 15,251 | 74.8% |
| Smartphone | 17,892 | 87.8% |
| Tablet | 12,116 | 59.4% |
| No Computing Device | 1,202 | 5.9% |
| Total | 20,385 | 100.0% |
Internet Access in Coles County

| Internet Type | # Households | % Households |
| Dial-Up Internet | 66 | 0.3% |
| Broadband Home | 13,859 | 68.0% |
| Cellular Data Only | 2,511 | 12.3% |
| Satellite Internet | 1,110 | 5.4% |
| No Internet | 3,038 | 14.9% |
| Total | 20,385 | 100.0% |
Coles County Summary
Coles County is located in the east-central region of Illinois, and is part of the Champaign-Urbana Metropolitan Statistical Area. The county seat is Charleston, and the county was named after Edward Coles, the second governor of Illinois. As of the 2010 census, the population of Coles County was 53,873.
Geography
Coles County is located in east-central Illinois, and is bordered by Clark County to the north, Cumberland County to the east, Douglas County to the south, and Edgar and Moultrie Counties to the west. The county has a total area of 576 square miles, of which 574 square miles is land and 2 square miles is water. The county is mostly flat, with some rolling hills in the northern and western parts. The Embarras River runs through the county, and there are several small lakes and ponds scattered throughout.
History
Coles County was formed in 1831 from parts of Clark, Edgar, and Shelby Counties. The county was named after Edward Coles, the second governor of Illinois. The first settlers arrived in the area in the early 1820s, and the county was officially organized in 1833. The county seat was originally located in Charleston, and the first courthouse was built in 1837.
The county experienced rapid growth in the late 19th and early 20th centuries, as the railroads and coal mining industry brought new jobs and people to the area. The county also became a major agricultural center, with corn, wheat, and soybeans being the main crops.
Economy
Coles County has a diverse economy, with a mix of manufacturing, agriculture, and services. The county is home to several large employers, including the Charleston Correctional Center, Eastern Illinois University, and the Coles County Health Department. The county is also home to several small businesses, including restaurants, retail stores, and professional services.
Agriculture is a major part of the county’s economy, with corn, soybeans, and wheat being the main crops. Livestock production is also important, with cattle, hogs, and poultry being the main animals raised.
Demographics
As of the 2010 census, the population of Coles County was 53,873. The population is fairly evenly split between men and women, with 50.3% male and 49.7% female. The median age is 38.7 years, and the median household income is $50,945.
The racial makeup of the county is 90.2% White, 5.2% African American, 0.7% Native American, 1.2% Asian, 0.1% Pacific Islander, 1.2% from other races, and 1.5% from two or more races. The largest ancestry groups are German (25.3%), Irish (17.2%), English (14.2%), and American (10.2%).
The county is served by several school districts, including the Charleston Community Unit School District, the Mattoon Community Unit School District, and the Oakland Community Unit School District. The county is also home to Eastern Illinois University, a public university located in Charleston.
Common Questions
What is the Total Population of Coles County?
Total Population of Coles County is 47,076.
What is the Total Male Population of Coles County?
Total Male Population of Coles County is 23,095.
What is the Total Female Population of Coles County?
Total Female Population of Coles County is 23,981.
What is the Ratio of Males per 100 Females in Coles County?
There are 96.31 Males per 100 Females in Coles County.
What is the Ratio of Females per 100 Males in Coles County?
There are 103.84 Females per 100 Males in Coles County.
What is the Median Population Age in Coles County?
Median Population Age in Coles County is 37.4 Years.
What is the Average Family Size in Coles County
Average Family Size in Coles County is 2.7 People.
What is the Average Household Size in Coles County
Average Household Size in Coles County is 2.1 People.
What is Per Capita Income in Coles County?
Per Capita income in Coles County is $32,395.
What is the Median Family Income in Coles County?
Median Family Income in Coles County is $68,710.
What is the Median Household income in Coles County?
Median Household Income in Coles County is $53,732.
What is Income or Wage Gap in Coles County?
Income or Wage Gap in Coles County is 22.8%.
Women in Coles County earn 77.2 cents for every dollar earned by a man.
What is Family Income Deficit in Coles County?
Family Income Deficit in Coles County is $8,180.
Families that are below poverty line in Coles County earn $8,180 less on average than the poverty threshold level.
What is Inequality or Gini Index in Coles County?
Inequality or Gini Index in Coles County is 0.47.
How Large is the Labor Force in Coles County?
There are 25,215 People in the Labor Forcein in Coles County.
What is the Percentage of People in the Labor Force in Coles County?
63.8% of People are in the Labor Force in Coles County.
What is the Unemployment Rate in Coles County?
Unemployment Rate in Coles County is 6.9%.