Champaign County, IL
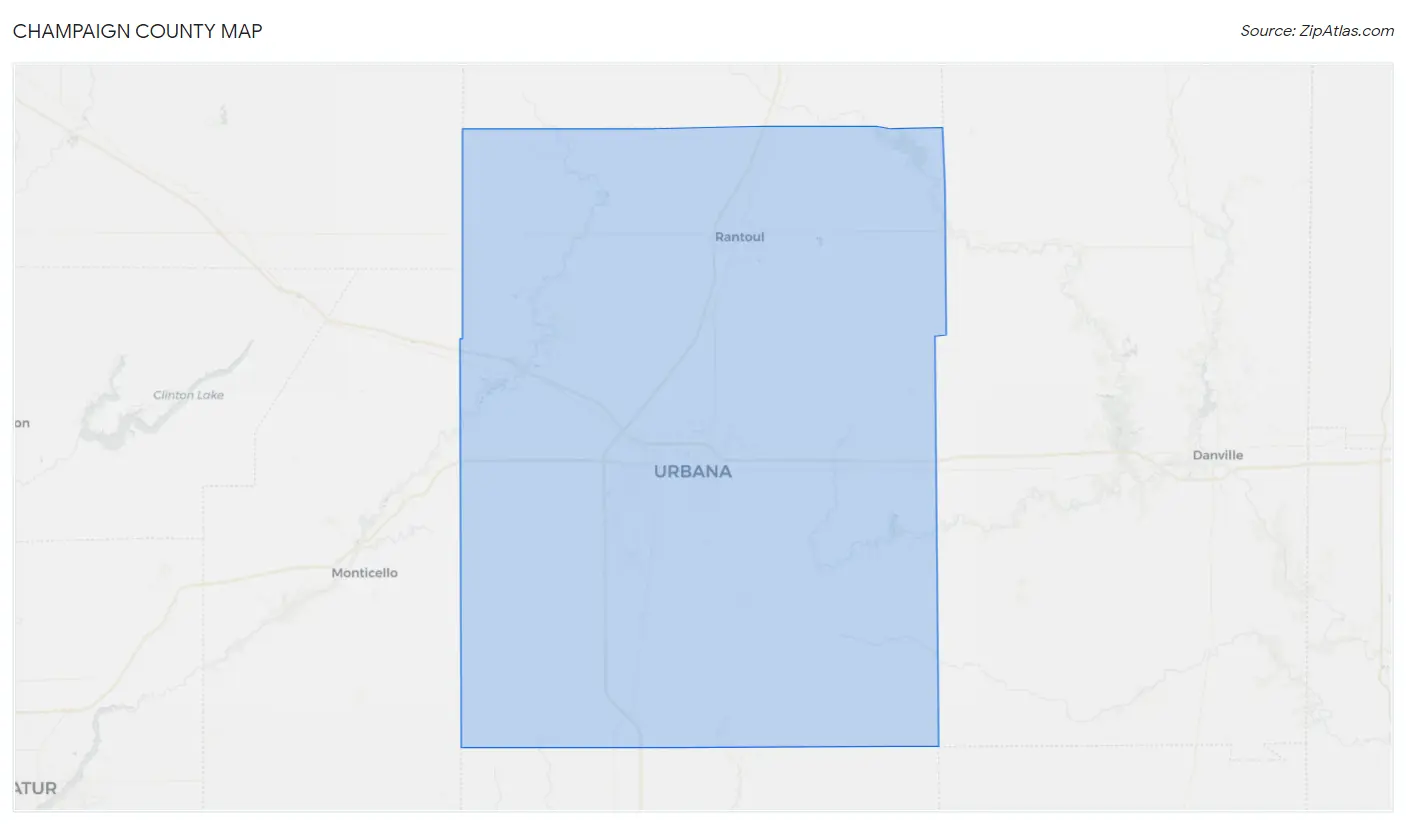
Champaign County Map
Champaign County Overview
206,525
TOTAL POPULATION
103,245
MALE POPULATION
103,280
FEMALE POPULATION
99.97
MALES / 100 FEMALES
100.03
FEMALES / 100 MALES
30.8
MEDIAN AGE
3.1
AVG FAMILY SIZE
2.3
AVG HOUSEHOLD SIZE
$35,810
PER CAPITA INCOME
$94,792
AVG FAMILY INCOME
$61,090
AVG HOUSEHOLD INCOME
20.3%
WAGE / INCOME GAP [ % ]
79.7¢/ $1
WAGE / INCOME GAP [ $ ]
$10,868
FAMILY INCOME DEFICIT
0.50
INEQUALITY / GINI INDEX
106,276
LABOR FORCE [ PEOPLE ]
61.8%
PERCENT IN LABOR FORCE
4.8%
UNEMPLOYMENT RATE
Champaign County Area Codes
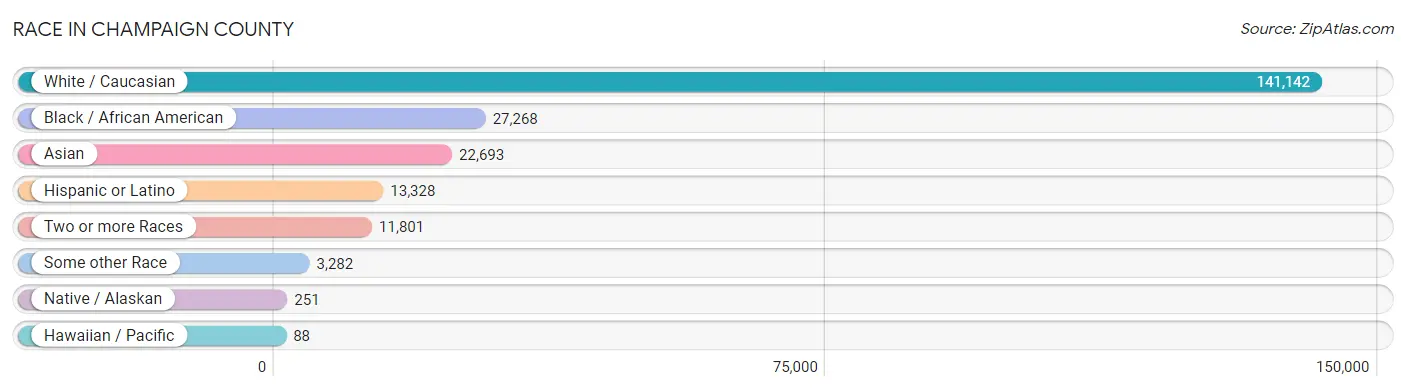
Race in Champaign County
The most populous races in Champaign County are White / Caucasian (141,142 | 68.3%), Black / African American (27,268 | 13.2%), and Asian (22,693 | 11.0%).
| Race | # Population | % Population |
| Asian | 22,693 | 11.0% |
| Black / African American | 27,268 | 13.2% |
| Hawaiian / Pacific | 88 | 0.0% |
| Hispanic or Latino | 13,328 | 6.5% |
| Native / Alaskan | 251 | 0.1% |
| White / Caucasian | 141,142 | 68.3% |
| Two or more Races | 11,801 | 5.7% |
| Some other Race | 3,282 | 1.6% |
| Total | 206,525 | 100.0% |
Ancestry in Champaign County
The most populous ancestries reported in Champaign County are German (38,774 | 18.8%), Irish (20,647 | 10.0%), English (18,658 | 9.0%), Indian (Asian) (9,845 | 4.8%), and Mexican (8,108 | 3.9%), together accounting for 46.5% of all Champaign County residents.

| Ancestry | # Population | % Population |
| Afghan | 1 | 0.0% |
| African | 1,294 | 0.6% |
| Albanian | 25 | 0.0% |
| Aleut | 2 | 0.0% |
| Alsatian | 19 | 0.0% |
| American | 6,528 | 3.2% |
| Apache | 45 | 0.0% |
| Arab | 1,478 | 0.7% |
| Argentinean | 128 | 0.1% |
| Armenian | 103 | 0.1% |
| Australian | 5 | 0.0% |
| Austrian | 433 | 0.2% |
| Bangladeshi | 9 | 0.0% |
| Belgian | 171 | 0.1% |
| Belizean | 18 | 0.0% |
| Bermudan | 17 | 0.0% |
| Bhutanese | 978 | 0.5% |
| Blackfeet | 36 | 0.0% |
| Bolivian | 52 | 0.0% |
| Brazilian | 254 | 0.1% |
| British | 1,187 | 0.6% |
| Bulgarian | 20 | 0.0% |
| Burmese | 2,831 | 1.4% |
| Cambodian | 137 | 0.1% |
| Canadian | 145 | 0.1% |
| Carpatho Rusyn | 16 | 0.0% |
| Central American | 1,203 | 0.6% |
| Central American Indian | 104 | 0.1% |
| Cherokee | 258 | 0.1% |
| Chickasaw | 45 | 0.0% |
| Chilean | 141 | 0.1% |
| Chippewa | 23 | 0.0% |
| Choctaw | 2 | 0.0% |
| Colombian | 398 | 0.2% |
| Comanche | 4 | 0.0% |
| Costa Rican | 154 | 0.1% |
| Creek | 33 | 0.0% |
| Croatian | 189 | 0.1% |
| Cuban | 181 | 0.1% |
| Cypriot | 8 | 0.0% |
| Czech | 772 | 0.4% |
| Czechoslovakian | 170 | 0.1% |
| Danish | 543 | 0.3% |
| Dominican | 140 | 0.1% |
| Dutch | 1,964 | 0.9% |
| Eastern European | 563 | 0.3% |
| Ecuadorian | 85 | 0.0% |
| Egyptian | 248 | 0.1% |
| English | 18,658 | 9.0% |
| Estonian | 63 | 0.0% |
| Ethiopian | 232 | 0.1% |
| European | 3,476 | 1.7% |
| Filipino | 456 | 0.2% |
| Finnish | 207 | 0.1% |
| French | 3,595 | 1.7% |
| French Canadian | 737 | 0.4% |
| German | 38,774 | 18.8% |
| German Russian | 140 | 0.1% |
| Ghanaian | 71 | 0.0% |
| Greek | 858 | 0.4% |
| Guamanian / Chamorro | 23 | 0.0% |
| Guatemalan | 853 | 0.4% |
| Guyanese | 1 | 0.0% |
| Haitian | 2 | 0.0% |
| Honduran | 37 | 0.0% |
| Houma | 6 | 0.0% |
| Hungarian | 586 | 0.3% |
| Icelander | 24 | 0.0% |
| Indian (Asian) | 9,845 | 4.8% |
| Indonesian | 114 | 0.1% |
| Iranian | 552 | 0.3% |
| Iraqi | 66 | 0.0% |
| Irish | 20,647 | 10.0% |
| Iroquois | 9 | 0.0% |
| Israeli | 114 | 0.1% |
| Italian | 6,741 | 3.3% |
| Jamaican | 88 | 0.0% |
| Japanese | 60 | 0.0% |
| Jordanian | 34 | 0.0% |
| Kenyan | 30 | 0.0% |
| Korean | 1,758 | 0.9% |
| Laotian | 94 | 0.1% |
| Latvian | 33 | 0.0% |
| Lebanese | 153 | 0.1% |
| Liberian | 14 | 0.0% |
| Lithuanian | 422 | 0.2% |
| Macedonian | 55 | 0.0% |
| Malaysian | 476 | 0.2% |
| Mexican | 8,108 | 3.9% |
| Mexican American Indian | 45 | 0.0% |
| Mongolian | 54 | 0.0% |
| Moroccan | 187 | 0.1% |
| Native Hawaiian | 33 | 0.0% |
| New Zealander | 1 | 0.0% |
| Nicaraguan | 6 | 0.0% |
| Nigerian | 198 | 0.1% |
| Northern European | 832 | 0.4% |
| Norwegian | 1,957 | 0.9% |
| Okinawan | 9 | 0.0% |
| Pakistani | 650 | 0.3% |
| Palestinian | 162 | 0.1% |
| Panamanian | 23 | 0.0% |
| Paraguayan | 6 | 0.0% |
| Pennsylvania German | 78 | 0.0% |
| Peruvian | 163 | 0.1% |
| Polish | 6,205 | 3.0% |
| Portuguese | 265 | 0.1% |
| Potawatomi | 16 | 0.0% |
| Puerto Rican | 1,404 | 0.7% |
| Romanian | 60 | 0.0% |
| Russian | 1,288 | 0.6% |
| Salvadoran | 130 | 0.1% |
| Samoan | 65 | 0.0% |
| Scandinavian | 707 | 0.3% |
| Scotch-Irish | 1,812 | 0.9% |
| Scottish | 2,818 | 1.4% |
| Serbian | 29 | 0.0% |
| Sierra Leonean | 8 | 0.0% |
| Sioux | 13 | 0.0% |
| Slavic | 49 | 0.0% |
| Slovak | 271 | 0.1% |
| Slovene | 80 | 0.0% |
| South African | 161 | 0.1% |
| South American | 1,058 | 0.5% |
| Spaniard | 536 | 0.3% |
| Spanish | 218 | 0.1% |
| Sri Lankan | 1,553 | 0.7% |
| Subsaharan African | 2,703 | 1.3% |
| Swedish | 2,239 | 1.1% |
| Swiss | 752 | 0.4% |
| Syrian | 16 | 0.0% |
| Thai | 5,299 | 2.6% |
| Turkish | 172 | 0.1% |
| U.S. Virgin Islander | 39 | 0.0% |
| Ugandan | 13 | 0.0% |
| Ukrainian | 366 | 0.2% |
| Venezuelan | 85 | 0.0% |
| Vietnamese | 248 | 0.1% |
| Welsh | 924 | 0.4% |
| West Indian | 81 | 0.0% |
| Yugoslavian | 22 | 0.0% | View All 141 Rows |
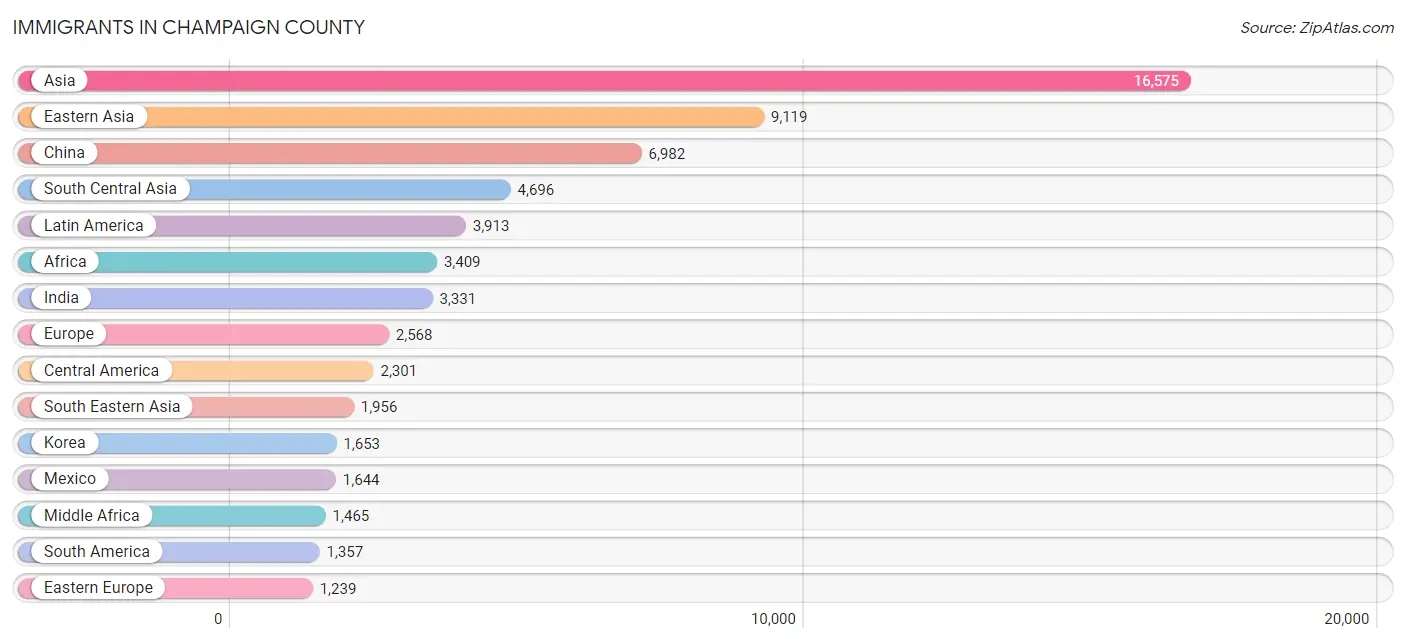
Immigrants in Champaign County
The most numerous immigrant groups reported in Champaign County came from Asia (16,575 | 8.0%), Eastern Asia (9,119 | 4.4%), China (6,982 | 3.4%), South Central Asia (4,696 | 2.3%), and Latin America (3,913 | 1.9%), together accounting for 20.0% of all Champaign County residents.
| Immigration Origin | # Population | % Population |
| Afghanistan | 3 | 0.0% |
| Africa | 3,409 | 1.7% |
| Albania | 8 | 0.0% |
| Argentina | 141 | 0.1% |
| Asia | 16,575 | 8.0% |
| Australia | 5 | 0.0% |
| Austria | 62 | 0.0% |
| Bangladesh | 262 | 0.1% |
| Belgium | 10 | 0.0% |
| Belize | 35 | 0.0% |
| Brazil | 460 | 0.2% |
| Bulgaria | 20 | 0.0% |
| Cameroon | 181 | 0.1% |
| Canada | 409 | 0.2% |
| Caribbean | 255 | 0.1% |
| Central America | 2,301 | 1.1% |
| Chile | 81 | 0.0% |
| China | 6,982 | 3.4% |
| Colombia | 371 | 0.2% |
| Congo | 161 | 0.1% |
| Costa Rica | 86 | 0.0% |
| Cuba | 34 | 0.0% |
| Czechoslovakia | 150 | 0.1% |
| Dominican Republic | 108 | 0.1% |
| Eastern Africa | 337 | 0.2% |
| Eastern Asia | 9,119 | 4.4% |
| Eastern Europe | 1,239 | 0.6% |
| Ecuador | 59 | 0.0% |
| Egypt | 244 | 0.1% |
| El Salvador | 149 | 0.1% |
| England | 128 | 0.1% |
| Ethiopia | 179 | 0.1% |
| Europe | 2,568 | 1.2% |
| France | 54 | 0.0% |
| Germany | 240 | 0.1% |
| Ghana | 52 | 0.0% |
| Greece | 97 | 0.1% |
| Guatemala | 314 | 0.2% |
| Guyana | 66 | 0.0% |
| Haiti | 2 | 0.0% |
| Honduras | 6 | 0.0% |
| Hong Kong | 136 | 0.1% |
| Hungary | 17 | 0.0% |
| India | 3,331 | 1.6% |
| Indonesia | 77 | 0.0% |
| Iran | 592 | 0.3% |
| Iraq | 66 | 0.0% |
| Ireland | 11 | 0.0% |
| Israel | 152 | 0.1% |
| Italy | 144 | 0.1% |
| Jamaica | 62 | 0.0% |
| Japan | 384 | 0.2% |
| Jordan | 125 | 0.1% |
| Kazakhstan | 117 | 0.1% |
| Kenya | 53 | 0.0% |
| Korea | 1,653 | 0.8% |
| Kuwait | 2 | 0.0% |
| Laos | 327 | 0.2% |
| Latin America | 3,913 | 1.9% |
| Lebanon | 35 | 0.0% |
| Liberia | 14 | 0.0% |
| Lithuania | 60 | 0.0% |
| Malaysia | 11 | 0.0% |
| Mexico | 1,644 | 0.8% |
| Micronesia | 63 | 0.0% |
| Middle Africa | 1,465 | 0.7% |
| Morocco | 80 | 0.0% |
| Nepal | 114 | 0.1% |
| Netherlands | 36 | 0.0% |
| Nigeria | 392 | 0.2% |
| North Macedonia | 25 | 0.0% |
| Northern Africa | 606 | 0.3% |
| Northern Europe | 560 | 0.3% |
| Norway | 71 | 0.0% |
| Oceania | 91 | 0.0% |
| Pakistan | 235 | 0.1% |
| Panama | 67 | 0.0% |
| Peru | 116 | 0.1% |
| Philippines | 768 | 0.4% |
| Poland | 334 | 0.2% |
| Portugal | 34 | 0.0% |
| Romania | 33 | 0.0% |
| Russia | 395 | 0.2% |
| Saudi Arabia | 170 | 0.1% |
| Scotland | 13 | 0.0% |
| Serbia | 23 | 0.0% |
| Singapore | 72 | 0.0% |
| South Africa | 55 | 0.0% |
| South America | 1,357 | 0.7% |
| South Central Asia | 4,696 | 2.3% |
| South Eastern Asia | 1,956 | 0.9% |
| Southern Europe | 367 | 0.2% |
| Spain | 92 | 0.0% |
| Sri Lanka | 39 | 0.0% |
| St. Vincent and the Grenadines | 2 | 0.0% |
| Sweden | 8 | 0.0% |
| Syria | 23 | 0.0% |
| Taiwan | 341 | 0.2% |
| Thailand | 96 | 0.1% |
| Trinidad and Tobago | 47 | 0.0% |
| Turkey | 135 | 0.1% |
| Uganda | 13 | 0.0% |
| Ukraine | 145 | 0.1% |
| Uzbekistan | 3 | 0.0% |
| Venezuela | 63 | 0.0% |
| Vietnam | 603 | 0.3% |
| Western Africa | 466 | 0.2% |
| Western Asia | 784 | 0.4% |
| Western Europe | 402 | 0.2% |
| Zaire | 1,123 | 0.5% |
| Zimbabwe | 7 | 0.0% | View All 111 Rows |
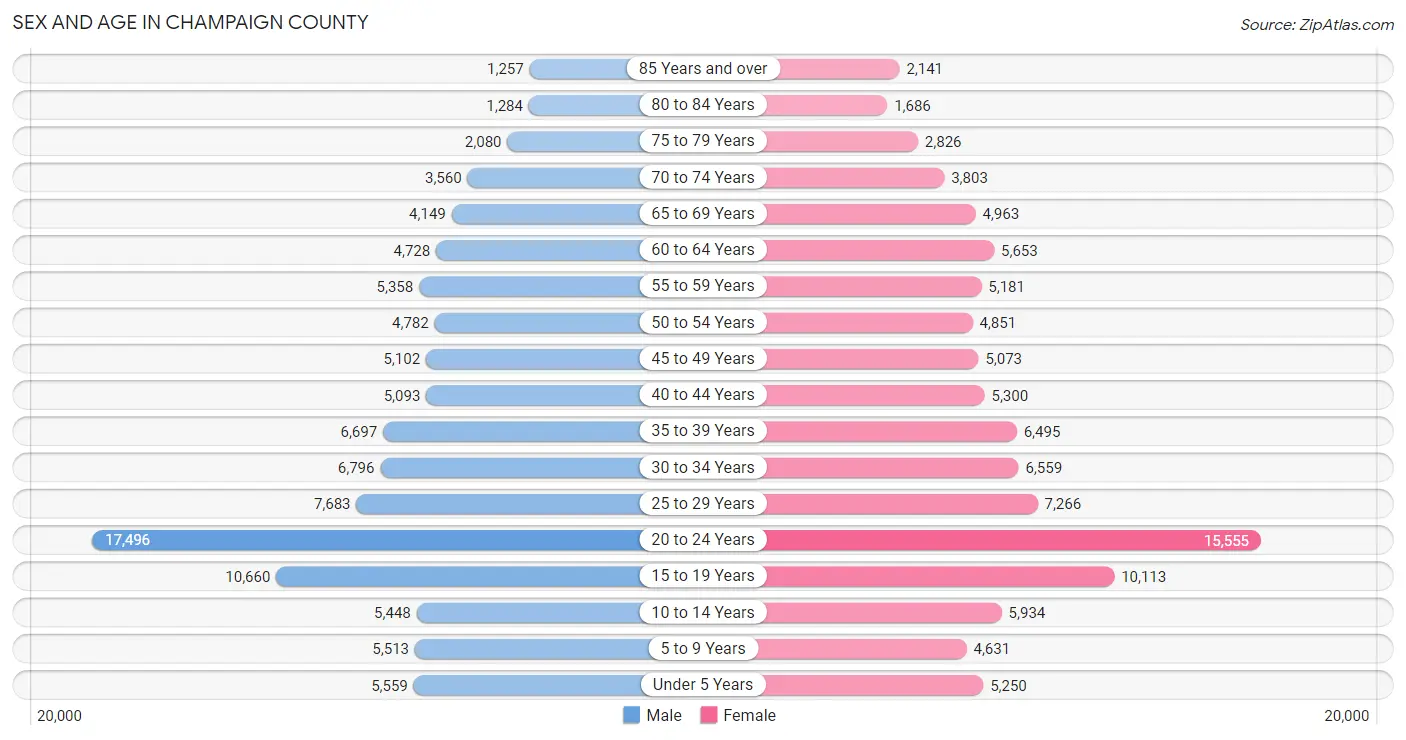
Sex and Age in Champaign County
Sex and Age in Champaign County
The most populous age groups in Champaign County are 20 to 24 Years (17,496 | 17.0%) for men and 20 to 24 Years (15,555 | 15.1%) for women.
| Age Bracket | Male | Female |
| Under 5 Years | 5,559 (5.4%) | 5,250 (5.1%) |
| 5 to 9 Years | 5,513 (5.3%) | 4,631 (4.5%) |
| 10 to 14 Years | 5,448 (5.3%) | 5,934 (5.8%) |
| 15 to 19 Years | 10,660 (10.3%) | 10,113 (9.8%) |
| 20 to 24 Years | 17,496 (17.0%) | 15,555 (15.1%) |
| 25 to 29 Years | 7,683 (7.4%) | 7,266 (7.0%) |
| 30 to 34 Years | 6,796 (6.6%) | 6,559 (6.4%) |
| 35 to 39 Years | 6,697 (6.5%) | 6,495 (6.3%) |
| 40 to 44 Years | 5,093 (4.9%) | 5,300 (5.1%) |
| 45 to 49 Years | 5,102 (4.9%) | 5,073 (4.9%) |
| 50 to 54 Years | 4,782 (4.6%) | 4,851 (4.7%) |
| 55 to 59 Years | 5,358 (5.2%) | 5,181 (5.0%) |
| 60 to 64 Years | 4,728 (4.6%) | 5,653 (5.5%) |
| 65 to 69 Years | 4,149 (4.0%) | 4,963 (4.8%) |
| 70 to 74 Years | 3,560 (3.5%) | 3,803 (3.7%) |
| 75 to 79 Years | 2,080 (2.0%) | 2,826 (2.7%) |
| 80 to 84 Years | 1,284 (1.2%) | 1,686 (1.6%) |
| 85 Years and over | 1,257 (1.2%) | 2,141 (2.1%) |
| Total | 103,245 (100.0%) | 103,280 (100.0%) |
Families and Households in Champaign County
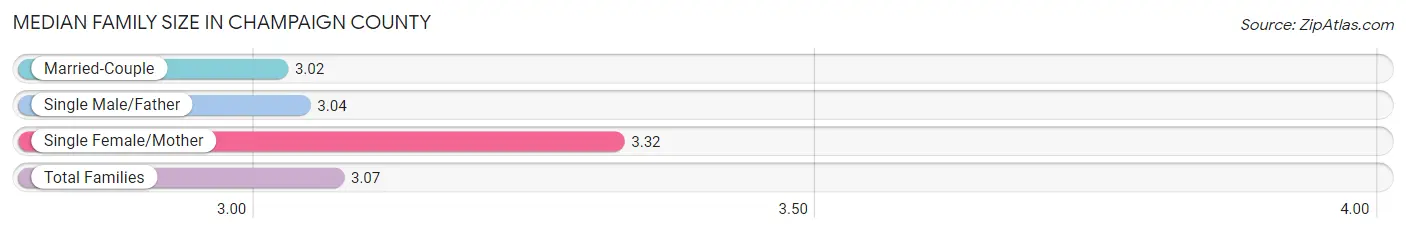
Median Family Size in Champaign County
The median family size in Champaign County is 3.07 persons per family, with single female/mother families (7,592 | 17.8%) accounting for the largest median family size of 3.32 persons per family. On the other hand, married-couple families (32,565 | 76.2%) represent the smallest median family size with 3.02 persons per family.
| Family Type | # Families | Family Size |
| Married-Couple | 32,565 (76.2%) | 3.02 |
| Single Male/Father | 2,568 (6.0%) | 3.04 |
| Single Female/Mother | 7,592 (17.8%) | 3.32 |
| Total Families | 42,725 (100.0%) | 3.07 |
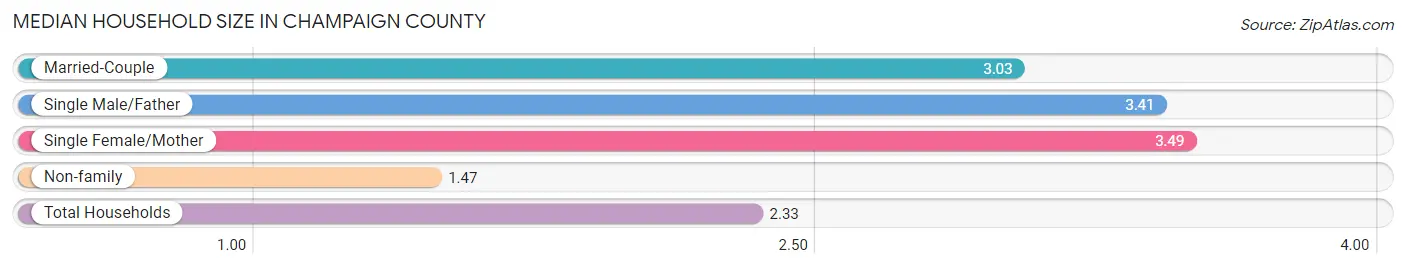
Median Household Size in Champaign County
The median household size in Champaign County is 2.33 persons per household, with single female/mother households (7,592 | 9.2%) accounting for the largest median household size of 3.49 persons per household. non-family households (39,742 | 48.2%) represent the smallest median household size with 1.47 persons per household.
| Household Type | # Households | Household Size |
| Married-Couple | 32,565 (39.5%) | 3.03 |
| Single Male/Father | 2,568 (3.1%) | 3.41 |
| Single Female/Mother | 7,592 (9.2%) | 3.49 |
| Non-family | 39,742 (48.2%) | 1.47 |
| Total Households | 82,467 (100.0%) | 2.33 |
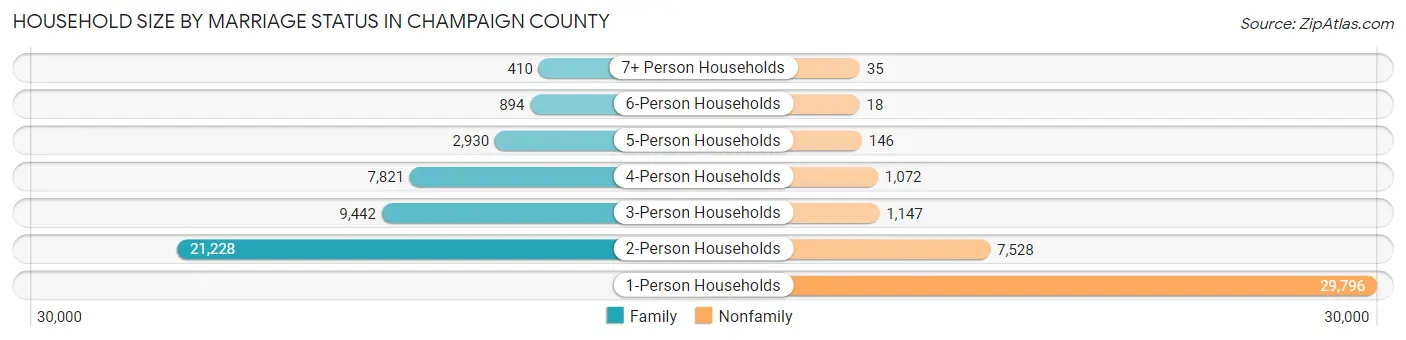
Household Size by Marriage Status in Champaign County
Out of a total of 82,467 households in Champaign County, 42,725 (51.8%) are family households, while 39,742 (48.2%) are nonfamily households. The most numerous type of family households are 2-person households, comprising 21,228, and the most common type of nonfamily households are 1-person households, comprising 29,796.
| Household Size | Family Households | Nonfamily Households |
| 1-Person Households | - | 29,796 (36.1%) |
| 2-Person Households | 21,228 (25.7%) | 7,528 (9.1%) |
| 3-Person Households | 9,442 (11.5%) | 1,147 (1.4%) |
| 4-Person Households | 7,821 (9.5%) | 1,072 (1.3%) |
| 5-Person Households | 2,930 (3.5%) | 146 (0.2%) |
| 6-Person Households | 894 (1.1%) | 18 (0.0%) |
| 7+ Person Households | 410 (0.5%) | 35 (0.0%) |
| Total | 42,725 (51.8%) | 39,742 (48.2%) |
Female Fertility in Champaign County
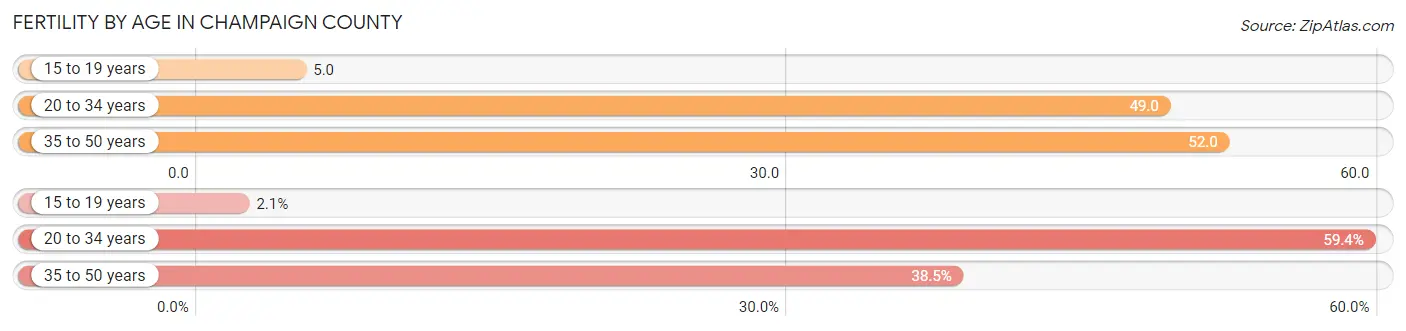
Fertility by Age in Champaign County
Average fertility rate in Champaign County is 42.0 births per 1,000 women. Women in the age bracket of 35 to 50 years have the highest fertility rate with 52.0 births per 1,000 women. Women in the age bracket of 20 to 34 years acount for 59.4% of all women with births.
| Age Bracket | Women with Births | Births / 1,000 Women |
| 15 to 19 years | 51 (2.1%) | 5.0 |
| 20 to 34 years | 1,437 (59.4%) | 49.0 |
| 35 to 50 years | 930 (38.5%) | 52.0 |
| Total | 2,418 (100.0%) | 42.0 |
Fertility by Age by Marriage Status in Champaign County
66.5% of women with births (2,418) in Champaign County are married. The highest percentage of unmarried women with births falls into 15 to 19 years age bracket with 100.0% of them unmarried at the time of birth, while the lowest percentage of unmarried women with births belong to 20 to 34 years age bracket with 31.5% of them unmarried.
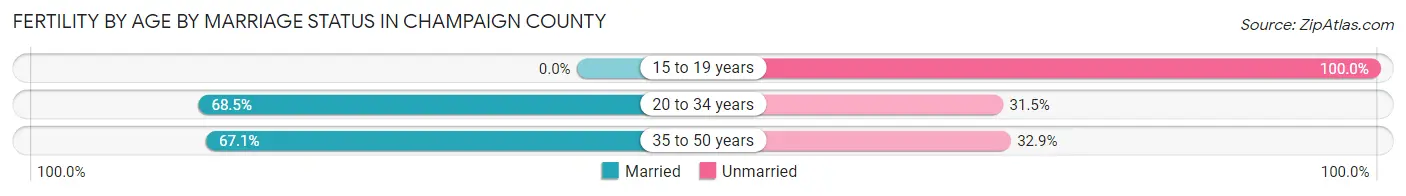
| Age Bracket | Married | Unmarried |
| 15 to 19 years | 0 (0.0%) | 51 (100.0%) |
| 20 to 34 years | 984 (68.5%) | 453 (31.5%) |
| 35 to 50 years | 624 (67.1%) | 306 (32.9%) |
| Total | 1,608 (66.5%) | 810 (33.5%) |
Fertility by Education in Champaign County
Average fertility rate in Champaign County is 42.0 births per 1,000 women. Women with the education attainment of graduate degree have the highest fertility rate of 61.0 births per 1,000 women, while women with the education attainment of college or associate's degree have the lowest fertility at 24.0 births per 1,000 women. Women with the education attainment of bachelor's degree represent 25.6% of all women with births.
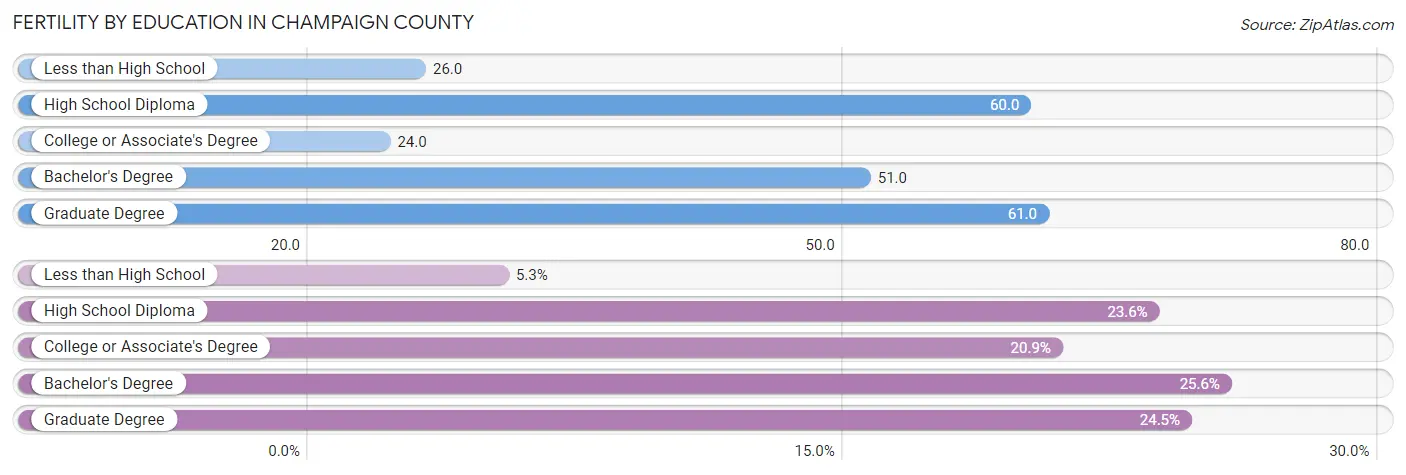
| Educational Attainment | Women with Births | Births / 1,000 Women |
| Less than High School | 129 (5.3%) | 26.0 |
| High School Diploma | 571 (23.6%) | 60.0 |
| College or Associate's Degree | 505 (20.9%) | 24.0 |
| Bachelor's Degree | 620 (25.6%) | 51.0 |
| Graduate Degree | 593 (24.5%) | 61.0 |
| Total | 2,418 (100.0%) | 42.0 |
Fertility by Education by Marriage Status in Champaign County
33.5% of women with births in Champaign County are unmarried. Women with the educational attainment of bachelor's degree are most likely to be married with 95.3% of them married at childbirth, while women with the educational attainment of less than high school are least likely to be married with 73.6% of them unmarried at childbirth.
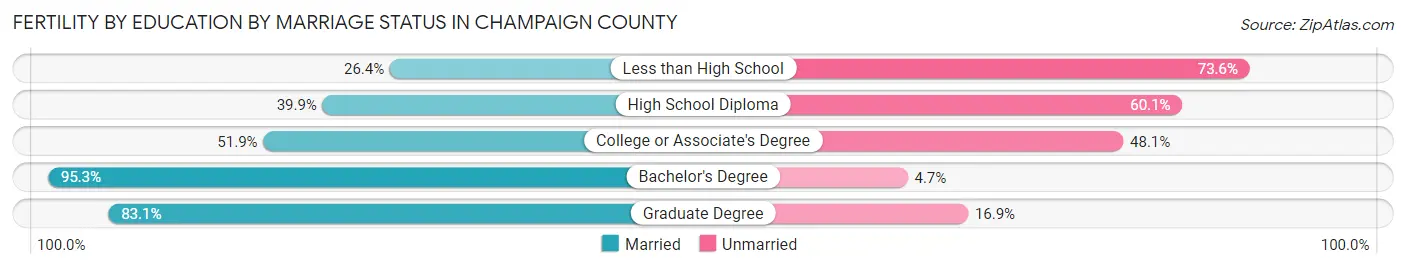
| Educational Attainment | Married | Unmarried |
| Less than High School | 34 (26.4%) | 95 (73.6%) |
| High School Diploma | 228 (39.9%) | 343 (60.1%) |
| College or Associate's Degree | 262 (51.9%) | 243 (48.1%) |
| Bachelor's Degree | 591 (95.3%) | 29 (4.7%) |
| Graduate Degree | 493 (83.1%) | 100 (16.9%) |
| Total | 1,608 (66.5%) | 810 (33.5%) |
Income in Champaign County
Income Overview in Champaign County
Per Capita Income in Champaign County is $35,810, while median incomes of families and households are $94,792 and $61,090 respectively.
| Characteristic | Number | Measure |
| Per Capita Income | 206,525 | $35,810 |
| Median Family Income | 42,725 | $94,792 |
| Mean Family Income | 42,725 | $117,966 |
| Median Household Income | 82,467 | $61,090 |
| Mean Household Income | 82,467 | $86,280 |
| Income Deficit | 42,725 | $10,868 |
| Wage / Income Gap (%) | 206,525 | 20.26% |
| Wage / Income Gap ($) | 206,525 | 79.74¢ per $1 |
| Gini / Inequality Index | 206,525 | 0.50 |
Earnings by Sex in Champaign County
Average Earnings in Champaign County are $33,940, $38,197 for men and $30,460 for women, a difference of 20.3%.
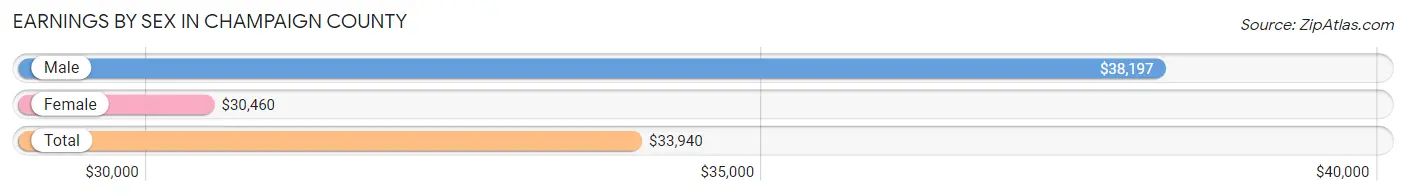
| Sex | Number | Average Earnings |
| Male | 61,134 (52.1%) | $38,197 |
| Female | 56,167 (47.9%) | $30,460 |
| Total | 117,301 (100.0%) | $33,940 |
Earnings by Sex by Income Bracket in Champaign County
The most common earnings brackets in Champaign County are $100,000+ for men (9,136 | 14.9%) and $2,499 or less for women (5,927 | 10.5%).
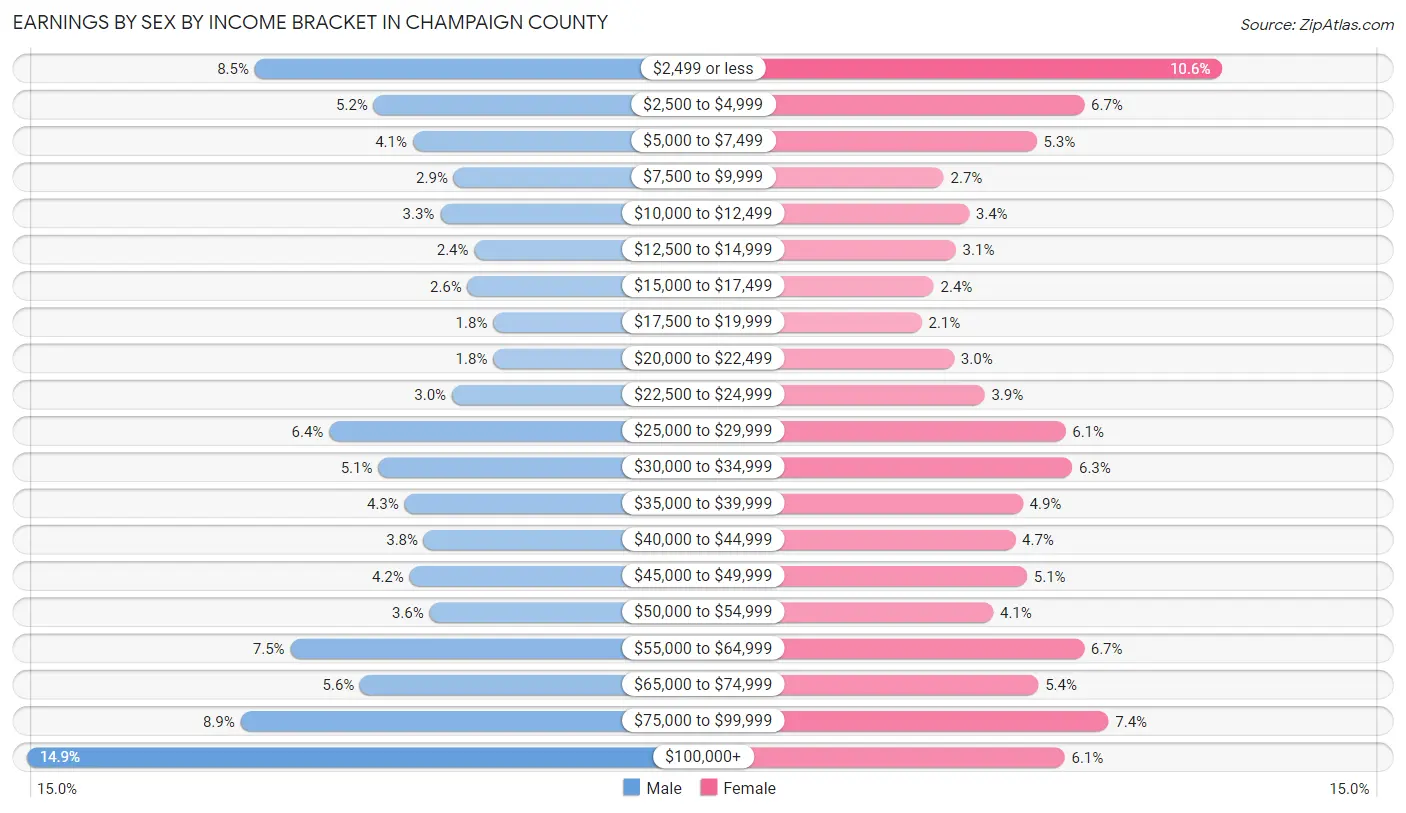
| Income | Male | Female |
| $2,499 or less | 5,215 (8.5%) | 5,927 (10.5%) |
| $2,500 to $4,999 | 3,170 (5.2%) | 3,744 (6.7%) |
| $5,000 to $7,499 | 2,498 (4.1%) | 2,994 (5.3%) |
| $7,500 to $9,999 | 1,799 (2.9%) | 1,525 (2.7%) |
| $10,000 to $12,499 | 2,032 (3.3%) | 1,928 (3.4%) |
| $12,500 to $14,999 | 1,443 (2.4%) | 1,719 (3.1%) |
| $15,000 to $17,499 | 1,560 (2.5%) | 1,370 (2.4%) |
| $17,500 to $19,999 | 1,117 (1.8%) | 1,180 (2.1%) |
| $20,000 to $22,499 | 1,119 (1.8%) | 1,690 (3.0%) |
| $22,500 to $24,999 | 1,828 (3.0%) | 2,173 (3.9%) |
| $25,000 to $29,999 | 3,940 (6.4%) | 3,450 (6.1%) |
| $30,000 to $34,999 | 3,094 (5.1%) | 3,558 (6.3%) |
| $35,000 to $39,999 | 2,639 (4.3%) | 2,777 (4.9%) |
| $40,000 to $44,999 | 2,313 (3.8%) | 2,658 (4.7%) |
| $45,000 to $49,999 | 2,553 (4.2%) | 2,840 (5.1%) |
| $50,000 to $54,999 | 2,212 (3.6%) | 2,311 (4.1%) |
| $55,000 to $64,999 | 4,602 (7.5%) | 3,741 (6.7%) |
| $65,000 to $74,999 | 3,404 (5.6%) | 3,019 (5.4%) |
| $75,000 to $99,999 | 5,460 (8.9%) | 4,126 (7.3%) |
| $100,000+ | 9,136 (14.9%) | 3,437 (6.1%) |
| Total | 61,134 (100.0%) | 56,167 (100.0%) |
Earnings by Sex by Educational Attainment in Champaign County
Average earnings in Champaign County are $54,882 for men and $41,771 for women, a difference of 23.9%. Men with an educational attainment of graduate degree enjoy the highest average annual earnings of $79,227, while those with less than high school education earn the least with $32,843. Women with an educational attainment of graduate degree earn the most with the average annual earnings of $59,724, while those with less than high school education have the smallest earnings of $28,311.
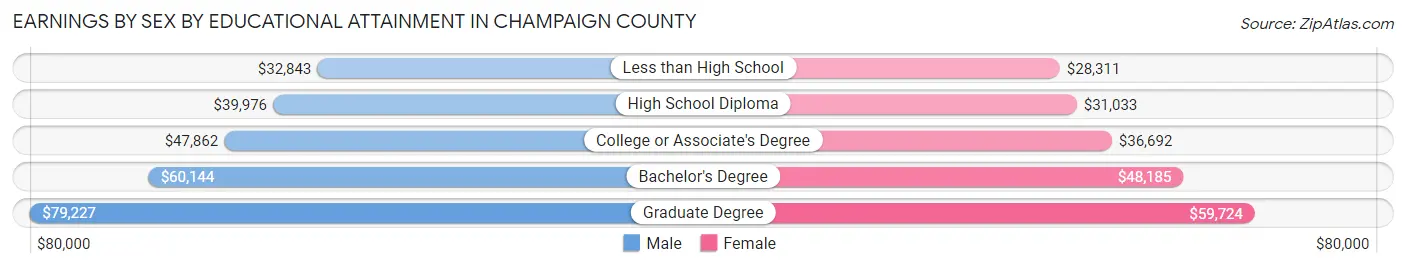
| Educational Attainment | Male Income | Female Income |
| Less than High School | $32,843 | $28,311 |
| High School Diploma | $39,976 | $31,033 |
| College or Associate's Degree | $47,862 | $36,692 |
| Bachelor's Degree | $60,144 | $48,185 |
| Graduate Degree | $79,227 | $59,724 |
| Total | $54,882 | $41,771 |
Family Income in Champaign County
Family Income Brackets in Champaign County
According to the Champaign County family income data, there are 9,314 families falling into the $100,000 to $149,999 income range, which is the most common income bracket and makes up 21.8% of all families. Conversely, the $10,000 to $14,999 income bracket is the least frequent group with only 598 families (1.4%) belonging to this category.
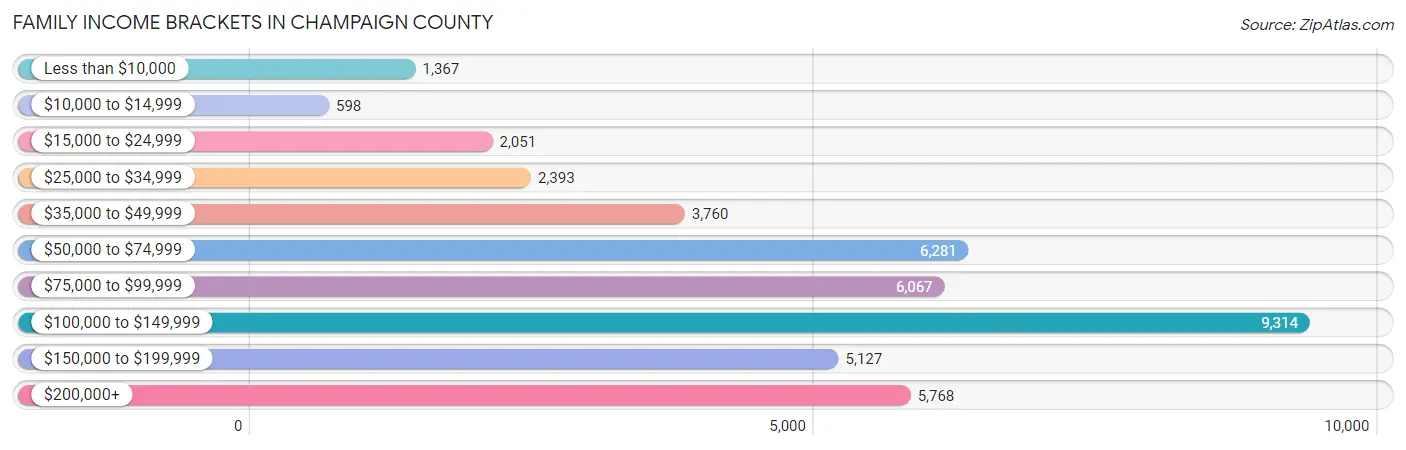
| Income Bracket | # Families | % Families |
| Less than $10,000 | 1,367 | 3.2% |
| $10,000 to $14,999 | 598 | 1.4% |
| $15,000 to $24,999 | 2,051 | 4.8% |
| $25,000 to $34,999 | 2,393 | 5.6% |
| $35,000 to $49,999 | 3,760 | 8.8% |
| $50,000 to $74,999 | 6,281 | 14.7% |
| $75,000 to $99,999 | 6,067 | 14.2% |
| $100,000 to $149,999 | 9,314 | 21.8% |
| $150,000 to $199,999 | 5,127 | 12.0% |
| $200,000+ | 5,768 | 13.5% |
Family Income by Famaliy Size in Champaign County
4-person families (7,603 | 17.8%) account for the highest median family income in Champaign County with $108,472 per family, while 2-person families (22,383 | 52.4%) have the highest median income of $44,982 per family member.

| Income Bracket | # Families | Median Income |
| 2-Person Families | 22,383 (52.4%) | $89,964 |
| 3-Person Families | 8,872 (20.8%) | $98,460 |
| 4-Person Families | 7,603 (17.8%) | $108,472 |
| 5-Person Families | 2,668 (6.2%) | $105,871 |
| 6-Person Families | 838 (2.0%) | $71,071 |
| 7+ Person Families | 361 (0.8%) | $89,830 |
| Total | 42,725 (100.0%) | $94,792 |
Family Income by Number of Earners in Champaign County
The median family income in Champaign County is $94,792, with families comprising 3+ earners (3,253) having the highest median family income of $152,371, while families with 1 earner (13,480) have the lowest median family income of $59,787, accounting for 7.6% and 31.6% of families, respectively.
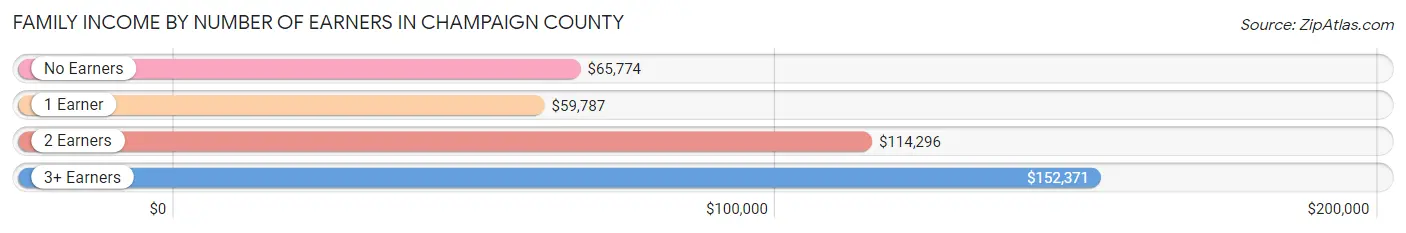
| Number of Earners | # Families | Median Income |
| No Earners | 6,070 (14.2%) | $65,774 |
| 1 Earner | 13,480 (31.6%) | $59,787 |
| 2 Earners | 19,922 (46.6%) | $114,296 |
| 3+ Earners | 3,253 (7.6%) | $152,371 |
| Total | 42,725 (100.0%) | $94,792 |
Household Income in Champaign County
Household Income Brackets in Champaign County
With 13,442 households falling in the category, the $50,000 to $74,999 income range is the most frequent in Champaign County, accounting for 16.3% of all households. In contrast, only 2,639 households (3.2%) fall into the $10,000 to $14,999 income bracket, making it the least populous group.
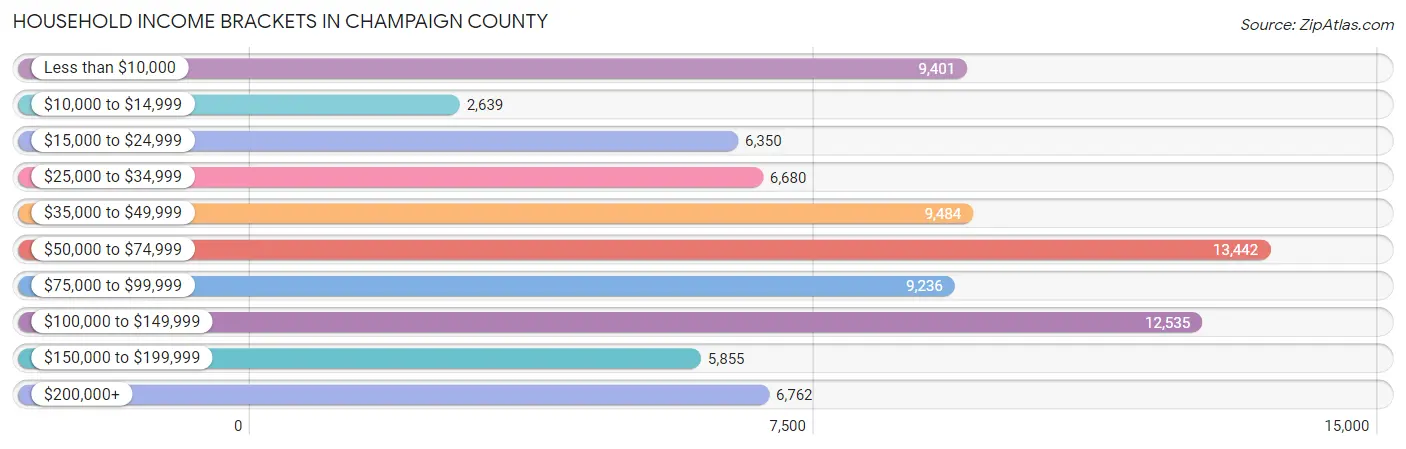
| Income Bracket | # Households | % Households |
| Less than $10,000 | 9,401 | 11.4% |
| $10,000 to $14,999 | 2,639 | 3.2% |
| $15,000 to $24,999 | 6,350 | 7.7% |
| $25,000 to $34,999 | 6,680 | 8.1% |
| $35,000 to $49,999 | 9,484 | 11.5% |
| $50,000 to $74,999 | 13,442 | 16.3% |
| $75,000 to $99,999 | 9,236 | 11.2% |
| $100,000 to $149,999 | 12,535 | 15.2% |
| $150,000 to $199,999 | 5,855 | 7.1% |
| $200,000+ | 6,762 | 8.2% |
Household Income by Householder Age in Champaign County
The median household income in Champaign County is $61,090, with the highest median household income of $89,039 found in the 45 to 64 years age bracket for the primary householder. A total of 23,663 households (28.7%) fall into this category. Meanwhile, the 15 to 24 years age bracket for the primary householder has the lowest median household income of $18,513, with 12,777 households (15.5%) in this group.
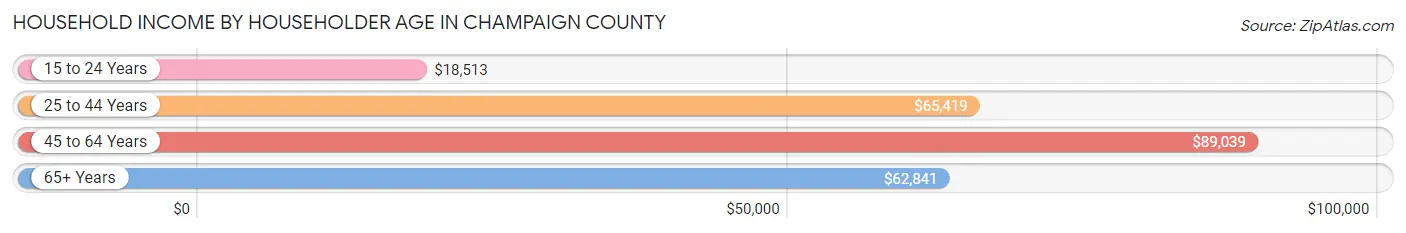
| Income Bracket | # Households | Median Income |
| 15 to 24 Years | 12,777 (15.5%) | $18,513 |
| 25 to 44 Years | 28,405 (34.4%) | $65,419 |
| 45 to 64 Years | 23,663 (28.7%) | $89,039 |
| 65+ Years | 17,622 (21.4%) | $62,841 |
| Total | 82,467 (100.0%) | $61,090 |
Poverty in Champaign County
Income Below Poverty by Sex and Age in Champaign County
With 18.0% poverty level for males and 19.4% for females among the residents of Champaign County, 18 to 24 year old males and 18 to 24 year old females are the most vulnerable to poverty, with 9,138 males (50.1%) and 8,912 females (53.6%) in their respective age groups living below the poverty level.

| Age Bracket | Male | Female |
| Under 5 Years | 666 (12.1%) | 824 (15.8%) |
| 5 Years | 72 (8.2%) | 214 (19.0%) |
| 6 to 11 Years | 938 (14.4%) | 665 (12.6%) |
| 12 to 14 Years | 575 (17.1%) | 463 (11.8%) |
| 15 Years | 205 (18.6%) | 439 (39.3%) |
| 16 and 17 Years | 269 (11.8%) | 307 (16.1%) |
| 18 to 24 Years | 9,138 (50.1%) | 8,912 (53.6%) |
| 25 to 34 Years | 2,034 (14.2%) | 2,096 (15.2%) |
| 35 to 44 Years | 947 (8.1%) | 1,445 (12.3%) |
| 45 to 54 Years | 942 (9.6%) | 910 (9.2%) |
| 55 to 64 Years | 603 (6.0%) | 1,360 (12.6%) |
| 65 to 74 Years | 669 (8.7%) | 707 (8.1%) |
| 75 Years and over | 213 (4.8%) | 378 (6.0%) |
| Total | 17,271 (18.0%) | 18,720 (19.4%) |
Income Above Poverty by Sex and Age in Champaign County
According to the poverty statistics in Champaign County, males aged 75 years and over and females aged 75 years and over are the age groups that are most secure financially, with 95.2% of males and 94.0% of females in these age groups living above the poverty line.
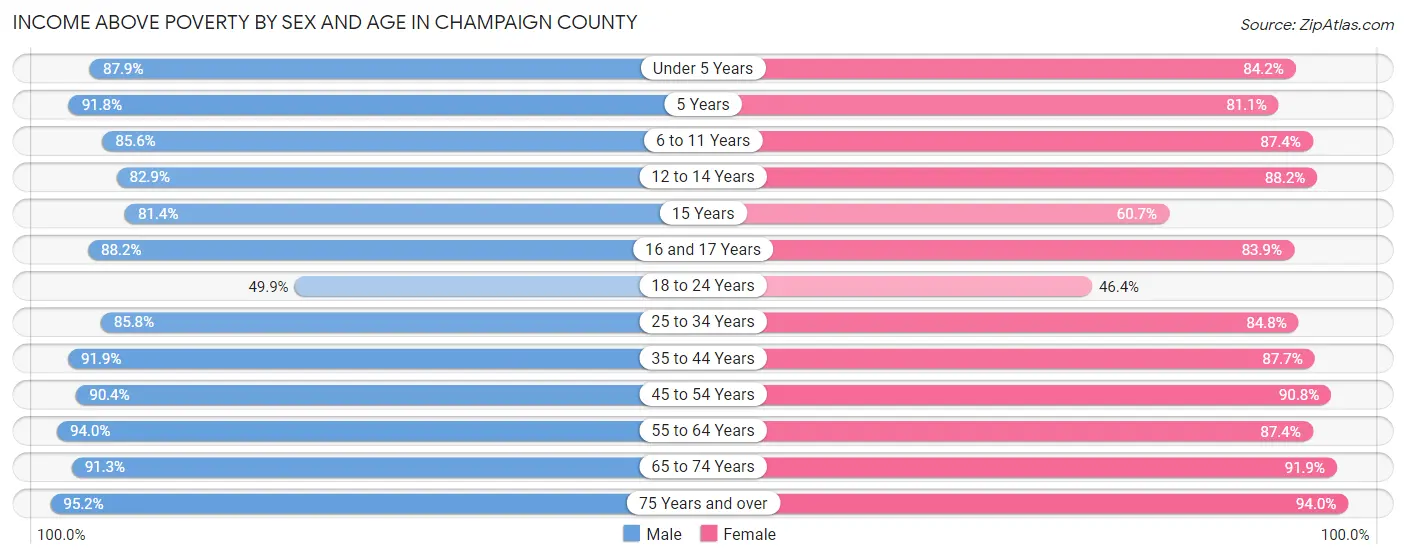
| Age Bracket | Male | Female |
| Under 5 Years | 4,815 (87.8%) | 4,395 (84.2%) |
| 5 Years | 806 (91.8%) | 915 (81.0%) |
| 6 to 11 Years | 5,554 (85.6%) | 4,609 (87.4%) |
| 12 to 14 Years | 2,793 (82.9%) | 3,471 (88.2%) |
| 15 Years | 894 (81.4%) | 678 (60.7%) |
| 16 and 17 Years | 2,015 (88.2%) | 1,598 (83.9%) |
| 18 to 24 Years | 9,105 (49.9%) | 7,725 (46.4%) |
| 25 to 34 Years | 12,326 (85.8%) | 11,671 (84.8%) |
| 35 to 44 Years | 10,785 (91.9%) | 10,342 (87.7%) |
| 45 to 54 Years | 8,868 (90.4%) | 9,007 (90.8%) |
| 55 to 64 Years | 9,399 (94.0%) | 9,413 (87.4%) |
| 65 to 74 Years | 6,981 (91.2%) | 7,994 (91.9%) |
| 75 Years and over | 4,236 (95.2%) | 5,901 (94.0%) |
| Total | 78,577 (82.0%) | 77,719 (80.6%) |
Income Below Poverty Among Married-Couple Families in Champaign County
The poverty statistics for married-couple families in Champaign County show that 3.7% or 1,220 of the total 32,565 families live below the poverty line. Families with 5 or more children have the highest poverty rate of 20.6%, comprising of 33 families. On the other hand, families with 1 or 2 children have the lowest poverty rate of 3.1%, which includes 318 families.
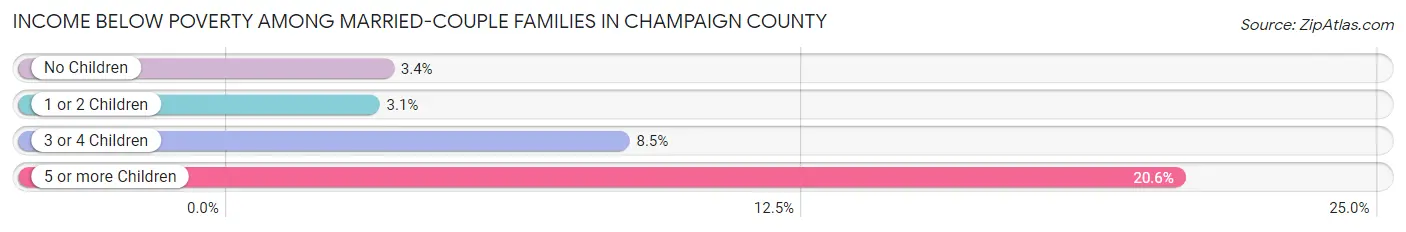
| Children | Above Poverty | Below Poverty |
| No Children | 19,068 (96.6%) | 669 (3.4%) |
| 1 or 2 Children | 10,002 (96.9%) | 318 (3.1%) |
| 3 or 4 Children | 2,148 (91.5%) | 200 (8.5%) |
| 5 or more Children | 127 (79.4%) | 33 (20.6%) |
| Total | 31,345 (96.3%) | 1,220 (3.7%) |
Income Below Poverty Among Single-Parent Households in Champaign County
According to the poverty data in Champaign County, 19.2% or 492 single-father households and 22.2% or 1,685 single-mother households are living below the poverty line. Among single-father households, those with 1 or 2 children have the highest poverty rate, with 274 households (22.5%) experiencing poverty. Likewise, among single-mother households, those with 3 or 4 children have the highest poverty rate, with 421 households (40.0%) falling below the poverty line.
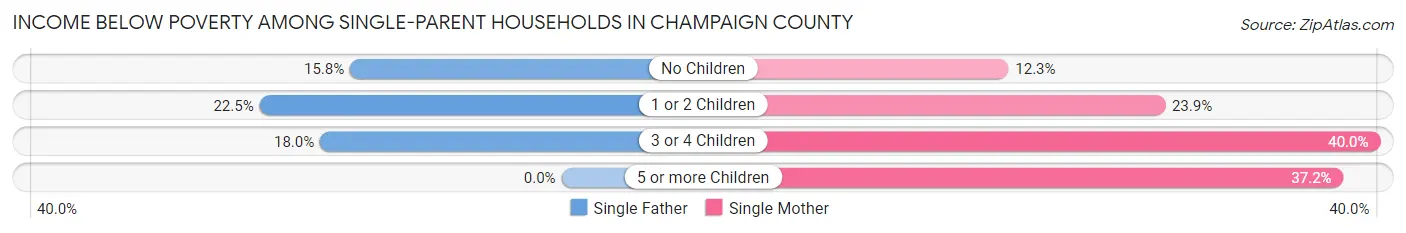
| Children | Single Father | Single Mother |
| No Children | 175 (15.8%) | 336 (12.3%) |
| 1 or 2 Children | 274 (22.5%) | 877 (23.9%) |
| 3 or 4 Children | 43 (18.0%) | 421 (40.0%) |
| 5 or more Children | 0 (0.0%) | 51 (37.2%) |
| Total | 492 (19.2%) | 1,685 (22.2%) |
Income Below Poverty Among Married-Couple vs Single-Parent Households in Champaign County
The poverty data for Champaign County shows that 1,220 of the married-couple family households (3.7%) and 2,177 of the single-parent households (21.4%) are living below the poverty level. Within the married-couple family households, those with 5 or more children have the highest poverty rate, with 33 households (20.6%) falling below the poverty line. Among the single-parent households, those with 5 or more children have the highest poverty rate, with 51 household (37.2%) living below poverty.

| Children | Married-Couple Families | Single-Parent Households |
| No Children | 669 (3.4%) | 511 (13.3%) |
| 1 or 2 Children | 318 (3.1%) | 1,151 (23.6%) |
| 3 or 4 Children | 200 (8.5%) | 464 (35.9%) |
| 5 or more Children | 33 (20.6%) | 51 (37.2%) |
| Total | 1,220 (3.7%) | 2,177 (21.4%) |
Employment Characteristics in Champaign County
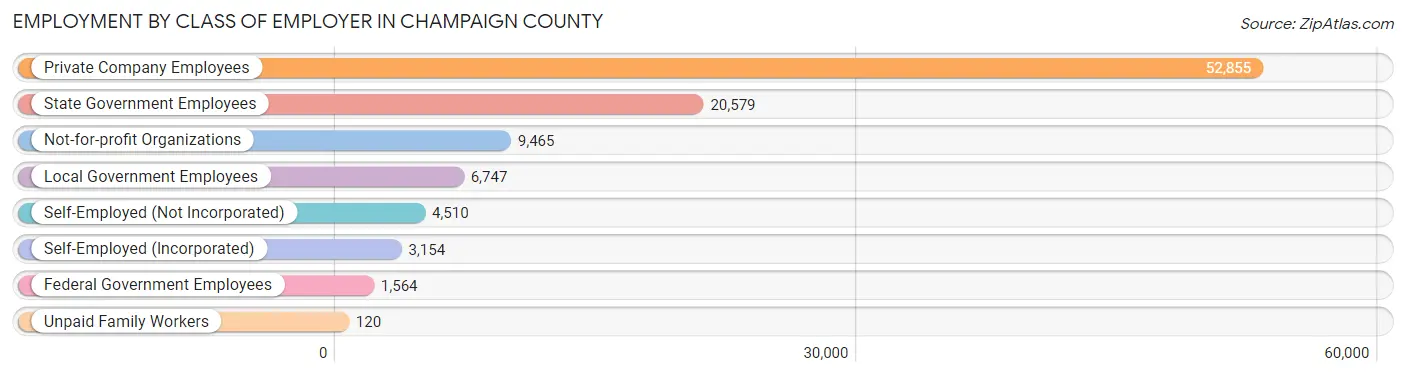
Employment by Class of Employer in Champaign County
Among the 98,994 employed individuals in Champaign County, private company employees (52,855 | 53.4%), state government employees (20,579 | 20.8%), and not-for-profit organizations (9,465 | 9.6%) make up the most common classes of employment.
| Employer Class | # Employees | % Employees |
| Private Company Employees | 52,855 | 53.4% |
| Self-Employed (Incorporated) | 3,154 | 3.2% |
| Self-Employed (Not Incorporated) | 4,510 | 4.6% |
| Not-for-profit Organizations | 9,465 | 9.6% |
| Local Government Employees | 6,747 | 6.8% |
| State Government Employees | 20,579 | 20.8% |
| Federal Government Employees | 1,564 | 1.6% |
| Unpaid Family Workers | 120 | 0.1% |
| Total | 98,994 | 100.0% |
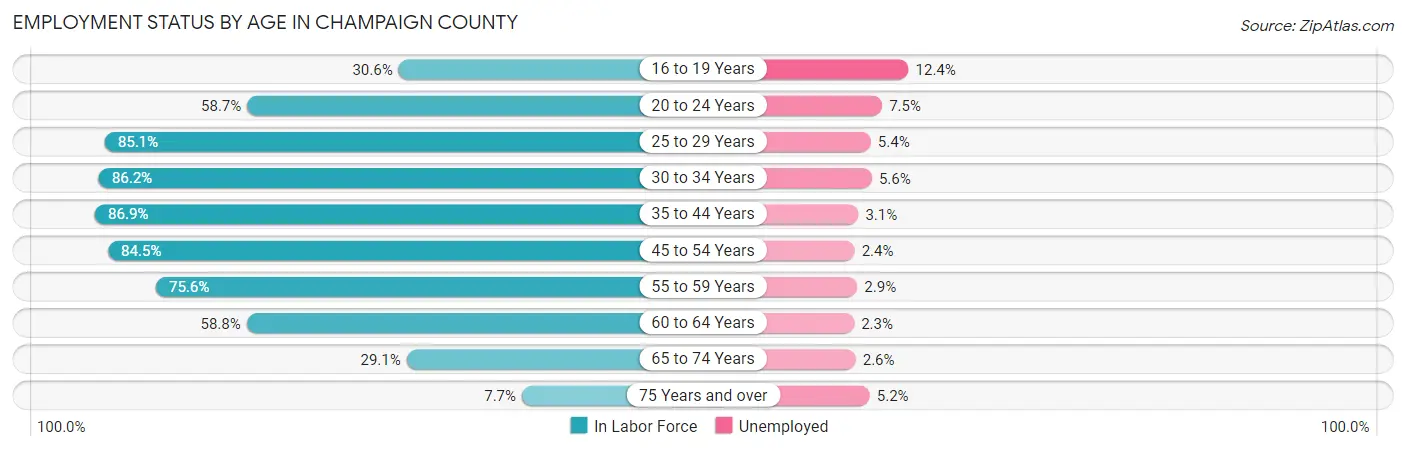
Employment Status by Age in Champaign County
According to the labor force statistics for Champaign County, out of the total population over 16 years of age (171,967), 61.8% or 106,276 individuals are in the labor force, with 4.8% or 5,101 of them unemployed. The age group with the highest labor force participation rate is 35 to 44 years, with 86.9% or 20,495 individuals in the labor force. Within the labor force, the 16 to 19 years age range has the highest percentage of unemployed individuals, with 12.4% or 704 of them being unemployed.
| Age Bracket | In Labor Force | Unemployed |
| 16 to 19 Years | 5,676 (30.6%) | 704 (12.4%) |
| 20 to 24 Years | 19,401 (58.7%) | 1,455 (7.5%) |
| 25 to 29 Years | 12,722 (85.1%) | 687 (5.4%) |
| 30 to 34 Years | 11,512 (86.2%) | 645 (5.6%) |
| 35 to 44 Years | 20,495 (86.9%) | 635 (3.1%) |
| 45 to 54 Years | 16,738 (84.5%) | 402 (2.4%) |
| 55 to 59 Years | 7,967 (75.6%) | 231 (2.9%) |
| 60 to 64 Years | 6,104 (58.8%) | 140 (2.3%) |
| 65 to 74 Years | 4,794 (29.1%) | 125 (2.6%) |
| 75 Years and over | 868 (7.7%) | 45 (5.2%) |
| Total | 106,276 (61.8%) | 5,101 (4.8%) |
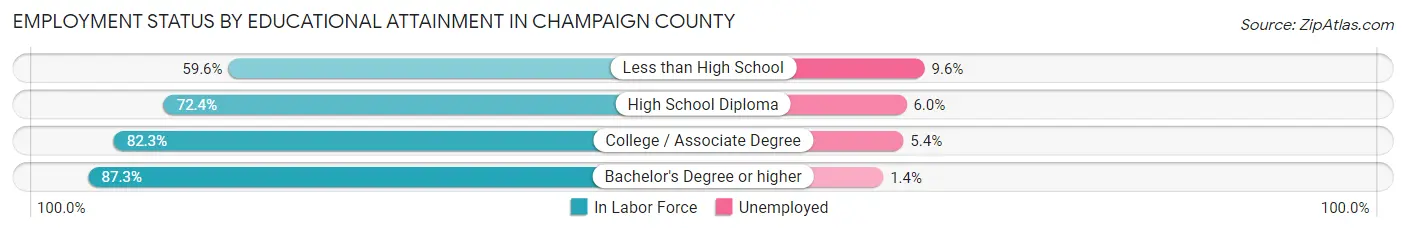
Employment Status by Educational Attainment in Champaign County
According to labor force statistics for Champaign County, 81.6% of individuals (75,575) out of the total population between 25 and 64 years of age (92,617) are in the labor force, with 3.6% or 2,721 of them being unemployed. The group with the highest labor force participation rate are those with the educational attainment of bachelor's degree or higher, with 87.3% or 38,547 individuals in the labor force. Within the labor force, individuals with less than high school education have the highest percentage of unemployment, with 9.6% or 277 of them being unemployed.
| Educational Attainment | In Labor Force | Unemployed |
| Less than High School | 2,885 (59.6%) | 465 (9.6%) |
| High School Diploma | 13,353 (72.4%) | 1,107 (6.0%) |
| College / Associate Degree | 20,721 (82.3%) | 1,360 (5.4%) |
| Bachelor's Degree or higher | 38,547 (87.3%) | 618 (1.4%) |
| Total | 75,575 (81.6%) | 3,334 (3.6%) |
Employment Occupations by Sex in Champaign County
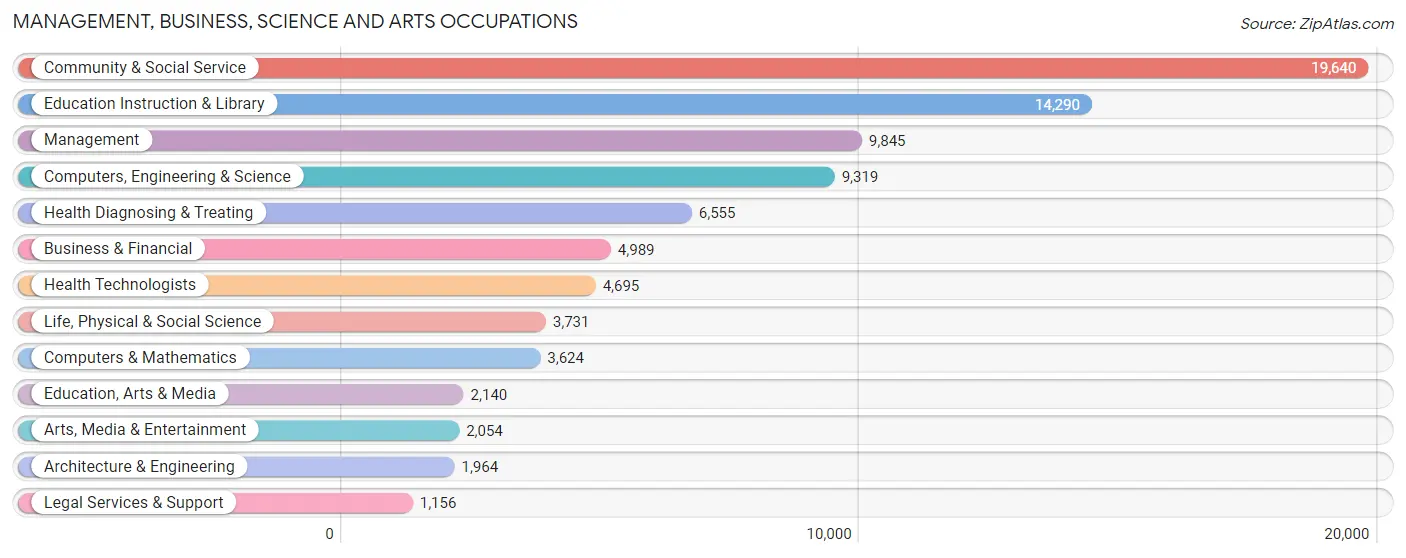
Management, Business, Science and Arts Occupations
The most common Management, Business, Science and Arts occupations in Champaign County are Community & Social Service (19,640 | 19.4%), Education Instruction & Library (14,290 | 14.1%), Management (9,845 | 9.7%), Computers, Engineering & Science (9,319 | 9.2%), and Health Diagnosing & Treating (6,555 | 6.5%).
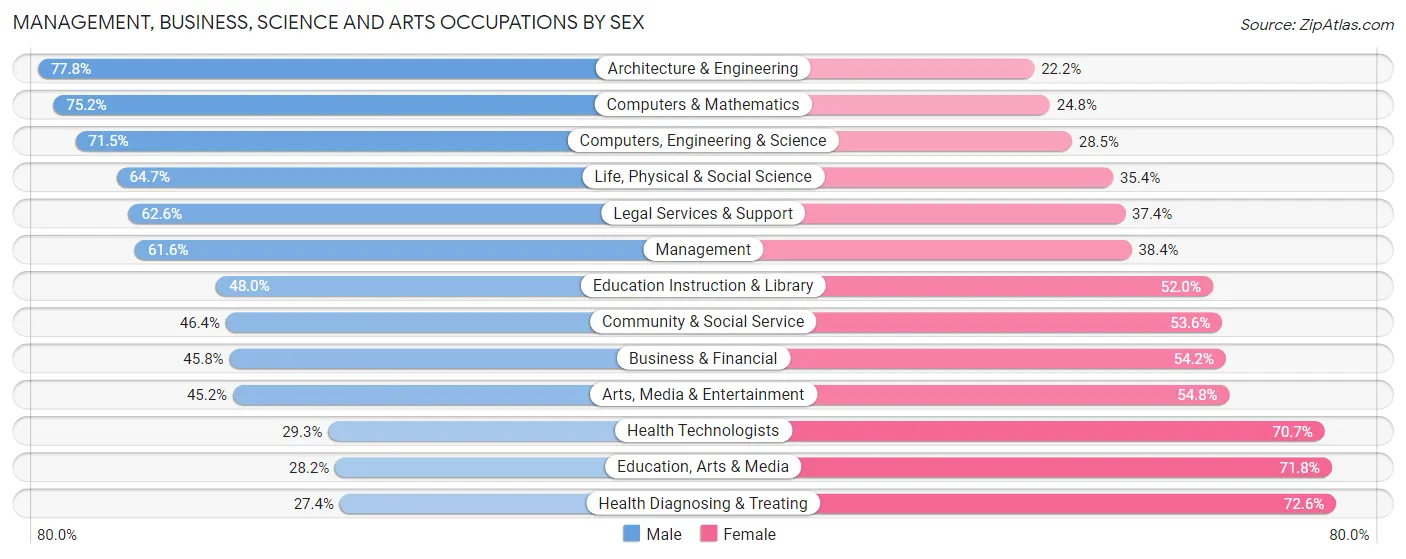
Management, Business, Science and Arts Occupations by Sex
Within the Management, Business, Science and Arts occupations in Champaign County, the most male-oriented occupations are Architecture & Engineering (77.8%), Computers & Mathematics (75.2%), and Computers, Engineering & Science (71.5%), while the most female-oriented occupations are Health Diagnosing & Treating (72.6%), Education, Arts & Media (71.8%), and Health Technologists (70.7%).
| Occupation | Male | Female |
| Management | 6,062 (61.6%) | 3,783 (38.4%) |
| Business & Financial | 2,286 (45.8%) | 2,703 (54.2%) |
| Computers, Engineering & Science | 6,665 (71.5%) | 2,654 (28.5%) |
| Computers & Mathematics | 2,725 (75.2%) | 899 (24.8%) |
| Architecture & Engineering | 1,528 (77.8%) | 436 (22.2%) |
| Life, Physical & Social Science | 2,412 (64.6%) | 1,319 (35.3%) |
| Community & Social Service | 9,115 (46.4%) | 10,525 (53.6%) |
| Education, Arts & Media | 603 (28.2%) | 1,537 (71.8%) |
| Legal Services & Support | 724 (62.6%) | 432 (37.4%) |
| Education Instruction & Library | 6,859 (48.0%) | 7,431 (52.0%) |
| Arts, Media & Entertainment | 929 (45.2%) | 1,125 (54.8%) |
| Health Diagnosing & Treating | 1,797 (27.4%) | 4,758 (72.6%) |
| Health Technologists | 1,377 (29.3%) | 3,318 (70.7%) |
| Total (Category) | 25,925 (51.5%) | 24,423 (48.5%) |
| Total (Overall) | 52,543 (52.0%) | 48,581 (48.0%) |
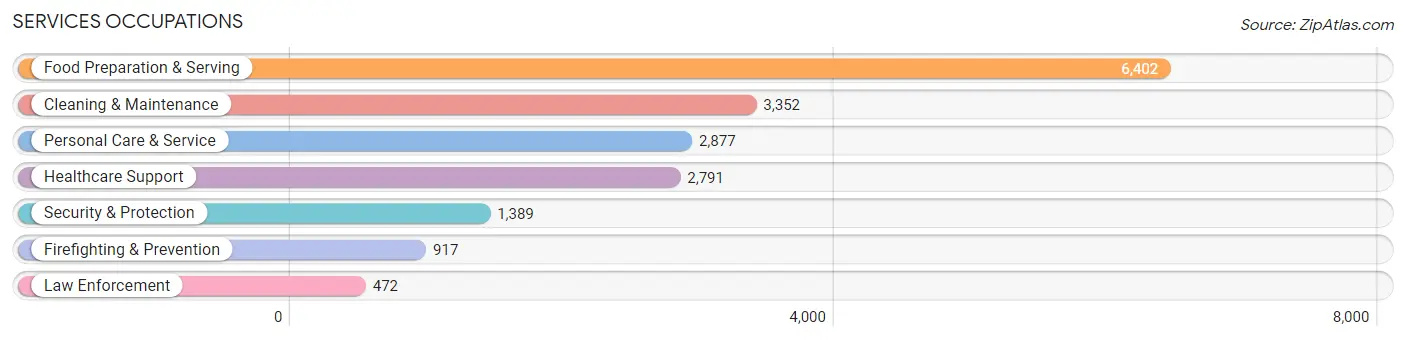
Services Occupations
The most common Services occupations in Champaign County are Food Preparation & Serving (6,402 | 6.3%), Cleaning & Maintenance (3,352 | 3.3%), Personal Care & Service (2,877 | 2.9%), Healthcare Support (2,791 | 2.8%), and Security & Protection (1,389 | 1.4%).
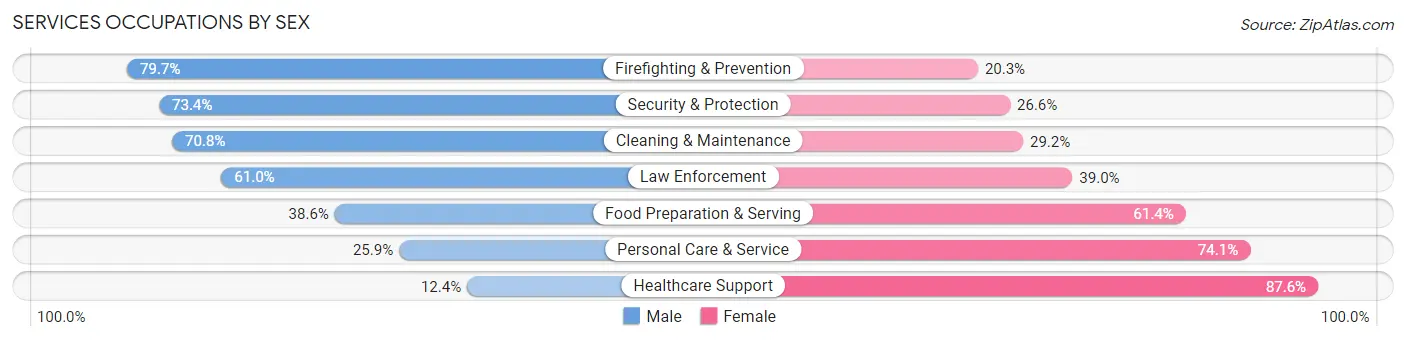
Services Occupations by Sex
Within the Services occupations in Champaign County, the most male-oriented occupations are Firefighting & Prevention (79.7%), Security & Protection (73.4%), and Cleaning & Maintenance (70.8%), while the most female-oriented occupations are Healthcare Support (87.6%), Personal Care & Service (74.1%), and Food Preparation & Serving (61.4%).
| Occupation | Male | Female |
| Healthcare Support | 346 (12.4%) | 2,445 (87.6%) |
| Security & Protection | 1,019 (73.4%) | 370 (26.6%) |
| Firefighting & Prevention | 731 (79.7%) | 186 (20.3%) |
| Law Enforcement | 288 (61.0%) | 184 (39.0%) |
| Food Preparation & Serving | 2,471 (38.6%) | 3,931 (61.4%) |
| Cleaning & Maintenance | 2,373 (70.8%) | 979 (29.2%) |
| Personal Care & Service | 744 (25.9%) | 2,133 (74.1%) |
| Total (Category) | 6,953 (41.4%) | 9,858 (58.6%) |
| Total (Overall) | 52,543 (52.0%) | 48,581 (48.0%) |
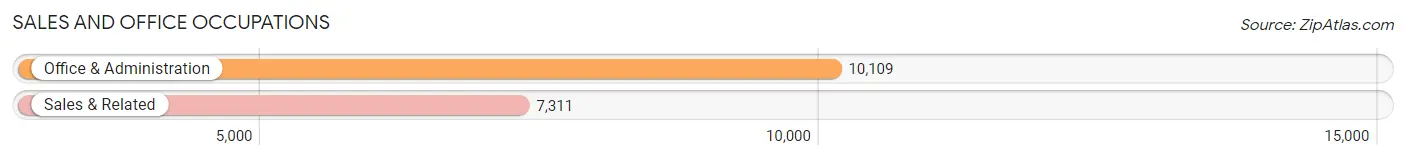
Sales and Office Occupations
The most common Sales and Office occupations in Champaign County are Office & Administration (10,109 | 10.0%), and Sales & Related (7,311 | 7.2%).
Sales and Office Occupations by Sex
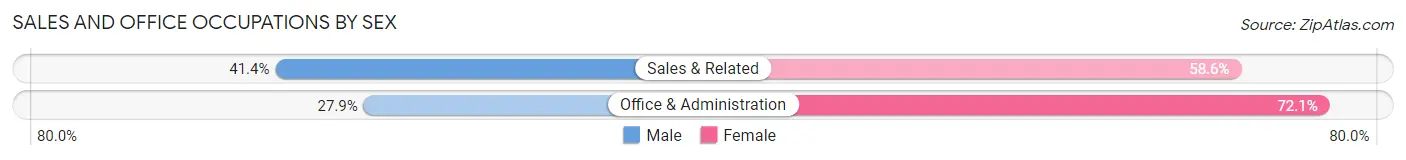
| Occupation | Male | Female |
| Sales & Related | 3,029 (41.4%) | 4,282 (58.6%) |
| Office & Administration | 2,816 (27.9%) | 7,293 (72.1%) |
| Total (Category) | 5,845 (33.6%) | 11,575 (66.4%) |
| Total (Overall) | 52,543 (52.0%) | 48,581 (48.0%) |
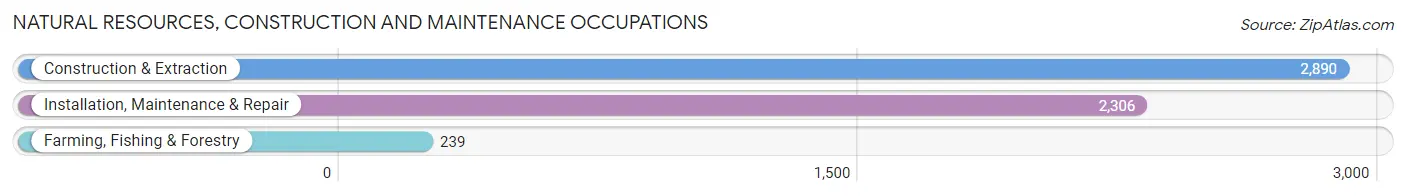
Natural Resources, Construction and Maintenance Occupations
The most common Natural Resources, Construction and Maintenance occupations in Champaign County are Construction & Extraction (2,890 | 2.9%), Installation, Maintenance & Repair (2,306 | 2.3%), and Farming, Fishing & Forestry (239 | 0.2%).
Natural Resources, Construction and Maintenance Occupations by Sex
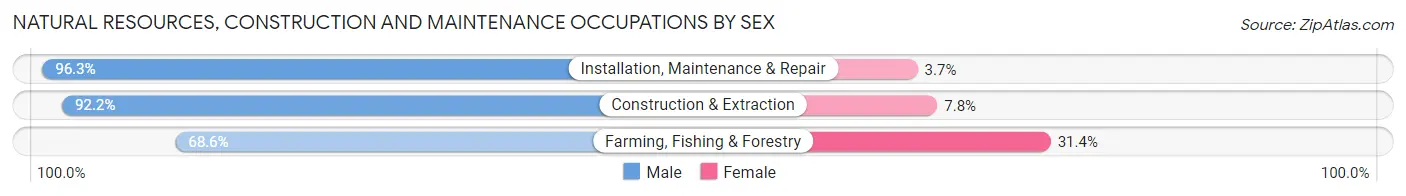
| Occupation | Male | Female |
| Farming, Fishing & Forestry | 164 (68.6%) | 75 (31.4%) |
| Construction & Extraction | 2,665 (92.2%) | 225 (7.8%) |
| Installation, Maintenance & Repair | 2,221 (96.3%) | 85 (3.7%) |
| Total (Category) | 5,050 (92.9%) | 385 (7.1%) |
| Total (Overall) | 52,543 (52.0%) | 48,581 (48.0%) |
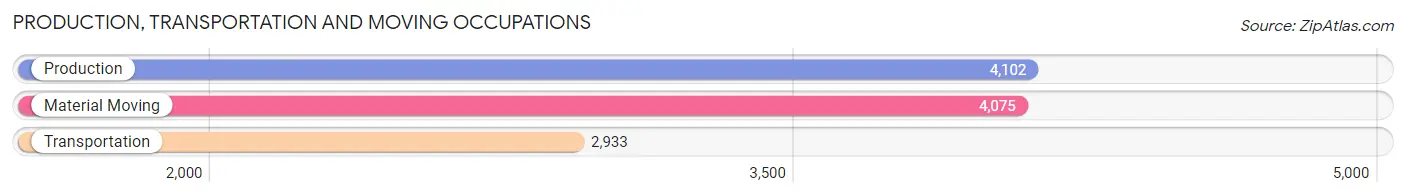
Production, Transportation and Moving Occupations
The most common Production, Transportation and Moving occupations in Champaign County are Production (4,102 | 4.1%), Material Moving (4,075 | 4.0%), and Transportation (2,933 | 2.9%).
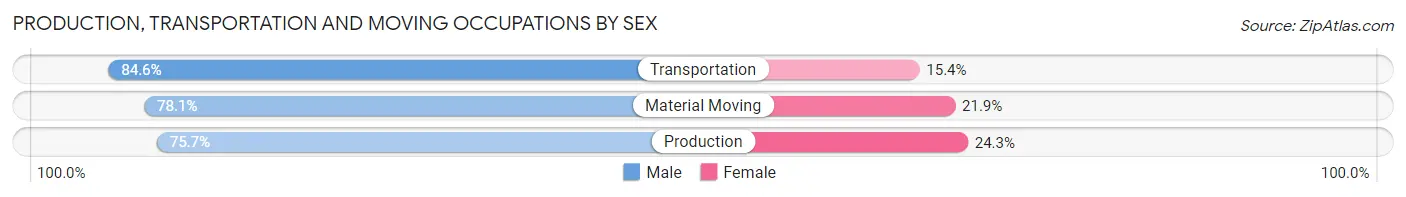
Production, Transportation and Moving Occupations by Sex
| Occupation | Male | Female |
| Production | 3,107 (75.7%) | 995 (24.3%) |
| Transportation | 2,482 (84.6%) | 451 (15.4%) |
| Material Moving | 3,181 (78.1%) | 894 (21.9%) |
| Total (Category) | 8,770 (78.9%) | 2,340 (21.1%) |
| Total (Overall) | 52,543 (52.0%) | 48,581 (48.0%) |
Employment Industries by Sex in Champaign County
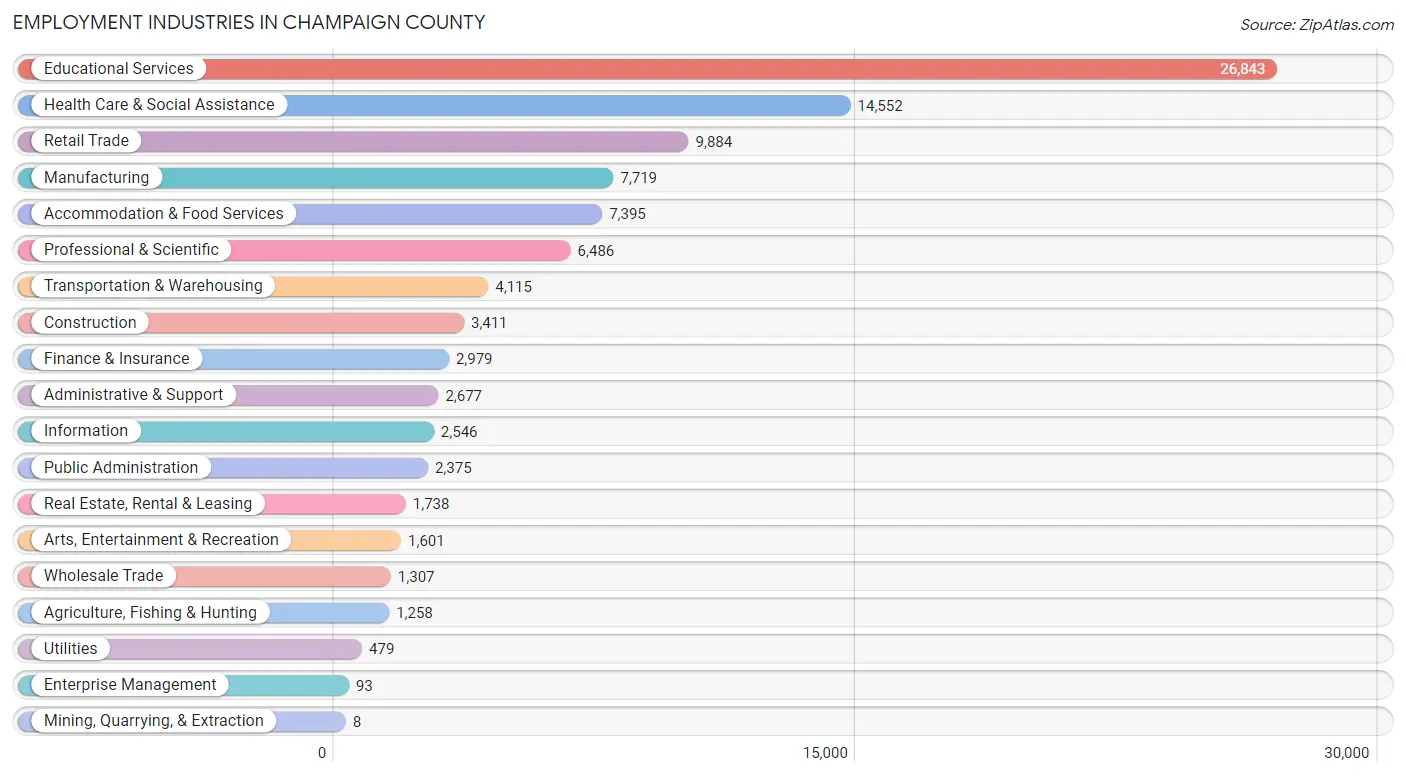
Employment Industries in Champaign County
The major employment industries in Champaign County include Educational Services (26,843 | 26.5%), Health Care & Social Assistance (14,552 | 14.4%), Retail Trade (9,884 | 9.8%), Manufacturing (7,719 | 7.6%), and Accommodation & Food Services (7,395 | 7.3%).
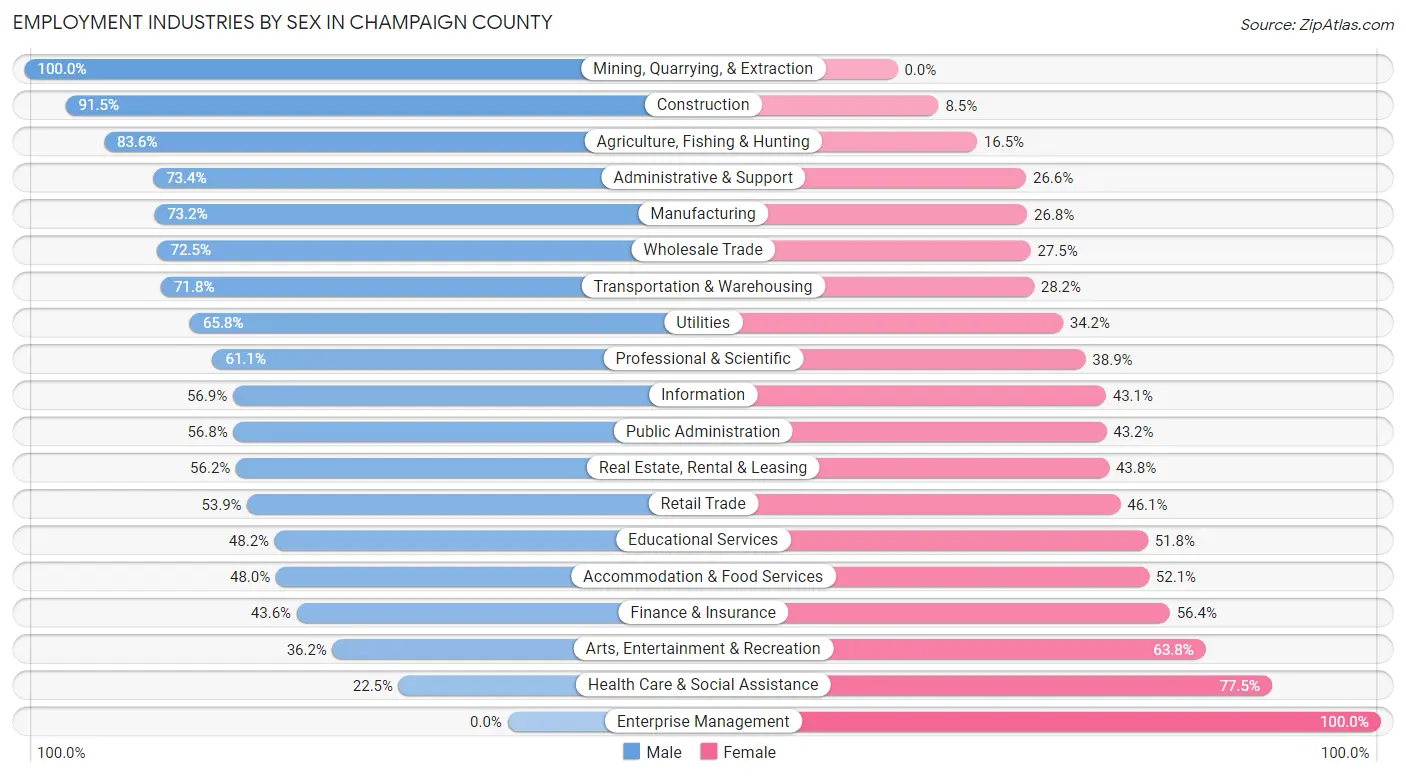
Employment Industries by Sex in Champaign County
The Champaign County industries that see more men than women are Mining, Quarrying, & Extraction (100.0%), Construction (91.5%), and Agriculture, Fishing & Hunting (83.6%), whereas the industries that tend to have a higher number of women are Enterprise Management (100.0%), Health Care & Social Assistance (77.5%), and Arts, Entertainment & Recreation (63.8%).
| Industry | Male | Female |
| Agriculture, Fishing & Hunting | 1,051 (83.6%) | 207 (16.5%) |
| Mining, Quarrying, & Extraction | 8 (100.0%) | 0 (0.0%) |
| Construction | 3,121 (91.5%) | 290 (8.5%) |
| Manufacturing | 5,647 (73.2%) | 2,072 (26.8%) |
| Wholesale Trade | 947 (72.5%) | 360 (27.5%) |
| Retail Trade | 5,325 (53.9%) | 4,559 (46.1%) |
| Transportation & Warehousing | 2,953 (71.8%) | 1,162 (28.2%) |
| Utilities | 315 (65.8%) | 164 (34.2%) |
| Information | 1,448 (56.9%) | 1,098 (43.1%) |
| Finance & Insurance | 1,300 (43.6%) | 1,679 (56.4%) |
| Real Estate, Rental & Leasing | 977 (56.2%) | 761 (43.8%) |
| Professional & Scientific | 3,962 (61.1%) | 2,524 (38.9%) |
| Enterprise Management | 0 (0.0%) | 93 (100.0%) |
| Administrative & Support | 1,964 (73.4%) | 713 (26.6%) |
| Educational Services | 12,935 (48.2%) | 13,908 (51.8%) |
| Health Care & Social Assistance | 3,278 (22.5%) | 11,274 (77.5%) |
| Arts, Entertainment & Recreation | 580 (36.2%) | 1,021 (63.8%) |
| Accommodation & Food Services | 3,546 (47.9%) | 3,849 (52.0%) |
| Public Administration | 1,348 (56.8%) | 1,027 (43.2%) |
| Total | 52,543 (52.0%) | 48,581 (48.0%) |
Education in Champaign County
School Enrollment in Champaign County
The most common levels of schooling among the 74,233 students in Champaign County are college / undergraduate (31,360 | 42.2%), graduate / professional (12,118 | 16.3%), and middle school (9,126 | 12.3%).
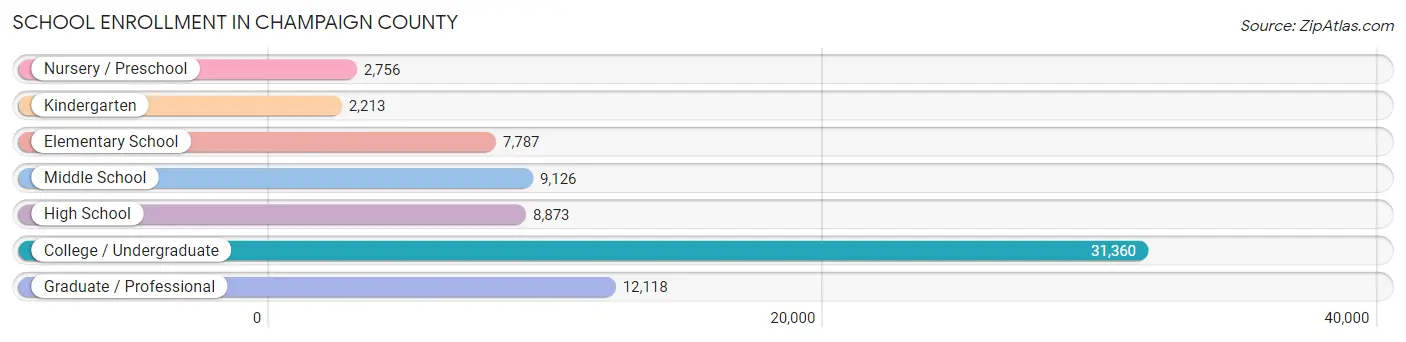
| School Level | # Students | % Students |
| Nursery / Preschool | 2,756 | 3.7% |
| Kindergarten | 2,213 | 3.0% |
| Elementary School | 7,787 | 10.5% |
| Middle School | 9,126 | 12.3% |
| High School | 8,873 | 11.9% |
| College / Undergraduate | 31,360 | 42.2% |
| Graduate / Professional | 12,118 | 16.3% |
| Total | 74,233 | 100.0% |
School Enrollment by Age by Funding Source in Champaign County
Out of a total of 74,233 students who are enrolled in schools in Champaign County, 6,533 (8.8%) attend a private institution, while the remaining 67,700 (91.2%) are enrolled in public schools. The age group of 3 to 4 year olds has the highest likelihood of being enrolled in private schools, with 892 (40.8% in the age bracket) enrolled. Conversely, the age group of 18 to 19 year olds has the lowest likelihood of being enrolled in a private school, with 12,343 (97.1% in the age bracket) attending a public institution.

| Age Bracket | Public School | Private School |
| 3 to 4 Year Olds | 1,294 (59.2%) | 892 (40.8%) |
| 5 to 9 Year Old | 7,968 (81.7%) | 1,782 (18.3%) |
| 10 to 14 Year Olds | 9,925 (88.7%) | 1,258 (11.3%) |
| 15 to 17 Year Olds | 5,823 (93.8%) | 386 (6.2%) |
| 18 to 19 Year Olds | 12,343 (97.1%) | 369 (2.9%) |
| 20 to 24 Year Olds | 21,426 (95.8%) | 944 (4.2%) |
| 25 to 34 Year Olds | 6,576 (93.6%) | 453 (6.4%) |
| 35 Years and over | 2,382 (85.3%) | 412 (14.7%) |
| Total | 67,700 (91.2%) | 6,533 (8.8%) |
Educational Attainment by Field of Study in Champaign County
Education (6,966 | 11.8%), business (6,698 | 11.3%), bio, nature & agricultural (6,536 | 11.1%), engineering (5,180 | 8.8%), and science & technology (5,164 | 8.7%) are the most common fields of study among 59,115 individuals in Champaign County who have obtained a bachelor's degree or higher.
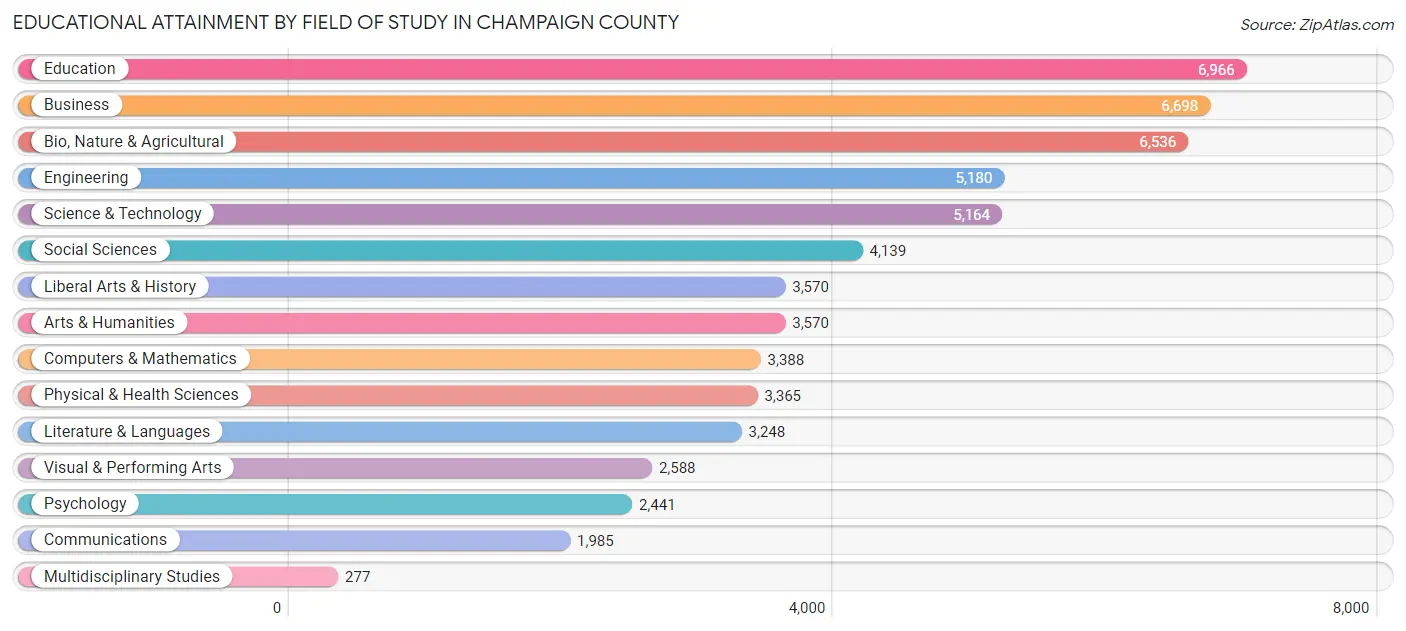
| Field of Study | # Graduates | % Graduates |
| Computers & Mathematics | 3,388 | 5.7% |
| Bio, Nature & Agricultural | 6,536 | 11.1% |
| Physical & Health Sciences | 3,365 | 5.7% |
| Psychology | 2,441 | 4.1% |
| Social Sciences | 4,139 | 7.0% |
| Engineering | 5,180 | 8.8% |
| Multidisciplinary Studies | 277 | 0.5% |
| Science & Technology | 5,164 | 8.7% |
| Business | 6,698 | 11.3% |
| Education | 6,966 | 11.8% |
| Literature & Languages | 3,248 | 5.5% |
| Liberal Arts & History | 3,570 | 6.0% |
| Visual & Performing Arts | 2,588 | 4.4% |
| Communications | 1,985 | 3.4% |
| Arts & Humanities | 3,570 | 6.0% |
| Total | 59,115 | 100.0% |
Transportation & Commute in Champaign County
Vehicle Availability by Sex in Champaign County
The most prevalent vehicle ownership categories in Champaign County are males with 2 vehicles (21,223, accounting for 42.5%) and females with 2 vehicles (18,673, making up 46.4%).
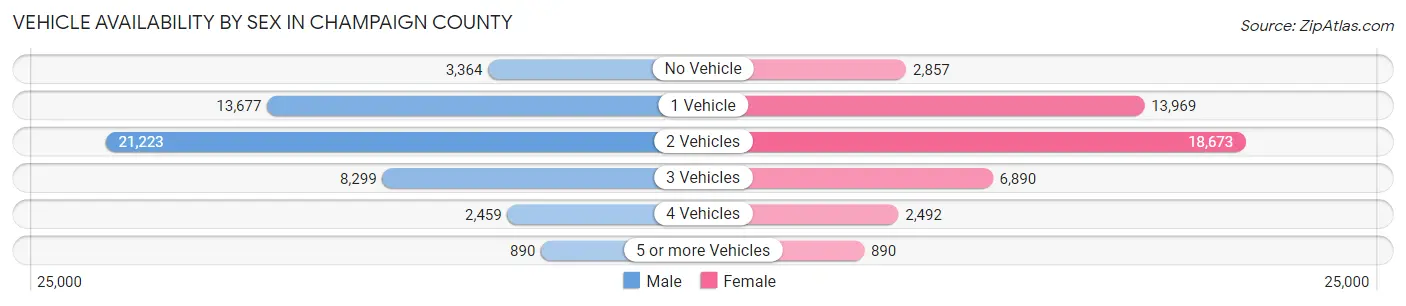
| Vehicles Available | Male | Female |
| No Vehicle | 3,364 (6.7%) | 2,857 (6.2%) |
| 1 Vehicle | 13,677 (27.4%) | 13,969 (30.5%) |
| 2 Vehicles | 21,223 (42.5%) | 18,673 (40.8%) |
| 3 Vehicles | 8,299 (16.6%) | 6,890 (15.0%) |
| 4 Vehicles | 2,459 (4.9%) | 2,492 (5.4%) |
| 5 or more Vehicles | 890 (1.8%) | 890 (1.9%) |
| Total | 49,912 (100.0%) | 45,771 (100.0%) |
Commute Time in Champaign County
The most frequently occuring commute durations in Champaign County are 10 to 14 minutes (21,861 commuters, 25.0%), 15 to 19 minutes (21,407 commuters, 24.4%), and 5 to 9 minutes (13,369 commuters, 15.3%).
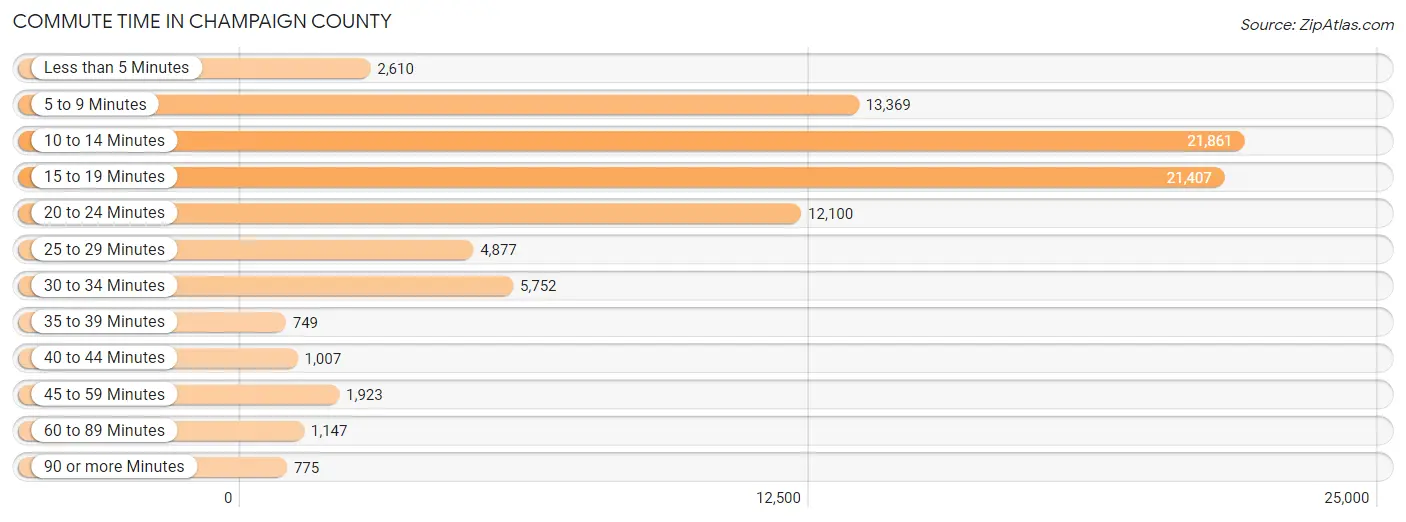
| Commute Time | # Commuters | % Commuters |
| Less than 5 Minutes | 2,610 | 3.0% |
| 5 to 9 Minutes | 13,369 | 15.3% |
| 10 to 14 Minutes | 21,861 | 25.0% |
| 15 to 19 Minutes | 21,407 | 24.4% |
| 20 to 24 Minutes | 12,100 | 13.8% |
| 25 to 29 Minutes | 4,877 | 5.6% |
| 30 to 34 Minutes | 5,752 | 6.6% |
| 35 to 39 Minutes | 749 | 0.9% |
| 40 to 44 Minutes | 1,007 | 1.1% |
| 45 to 59 Minutes | 1,923 | 2.2% |
| 60 to 89 Minutes | 1,147 | 1.3% |
| 90 or more Minutes | 775 | 0.9% |
Commute Time by Sex in Champaign County
The most common commute times in Champaign County are 10 to 14 minutes (11,861 commuters, 26.1%) for males and 10 to 14 minutes (10,000 commuters, 23.7%) for females.
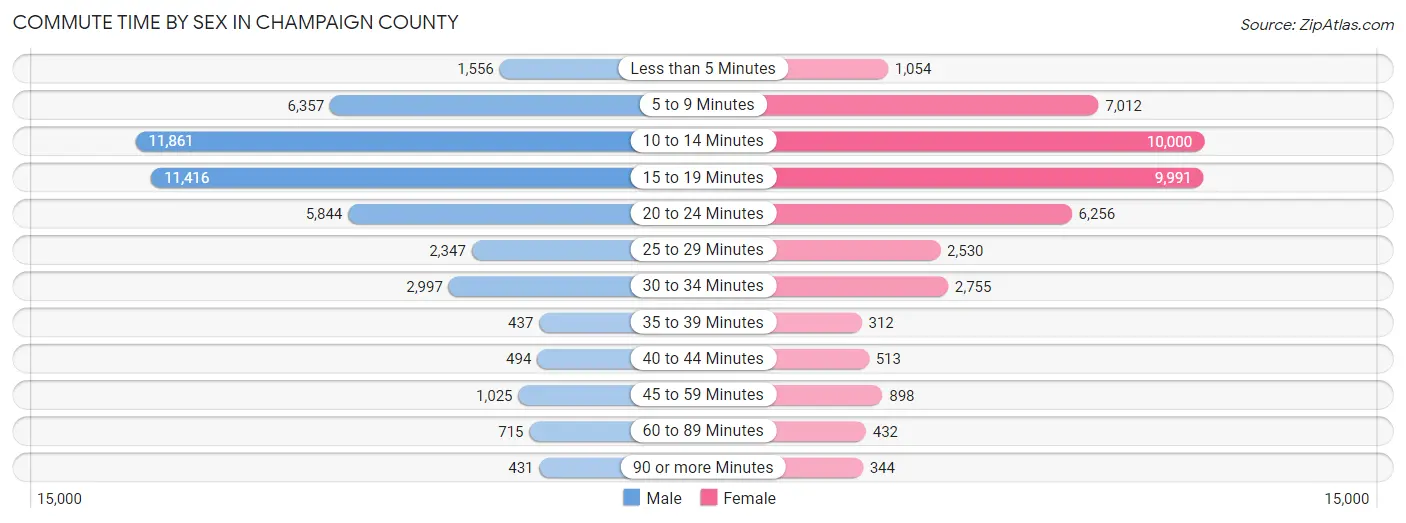
| Commute Time | Male | Female |
| Less than 5 Minutes | 1,556 (3.4%) | 1,054 (2.5%) |
| 5 to 9 Minutes | 6,357 (14.0%) | 7,012 (16.7%) |
| 10 to 14 Minutes | 11,861 (26.1%) | 10,000 (23.7%) |
| 15 to 19 Minutes | 11,416 (25.1%) | 9,991 (23.7%) |
| 20 to 24 Minutes | 5,844 (12.9%) | 6,256 (14.9%) |
| 25 to 29 Minutes | 2,347 (5.2%) | 2,530 (6.0%) |
| 30 to 34 Minutes | 2,997 (6.6%) | 2,755 (6.5%) |
| 35 to 39 Minutes | 437 (1.0%) | 312 (0.7%) |
| 40 to 44 Minutes | 494 (1.1%) | 513 (1.2%) |
| 45 to 59 Minutes | 1,025 (2.2%) | 898 (2.1%) |
| 60 to 89 Minutes | 715 (1.6%) | 432 (1.0%) |
| 90 or more Minutes | 431 (0.9%) | 344 (0.8%) |
Time of Departure to Work by Sex in Champaign County
The most frequent times of departure to work in Champaign County are 7:30 AM to 7:59 AM (6,377, 14.0%) for males and 7:30 AM to 7:59 AM (7,622, 18.1%) for females.

| Time of Departure | Male | Female |
| 12:00 AM to 4:59 AM | 1,789 (3.9%) | 746 (1.8%) |
| 5:00 AM to 5:29 AM | 850 (1.9%) | 437 (1.0%) |
| 5:30 AM to 5:59 AM | 1,758 (3.9%) | 1,377 (3.3%) |
| 6:00 AM to 6:29 AM | 2,881 (6.3%) | 2,201 (5.2%) |
| 6:30 AM to 6:59 AM | 4,818 (10.6%) | 3,710 (8.8%) |
| 7:00 AM to 7:29 AM | 5,284 (11.6%) | 5,925 (14.1%) |
| 7:30 AM to 7:59 AM | 6,377 (14.0%) | 7,622 (18.1%) |
| 8:00 AM to 8:29 AM | 5,639 (12.4%) | 5,064 (12.0%) |
| 8:30 AM to 8:59 AM | 3,277 (7.2%) | 3,306 (7.9%) |
| 9:00 AM to 9:59 AM | 3,455 (7.6%) | 3,044 (7.2%) |
| 10:00 AM to 10:59 AM | 1,751 (3.8%) | 1,638 (3.9%) |
| 11:00 AM to 11:59 AM | 670 (1.5%) | 615 (1.5%) |
| 12:00 PM to 3:59 PM | 3,323 (7.3%) | 4,097 (9.7%) |
| 4:00 PM to 11:59 PM | 3,608 (7.9%) | 2,315 (5.5%) |
| Total | 45,480 (100.0%) | 42,097 (100.0%) |
Housing Occupancy in Champaign County
Occupancy by Ownership in Champaign County
Of the total 82,467 dwellings in Champaign County, owner-occupied units account for 44,154 (53.5%), while renter-occupied units make up 38,313 (46.5%).
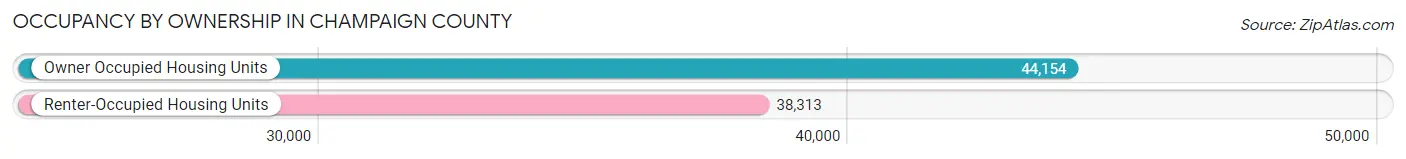
| Occupancy | # Housing Units | % Housing Units |
| Owner Occupied Housing Units | 44,154 | 53.5% |
| Renter-Occupied Housing Units | 38,313 | 46.5% |
| Total Occupied Housing Units | 82,467 | 100.0% |
Occupancy by Household Size in Champaign County
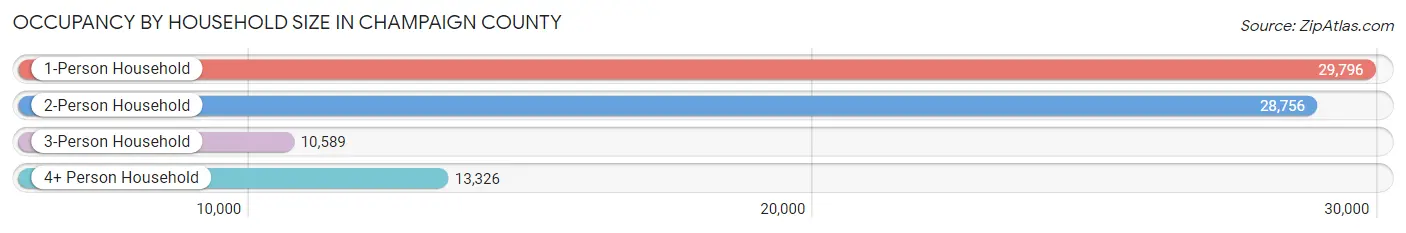
| Household Size | # Housing Units | % Housing Units |
| 1-Person Household | 29,796 | 36.1% |
| 2-Person Household | 28,756 | 34.9% |
| 3-Person Household | 10,589 | 12.8% |
| 4+ Person Household | 13,326 | 16.2% |
| Total Housing Units | 82,467 | 100.0% |
Occupancy by Ownership by Household Size in Champaign County
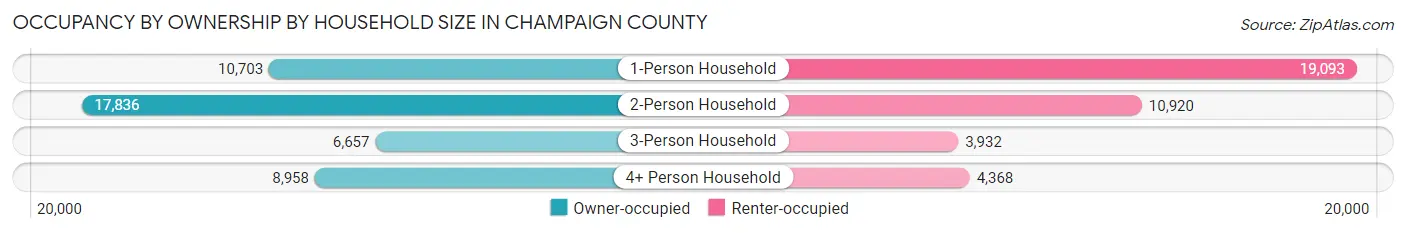
| Household Size | Owner-occupied | Renter-occupied |
| 1-Person Household | 10,703 (35.9%) | 19,093 (64.1%) |
| 2-Person Household | 17,836 (62.0%) | 10,920 (38.0%) |
| 3-Person Household | 6,657 (62.9%) | 3,932 (37.1%) |
| 4+ Person Household | 8,958 (67.2%) | 4,368 (32.8%) |
| Total Housing Units | 44,154 (53.5%) | 38,313 (46.5%) |
Occupancy by Educational Attainment in Champaign County
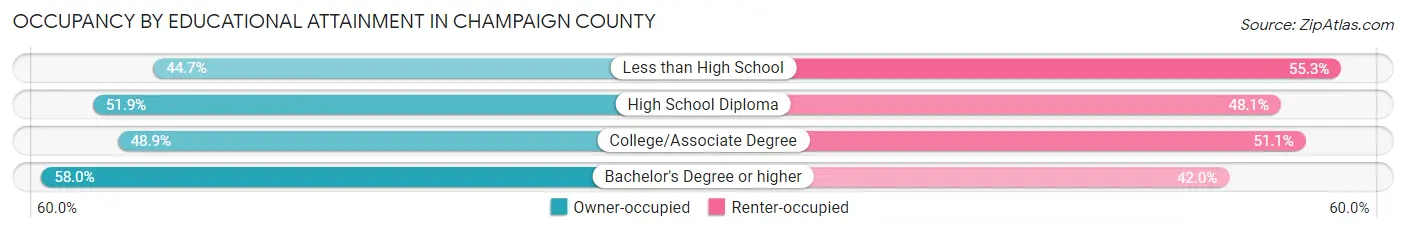
| Household Size | Owner-occupied | Renter-occupied |
| Less than High School | 1,455 (44.7%) | 1,801 (55.3%) |
| High School Diploma | 8,160 (51.9%) | 7,572 (48.1%) |
| College/Associate Degree | 12,306 (48.9%) | 12,847 (51.1%) |
| Bachelor's Degree or higher | 22,233 (58.0%) | 16,093 (42.0%) |
Occupancy by Age of Householder in Champaign County
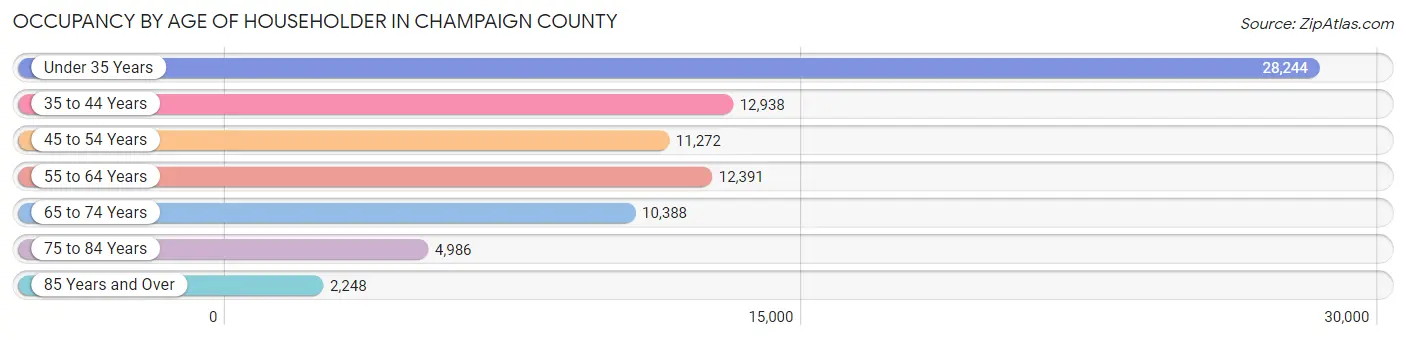
| Age Bracket | # Households | % Households |
| Under 35 Years | 28,244 | 34.3% |
| 35 to 44 Years | 12,938 | 15.7% |
| 45 to 54 Years | 11,272 | 13.7% |
| 55 to 64 Years | 12,391 | 15.0% |
| 65 to 74 Years | 10,388 | 12.6% |
| 75 to 84 Years | 4,986 | 6.0% |
| 85 Years and Over | 2,248 | 2.7% |
| Total | 82,467 | 100.0% |
Housing Finances in Champaign County
Median Income by Occupancy in Champaign County
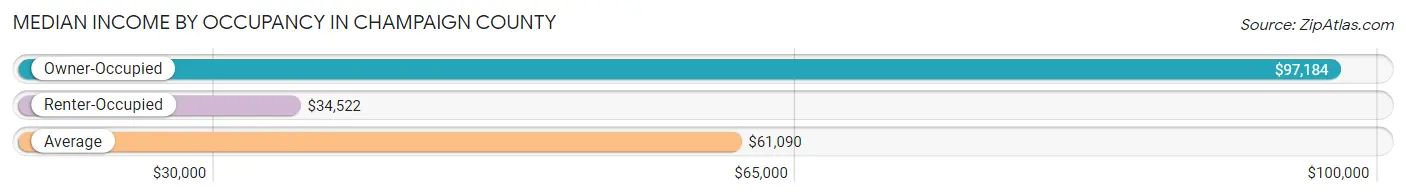
| Occupancy Type | # Households | Median Income |
| Owner-Occupied | 44,154 (53.5%) | $97,184 |
| Renter-Occupied | 38,313 (46.5%) | $34,522 |
| Average | 82,467 (100.0%) | $61,090 |
Occupancy by Householder Income Bracket in Champaign County
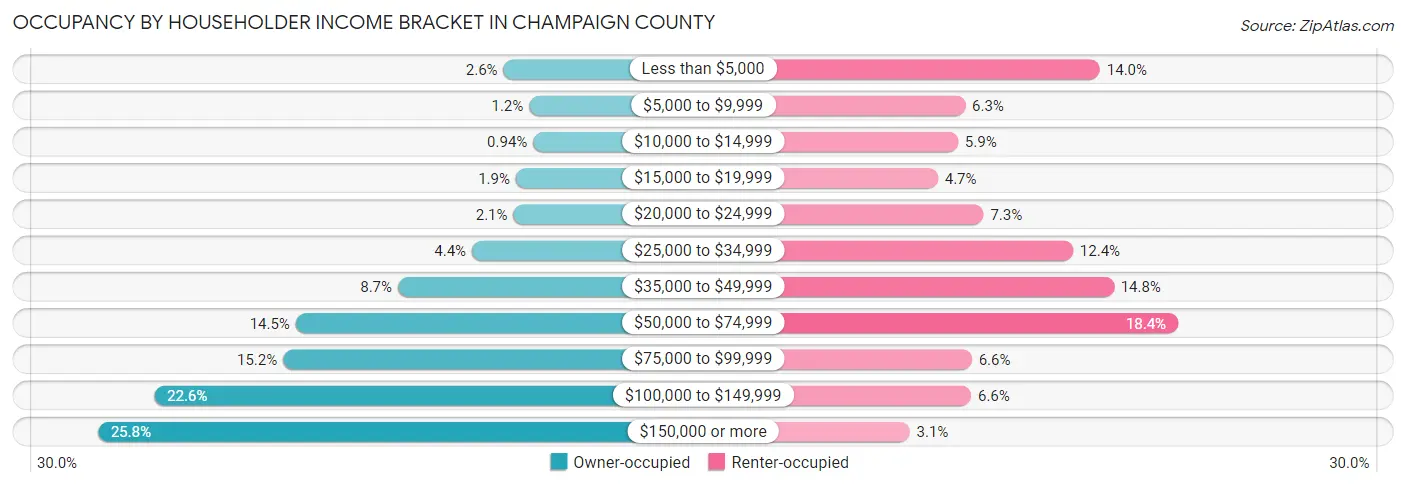
| Income Bracket | Owner-occupied | Renter-occupied |
| Less than $5,000 | 1,166 (2.6%) | 5,350 (14.0%) |
| $5,000 to $9,999 | 515 (1.2%) | 2,397 (6.3%) |
| $10,000 to $14,999 | 416 (0.9%) | 2,243 (5.9%) |
| $15,000 to $19,999 | 851 (1.9%) | 1,800 (4.7%) |
| $20,000 to $24,999 | 912 (2.1%) | 2,799 (7.3%) |
| $25,000 to $34,999 | 1,960 (4.4%) | 4,760 (12.4%) |
| $35,000 to $49,999 | 3,829 (8.7%) | 5,651 (14.7%) |
| $50,000 to $74,999 | 6,406 (14.5%) | 7,059 (18.4%) |
| $75,000 to $99,999 | 6,723 (15.2%) | 2,544 (6.6%) |
| $100,000 to $149,999 | 9,977 (22.6%) | 2,527 (6.6%) |
| $150,000 or more | 11,399 (25.8%) | 1,183 (3.1%) |
| Total | 44,154 (100.0%) | 38,313 (100.0%) |
Monthly Housing Cost Tiers in Champaign County
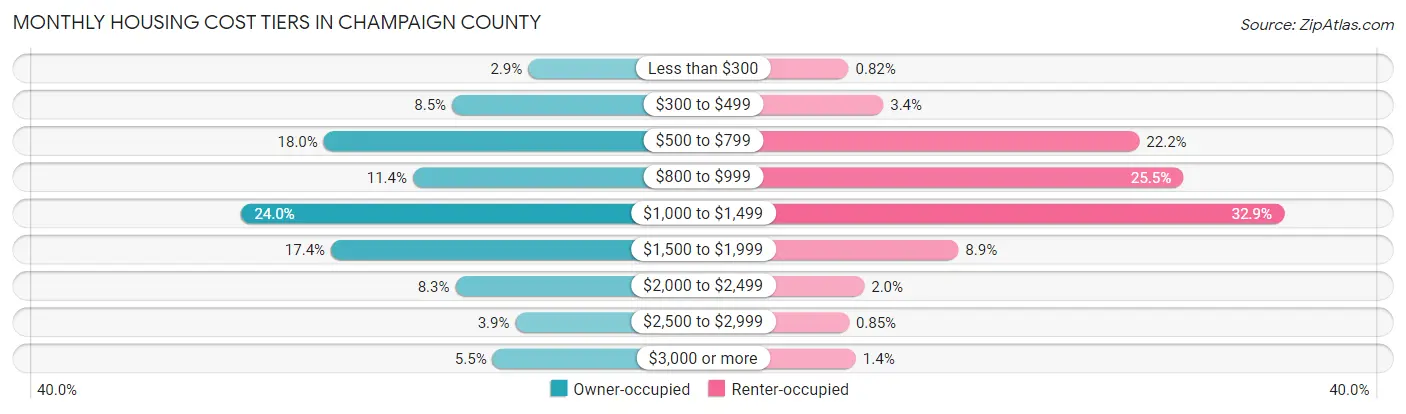
| Monthly Cost | Owner-occupied | Renter-occupied |
| Less than $300 | 1,291 (2.9%) | 314 (0.8%) |
| $300 to $499 | 3,765 (8.5%) | 1,295 (3.4%) |
| $500 to $799 | 7,940 (18.0%) | 8,521 (22.2%) |
| $800 to $999 | 5,039 (11.4%) | 9,752 (25.5%) |
| $1,000 to $1,499 | 10,611 (24.0%) | 12,595 (32.9%) |
| $1,500 to $1,999 | 7,702 (17.4%) | 3,415 (8.9%) |
| $2,000 to $2,499 | 3,654 (8.3%) | 758 (2.0%) |
| $2,500 to $2,999 | 1,704 (3.9%) | 327 (0.9%) |
| $3,000 or more | 2,448 (5.5%) | 521 (1.4%) |
| Total | 44,154 (100.0%) | 38,313 (100.0%) |
Physical Housing Characteristics in Champaign County
Housing Structures in Champaign County
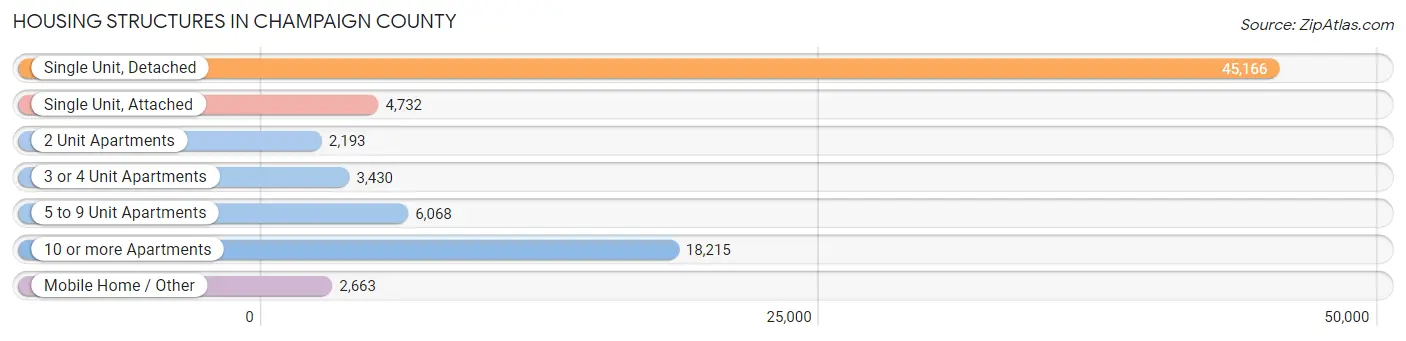
| Structure Type | # Housing Units | % Housing Units |
| Single Unit, Detached | 45,166 | 54.8% |
| Single Unit, Attached | 4,732 | 5.7% |
| 2 Unit Apartments | 2,193 | 2.7% |
| 3 or 4 Unit Apartments | 3,430 | 4.2% |
| 5 to 9 Unit Apartments | 6,068 | 7.4% |
| 10 or more Apartments | 18,215 | 22.1% |
| Mobile Home / Other | 2,663 | 3.2% |
| Total | 82,467 | 100.0% |
Housing Structures by Occupancy in Champaign County
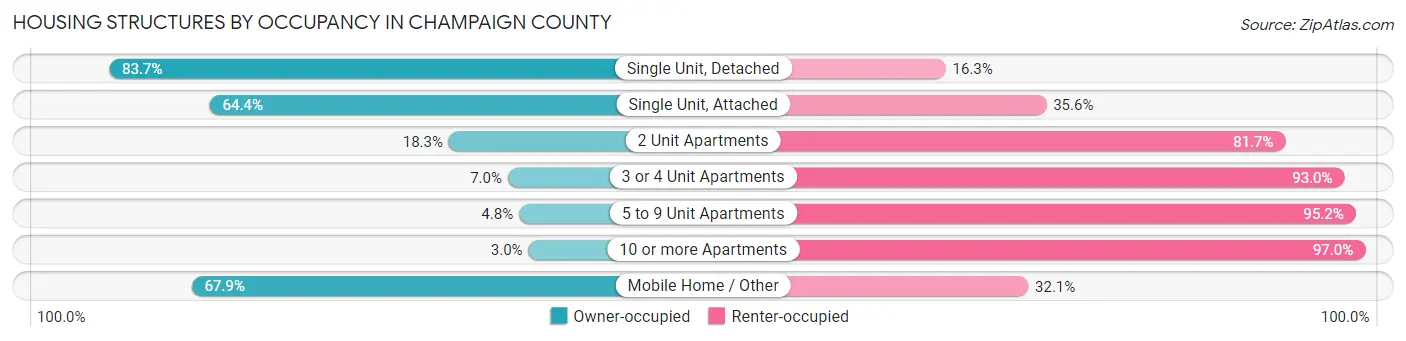
| Structure Type | Owner-occupied | Renter-occupied |
| Single Unit, Detached | 37,821 (83.7%) | 7,345 (16.3%) |
| Single Unit, Attached | 3,046 (64.4%) | 1,686 (35.6%) |
| 2 Unit Apartments | 402 (18.3%) | 1,791 (81.7%) |
| 3 or 4 Unit Apartments | 239 (7.0%) | 3,191 (93.0%) |
| 5 to 9 Unit Apartments | 292 (4.8%) | 5,776 (95.2%) |
| 10 or more Apartments | 547 (3.0%) | 17,668 (97.0%) |
| Mobile Home / Other | 1,807 (67.9%) | 856 (32.1%) |
| Total | 44,154 (53.5%) | 38,313 (46.5%) |
Housing Structures by Number of Rooms in Champaign County
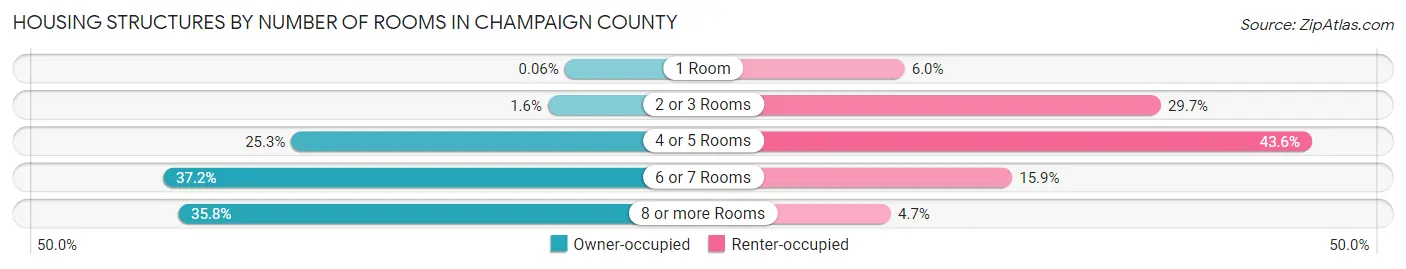
| Number of Rooms | Owner-occupied | Renter-occupied |
| 1 Room | 28 (0.1%) | 2,298 (6.0%) |
| 2 or 3 Rooms | 710 (1.6%) | 11,376 (29.7%) |
| 4 or 5 Rooms | 11,190 (25.3%) | 16,720 (43.6%) |
| 6 or 7 Rooms | 16,419 (37.2%) | 6,108 (15.9%) |
| 8 or more Rooms | 15,807 (35.8%) | 1,811 (4.7%) |
| Total | 44,154 (100.0%) | 38,313 (100.0%) |
Housing Structure by Heating Type in Champaign County
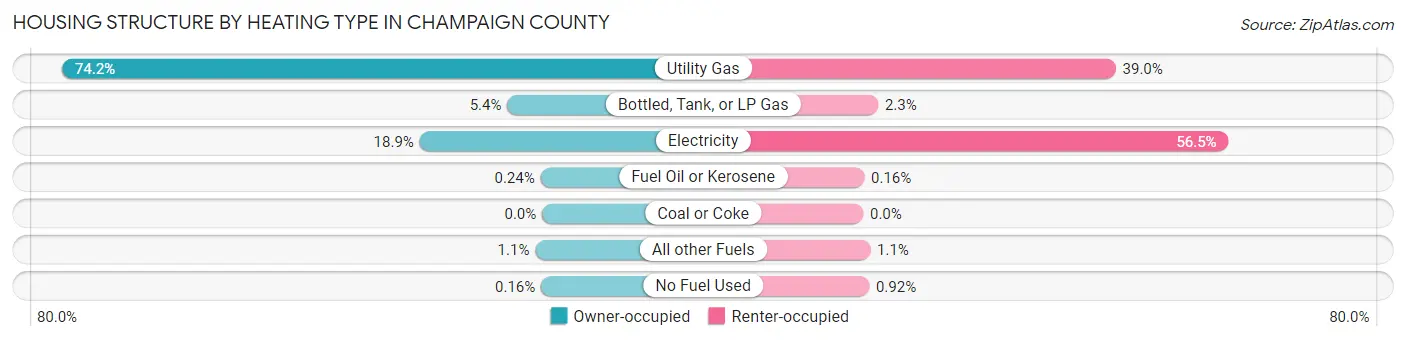
| Heating Type | Owner-occupied | Renter-occupied |
| Utility Gas | 32,776 (74.2%) | 14,957 (39.0%) |
| Bottled, Tank, or LP Gas | 2,375 (5.4%) | 884 (2.3%) |
| Electricity | 8,359 (18.9%) | 21,639 (56.5%) |
| Fuel Oil or Kerosene | 107 (0.2%) | 63 (0.2%) |
| Coal or Coke | 0 (0.0%) | 0 (0.0%) |
| All other Fuels | 467 (1.1%) | 416 (1.1%) |
| No Fuel Used | 70 (0.2%) | 354 (0.9%) |
| Total | 44,154 (100.0%) | 38,313 (100.0%) |
Household Vehicle Usage in Champaign County
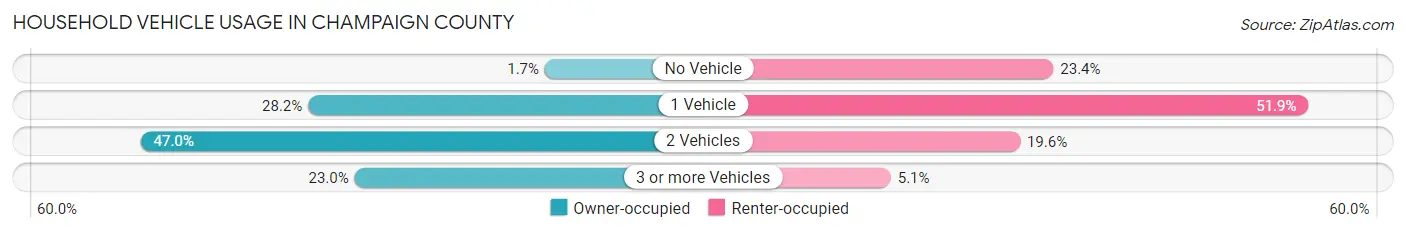
| Vehicles per Household | Owner-occupied | Renter-occupied |
| No Vehicle | 759 (1.7%) | 8,946 (23.4%) |
| 1 Vehicle | 12,470 (28.2%) | 19,886 (51.9%) |
| 2 Vehicles | 20,754 (47.0%) | 7,512 (19.6%) |
| 3 or more Vehicles | 10,171 (23.0%) | 1,969 (5.1%) |
| Total | 44,154 (100.0%) | 38,313 (100.0%) |
Real Estate & Mortgages in Champaign County
Real Estate and Mortgage Overview in Champaign County
| Characteristic | Without Mortgage | With Mortgage |
| Housing Units | 17,374 | 26,780 |
| Median Property Value | $179,700 | $198,700 |
| Median Household Income | $77,766 | $7,966 |
| Monthly Housing Costs | $669 | $2,378 |
| Real Estate Taxes | $3,857 | $352 |
Property Value by Mortgage Status in Champaign County
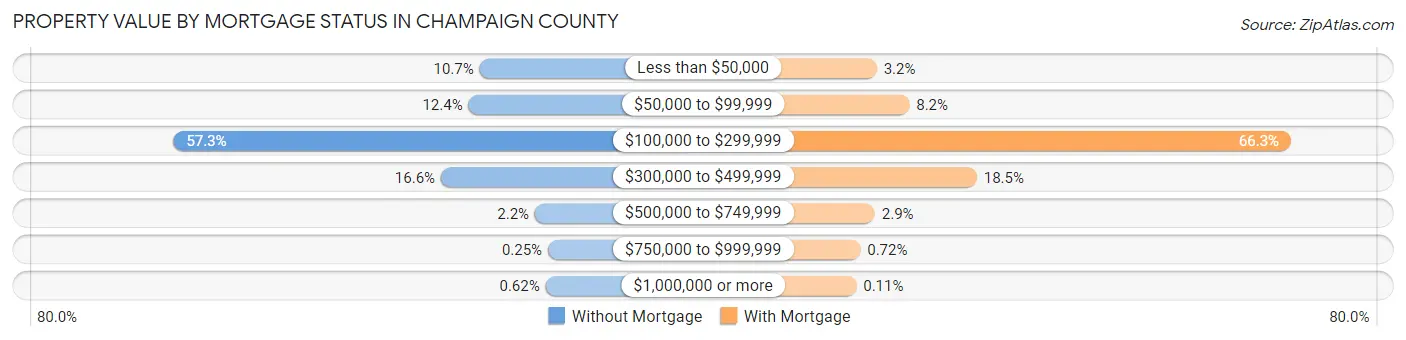
| Property Value | Without Mortgage | With Mortgage |
| Less than $50,000 | 1,853 (10.7%) | 864 (3.2%) |
| $50,000 to $99,999 | 2,147 (12.4%) | 2,193 (8.2%) |
| $100,000 to $299,999 | 9,960 (57.3%) | 17,766 (66.3%) |
| $300,000 to $499,999 | 2,877 (16.6%) | 4,949 (18.5%) |
| $500,000 to $749,999 | 387 (2.2%) | 787 (2.9%) |
| $750,000 to $999,999 | 43 (0.3%) | 192 (0.7%) |
| $1,000,000 or more | 107 (0.6%) | 29 (0.1%) |
| Total | 17,374 (100.0%) | 26,780 (100.0%) |
Household Income by Mortgage Status in Champaign County
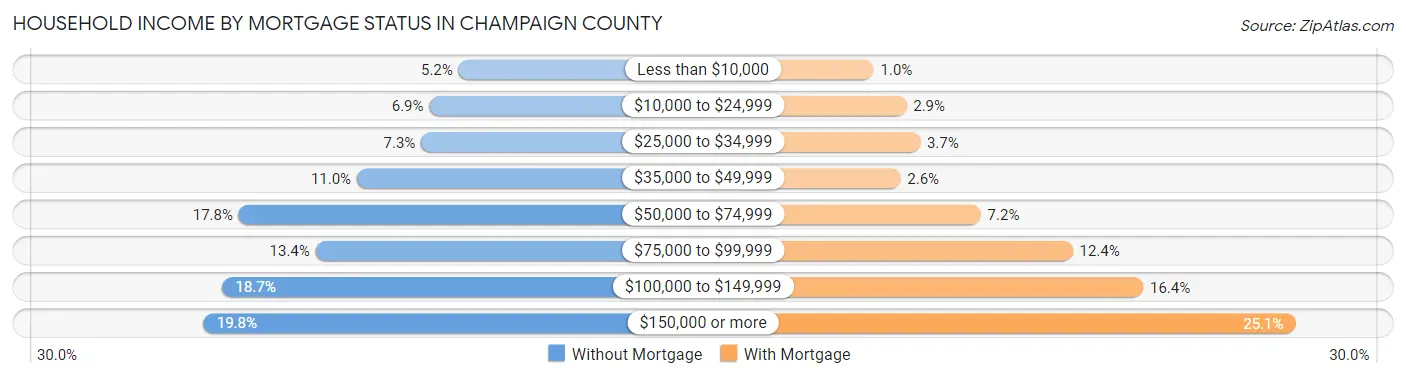
| Household Income | Without Mortgage | With Mortgage |
| Less than $10,000 | 904 (5.2%) | 276 (1.0%) |
| $10,000 to $24,999 | 1,193 (6.9%) | 777 (2.9%) |
| $25,000 to $34,999 | 1,275 (7.3%) | 986 (3.7%) |
| $35,000 to $49,999 | 1,913 (11.0%) | 685 (2.6%) |
| $50,000 to $74,999 | 3,086 (17.8%) | 1,916 (7.1%) |
| $75,000 to $99,999 | 2,323 (13.4%) | 3,320 (12.4%) |
| $100,000 to $149,999 | 3,247 (18.7%) | 4,400 (16.4%) |
| $150,000 or more | 3,433 (19.8%) | 6,730 (25.1%) |
| Total | 17,374 (100.0%) | 26,780 (100.0%) |
Property Value to Household Income Ratio in Champaign County
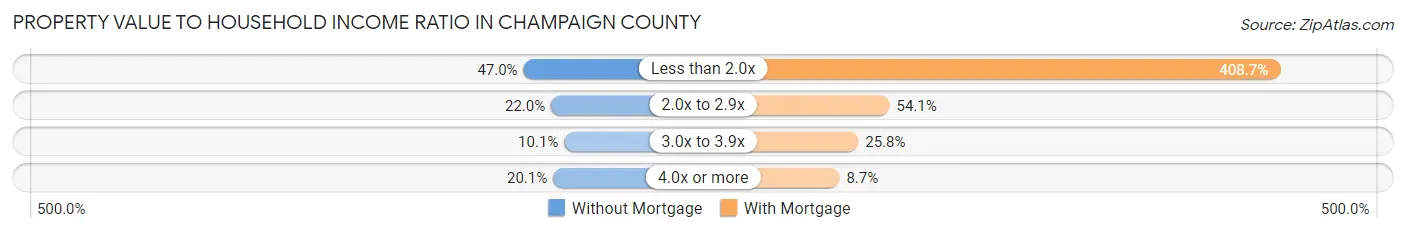
| Value-to-Income Ratio | Without Mortgage | With Mortgage |
| Less than 2.0x | 8,169 (47.0%) | 109,438 (408.7%) |
| 2.0x to 2.9x | 3,815 (22.0%) | 14,498 (54.1%) |
| 3.0x to 3.9x | 1,748 (10.1%) | 6,907 (25.8%) |
| 4.0x or more | 3,496 (20.1%) | 2,322 (8.7%) |
| Total | 17,374 (100.0%) | 26,780 (100.0%) |
Real Estate Taxes by Mortgage Status in Champaign County
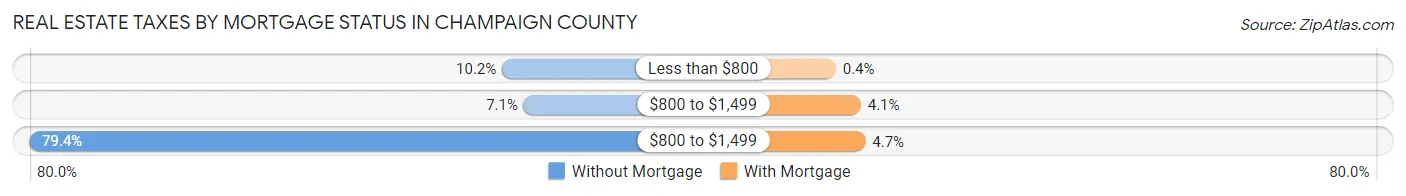
| Property Taxes | Without Mortgage | With Mortgage |
| Less than $800 | 1,778 (10.2%) | 107 (0.4%) |
| $800 to $1,499 | 1,226 (7.1%) | 1,085 (4.1%) |
| $800 to $1,499 | 13,788 (79.4%) | 1,265 (4.7%) |
| Total | 17,374 (100.0%) | 26,780 (100.0%) |
Health & Disability in Champaign County
Health Insurance Coverage by Age in Champaign County
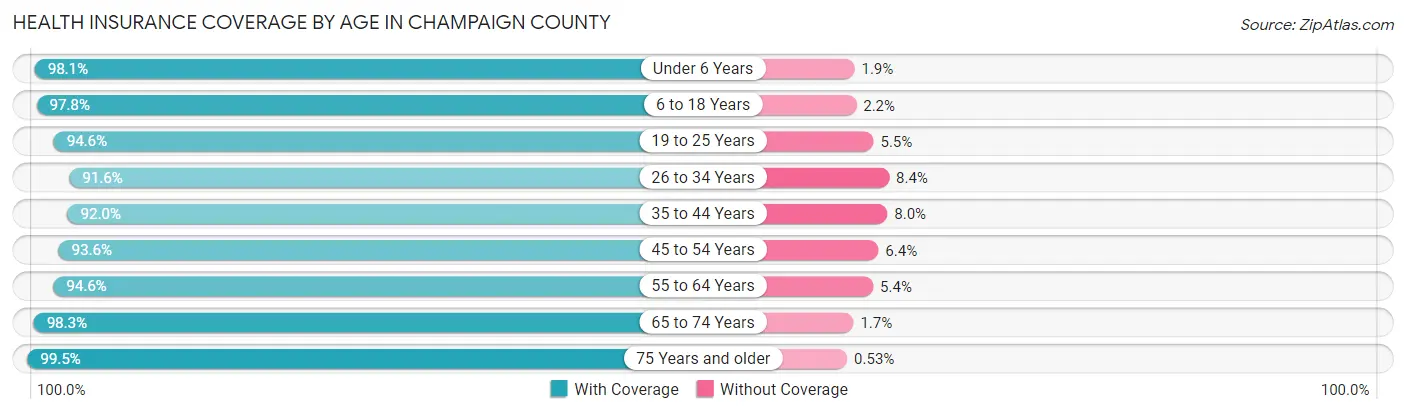
| Age Bracket | With Coverage | Without Coverage |
| Under 6 Years | 12,648 (98.1%) | 246 (1.9%) |
| 6 to 18 Years | 31,926 (97.8%) | 729 (2.2%) |
| 19 to 25 Years | 41,281 (94.6%) | 2,378 (5.4%) |
| 26 to 34 Years | 22,713 (91.6%) | 2,073 (8.4%) |
| 35 to 44 Years | 21,645 (92.0%) | 1,891 (8.0%) |
| 45 to 54 Years | 18,472 (93.6%) | 1,255 (6.4%) |
| 55 to 64 Years | 19,650 (94.6%) | 1,117 (5.4%) |
| 65 to 74 Years | 16,071 (98.3%) | 280 (1.7%) |
| 75 Years and older | 10,671 (99.5%) | 57 (0.5%) |
| Total | 195,077 (95.1%) | 10,026 (4.9%) |
Health Insurance Coverage by Citizenship Status in Champaign County
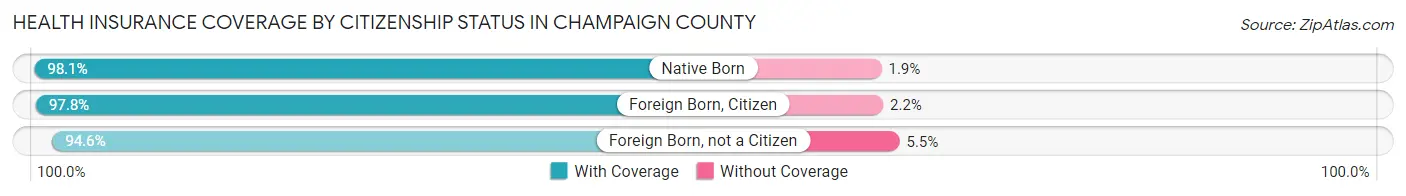
| Citizenship Status | With Coverage | Without Coverage |
| Native Born | 12,648 (98.1%) | 246 (1.9%) |
| Foreign Born, Citizen | 31,926 (97.8%) | 729 (2.2%) |
| Foreign Born, not a Citizen | 41,281 (94.6%) | 2,378 (5.4%) |
Health Insurance Coverage by Household Income in Champaign County
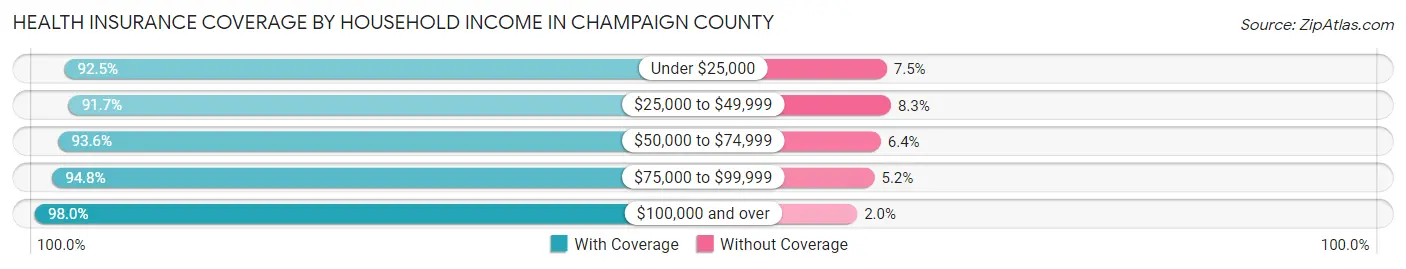
| Household Income | With Coverage | Without Coverage |
| Under $25,000 | 30,729 (92.5%) | 2,496 (7.5%) |
| $25,000 to $49,999 | 30,230 (91.7%) | 2,728 (8.3%) |
| $50,000 to $74,999 | 28,210 (93.6%) | 1,922 (6.4%) |
| $75,000 to $99,999 | 22,255 (94.8%) | 1,220 (5.2%) |
| $100,000 and over | 71,187 (98.0%) | 1,420 (2.0%) |
Public vs Private Health Insurance Coverage by Age in Champaign County
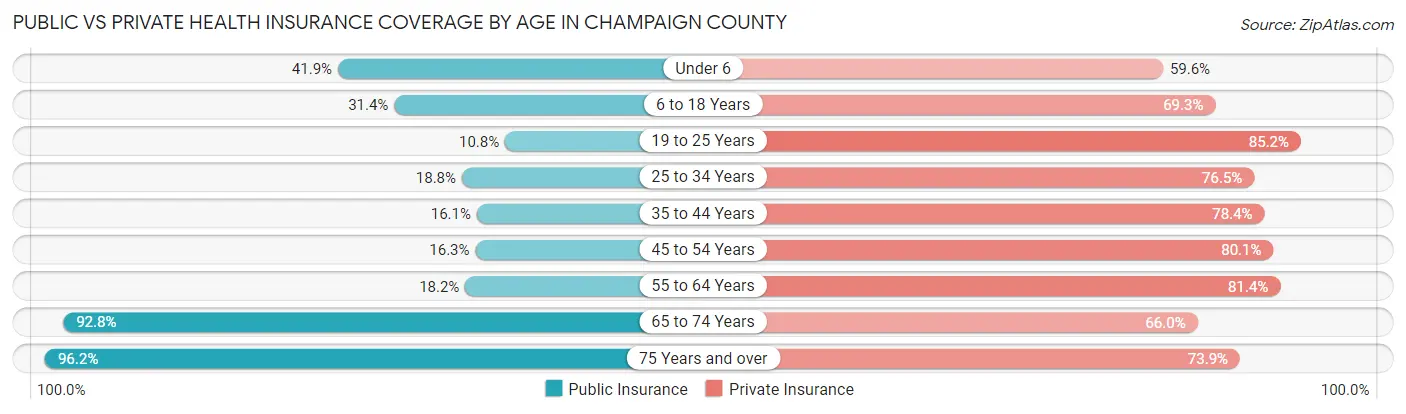
| Age Bracket | Public Insurance | Private Insurance |
| Under 6 | 5,396 (41.8%) | 7,686 (59.6%) |
| 6 to 18 Years | 10,254 (31.4%) | 22,632 (69.3%) |
| 19 to 25 Years | 4,725 (10.8%) | 37,199 (85.2%) |
| 25 to 34 Years | 4,670 (18.8%) | 18,969 (76.5%) |
| 35 to 44 Years | 3,783 (16.1%) | 18,461 (78.4%) |
| 45 to 54 Years | 3,221 (16.3%) | 15,798 (80.1%) |
| 55 to 64 Years | 3,783 (18.2%) | 16,895 (81.4%) |
| 65 to 74 Years | 15,179 (92.8%) | 10,793 (66.0%) |
| 75 Years and over | 10,321 (96.2%) | 7,927 (73.9%) |
| Total | 61,332 (29.9%) | 156,360 (76.2%) |
Disability Status by Sex by Age in Champaign County
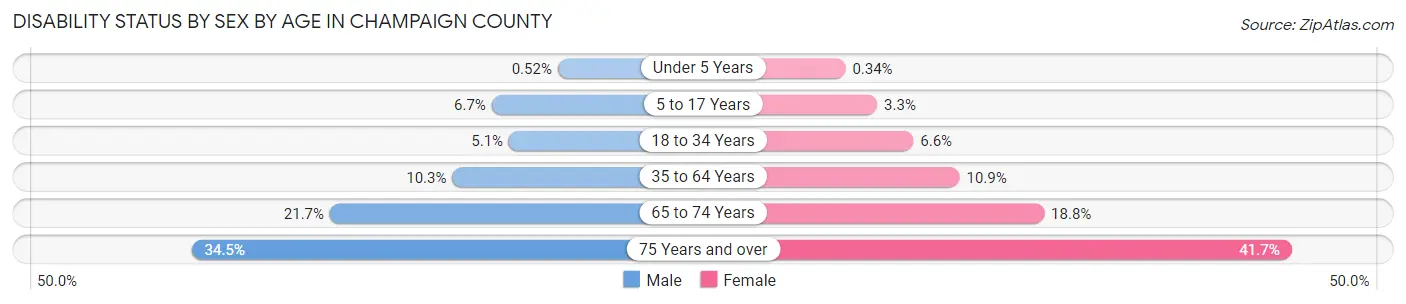
| Age Bracket | Male | Female |
| Under 5 Years | 29 (0.5%) | 18 (0.3%) |
| 5 to 17 Years | 952 (6.7%) | 447 (3.3%) |
| 18 to 34 Years | 1,965 (5.1%) | 2,408 (6.6%) |
| 35 to 64 Years | 3,252 (10.3%) | 3,549 (10.9%) |
| 65 to 74 Years | 1,658 (21.7%) | 1,634 (18.8%) |
| 75 Years and over | 1,535 (34.5%) | 2,620 (41.7%) |
Disability Class by Sex by Age in Champaign County
Disability Class: Hearing Difficulty
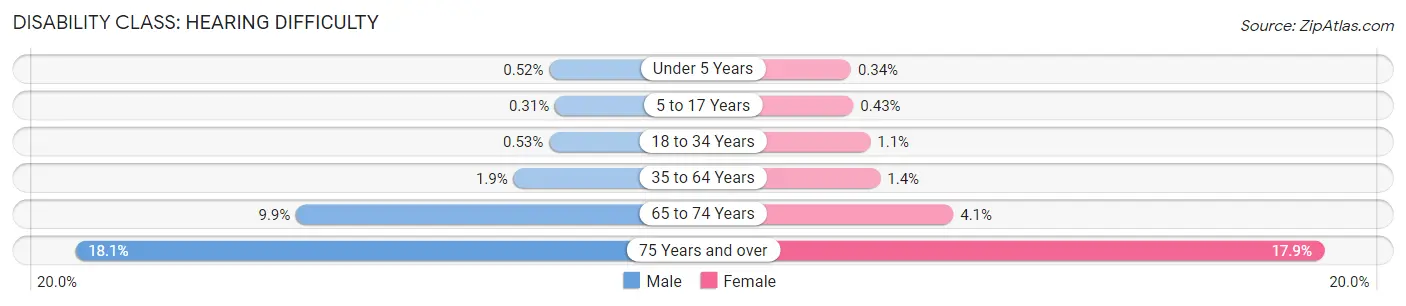
| Age Bracket | Male | Female |
| Under 5 Years | 29 (0.5%) | 18 (0.3%) |
| 5 to 17 Years | 44 (0.3%) | 59 (0.4%) |
| 18 to 34 Years | 206 (0.5%) | 385 (1.1%) |
| 35 to 64 Years | 583 (1.8%) | 466 (1.4%) |
| 65 to 74 Years | 759 (9.9%) | 360 (4.1%) |
| 75 Years and over | 806 (18.1%) | 1,123 (17.9%) |
Disability Class: Vision Difficulty
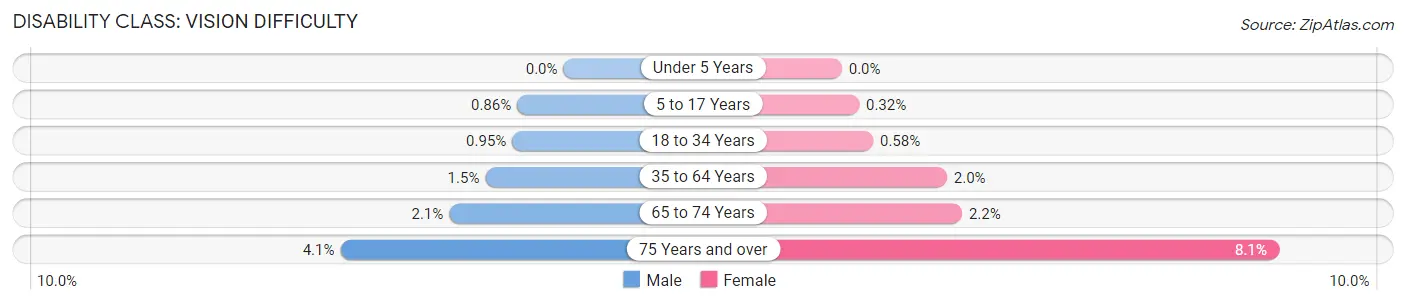
| Age Bracket | Male | Female |
| Under 5 Years | 0 (0.0%) | 0 (0.0%) |
| 5 to 17 Years | 123 (0.9%) | 44 (0.3%) |
| 18 to 34 Years | 369 (0.9%) | 210 (0.6%) |
| 35 to 64 Years | 458 (1.5%) | 633 (1.9%) |
| 65 to 74 Years | 162 (2.1%) | 194 (2.2%) |
| 75 Years and over | 184 (4.1%) | 509 (8.1%) |
Disability Class: Cognitive Difficulty
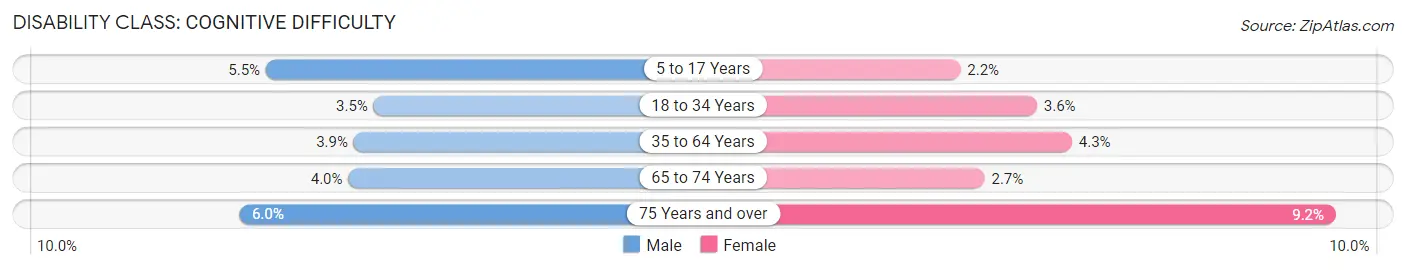
| Age Bracket | Male | Female |
| 5 to 17 Years | 791 (5.5%) | 300 (2.2%) |
| 18 to 34 Years | 1,372 (3.5%) | 1,314 (3.6%) |
| 35 to 64 Years | 1,228 (3.9%) | 1,386 (4.3%) |
| 65 to 74 Years | 305 (4.0%) | 231 (2.6%) |
| 75 Years and over | 268 (6.0%) | 576 (9.2%) |
Disability Class: Ambulatory Difficulty
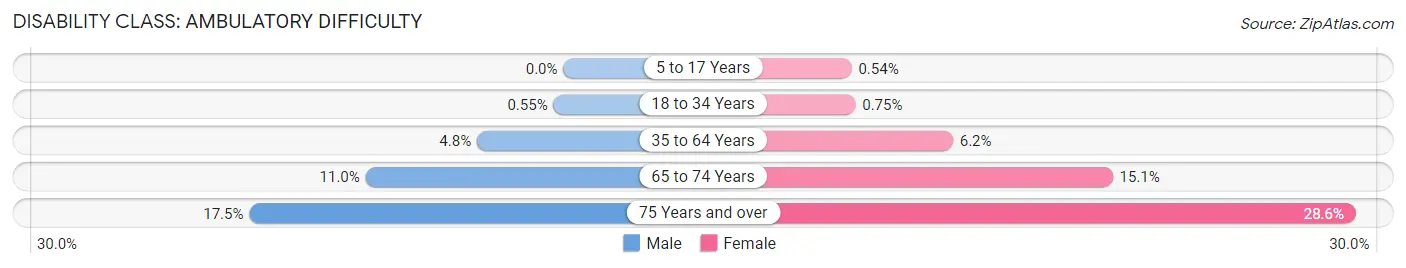
| Age Bracket | Male | Female |
| 5 to 17 Years | 0 (0.0%) | 74 (0.5%) |
| 18 to 34 Years | 214 (0.5%) | 272 (0.7%) |
| 35 to 64 Years | 1,517 (4.8%) | 2,006 (6.2%) |
| 65 to 74 Years | 842 (11.0%) | 1,312 (15.1%) |
| 75 Years and over | 778 (17.5%) | 1,797 (28.6%) |
Disability Class: Self-Care Difficulty
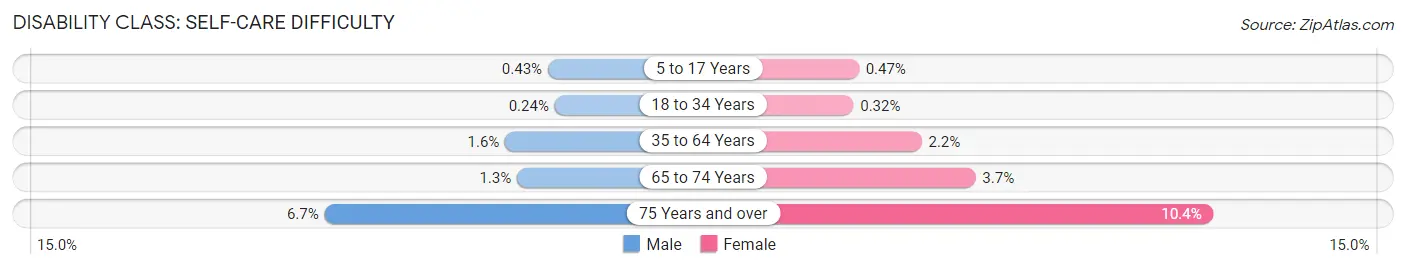
| Age Bracket | Male | Female |
| 5 to 17 Years | 62 (0.4%) | 64 (0.5%) |
| 18 to 34 Years | 94 (0.2%) | 116 (0.3%) |
| 35 to 64 Years | 510 (1.6%) | 722 (2.2%) |
| 65 to 74 Years | 99 (1.3%) | 324 (3.7%) |
| 75 Years and over | 296 (6.7%) | 650 (10.3%) |
Technology Access in Champaign County
Computing Device Access in Champaign County
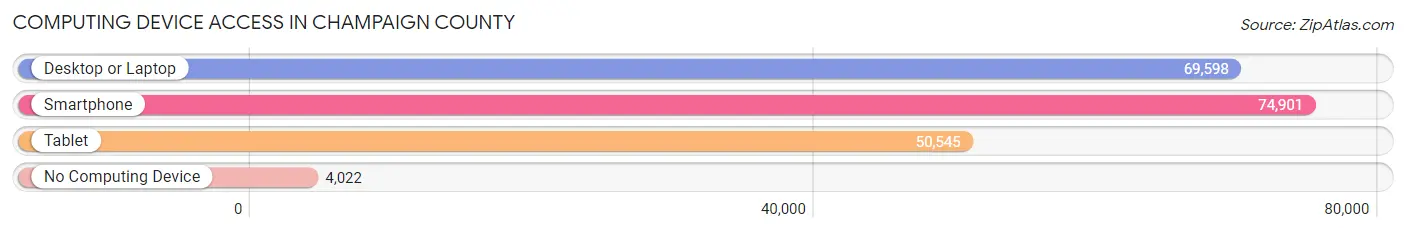
| Device Type | # Households | % Households |
| Desktop or Laptop | 69,598 | 84.4% |
| Smartphone | 74,901 | 90.8% |
| Tablet | 50,545 | 61.3% |
| No Computing Device | 4,022 | 4.9% |
| Total | 82,467 | 100.0% |
Internet Access in Champaign County
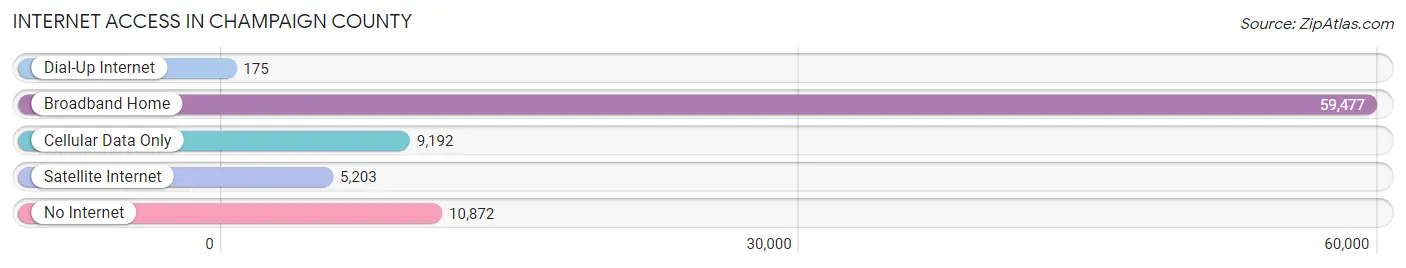
| Internet Type | # Households | % Households |
| Dial-Up Internet | 175 | 0.2% |
| Broadband Home | 59,477 | 72.1% |
| Cellular Data Only | 9,192 | 11.2% |
| Satellite Internet | 5,203 | 6.3% |
| No Internet | 10,872 | 13.2% |
| Total | 82,467 | 100.0% |
Champaign County Summary
Champaign County, Illinois is located in the east-central part of the state, about 135 miles south of Chicago. It is part of the Champaign-Urbana metropolitan area, which is home to the University of Illinois at Urbana-Champaign. The county has a population of 201,081, according to the 2019 U.S. Census.
History
The area that is now Champaign County was first settled in 1822 by William and Ann Busey, who were among the first settlers in the area. The county was officially established in 1833 and was named after the city of Champaign, which was named after the French word for “open field.”
The county was an important agricultural center in the 19th century, and the area was known for its production of corn, wheat, and other grains. The county was also home to several coal mines, which provided employment for many of the area’s residents.
In the early 20th century, the county experienced a period of rapid growth, as the University of Illinois at Urbana-Champaign was established in the area. This led to an influx of students and faculty, as well as businesses and industries that catered to the university.
Geography
Champaign County is located in east-central Illinois, about 135 miles south of Chicago. It is bordered by Vermilion County to the north, Douglas County to the east, Piatt County to the south, and Macon County to the west. The county covers an area of 845 square miles, and is home to several small towns and villages, including Champaign, Urbana, Mahomet, Rantoul, and St. Joseph.
The county is located in the Central Till Plains region of Illinois, and is characterized by flat terrain and fertile soil. The county is drained by the Sangamon River, which flows through the county from north to south.
Economy
The economy of Champaign County is largely driven by the University of Illinois at Urbana-Champaign, which is the largest employer in the county. Other major employers in the county include Carle Foundation Hospital, Kraft Foods, and the Champaign-Urbana Mass Transit District.
The county is also home to several large agricultural operations, including the University of Illinois Research and Education Center, which is one of the largest agricultural research centers in the United States. The county is also home to several manufacturing companies, including the Mitsubishi Motors plant in Normal.
Demographics
According to the 2019 U.S. Census, the population of Champaign County was 201,081. The population is fairly diverse, with the largest racial/ethnic groups being White (77.2%), Black or African American (10.2%), Asian (5.2%), and Hispanic or Latino (5.1%).
The median household income in the county is $60,945, and the median home value is $179,400. The unemployment rate in the county is 3.3%, which is lower than the national average of 3.7%.
Conclusion
Champaign County, Illinois is a vibrant and diverse county located in east-central Illinois. The county is home to the University of Illinois at Urbana-Champaign, which is the largest employer in the county. The county is also home to several large agricultural operations, as well as several manufacturing companies. The population of the county is diverse, with the largest racial/ethnic groups being White, Black or African American, Asian, and Hispanic or Latino. The median household income in the county is $60,945, and the median home value is $179,400.
Common Questions
What is the Total Population of Champaign County?
Total Population of Champaign County is 206,525.
What is the Total Male Population of Champaign County?
Total Male Population of Champaign County is 103,245.
What is the Total Female Population of Champaign County?
Total Female Population of Champaign County is 103,280.
What is the Ratio of Males per 100 Females in Champaign County?
There are 99.97 Males per 100 Females in Champaign County.
What is the Ratio of Females per 100 Males in Champaign County?
There are 100.03 Females per 100 Males in Champaign County.
What is the Median Population Age in Champaign County?
Median Population Age in Champaign County is 30.8 Years.
What is the Average Family Size in Champaign County
Average Family Size in Champaign County is 3.1 People.
What is the Average Household Size in Champaign County
Average Household Size in Champaign County is 2.3 People.
What is Per Capita Income in Champaign County?
Per Capita income in Champaign County is $35,810.
What is the Median Family Income in Champaign County?
Median Family Income in Champaign County is $94,792.
What is the Median Household income in Champaign County?
Median Household Income in Champaign County is $61,090.
What is Income or Wage Gap in Champaign County?
Income or Wage Gap in Champaign County is 20.3%.
Women in Champaign County earn 79.7 cents for every dollar earned by a man.
What is Family Income Deficit in Champaign County?
Family Income Deficit in Champaign County is $10,868.
Families that are below poverty line in Champaign County earn $10,868 less on average than the poverty threshold level.
What is Inequality or Gini Index in Champaign County?
Inequality or Gini Index in Champaign County is 0.50.
How Large is the Labor Force in Champaign County?
There are 106,276 People in the Labor Forcein in Champaign County.
What is the Percentage of People in the Labor Force in Champaign County?
61.8% of People are in the Labor Force in Champaign County.
What is the Unemployment Rate in Champaign County?
Unemployment Rate in Champaign County is 4.8%.