Cass County, IL
Cass County Map
Cass County Overview
12,955
TOTAL POPULATION
6,557
MALE POPULATION
6,398
FEMALE POPULATION
102.49
MALES / 100 FEMALES
97.58
FEMALES / 100 MALES
38.8
MEDIAN AGE
3.2
AVG FAMILY SIZE
2.6
AVG HOUSEHOLD SIZE
$29,842
PER CAPITA INCOME
$75,790
AVG FAMILY INCOME
$64,826
AVG HOUSEHOLD INCOME
31.5%
WAGE / INCOME GAP [ % ]
68.5¢/ $1
WAGE / INCOME GAP [ $ ]
$10,776
FAMILY INCOME DEFICIT
0.40
INEQUALITY / GINI INDEX
6,235
LABOR FORCE [ PEOPLE ]
61.2%
PERCENT IN LABOR FORCE
5.4%
UNEMPLOYMENT RATE
Cass County Area Codes
Race in Cass County
The most populous races in Cass County are White / Caucasian (10,644 | 82.2%), Hispanic or Latino (2,636 | 20.3%), and Two or more Races (859 | 6.6%).

| Race | # Population | % Population |
| Asian | 98 | 0.8% |
| Black / African American | 467 | 3.6% |
| Hawaiian / Pacific | 101 | 0.8% |
| Hispanic or Latino | 2,636 | 20.3% |
| Native / Alaskan | 119 | 0.9% |
| White / Caucasian | 10,644 | 82.2% |
| Two or more Races | 859 | 6.6% |
| Some other Race | 667 | 5.1% |
| Total | 12,955 | 100.0% |
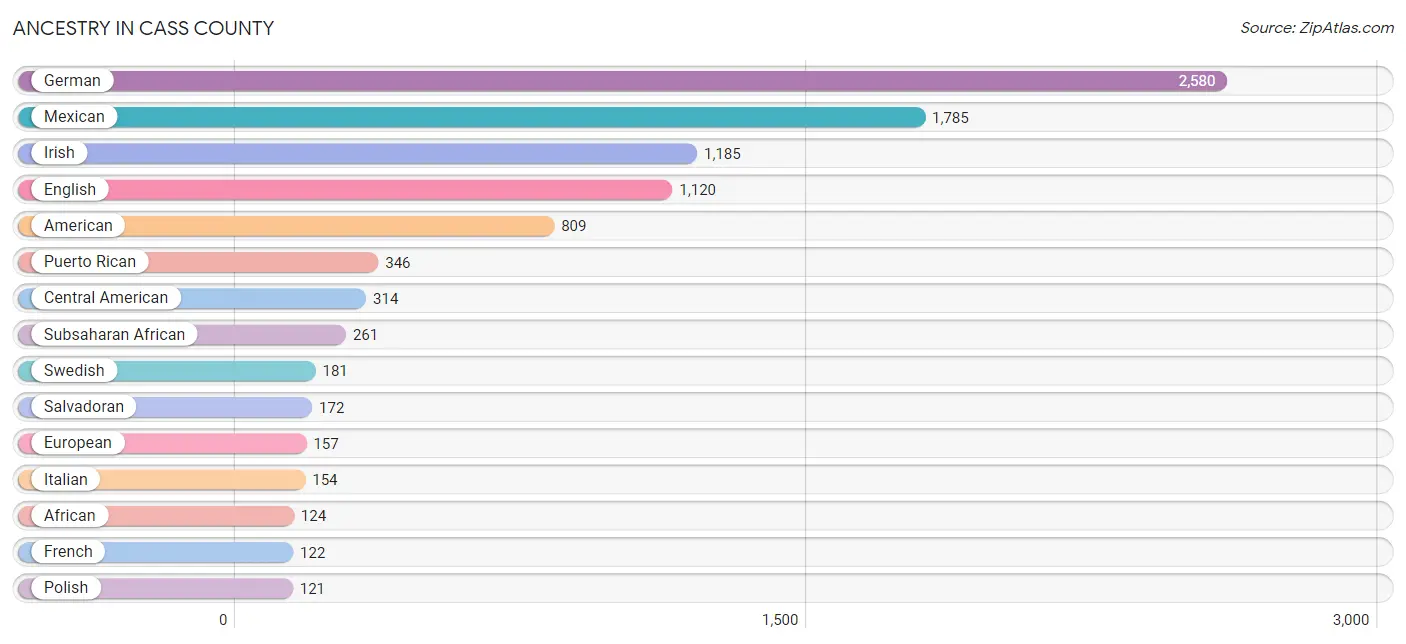
Ancestry in Cass County
The most populous ancestries reported in Cass County are German (2,580 | 19.9%), Mexican (1,785 | 13.8%), Irish (1,185 | 9.1%), English (1,120 | 8.6%), and American (809 | 6.2%), together accounting for 57.7% of all Cass County residents.
| Ancestry | # Population | % Population |
| African | 124 | 1.0% |
| American | 809 | 6.2% |
| Armenian | 2 | 0.0% |
| Austrian | 16 | 0.1% |
| Belgian | 27 | 0.2% |
| Blackfeet | 4 | 0.0% |
| British | 11 | 0.1% |
| Central American | 314 | 2.4% |
| Central American Indian | 4 | 0.0% |
| Cherokee | 17 | 0.1% |
| Chippewa | 2 | 0.0% |
| Colombian | 6 | 0.1% |
| Croatian | 3 | 0.0% |
| Cuban | 112 | 0.9% |
| Czech | 2 | 0.0% |
| Danish | 11 | 0.1% |
| Dominican | 46 | 0.4% |
| Dutch | 62 | 0.5% |
| English | 1,120 | 8.6% |
| European | 157 | 1.2% |
| French | 122 | 0.9% |
| French Canadian | 7 | 0.1% |
| German | 2,580 | 19.9% |
| Guatemalan | 77 | 0.6% |
| Indian (Asian) | 21 | 0.2% |
| Indonesian | 46 | 0.4% |
| Irish | 1,185 | 9.1% |
| Iroquois | 6 | 0.1% |
| Italian | 154 | 1.2% |
| Korean | 63 | 0.5% |
| Lithuanian | 16 | 0.1% |
| Mexican | 1,785 | 13.8% |
| Mexican American Indian | 96 | 0.7% |
| Native Hawaiian | 104 | 0.8% |
| Northern European | 4 | 0.0% |
| Norwegian | 19 | 0.2% |
| Panamanian | 65 | 0.5% |
| Polish | 121 | 0.9% |
| Portuguese | 81 | 0.6% |
| Pueblo | 5 | 0.0% |
| Puerto Rican | 346 | 2.7% |
| Salvadoran | 172 | 1.3% |
| Scandinavian | 16 | 0.1% |
| Scotch-Irish | 22 | 0.2% |
| Scottish | 98 | 0.8% |
| South American | 33 | 0.3% |
| Subsaharan African | 261 | 2.0% |
| Swedish | 181 | 1.4% |
| Swiss | 48 | 0.4% |
| Trinidadian and Tobagonian | 2 | 0.0% |
| Uruguayan | 27 | 0.2% |
| Welsh | 7 | 0.1% | View All 52 Rows |
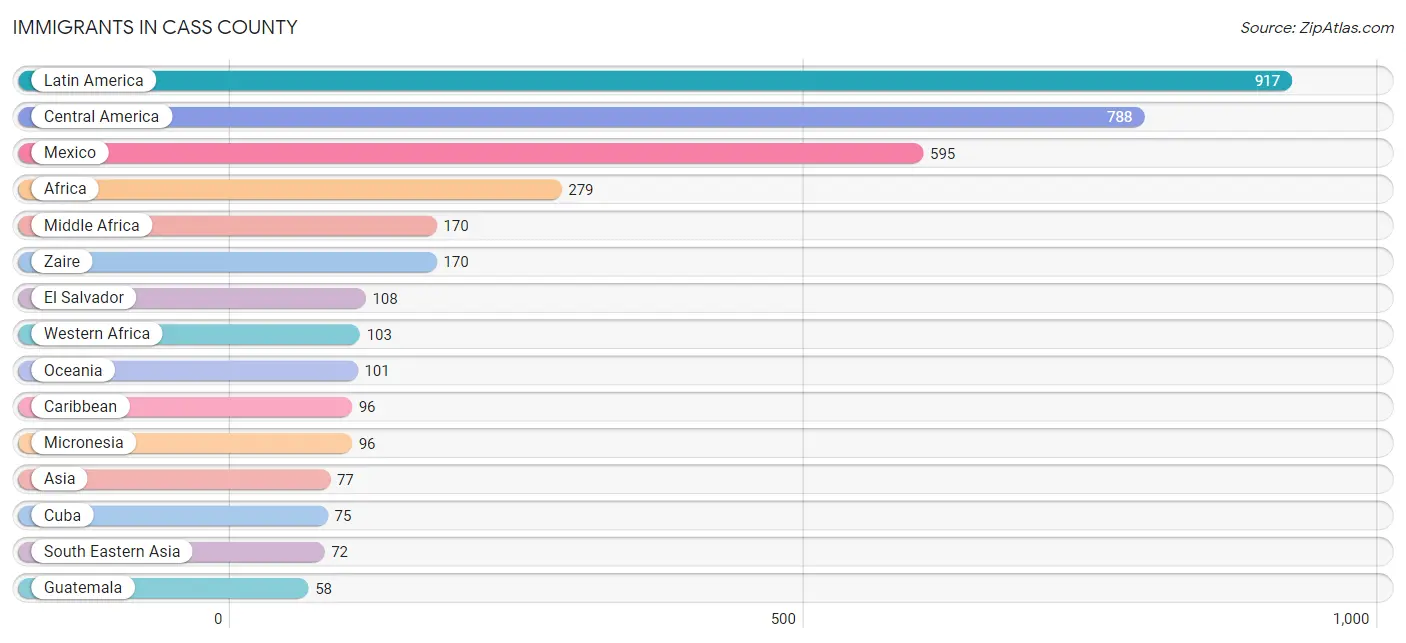
Immigrants in Cass County
The most numerous immigrant groups reported in Cass County came from Latin America (917 | 7.1%), Central America (788 | 6.1%), Mexico (595 | 4.6%), Africa (279 | 2.1%), and Middle Africa (170 | 1.3%), together accounting for 21.2% of all Cass County residents.
| Immigration Origin | # Population | % Population |
| Africa | 279 | 2.1% |
| Asia | 77 | 0.6% |
| Caribbean | 96 | 0.7% |
| Central America | 788 | 6.1% |
| Colombia | 6 | 0.1% |
| Cuba | 75 | 0.6% |
| Dominican Republic | 21 | 0.2% |
| Eastern Asia | 5 | 0.0% |
| El Salvador | 108 | 0.8% |
| England | 5 | 0.0% |
| Europe | 5 | 0.0% |
| Guatemala | 58 | 0.4% |
| Korea | 5 | 0.0% |
| Latin America | 917 | 7.1% |
| Mexico | 595 | 4.6% |
| Micronesia | 96 | 0.7% |
| Middle Africa | 170 | 1.3% |
| Northern Europe | 5 | 0.0% |
| Oceania | 101 | 0.8% |
| Panama | 27 | 0.2% |
| Philippines | 31 | 0.2% |
| Senegal | 55 | 0.4% |
| Sierra Leone | 5 | 0.0% |
| South America | 33 | 0.3% |
| South Eastern Asia | 72 | 0.6% |
| Uruguay | 27 | 0.2% |
| Western Africa | 103 | 0.8% |
| Zaire | 170 | 1.3% | View All 28 Rows |
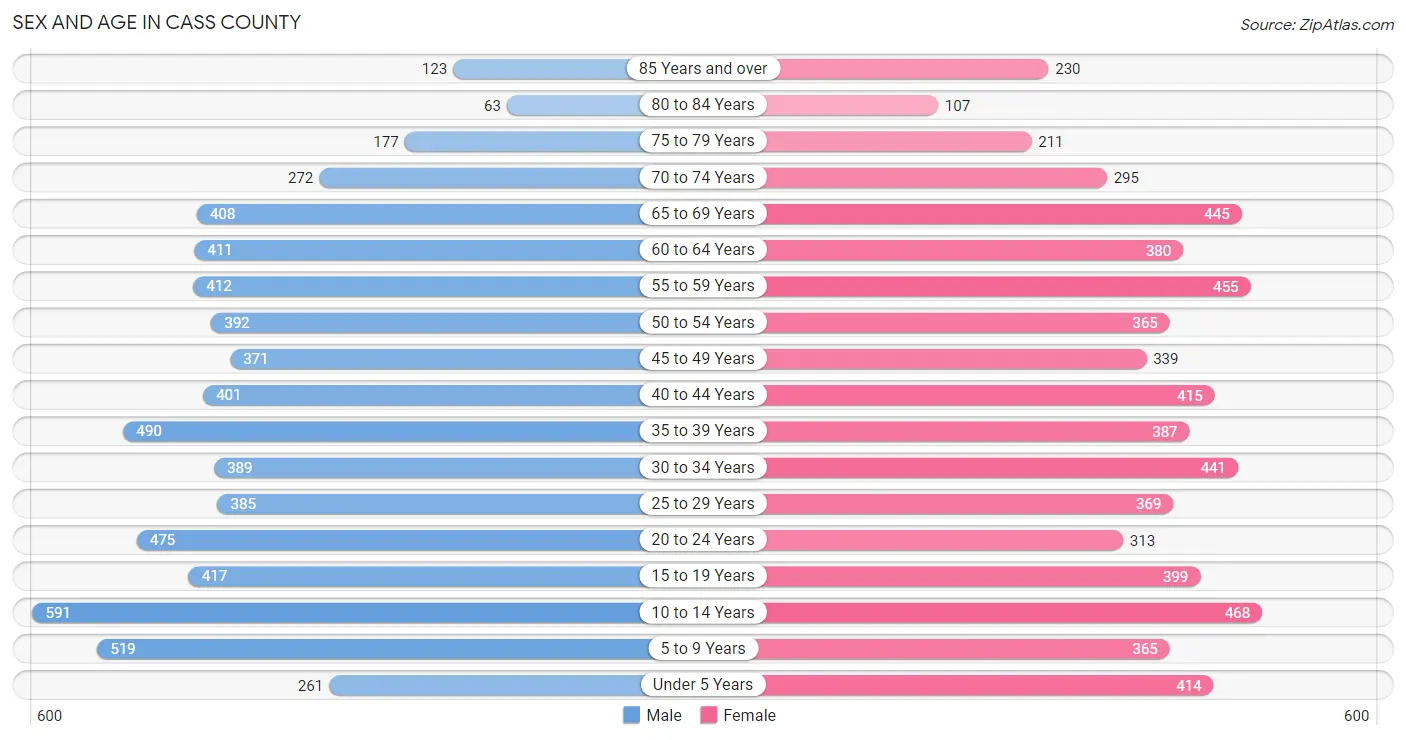
Sex and Age in Cass County
Sex and Age in Cass County
The most populous age groups in Cass County are 10 to 14 Years (591 | 9.0%) for men and 10 to 14 Years (468 | 7.3%) for women.
| Age Bracket | Male | Female |
| Under 5 Years | 261 (4.0%) | 414 (6.5%) |
| 5 to 9 Years | 519 (7.9%) | 365 (5.7%) |
| 10 to 14 Years | 591 (9.0%) | 468 (7.3%) |
| 15 to 19 Years | 417 (6.4%) | 399 (6.2%) |
| 20 to 24 Years | 475 (7.2%) | 313 (4.9%) |
| 25 to 29 Years | 385 (5.9%) | 369 (5.8%) |
| 30 to 34 Years | 389 (5.9%) | 441 (6.9%) |
| 35 to 39 Years | 490 (7.5%) | 387 (6.0%) |
| 40 to 44 Years | 401 (6.1%) | 415 (6.5%) |
| 45 to 49 Years | 371 (5.7%) | 339 (5.3%) |
| 50 to 54 Years | 392 (6.0%) | 365 (5.7%) |
| 55 to 59 Years | 412 (6.3%) | 455 (7.1%) |
| 60 to 64 Years | 411 (6.3%) | 380 (5.9%) |
| 65 to 69 Years | 408 (6.2%) | 445 (7.0%) |
| 70 to 74 Years | 272 (4.2%) | 295 (4.6%) |
| 75 to 79 Years | 177 (2.7%) | 211 (3.3%) |
| 80 to 84 Years | 63 (1.0%) | 107 (1.7%) |
| 85 Years and over | 123 (1.9%) | 230 (3.6%) |
| Total | 6,557 (100.0%) | 6,398 (100.0%) |
Families and Households in Cass County
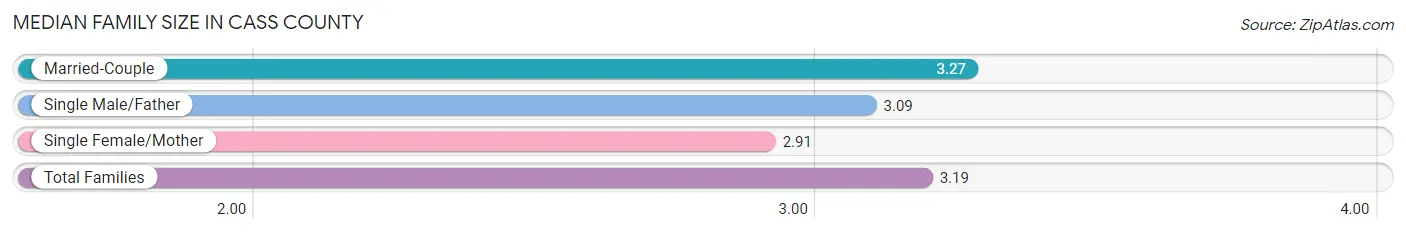
Median Family Size in Cass County
The median family size in Cass County is 3.19 persons per family, with married-couple families (2,456 | 74.7%) accounting for the largest median family size of 3.27 persons per family. On the other hand, single female/mother families (562 | 17.1%) represent the smallest median family size with 2.91 persons per family.
| Family Type | # Families | Family Size |
| Married-Couple | 2,456 (74.7%) | 3.27 |
| Single Male/Father | 269 (8.2%) | 3.09 |
| Single Female/Mother | 562 (17.1%) | 2.91 |
| Total Families | 3,287 (100.0%) | 3.19 |
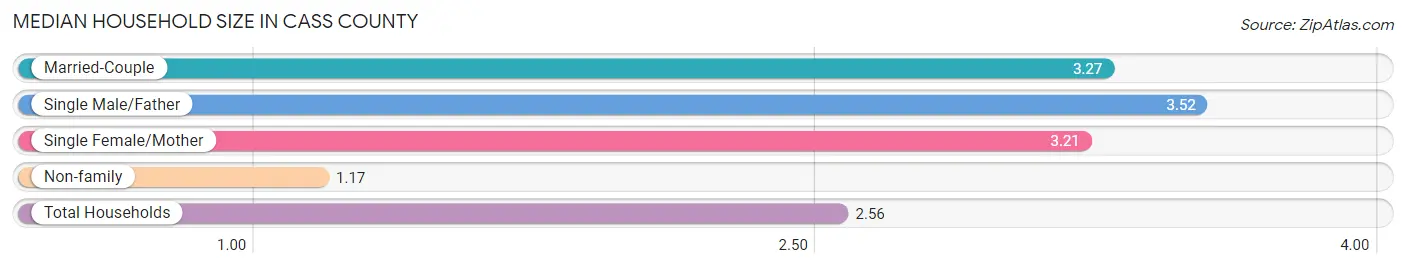
Median Household Size in Cass County
The median household size in Cass County is 2.56 persons per household, with single male/father households (269 | 5.4%) accounting for the largest median household size of 3.52 persons per household. non-family households (1,717 | 34.3%) represent the smallest median household size with 1.17 persons per household.
| Household Type | # Households | Household Size |
| Married-Couple | 2,456 (49.1%) | 3.27 |
| Single Male/Father | 269 (5.4%) | 3.52 |
| Single Female/Mother | 562 (11.2%) | 3.21 |
| Non-family | 1,717 (34.3%) | 1.17 |
| Total Households | 5,004 (100.0%) | 2.56 |
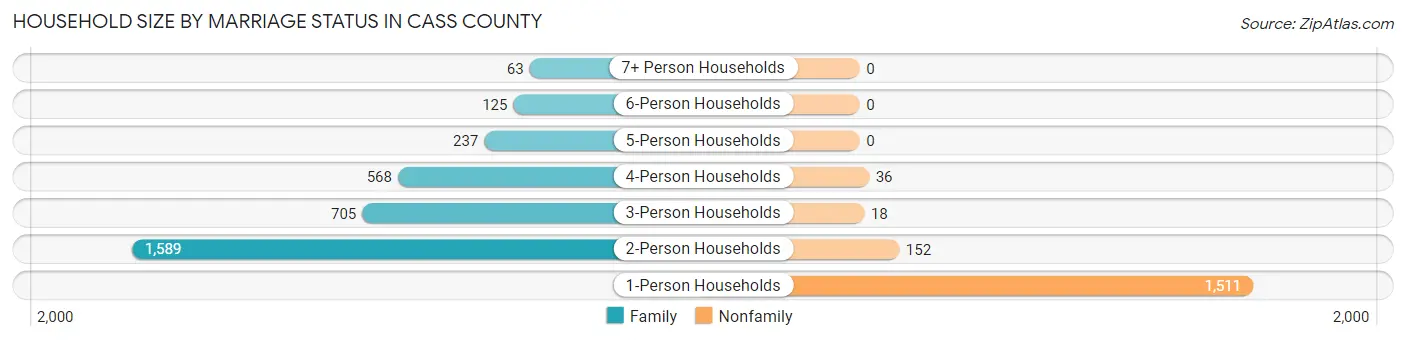
Household Size by Marriage Status in Cass County
Out of a total of 5,004 households in Cass County, 3,287 (65.7%) are family households, while 1,717 (34.3%) are nonfamily households. The most numerous type of family households are 2-person households, comprising 1,589, and the most common type of nonfamily households are 1-person households, comprising 1,511.
| Household Size | Family Households | Nonfamily Households |
| 1-Person Households | - | 1,511 (30.2%) |
| 2-Person Households | 1,589 (31.8%) | 152 (3.0%) |
| 3-Person Households | 705 (14.1%) | 18 (0.4%) |
| 4-Person Households | 568 (11.4%) | 36 (0.7%) |
| 5-Person Households | 237 (4.7%) | 0 (0.0%) |
| 6-Person Households | 125 (2.5%) | 0 (0.0%) |
| 7+ Person Households | 63 (1.3%) | 0 (0.0%) |
| Total | 3,287 (65.7%) | 1,717 (34.3%) |
Female Fertility in Cass County
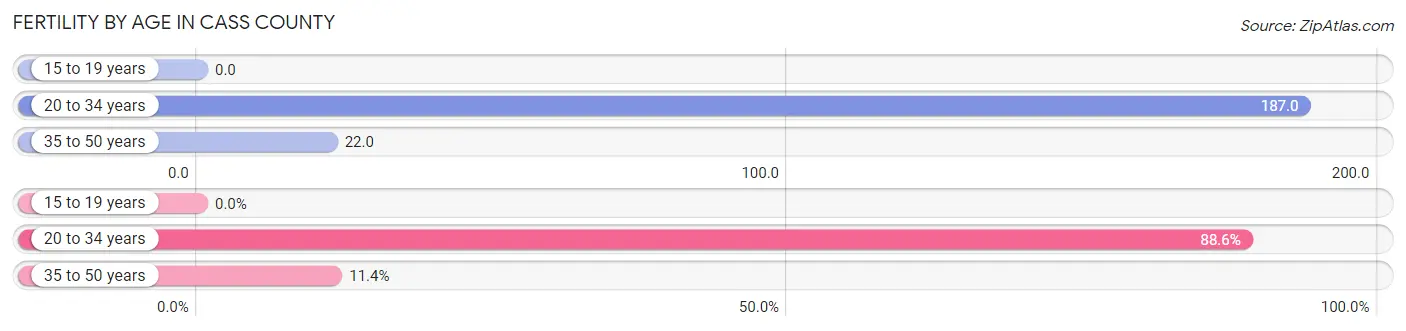
Fertility by Age in Cass County
Average fertility rate in Cass County is 87.0 births per 1,000 women. Women in the age bracket of 20 to 34 years have the highest fertility rate with 187.0 births per 1,000 women. Women in the age bracket of 20 to 34 years acount for 88.6% of all women with births.
| Age Bracket | Women with Births | Births / 1,000 Women |
| 15 to 19 years | 0 (0.0%) | 0.0 |
| 20 to 34 years | 210 (88.6%) | 187.0 |
| 35 to 50 years | 27 (11.4%) | 22.0 |
| Total | 237 (100.0%) | 87.0 |
Fertility by Age by Marriage Status in Cass County
84.4% of women with births (237) in Cass County are married. The highest percentage of unmarried women with births falls into 20 to 34 years age bracket with 17.6% of them unmarried at the time of birth, while the lowest percentage of unmarried women with births belong to 35 to 50 years age bracket with 0.0% of them unmarried.
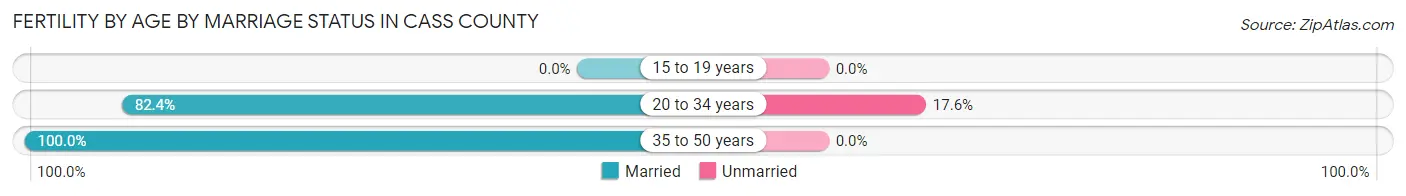
| Age Bracket | Married | Unmarried |
| 15 to 19 years | 0 (0.0%) | 0 (0.0%) |
| 20 to 34 years | 173 (82.4%) | 37 (17.6%) |
| 35 to 50 years | 27 (100.0%) | 0 (0.0%) |
| Total | 200 (84.4%) | 37 (15.6%) |
Fertility by Education in Cass County
Average fertility rate in Cass County is 87.0 births per 1,000 women. Women with the education attainment of less than high school have the highest fertility rate of 142.0 births per 1,000 women, while women with the education attainment of bachelor's degree have the lowest fertility at 36.0 births per 1,000 women. Women with the education attainment of high school diploma represent 44.3% of all women with births.
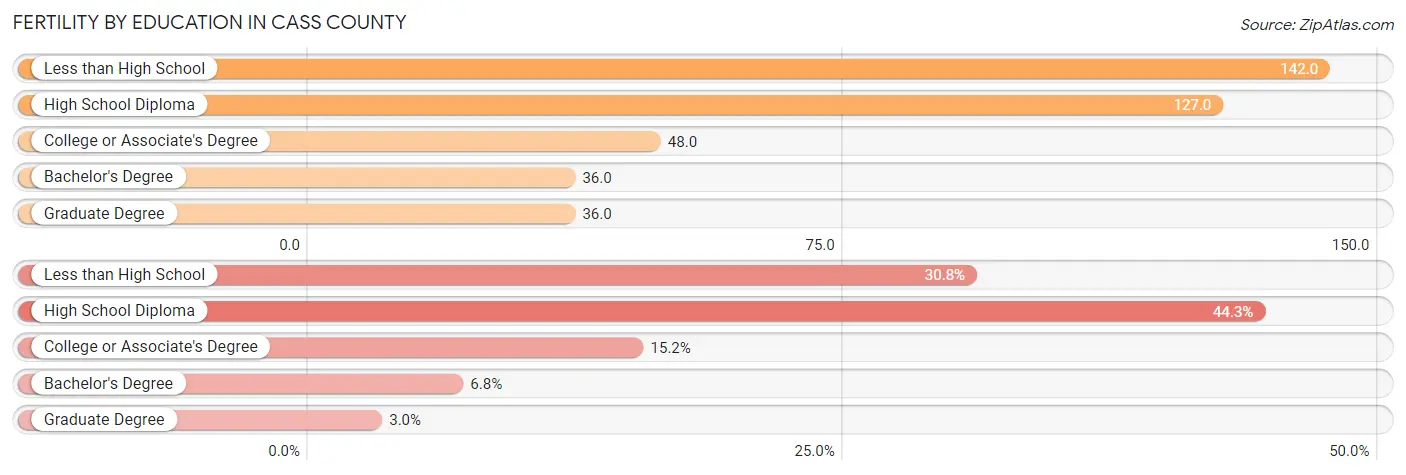
| Educational Attainment | Women with Births | Births / 1,000 Women |
| Less than High School | 73 (30.8%) | 142.0 |
| High School Diploma | 105 (44.3%) | 127.0 |
| College or Associate's Degree | 36 (15.2%) | 48.0 |
| Bachelor's Degree | 16 (6.8%) | 36.0 |
| Graduate Degree | 7 (2.9%) | 36.0 |
| Total | 237 (100.0%) | 87.0 |
Fertility by Education by Marriage Status in Cass County
15.6% of women with births in Cass County are unmarried. Women with the educational attainment of college or associate's degree are most likely to be married with 100.0% of them married at childbirth, while women with the educational attainment of less than high school are least likely to be married with 28.8% of them unmarried at childbirth.
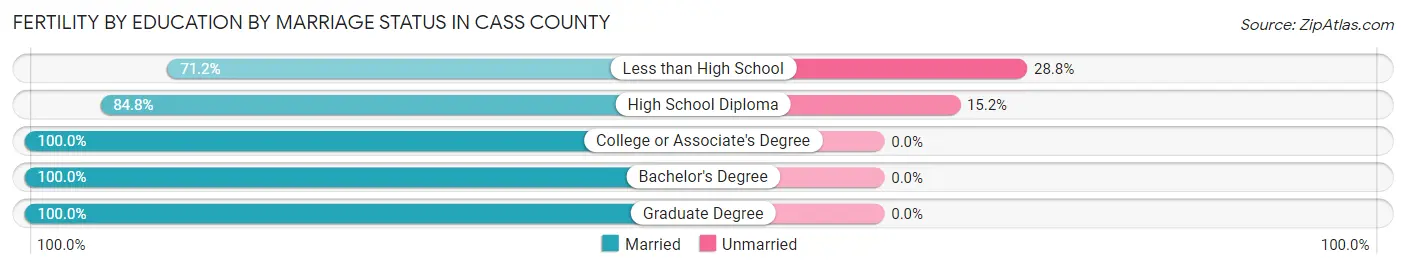
| Educational Attainment | Married | Unmarried |
| Less than High School | 52 (71.2%) | 21 (28.8%) |
| High School Diploma | 89 (84.8%) | 16 (15.2%) |
| College or Associate's Degree | 36 (100.0%) | 0 (0.0%) |
| Bachelor's Degree | 16 (100.0%) | 0 (0.0%) |
| Graduate Degree | 7 (100.0%) | 0 (0.0%) |
| Total | 200 (84.4%) | 37 (15.6%) |
Income in Cass County
Income Overview in Cass County
Per Capita Income in Cass County is $29,842, while median incomes of families and households are $75,790 and $64,826 respectively.
| Characteristic | Number | Measure |
| Per Capita Income | 12,955 | $29,842 |
| Median Family Income | 3,287 | $75,790 |
| Mean Family Income | 3,287 | $88,866 |
| Median Household Income | 5,004 | $64,826 |
| Mean Household Income | 5,004 | $75,705 |
| Income Deficit | 3,287 | $10,776 |
| Wage / Income Gap (%) | 12,955 | 31.54% |
| Wage / Income Gap ($) | 12,955 | 68.46¢ per $1 |
| Gini / Inequality Index | 12,955 | 0.40 |
Earnings by Sex in Cass County
Average Earnings in Cass County are $37,111, $44,162 for men and $30,234 for women, a difference of 31.5%.
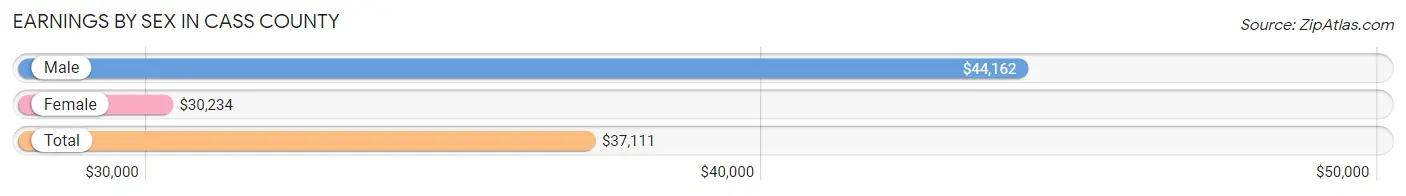
| Sex | Number | Average Earnings |
| Male | 3,693 (55.6%) | $44,162 |
| Female | 2,951 (44.4%) | $30,234 |
| Total | 6,644 (100.0%) | $37,111 |
Earnings by Sex by Income Bracket in Cass County
The most common earnings brackets in Cass County are $100,000+ for men (365 | 9.9%) and $30,000 to $34,999 for women (272 | 9.2%).
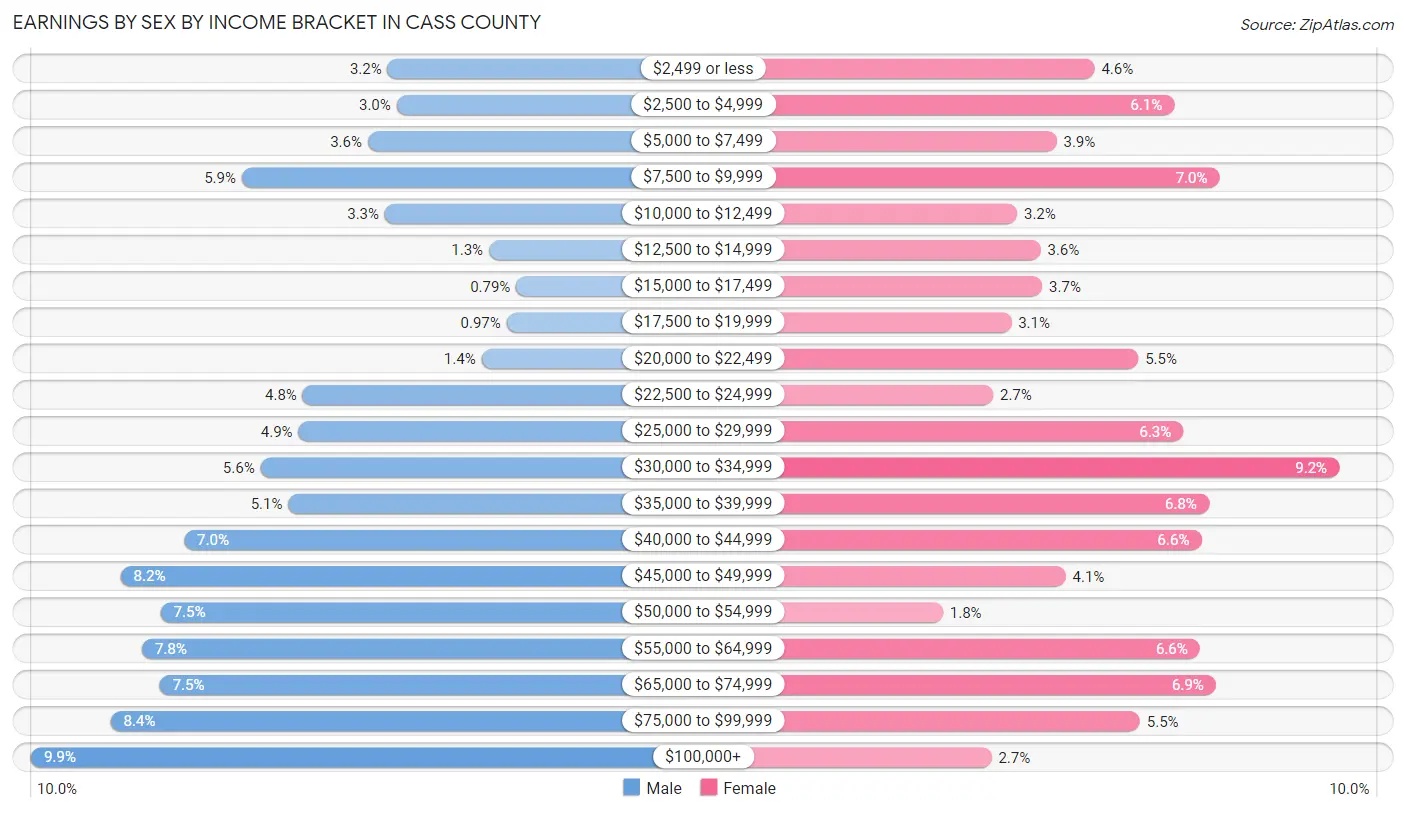
| Income | Male | Female |
| $2,499 or less | 118 (3.2%) | 137 (4.6%) |
| $2,500 to $4,999 | 112 (3.0%) | 181 (6.1%) |
| $5,000 to $7,499 | 132 (3.6%) | 116 (3.9%) |
| $7,500 to $9,999 | 219 (5.9%) | 206 (7.0%) |
| $10,000 to $12,499 | 120 (3.3%) | 94 (3.2%) |
| $12,500 to $14,999 | 48 (1.3%) | 107 (3.6%) |
| $15,000 to $17,499 | 29 (0.8%) | 108 (3.7%) |
| $17,500 to $19,999 | 36 (1.0%) | 91 (3.1%) |
| $20,000 to $22,499 | 53 (1.4%) | 161 (5.5%) |
| $22,500 to $24,999 | 177 (4.8%) | 81 (2.7%) |
| $25,000 to $29,999 | 180 (4.9%) | 186 (6.3%) |
| $30,000 to $34,999 | 206 (5.6%) | 272 (9.2%) |
| $35,000 to $39,999 | 187 (5.1%) | 200 (6.8%) |
| $40,000 to $44,999 | 259 (7.0%) | 196 (6.6%) |
| $45,000 to $49,999 | 303 (8.2%) | 121 (4.1%) |
| $50,000 to $54,999 | 275 (7.4%) | 53 (1.8%) |
| $55,000 to $64,999 | 288 (7.8%) | 195 (6.6%) |
| $65,000 to $74,999 | 276 (7.5%) | 204 (6.9%) |
| $75,000 to $99,999 | 310 (8.4%) | 162 (5.5%) |
| $100,000+ | 365 (9.9%) | 80 (2.7%) |
| Total | 3,693 (100.0%) | 2,951 (100.0%) |
Earnings by Sex by Educational Attainment in Cass County
Average earnings in Cass County are $47,754 for men and $33,921 for women, a difference of 29.0%. Men with an educational attainment of graduate degree enjoy the highest average annual earnings of $86,786, while those with less than high school education earn the least with $33,269. Women with an educational attainment of graduate degree earn the most with the average annual earnings of $61,071, while those with less than high school education have the smallest earnings of $20,714.
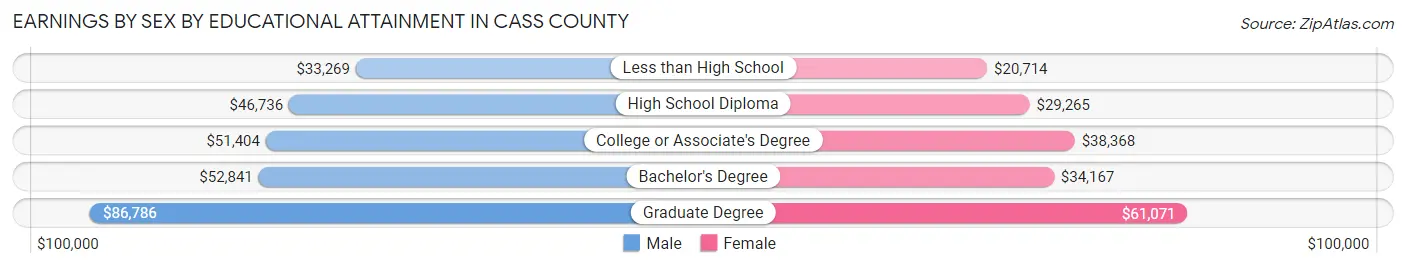
| Educational Attainment | Male Income | Female Income |
| Less than High School | $33,269 | $20,714 |
| High School Diploma | $46,736 | $29,265 |
| College or Associate's Degree | $51,404 | $38,368 |
| Bachelor's Degree | $52,841 | $34,167 |
| Graduate Degree | $86,786 | $61,071 |
| Total | $47,754 | $33,921 |
Family Income in Cass County
Family Income Brackets in Cass County
According to the Cass County family income data, there are 756 families falling into the $50,000 to $74,999 income range, which is the most common income bracket and makes up 23.0% of all families. Conversely, the $10,000 to $14,999 income bracket is the least frequent group with only 115 families (3.5%) belonging to this category.
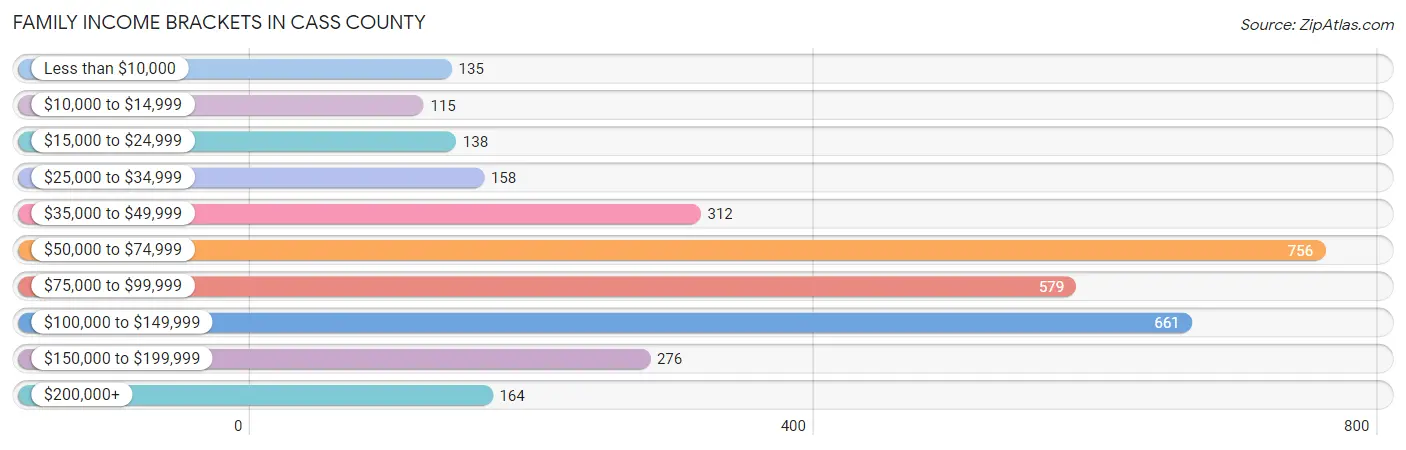
| Income Bracket | # Families | % Families |
| Less than $10,000 | 135 | 4.1% |
| $10,000 to $14,999 | 115 | 3.5% |
| $15,000 to $24,999 | 138 | 4.2% |
| $25,000 to $34,999 | 158 | 4.8% |
| $35,000 to $49,999 | 312 | 9.5% |
| $50,000 to $74,999 | 756 | 23.0% |
| $75,000 to $99,999 | 579 | 17.6% |
| $100,000 to $149,999 | 661 | 20.1% |
| $150,000 to $199,999 | 276 | 8.4% |
| $200,000+ | 164 | 5.0% |
Family Income by Famaliy Size in Cass County
6-person families (133 | 4.1%) account for the highest median family income in Cass County with $104,856 per family, while 2-person families (1,717 | 52.2%) have the highest median income of $36,404 per family member.
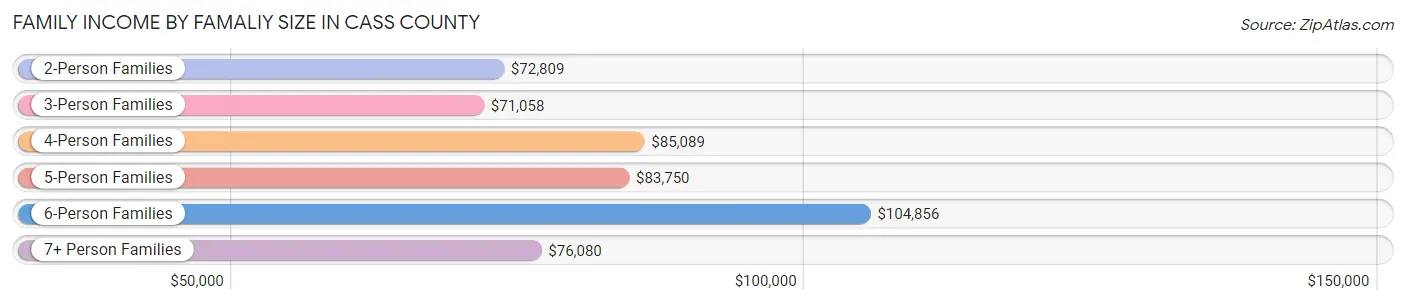
| Income Bracket | # Families | Median Income |
| 2-Person Families | 1,717 (52.2%) | $72,809 |
| 3-Person Families | 711 (21.6%) | $71,058 |
| 4-Person Families | 457 (13.9%) | $85,089 |
| 5-Person Families | 216 (6.6%) | $83,750 |
| 6-Person Families | 133 (4.1%) | $104,856 |
| 7+ Person Families | 53 (1.6%) | $76,080 |
| Total | 3,287 (100.0%) | $75,790 |
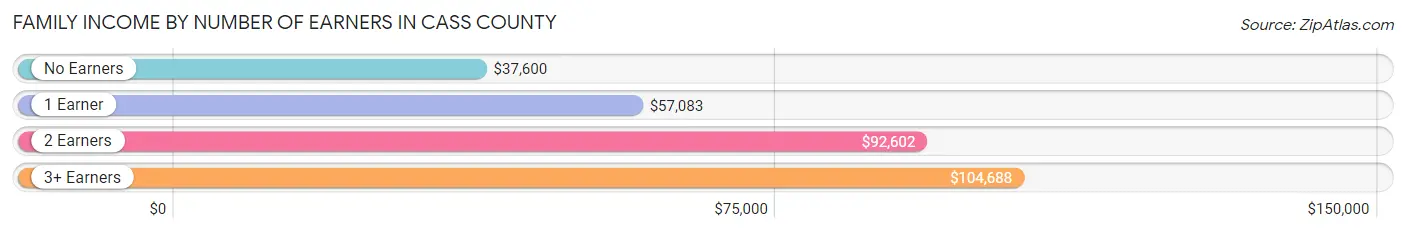
Family Income by Number of Earners in Cass County
The median family income in Cass County is $75,790, with families comprising 3+ earners (475) having the highest median family income of $104,688, while families with no earners (508) have the lowest median family income of $37,600, accounting for 14.4% and 15.4% of families, respectively.
| Number of Earners | # Families | Median Income |
| No Earners | 508 (15.4%) | $37,600 |
| 1 Earner | 976 (29.7%) | $57,083 |
| 2 Earners | 1,328 (40.4%) | $92,602 |
| 3+ Earners | 475 (14.4%) | $104,688 |
| Total | 3,287 (100.0%) | $75,790 |
Household Income in Cass County
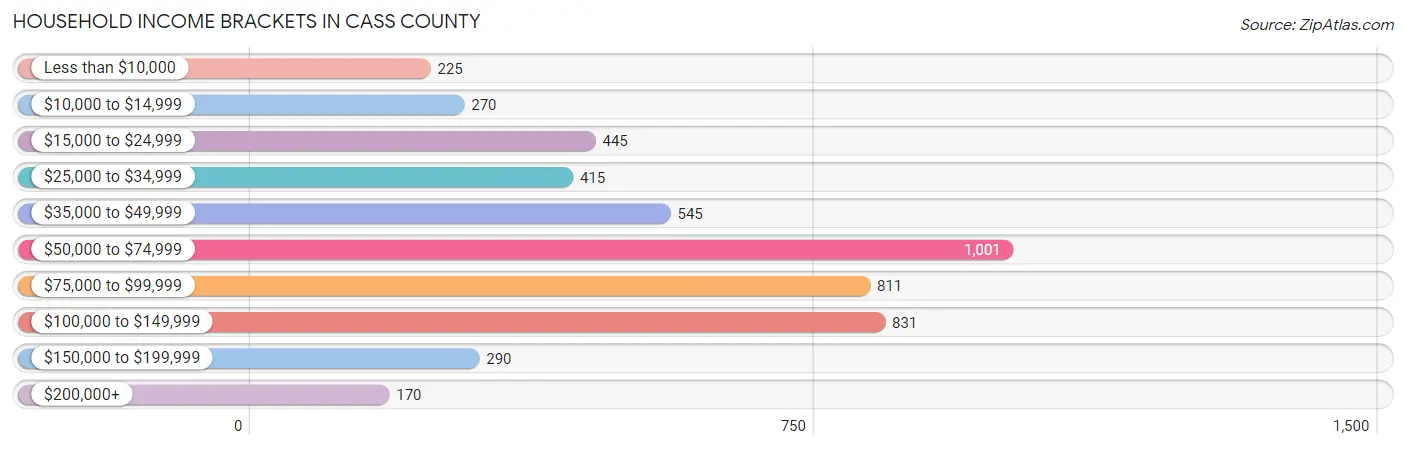
Household Income Brackets in Cass County
With 1,001 households falling in the category, the $50,000 to $74,999 income range is the most frequent in Cass County, accounting for 20.0% of all households. In contrast, only 170 households (3.4%) fall into the $200,000+ income bracket, making it the least populous group.
| Income Bracket | # Households | % Households |
| Less than $10,000 | 225 | 4.5% |
| $10,000 to $14,999 | 270 | 5.4% |
| $15,000 to $24,999 | 445 | 8.9% |
| $25,000 to $34,999 | 415 | 8.3% |
| $35,000 to $49,999 | 545 | 10.9% |
| $50,000 to $74,999 | 1,001 | 20.0% |
| $75,000 to $99,999 | 811 | 16.2% |
| $100,000 to $149,999 | 831 | 16.6% |
| $150,000 to $199,999 | 290 | 5.8% |
| $200,000+ | 170 | 3.4% |
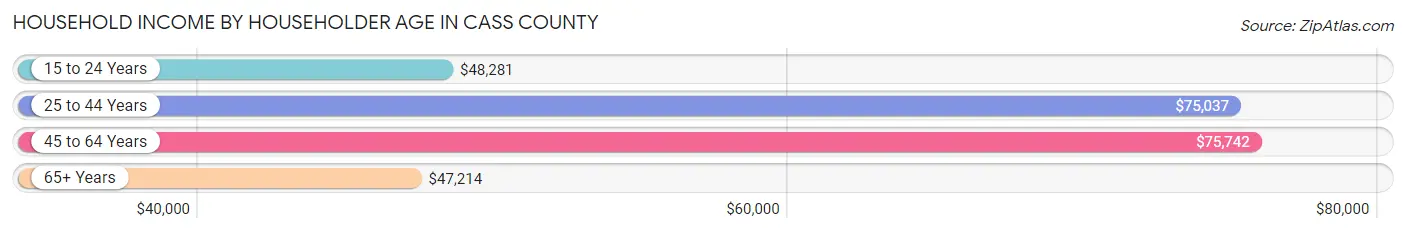
Household Income by Householder Age in Cass County
The median household income in Cass County is $64,826, with the highest median household income of $75,742 found in the 45 to 64 years age bracket for the primary householder. A total of 1,699 households (34.0%) fall into this category. Meanwhile, the 65+ years age bracket for the primary householder has the lowest median household income of $47,214, with 1,603 households (32.0%) in this group.
| Income Bracket | # Households | Median Income |
| 15 to 24 Years | 197 (3.9%) | $48,281 |
| 25 to 44 Years | 1,505 (30.1%) | $75,037 |
| 45 to 64 Years | 1,699 (34.0%) | $75,742 |
| 65+ Years | 1,603 (32.0%) | $47,214 |
| Total | 5,004 (100.0%) | $64,826 |
Poverty in Cass County
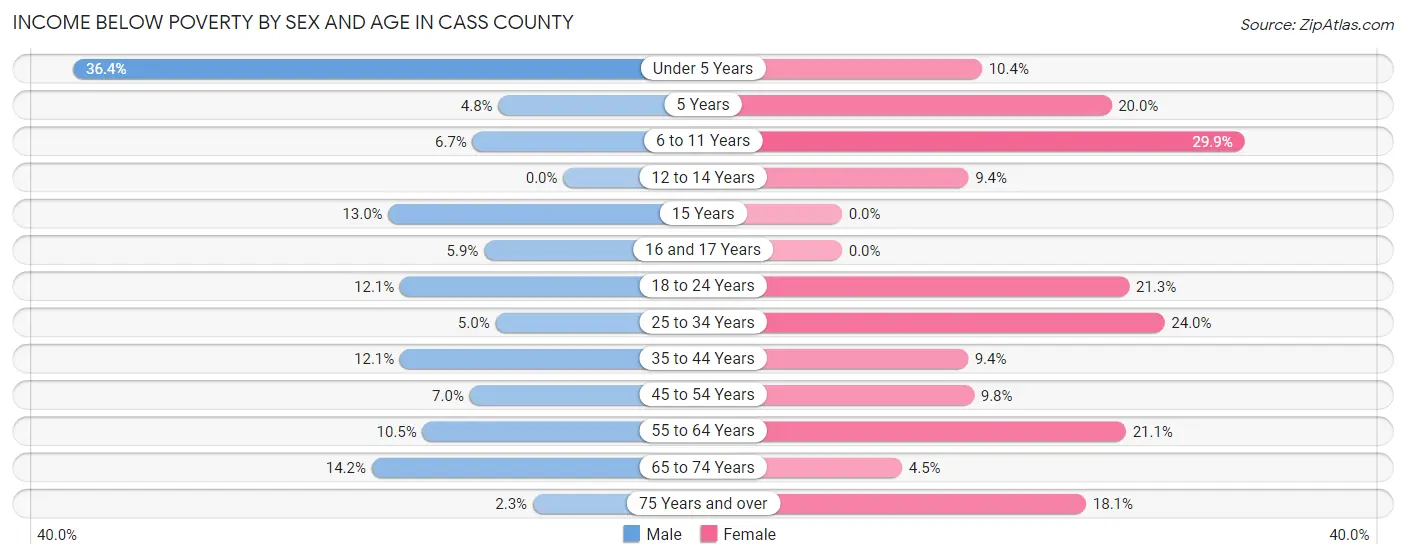
Income Below Poverty by Sex and Age in Cass County
With 9.6% poverty level for males and 15.1% for females among the residents of Cass County, under 5 year old males and 6 to 11 year old females are the most vulnerable to poverty, with 95 males (36.4%) and 119 females (29.9%) in their respective age groups living below the poverty level.
| Age Bracket | Male | Female |
| Under 5 Years | 95 (36.4%) | 43 (10.4%) |
| 5 Years | 4 (4.8%) | 21 (20.0%) |
| 6 to 11 Years | 43 (6.7%) | 119 (29.9%) |
| 12 to 14 Years | 0 (0.0%) | 31 (9.4%) |
| 15 Years | 10 (13.0%) | 0 (0.0%) |
| 16 and 17 Years | 13 (5.9%) | 0 (0.0%) |
| 18 to 24 Years | 72 (12.1%) | 103 (21.3%) |
| 25 to 34 Years | 39 (5.0%) | 194 (23.9%) |
| 35 to 44 Years | 108 (12.1%) | 75 (9.3%) |
| 45 to 54 Years | 53 (7.0%) | 69 (9.8%) |
| 55 to 64 Years | 86 (10.4%) | 176 (21.1%) |
| 65 to 74 Years | 96 (14.2%) | 32 (4.5%) |
| 75 Years and over | 8 (2.3%) | 87 (18.1%) |
| Total | 627 (9.6%) | 950 (15.1%) |
Income Above Poverty by Sex and Age in Cass County
According to the poverty statistics in Cass County, males aged 12 to 14 years and females aged 15 years are the age groups that are most secure financially, with 100.0% of males and 100.0% of females in these age groups living above the poverty line.
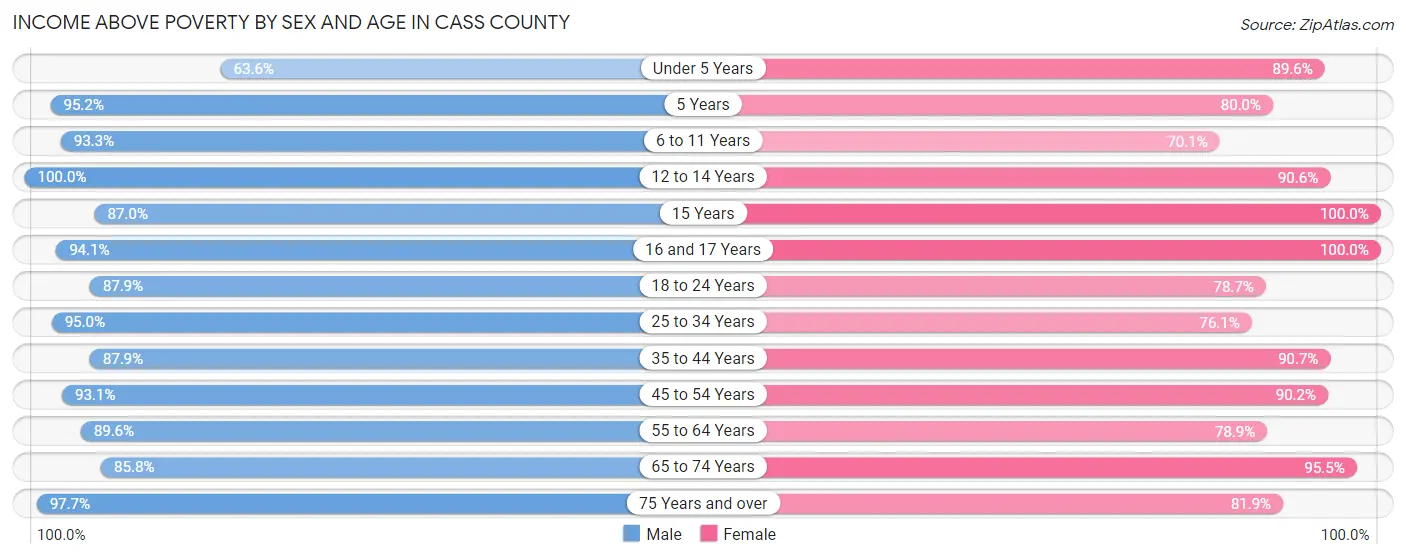
| Age Bracket | Male | Female |
| Under 5 Years | 166 (63.6%) | 371 (89.6%) |
| 5 Years | 79 (95.2%) | 84 (80.0%) |
| 6 to 11 Years | 596 (93.3%) | 279 (70.1%) |
| 12 to 14 Years | 382 (100.0%) | 299 (90.6%) |
| 15 Years | 67 (87.0%) | 72 (100.0%) |
| 16 and 17 Years | 208 (94.1%) | 157 (100.0%) |
| 18 to 24 Years | 522 (87.9%) | 380 (78.7%) |
| 25 to 34 Years | 735 (95.0%) | 616 (76.0%) |
| 35 to 44 Years | 783 (87.9%) | 727 (90.6%) |
| 45 to 54 Years | 710 (93.0%) | 635 (90.2%) |
| 55 to 64 Years | 737 (89.5%) | 659 (78.9%) |
| 65 to 74 Years | 579 (85.8%) | 686 (95.5%) |
| 75 Years and over | 346 (97.7%) | 393 (81.9%) |
| Total | 5,910 (90.4%) | 5,358 (84.9%) |
Income Below Poverty Among Married-Couple Families in Cass County
The poverty statistics for married-couple families in Cass County show that 4.0% or 99 of the total 2,456 families live below the poverty line. Families with 3 or 4 children have the highest poverty rate of 6.7%, comprising of 15 families. On the other hand, families with 5 or more children have the lowest poverty rate of 0.0%, which includes 0 families.

| Children | Above Poverty | Below Poverty |
| No Children | 1,496 (96.0%) | 62 (4.0%) |
| 1 or 2 Children | 626 (96.6%) | 22 (3.4%) |
| 3 or 4 Children | 209 (93.3%) | 15 (6.7%) |
| 5 or more Children | 26 (100.0%) | 0 (0.0%) |
| Total | 2,357 (96.0%) | 99 (4.0%) |
Income Below Poverty Among Single-Parent Households in Cass County
According to the poverty data in Cass County, 29.0% or 78 single-father households and 25.1% or 141 single-mother households are living below the poverty line. Among single-father households, those with 3 or 4 children have the highest poverty rate, with 11 households (68.8%) experiencing poverty. Likewise, among single-mother households, those with 5 or more children have the highest poverty rate, with 10 households (100.0%) falling below the poverty line.
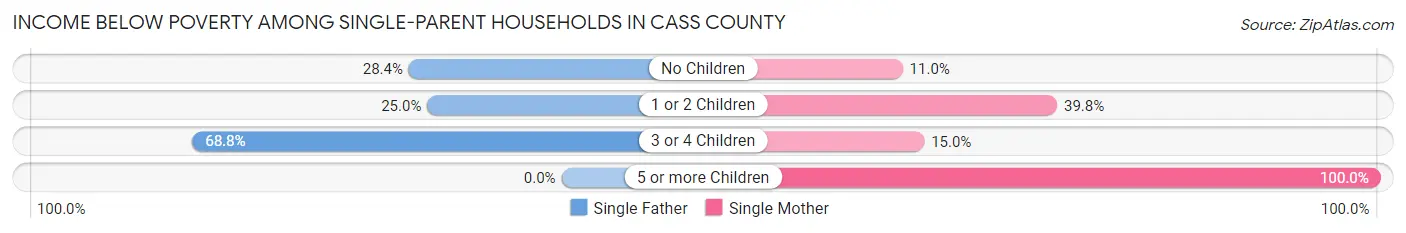
| Children | Single Father | Single Mother |
| No Children | 31 (28.4%) | 30 (11.0%) |
| 1 or 2 Children | 36 (25.0%) | 95 (39.8%) |
| 3 or 4 Children | 11 (68.8%) | 6 (15.0%) |
| 5 or more Children | 0 (0.0%) | 10 (100.0%) |
| Total | 78 (29.0%) | 141 (25.1%) |
Income Below Poverty Among Married-Couple vs Single-Parent Households in Cass County
The poverty data for Cass County shows that 99 of the married-couple family households (4.0%) and 219 of the single-parent households (26.4%) are living below the poverty level. Within the married-couple family households, those with 3 or 4 children have the highest poverty rate, with 15 households (6.7%) falling below the poverty line. Among the single-parent households, those with 5 or more children have the highest poverty rate, with 10 household (100.0%) living below poverty.
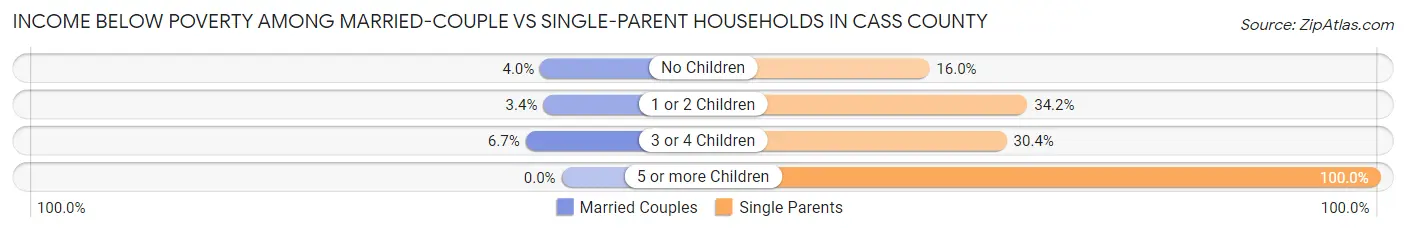
| Children | Married-Couple Families | Single-Parent Households |
| No Children | 62 (4.0%) | 61 (16.0%) |
| 1 or 2 Children | 22 (3.4%) | 131 (34.2%) |
| 3 or 4 Children | 15 (6.7%) | 17 (30.4%) |
| 5 or more Children | 0 (0.0%) | 10 (100.0%) |
| Total | 99 (4.0%) | 219 (26.4%) |
Employment Characteristics in Cass County
Employment by Class of Employer in Cass County
Among the 5,760 employed individuals in Cass County, private company employees (4,102 | 71.2%), local government employees (408 | 7.1%), and not-for-profit organizations (376 | 6.5%) make up the most common classes of employment.
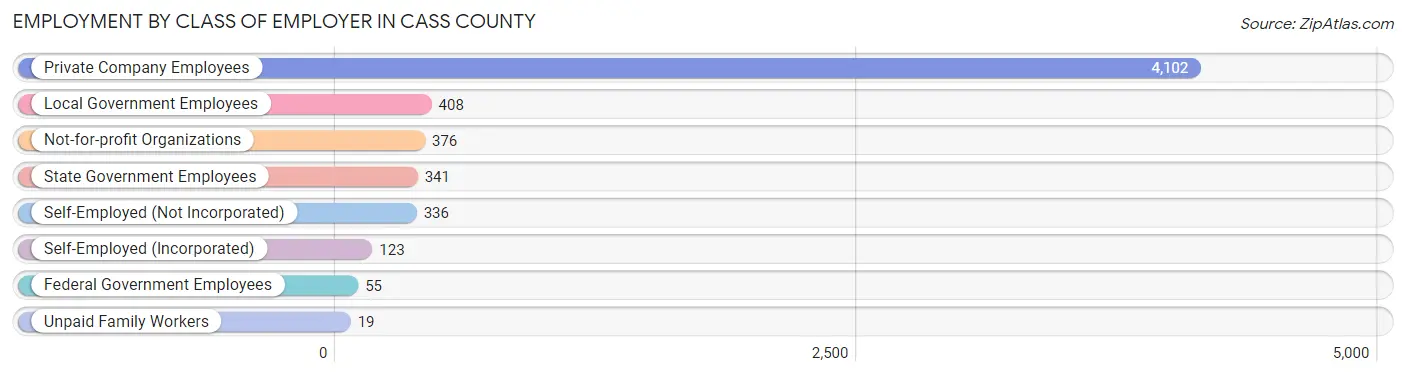
| Employer Class | # Employees | % Employees |
| Private Company Employees | 4,102 | 71.2% |
| Self-Employed (Incorporated) | 123 | 2.1% |
| Self-Employed (Not Incorporated) | 336 | 5.8% |
| Not-for-profit Organizations | 376 | 6.5% |
| Local Government Employees | 408 | 7.1% |
| State Government Employees | 341 | 5.9% |
| Federal Government Employees | 55 | 0.9% |
| Unpaid Family Workers | 19 | 0.3% |
| Total | 5,760 | 100.0% |
Employment Status by Age in Cass County
According to the labor force statistics for Cass County, out of the total population over 16 years of age (10,188), 61.2% or 6,235 individuals are in the labor force, with 5.4% or 337 of them unemployed. The age group with the highest labor force participation rate is 25 to 29 years, with 83.4% or 629 individuals in the labor force. Within the labor force, the 20 to 24 years age range has the highest percentage of unemployed individuals, with 13.4% or 80 of them being unemployed.
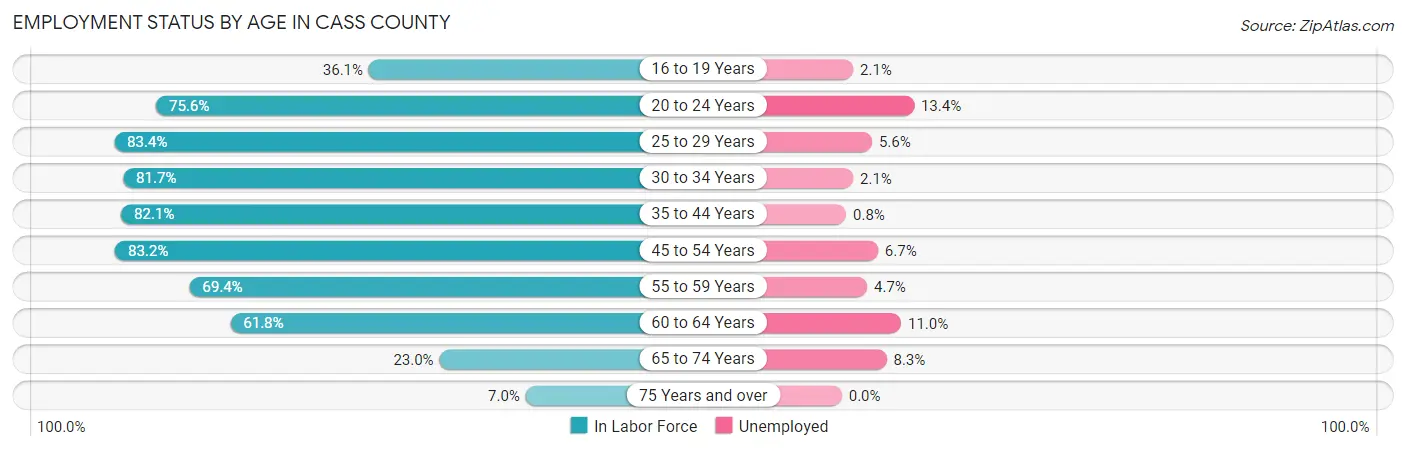
| Age Bracket | In Labor Force | Unemployed |
| 16 to 19 Years | 241 (36.1%) | 5 (2.1%) |
| 20 to 24 Years | 596 (75.6%) | 80 (13.4%) |
| 25 to 29 Years | 629 (83.4%) | 35 (5.6%) |
| 30 to 34 Years | 678 (81.7%) | 14 (2.1%) |
| 35 to 44 Years | 1,390 (82.1%) | 11 (0.8%) |
| 45 to 54 Years | 1,221 (83.2%) | 82 (6.7%) |
| 55 to 59 Years | 602 (69.4%) | 28 (4.7%) |
| 60 to 64 Years | 489 (61.8%) | 54 (11.0%) |
| 65 to 74 Years | 327 (23.0%) | 27 (8.3%) |
| 75 Years and over | 64 (7.0%) | 0 (0.0%) |
| Total | 6,235 (61.2%) | 337 (5.4%) |
Employment Status by Educational Attainment in Cass County
According to labor force statistics for Cass County, 78.2% of individuals (5,006) out of the total population between 25 and 64 years of age (6,402) are in the labor force, with 4.5% or 225 of them being unemployed. The group with the highest labor force participation rate are those with the educational attainment of bachelor's degree or higher, with 87.5% or 1,079 individuals in the labor force. Within the labor force, individuals with high school diploma education have the highest percentage of unemployment, with 5.7% or 110 of them being unemployed.
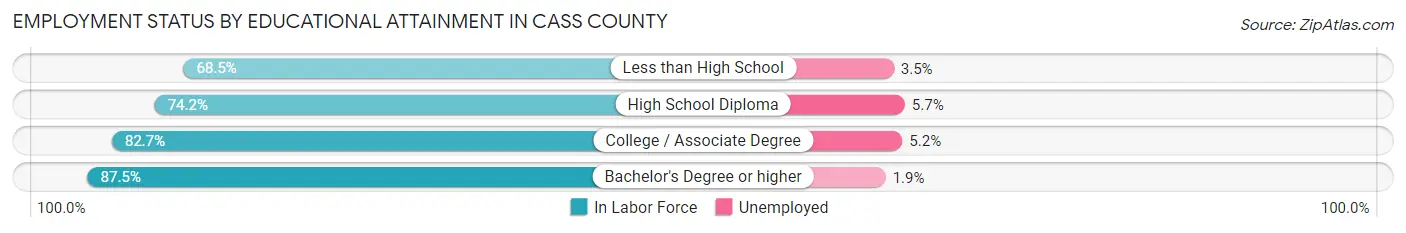
| Educational Attainment | In Labor Force | Unemployed |
| Less than High School | 595 (68.5%) | 30 (3.5%) |
| High School Diploma | 1,923 (74.2%) | 148 (5.7%) |
| College / Associate Degree | 1,413 (82.7%) | 89 (5.2%) |
| Bachelor's Degree or higher | 1,079 (87.5%) | 23 (1.9%) |
| Total | 5,006 (78.2%) | 288 (4.5%) |
Employment Occupations by Sex in Cass County
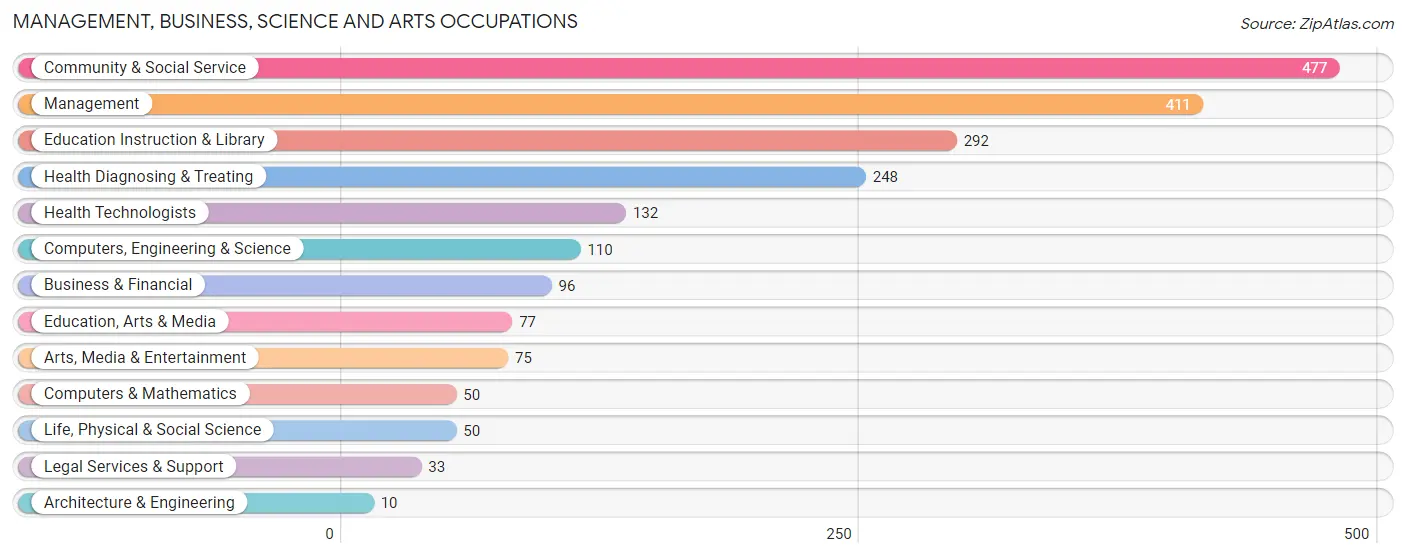
Management, Business, Science and Arts Occupations
The most common Management, Business, Science and Arts occupations in Cass County are Community & Social Service (477 | 8.1%), Management (411 | 7.0%), Education Instruction & Library (292 | 5.0%), Health Diagnosing & Treating (248 | 4.2%), and Health Technologists (132 | 2.2%).
Management, Business, Science and Arts Occupations by Sex
Within the Management, Business, Science and Arts occupations in Cass County, the most male-oriented occupations are Architecture & Engineering (100.0%), Arts, Media & Entertainment (82.7%), and Life, Physical & Social Science (70.0%), while the most female-oriented occupations are Health Technologists (97.7%), Health Diagnosing & Treating (96.0%), and Education Instruction & Library (75.0%).
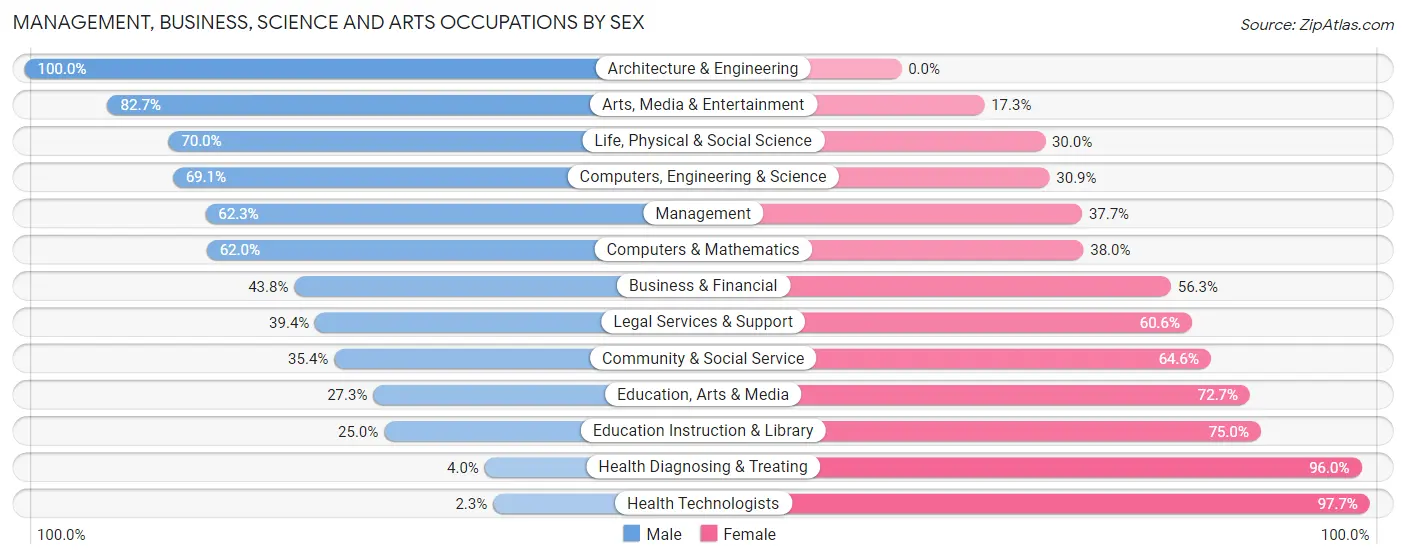
| Occupation | Male | Female |
| Management | 256 (62.3%) | 155 (37.7%) |
| Business & Financial | 42 (43.8%) | 54 (56.2%) |
| Computers, Engineering & Science | 76 (69.1%) | 34 (30.9%) |
| Computers & Mathematics | 31 (62.0%) | 19 (38.0%) |
| Architecture & Engineering | 10 (100.0%) | 0 (0.0%) |
| Life, Physical & Social Science | 35 (70.0%) | 15 (30.0%) |
| Community & Social Service | 169 (35.4%) | 308 (64.6%) |
| Education, Arts & Media | 21 (27.3%) | 56 (72.7%) |
| Legal Services & Support | 13 (39.4%) | 20 (60.6%) |
| Education Instruction & Library | 73 (25.0%) | 219 (75.0%) |
| Arts, Media & Entertainment | 62 (82.7%) | 13 (17.3%) |
| Health Diagnosing & Treating | 10 (4.0%) | 238 (96.0%) |
| Health Technologists | 3 (2.3%) | 129 (97.7%) |
| Total (Category) | 553 (41.2%) | 789 (58.8%) |
| Total (Overall) | 3,281 (55.6%) | 2,615 (44.4%) |
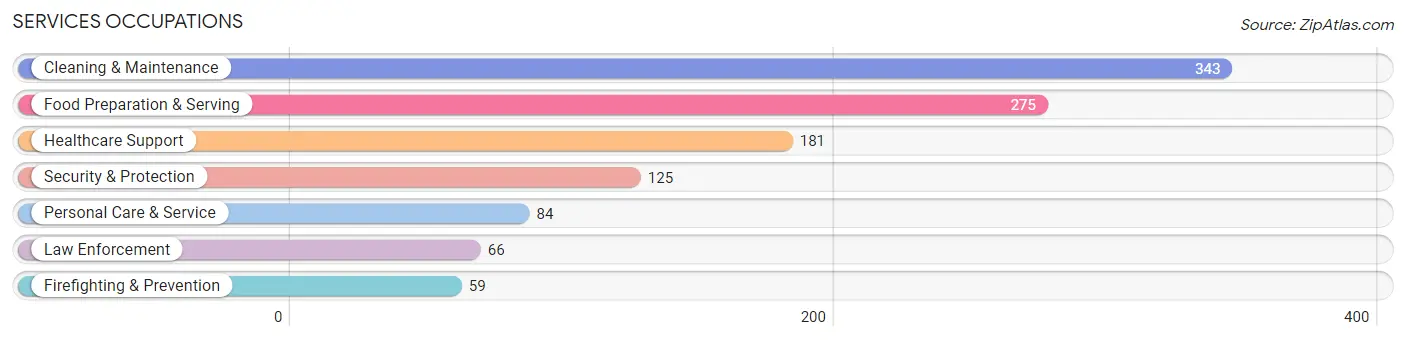
Services Occupations
The most common Services occupations in Cass County are Cleaning & Maintenance (343 | 5.8%), Food Preparation & Serving (275 | 4.7%), Healthcare Support (181 | 3.1%), Security & Protection (125 | 2.1%), and Personal Care & Service (84 | 1.4%).
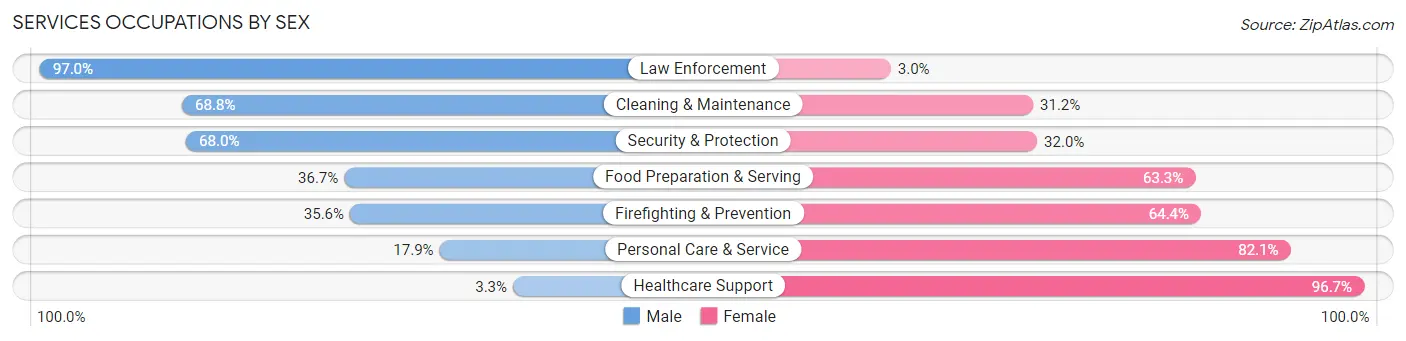
Services Occupations by Sex
Within the Services occupations in Cass County, the most male-oriented occupations are Law Enforcement (97.0%), Cleaning & Maintenance (68.8%), and Security & Protection (68.0%), while the most female-oriented occupations are Healthcare Support (96.7%), Personal Care & Service (82.1%), and Firefighting & Prevention (64.4%).
| Occupation | Male | Female |
| Healthcare Support | 6 (3.3%) | 175 (96.7%) |
| Security & Protection | 85 (68.0%) | 40 (32.0%) |
| Firefighting & Prevention | 21 (35.6%) | 38 (64.4%) |
| Law Enforcement | 64 (97.0%) | 2 (3.0%) |
| Food Preparation & Serving | 101 (36.7%) | 174 (63.3%) |
| Cleaning & Maintenance | 236 (68.8%) | 107 (31.2%) |
| Personal Care & Service | 15 (17.9%) | 69 (82.1%) |
| Total (Category) | 443 (44.0%) | 565 (56.0%) |
| Total (Overall) | 3,281 (55.6%) | 2,615 (44.4%) |
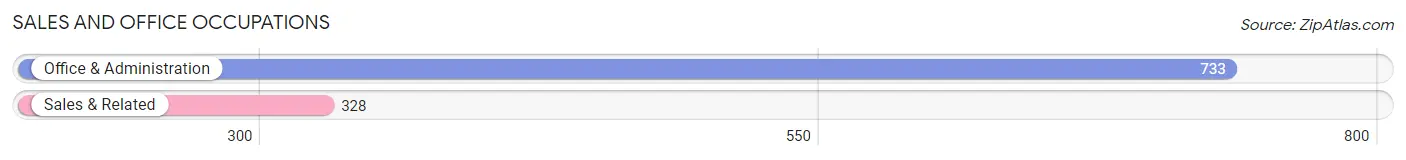
Sales and Office Occupations
The most common Sales and Office occupations in Cass County are Office & Administration (733 | 12.4%), and Sales & Related (328 | 5.6%).
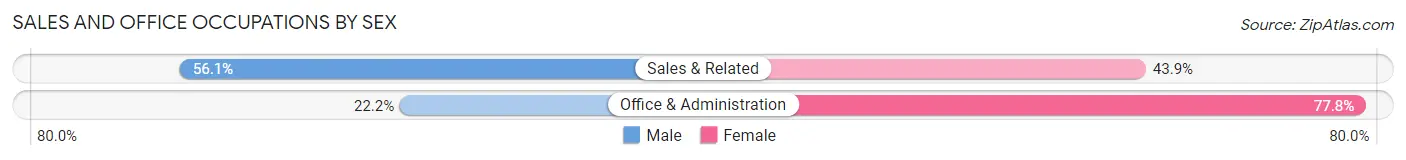
Sales and Office Occupations by Sex
| Occupation | Male | Female |
| Sales & Related | 184 (56.1%) | 144 (43.9%) |
| Office & Administration | 163 (22.2%) | 570 (77.8%) |
| Total (Category) | 347 (32.7%) | 714 (67.3%) |
| Total (Overall) | 3,281 (55.6%) | 2,615 (44.4%) |
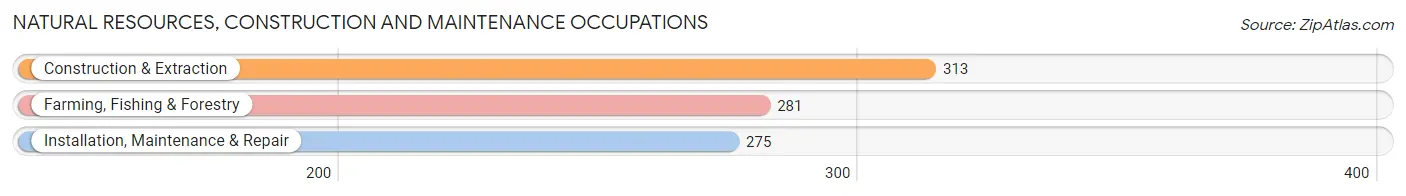
Natural Resources, Construction and Maintenance Occupations
The most common Natural Resources, Construction and Maintenance occupations in Cass County are Construction & Extraction (313 | 5.3%), Farming, Fishing & Forestry (281 | 4.8%), and Installation, Maintenance & Repair (275 | 4.7%).
Natural Resources, Construction and Maintenance Occupations by Sex
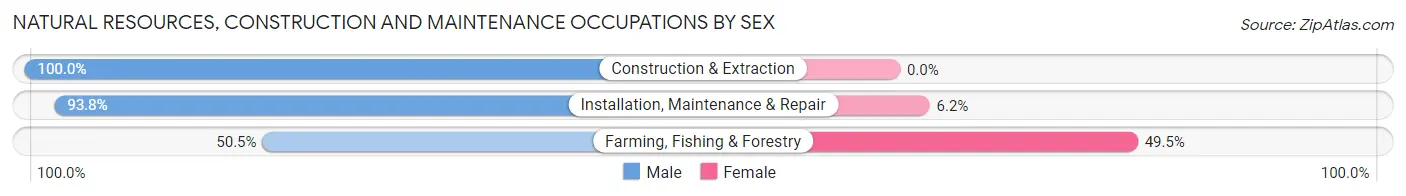
| Occupation | Male | Female |
| Farming, Fishing & Forestry | 142 (50.5%) | 139 (49.5%) |
| Construction & Extraction | 313 (100.0%) | 0 (0.0%) |
| Installation, Maintenance & Repair | 258 (93.8%) | 17 (6.2%) |
| Total (Category) | 713 (82.1%) | 156 (17.9%) |
| Total (Overall) | 3,281 (55.6%) | 2,615 (44.4%) |
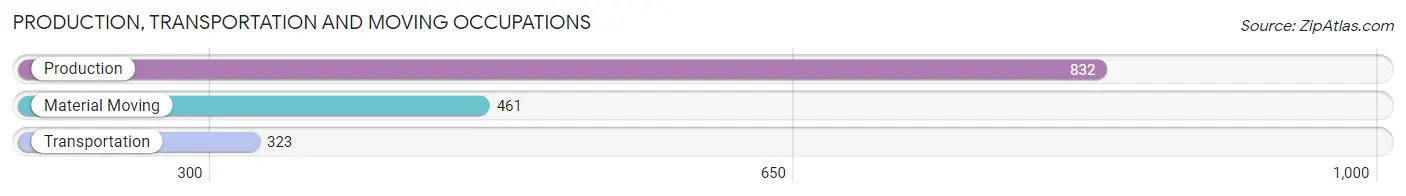
Production, Transportation and Moving Occupations
The most common Production, Transportation and Moving occupations in Cass County are Production (832 | 14.1%), Material Moving (461 | 7.8%), and Transportation (323 | 5.5%).
Production, Transportation and Moving Occupations by Sex
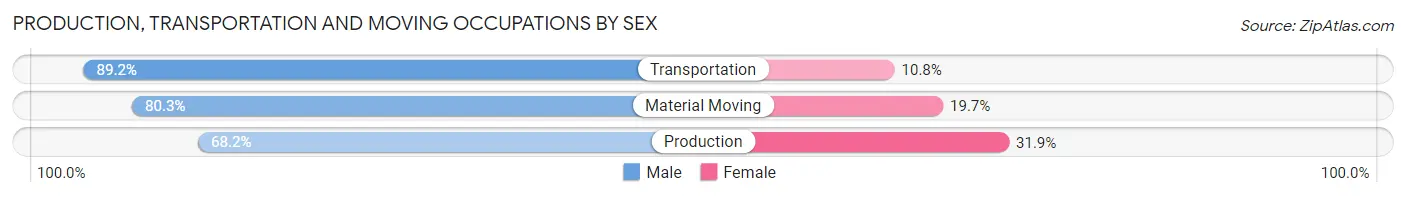
| Occupation | Male | Female |
| Production | 567 (68.1%) | 265 (31.9%) |
| Transportation | 288 (89.2%) | 35 (10.8%) |
| Material Moving | 370 (80.3%) | 91 (19.7%) |
| Total (Category) | 1,225 (75.8%) | 391 (24.2%) |
| Total (Overall) | 3,281 (55.6%) | 2,615 (44.4%) |
Employment Industries by Sex in Cass County
Employment Industries in Cass County
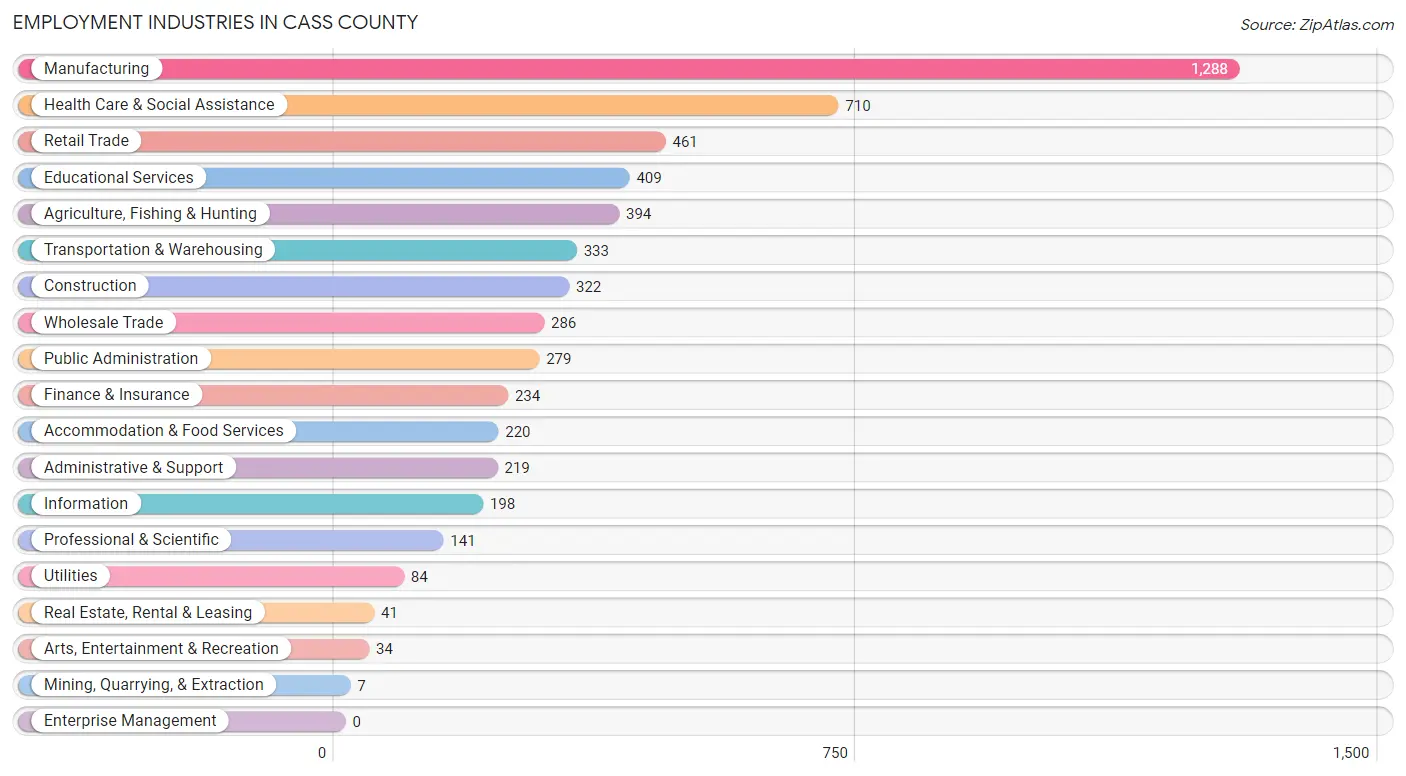
The major employment industries in Cass County include Manufacturing (1,288 | 21.8%), Health Care & Social Assistance (710 | 12.0%), Retail Trade (461 | 7.8%), Educational Services (409 | 6.9%), and Agriculture, Fishing & Hunting (394 | 6.7%).
Employment Industries by Sex in Cass County
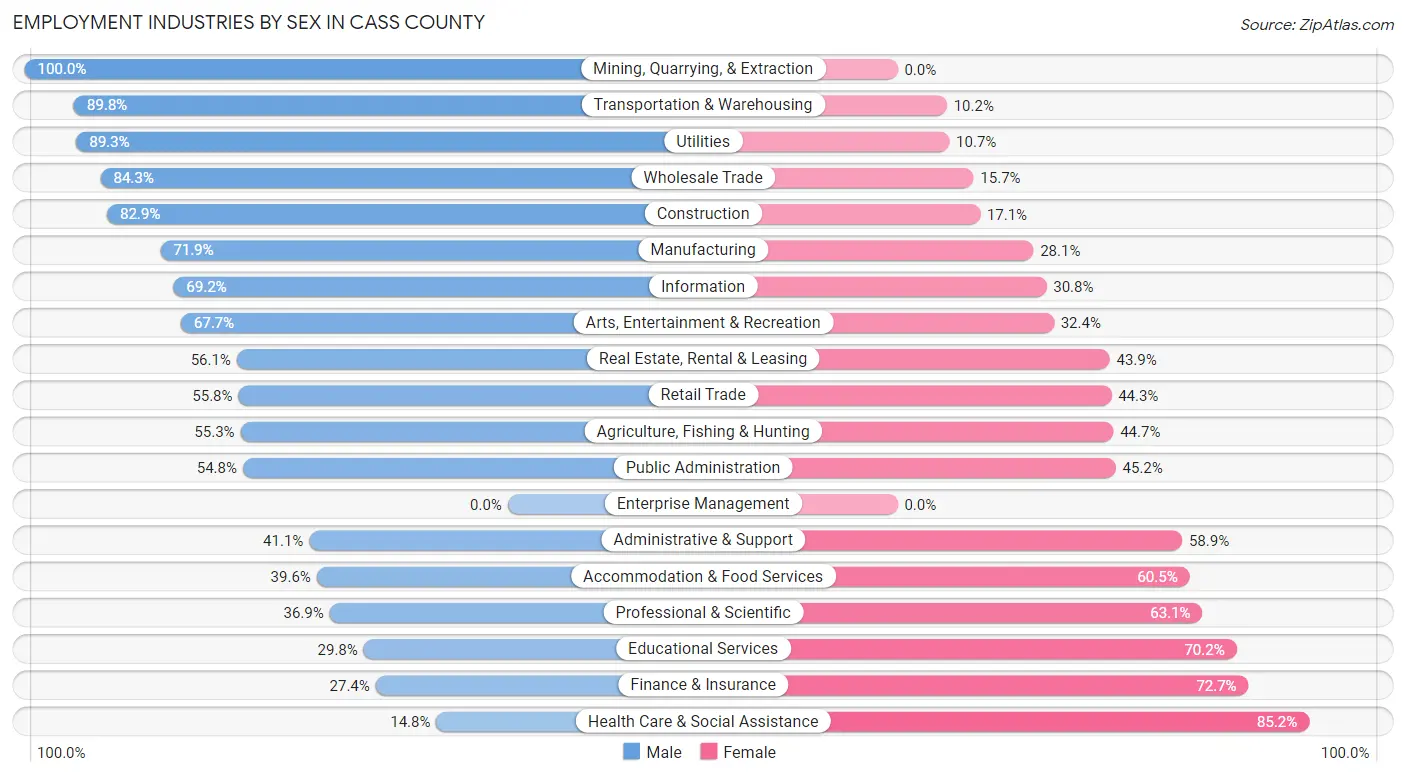
The Cass County industries that see more men than women are Mining, Quarrying, & Extraction (100.0%), Transportation & Warehousing (89.8%), and Utilities (89.3%), whereas the industries that tend to have a higher number of women are Health Care & Social Assistance (85.2%), Finance & Insurance (72.7%), and Educational Services (70.2%).
| Industry | Male | Female |
| Agriculture, Fishing & Hunting | 218 (55.3%) | 176 (44.7%) |
| Mining, Quarrying, & Extraction | 7 (100.0%) | 0 (0.0%) |
| Construction | 267 (82.9%) | 55 (17.1%) |
| Manufacturing | 926 (71.9%) | 362 (28.1%) |
| Wholesale Trade | 241 (84.3%) | 45 (15.7%) |
| Retail Trade | 257 (55.7%) | 204 (44.3%) |
| Transportation & Warehousing | 299 (89.8%) | 34 (10.2%) |
| Utilities | 75 (89.3%) | 9 (10.7%) |
| Information | 137 (69.2%) | 61 (30.8%) |
| Finance & Insurance | 64 (27.4%) | 170 (72.7%) |
| Real Estate, Rental & Leasing | 23 (56.1%) | 18 (43.9%) |
| Professional & Scientific | 52 (36.9%) | 89 (63.1%) |
| Enterprise Management | 0 (0.0%) | 0 (0.0%) |
| Administrative & Support | 90 (41.1%) | 129 (58.9%) |
| Educational Services | 122 (29.8%) | 287 (70.2%) |
| Health Care & Social Assistance | 105 (14.8%) | 605 (85.2%) |
| Arts, Entertainment & Recreation | 23 (67.6%) | 11 (32.4%) |
| Accommodation & Food Services | 87 (39.6%) | 133 (60.5%) |
| Public Administration | 153 (54.8%) | 126 (45.2%) |
| Total | 3,281 (55.6%) | 2,615 (44.4%) |
Education in Cass County
School Enrollment in Cass County
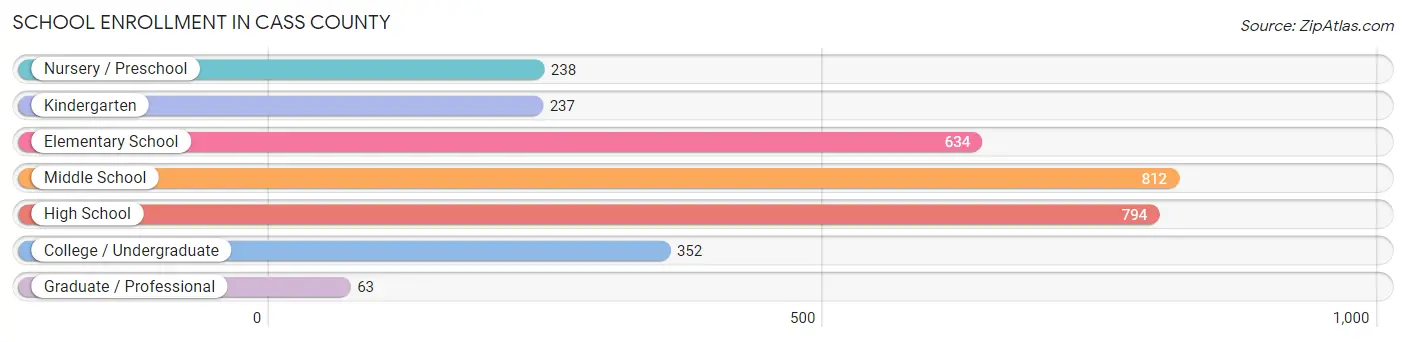
The most common levels of schooling among the 3,130 students in Cass County are middle school (812 | 25.9%), high school (794 | 25.4%), and elementary school (634 | 20.3%).
| School Level | # Students | % Students |
| Nursery / Preschool | 238 | 7.6% |
| Kindergarten | 237 | 7.6% |
| Elementary School | 634 | 20.3% |
| Middle School | 812 | 25.9% |
| High School | 794 | 25.4% |
| College / Undergraduate | 352 | 11.3% |
| Graduate / Professional | 63 | 2.0% |
| Total | 3,130 | 100.0% |
School Enrollment by Age by Funding Source in Cass County
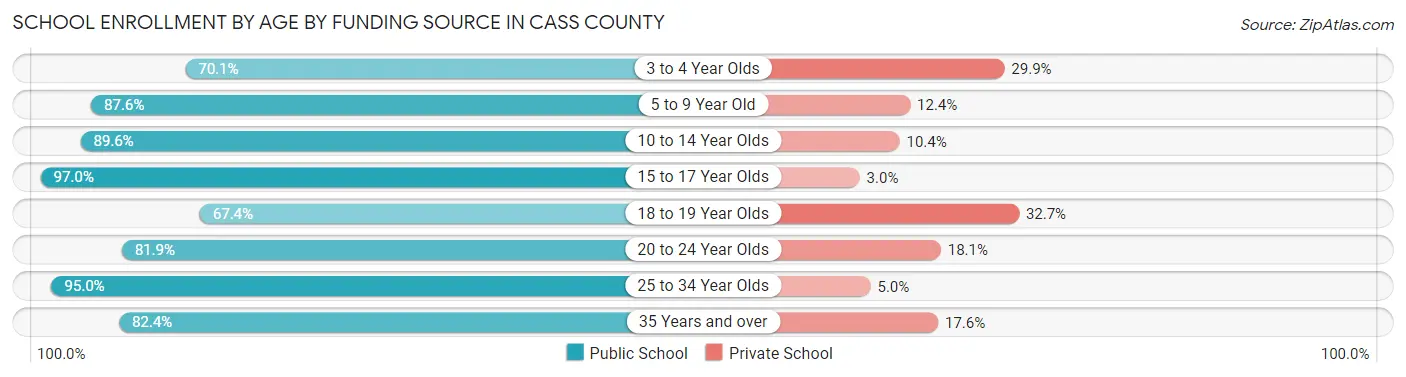
Out of a total of 3,130 students who are enrolled in schools in Cass County, 388 (12.4%) attend a private institution, while the remaining 2,742 (87.6%) are enrolled in public schools. The age group of 18 to 19 year olds has the highest likelihood of being enrolled in private schools, with 48 (32.7% in the age bracket) enrolled. Conversely, the age group of 15 to 17 year olds has the lowest likelihood of being enrolled in a private school, with 488 (97.0% in the age bracket) attending a public institution.
| Age Bracket | Public School | Private School |
| 3 to 4 Year Olds | 124 (70.1%) | 53 (29.9%) |
| 5 to 9 Year Old | 751 (87.6%) | 106 (12.4%) |
| 10 to 14 Year Olds | 938 (89.6%) | 109 (10.4%) |
| 15 to 17 Year Olds | 488 (97.0%) | 15 (3.0%) |
| 18 to 19 Year Olds | 99 (67.3%) | 48 (32.7%) |
| 20 to 24 Year Olds | 154 (81.9%) | 34 (18.1%) |
| 25 to 34 Year Olds | 114 (95.0%) | 6 (5.0%) |
| 35 Years and over | 75 (82.4%) | 16 (17.6%) |
| Total | 2,742 (87.6%) | 388 (12.4%) |
Educational Attainment by Field of Study in Cass County
Education (432 | 24.9%), bio, nature & agricultural (385 | 22.2%), business (171 | 9.8%), science & technology (119 | 6.9%), and psychology (118 | 6.8%) are the most common fields of study among 1,737 individuals in Cass County who have obtained a bachelor's degree or higher.
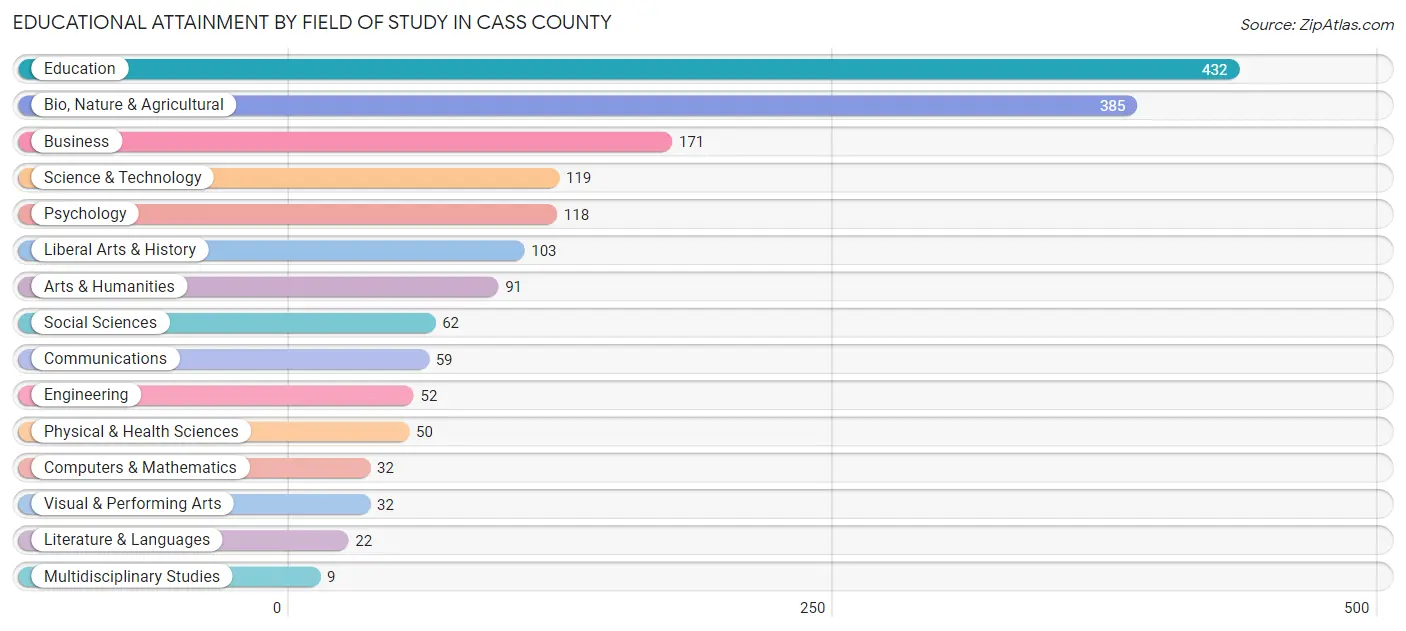
| Field of Study | # Graduates | % Graduates |
| Computers & Mathematics | 32 | 1.8% |
| Bio, Nature & Agricultural | 385 | 22.2% |
| Physical & Health Sciences | 50 | 2.9% |
| Psychology | 118 | 6.8% |
| Social Sciences | 62 | 3.6% |
| Engineering | 52 | 3.0% |
| Multidisciplinary Studies | 9 | 0.5% |
| Science & Technology | 119 | 6.9% |
| Business | 171 | 9.8% |
| Education | 432 | 24.9% |
| Literature & Languages | 22 | 1.3% |
| Liberal Arts & History | 103 | 5.9% |
| Visual & Performing Arts | 32 | 1.8% |
| Communications | 59 | 3.4% |
| Arts & Humanities | 91 | 5.2% |
| Total | 1,737 | 100.0% |
Transportation & Commute in Cass County
Vehicle Availability by Sex in Cass County
The most prevalent vehicle ownership categories in Cass County are males with 2 vehicles (1,416, accounting for 43.6%) and females with 2 vehicles (951, making up 56.7%).
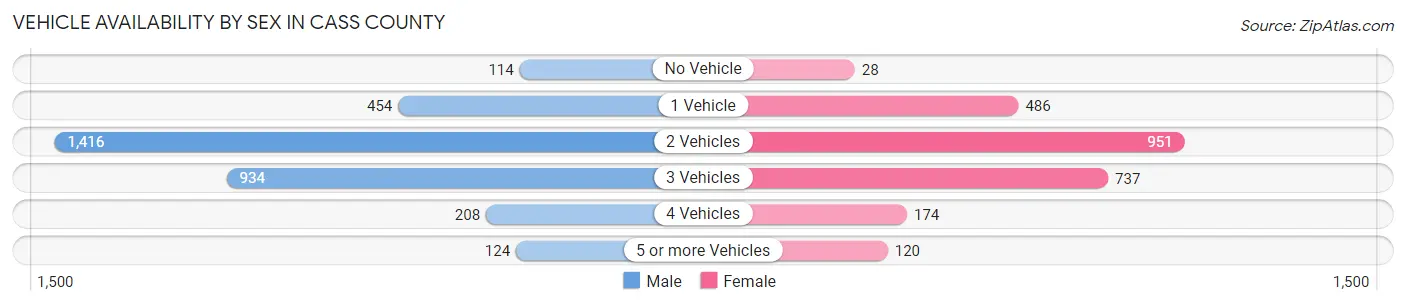
| Vehicles Available | Male | Female |
| No Vehicle | 114 (3.5%) | 28 (1.1%) |
| 1 Vehicle | 454 (14.0%) | 486 (19.5%) |
| 2 Vehicles | 1,416 (43.6%) | 951 (38.1%) |
| 3 Vehicles | 934 (28.7%) | 737 (29.5%) |
| 4 Vehicles | 208 (6.4%) | 174 (7.0%) |
| 5 or more Vehicles | 124 (3.8%) | 120 (4.8%) |
| Total | 3,250 (100.0%) | 2,496 (100.0%) |
Commute Time in Cass County
The most frequently occuring commute durations in Cass County are 5 to 9 minutes (1,425 commuters, 26.0%), 10 to 14 minutes (801 commuters, 14.6%), and 30 to 34 minutes (627 commuters, 11.4%).
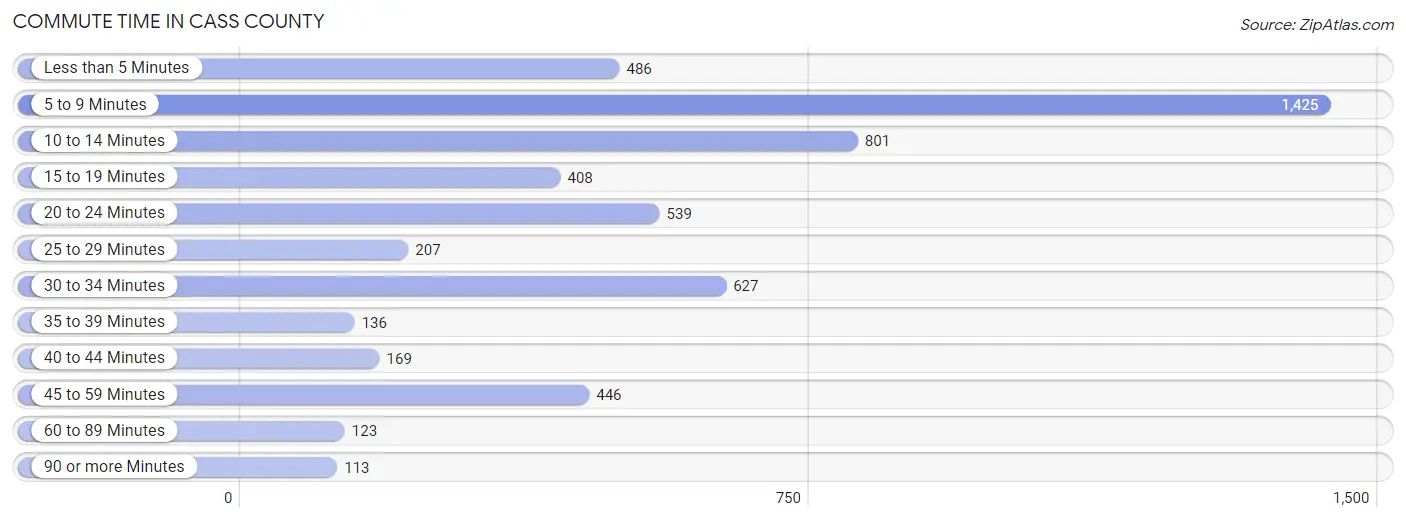
| Commute Time | # Commuters | % Commuters |
| Less than 5 Minutes | 486 | 8.9% |
| 5 to 9 Minutes | 1,425 | 26.0% |
| 10 to 14 Minutes | 801 | 14.6% |
| 15 to 19 Minutes | 408 | 7.4% |
| 20 to 24 Minutes | 539 | 9.8% |
| 25 to 29 Minutes | 207 | 3.8% |
| 30 to 34 Minutes | 627 | 11.4% |
| 35 to 39 Minutes | 136 | 2.5% |
| 40 to 44 Minutes | 169 | 3.1% |
| 45 to 59 Minutes | 446 | 8.1% |
| 60 to 89 Minutes | 123 | 2.2% |
| 90 or more Minutes | 113 | 2.1% |
Commute Time by Sex in Cass County
The most common commute times in Cass County are 5 to 9 minutes (795 commuters, 26.0%) for males and 5 to 9 minutes (630 commuters, 26.0%) for females.
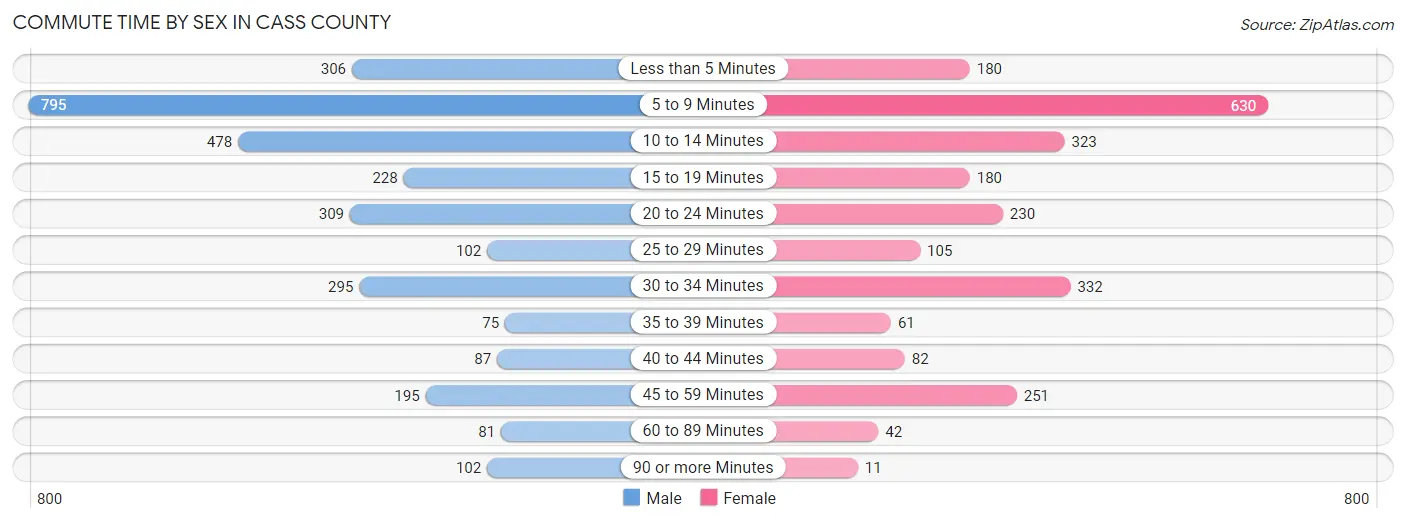
| Commute Time | Male | Female |
| Less than 5 Minutes | 306 (10.0%) | 180 (7.4%) |
| 5 to 9 Minutes | 795 (26.0%) | 630 (26.0%) |
| 10 to 14 Minutes | 478 (15.7%) | 323 (13.3%) |
| 15 to 19 Minutes | 228 (7.5%) | 180 (7.4%) |
| 20 to 24 Minutes | 309 (10.1%) | 230 (9.5%) |
| 25 to 29 Minutes | 102 (3.3%) | 105 (4.3%) |
| 30 to 34 Minutes | 295 (9.7%) | 332 (13.7%) |
| 35 to 39 Minutes | 75 (2.5%) | 61 (2.5%) |
| 40 to 44 Minutes | 87 (2.9%) | 82 (3.4%) |
| 45 to 59 Minutes | 195 (6.4%) | 251 (10.3%) |
| 60 to 89 Minutes | 81 (2.6%) | 42 (1.7%) |
| 90 or more Minutes | 102 (3.3%) | 11 (0.4%) |
Time of Departure to Work by Sex in Cass County
The most frequent times of departure to work in Cass County are 12:00 PM to 3:59 PM (493, 16.2%) for males and 7:30 AM to 7:59 AM (361, 14.9%) for females.
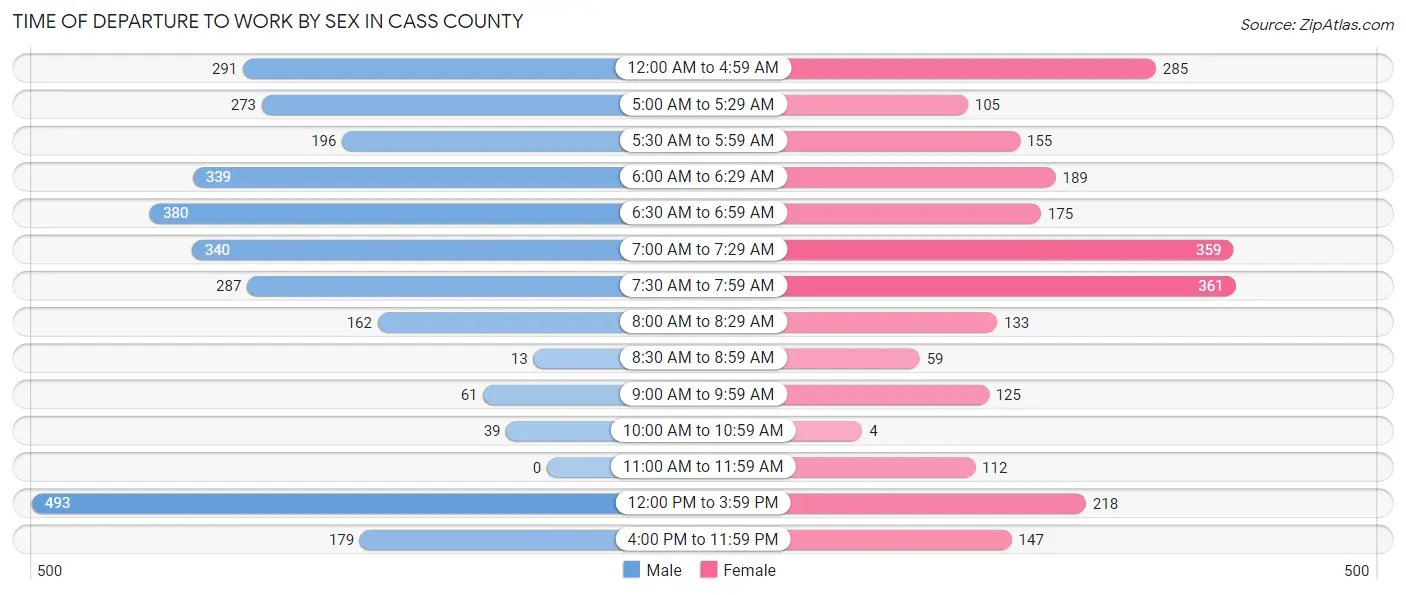
| Time of Departure | Male | Female |
| 12:00 AM to 4:59 AM | 291 (9.5%) | 285 (11.7%) |
| 5:00 AM to 5:29 AM | 273 (8.9%) | 105 (4.3%) |
| 5:30 AM to 5:59 AM | 196 (6.4%) | 155 (6.4%) |
| 6:00 AM to 6:29 AM | 339 (11.1%) | 189 (7.8%) |
| 6:30 AM to 6:59 AM | 380 (12.4%) | 175 (7.2%) |
| 7:00 AM to 7:29 AM | 340 (11.1%) | 359 (14.8%) |
| 7:30 AM to 7:59 AM | 287 (9.4%) | 361 (14.9%) |
| 8:00 AM to 8:29 AM | 162 (5.3%) | 133 (5.5%) |
| 8:30 AM to 8:59 AM | 13 (0.4%) | 59 (2.4%) |
| 9:00 AM to 9:59 AM | 61 (2.0%) | 125 (5.1%) |
| 10:00 AM to 10:59 AM | 39 (1.3%) | 4 (0.2%) |
| 11:00 AM to 11:59 AM | 0 (0.0%) | 112 (4.6%) |
| 12:00 PM to 3:59 PM | 493 (16.2%) | 218 (9.0%) |
| 4:00 PM to 11:59 PM | 179 (5.9%) | 147 (6.1%) |
| Total | 3,053 (100.0%) | 2,427 (100.0%) |
Housing Occupancy in Cass County
Occupancy by Ownership in Cass County
Of the total 5,004 dwellings in Cass County, owner-occupied units account for 3,861 (77.2%), while renter-occupied units make up 1,143 (22.8%).
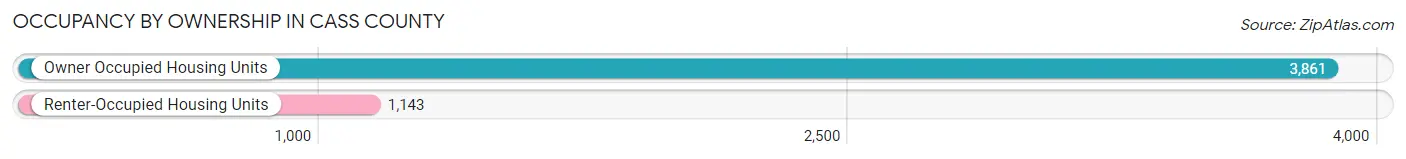
| Occupancy | # Housing Units | % Housing Units |
| Owner Occupied Housing Units | 3,861 | 77.2% |
| Renter-Occupied Housing Units | 1,143 | 22.8% |
| Total Occupied Housing Units | 5,004 | 100.0% |
Occupancy by Household Size in Cass County
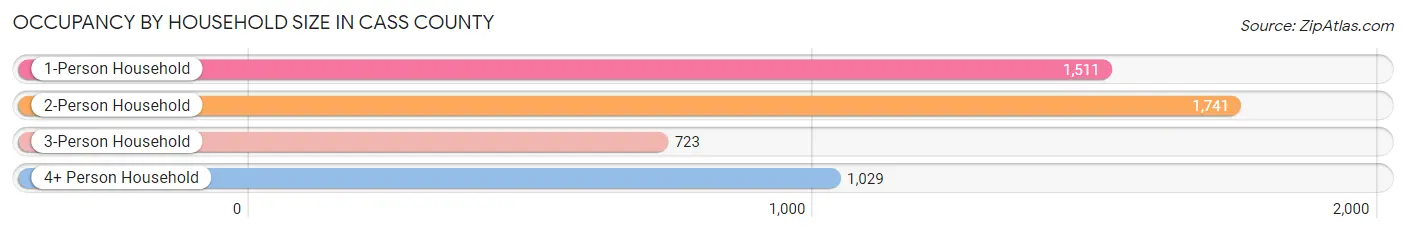
| Household Size | # Housing Units | % Housing Units |
| 1-Person Household | 1,511 | 30.2% |
| 2-Person Household | 1,741 | 34.8% |
| 3-Person Household | 723 | 14.4% |
| 4+ Person Household | 1,029 | 20.6% |
| Total Housing Units | 5,004 | 100.0% |
Occupancy by Ownership by Household Size in Cass County
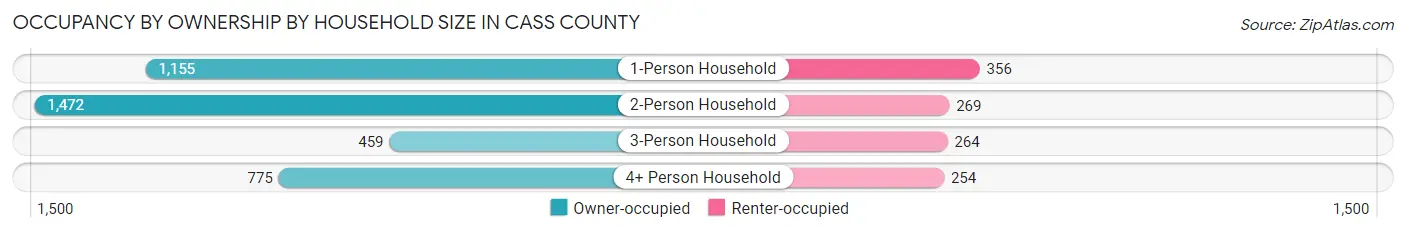
| Household Size | Owner-occupied | Renter-occupied |
| 1-Person Household | 1,155 (76.4%) | 356 (23.6%) |
| 2-Person Household | 1,472 (84.6%) | 269 (15.4%) |
| 3-Person Household | 459 (63.5%) | 264 (36.5%) |
| 4+ Person Household | 775 (75.3%) | 254 (24.7%) |
| Total Housing Units | 3,861 (77.2%) | 1,143 (22.8%) |
Occupancy by Educational Attainment in Cass County
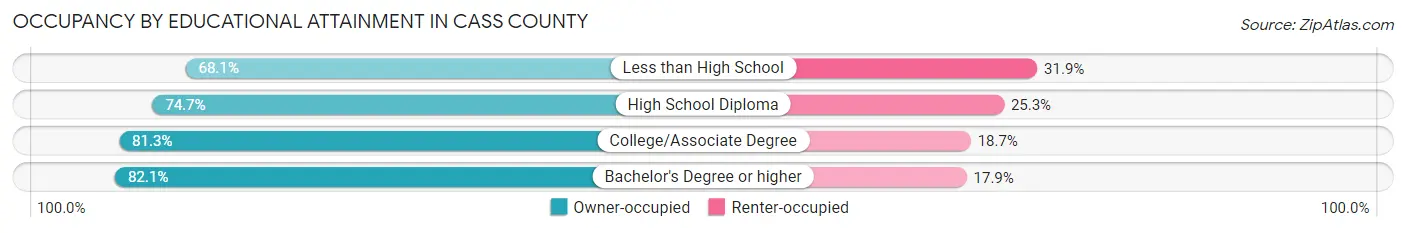
| Household Size | Owner-occupied | Renter-occupied |
| Less than High School | 433 (68.1%) | 203 (31.9%) |
| High School Diploma | 1,468 (74.7%) | 498 (25.3%) |
| College/Associate Degree | 1,145 (81.3%) | 264 (18.7%) |
| Bachelor's Degree or higher | 815 (82.1%) | 178 (17.9%) |
Occupancy by Age of Householder in Cass County
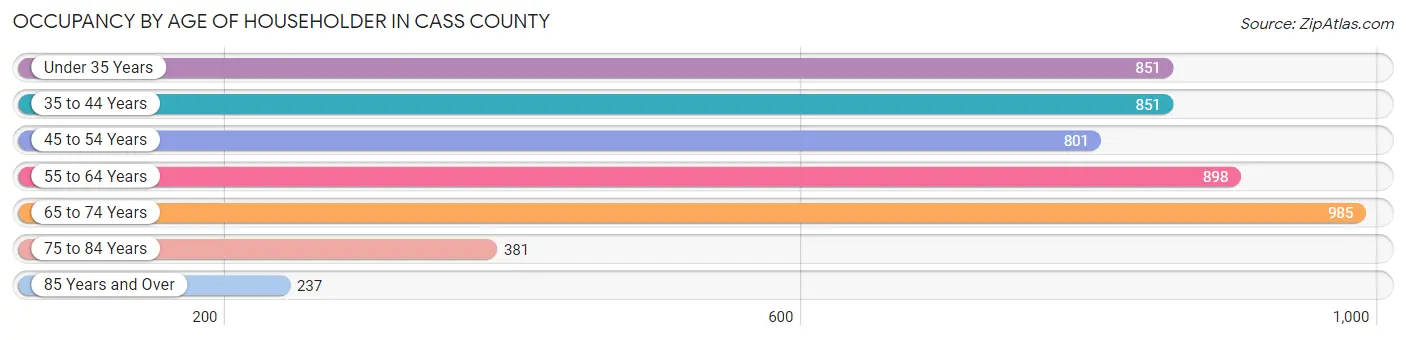
| Age Bracket | # Households | % Households |
| Under 35 Years | 851 | 17.0% |
| 35 to 44 Years | 851 | 17.0% |
| 45 to 54 Years | 801 | 16.0% |
| 55 to 64 Years | 898 | 17.9% |
| 65 to 74 Years | 985 | 19.7% |
| 75 to 84 Years | 381 | 7.6% |
| 85 Years and Over | 237 | 4.7% |
| Total | 5,004 | 100.0% |
Housing Finances in Cass County
Median Income by Occupancy in Cass County
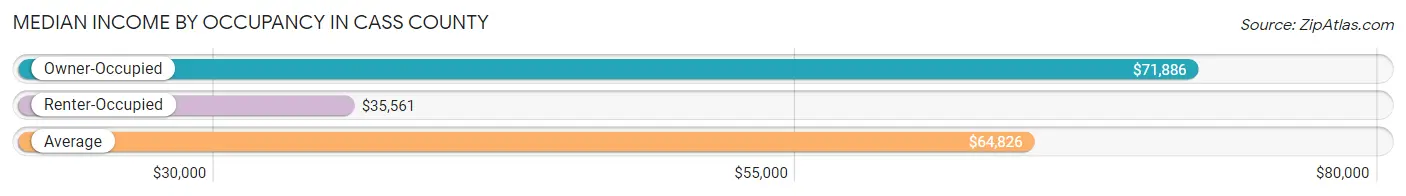
| Occupancy Type | # Households | Median Income |
| Owner-Occupied | 3,861 (77.2%) | $71,886 |
| Renter-Occupied | 1,143 (22.8%) | $35,561 |
| Average | 5,004 (100.0%) | $64,826 |
Occupancy by Householder Income Bracket in Cass County
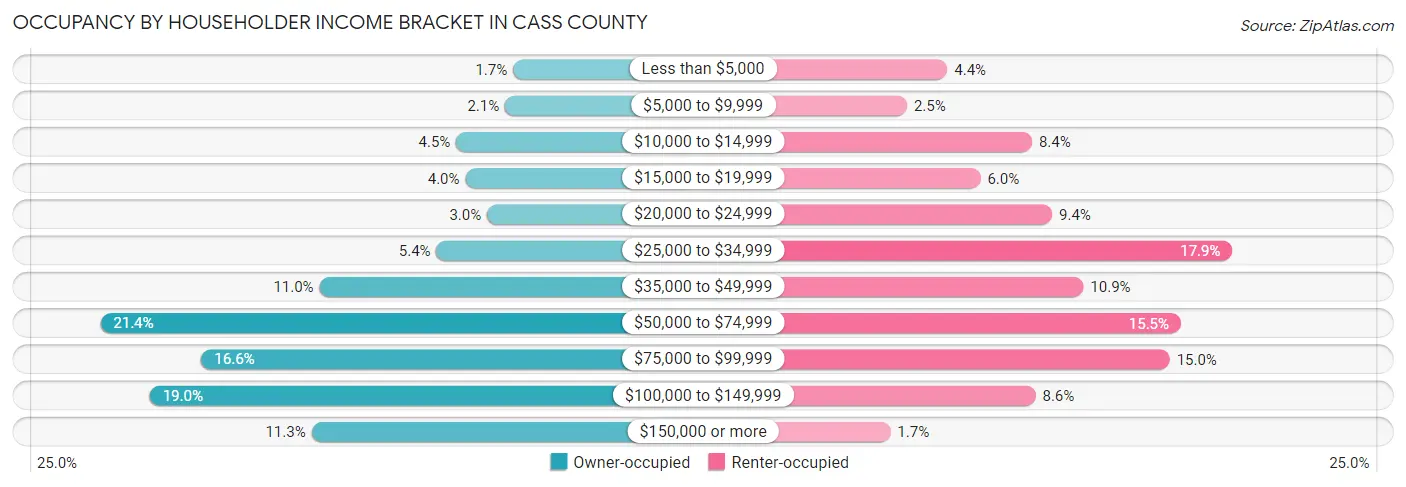
| Income Bracket | Owner-occupied | Renter-occupied |
| Less than $5,000 | 67 (1.7%) | 50 (4.4%) |
| $5,000 to $9,999 | 82 (2.1%) | 28 (2.5%) |
| $10,000 to $14,999 | 172 (4.4%) | 96 (8.4%) |
| $15,000 to $19,999 | 155 (4.0%) | 68 (5.9%) |
| $20,000 to $24,999 | 115 (3.0%) | 107 (9.4%) |
| $25,000 to $34,999 | 208 (5.4%) | 205 (17.9%) |
| $35,000 to $49,999 | 423 (11.0%) | 124 (10.8%) |
| $50,000 to $74,999 | 826 (21.4%) | 177 (15.5%) |
| $75,000 to $99,999 | 640 (16.6%) | 171 (15.0%) |
| $100,000 to $149,999 | 735 (19.0%) | 98 (8.6%) |
| $150,000 or more | 438 (11.3%) | 19 (1.7%) |
| Total | 3,861 (100.0%) | 1,143 (100.0%) |
Monthly Housing Cost Tiers in Cass County
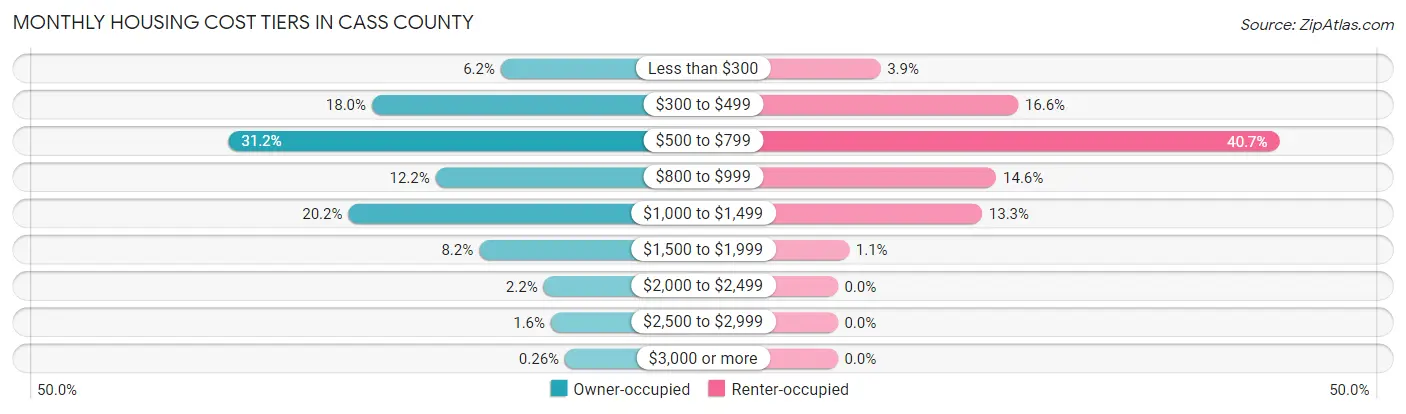
| Monthly Cost | Owner-occupied | Renter-occupied |
| Less than $300 | 238 (6.2%) | 45 (3.9%) |
| $300 to $499 | 696 (18.0%) | 190 (16.6%) |
| $500 to $799 | 1,206 (31.2%) | 465 (40.7%) |
| $800 to $999 | 470 (12.2%) | 167 (14.6%) |
| $1,000 to $1,499 | 780 (20.2%) | 152 (13.3%) |
| $1,500 to $1,999 | 315 (8.2%) | 12 (1.1%) |
| $2,000 to $2,499 | 86 (2.2%) | 0 (0.0%) |
| $2,500 to $2,999 | 60 (1.5%) | 0 (0.0%) |
| $3,000 or more | 10 (0.3%) | 0 (0.0%) |
| Total | 3,861 (100.0%) | 1,143 (100.0%) |
Physical Housing Characteristics in Cass County
Housing Structures in Cass County
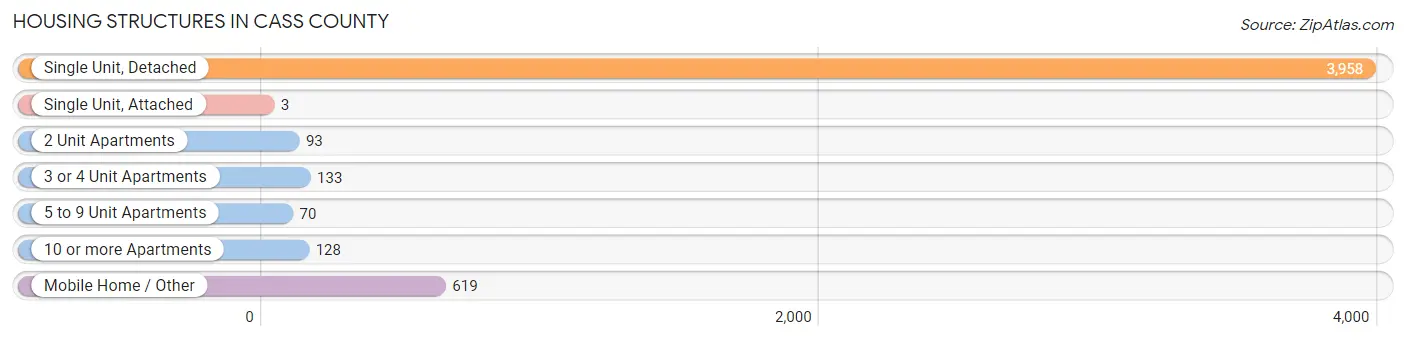
| Structure Type | # Housing Units | % Housing Units |
| Single Unit, Detached | 3,958 | 79.1% |
| Single Unit, Attached | 3 | 0.1% |
| 2 Unit Apartments | 93 | 1.9% |
| 3 or 4 Unit Apartments | 133 | 2.7% |
| 5 to 9 Unit Apartments | 70 | 1.4% |
| 10 or more Apartments | 128 | 2.6% |
| Mobile Home / Other | 619 | 12.4% |
| Total | 5,004 | 100.0% |
Housing Structures by Occupancy in Cass County
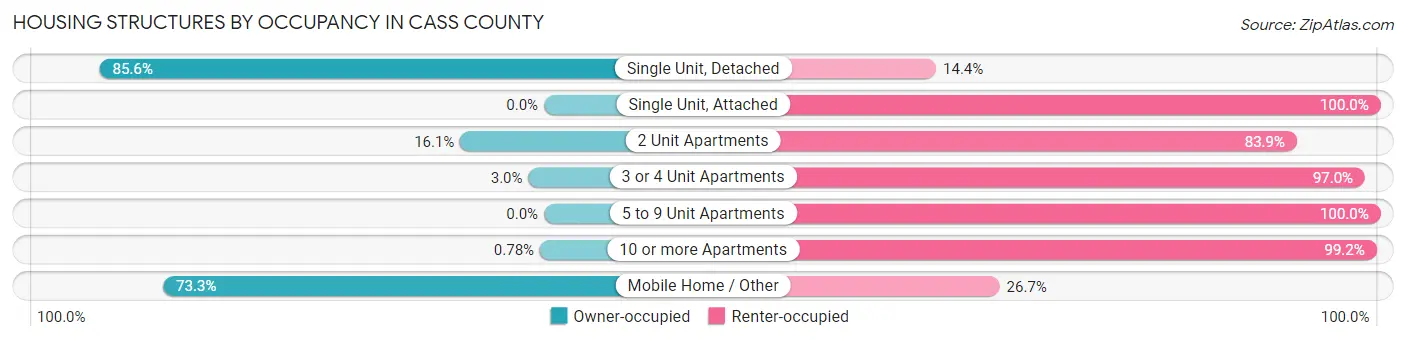
| Structure Type | Owner-occupied | Renter-occupied |
| Single Unit, Detached | 3,387 (85.6%) | 571 (14.4%) |
| Single Unit, Attached | 0 (0.0%) | 3 (100.0%) |
| 2 Unit Apartments | 15 (16.1%) | 78 (83.9%) |
| 3 or 4 Unit Apartments | 4 (3.0%) | 129 (97.0%) |
| 5 to 9 Unit Apartments | 0 (0.0%) | 70 (100.0%) |
| 10 or more Apartments | 1 (0.8%) | 127 (99.2%) |
| Mobile Home / Other | 454 (73.3%) | 165 (26.7%) |
| Total | 3,861 (77.2%) | 1,143 (22.8%) |
Housing Structures by Number of Rooms in Cass County
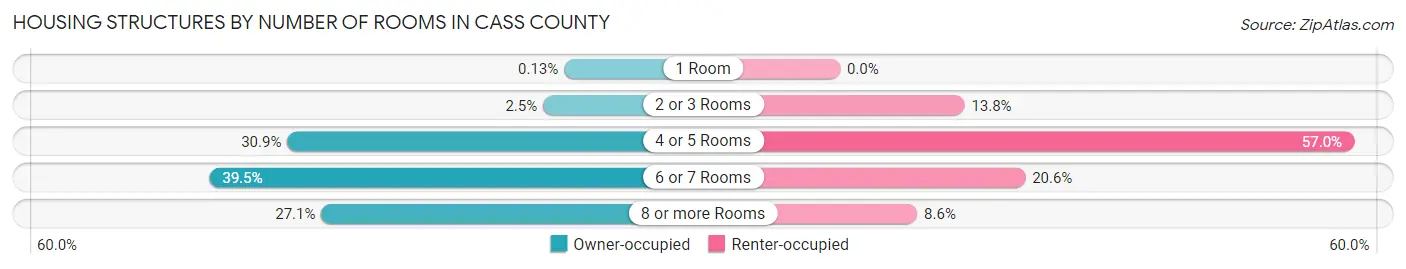
| Number of Rooms | Owner-occupied | Renter-occupied |
| 1 Room | 5 (0.1%) | 0 (0.0%) |
| 2 or 3 Rooms | 95 (2.5%) | 158 (13.8%) |
| 4 or 5 Rooms | 1,191 (30.8%) | 652 (57.0%) |
| 6 or 7 Rooms | 1,525 (39.5%) | 235 (20.6%) |
| 8 or more Rooms | 1,045 (27.1%) | 98 (8.6%) |
| Total | 3,861 (100.0%) | 1,143 (100.0%) |
Housing Structure by Heating Type in Cass County
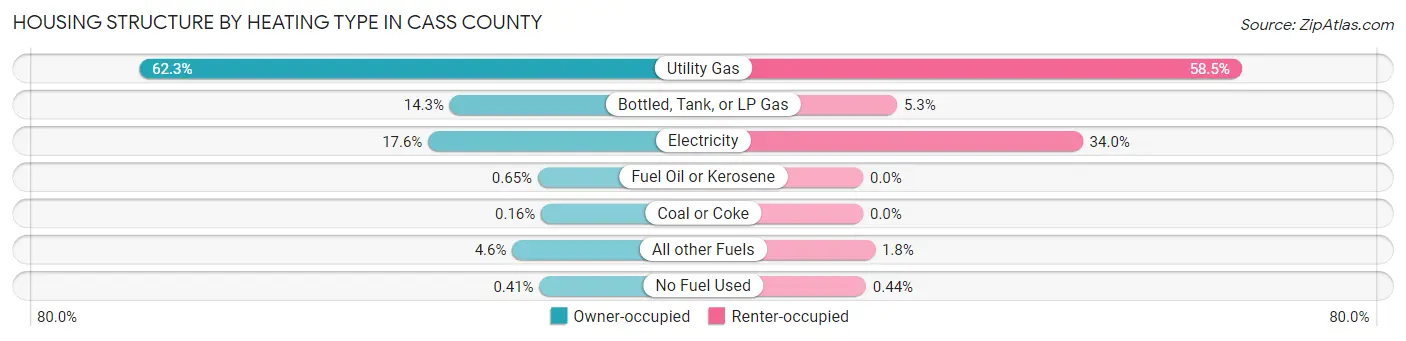
| Heating Type | Owner-occupied | Renter-occupied |
| Utility Gas | 2,405 (62.3%) | 669 (58.5%) |
| Bottled, Tank, or LP Gas | 551 (14.3%) | 60 (5.2%) |
| Electricity | 680 (17.6%) | 388 (34.0%) |
| Fuel Oil or Kerosene | 25 (0.6%) | 0 (0.0%) |
| Coal or Coke | 6 (0.2%) | 0 (0.0%) |
| All other Fuels | 178 (4.6%) | 21 (1.8%) |
| No Fuel Used | 16 (0.4%) | 5 (0.4%) |
| Total | 3,861 (100.0%) | 1,143 (100.0%) |
Household Vehicle Usage in Cass County
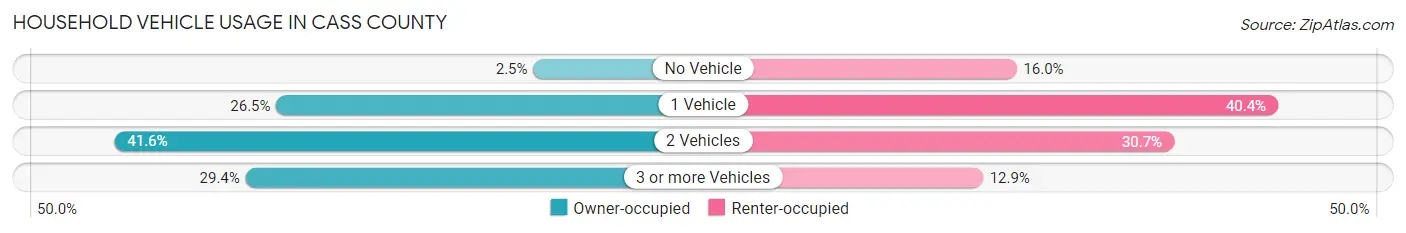
| Vehicles per Household | Owner-occupied | Renter-occupied |
| No Vehicle | 97 (2.5%) | 183 (16.0%) |
| 1 Vehicle | 1,023 (26.5%) | 462 (40.4%) |
| 2 Vehicles | 1,607 (41.6%) | 351 (30.7%) |
| 3 or more Vehicles | 1,134 (29.4%) | 147 (12.9%) |
| Total | 3,861 (100.0%) | 1,143 (100.0%) |
Real Estate & Mortgages in Cass County
Real Estate and Mortgage Overview in Cass County
| Characteristic | Without Mortgage | With Mortgage |
| Housing Units | 1,954 | 1,907 |
| Median Property Value | $88,100 | $95,300 |
| Median Household Income | $60,261 | $299 |
| Monthly Housing Costs | $527 | $10 |
| Real Estate Taxes | $1,738 | $64 |
Property Value by Mortgage Status in Cass County
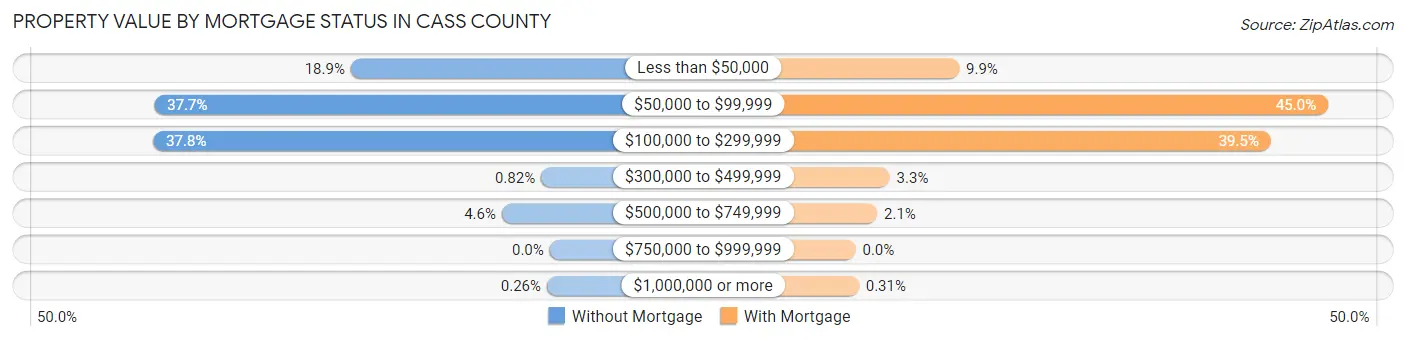
| Property Value | Without Mortgage | With Mortgage |
| Less than $50,000 | 370 (18.9%) | 188 (9.9%) |
| $50,000 to $99,999 | 736 (37.7%) | 858 (45.0%) |
| $100,000 to $299,999 | 738 (37.8%) | 754 (39.5%) |
| $300,000 to $499,999 | 16 (0.8%) | 62 (3.3%) |
| $500,000 to $749,999 | 89 (4.5%) | 39 (2.1%) |
| $750,000 to $999,999 | 0 (0.0%) | 0 (0.0%) |
| $1,000,000 or more | 5 (0.3%) | 6 (0.3%) |
| Total | 1,954 (100.0%) | 1,907 (100.0%) |
Household Income by Mortgage Status in Cass County
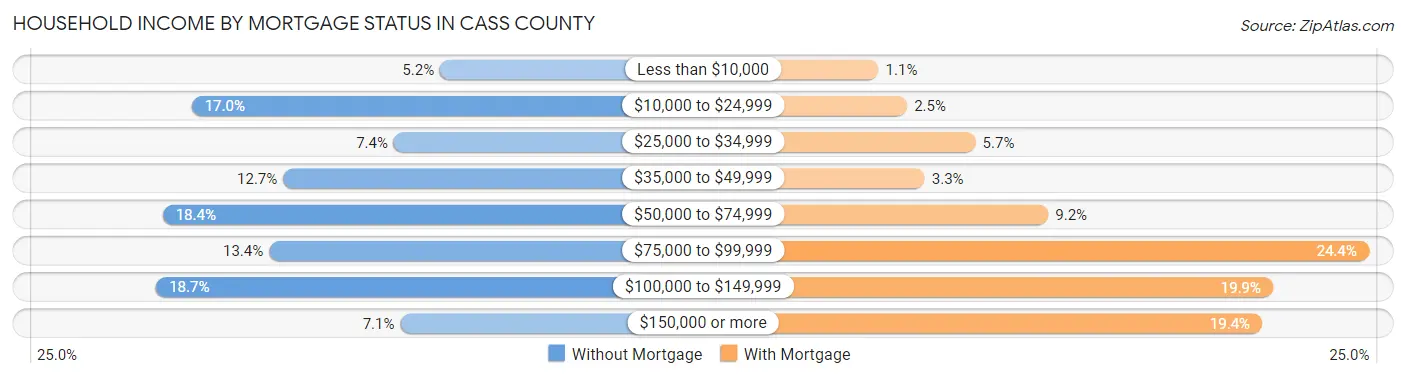
| Household Income | Without Mortgage | With Mortgage |
| Less than $10,000 | 102 (5.2%) | 21 (1.1%) |
| $10,000 to $24,999 | 333 (17.0%) | 47 (2.5%) |
| $25,000 to $34,999 | 145 (7.4%) | 109 (5.7%) |
| $35,000 to $49,999 | 248 (12.7%) | 63 (3.3%) |
| $50,000 to $74,999 | 360 (18.4%) | 175 (9.2%) |
| $75,000 to $99,999 | 261 (13.4%) | 466 (24.4%) |
| $100,000 to $149,999 | 366 (18.7%) | 379 (19.9%) |
| $150,000 or more | 139 (7.1%) | 369 (19.4%) |
| Total | 1,954 (100.0%) | 1,907 (100.0%) |
Property Value to Household Income Ratio in Cass County
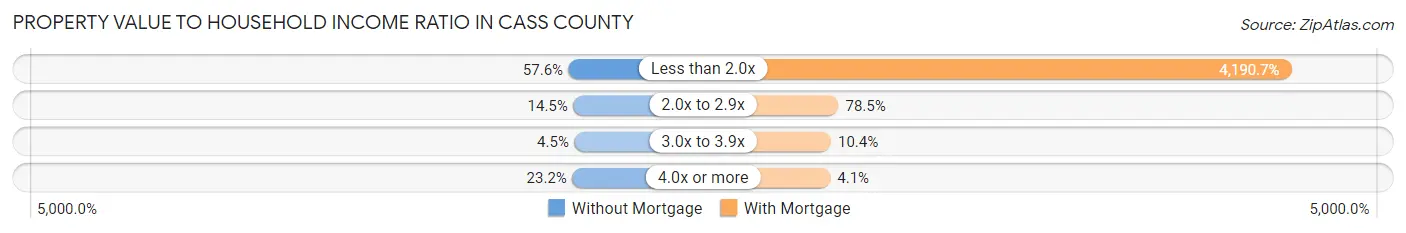
| Value-to-Income Ratio | Without Mortgage | With Mortgage |
| Less than 2.0x | 1,125 (57.6%) | 79,917 (4,190.7%) |
| 2.0x to 2.9x | 283 (14.5%) | 1,496 (78.4%) |
| 3.0x to 3.9x | 88 (4.5%) | 199 (10.4%) |
| 4.0x or more | 454 (23.2%) | 78 (4.1%) |
| Total | 1,954 (100.0%) | 1,907 (100.0%) |
Real Estate Taxes by Mortgage Status in Cass County
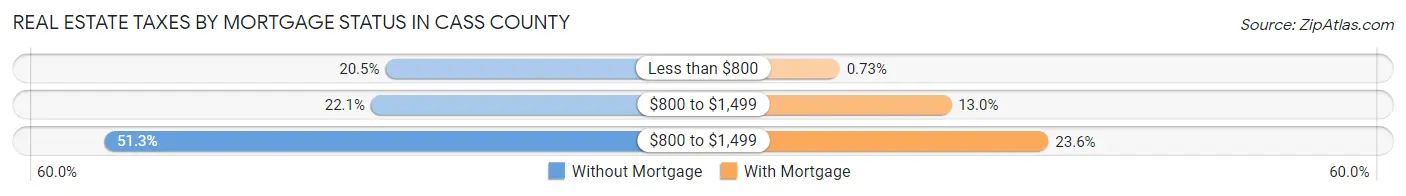
| Property Taxes | Without Mortgage | With Mortgage |
| Less than $800 | 400 (20.5%) | 14 (0.7%) |
| $800 to $1,499 | 431 (22.1%) | 247 (13.0%) |
| $800 to $1,499 | 1,002 (51.3%) | 450 (23.6%) |
| Total | 1,954 (100.0%) | 1,907 (100.0%) |
Health & Disability in Cass County
Health Insurance Coverage by Age in Cass County
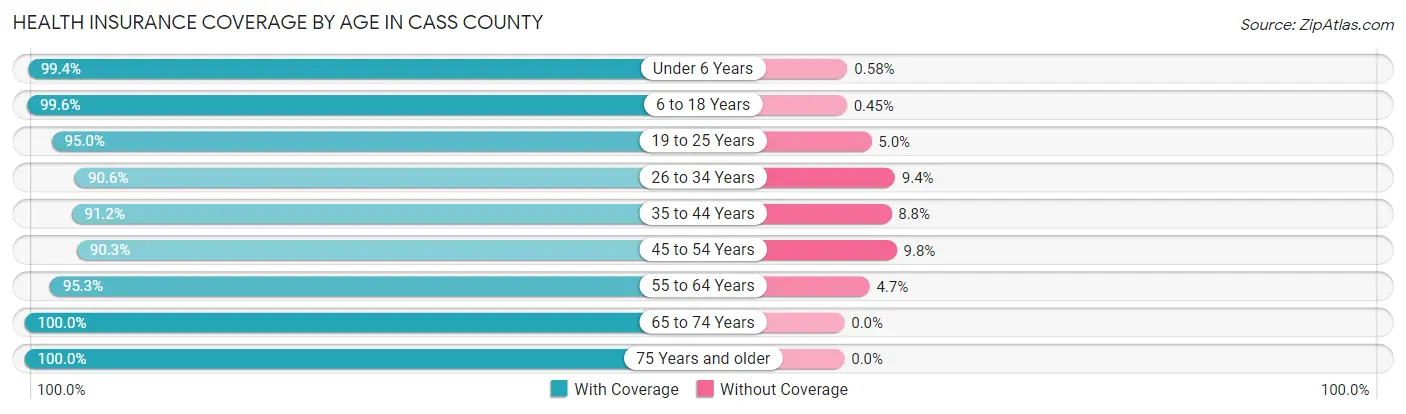
| Age Bracket | With Coverage | Without Coverage |
| Under 6 Years | 858 (99.4%) | 5 (0.6%) |
| 6 to 18 Years | 2,447 (99.6%) | 11 (0.4%) |
| 19 to 25 Years | 979 (95.0%) | 52 (5.0%) |
| 26 to 34 Years | 1,317 (90.6%) | 137 (9.4%) |
| 35 to 44 Years | 1,541 (91.2%) | 148 (8.8%) |
| 45 to 54 Years | 1,324 (90.2%) | 143 (9.8%) |
| 55 to 64 Years | 1,580 (95.3%) | 78 (4.7%) |
| 65 to 74 Years | 1,393 (100.0%) | 0 (0.0%) |
| 75 Years and older | 834 (100.0%) | 0 (0.0%) |
| Total | 12,273 (95.5%) | 574 (4.5%) |
Health Insurance Coverage by Citizenship Status in Cass County
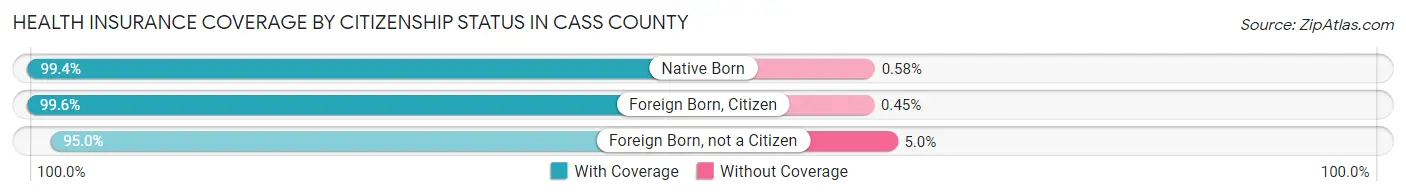
| Citizenship Status | With Coverage | Without Coverage |
| Native Born | 858 (99.4%) | 5 (0.6%) |
| Foreign Born, Citizen | 2,447 (99.6%) | 11 (0.4%) |
| Foreign Born, not a Citizen | 979 (95.0%) | 52 (5.0%) |
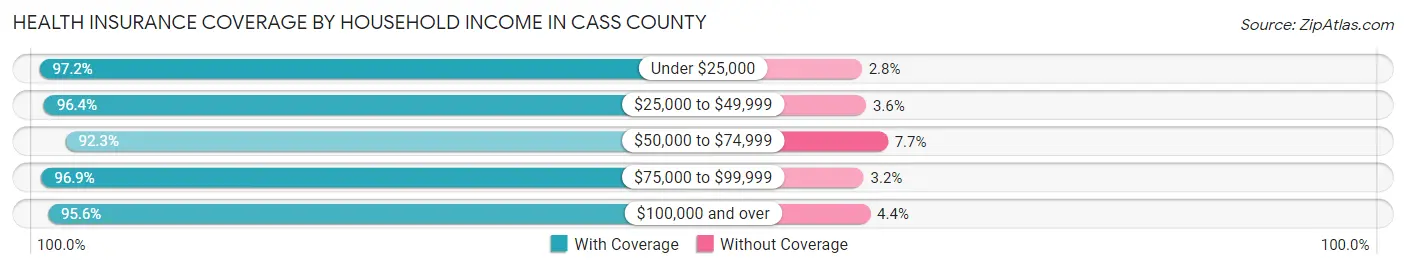
Health Insurance Coverage by Household Income in Cass County
| Household Income | With Coverage | Without Coverage |
| Under $25,000 | 1,461 (97.2%) | 42 (2.8%) |
| $25,000 to $49,999 | 1,984 (96.4%) | 74 (3.6%) |
| $50,000 to $74,999 | 2,394 (92.3%) | 199 (7.7%) |
| $75,000 to $99,999 | 2,522 (96.9%) | 82 (3.2%) |
| $100,000 and over | 3,867 (95.6%) | 177 (4.4%) |
Public vs Private Health Insurance Coverage by Age in Cass County
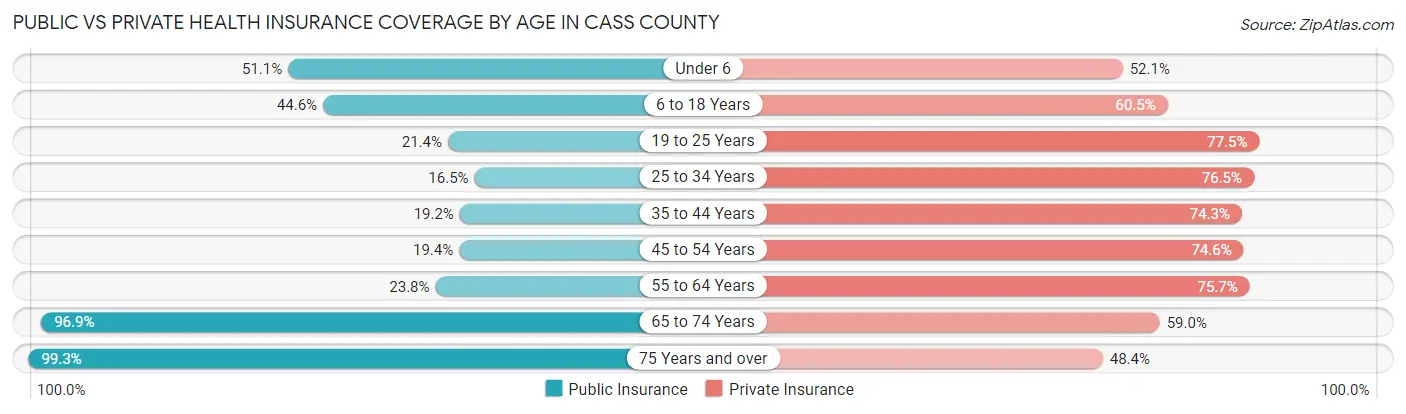
| Age Bracket | Public Insurance | Private Insurance |
| Under 6 | 441 (51.1%) | 450 (52.1%) |
| 6 to 18 Years | 1,097 (44.6%) | 1,486 (60.5%) |
| 19 to 25 Years | 221 (21.4%) | 799 (77.5%) |
| 25 to 34 Years | 240 (16.5%) | 1,112 (76.5%) |
| 35 to 44 Years | 325 (19.2%) | 1,254 (74.3%) |
| 45 to 54 Years | 284 (19.4%) | 1,094 (74.6%) |
| 55 to 64 Years | 394 (23.8%) | 1,255 (75.7%) |
| 65 to 74 Years | 1,350 (96.9%) | 822 (59.0%) |
| 75 Years and over | 828 (99.3%) | 404 (48.4%) |
| Total | 5,180 (40.3%) | 8,676 (67.5%) |
Disability Status by Sex by Age in Cass County
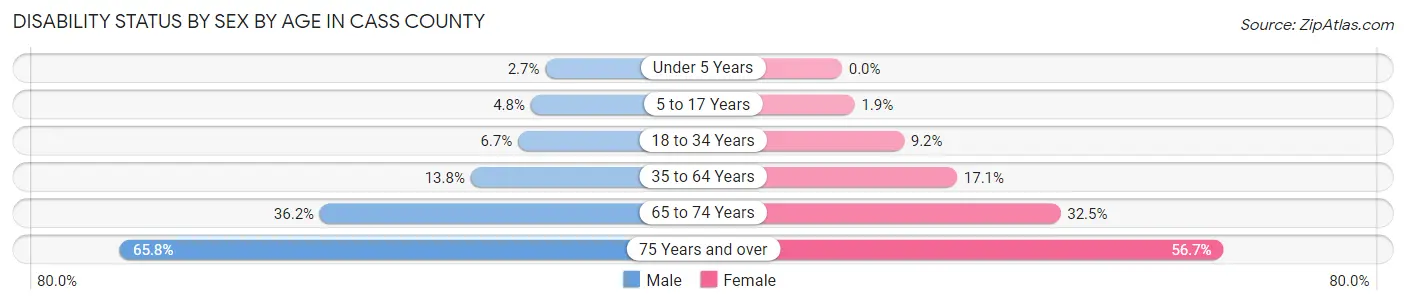
| Age Bracket | Male | Female |
| Under 5 Years | 7 (2.7%) | 0 (0.0%) |
| 5 to 17 Years | 68 (4.8%) | 20 (1.9%) |
| 18 to 34 Years | 92 (6.7%) | 119 (9.2%) |
| 35 to 64 Years | 340 (13.8%) | 400 (17.1%) |
| 65 to 74 Years | 244 (36.1%) | 233 (32.5%) |
| 75 Years and over | 233 (65.8%) | 272 (56.7%) |
Disability Class by Sex by Age in Cass County
Disability Class: Hearing Difficulty
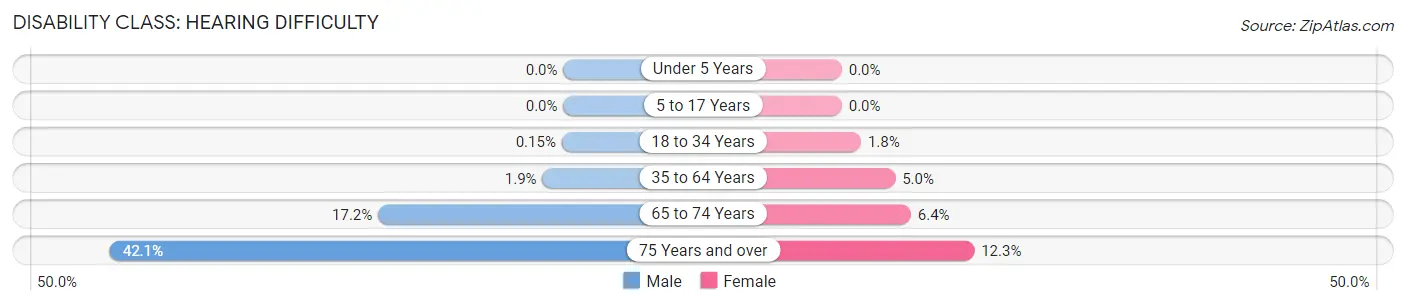
| Age Bracket | Male | Female |
| Under 5 Years | 0 (0.0%) | 0 (0.0%) |
| 5 to 17 Years | 0 (0.0%) | 0 (0.0%) |
| 18 to 34 Years | 2 (0.2%) | 23 (1.8%) |
| 35 to 64 Years | 48 (1.9%) | 116 (5.0%) |
| 65 to 74 Years | 116 (17.2%) | 46 (6.4%) |
| 75 Years and over | 149 (42.1%) | 59 (12.3%) |
Disability Class: Vision Difficulty
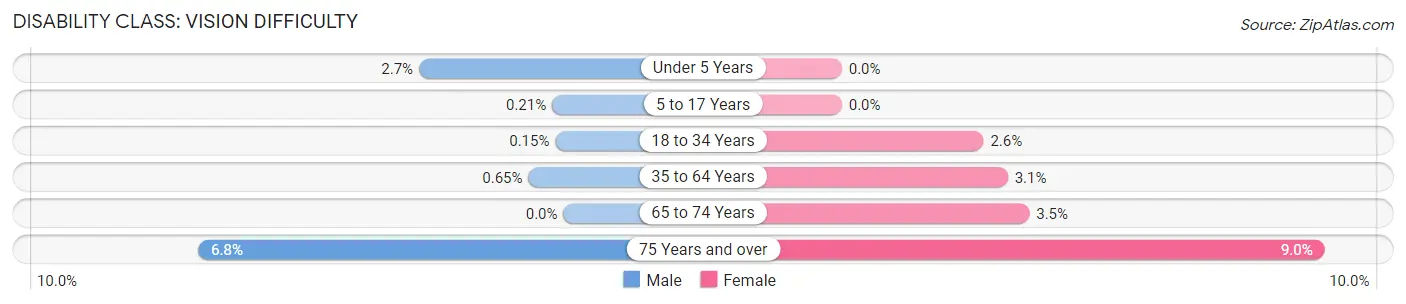
| Age Bracket | Male | Female |
| Under 5 Years | 7 (2.7%) | 0 (0.0%) |
| 5 to 17 Years | 3 (0.2%) | 0 (0.0%) |
| 18 to 34 Years | 2 (0.2%) | 34 (2.6%) |
| 35 to 64 Years | 16 (0.6%) | 72 (3.1%) |
| 65 to 74 Years | 0 (0.0%) | 25 (3.5%) |
| 75 Years and over | 24 (6.8%) | 43 (9.0%) |
Disability Class: Cognitive Difficulty
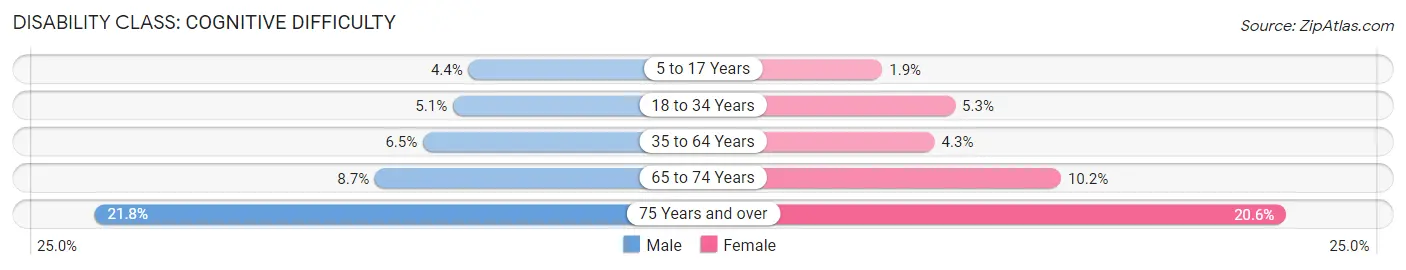
| Age Bracket | Male | Female |
| 5 to 17 Years | 62 (4.4%) | 20 (1.9%) |
| 18 to 34 Years | 70 (5.1%) | 68 (5.3%) |
| 35 to 64 Years | 161 (6.5%) | 101 (4.3%) |
| 65 to 74 Years | 59 (8.7%) | 73 (10.2%) |
| 75 Years and over | 77 (21.7%) | 99 (20.6%) |
Disability Class: Ambulatory Difficulty
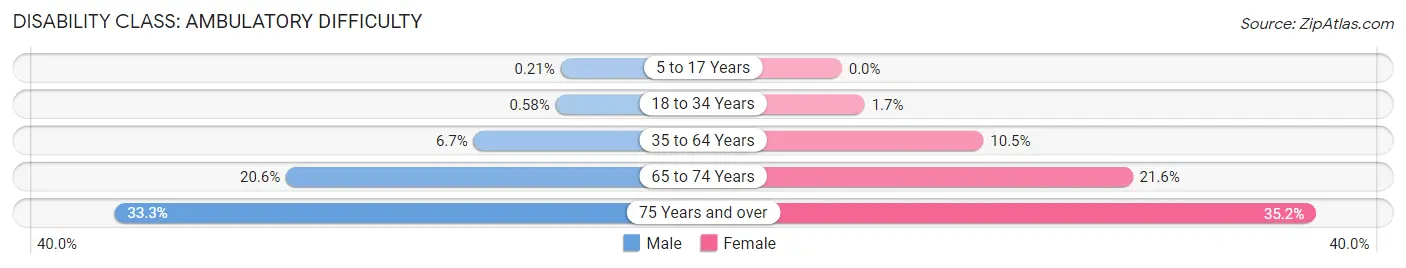
| Age Bracket | Male | Female |
| 5 to 17 Years | 3 (0.2%) | 0 (0.0%) |
| 18 to 34 Years | 8 (0.6%) | 22 (1.7%) |
| 35 to 64 Years | 165 (6.7%) | 246 (10.5%) |
| 65 to 74 Years | 139 (20.6%) | 155 (21.6%) |
| 75 Years and over | 118 (33.3%) | 169 (35.2%) |
Disability Class: Self-Care Difficulty
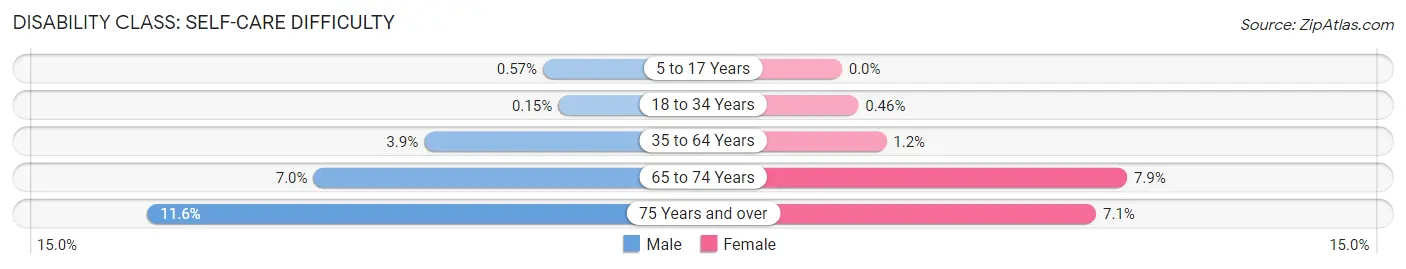
| Age Bracket | Male | Female |
| 5 to 17 Years | 8 (0.6%) | 0 (0.0%) |
| 18 to 34 Years | 2 (0.2%) | 6 (0.5%) |
| 35 to 64 Years | 96 (3.9%) | 29 (1.2%) |
| 65 to 74 Years | 47 (7.0%) | 57 (7.9%) |
| 75 Years and over | 41 (11.6%) | 34 (7.1%) |
Technology Access in Cass County
Computing Device Access in Cass County
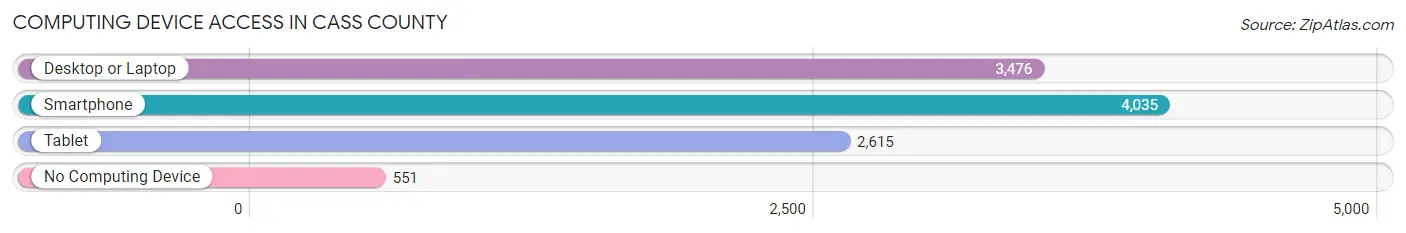
| Device Type | # Households | % Households |
| Desktop or Laptop | 3,476 | 69.5% |
| Smartphone | 4,035 | 80.6% |
| Tablet | 2,615 | 52.3% |
| No Computing Device | 551 | 11.0% |
| Total | 5,004 | 100.0% |
Internet Access in Cass County
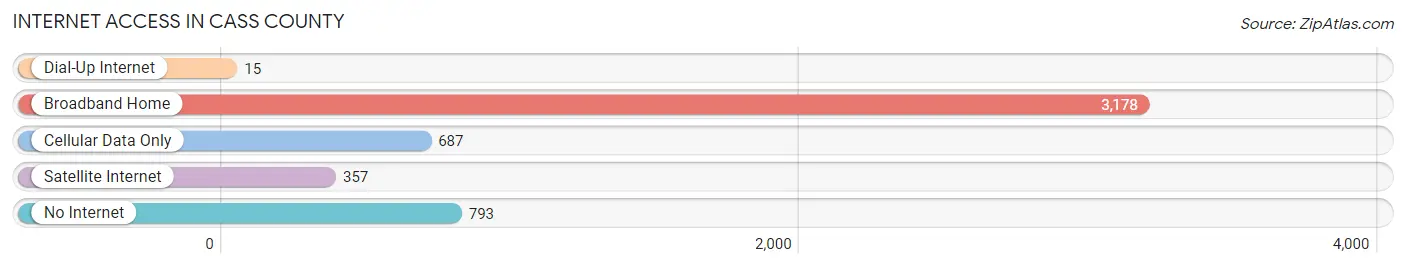
| Internet Type | # Households | % Households |
| Dial-Up Internet | 15 | 0.3% |
| Broadband Home | 3,178 | 63.5% |
| Cellular Data Only | 687 | 13.7% |
| Satellite Internet | 357 | 7.1% |
| No Internet | 793 | 15.9% |
| Total | 5,004 | 100.0% |
Cass County Summary
Cass County, Illinois is located in the central part of the state, and is part of the Springfield Metropolitan Statistical Area. The county was established in 1837 and named after Lewis Cass, a former governor of Michigan. As of the 2010 census, the population was 13,642.
Geography
Cass County is located in the central part of Illinois, and is bordered by Morgan County to the north, Sangamon County to the east, Mason County to the south, and Schuyler County to the west. The county has a total area of 545 square miles, of which 544 square miles is land and 1.2 square miles is water. The county is mostly flat, with some rolling hills in the northern part. The Sangamon River runs through the county, and there are several small lakes and ponds scattered throughout.
Demographics
As of the 2010 census, there were 13,642 people, 5,541 households, and 3,743 families residing in the county. The population density was 25 people per square mile. The racial makeup of the county was 97.3% White, 0.7% African American, 0.2% Native American, 0.2% Asian, 0.2% from other races, and 1.4% from two or more races. Hispanic or Latino of any race were 1.2% of the population.
The median income for a household in the county was $45,845, and the median income for a family was $54,845. The per capita income for the county was $21,845. About 8.7% of families and 11.2% of the population were below the poverty line, including 14.2% of those under age 18 and 8.2% of those age 65 or over.
Economy
The economy of Cass County is largely based on agriculture. The county is home to several large farms, and the main crops grown are corn, soybeans, and wheat. Livestock production is also important, with cattle, hogs, and sheep being the main animals raised.
The county also has a number of small businesses, including manufacturing, retail, and service industries. The largest employers in the county are the local school district, the county government, and the local hospital.
History
Cass County was established in 1837 and named after Lewis Cass, a former governor of Michigan. The county was originally part of Sangamon County, and was created to provide better access to the county seat in Springfield.
The county was largely agricultural in its early years, and the population grew slowly. The first railroad line was built in 1871, and this helped to spur economic growth in the area. The county also benefited from the construction of the Illinois and Michigan Canal in the late 19th century.
In the early 20th century, the county saw a population boom as people moved to the area to take advantage of the agricultural opportunities. The population peaked in the 1950s, but has since declined as people have moved away in search of better economic opportunities.
Common Questions
What is the Total Population of Cass County?
Total Population of Cass County is 12,955.
What is the Total Male Population of Cass County?
Total Male Population of Cass County is 6,557.
What is the Total Female Population of Cass County?
Total Female Population of Cass County is 6,398.
What is the Ratio of Males per 100 Females in Cass County?
There are 102.49 Males per 100 Females in Cass County.
What is the Ratio of Females per 100 Males in Cass County?
There are 97.58 Females per 100 Males in Cass County.
What is the Median Population Age in Cass County?
Median Population Age in Cass County is 38.8 Years.
What is the Average Family Size in Cass County
Average Family Size in Cass County is 3.2 People.
What is the Average Household Size in Cass County
Average Household Size in Cass County is 2.6 People.
What is Per Capita Income in Cass County?
Per Capita income in Cass County is $29,842.
What is the Median Family Income in Cass County?
Median Family Income in Cass County is $75,790.
What is the Median Household income in Cass County?
Median Household Income in Cass County is $64,826.
What is Income or Wage Gap in Cass County?
Income or Wage Gap in Cass County is 31.5%.
Women in Cass County earn 68.5 cents for every dollar earned by a man.
What is Family Income Deficit in Cass County?
Family Income Deficit in Cass County is $10,776.
Families that are below poverty line in Cass County earn $10,776 less on average than the poverty threshold level.
What is Inequality or Gini Index in Cass County?
Inequality or Gini Index in Cass County is 0.40.
How Large is the Labor Force in Cass County?
There are 6,235 People in the Labor Forcein in Cass County.
What is the Percentage of People in the Labor Force in Cass County?
61.2% of People are in the Labor Force in Cass County.
What is the Unemployment Rate in Cass County?
Unemployment Rate in Cass County is 5.4%.