Carroll County, IL
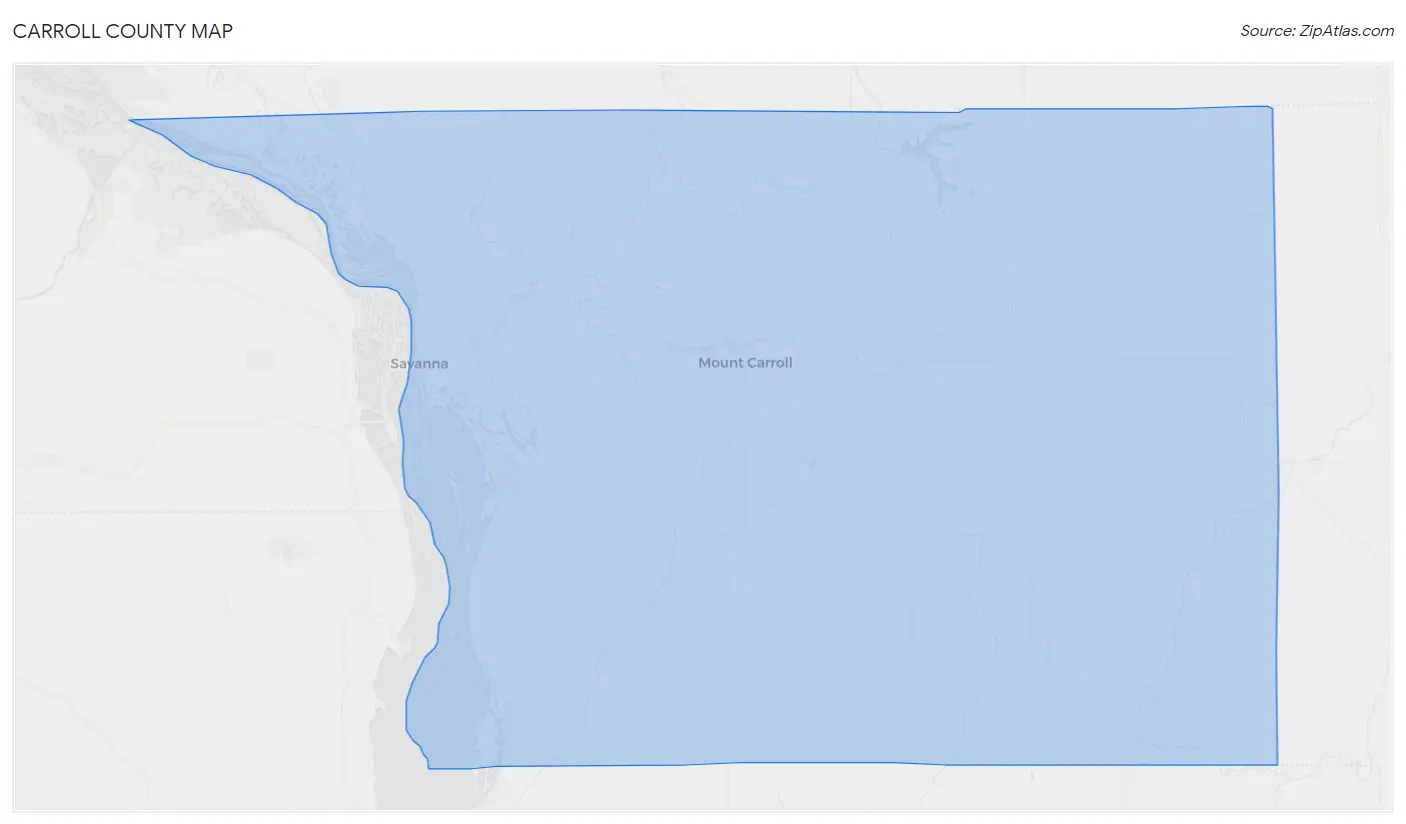
Carroll County Map
Carroll County Overview
15,594
TOTAL POPULATION
8,383
MALE POPULATION
7,211
FEMALE POPULATION
116.25
MALES / 100 FEMALES
86.02
FEMALES / 100 MALES
45.0
MEDIAN AGE
2.9
AVG FAMILY SIZE
2.3
AVG HOUSEHOLD SIZE
$31,882
PER CAPITA INCOME
$77,736
AVG FAMILY INCOME
$61,539
AVG HOUSEHOLD INCOME
24.8%
WAGE / INCOME GAP [ % ]
75.2¢/ $1
WAGE / INCOME GAP [ $ ]
$11,057
FAMILY INCOME DEFICIT
0.42
INEQUALITY / GINI INDEX
7,159
LABOR FORCE [ PEOPLE ]
54.3%
PERCENT IN LABOR FORCE
4.9%
UNEMPLOYMENT RATE
Carroll County Area Codes
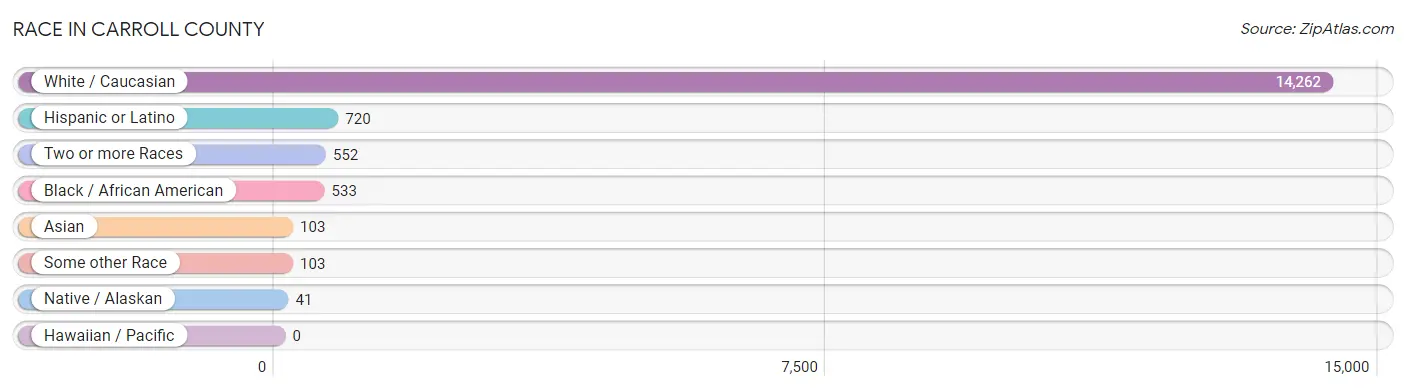
Race in Carroll County
The most populous races in Carroll County are White / Caucasian (14,262 | 91.5%), Hispanic or Latino (720 | 4.6%), and Two or more Races (552 | 3.5%).
| Race | # Population | % Population |
| Asian | 103 | 0.7% |
| Black / African American | 533 | 3.4% |
| Hawaiian / Pacific | 0 | 0.0% |
| Hispanic or Latino | 720 | 4.6% |
| Native / Alaskan | 41 | 0.3% |
| White / Caucasian | 14,262 | 91.5% |
| Two or more Races | 552 | 3.5% |
| Some other Race | 103 | 0.7% |
| Total | 15,594 | 100.0% |
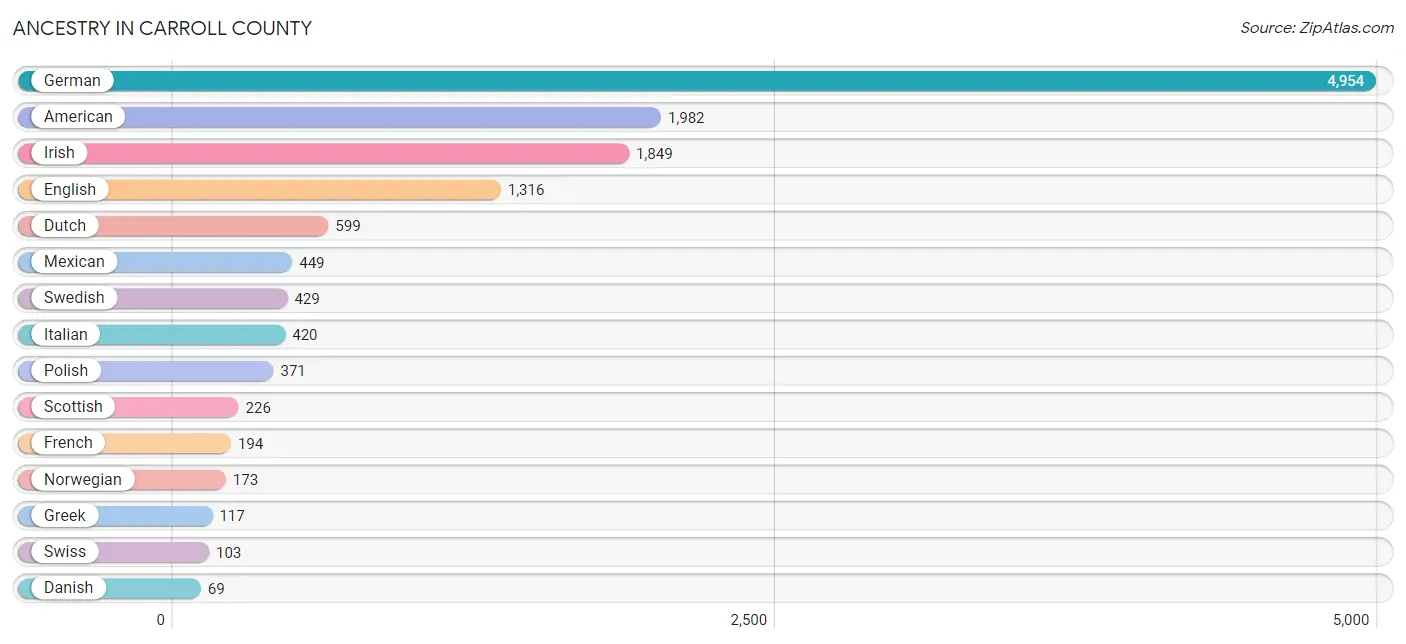
Ancestry in Carroll County
The most populous ancestries reported in Carroll County are German (4,954 | 31.8%), American (1,982 | 12.7%), Irish (1,849 | 11.9%), English (1,316 | 8.4%), and Dutch (599 | 3.8%), together accounting for 68.6% of all Carroll County residents.
| Ancestry | # Population | % Population |
| African | 1 | 0.0% |
| American | 1,982 | 12.7% |
| Arab | 39 | 0.3% |
| Assyrian / Chaldean / Syriac | 4 | 0.0% |
| Austrian | 24 | 0.2% |
| Belgian | 53 | 0.3% |
| Bhutanese | 18 | 0.1% |
| Blackfeet | 1 | 0.0% |
| British | 28 | 0.2% |
| Burmese | 15 | 0.1% |
| Canadian | 6 | 0.0% |
| Central American | 13 | 0.1% |
| Cherokee | 18 | 0.1% |
| Chippewa | 5 | 0.0% |
| Colombian | 7 | 0.0% |
| Croatian | 21 | 0.1% |
| Cuban | 18 | 0.1% |
| Czech | 50 | 0.3% |
| Danish | 69 | 0.4% |
| Dutch | 599 | 3.8% |
| Eastern European | 10 | 0.1% |
| Ecuadorian | 10 | 0.1% |
| Egyptian | 15 | 0.1% |
| English | 1,316 | 8.4% |
| European | 63 | 0.4% |
| Filipino | 1 | 0.0% |
| Finnish | 58 | 0.4% |
| French | 194 | 1.2% |
| French Canadian | 68 | 0.4% |
| German | 4,954 | 31.8% |
| German Russian | 10 | 0.1% |
| Greek | 117 | 0.7% |
| Haitian | 5 | 0.0% |
| Honduran | 8 | 0.1% |
| Hungarian | 43 | 0.3% |
| Indian (Asian) | 4 | 0.0% |
| Irish | 1,849 | 11.9% |
| Italian | 420 | 2.7% |
| Korean | 34 | 0.2% |
| Lithuanian | 41 | 0.3% |
| Mexican | 449 | 2.9% |
| Mexican American Indian | 22 | 0.1% |
| Moroccan | 3 | 0.0% |
| Northern European | 5 | 0.0% |
| Norwegian | 173 | 1.1% |
| Pennsylvania German | 19 | 0.1% |
| Polish | 371 | 2.4% |
| Portuguese | 2 | 0.0% |
| Pueblo | 5 | 0.0% |
| Puerto Rican | 48 | 0.3% |
| Romanian | 1 | 0.0% |
| Russian | 15 | 0.1% |
| Salvadoran | 5 | 0.0% |
| Scandinavian | 29 | 0.2% |
| Scotch-Irish | 43 | 0.3% |
| Scottish | 226 | 1.5% |
| Sioux | 1 | 0.0% |
| Slovak | 13 | 0.1% |
| South American | 17 | 0.1% |
| South American Indian | 22 | 0.1% |
| Spaniard | 7 | 0.0% |
| Sri Lankan | 2 | 0.0% |
| Subsaharan African | 1 | 0.0% |
| Swedish | 429 | 2.8% |
| Swiss | 103 | 0.7% |
| Thai | 46 | 0.3% |
| Trinidadian and Tobagonian | 10 | 0.1% |
| Ukrainian | 4 | 0.0% |
| Welsh | 37 | 0.2% |
| West Indian | 10 | 0.1% |
| Yugoslavian | 6 | 0.0% | View All 71 Rows |
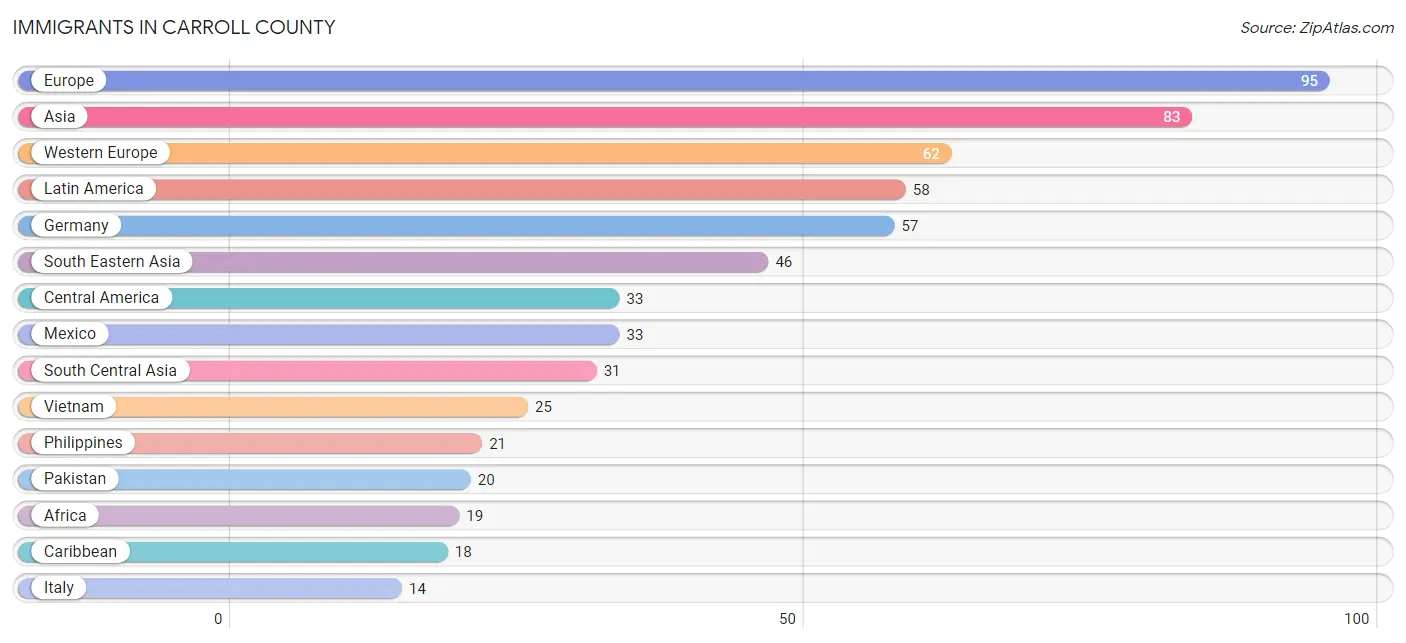
Immigrants in Carroll County
The most numerous immigrant groups reported in Carroll County came from Europe (95 | 0.6%), Asia (83 | 0.5%), Western Europe (62 | 0.4%), Latin America (58 | 0.4%), and Germany (57 | 0.4%), together accounting for 2.3% of all Carroll County residents.
| Immigration Origin | # Population | % Population |
| Africa | 19 | 0.1% |
| Asia | 83 | 0.5% |
| Austria | 5 | 0.0% |
| Canada | 6 | 0.0% |
| Caribbean | 18 | 0.1% |
| Central America | 33 | 0.2% |
| Colombia | 7 | 0.0% |
| Dominican Republic | 11 | 0.1% |
| Eastern Africa | 13 | 0.1% |
| Eastern Europe | 11 | 0.1% |
| Egypt | 5 | 0.0% |
| England | 8 | 0.1% |
| Europe | 95 | 0.6% |
| Germany | 57 | 0.4% |
| Haiti | 7 | 0.0% |
| India | 11 | 0.1% |
| Italy | 14 | 0.1% |
| Jordan | 4 | 0.0% |
| Latin America | 58 | 0.4% |
| Latvia | 3 | 0.0% |
| Mexico | 33 | 0.2% |
| Northern Africa | 5 | 0.0% |
| Northern Europe | 8 | 0.1% |
| Oceania | 5 | 0.0% |
| Pakistan | 20 | 0.1% |
| Philippines | 21 | 0.1% |
| Poland | 8 | 0.1% |
| South America | 7 | 0.0% |
| South Central Asia | 31 | 0.2% |
| South Eastern Asia | 46 | 0.3% |
| Southern Europe | 14 | 0.1% |
| Vietnam | 25 | 0.2% |
| Western Africa | 1 | 0.0% |
| Western Asia | 4 | 0.0% |
| Western Europe | 62 | 0.4% | View All 35 Rows |
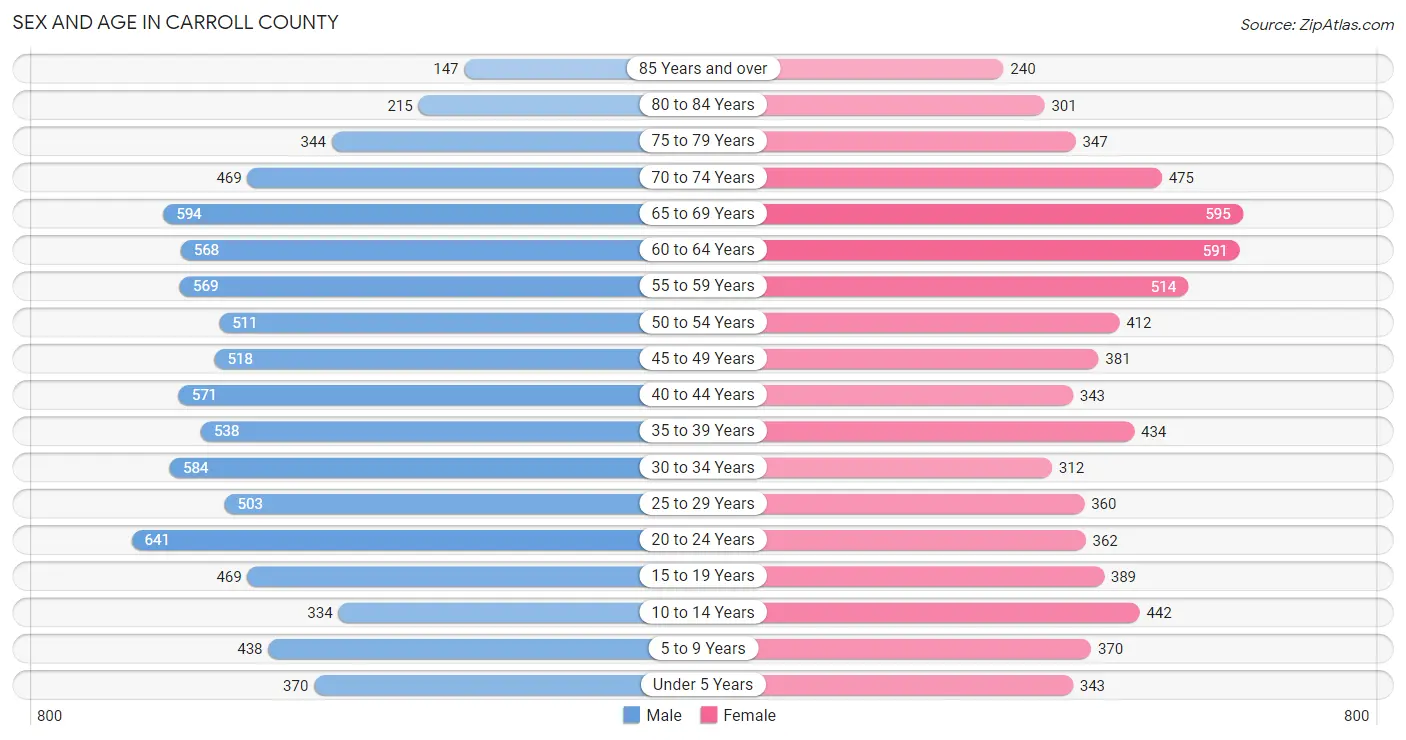
Sex and Age in Carroll County
Sex and Age in Carroll County
The most populous age groups in Carroll County are 20 to 24 Years (641 | 7.6%) for men and 65 to 69 Years (595 | 8.3%) for women.
| Age Bracket | Male | Female |
| Under 5 Years | 370 (4.4%) | 343 (4.8%) |
| 5 to 9 Years | 438 (5.2%) | 370 (5.1%) |
| 10 to 14 Years | 334 (4.0%) | 442 (6.1%) |
| 15 to 19 Years | 469 (5.6%) | 389 (5.4%) |
| 20 to 24 Years | 641 (7.6%) | 362 (5.0%) |
| 25 to 29 Years | 503 (6.0%) | 360 (5.0%) |
| 30 to 34 Years | 584 (7.0%) | 312 (4.3%) |
| 35 to 39 Years | 538 (6.4%) | 434 (6.0%) |
| 40 to 44 Years | 571 (6.8%) | 343 (4.8%) |
| 45 to 49 Years | 518 (6.2%) | 381 (5.3%) |
| 50 to 54 Years | 511 (6.1%) | 412 (5.7%) |
| 55 to 59 Years | 569 (6.8%) | 514 (7.1%) |
| 60 to 64 Years | 568 (6.8%) | 591 (8.2%) |
| 65 to 69 Years | 594 (7.1%) | 595 (8.3%) |
| 70 to 74 Years | 469 (5.6%) | 475 (6.6%) |
| 75 to 79 Years | 344 (4.1%) | 347 (4.8%) |
| 80 to 84 Years | 215 (2.6%) | 301 (4.2%) |
| 85 Years and over | 147 (1.8%) | 240 (3.3%) |
| Total | 8,383 (100.0%) | 7,211 (100.0%) |
Families and Households in Carroll County
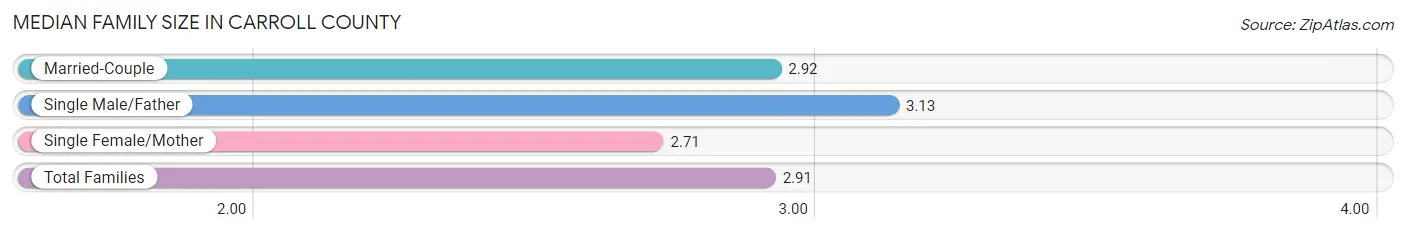
Median Family Size in Carroll County
The median family size in Carroll County is 2.91 persons per family, with single male/father families (307 | 7.8%) accounting for the largest median family size of 3.13 persons per family. On the other hand, single female/mother families (486 | 12.3%) represent the smallest median family size with 2.71 persons per family.
| Family Type | # Families | Family Size |
| Married-Couple | 3,150 (79.9%) | 2.92 |
| Single Male/Father | 307 (7.8%) | 3.13 |
| Single Female/Mother | 486 (12.3%) | 2.71 |
| Total Families | 3,943 (100.0%) | 2.91 |
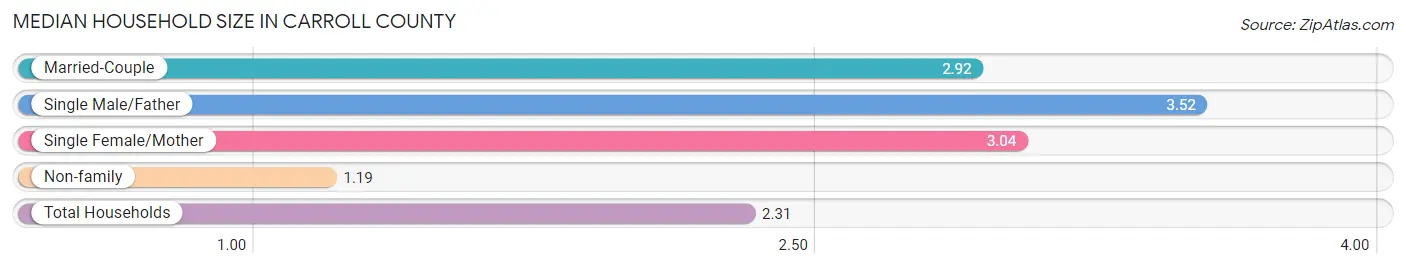
Median Household Size in Carroll County
The median household size in Carroll County is 2.31 persons per household, with single male/father households (307 | 4.9%) accounting for the largest median household size of 3.52 persons per household. non-family households (2,374 | 37.6%) represent the smallest median household size with 1.19 persons per household.
| Household Type | # Households | Household Size |
| Married-Couple | 3,150 (49.9%) | 2.92 |
| Single Male/Father | 307 (4.9%) | 3.52 |
| Single Female/Mother | 486 (7.7%) | 3.04 |
| Non-family | 2,374 (37.6%) | 1.19 |
| Total Households | 6,317 (100.0%) | 2.31 |
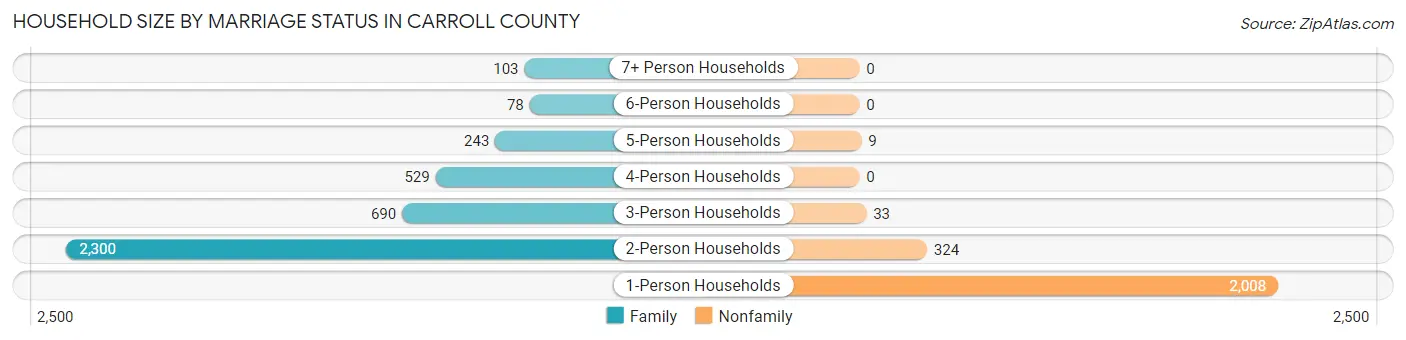
Household Size by Marriage Status in Carroll County
Out of a total of 6,317 households in Carroll County, 3,943 (62.4%) are family households, while 2,374 (37.6%) are nonfamily households. The most numerous type of family households are 2-person households, comprising 2,300, and the most common type of nonfamily households are 1-person households, comprising 2,008.
| Household Size | Family Households | Nonfamily Households |
| 1-Person Households | - | 2,008 (31.8%) |
| 2-Person Households | 2,300 (36.4%) | 324 (5.1%) |
| 3-Person Households | 690 (10.9%) | 33 (0.5%) |
| 4-Person Households | 529 (8.4%) | 0 (0.0%) |
| 5-Person Households | 243 (3.8%) | 9 (0.1%) |
| 6-Person Households | 78 (1.2%) | 0 (0.0%) |
| 7+ Person Households | 103 (1.6%) | 0 (0.0%) |
| Total | 3,943 (62.4%) | 2,374 (37.6%) |
Female Fertility in Carroll County
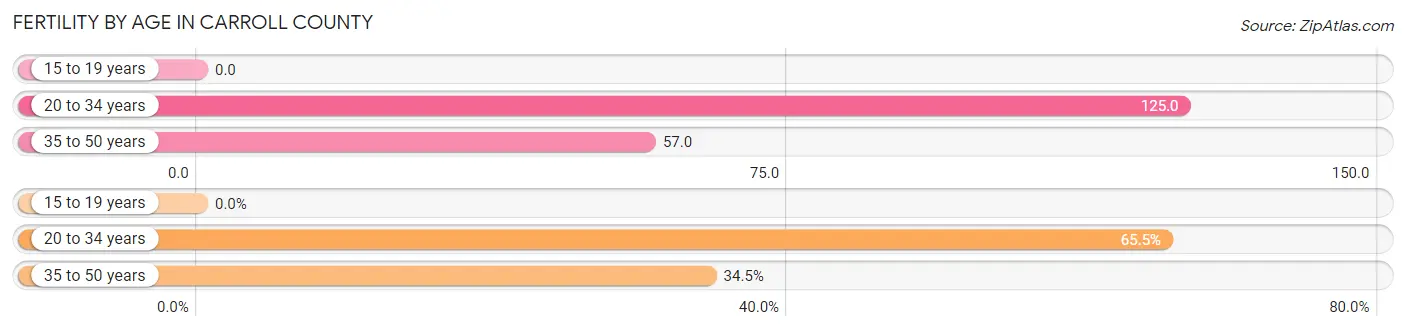
Fertility by Age in Carroll County
Average fertility rate in Carroll County is 75.0 births per 1,000 women. Women in the age bracket of 20 to 34 years have the highest fertility rate with 125.0 births per 1,000 women. Women in the age bracket of 20 to 34 years acount for 65.5% of all women with births.
| Age Bracket | Women with Births | Births / 1,000 Women |
| 15 to 19 years | 0 (0.0%) | 0.0 |
| 20 to 34 years | 129 (65.5%) | 125.0 |
| 35 to 50 years | 68 (34.5%) | 57.0 |
| Total | 197 (100.0%) | 75.0 |
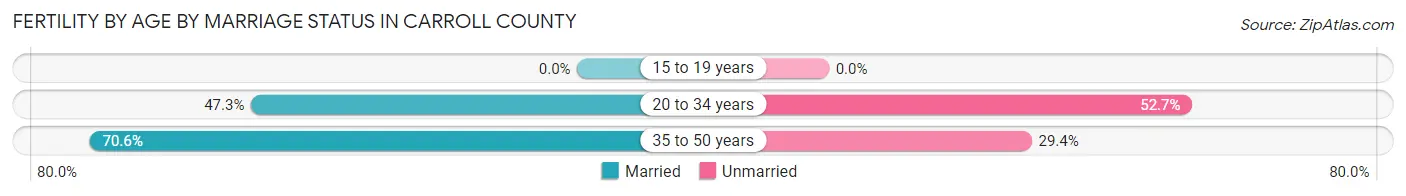
Fertility by Age by Marriage Status in Carroll County
55.3% of women with births (197) in Carroll County are married. The highest percentage of unmarried women with births falls into 20 to 34 years age bracket with 52.7% of them unmarried at the time of birth, while the lowest percentage of unmarried women with births belong to 35 to 50 years age bracket with 29.4% of them unmarried.
| Age Bracket | Married | Unmarried |
| 15 to 19 years | 0 (0.0%) | 0 (0.0%) |
| 20 to 34 years | 61 (47.3%) | 68 (52.7%) |
| 35 to 50 years | 48 (70.6%) | 20 (29.4%) |
| Total | 109 (55.3%) | 88 (44.7%) |
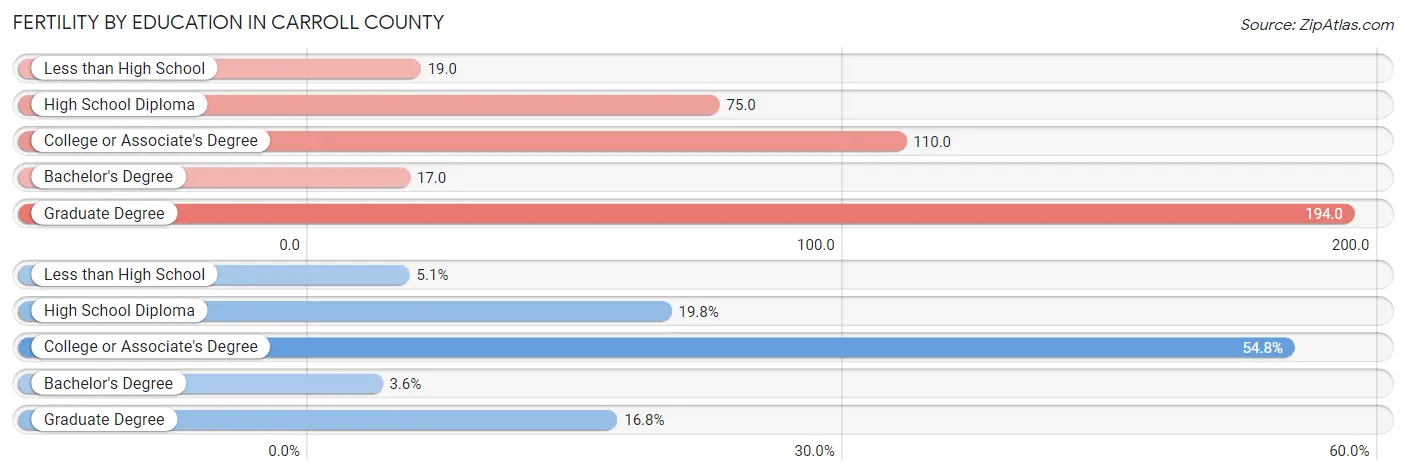
Fertility by Education in Carroll County
Average fertility rate in Carroll County is 75.0 births per 1,000 women. Women with the education attainment of graduate degree have the highest fertility rate of 194.0 births per 1,000 women, while women with the education attainment of bachelor's degree have the lowest fertility at 17.0 births per 1,000 women. Women with the education attainment of college or associate's degree represent 54.8% of all women with births.
| Educational Attainment | Women with Births | Births / 1,000 Women |
| Less than High School | 10 (5.1%) | 19.0 |
| High School Diploma | 39 (19.8%) | 75.0 |
| College or Associate's Degree | 108 (54.8%) | 110.0 |
| Bachelor's Degree | 7 (3.5%) | 17.0 |
| Graduate Degree | 33 (16.8%) | 194.0 |
| Total | 197 (100.0%) | 75.0 |
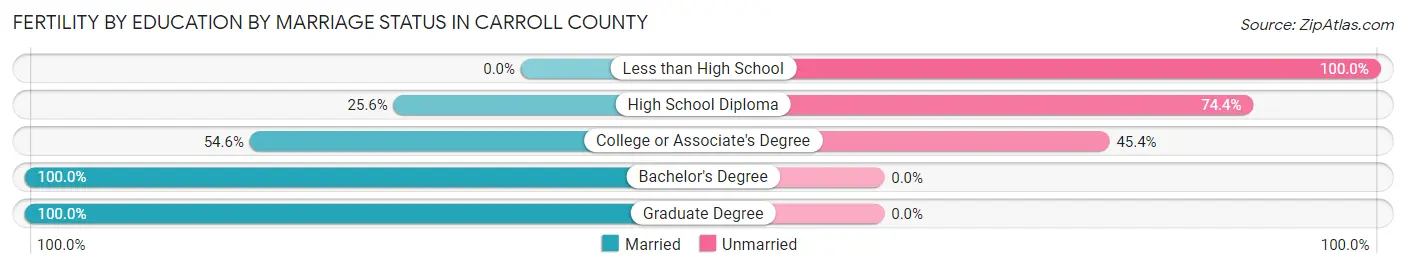
Fertility by Education by Marriage Status in Carroll County
44.7% of women with births in Carroll County are unmarried. Women with the educational attainment of bachelor's degree are most likely to be married with 100.0% of them married at childbirth, while women with the educational attainment of less than high school are least likely to be married with 100.0% of them unmarried at childbirth.
| Educational Attainment | Married | Unmarried |
| Less than High School | 0 (0.0%) | 10 (100.0%) |
| High School Diploma | 10 (25.6%) | 29 (74.4%) |
| College or Associate's Degree | 59 (54.6%) | 49 (45.4%) |
| Bachelor's Degree | 7 (100.0%) | 0 (0.0%) |
| Graduate Degree | 33 (100.0%) | 0 (0.0%) |
| Total | 109 (55.3%) | 88 (44.7%) |
Income in Carroll County
Income Overview in Carroll County
Per Capita Income in Carroll County is $31,882, while median incomes of families and households are $77,736 and $61,539 respectively.
| Characteristic | Number | Measure |
| Per Capita Income | 15,594 | $31,882 |
| Median Family Income | 3,943 | $77,736 |
| Mean Family Income | 3,943 | $91,556 |
| Median Household Income | 6,317 | $61,539 |
| Mean Household Income | 6,317 | $78,177 |
| Income Deficit | 3,943 | $11,057 |
| Wage / Income Gap (%) | 15,594 | 24.77% |
| Wage / Income Gap ($) | 15,594 | 75.23¢ per $1 |
| Gini / Inequality Index | 15,594 | 0.42 |
Earnings by Sex in Carroll County
Average Earnings in Carroll County are $34,292, $40,785 for men and $30,684 for women, a difference of 24.8%.
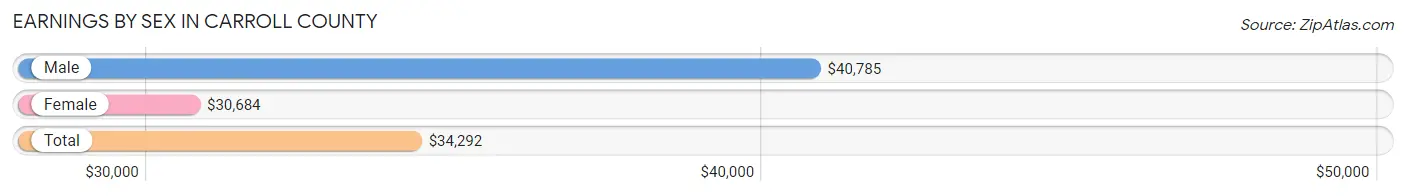
| Sex | Number | Average Earnings |
| Male | 4,377 (57.5%) | $40,785 |
| Female | 3,231 (42.5%) | $30,684 |
| Total | 7,608 (100.0%) | $34,292 |
Earnings by Sex by Income Bracket in Carroll County
The most common earnings brackets in Carroll County are $55,000 to $64,999 for men (439 | 10.0%) and $30,000 to $34,999 for women (386 | 11.9%).
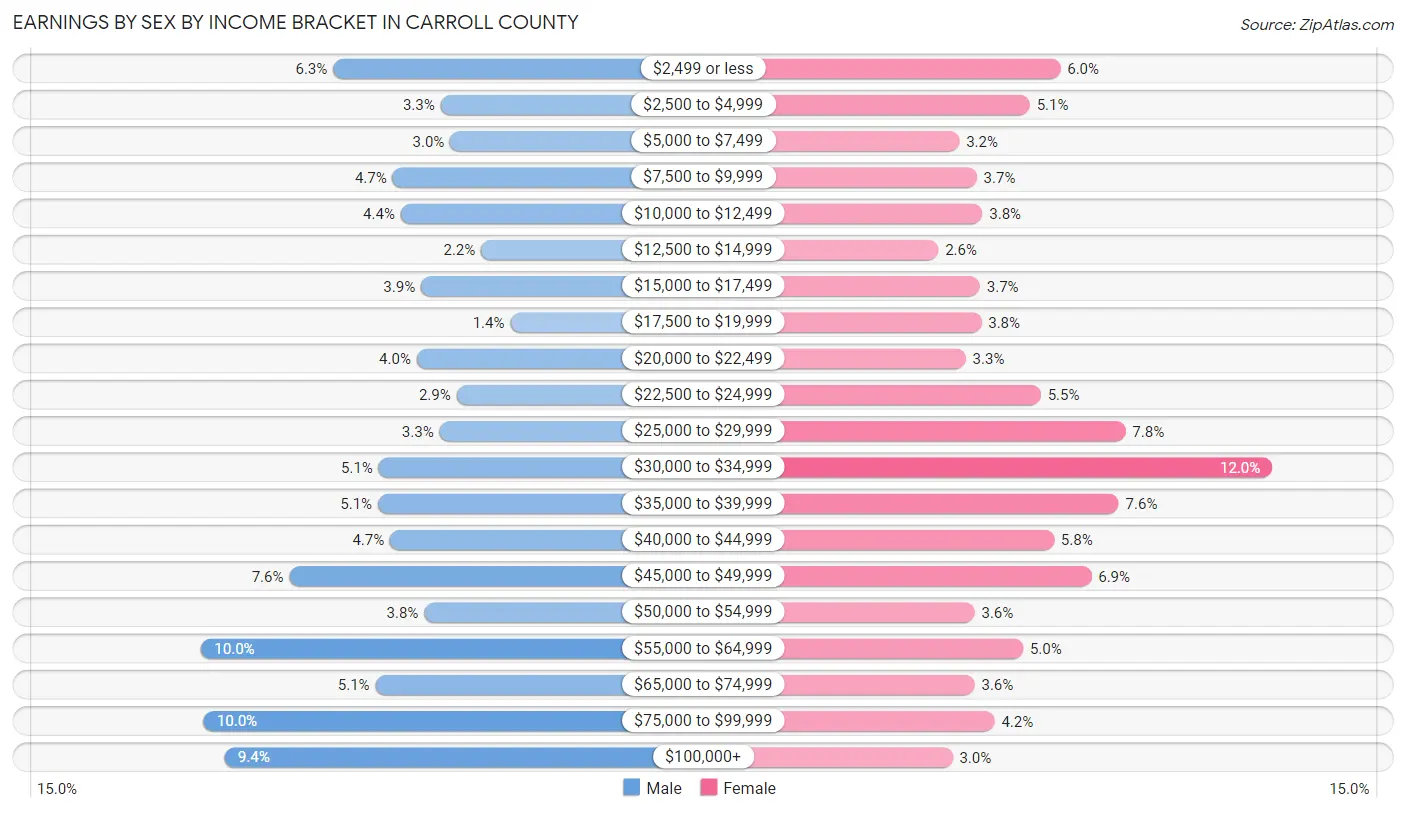
| Income | Male | Female |
| $2,499 or less | 277 (6.3%) | 194 (6.0%) |
| $2,500 to $4,999 | 145 (3.3%) | 166 (5.1%) |
| $5,000 to $7,499 | 133 (3.0%) | 102 (3.2%) |
| $7,500 to $9,999 | 204 (4.7%) | 118 (3.6%) |
| $10,000 to $12,499 | 194 (4.4%) | 123 (3.8%) |
| $12,500 to $14,999 | 95 (2.2%) | 83 (2.6%) |
| $15,000 to $17,499 | 169 (3.9%) | 121 (3.7%) |
| $17,500 to $19,999 | 59 (1.3%) | 122 (3.8%) |
| $20,000 to $22,499 | 174 (4.0%) | 108 (3.3%) |
| $22,500 to $24,999 | 125 (2.9%) | 176 (5.4%) |
| $25,000 to $29,999 | 146 (3.3%) | 253 (7.8%) |
| $30,000 to $34,999 | 221 (5.1%) | 386 (11.9%) |
| $35,000 to $39,999 | 222 (5.1%) | 247 (7.6%) |
| $40,000 to $44,999 | 207 (4.7%) | 188 (5.8%) |
| $45,000 to $49,999 | 331 (7.6%) | 222 (6.9%) |
| $50,000 to $54,999 | 165 (3.8%) | 116 (3.6%) |
| $55,000 to $64,999 | 439 (10.0%) | 160 (5.0%) |
| $65,000 to $74,999 | 225 (5.1%) | 116 (3.6%) |
| $75,000 to $99,999 | 436 (10.0%) | 134 (4.2%) |
| $100,000+ | 410 (9.4%) | 96 (3.0%) |
| Total | 4,377 (100.0%) | 3,231 (100.0%) |
Earnings by Sex by Educational Attainment in Carroll County
Average earnings in Carroll County are $47,007 for men and $32,816 for women, a difference of 30.2%. Men with an educational attainment of graduate degree enjoy the highest average annual earnings of $95,625, while those with high school diploma education earn the least with $46,434. Women with an educational attainment of graduate degree earn the most with the average annual earnings of $62,734, while those with less than high school education have the smallest earnings of $18,924.
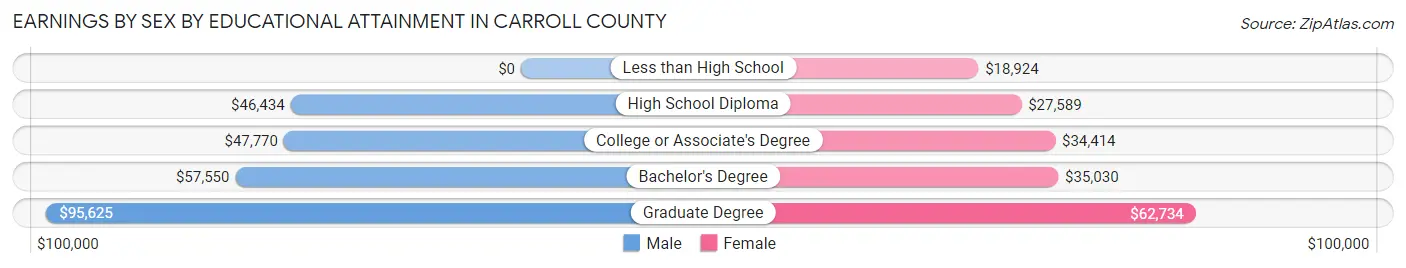
| Educational Attainment | Male Income | Female Income |
| Less than High School | - | - |
| High School Diploma | $46,434 | $27,589 |
| College or Associate's Degree | $47,770 | $34,414 |
| Bachelor's Degree | $57,550 | $35,030 |
| Graduate Degree | $95,625 | $62,734 |
| Total | $47,007 | $32,816 |
Family Income in Carroll County
Family Income Brackets in Carroll County
According to the Carroll County family income data, there are 931 families falling into the $100,000 to $149,999 income range, which is the most common income bracket and makes up 23.6% of all families. Conversely, the $10,000 to $14,999 income bracket is the least frequent group with only 43 families (1.1%) belonging to this category.
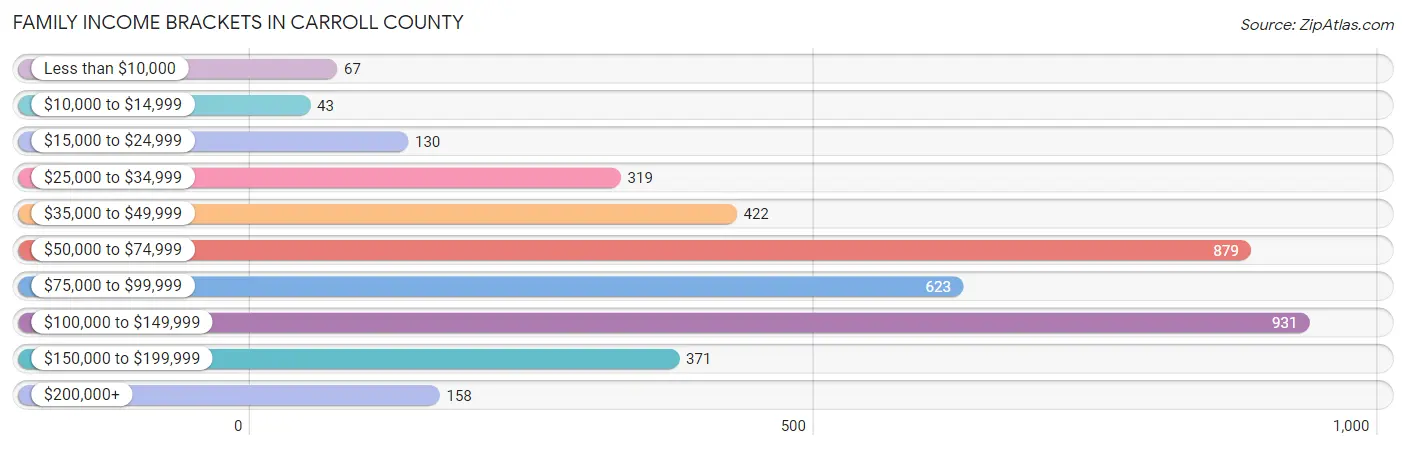
| Income Bracket | # Families | % Families |
| Less than $10,000 | 67 | 1.7% |
| $10,000 to $14,999 | 43 | 1.1% |
| $15,000 to $24,999 | 130 | 3.3% |
| $25,000 to $34,999 | 319 | 8.1% |
| $35,000 to $49,999 | 422 | 10.7% |
| $50,000 to $74,999 | 879 | 22.3% |
| $75,000 to $99,999 | 623 | 15.8% |
| $100,000 to $149,999 | 931 | 23.6% |
| $150,000 to $199,999 | 371 | 9.4% |
| $200,000+ | 158 | 4.0% |
Family Income by Famaliy Size in Carroll County
5-person families (194 | 4.9%) account for the highest median family income in Carroll County with $102,917 per family, while 2-person families (2,408 | 61.1%) have the highest median income of $36,446 per family member.
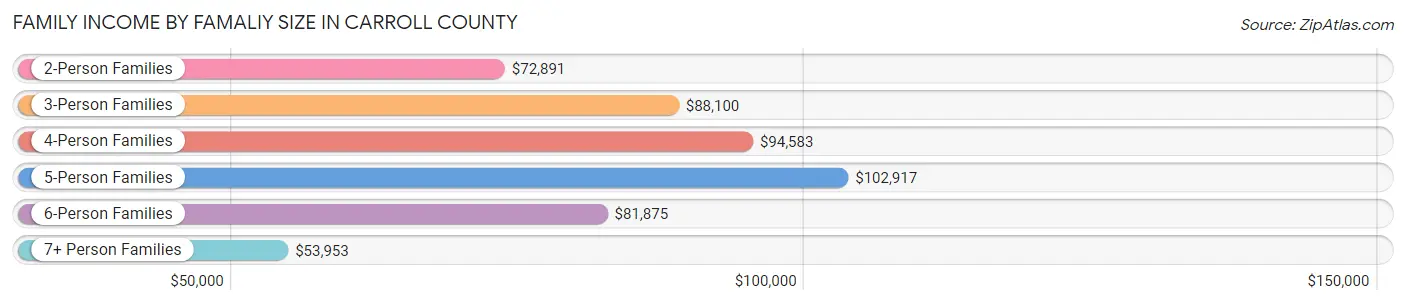
| Income Bracket | # Families | Median Income |
| 2-Person Families | 2,408 (61.1%) | $72,891 |
| 3-Person Families | 650 (16.5%) | $88,100 |
| 4-Person Families | 519 (13.2%) | $94,583 |
| 5-Person Families | 194 (4.9%) | $102,917 |
| 6-Person Families | 74 (1.9%) | $81,875 |
| 7+ Person Families | 98 (2.5%) | $53,953 |
| Total | 3,943 (100.0%) | $77,736 |
Family Income by Number of Earners in Carroll County
The median family income in Carroll County is $77,736, with families comprising 3+ earners (412) having the highest median family income of $116,635, while families with no earners (858) have the lowest median family income of $55,571, accounting for 10.4% and 21.8% of families, respectively.
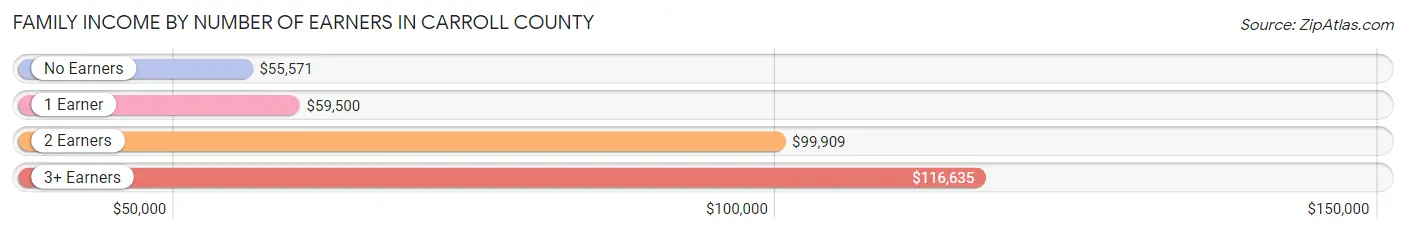
| Number of Earners | # Families | Median Income |
| No Earners | 858 (21.8%) | $55,571 |
| 1 Earner | 1,222 (31.0%) | $59,500 |
| 2 Earners | 1,451 (36.8%) | $99,909 |
| 3+ Earners | 412 (10.4%) | $116,635 |
| Total | 3,943 (100.0%) | $77,736 |
Household Income in Carroll County
Household Income Brackets in Carroll County
With 1,289 households falling in the category, the $50,000 to $74,999 income range is the most frequent in Carroll County, accounting for 20.4% of all households. In contrast, only 215 households (3.4%) fall into the $10,000 to $14,999 income bracket, making it the least populous group.
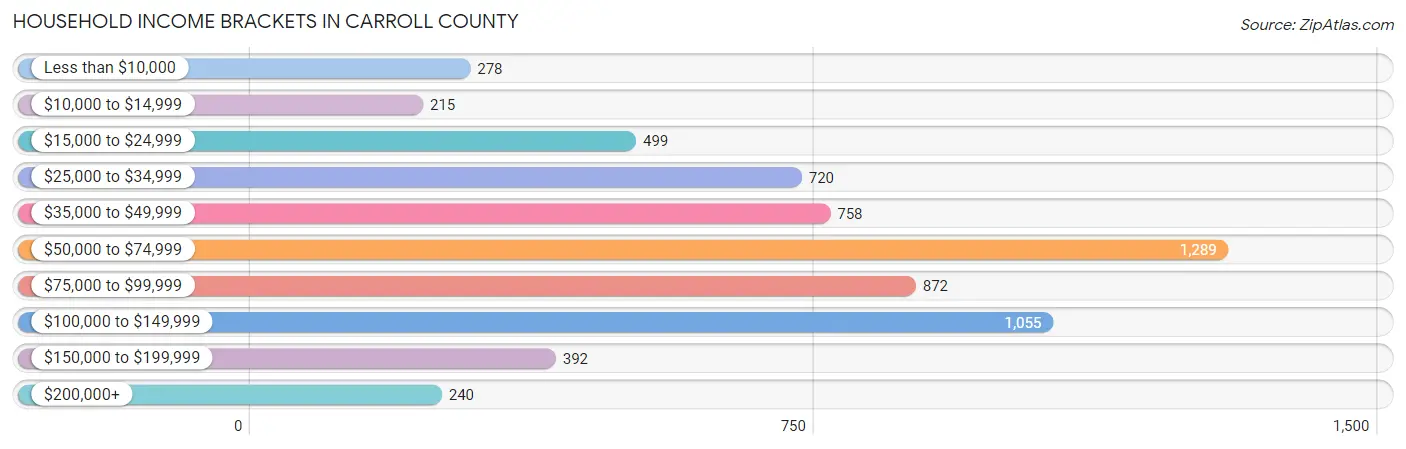
| Income Bracket | # Households | % Households |
| Less than $10,000 | 278 | 4.4% |
| $10,000 to $14,999 | 215 | 3.4% |
| $15,000 to $24,999 | 499 | 7.9% |
| $25,000 to $34,999 | 720 | 11.4% |
| $35,000 to $49,999 | 758 | 12.0% |
| $50,000 to $74,999 | 1,289 | 20.4% |
| $75,000 to $99,999 | 872 | 13.8% |
| $100,000 to $149,999 | 1,055 | 16.7% |
| $150,000 to $199,999 | 392 | 6.2% |
| $200,000+ | 240 | 3.8% |
Household Income by Householder Age in Carroll County
The median household income in Carroll County is $61,539, with the highest median household income of $72,650 found in the 45 to 64 years age bracket for the primary householder. A total of 2,181 households (34.5%) fall into this category. Meanwhile, the 15 to 24 years age bracket for the primary householder has the lowest median household income of $34,583, with 303 households (4.8%) in this group.
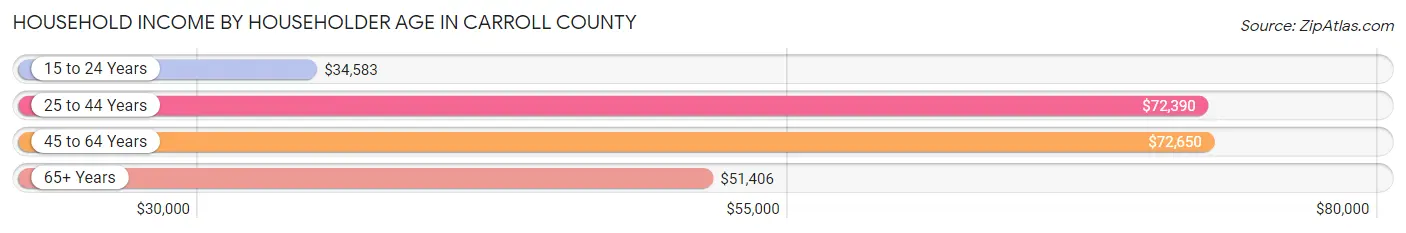
| Income Bracket | # Households | Median Income |
| 15 to 24 Years | 303 (4.8%) | $34,583 |
| 25 to 44 Years | 1,477 (23.4%) | $72,390 |
| 45 to 64 Years | 2,181 (34.5%) | $72,650 |
| 65+ Years | 2,356 (37.3%) | $51,406 |
| Total | 6,317 (100.0%) | $61,539 |
Poverty in Carroll County
Income Below Poverty by Sex and Age in Carroll County
With 11.1% poverty level for males and 11.4% for females among the residents of Carroll County, 16 and 17 year old males and 16 and 17 year old females are the most vulnerable to poverty, with 74 males (32.3%) and 31 females (17.3%) in their respective age groups living below the poverty level.
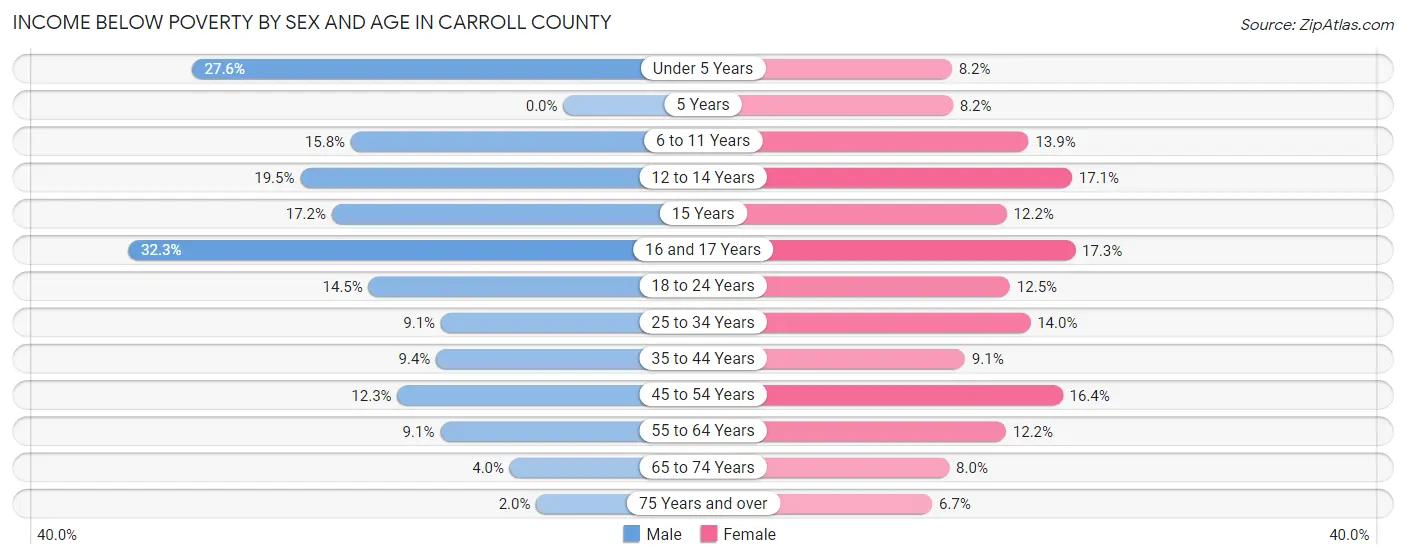
| Age Bracket | Male | Female |
| Under 5 Years | 101 (27.6%) | 28 (8.2%) |
| 5 Years | 0 (0.0%) | 7 (8.2%) |
| 6 to 11 Years | 85 (15.8%) | 60 (13.9%) |
| 12 to 14 Years | 33 (19.5%) | 48 (17.1%) |
| 15 Years | 11 (17.2%) | 6 (12.2%) |
| 16 and 17 Years | 74 (32.3%) | 31 (17.3%) |
| 18 to 24 Years | 117 (14.5%) | 64 (12.5%) |
| 25 to 34 Years | 72 (9.1%) | 94 (14.0%) |
| 35 to 44 Years | 72 (9.4%) | 71 (9.1%) |
| 45 to 54 Years | 111 (12.3%) | 130 (16.4%) |
| 55 to 64 Years | 98 (9.1%) | 133 (12.2%) |
| 65 to 74 Years | 42 (4.0%) | 85 (8.0%) |
| 75 Years and over | 14 (2.0%) | 54 (6.7%) |
| Total | 830 (11.1%) | 811 (11.4%) |
Income Above Poverty by Sex and Age in Carroll County
According to the poverty statistics in Carroll County, males aged 5 years and females aged 75 years and over are the age groups that are most secure financially, with 100.0% of males and 93.3% of females in these age groups living above the poverty line.
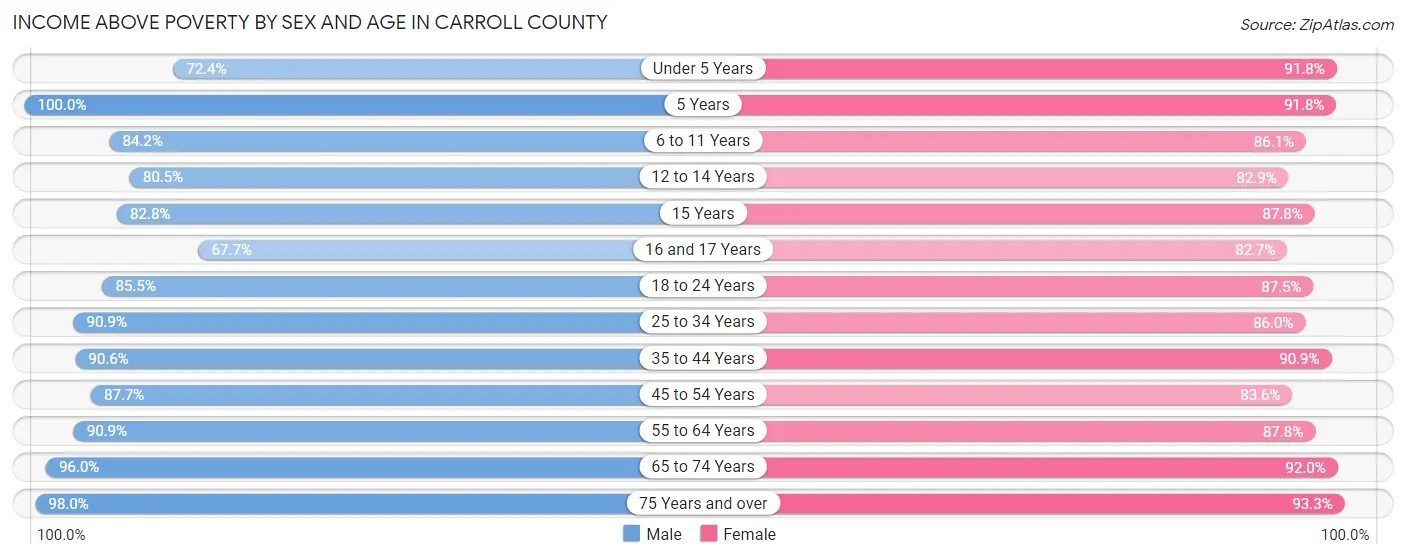
| Age Bracket | Male | Female |
| Under 5 Years | 265 (72.4%) | 315 (91.8%) |
| 5 Years | 49 (100.0%) | 78 (91.8%) |
| 6 to 11 Years | 454 (84.2%) | 373 (86.1%) |
| 12 to 14 Years | 136 (80.5%) | 233 (82.9%) |
| 15 Years | 53 (82.8%) | 43 (87.8%) |
| 16 and 17 Years | 155 (67.7%) | 148 (82.7%) |
| 18 to 24 Years | 692 (85.5%) | 449 (87.5%) |
| 25 to 34 Years | 720 (90.9%) | 578 (86.0%) |
| 35 to 44 Years | 691 (90.6%) | 706 (90.9%) |
| 45 to 54 Years | 790 (87.7%) | 663 (83.6%) |
| 55 to 64 Years | 974 (90.9%) | 959 (87.8%) |
| 65 to 74 Years | 1,017 (96.0%) | 981 (92.0%) |
| 75 Years and over | 681 (98.0%) | 752 (93.3%) |
| Total | 6,677 (88.9%) | 6,278 (88.6%) |
Income Below Poverty Among Married-Couple Families in Carroll County
The poverty statistics for married-couple families in Carroll County show that 3.8% or 121 of the total 3,150 families live below the poverty line. Families with 5 or more children have the highest poverty rate of 46.0%, comprising of 23 families. On the other hand, families with no children have the lowest poverty rate of 1.6%, which includes 36 families.
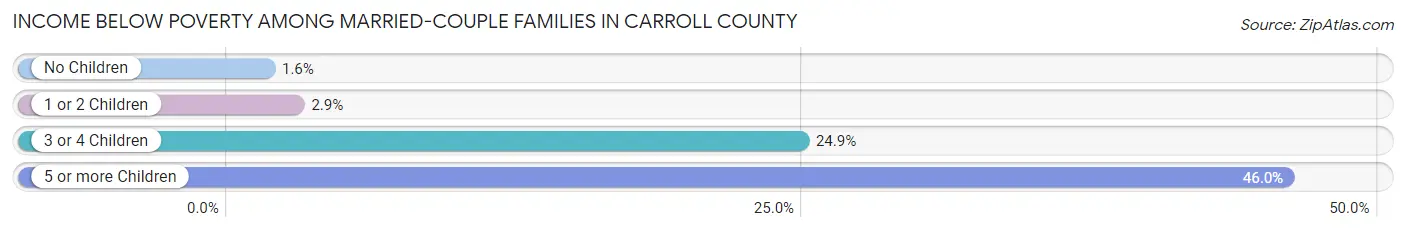
| Children | Above Poverty | Below Poverty |
| No Children | 2,204 (98.4%) | 36 (1.6%) |
| 1 or 2 Children | 671 (97.1%) | 20 (2.9%) |
| 3 or 4 Children | 127 (75.1%) | 42 (24.8%) |
| 5 or more Children | 27 (54.0%) | 23 (46.0%) |
| Total | 3,029 (96.2%) | 121 (3.8%) |
Income Below Poverty Among Single-Parent Households in Carroll County
According to the poverty data in Carroll County, 8.5% or 26 single-father households and 19.8% or 96 single-mother households are living below the poverty line. Among single-father households, those with 5 or more children have the highest poverty rate, with 2 households (100.0%) experiencing poverty. Likewise, among single-mother households, those with 3 or 4 children have the highest poverty rate, with 40 households (71.4%) falling below the poverty line.
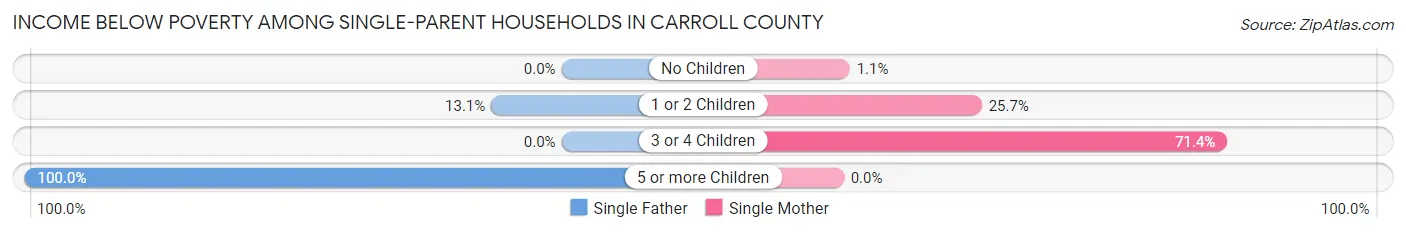
| Children | Single Father | Single Mother |
| No Children | 0 (0.0%) | 2 (1.1%) |
| 1 or 2 Children | 24 (13.1%) | 54 (25.7%) |
| 3 or 4 Children | 0 (0.0%) | 40 (71.4%) |
| 5 or more Children | 2 (100.0%) | 0 (0.0%) |
| Total | 26 (8.5%) | 96 (19.8%) |
Income Below Poverty Among Married-Couple vs Single-Parent Households in Carroll County
The poverty data for Carroll County shows that 121 of the married-couple family households (3.8%) and 122 of the single-parent households (15.4%) are living below the poverty level. Within the married-couple family households, those with 5 or more children have the highest poverty rate, with 23 households (46.0%) falling below the poverty line. Among the single-parent households, those with 3 or 4 children have the highest poverty rate, with 40 household (50.0%) living below poverty.
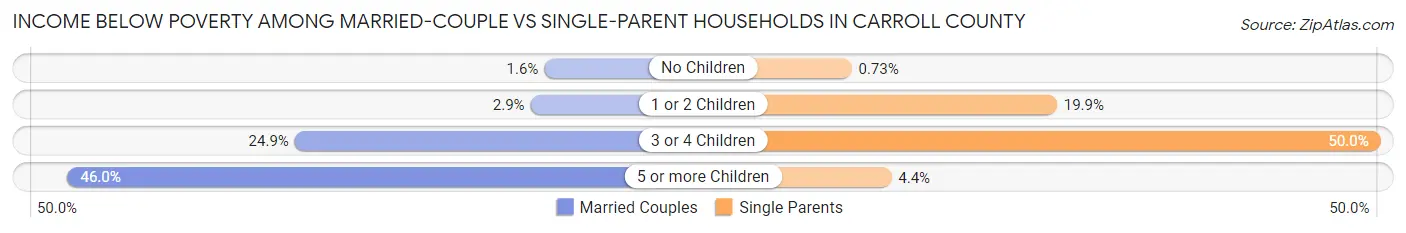
| Children | Married-Couple Families | Single-Parent Households |
| No Children | 36 (1.6%) | 2 (0.7%) |
| 1 or 2 Children | 20 (2.9%) | 78 (19.9%) |
| 3 or 4 Children | 42 (24.8%) | 40 (50.0%) |
| 5 or more Children | 23 (46.0%) | 2 (4.4%) |
| Total | 121 (3.8%) | 122 (15.4%) |
Employment Characteristics in Carroll County
Employment by Class of Employer in Carroll County
Among the 6,722 employed individuals in Carroll County, private company employees (4,488 | 66.8%), self-employed (not incorporated) (543 | 8.1%), and local government employees (486 | 7.2%) make up the most common classes of employment.
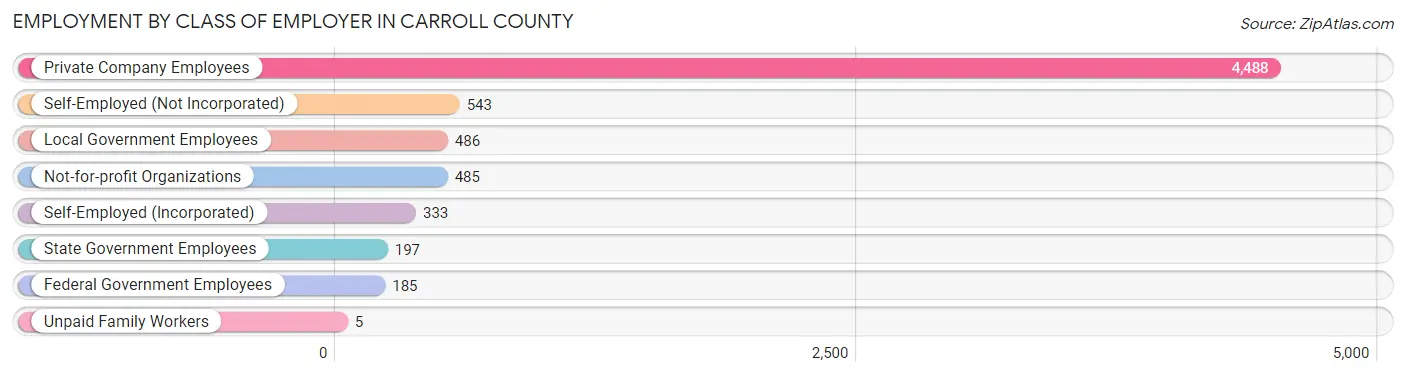
| Employer Class | # Employees | % Employees |
| Private Company Employees | 4,488 | 66.8% |
| Self-Employed (Incorporated) | 333 | 5.0% |
| Self-Employed (Not Incorporated) | 543 | 8.1% |
| Not-for-profit Organizations | 485 | 7.2% |
| Local Government Employees | 486 | 7.2% |
| State Government Employees | 197 | 2.9% |
| Federal Government Employees | 185 | 2.8% |
| Unpaid Family Workers | 5 | 0.1% |
| Total | 6,722 | 100.0% |
Employment Status by Age in Carroll County
According to the labor force statistics for Carroll County, out of the total population over 16 years of age (13,184), 54.3% or 7,159 individuals are in the labor force, with 4.9% or 351 of them unemployed. The age group with the highest labor force participation rate is 20 to 24 years, with 92.7% or 930 individuals in the labor force. Within the labor force, the 20 to 24 years age range has the highest percentage of unemployed individuals, with 10.8% or 100 of them being unemployed.
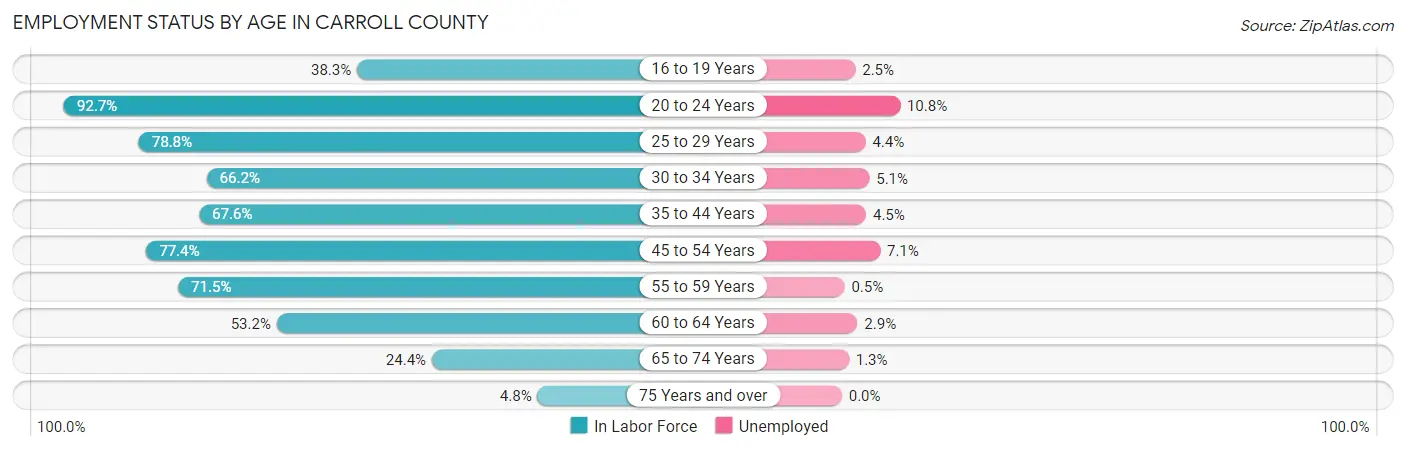
| Age Bracket | In Labor Force | Unemployed |
| 16 to 19 Years | 285 (38.3%) | 7 (2.5%) |
| 20 to 24 Years | 930 (92.7%) | 100 (10.8%) |
| 25 to 29 Years | 680 (78.8%) | 30 (4.4%) |
| 30 to 34 Years | 593 (66.2%) | 30 (5.1%) |
| 35 to 44 Years | 1,275 (67.6%) | 57 (4.5%) |
| 45 to 54 Years | 1,410 (77.4%) | 100 (7.1%) |
| 55 to 59 Years | 774 (71.5%) | 4 (0.5%) |
| 60 to 64 Years | 617 (53.2%) | 18 (2.9%) |
| 65 to 74 Years | 520 (24.4%) | 7 (1.3%) |
| 75 Years and over | 77 (4.8%) | 0 (0.0%) |
| Total | 7,159 (54.3%) | 351 (4.9%) |
Employment Status by Educational Attainment in Carroll County
According to labor force statistics for Carroll County, 69.4% of individuals (5,350) out of the total population between 25 and 64 years of age (7,709) are in the labor force, with 4.5% or 241 of them being unemployed. The group with the highest labor force participation rate are those with the educational attainment of bachelor's degree or higher, with 82.3% or 1,211 individuals in the labor force. Within the labor force, individuals with less than high school education have the highest percentage of unemployment, with 6.1% or 23 of them being unemployed.
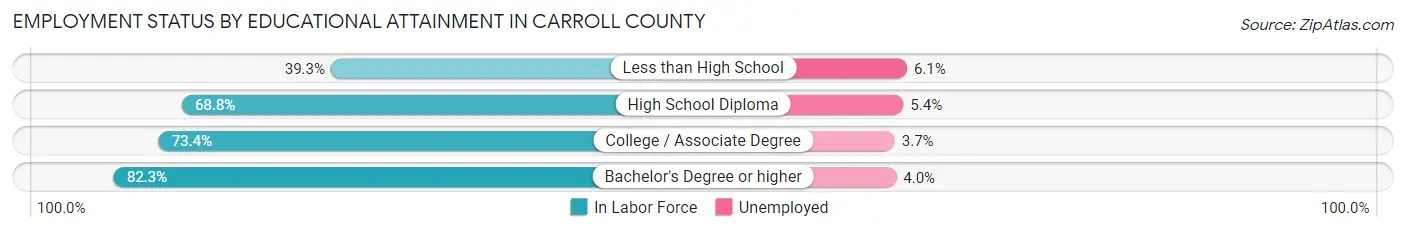
| Educational Attainment | In Labor Force | Unemployed |
| Less than High School | 374 (39.3%) | 58 (6.1%) |
| High School Diploma | 1,737 (68.8%) | 136 (5.4%) |
| College / Associate Degree | 2,027 (73.4%) | 102 (3.7%) |
| Bachelor's Degree or higher | 1,211 (82.3%) | 59 (4.0%) |
| Total | 5,350 (69.4%) | 347 (4.5%) |
Employment Occupations by Sex in Carroll County
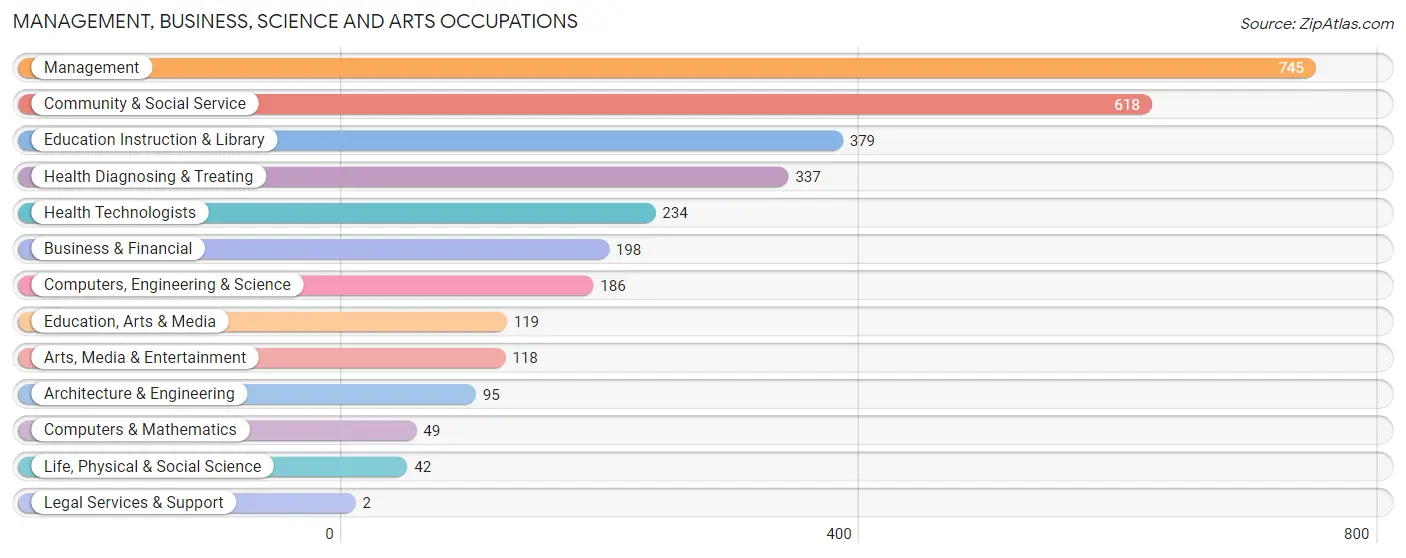
Management, Business, Science and Arts Occupations
The most common Management, Business, Science and Arts occupations in Carroll County are Management (745 | 11.0%), Community & Social Service (618 | 9.1%), Education Instruction & Library (379 | 5.6%), Health Diagnosing & Treating (337 | 5.0%), and Health Technologists (234 | 3.4%).
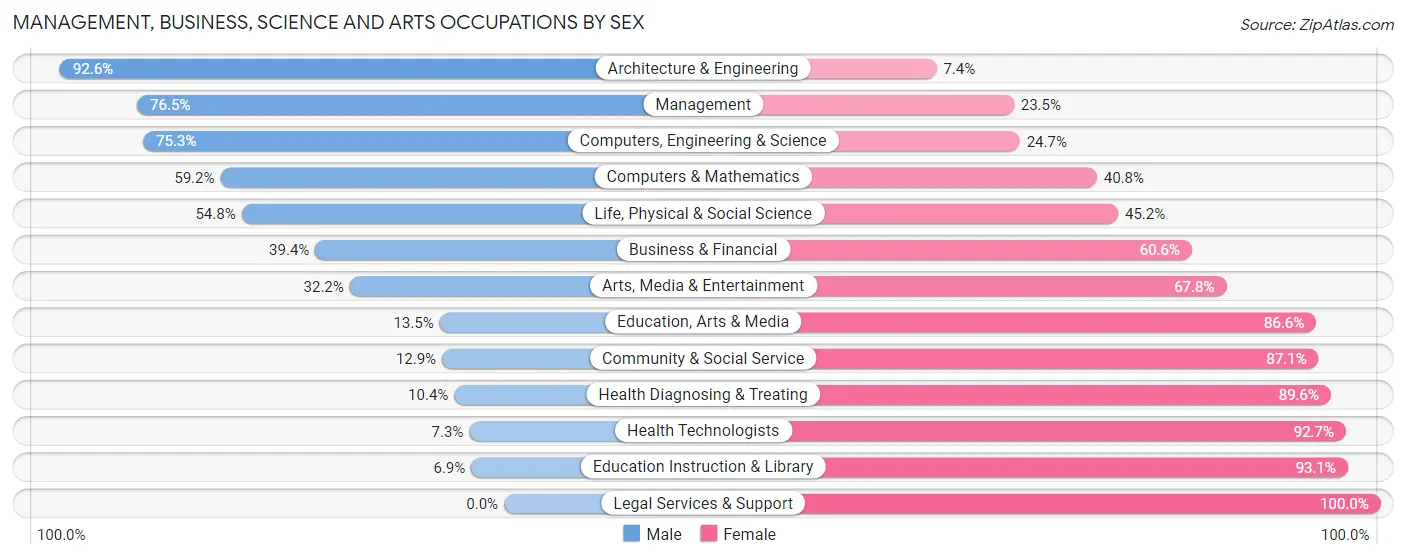
Management, Business, Science and Arts Occupations by Sex
Within the Management, Business, Science and Arts occupations in Carroll County, the most male-oriented occupations are Architecture & Engineering (92.6%), Management (76.5%), and Computers, Engineering & Science (75.3%), while the most female-oriented occupations are Legal Services & Support (100.0%), Education Instruction & Library (93.1%), and Health Technologists (92.7%).
| Occupation | Male | Female |
| Management | 570 (76.5%) | 175 (23.5%) |
| Business & Financial | 78 (39.4%) | 120 (60.6%) |
| Computers, Engineering & Science | 140 (75.3%) | 46 (24.7%) |
| Computers & Mathematics | 29 (59.2%) | 20 (40.8%) |
| Architecture & Engineering | 88 (92.6%) | 7 (7.4%) |
| Life, Physical & Social Science | 23 (54.8%) | 19 (45.2%) |
| Community & Social Service | 80 (12.9%) | 538 (87.1%) |
| Education, Arts & Media | 16 (13.5%) | 103 (86.6%) |
| Legal Services & Support | 0 (0.0%) | 2 (100.0%) |
| Education Instruction & Library | 26 (6.9%) | 353 (93.1%) |
| Arts, Media & Entertainment | 38 (32.2%) | 80 (67.8%) |
| Health Diagnosing & Treating | 35 (10.4%) | 302 (89.6%) |
| Health Technologists | 17 (7.3%) | 217 (92.7%) |
| Total (Category) | 903 (43.3%) | 1,181 (56.7%) |
| Total (Overall) | 3,911 (57.6%) | 2,883 (42.4%) |
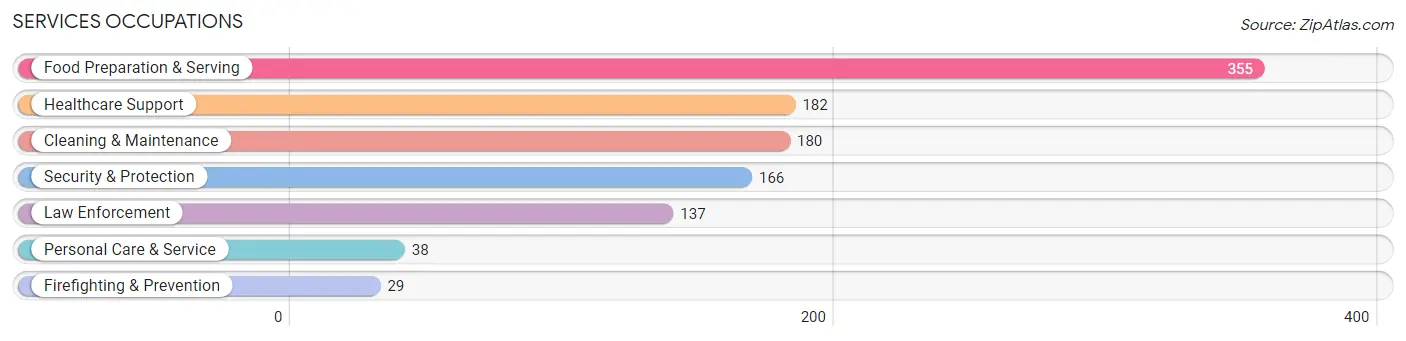
Services Occupations
The most common Services occupations in Carroll County are Food Preparation & Serving (355 | 5.2%), Healthcare Support (182 | 2.7%), Cleaning & Maintenance (180 | 2.6%), Security & Protection (166 | 2.4%), and Law Enforcement (137 | 2.0%).
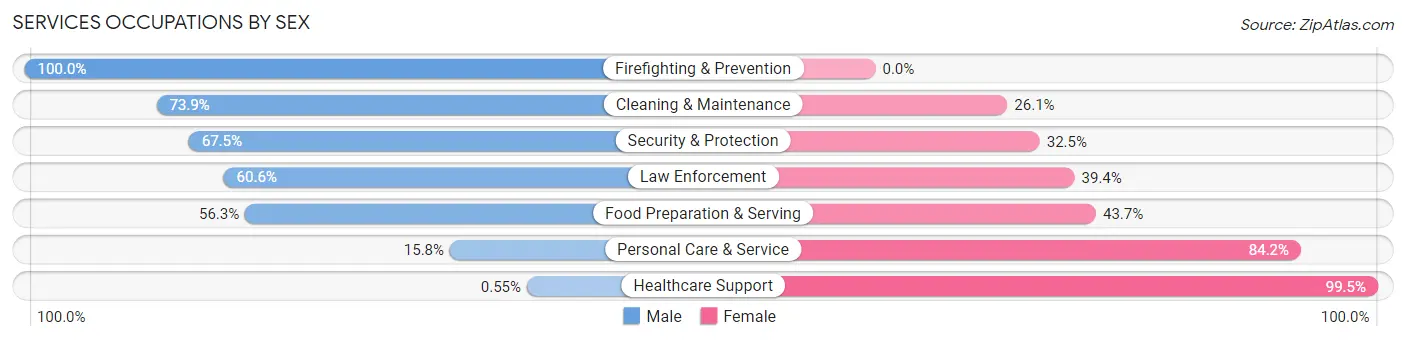
Services Occupations by Sex
Within the Services occupations in Carroll County, the most male-oriented occupations are Firefighting & Prevention (100.0%), Cleaning & Maintenance (73.9%), and Security & Protection (67.5%), while the most female-oriented occupations are Healthcare Support (99.5%), Personal Care & Service (84.2%), and Food Preparation & Serving (43.7%).
| Occupation | Male | Female |
| Healthcare Support | 1 (0.5%) | 181 (99.5%) |
| Security & Protection | 112 (67.5%) | 54 (32.5%) |
| Firefighting & Prevention | 29 (100.0%) | 0 (0.0%) |
| Law Enforcement | 83 (60.6%) | 54 (39.4%) |
| Food Preparation & Serving | 200 (56.3%) | 155 (43.7%) |
| Cleaning & Maintenance | 133 (73.9%) | 47 (26.1%) |
| Personal Care & Service | 6 (15.8%) | 32 (84.2%) |
| Total (Category) | 452 (49.1%) | 469 (50.9%) |
| Total (Overall) | 3,911 (57.6%) | 2,883 (42.4%) |
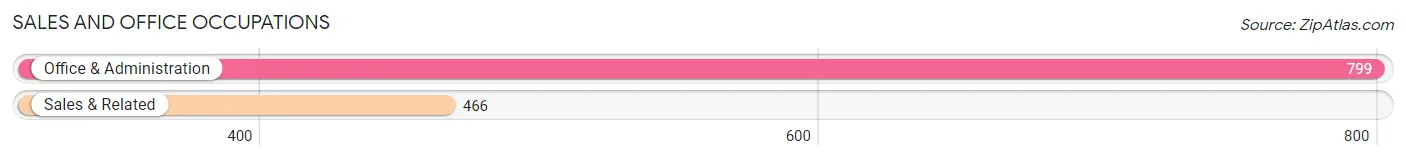
Sales and Office Occupations
The most common Sales and Office occupations in Carroll County are Office & Administration (799 | 11.8%), and Sales & Related (466 | 6.9%).
Sales and Office Occupations by Sex
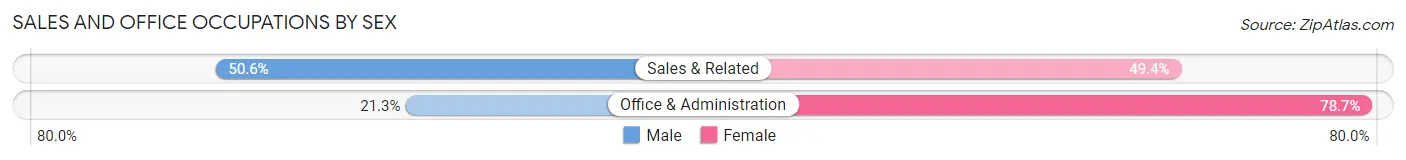
| Occupation | Male | Female |
| Sales & Related | 236 (50.6%) | 230 (49.4%) |
| Office & Administration | 170 (21.3%) | 629 (78.7%) |
| Total (Category) | 406 (32.1%) | 859 (67.9%) |
| Total (Overall) | 3,911 (57.6%) | 2,883 (42.4%) |
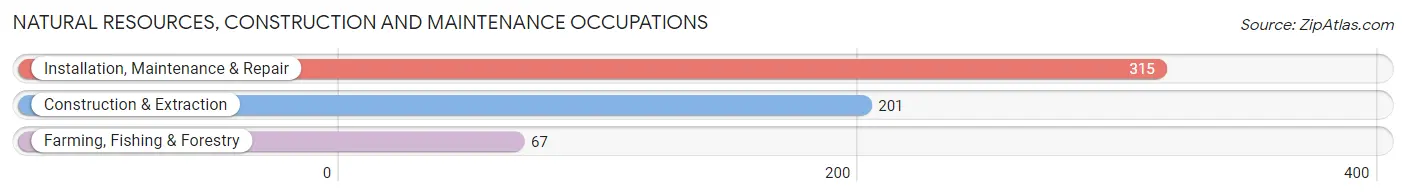
Natural Resources, Construction and Maintenance Occupations
The most common Natural Resources, Construction and Maintenance occupations in Carroll County are Installation, Maintenance & Repair (315 | 4.6%), Construction & Extraction (201 | 3.0%), and Farming, Fishing & Forestry (67 | 1.0%).
Natural Resources, Construction and Maintenance Occupations by Sex
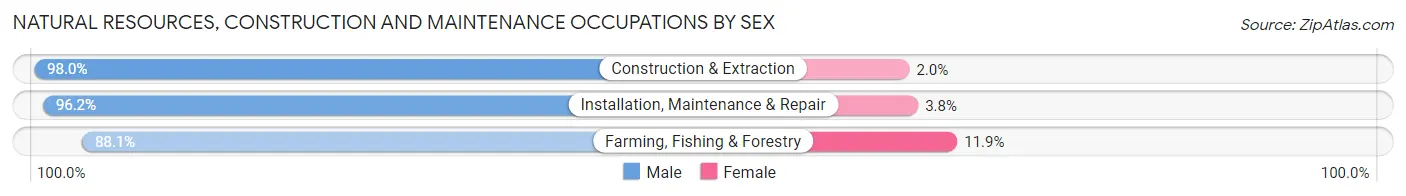
| Occupation | Male | Female |
| Farming, Fishing & Forestry | 59 (88.1%) | 8 (11.9%) |
| Construction & Extraction | 197 (98.0%) | 4 (2.0%) |
| Installation, Maintenance & Repair | 303 (96.2%) | 12 (3.8%) |
| Total (Category) | 559 (95.9%) | 24 (4.1%) |
| Total (Overall) | 3,911 (57.6%) | 2,883 (42.4%) |
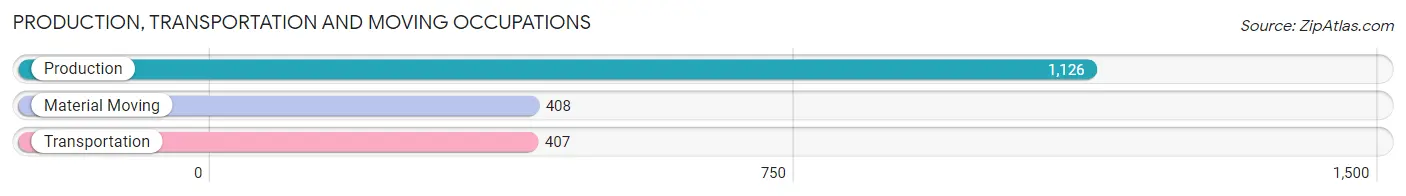
Production, Transportation and Moving Occupations
The most common Production, Transportation and Moving occupations in Carroll County are Production (1,126 | 16.6%), Material Moving (408 | 6.0%), and Transportation (407 | 6.0%).
Production, Transportation and Moving Occupations by Sex
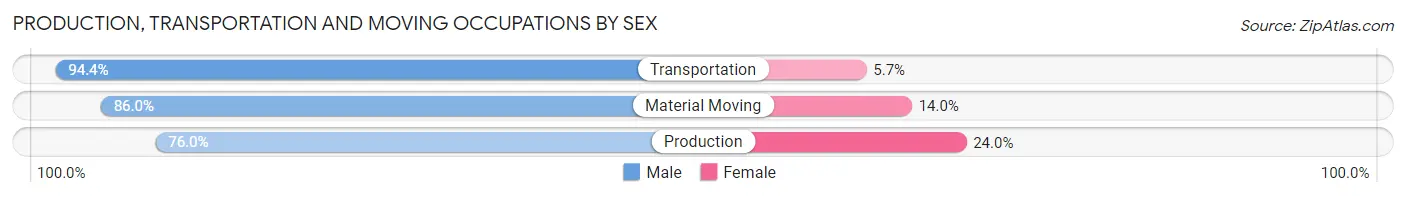
| Occupation | Male | Female |
| Production | 856 (76.0%) | 270 (24.0%) |
| Transportation | 384 (94.4%) | 23 (5.7%) |
| Material Moving | 351 (86.0%) | 57 (14.0%) |
| Total (Category) | 1,591 (82.0%) | 350 (18.0%) |
| Total (Overall) | 3,911 (57.6%) | 2,883 (42.4%) |
Employment Industries by Sex in Carroll County
Employment Industries in Carroll County
The major employment industries in Carroll County include Manufacturing (1,692 | 24.9%), Health Care & Social Assistance (856 | 12.6%), Retail Trade (680 | 10.0%), Educational Services (490 | 7.2%), and Agriculture, Fishing & Hunting (408 | 6.0%).

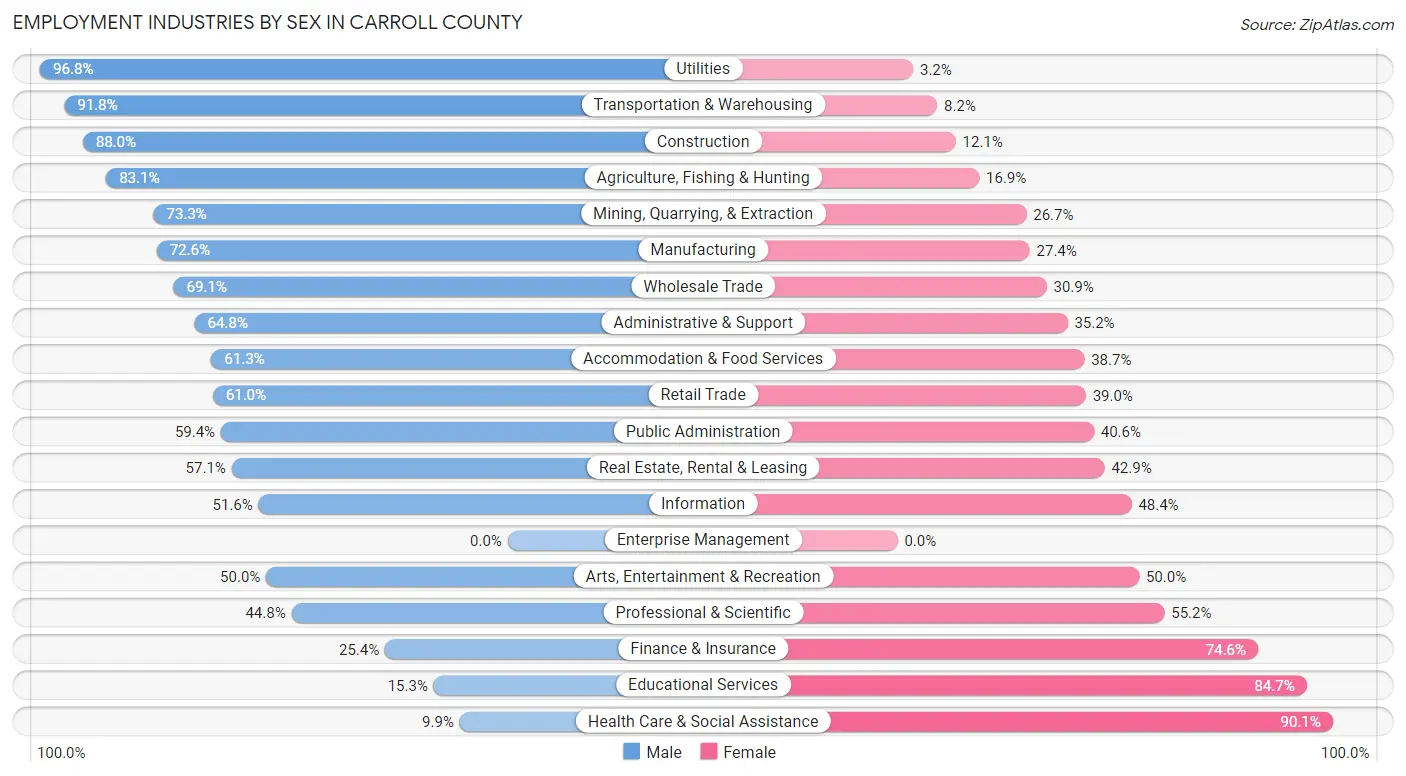
Employment Industries by Sex in Carroll County
The Carroll County industries that see more men than women are Utilities (96.8%), Transportation & Warehousing (91.8%), and Construction (87.9%), whereas the industries that tend to have a higher number of women are Health Care & Social Assistance (90.1%), Educational Services (84.7%), and Finance & Insurance (74.6%).
| Industry | Male | Female |
| Agriculture, Fishing & Hunting | 339 (83.1%) | 69 (16.9%) |
| Mining, Quarrying, & Extraction | 11 (73.3%) | 4 (26.7%) |
| Construction | 270 (87.9%) | 37 (12.0%) |
| Manufacturing | 1,229 (72.6%) | 463 (27.4%) |
| Wholesale Trade | 121 (69.1%) | 54 (30.9%) |
| Retail Trade | 415 (61.0%) | 265 (39.0%) |
| Transportation & Warehousing | 346 (91.8%) | 31 (8.2%) |
| Utilities | 60 (96.8%) | 2 (3.2%) |
| Information | 66 (51.6%) | 62 (48.4%) |
| Finance & Insurance | 64 (25.4%) | 188 (74.6%) |
| Real Estate, Rental & Leasing | 8 (57.1%) | 6 (42.9%) |
| Professional & Scientific | 47 (44.8%) | 58 (55.2%) |
| Enterprise Management | 0 (0.0%) | 0 (0.0%) |
| Administrative & Support | 105 (64.8%) | 57 (35.2%) |
| Educational Services | 75 (15.3%) | 415 (84.7%) |
| Health Care & Social Assistance | 85 (9.9%) | 771 (90.1%) |
| Arts, Entertainment & Recreation | 56 (50.0%) | 56 (50.0%) |
| Accommodation & Food Services | 249 (61.3%) | 157 (38.7%) |
| Public Administration | 168 (59.4%) | 115 (40.6%) |
| Total | 3,911 (57.6%) | 2,883 (42.4%) |
Education in Carroll County
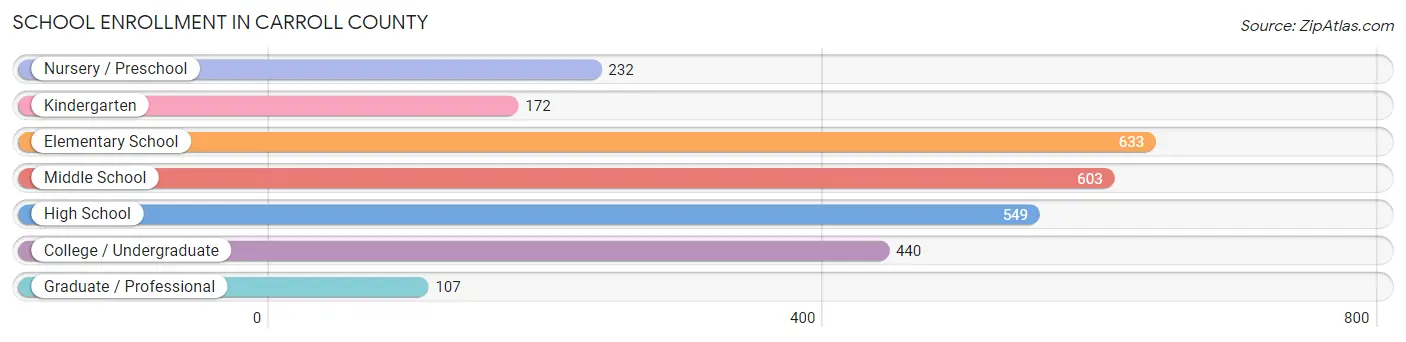
School Enrollment in Carroll County
The most common levels of schooling among the 2,736 students in Carroll County are elementary school (633 | 23.1%), middle school (603 | 22.0%), and high school (549 | 20.1%).
| School Level | # Students | % Students |
| Nursery / Preschool | 232 | 8.5% |
| Kindergarten | 172 | 6.3% |
| Elementary School | 633 | 23.1% |
| Middle School | 603 | 22.0% |
| High School | 549 | 20.1% |
| College / Undergraduate | 440 | 16.1% |
| Graduate / Professional | 107 | 3.9% |
| Total | 2,736 | 100.0% |
School Enrollment by Age by Funding Source in Carroll County
Out of a total of 2,736 students who are enrolled in schools in Carroll County, 460 (16.8%) attend a private institution, while the remaining 2,276 (83.2%) are enrolled in public schools. The age group of 35 years and over has the highest likelihood of being enrolled in private schools, with 41 (46.1% in the age bracket) enrolled. Conversely, the age group of 18 to 19 year olds has the lowest likelihood of being enrolled in a private school, with 183 (92.9% in the age bracket) attending a public institution.
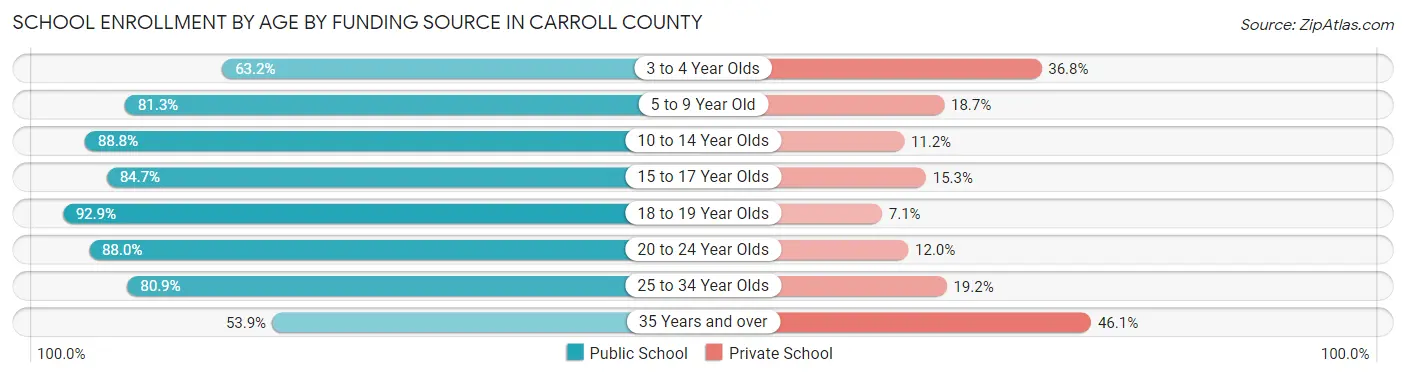
| Age Bracket | Public School | Private School |
| 3 to 4 Year Olds | 103 (63.2%) | 60 (36.8%) |
| 5 to 9 Year Old | 631 (81.3%) | 145 (18.7%) |
| 10 to 14 Year Olds | 672 (88.8%) | 85 (11.2%) |
| 15 to 17 Year Olds | 371 (84.7%) | 67 (15.3%) |
| 18 to 19 Year Olds | 183 (92.9%) | 14 (7.1%) |
| 20 to 24 Year Olds | 154 (88.0%) | 21 (12.0%) |
| 25 to 34 Year Olds | 114 (80.8%) | 27 (19.2%) |
| 35 Years and over | 48 (53.9%) | 41 (46.1%) |
| Total | 2,276 (83.2%) | 460 (16.8%) |
Educational Attainment by Field of Study in Carroll County
Education (448 | 18.6%), business (405 | 16.8%), science & technology (320 | 13.3%), arts & humanities (153 | 6.4%), and bio, nature & agricultural (146 | 6.1%) are the most common fields of study among 2,411 individuals in Carroll County who have obtained a bachelor's degree or higher.
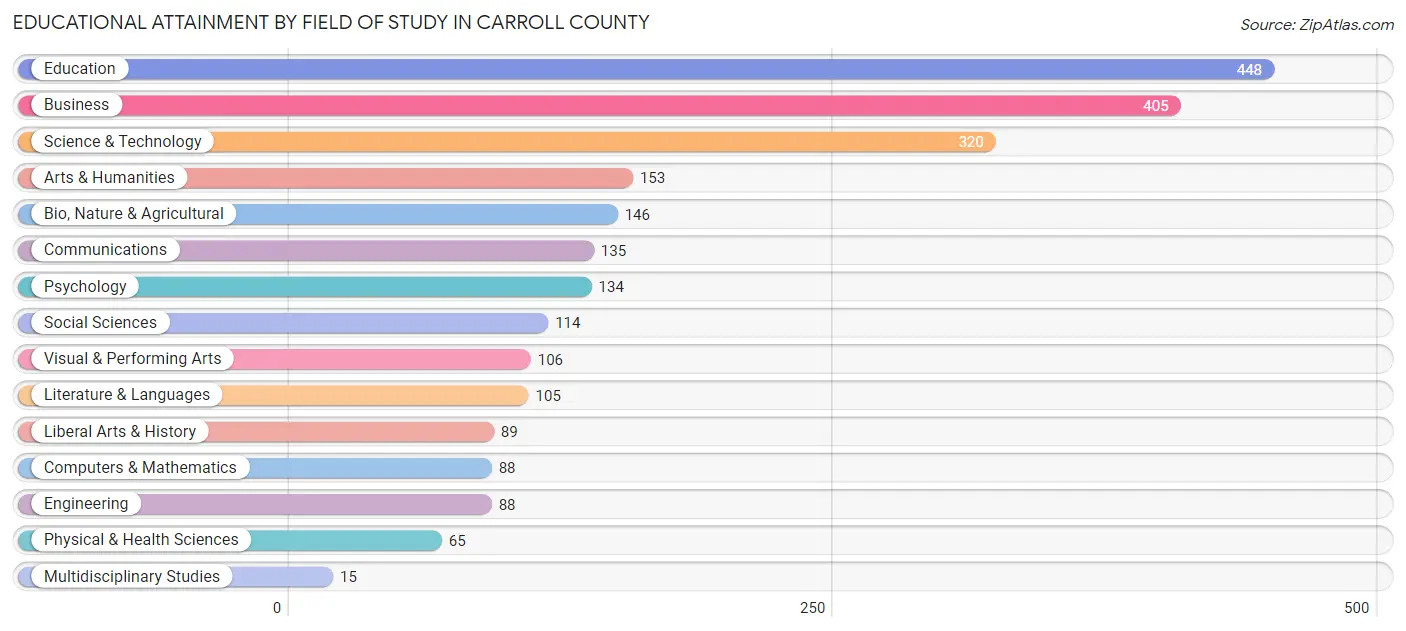
| Field of Study | # Graduates | % Graduates |
| Computers & Mathematics | 88 | 3.6% |
| Bio, Nature & Agricultural | 146 | 6.1% |
| Physical & Health Sciences | 65 | 2.7% |
| Psychology | 134 | 5.6% |
| Social Sciences | 114 | 4.7% |
| Engineering | 88 | 3.6% |
| Multidisciplinary Studies | 15 | 0.6% |
| Science & Technology | 320 | 13.3% |
| Business | 405 | 16.8% |
| Education | 448 | 18.6% |
| Literature & Languages | 105 | 4.4% |
| Liberal Arts & History | 89 | 3.7% |
| Visual & Performing Arts | 106 | 4.4% |
| Communications | 135 | 5.6% |
| Arts & Humanities | 153 | 6.4% |
| Total | 2,411 | 100.0% |
Transportation & Commute in Carroll County
Vehicle Availability by Sex in Carroll County
The most prevalent vehicle ownership categories in Carroll County are males with 2 vehicles (1,570, accounting for 40.6%) and females with 2 vehicles (1,233, making up 55.2%).
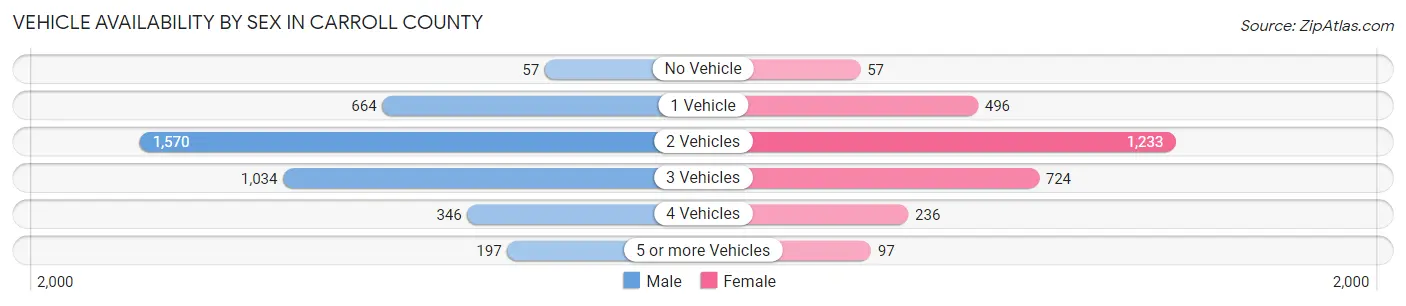
| Vehicles Available | Male | Female |
| No Vehicle | 57 (1.5%) | 57 (2.0%) |
| 1 Vehicle | 664 (17.2%) | 496 (17.4%) |
| 2 Vehicles | 1,570 (40.6%) | 1,233 (43.4%) |
| 3 Vehicles | 1,034 (26.7%) | 724 (25.5%) |
| 4 Vehicles | 346 (8.9%) | 236 (8.3%) |
| 5 or more Vehicles | 197 (5.1%) | 97 (3.4%) |
| Total | 3,868 (100.0%) | 2,843 (100.0%) |
Commute Time in Carroll County
The most frequently occuring commute durations in Carroll County are 5 to 9 minutes (992 commuters, 15.6%), less than 5 minutes (830 commuters, 13.0%), and 15 to 19 minutes (801 commuters, 12.6%).
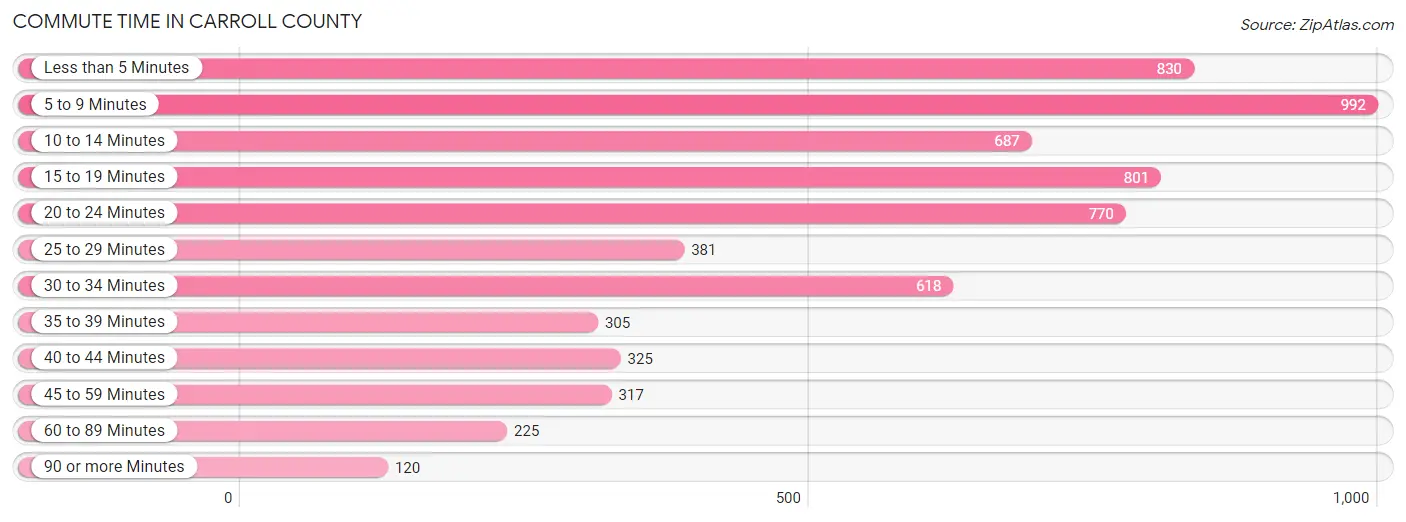
| Commute Time | # Commuters | % Commuters |
| Less than 5 Minutes | 830 | 13.0% |
| 5 to 9 Minutes | 992 | 15.6% |
| 10 to 14 Minutes | 687 | 10.8% |
| 15 to 19 Minutes | 801 | 12.6% |
| 20 to 24 Minutes | 770 | 12.1% |
| 25 to 29 Minutes | 381 | 6.0% |
| 30 to 34 Minutes | 618 | 9.7% |
| 35 to 39 Minutes | 305 | 4.8% |
| 40 to 44 Minutes | 325 | 5.1% |
| 45 to 59 Minutes | 317 | 5.0% |
| 60 to 89 Minutes | 225 | 3.5% |
| 90 or more Minutes | 120 | 1.9% |
Commute Time by Sex in Carroll County
The most common commute times in Carroll County are 5 to 9 minutes (689 commuters, 18.8%) for males and 20 to 24 minutes (359 commuters, 13.3%) for females.
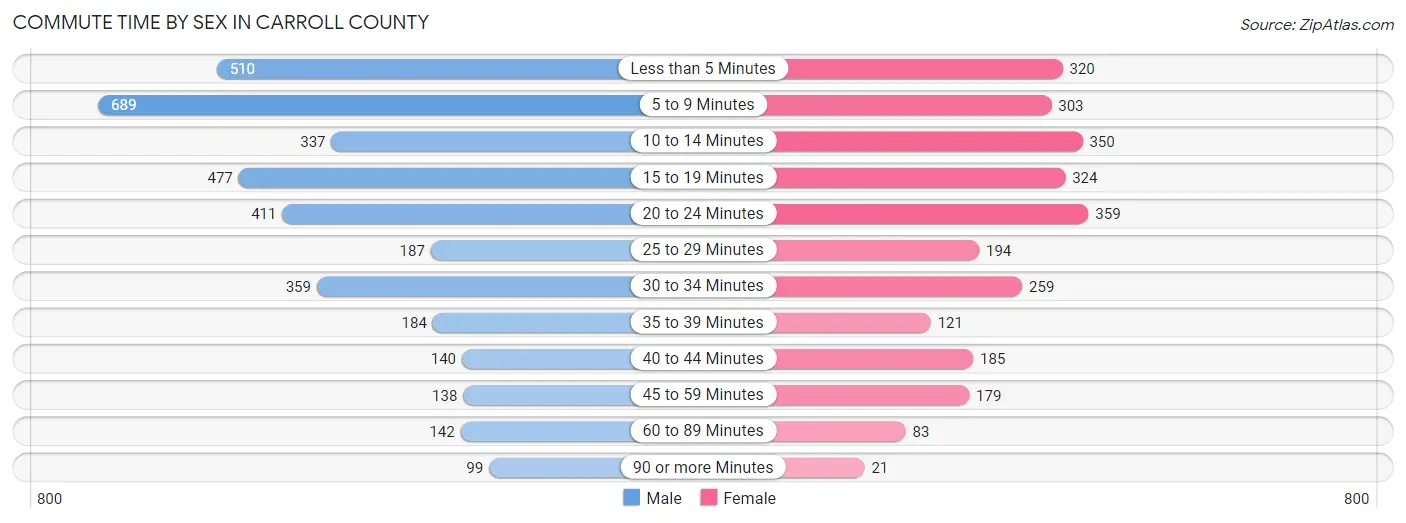
| Commute Time | Male | Female |
| Less than 5 Minutes | 510 (13.9%) | 320 (11.9%) |
| 5 to 9 Minutes | 689 (18.8%) | 303 (11.2%) |
| 10 to 14 Minutes | 337 (9.2%) | 350 (13.0%) |
| 15 to 19 Minutes | 477 (13.0%) | 324 (12.0%) |
| 20 to 24 Minutes | 411 (11.2%) | 359 (13.3%) |
| 25 to 29 Minutes | 187 (5.1%) | 194 (7.2%) |
| 30 to 34 Minutes | 359 (9.8%) | 259 (9.6%) |
| 35 to 39 Minutes | 184 (5.0%) | 121 (4.5%) |
| 40 to 44 Minutes | 140 (3.8%) | 185 (6.9%) |
| 45 to 59 Minutes | 138 (3.8%) | 179 (6.6%) |
| 60 to 89 Minutes | 142 (3.9%) | 83 (3.1%) |
| 90 or more Minutes | 99 (2.7%) | 21 (0.8%) |
Time of Departure to Work by Sex in Carroll County
The most frequent times of departure to work in Carroll County are 6:30 AM to 6:59 AM (556, 15.1%) for males and 7:00 AM to 7:29 AM (485, 18.0%) for females.
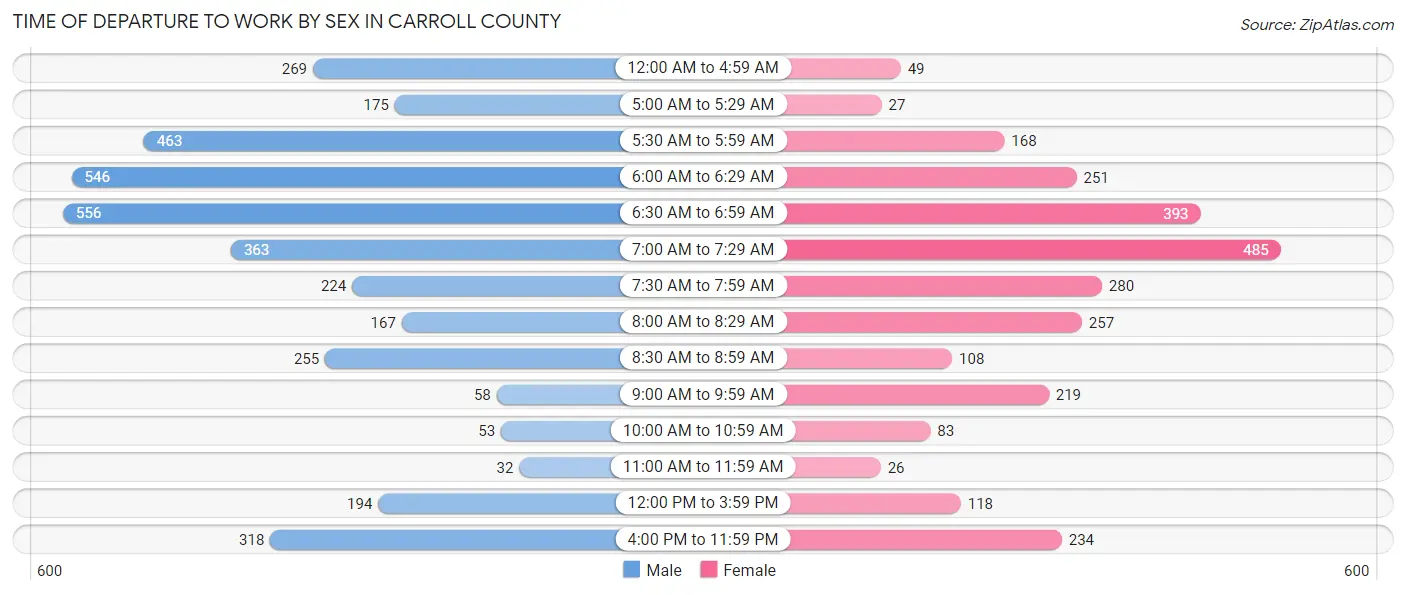
| Time of Departure | Male | Female |
| 12:00 AM to 4:59 AM | 269 (7.3%) | 49 (1.8%) |
| 5:00 AM to 5:29 AM | 175 (4.8%) | 27 (1.0%) |
| 5:30 AM to 5:59 AM | 463 (12.6%) | 168 (6.2%) |
| 6:00 AM to 6:29 AM | 546 (14.9%) | 251 (9.3%) |
| 6:30 AM to 6:59 AM | 556 (15.1%) | 393 (14.6%) |
| 7:00 AM to 7:29 AM | 363 (9.9%) | 485 (18.0%) |
| 7:30 AM to 7:59 AM | 224 (6.1%) | 280 (10.4%) |
| 8:00 AM to 8:29 AM | 167 (4.5%) | 257 (9.5%) |
| 8:30 AM to 8:59 AM | 255 (6.9%) | 108 (4.0%) |
| 9:00 AM to 9:59 AM | 58 (1.6%) | 219 (8.1%) |
| 10:00 AM to 10:59 AM | 53 (1.4%) | 83 (3.1%) |
| 11:00 AM to 11:59 AM | 32 (0.9%) | 26 (1.0%) |
| 12:00 PM to 3:59 PM | 194 (5.3%) | 118 (4.4%) |
| 4:00 PM to 11:59 PM | 318 (8.7%) | 234 (8.7%) |
| Total | 3,673 (100.0%) | 2,698 (100.0%) |
Housing Occupancy in Carroll County
Occupancy by Ownership in Carroll County
Of the total 6,317 dwellings in Carroll County, owner-occupied units account for 4,876 (77.2%), while renter-occupied units make up 1,441 (22.8%).
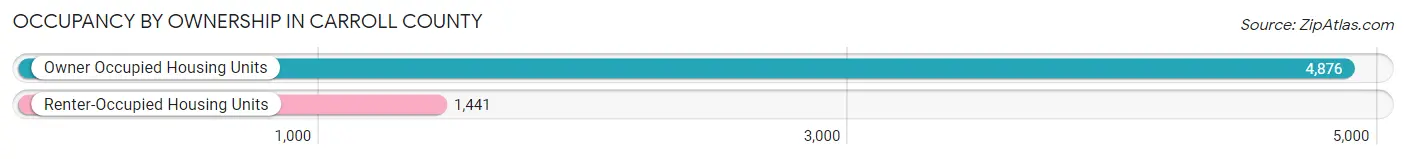
| Occupancy | # Housing Units | % Housing Units |
| Owner Occupied Housing Units | 4,876 | 77.2% |
| Renter-Occupied Housing Units | 1,441 | 22.8% |
| Total Occupied Housing Units | 6,317 | 100.0% |
Occupancy by Household Size in Carroll County
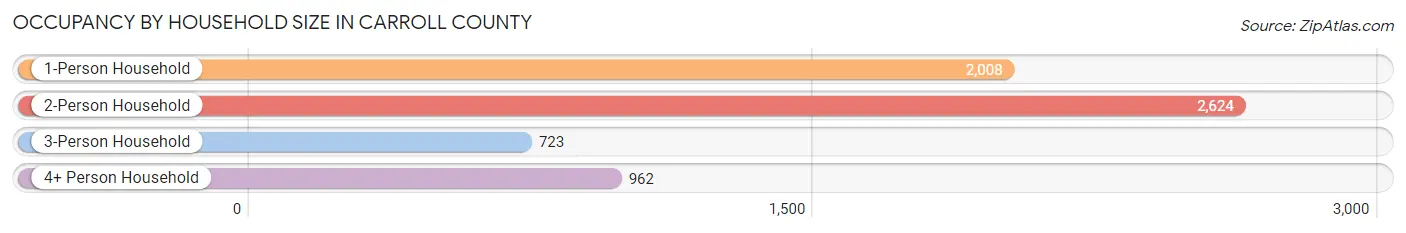
| Household Size | # Housing Units | % Housing Units |
| 1-Person Household | 2,008 | 31.8% |
| 2-Person Household | 2,624 | 41.5% |
| 3-Person Household | 723 | 11.5% |
| 4+ Person Household | 962 | 15.2% |
| Total Housing Units | 6,317 | 100.0% |
Occupancy by Ownership by Household Size in Carroll County
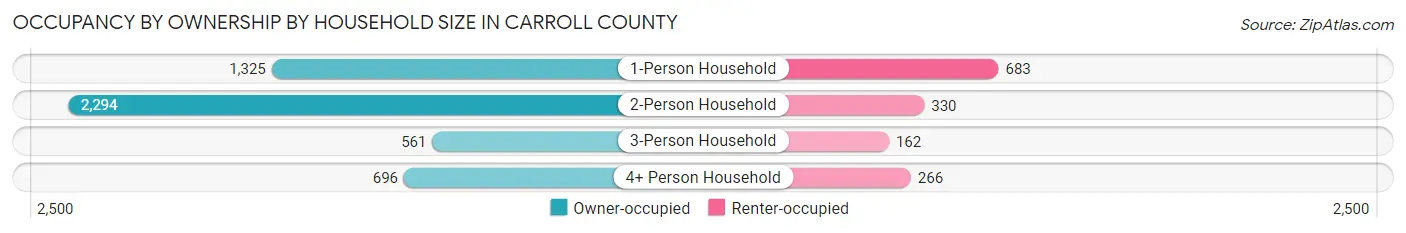
| Household Size | Owner-occupied | Renter-occupied |
| 1-Person Household | 1,325 (66.0%) | 683 (34.0%) |
| 2-Person Household | 2,294 (87.4%) | 330 (12.6%) |
| 3-Person Household | 561 (77.6%) | 162 (22.4%) |
| 4+ Person Household | 696 (72.4%) | 266 (27.7%) |
| Total Housing Units | 4,876 (77.2%) | 1,441 (22.8%) |
Occupancy by Educational Attainment in Carroll County
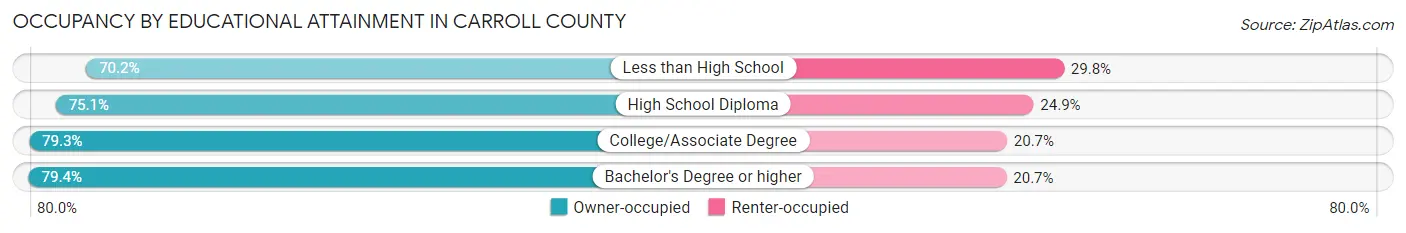
| Household Size | Owner-occupied | Renter-occupied |
| Less than High School | 316 (70.2%) | 134 (29.8%) |
| High School Diploma | 1,637 (75.1%) | 544 (24.9%) |
| College/Associate Degree | 1,770 (79.3%) | 463 (20.7%) |
| Bachelor's Degree or higher | 1,153 (79.3%) | 300 (20.6%) |
Occupancy by Age of Householder in Carroll County
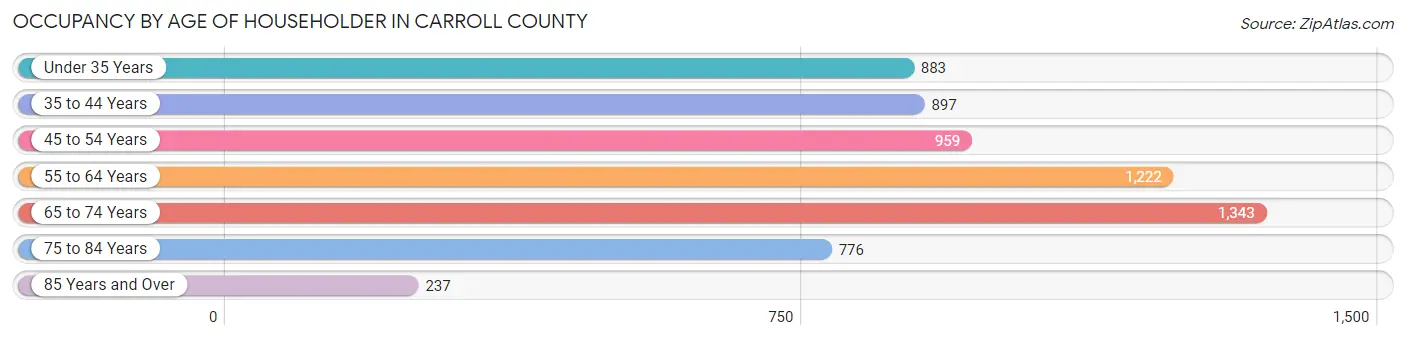
| Age Bracket | # Households | % Households |
| Under 35 Years | 883 | 14.0% |
| 35 to 44 Years | 897 | 14.2% |
| 45 to 54 Years | 959 | 15.2% |
| 55 to 64 Years | 1,222 | 19.3% |
| 65 to 74 Years | 1,343 | 21.3% |
| 75 to 84 Years | 776 | 12.3% |
| 85 Years and Over | 237 | 3.7% |
| Total | 6,317 | 100.0% |
Housing Finances in Carroll County
Median Income by Occupancy in Carroll County
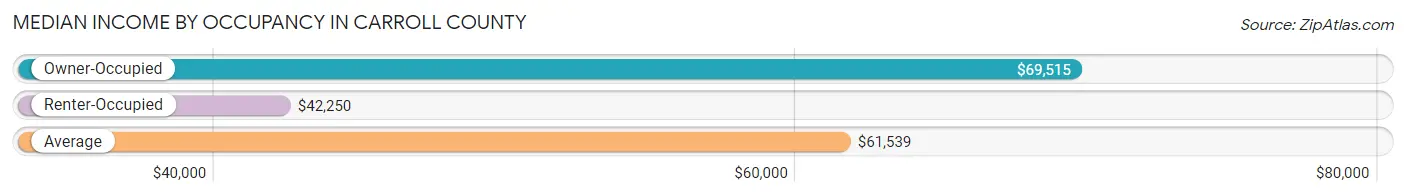
| Occupancy Type | # Households | Median Income |
| Owner-Occupied | 4,876 (77.2%) | $69,515 |
| Renter-Occupied | 1,441 (22.8%) | $42,250 |
| Average | 6,317 (100.0%) | $61,539 |
Occupancy by Householder Income Bracket in Carroll County
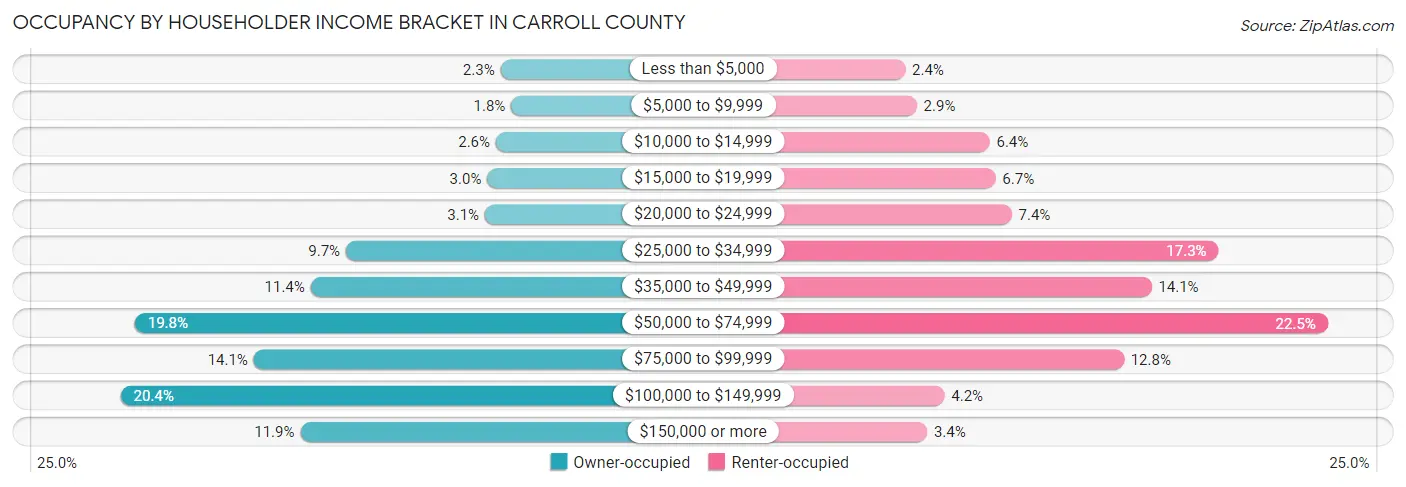
| Income Bracket | Owner-occupied | Renter-occupied |
| Less than $5,000 | 114 (2.3%) | 34 (2.4%) |
| $5,000 to $9,999 | 89 (1.8%) | 42 (2.9%) |
| $10,000 to $14,999 | 125 (2.6%) | 92 (6.4%) |
| $15,000 to $19,999 | 145 (3.0%) | 96 (6.7%) |
| $20,000 to $24,999 | 150 (3.1%) | 107 (7.4%) |
| $25,000 to $34,999 | 473 (9.7%) | 249 (17.3%) |
| $35,000 to $49,999 | 555 (11.4%) | 203 (14.1%) |
| $50,000 to $74,999 | 963 (19.8%) | 324 (22.5%) |
| $75,000 to $99,999 | 687 (14.1%) | 184 (12.8%) |
| $100,000 to $149,999 | 996 (20.4%) | 61 (4.2%) |
| $150,000 or more | 579 (11.9%) | 49 (3.4%) |
| Total | 4,876 (100.0%) | 1,441 (100.0%) |
Monthly Housing Cost Tiers in Carroll County
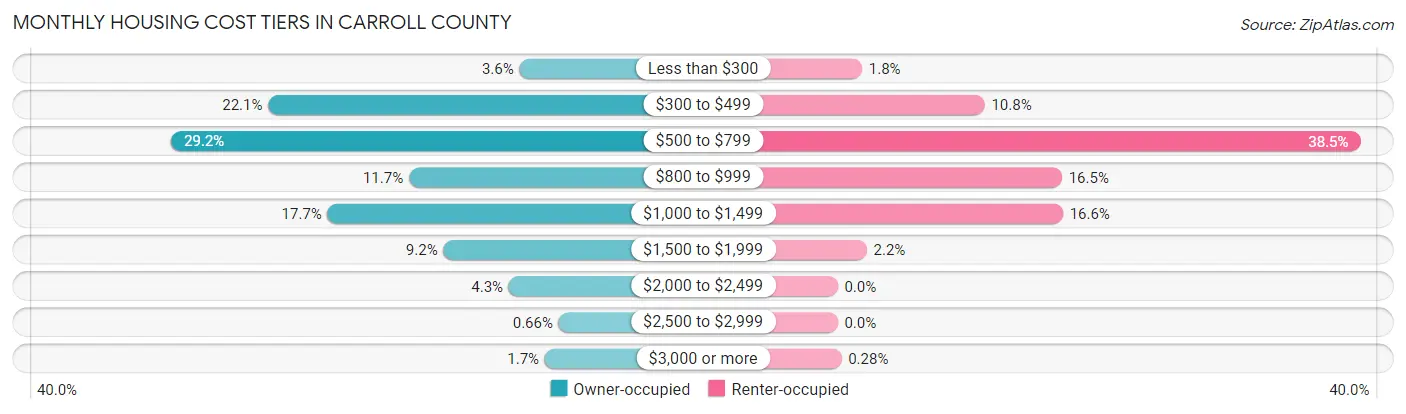
| Monthly Cost | Owner-occupied | Renter-occupied |
| Less than $300 | 173 (3.5%) | 26 (1.8%) |
| $300 to $499 | 1,075 (22.1%) | 156 (10.8%) |
| $500 to $799 | 1,425 (29.2%) | 555 (38.5%) |
| $800 to $999 | 570 (11.7%) | 238 (16.5%) |
| $1,000 to $1,499 | 862 (17.7%) | 239 (16.6%) |
| $1,500 to $1,999 | 446 (9.1%) | 31 (2.1%) |
| $2,000 to $2,499 | 211 (4.3%) | 0 (0.0%) |
| $2,500 to $2,999 | 32 (0.7%) | 0 (0.0%) |
| $3,000 or more | 82 (1.7%) | 4 (0.3%) |
| Total | 4,876 (100.0%) | 1,441 (100.0%) |
Physical Housing Characteristics in Carroll County
Housing Structures in Carroll County
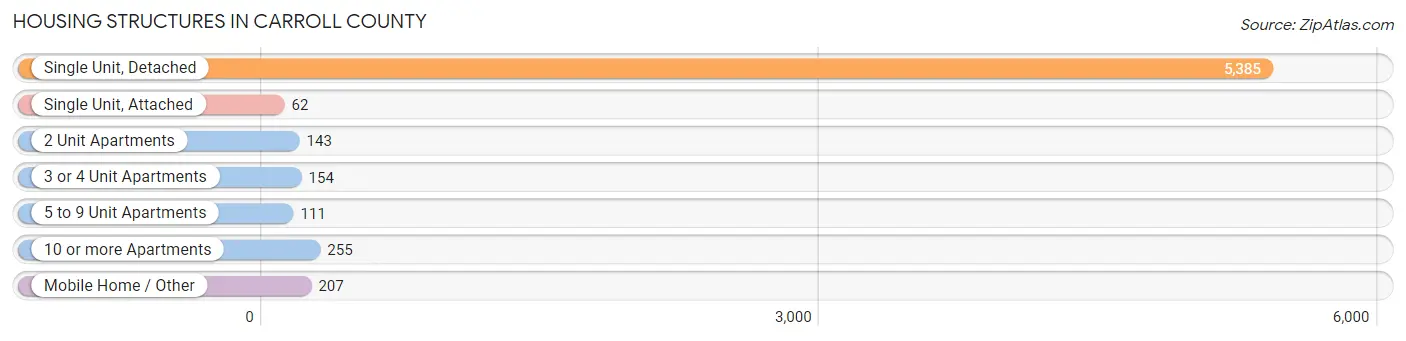
| Structure Type | # Housing Units | % Housing Units |
| Single Unit, Detached | 5,385 | 85.3% |
| Single Unit, Attached | 62 | 1.0% |
| 2 Unit Apartments | 143 | 2.3% |
| 3 or 4 Unit Apartments | 154 | 2.4% |
| 5 to 9 Unit Apartments | 111 | 1.8% |
| 10 or more Apartments | 255 | 4.0% |
| Mobile Home / Other | 207 | 3.3% |
| Total | 6,317 | 100.0% |
Housing Structures by Occupancy in Carroll County
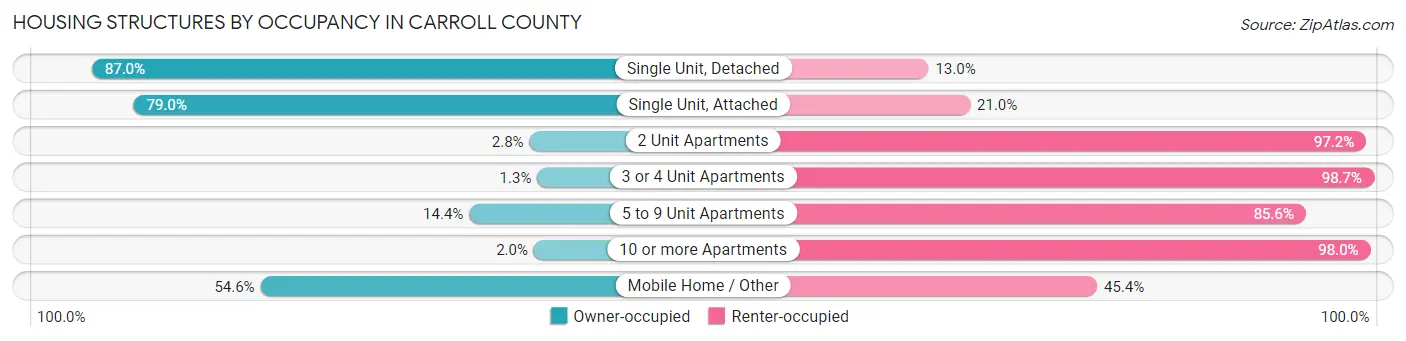
| Structure Type | Owner-occupied | Renter-occupied |
| Single Unit, Detached | 4,687 (87.0%) | 698 (13.0%) |
| Single Unit, Attached | 49 (79.0%) | 13 (21.0%) |
| 2 Unit Apartments | 4 (2.8%) | 139 (97.2%) |
| 3 or 4 Unit Apartments | 2 (1.3%) | 152 (98.7%) |
| 5 to 9 Unit Apartments | 16 (14.4%) | 95 (85.6%) |
| 10 or more Apartments | 5 (2.0%) | 250 (98.0%) |
| Mobile Home / Other | 113 (54.6%) | 94 (45.4%) |
| Total | 4,876 (77.2%) | 1,441 (22.8%) |
Housing Structures by Number of Rooms in Carroll County
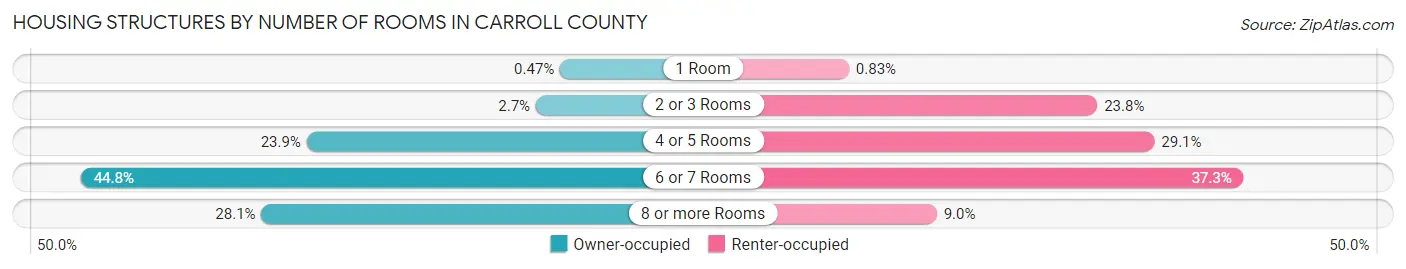
| Number of Rooms | Owner-occupied | Renter-occupied |
| 1 Room | 23 (0.5%) | 12 (0.8%) |
| 2 or 3 Rooms | 132 (2.7%) | 343 (23.8%) |
| 4 or 5 Rooms | 1,166 (23.9%) | 419 (29.1%) |
| 6 or 7 Rooms | 2,185 (44.8%) | 538 (37.3%) |
| 8 or more Rooms | 1,370 (28.1%) | 129 (8.9%) |
| Total | 4,876 (100.0%) | 1,441 (100.0%) |
Housing Structure by Heating Type in Carroll County
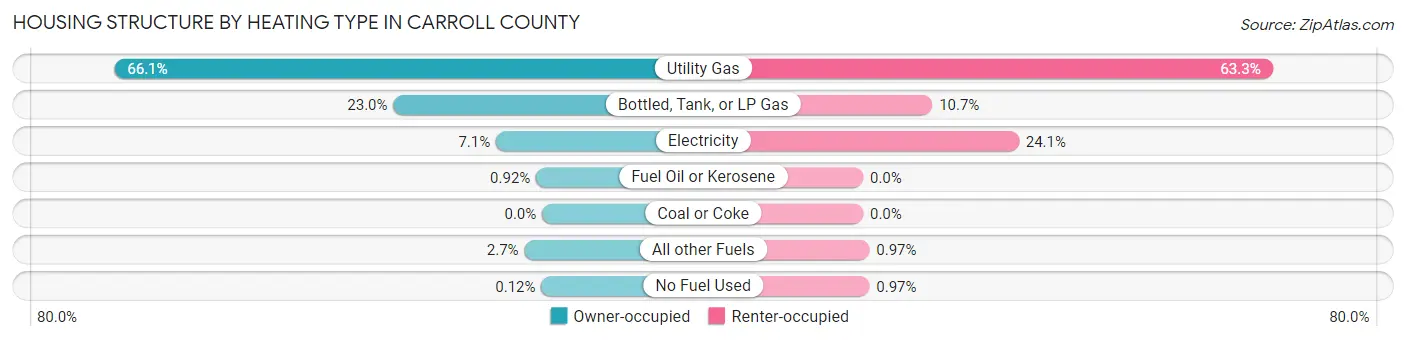
| Heating Type | Owner-occupied | Renter-occupied |
| Utility Gas | 3,224 (66.1%) | 912 (63.3%) |
| Bottled, Tank, or LP Gas | 1,121 (23.0%) | 154 (10.7%) |
| Electricity | 347 (7.1%) | 347 (24.1%) |
| Fuel Oil or Kerosene | 45 (0.9%) | 0 (0.0%) |
| Coal or Coke | 0 (0.0%) | 0 (0.0%) |
| All other Fuels | 133 (2.7%) | 14 (1.0%) |
| No Fuel Used | 6 (0.1%) | 14 (1.0%) |
| Total | 4,876 (100.0%) | 1,441 (100.0%) |
Household Vehicle Usage in Carroll County
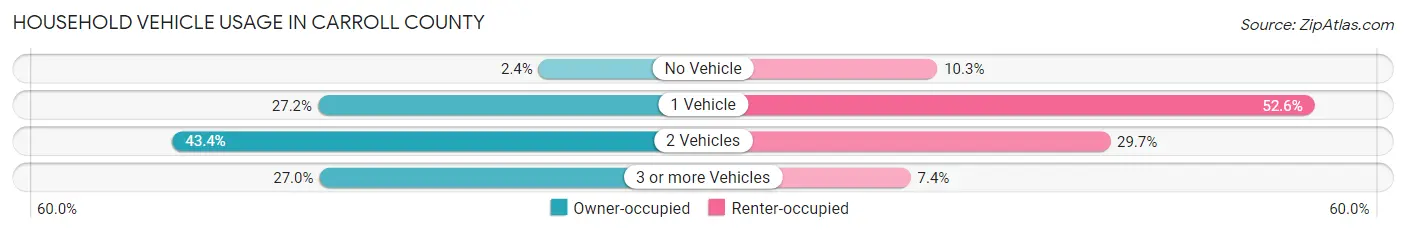
| Vehicles per Household | Owner-occupied | Renter-occupied |
| No Vehicle | 118 (2.4%) | 149 (10.3%) |
| 1 Vehicle | 1,324 (27.2%) | 758 (52.6%) |
| 2 Vehicles | 2,118 (43.4%) | 428 (29.7%) |
| 3 or more Vehicles | 1,316 (27.0%) | 106 (7.4%) |
| Total | 4,876 (100.0%) | 1,441 (100.0%) |
Real Estate & Mortgages in Carroll County
Real Estate and Mortgage Overview in Carroll County
| Characteristic | Without Mortgage | With Mortgage |
| Housing Units | 2,655 | 2,221 |
| Median Property Value | $104,900 | $117,400 |
| Median Household Income | $58,921 | $337 |
| Monthly Housing Costs | $527 | $82 |
| Real Estate Taxes | $2,115 | $34 |
Property Value by Mortgage Status in Carroll County

| Property Value | Without Mortgage | With Mortgage |
| Less than $50,000 | 394 (14.8%) | 216 (9.7%) |
| $50,000 to $99,999 | 856 (32.2%) | 711 (32.0%) |
| $100,000 to $299,999 | 1,135 (42.7%) | 1,022 (46.0%) |
| $300,000 to $499,999 | 190 (7.2%) | 210 (9.5%) |
| $500,000 to $749,999 | 60 (2.3%) | 19 (0.9%) |
| $750,000 to $999,999 | 0 (0.0%) | 17 (0.8%) |
| $1,000,000 or more | 20 (0.7%) | 26 (1.2%) |
| Total | 2,655 (100.0%) | 2,221 (100.0%) |
Household Income by Mortgage Status in Carroll County
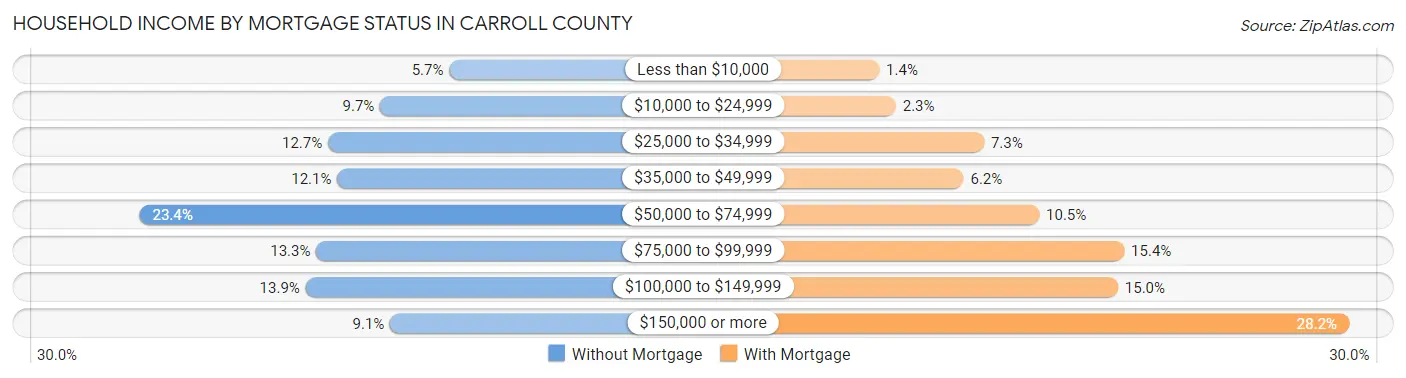
| Household Income | Without Mortgage | With Mortgage |
| Less than $10,000 | 152 (5.7%) | 30 (1.3%) |
| $10,000 to $24,999 | 257 (9.7%) | 51 (2.3%) |
| $25,000 to $34,999 | 336 (12.7%) | 163 (7.3%) |
| $35,000 to $49,999 | 322 (12.1%) | 137 (6.2%) |
| $50,000 to $74,999 | 622 (23.4%) | 233 (10.5%) |
| $75,000 to $99,999 | 354 (13.3%) | 341 (15.3%) |
| $100,000 to $149,999 | 370 (13.9%) | 333 (15.0%) |
| $150,000 or more | 242 (9.1%) | 626 (28.2%) |
| Total | 2,655 (100.0%) | 2,221 (100.0%) |
Property Value to Household Income Ratio in Carroll County
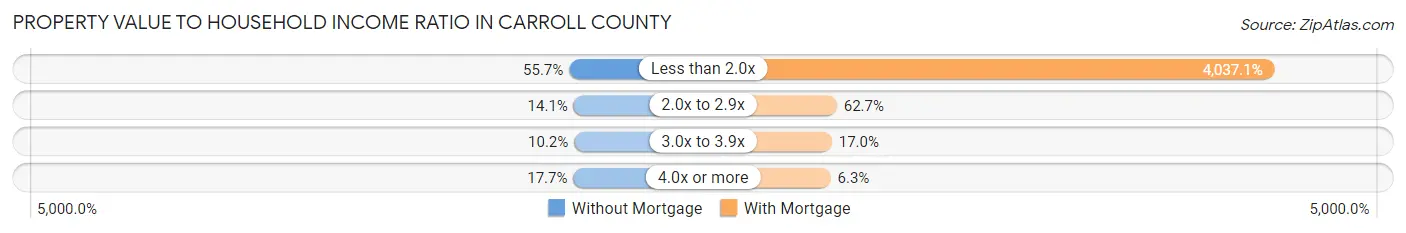
| Value-to-Income Ratio | Without Mortgage | With Mortgage |
| Less than 2.0x | 1,478 (55.7%) | 89,663 (4,037.1%) |
| 2.0x to 2.9x | 374 (14.1%) | 1,392 (62.7%) |
| 3.0x to 3.9x | 272 (10.2%) | 378 (17.0%) |
| 4.0x or more | 469 (17.7%) | 139 (6.3%) |
| Total | 2,655 (100.0%) | 2,221 (100.0%) |
Real Estate Taxes by Mortgage Status in Carroll County
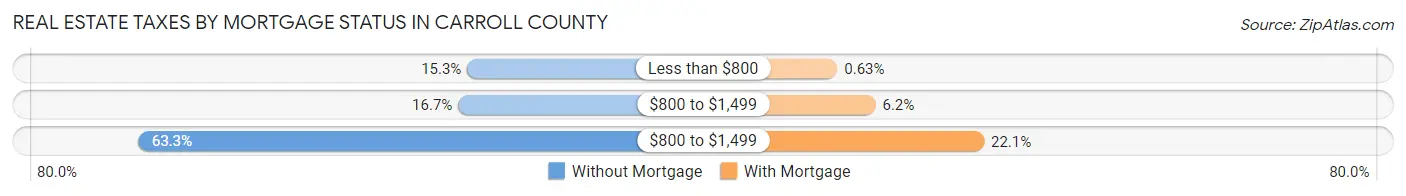
| Property Taxes | Without Mortgage | With Mortgage |
| Less than $800 | 407 (15.3%) | 14 (0.6%) |
| $800 to $1,499 | 442 (16.7%) | 138 (6.2%) |
| $800 to $1,499 | 1,681 (63.3%) | 490 (22.1%) |
| Total | 2,655 (100.0%) | 2,221 (100.0%) |
Health & Disability in Carroll County
Health Insurance Coverage by Age in Carroll County
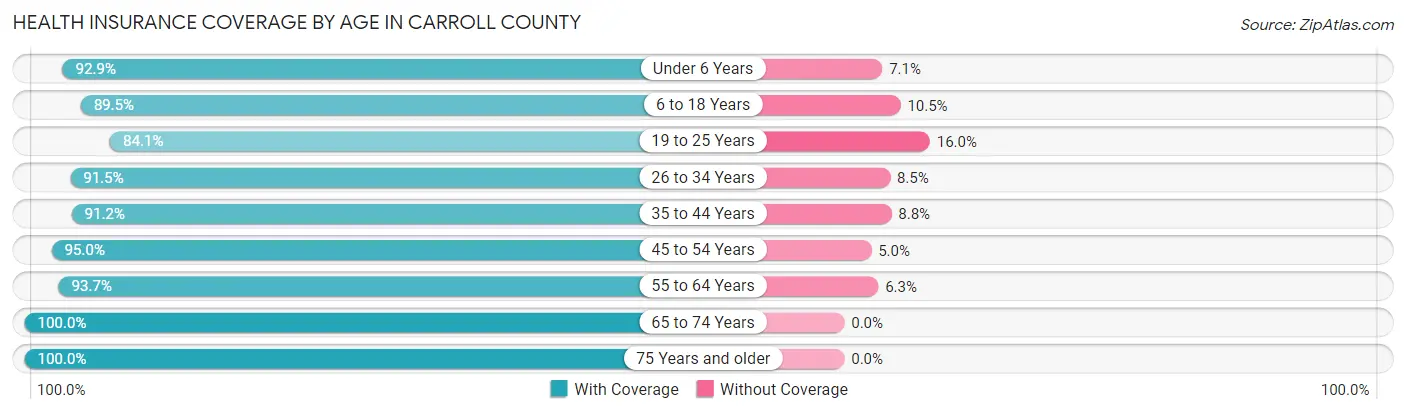
| Age Bracket | With Coverage | Without Coverage |
| Under 6 Years | 787 (92.9%) | 60 (7.1%) |
| 6 to 18 Years | 1,890 (89.5%) | 221 (10.5%) |
| 19 to 25 Years | 1,080 (84.1%) | 205 (16.0%) |
| 26 to 34 Years | 1,245 (91.5%) | 116 (8.5%) |
| 35 to 44 Years | 1,405 (91.2%) | 135 (8.8%) |
| 45 to 54 Years | 1,609 (95.0%) | 85 (5.0%) |
| 55 to 64 Years | 2,027 (93.7%) | 137 (6.3%) |
| 65 to 74 Years | 2,125 (100.0%) | 0 (0.0%) |
| 75 Years and older | 1,501 (100.0%) | 0 (0.0%) |
| Total | 13,669 (93.4%) | 959 (6.6%) |
Health Insurance Coverage by Citizenship Status in Carroll County
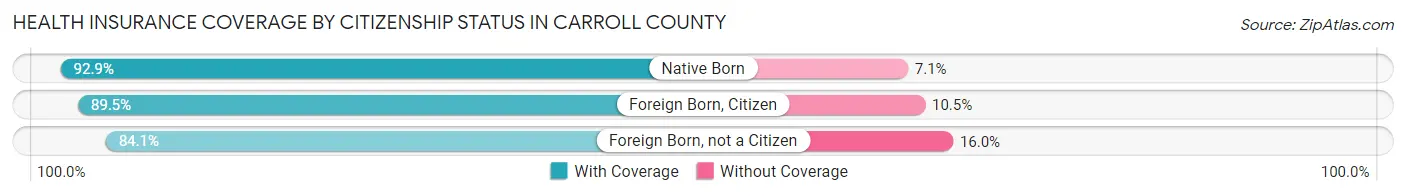
| Citizenship Status | With Coverage | Without Coverage |
| Native Born | 787 (92.9%) | 60 (7.1%) |
| Foreign Born, Citizen | 1,890 (89.5%) | 221 (10.5%) |
| Foreign Born, not a Citizen | 1,080 (84.1%) | 205 (16.0%) |
Health Insurance Coverage by Household Income in Carroll County
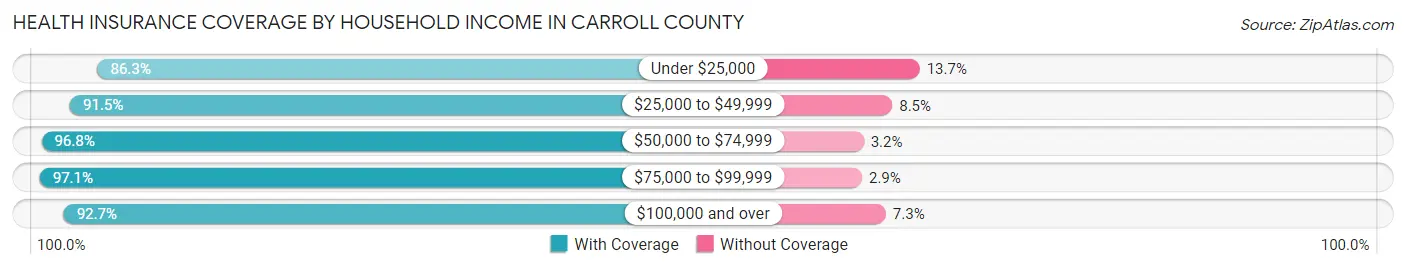
| Household Income | With Coverage | Without Coverage |
| Under $25,000 | 1,182 (86.3%) | 187 (13.7%) |
| $25,000 to $49,999 | 2,597 (91.5%) | 242 (8.5%) |
| $50,000 to $74,999 | 3,025 (96.8%) | 99 (3.2%) |
| $75,000 to $99,999 | 2,172 (97.1%) | 64 (2.9%) |
| $100,000 and over | 4,643 (92.7%) | 367 (7.3%) |
Public vs Private Health Insurance Coverage by Age in Carroll County
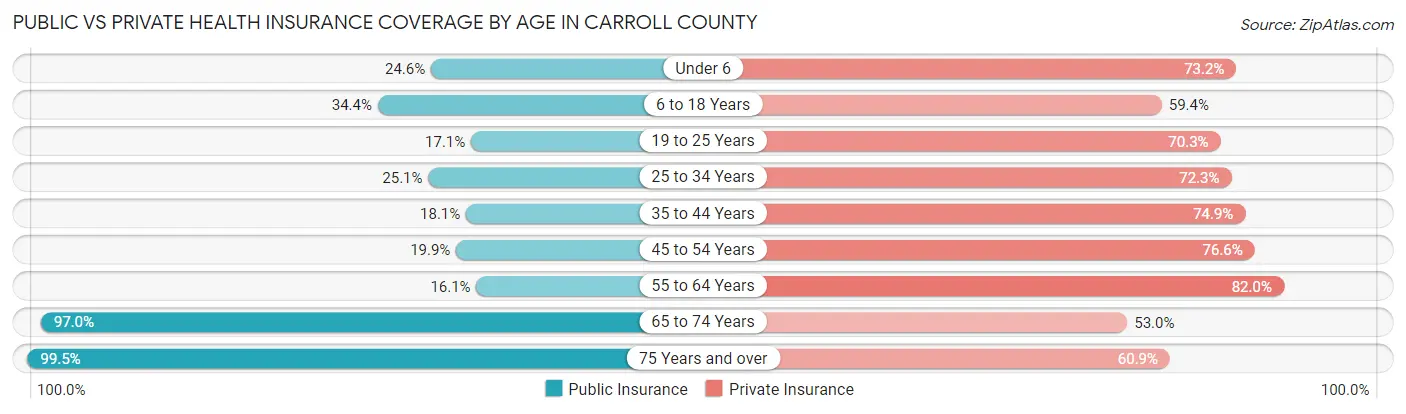
| Age Bracket | Public Insurance | Private Insurance |
| Under 6 | 208 (24.6%) | 620 (73.2%) |
| 6 to 18 Years | 727 (34.4%) | 1,254 (59.4%) |
| 19 to 25 Years | 220 (17.1%) | 903 (70.3%) |
| 25 to 34 Years | 341 (25.1%) | 984 (72.3%) |
| 35 to 44 Years | 278 (18.0%) | 1,153 (74.9%) |
| 45 to 54 Years | 337 (19.9%) | 1,298 (76.6%) |
| 55 to 64 Years | 349 (16.1%) | 1,775 (82.0%) |
| 65 to 74 Years | 2,061 (97.0%) | 1,126 (53.0%) |
| 75 Years and over | 1,493 (99.5%) | 914 (60.9%) |
| Total | 6,014 (41.1%) | 10,027 (68.5%) |
Disability Status by Sex by Age in Carroll County
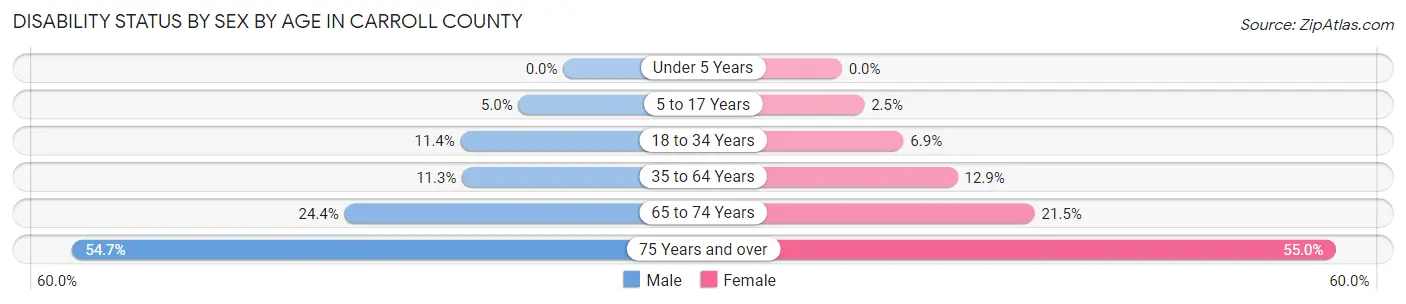
| Age Bracket | Male | Female |
| Under 5 Years | 0 (0.0%) | 0 (0.0%) |
| 5 to 17 Years | 53 (5.0%) | 26 (2.5%) |
| 18 to 34 Years | 182 (11.4%) | 82 (6.9%) |
| 35 to 64 Years | 308 (11.3%) | 343 (12.9%) |
| 65 to 74 Years | 258 (24.4%) | 229 (21.5%) |
| 75 Years and over | 380 (54.7%) | 443 (55.0%) |
Disability Class by Sex by Age in Carroll County
Disability Class: Hearing Difficulty
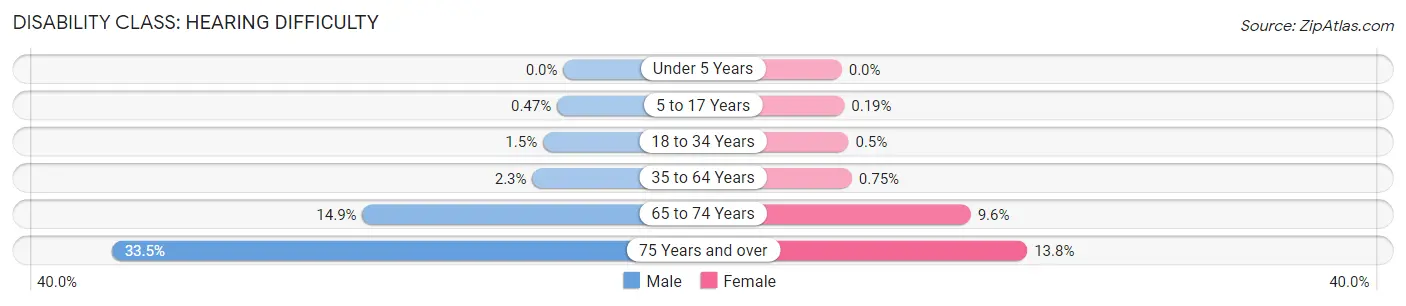
| Age Bracket | Male | Female |
| Under 5 Years | 0 (0.0%) | 0 (0.0%) |
| 5 to 17 Years | 5 (0.5%) | 2 (0.2%) |
| 18 to 34 Years | 24 (1.5%) | 6 (0.5%) |
| 35 to 64 Years | 63 (2.3%) | 20 (0.7%) |
| 65 to 74 Years | 158 (14.9%) | 102 (9.6%) |
| 75 Years and over | 233 (33.5%) | 111 (13.8%) |
Disability Class: Vision Difficulty
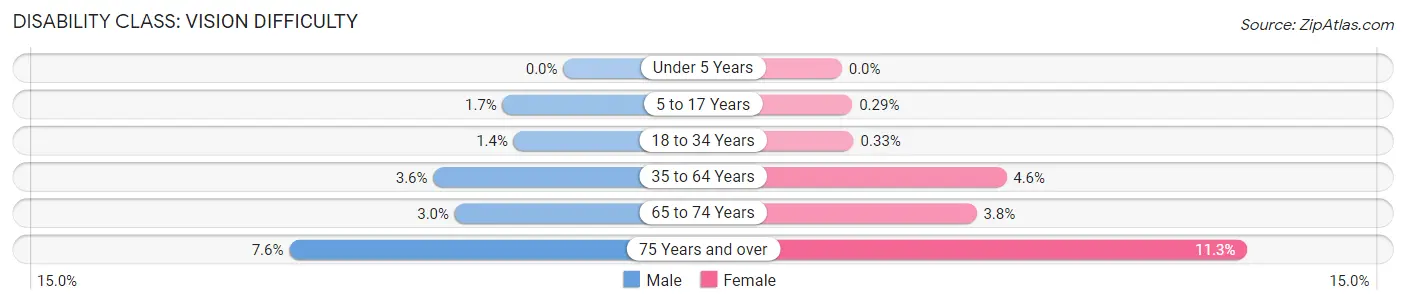
| Age Bracket | Male | Female |
| Under 5 Years | 0 (0.0%) | 0 (0.0%) |
| 5 to 17 Years | 18 (1.7%) | 3 (0.3%) |
| 18 to 34 Years | 22 (1.4%) | 4 (0.3%) |
| 35 to 64 Years | 99 (3.6%) | 122 (4.6%) |
| 65 to 74 Years | 32 (3.0%) | 40 (3.7%) |
| 75 Years and over | 53 (7.6%) | 91 (11.3%) |
Disability Class: Cognitive Difficulty
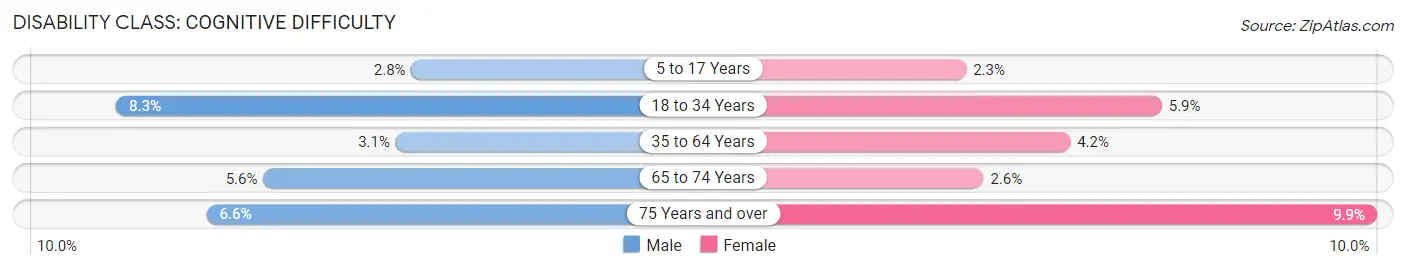
| Age Bracket | Male | Female |
| 5 to 17 Years | 30 (2.8%) | 24 (2.3%) |
| 18 to 34 Years | 132 (8.3%) | 71 (5.9%) |
| 35 to 64 Years | 85 (3.1%) | 113 (4.2%) |
| 65 to 74 Years | 59 (5.6%) | 28 (2.6%) |
| 75 Years and over | 46 (6.6%) | 80 (9.9%) |
Disability Class: Ambulatory Difficulty
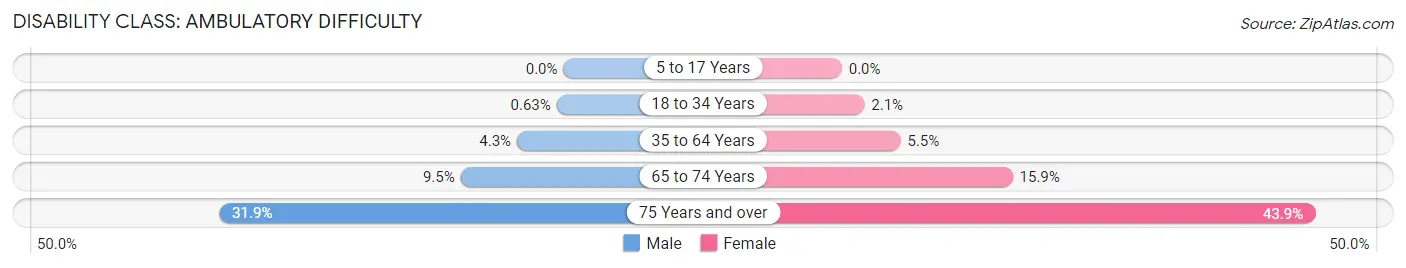
| Age Bracket | Male | Female |
| 5 to 17 Years | 0 (0.0%) | 0 (0.0%) |
| 18 to 34 Years | 10 (0.6%) | 25 (2.1%) |
| 35 to 64 Years | 118 (4.3%) | 145 (5.4%) |
| 65 to 74 Years | 101 (9.5%) | 169 (15.9%) |
| 75 Years and over | 222 (31.9%) | 354 (43.9%) |
Disability Class: Self-Care Difficulty
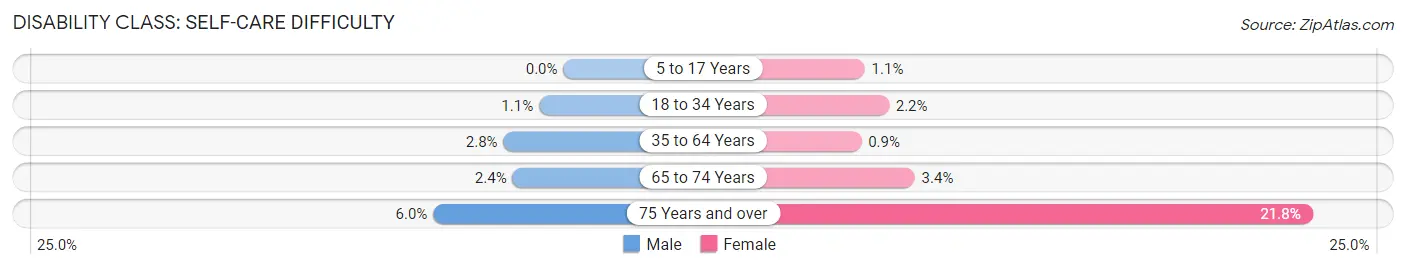
| Age Bracket | Male | Female |
| 5 to 17 Years | 0 (0.0%) | 11 (1.1%) |
| 18 to 34 Years | 18 (1.1%) | 26 (2.2%) |
| 35 to 64 Years | 76 (2.8%) | 24 (0.9%) |
| 65 to 74 Years | 25 (2.4%) | 36 (3.4%) |
| 75 Years and over | 42 (6.0%) | 176 (21.8%) |
Technology Access in Carroll County
Computing Device Access in Carroll County
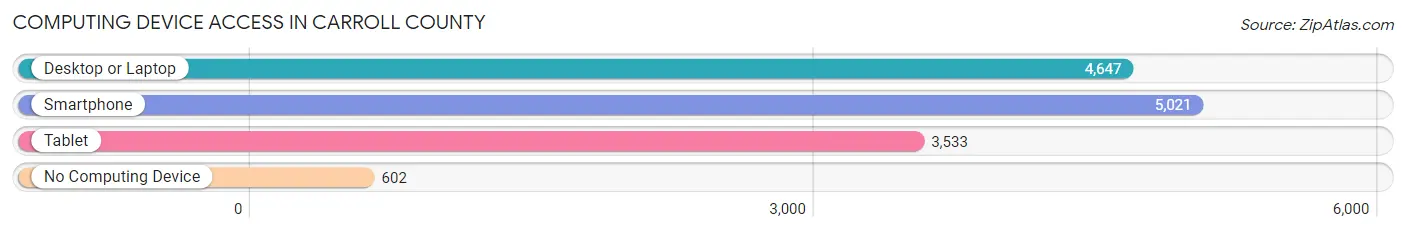
| Device Type | # Households | % Households |
| Desktop or Laptop | 4,647 | 73.6% |
| Smartphone | 5,021 | 79.5% |
| Tablet | 3,533 | 55.9% |
| No Computing Device | 602 | 9.5% |
| Total | 6,317 | 100.0% |
Internet Access in Carroll County
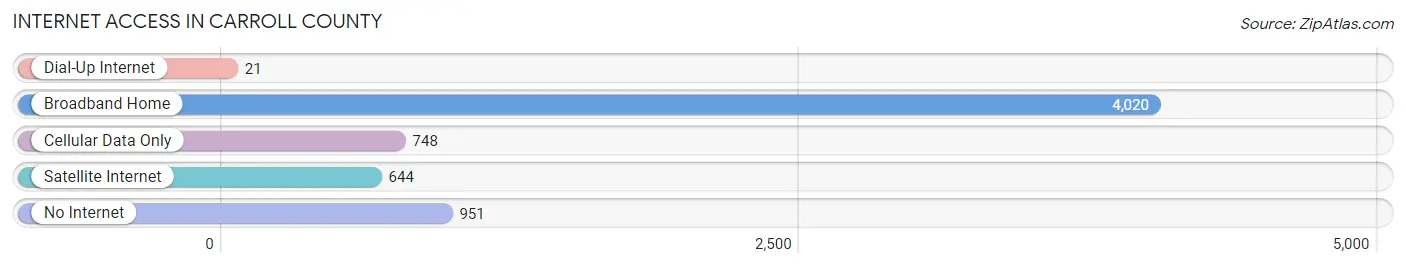
| Internet Type | # Households | % Households |
| Dial-Up Internet | 21 | 0.3% |
| Broadband Home | 4,020 | 63.6% |
| Cellular Data Only | 748 | 11.8% |
| Satellite Internet | 644 | 10.2% |
| No Internet | 951 | 15.0% |
| Total | 6,317 | 100.0% |
Carroll County Summary
Carroll County is located in the northwestern corner of the state of Illinois, and is part of the Quad Cities metropolitan area. The county was established in 1839 and named after Charles Carroll of Carrollton, the last surviving signer of the Declaration of Independence. The county seat is Mount Carroll, and the largest city is Savanna.
Geography
Carroll County is located in the northwestern corner of Illinois, and is bordered by Wisconsin to the north, Jo Daviess County to the east, Whiteside County to the south, and Iowa to the west. The county has a total area of 576 square miles, of which 573 square miles is land and 3.2 square miles is water. The terrain is mostly rolling hills, with the highest point being the summit of Apple River Hill at 1,039 feet above sea level. The county is drained by the Apple River, which flows through the center of the county, and the Mississippi River, which forms the western border.
Climate
Carroll County has a humid continental climate, with cold, snowy winters and hot, humid summers. The average annual temperature is 48°F, and the average annual precipitation is 33 inches.
Demographics
As of the 2010 census, there were 15,387 people, 6,093 households, and 4,092 families residing in the county. The population density was 27 people per square mile. The racial makeup of the county was 97.3% White, 0.3% African American, 0.3% Native American, 0.3% Asian, 0.2% from other races, and 1.5% from two or more races. Hispanic or Latino of any race were 1.3% of the population.
The median income for a household in the county was $45,845, and the median income for a family was $54,845. The per capita income for the county was $21,945. About 8.2% of families and 11.2% of the population were below the poverty line, including 14.2% of those under age 18 and 8.2% of those age 65 or over.
Economy
The economy of Carroll County is largely based on agriculture, with corn, soybeans, and hay being the main crops. The county is also home to several manufacturing companies, including a paper mill, a steel mill, and a plastics factory. Tourism is also an important part of the economy, with the county being home to several state parks and recreational areas.
History
Carroll County was first settled in the early 1830s, and was officially established in 1839. The county was named after Charles Carroll of Carrollton, the last surviving signer of the Declaration of Independence. The county seat was originally located in Savanna, but was moved to Mount Carroll in 1841.
During the Civil War, Carroll County was a major center of activity, with several battles taking place in the area. After the war, the county experienced a period of growth and prosperity, with the establishment of several industries, including a paper mill, a steel mill, and a plastics factory.
In the late 20th century, the county experienced a decline in population as people moved away to larger cities. However, the county has seen a resurgence in recent years, with an increase in tourism and the establishment of several new businesses.
Common Questions
What is the Total Population of Carroll County?
Total Population of Carroll County is 15,594.
What is the Total Male Population of Carroll County?
Total Male Population of Carroll County is 8,383.
What is the Total Female Population of Carroll County?
Total Female Population of Carroll County is 7,211.
What is the Ratio of Males per 100 Females in Carroll County?
There are 116.25 Males per 100 Females in Carroll County.
What is the Ratio of Females per 100 Males in Carroll County?
There are 86.02 Females per 100 Males in Carroll County.
What is the Median Population Age in Carroll County?
Median Population Age in Carroll County is 45.0 Years.
What is the Average Family Size in Carroll County
Average Family Size in Carroll County is 2.9 People.
What is the Average Household Size in Carroll County
Average Household Size in Carroll County is 2.3 People.
What is Per Capita Income in Carroll County?
Per Capita income in Carroll County is $31,882.
What is the Median Family Income in Carroll County?
Median Family Income in Carroll County is $77,736.
What is the Median Household income in Carroll County?
Median Household Income in Carroll County is $61,539.
What is Income or Wage Gap in Carroll County?
Income or Wage Gap in Carroll County is 24.8%.
Women in Carroll County earn 75.2 cents for every dollar earned by a man.
What is Family Income Deficit in Carroll County?
Family Income Deficit in Carroll County is $11,057.
Families that are below poverty line in Carroll County earn $11,057 less on average than the poverty threshold level.
What is Inequality or Gini Index in Carroll County?
Inequality or Gini Index in Carroll County is 0.42.
How Large is the Labor Force in Carroll County?
There are 7,159 People in the Labor Forcein in Carroll County.
What is the Percentage of People in the Labor Force in Carroll County?
54.3% of People are in the Labor Force in Carroll County.
What is the Unemployment Rate in Carroll County?
Unemployment Rate in Carroll County is 4.9%.