Boone County, IL
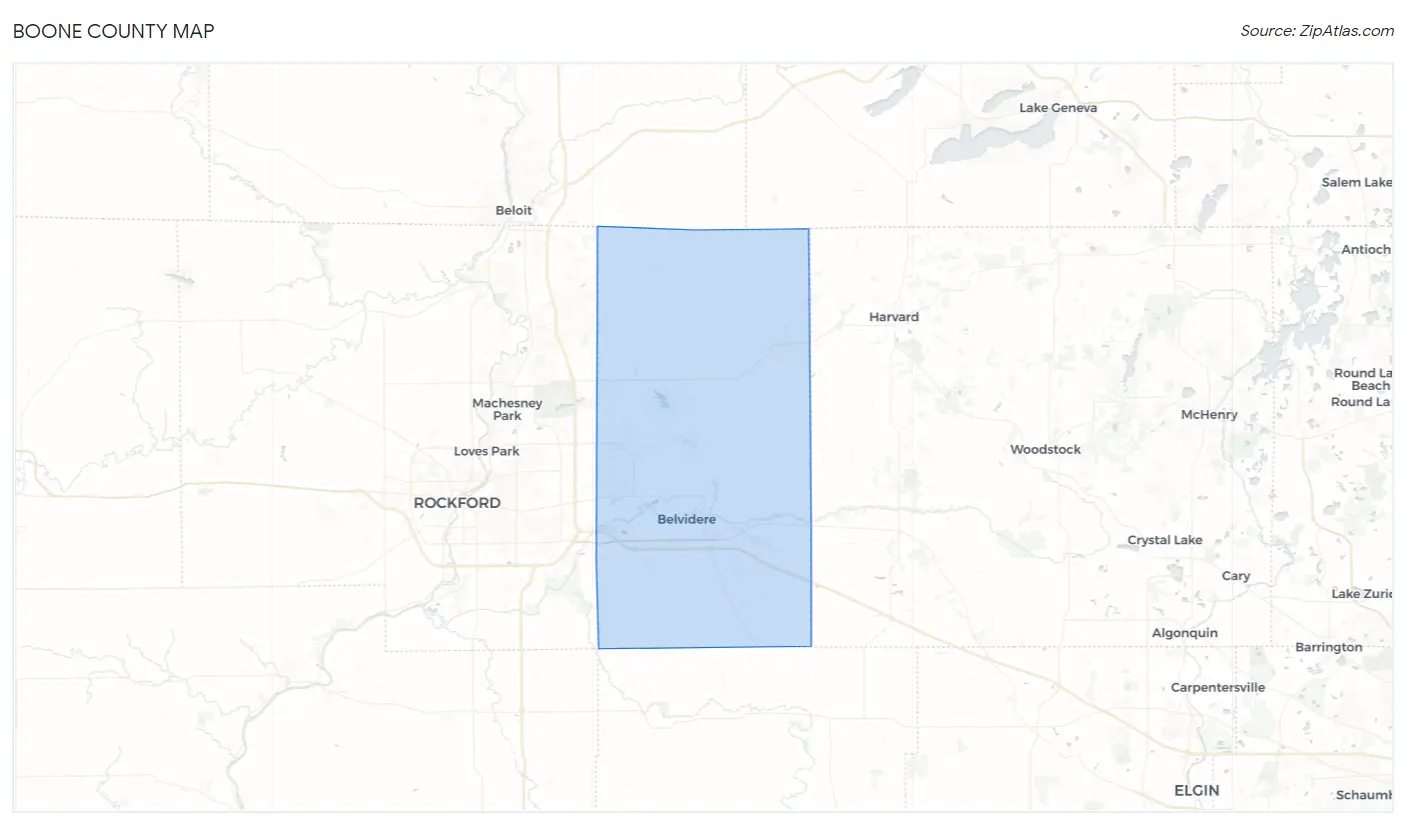
Boone County Map
Boone County Overview
53,459
TOTAL POPULATION
26,938
MALE POPULATION
26,521
FEMALE POPULATION
101.57
MALES / 100 FEMALES
98.45
FEMALES / 100 MALES
39.0
MEDIAN AGE
3.3
AVG FAMILY SIZE
2.8
AVG HOUSEHOLD SIZE
$37,055
PER CAPITA INCOME
$101,686
AVG FAMILY INCOME
$80,502
AVG HOUSEHOLD INCOME
38.2%
WAGE / INCOME GAP [ % ]
61.8¢/ $1
WAGE / INCOME GAP [ $ ]
$12,720
FAMILY INCOME DEFICIT
0.42
INEQUALITY / GINI INDEX
28,024
LABOR FORCE [ PEOPLE ]
66.0%
PERCENT IN LABOR FORCE
7.7%
UNEMPLOYMENT RATE
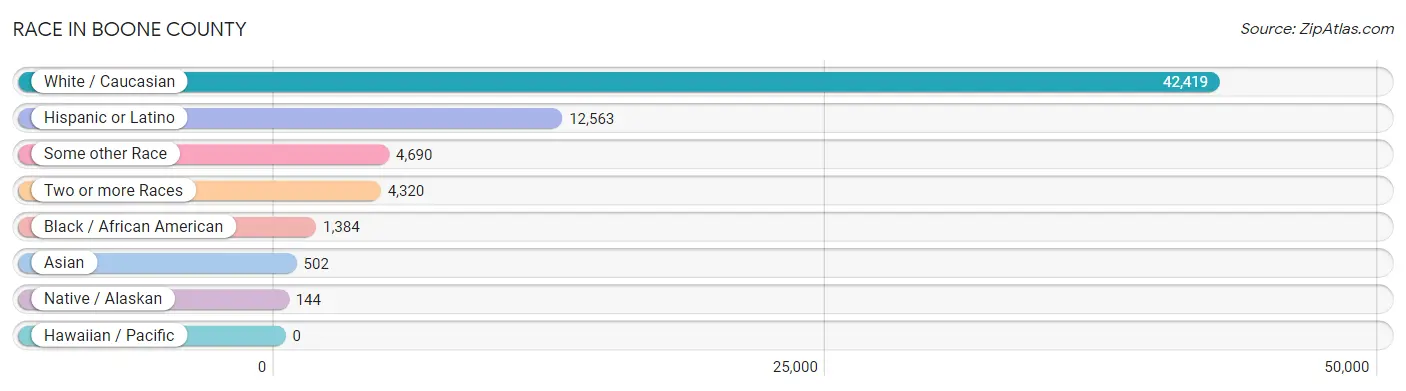
Race in Boone County
The most populous races in Boone County are White / Caucasian (42,419 | 79.3%), Hispanic or Latino (12,563 | 23.5%), and Some other Race (4,690 | 8.8%).
| Race | # Population | % Population |
| Asian | 502 | 0.9% |
| Black / African American | 1,384 | 2.6% |
| Hawaiian / Pacific | 0 | 0.0% |
| Hispanic or Latino | 12,563 | 23.5% |
| Native / Alaskan | 144 | 0.3% |
| White / Caucasian | 42,419 | 79.3% |
| Two or more Races | 4,320 | 8.1% |
| Some other Race | 4,690 | 8.8% |
| Total | 53,459 | 100.0% |
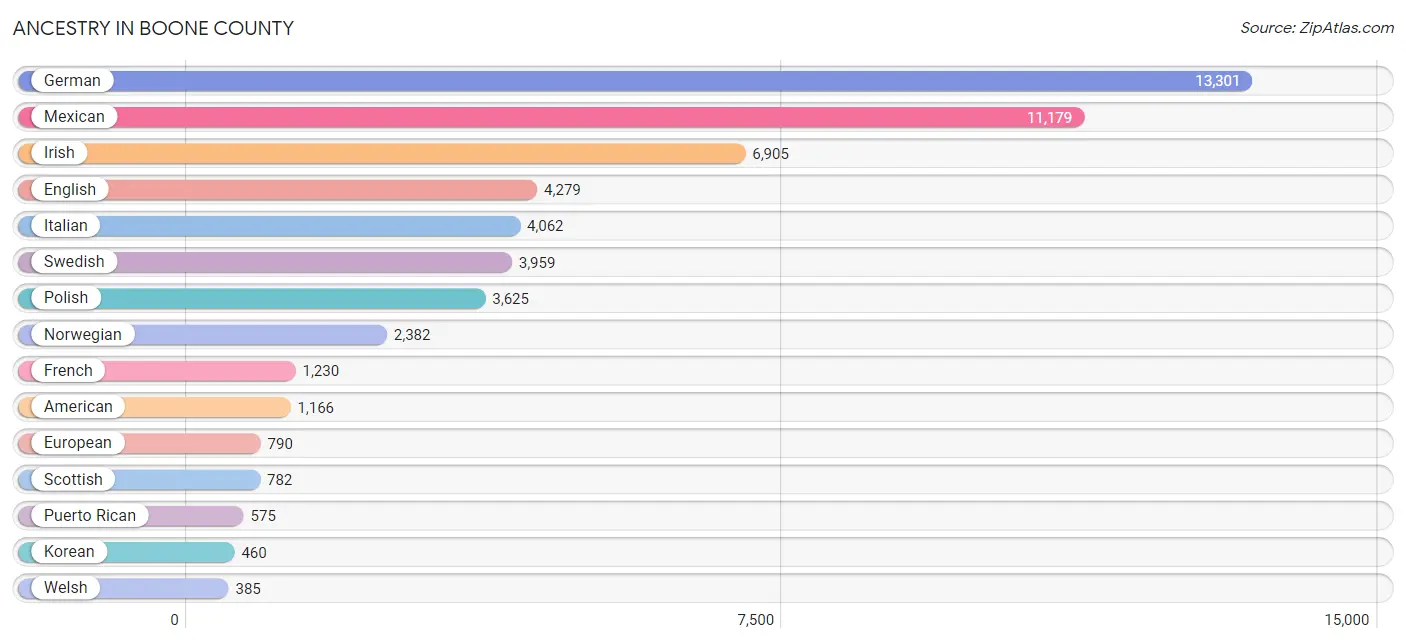
Ancestry in Boone County
The most populous ancestries reported in Boone County are German (13,301 | 24.9%), Mexican (11,179 | 20.9%), Irish (6,905 | 12.9%), English (4,279 | 8.0%), and Italian (4,062 | 7.6%), together accounting for 74.3% of all Boone County residents.
| Ancestry | # Population | % Population |
| American | 1,166 | 2.2% |
| Arab | 217 | 0.4% |
| Argentinean | 110 | 0.2% |
| Armenian | 45 | 0.1% |
| Austrian | 117 | 0.2% |
| Belgian | 241 | 0.4% |
| Bhutanese | 52 | 0.1% |
| Blackfeet | 108 | 0.2% |
| Bolivian | 27 | 0.1% |
| British | 183 | 0.3% |
| Burmese | 194 | 0.4% |
| Canadian | 74 | 0.1% |
| Central American | 201 | 0.4% |
| Cherokee | 374 | 0.7% |
| Chippewa | 45 | 0.1% |
| Croatian | 84 | 0.2% |
| Cuban | 128 | 0.2% |
| Czech | 174 | 0.3% |
| Czechoslovakian | 83 | 0.2% |
| Danish | 169 | 0.3% |
| Dutch | 276 | 0.5% |
| Eastern European | 85 | 0.2% |
| Ecuadorian | 19 | 0.0% |
| English | 4,279 | 8.0% |
| European | 790 | 1.5% |
| Finnish | 33 | 0.1% |
| French | 1,230 | 2.3% |
| French Canadian | 137 | 0.3% |
| German | 13,301 | 24.9% |
| Ghanaian | 20 | 0.0% |
| Greek | 254 | 0.5% |
| Guatemalan | 173 | 0.3% |
| Haitian | 5 | 0.0% |
| Honduran | 2 | 0.0% |
| Hungarian | 134 | 0.3% |
| Indian (Asian) | 318 | 0.6% |
| Irish | 6,905 | 12.9% |
| Italian | 4,062 | 7.6% |
| Jordanian | 60 | 0.1% |
| Korean | 460 | 0.9% |
| Lithuanian | 66 | 0.1% |
| Luxembourger | 12 | 0.0% |
| Malaysian | 74 | 0.1% |
| Mexican | 11,179 | 20.9% |
| Mexican American Indian | 152 | 0.3% |
| Northern European | 13 | 0.0% |
| Norwegian | 2,382 | 4.5% |
| Palestinian | 133 | 0.3% |
| Pennsylvania German | 17 | 0.0% |
| Peruvian | 68 | 0.1% |
| Polish | 3,625 | 6.8% |
| Puerto Rican | 575 | 1.1% |
| Romanian | 36 | 0.1% |
| Russian | 273 | 0.5% |
| Salvadoran | 26 | 0.1% |
| Scandinavian | 68 | 0.1% |
| Scotch-Irish | 123 | 0.2% |
| Scottish | 782 | 1.5% |
| Serbian | 79 | 0.2% |
| Sioux | 96 | 0.2% |
| Slovak | 23 | 0.0% |
| South American | 224 | 0.4% |
| South American Indian | 31 | 0.1% |
| Spaniard | 71 | 0.1% |
| Spanish | 98 | 0.2% |
| Sri Lankan | 20 | 0.0% |
| Subsaharan African | 20 | 0.0% |
| Swedish | 3,959 | 7.4% |
| Swiss | 183 | 0.3% |
| Syrian | 64 | 0.1% |
| Thai | 29 | 0.1% |
| Turkish | 24 | 0.0% |
| Ukrainian | 145 | 0.3% |
| Welsh | 385 | 0.7% |
| Yugoslavian | 30 | 0.1% | View All 75 Rows |
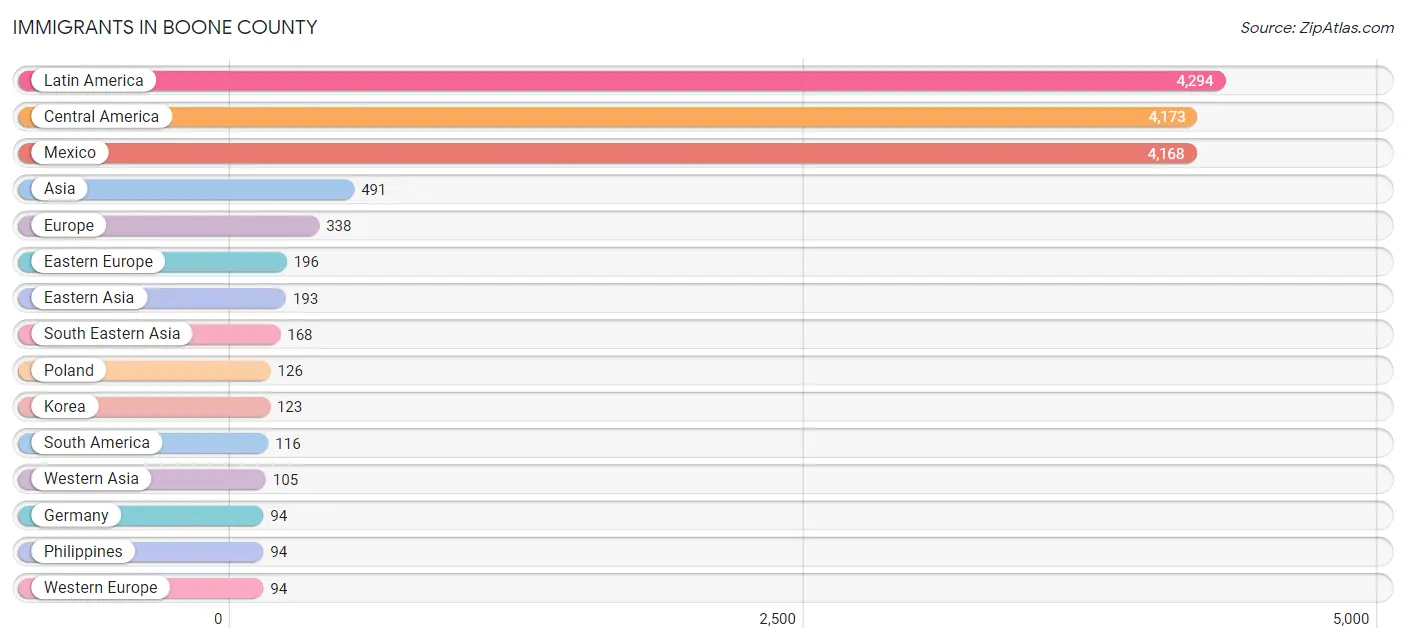
Immigrants in Boone County
The most numerous immigrant groups reported in Boone County came from Latin America (4,294 | 8.0%), Central America (4,173 | 7.8%), Mexico (4,168 | 7.8%), Asia (491 | 0.9%), and Europe (338 | 0.6%), together accounting for 25.2% of all Boone County residents.
| Immigration Origin | # Population | % Population |
| Africa | 20 | 0.0% |
| Argentina | 60 | 0.1% |
| Asia | 491 | 0.9% |
| Australia | 40 | 0.1% |
| Canada | 86 | 0.2% |
| Caribbean | 5 | 0.0% |
| Central America | 4,173 | 7.8% |
| China | 70 | 0.1% |
| Croatia | 27 | 0.1% |
| Eastern Asia | 193 | 0.4% |
| Eastern Europe | 196 | 0.4% |
| Ecuador | 19 | 0.0% |
| England | 5 | 0.0% |
| Europe | 338 | 0.6% |
| Germany | 94 | 0.2% |
| Ghana | 20 | 0.0% |
| Greece | 8 | 0.0% |
| Guatemala | 4 | 0.0% |
| Haiti | 5 | 0.0% |
| Honduras | 1 | 0.0% |
| Hong Kong | 17 | 0.0% |
| India | 25 | 0.1% |
| Ireland | 17 | 0.0% |
| Jordan | 32 | 0.1% |
| Korea | 123 | 0.2% |
| Kuwait | 27 | 0.1% |
| Laos | 74 | 0.1% |
| Latin America | 4,294 | 8.0% |
| Lebanon | 22 | 0.0% |
| Mexico | 4,168 | 7.8% |
| North Macedonia | 6 | 0.0% |
| Northern Europe | 40 | 0.1% |
| Norway | 16 | 0.0% |
| Oceania | 40 | 0.1% |
| Peru | 37 | 0.1% |
| Philippines | 94 | 0.2% |
| Poland | 126 | 0.2% |
| Russia | 7 | 0.0% |
| Scotland | 2 | 0.0% |
| Serbia | 30 | 0.1% |
| South America | 116 | 0.2% |
| South Central Asia | 25 | 0.1% |
| South Eastern Asia | 168 | 0.3% |
| Southern Europe | 8 | 0.0% |
| Western Africa | 20 | 0.0% |
| Western Asia | 105 | 0.2% |
| Western Europe | 94 | 0.2% | View All 47 Rows |
Sex and Age in Boone County
Sex and Age in Boone County
The most populous age groups in Boone County are 15 to 19 Years (2,254 | 8.4%) for men and 15 to 19 Years (2,124 | 8.0%) for women.
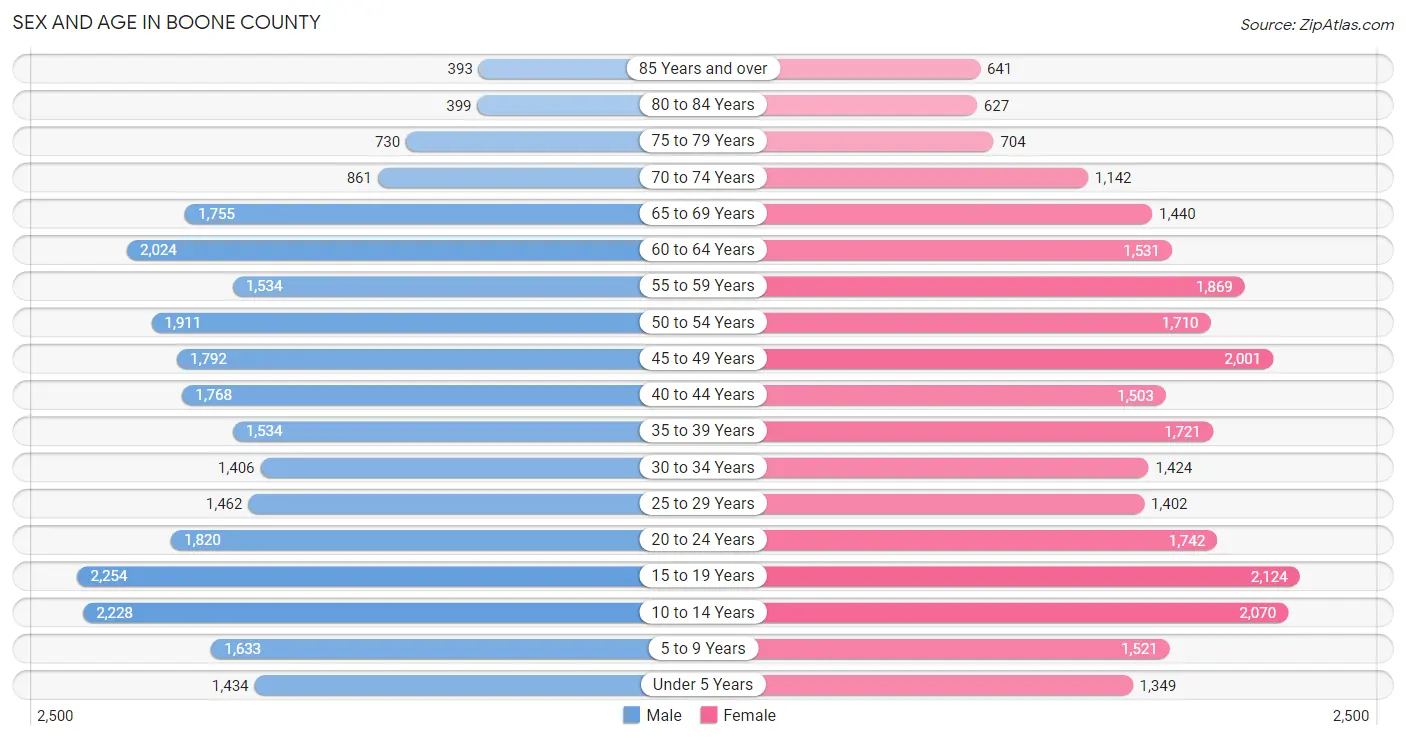
| Age Bracket | Male | Female |
| Under 5 Years | 1,434 (5.3%) | 1,349 (5.1%) |
| 5 to 9 Years | 1,633 (6.1%) | 1,521 (5.7%) |
| 10 to 14 Years | 2,228 (8.3%) | 2,070 (7.8%) |
| 15 to 19 Years | 2,254 (8.4%) | 2,124 (8.0%) |
| 20 to 24 Years | 1,820 (6.8%) | 1,742 (6.6%) |
| 25 to 29 Years | 1,462 (5.4%) | 1,402 (5.3%) |
| 30 to 34 Years | 1,406 (5.2%) | 1,424 (5.4%) |
| 35 to 39 Years | 1,534 (5.7%) | 1,721 (6.5%) |
| 40 to 44 Years | 1,768 (6.6%) | 1,503 (5.7%) |
| 45 to 49 Years | 1,792 (6.7%) | 2,001 (7.5%) |
| 50 to 54 Years | 1,911 (7.1%) | 1,710 (6.5%) |
| 55 to 59 Years | 1,534 (5.7%) | 1,869 (7.0%) |
| 60 to 64 Years | 2,024 (7.5%) | 1,531 (5.8%) |
| 65 to 69 Years | 1,755 (6.5%) | 1,440 (5.4%) |
| 70 to 74 Years | 861 (3.2%) | 1,142 (4.3%) |
| 75 to 79 Years | 730 (2.7%) | 704 (2.6%) |
| 80 to 84 Years | 399 (1.5%) | 627 (2.4%) |
| 85 Years and over | 393 (1.5%) | 641 (2.4%) |
| Total | 26,938 (100.0%) | 26,521 (100.0%) |
Families and Households in Boone County
Median Family Size in Boone County
The median family size in Boone County is 3.30 persons per family, with single male/father families (1,219 | 9.0%) accounting for the largest median family size of 3.35 persons per family. On the other hand, single female/mother families (1,908 | 14.1%) represent the smallest median family size with 3.07 persons per family.
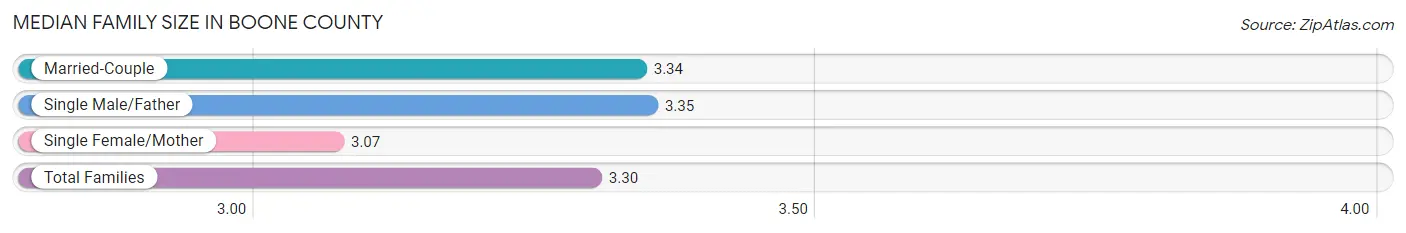
| Family Type | # Families | Family Size |
| Married-Couple | 10,388 (76.9%) | 3.34 |
| Single Male/Father | 1,219 (9.0%) | 3.35 |
| Single Female/Mother | 1,908 (14.1%) | 3.07 |
| Total Families | 13,515 (100.0%) | 3.30 |
Median Household Size in Boone County
The median household size in Boone County is 2.79 persons per household, with single male/father households (1,219 | 6.4%) accounting for the largest median household size of 3.94 persons per household. non-family households (5,509 | 29.0%) represent the smallest median household size with 1.28 persons per household.
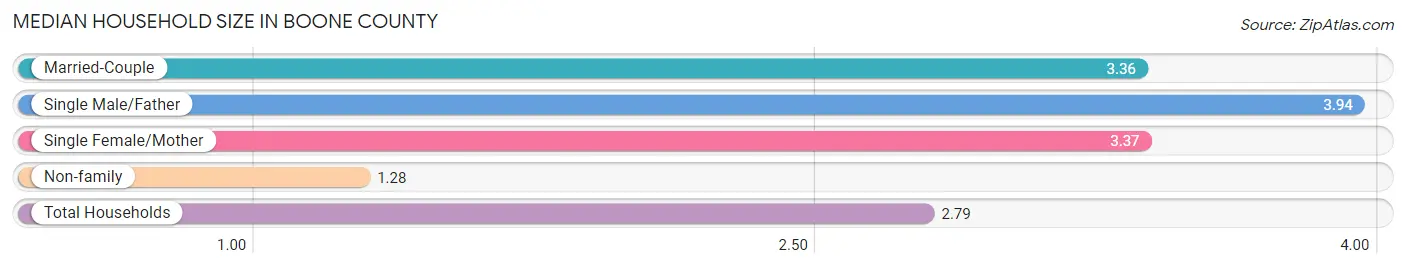
| Household Type | # Households | Household Size |
| Married-Couple | 10,388 (54.6%) | 3.36 |
| Single Male/Father | 1,219 (6.4%) | 3.94 |
| Single Female/Mother | 1,908 (10.0%) | 3.37 |
| Non-family | 5,509 (29.0%) | 1.28 |
| Total Households | 19,024 (100.0%) | 2.79 |
Household Size by Marriage Status in Boone County
Out of a total of 19,024 households in Boone County, 13,515 (71.0%) are family households, while 5,509 (29.0%) are nonfamily households. The most numerous type of family households are 2-person households, comprising 5,590, and the most common type of nonfamily households are 1-person households, comprising 4,395.
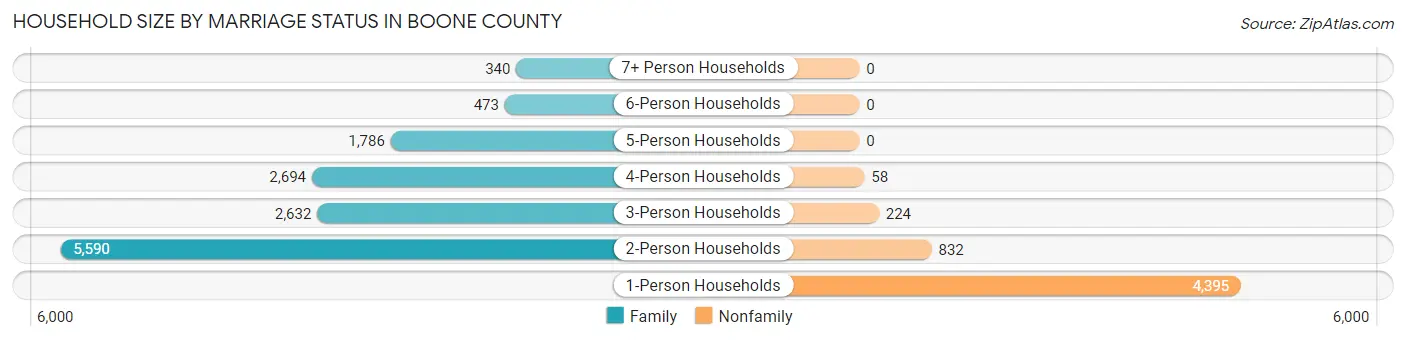
| Household Size | Family Households | Nonfamily Households |
| 1-Person Households | - | 4,395 (23.1%) |
| 2-Person Households | 5,590 (29.4%) | 832 (4.4%) |
| 3-Person Households | 2,632 (13.8%) | 224 (1.2%) |
| 4-Person Households | 2,694 (14.2%) | 58 (0.3%) |
| 5-Person Households | 1,786 (9.4%) | 0 (0.0%) |
| 6-Person Households | 473 (2.5%) | 0 (0.0%) |
| 7+ Person Households | 340 (1.8%) | 0 (0.0%) |
| Total | 13,515 (71.0%) | 5,509 (29.0%) |
Female Fertility in Boone County
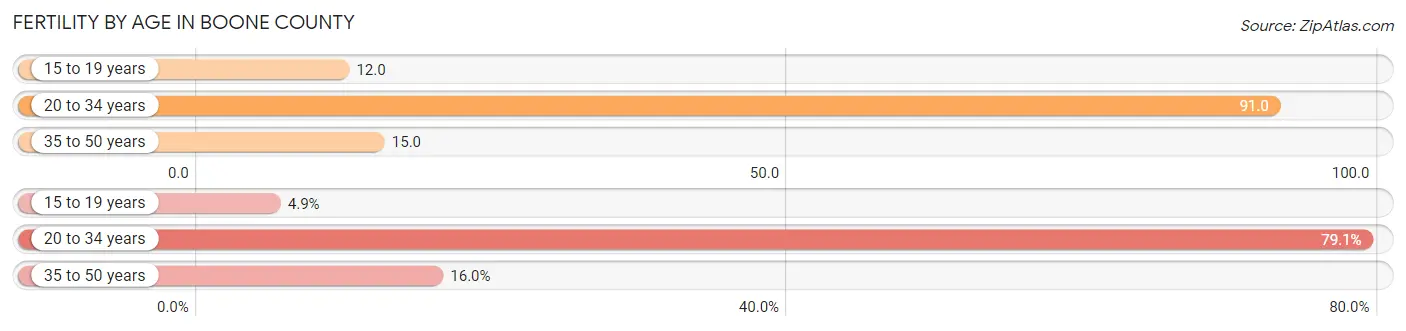
Fertility by Age in Boone County
Average fertility rate in Boone County is 43.0 births per 1,000 women. Women in the age bracket of 20 to 34 years have the highest fertility rate with 91.0 births per 1,000 women. Women in the age bracket of 20 to 34 years acount for 79.1% of all women with births.
| Age Bracket | Women with Births | Births / 1,000 Women |
| 15 to 19 years | 26 (4.9%) | 12.0 |
| 20 to 34 years | 416 (79.1%) | 91.0 |
| 35 to 50 years | 84 (16.0%) | 15.0 |
| Total | 526 (100.0%) | 43.0 |
Fertility by Age by Marriage Status in Boone County
39.2% of women with births (526) in Boone County are married. The highest percentage of unmarried women with births falls into 15 to 19 years age bracket with 100.0% of them unmarried at the time of birth, while the lowest percentage of unmarried women with births belong to 35 to 50 years age bracket with 7.1% of them unmarried.

| Age Bracket | Married | Unmarried |
| 15 to 19 years | 0 (0.0%) | 26 (100.0%) |
| 20 to 34 years | 128 (30.8%) | 288 (69.2%) |
| 35 to 50 years | 78 (92.9%) | 6 (7.1%) |
| Total | 206 (39.2%) | 320 (60.8%) |
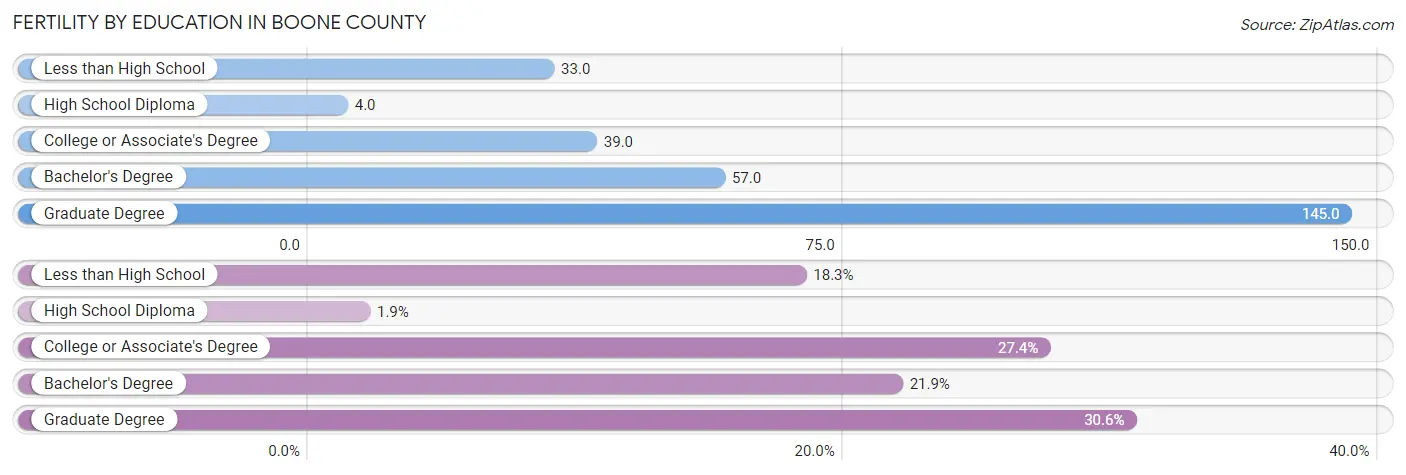
Fertility by Education in Boone County
Average fertility rate in Boone County is 43.0 births per 1,000 women. Women with the education attainment of graduate degree have the highest fertility rate of 145.0 births per 1,000 women, while women with the education attainment of high school diploma have the lowest fertility at 4.0 births per 1,000 women. Women with the education attainment of graduate degree represent 30.6% of all women with births.
| Educational Attainment | Women with Births | Births / 1,000 Women |
| Less than High School | 96 (18.2%) | 33.0 |
| High School Diploma | 10 (1.9%) | 4.0 |
| College or Associate's Degree | 144 (27.4%) | 39.0 |
| Bachelor's Degree | 115 (21.9%) | 57.0 |
| Graduate Degree | 161 (30.6%) | 145.0 |
| Total | 526 (100.0%) | 43.0 |
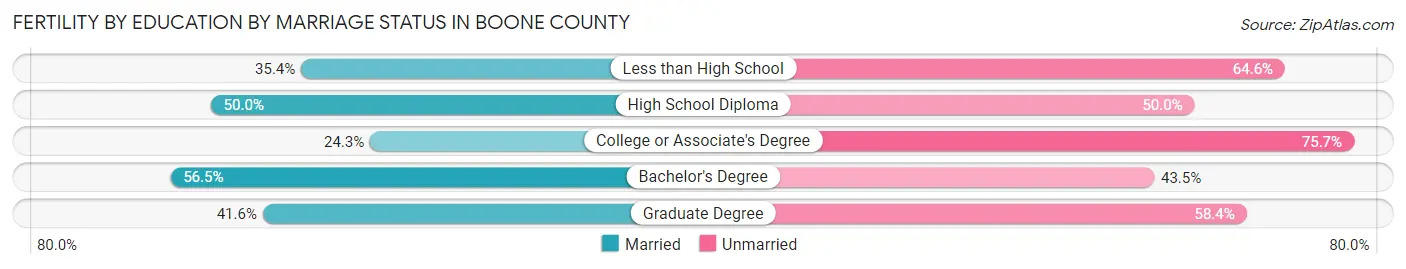
Fertility by Education by Marriage Status in Boone County
60.8% of women with births in Boone County are unmarried. Women with the educational attainment of bachelor's degree are most likely to be married with 56.5% of them married at childbirth, while women with the educational attainment of college or associate's degree are least likely to be married with 75.7% of them unmarried at childbirth.
| Educational Attainment | Married | Unmarried |
| Less than High School | 34 (35.4%) | 62 (64.6%) |
| High School Diploma | 5 (50.0%) | 5 (50.0%) |
| College or Associate's Degree | 35 (24.3%) | 109 (75.7%) |
| Bachelor's Degree | 65 (56.5%) | 50 (43.5%) |
| Graduate Degree | 67 (41.6%) | 94 (58.4%) |
| Total | 206 (39.2%) | 320 (60.8%) |
Income in Boone County
Income Overview in Boone County
Per Capita Income in Boone County is $37,055, while median incomes of families and households are $101,686 and $80,502 respectively.
| Characteristic | Number | Measure |
| Per Capita Income | 53,459 | $37,055 |
| Median Family Income | 13,515 | $101,686 |
| Mean Family Income | 13,515 | $117,270 |
| Median Household Income | 19,024 | $80,502 |
| Mean Household Income | 19,024 | $100,719 |
| Income Deficit | 13,515 | $12,720 |
| Wage / Income Gap (%) | 53,459 | 38.17% |
| Wage / Income Gap ($) | 53,459 | 61.83¢ per $1 |
| Gini / Inequality Index | 53,459 | 0.42 |
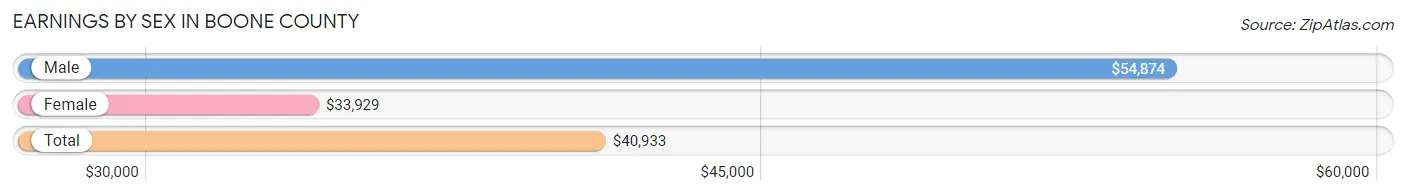
Earnings by Sex in Boone County
Average Earnings in Boone County are $40,933, $54,874 for men and $33,929 for women, a difference of 38.2%.
| Sex | Number | Average Earnings |
| Male | 15,585 (54.0%) | $54,874 |
| Female | 13,270 (46.0%) | $33,929 |
| Total | 28,855 (100.0%) | $40,933 |
Earnings by Sex by Income Bracket in Boone County
The most common earnings brackets in Boone County are $100,000+ for men (2,933 | 18.8%) and $35,000 to $39,999 for women (1,199 | 9.0%).
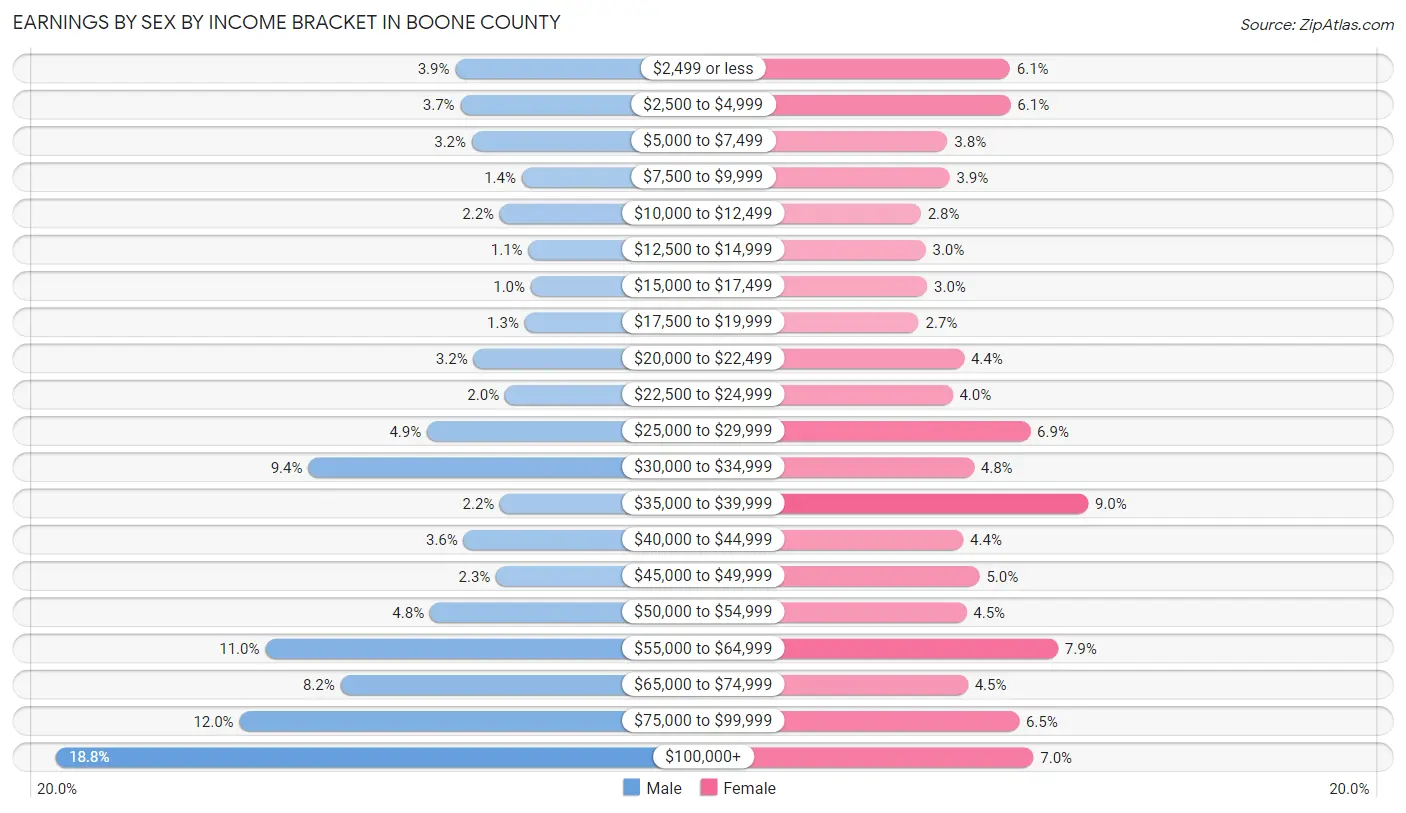
| Income | Male | Female |
| $2,499 or less | 602 (3.9%) | 811 (6.1%) |
| $2,500 to $4,999 | 572 (3.7%) | 814 (6.1%) |
| $5,000 to $7,499 | 505 (3.2%) | 500 (3.8%) |
| $7,500 to $9,999 | 214 (1.4%) | 511 (3.8%) |
| $10,000 to $12,499 | 341 (2.2%) | 367 (2.8%) |
| $12,500 to $14,999 | 175 (1.1%) | 392 (2.9%) |
| $15,000 to $17,499 | 160 (1.0%) | 400 (3.0%) |
| $17,500 to $19,999 | 196 (1.3%) | 357 (2.7%) |
| $20,000 to $22,499 | 496 (3.2%) | 582 (4.4%) |
| $22,500 to $24,999 | 311 (2.0%) | 526 (4.0%) |
| $25,000 to $29,999 | 767 (4.9%) | 912 (6.9%) |
| $30,000 to $34,999 | 1,460 (9.4%) | 631 (4.8%) |
| $35,000 to $39,999 | 340 (2.2%) | 1,199 (9.0%) |
| $40,000 to $44,999 | 553 (3.5%) | 579 (4.4%) |
| $45,000 to $49,999 | 363 (2.3%) | 660 (5.0%) |
| $50,000 to $54,999 | 750 (4.8%) | 595 (4.5%) |
| $55,000 to $64,999 | 1,712 (11.0%) | 1,049 (7.9%) |
| $65,000 to $74,999 | 1,272 (8.2%) | 601 (4.5%) |
| $75,000 to $99,999 | 1,863 (11.9%) | 856 (6.5%) |
| $100,000+ | 2,933 (18.8%) | 928 (7.0%) |
| Total | 15,585 (100.0%) | 13,270 (100.0%) |
Earnings by Sex by Educational Attainment in Boone County
Average earnings in Boone County are $59,492 for men and $38,262 for women, a difference of 35.7%. Men with an educational attainment of graduate degree enjoy the highest average annual earnings of $116,794, while those with less than high school education earn the least with $30,943. Women with an educational attainment of graduate degree earn the most with the average annual earnings of $78,987, while those with less than high school education have the smallest earnings of $31,427.
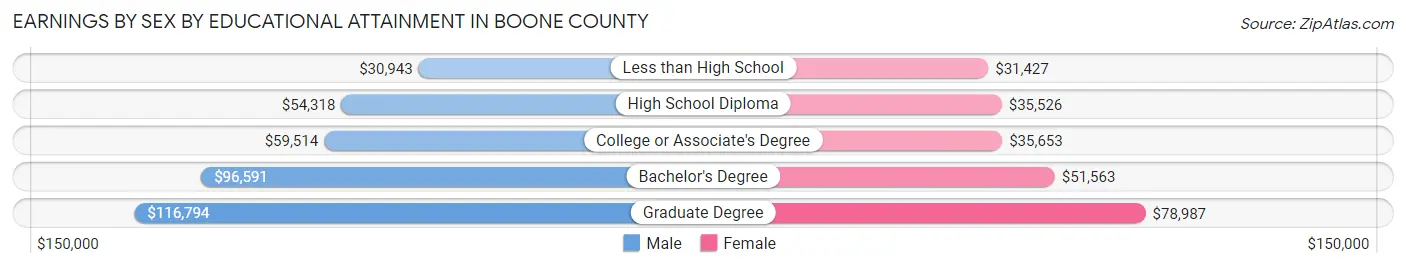
| Educational Attainment | Male Income | Female Income |
| Less than High School | $30,943 | $31,427 |
| High School Diploma | $54,318 | $35,526 |
| College or Associate's Degree | $59,514 | $35,653 |
| Bachelor's Degree | $96,591 | $51,563 |
| Graduate Degree | $116,794 | $78,987 |
| Total | $59,492 | $38,262 |
Family Income in Boone County
Family Income Brackets in Boone County
According to the Boone County family income data, there are 3,460 families falling into the $100,000 to $149,999 income range, which is the most common income bracket and makes up 25.6% of all families. Conversely, the $10,000 to $14,999 income bracket is the least frequent group with only 149 families (1.1%) belonging to this category.
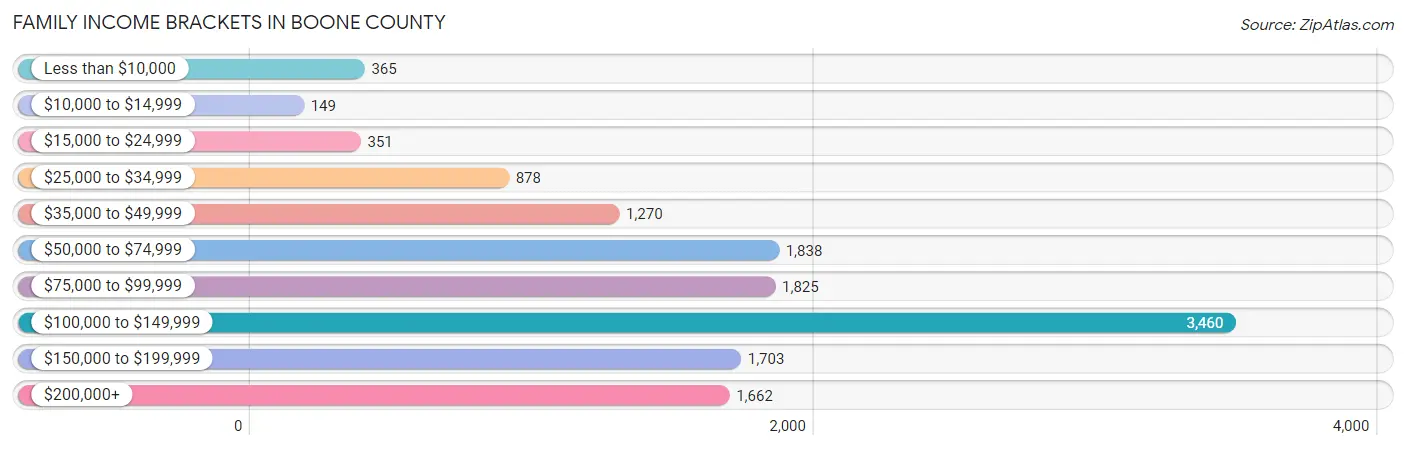
| Income Bracket | # Families | % Families |
| Less than $10,000 | 365 | 2.7% |
| $10,000 to $14,999 | 149 | 1.1% |
| $15,000 to $24,999 | 351 | 2.6% |
| $25,000 to $34,999 | 878 | 6.5% |
| $35,000 to $49,999 | 1,270 | 9.4% |
| $50,000 to $74,999 | 1,838 | 13.6% |
| $75,000 to $99,999 | 1,825 | 13.5% |
| $100,000 to $149,999 | 3,460 | 25.6% |
| $150,000 to $199,999 | 1,703 | 12.6% |
| $200,000+ | 1,662 | 12.3% |
Family Income by Famaliy Size in Boone County
7+ person families (304 | 2.2%) account for the highest median family income in Boone County with $128,651 per family, while 2-person families (5,983 | 44.3%) have the highest median income of $40,991 per family member.
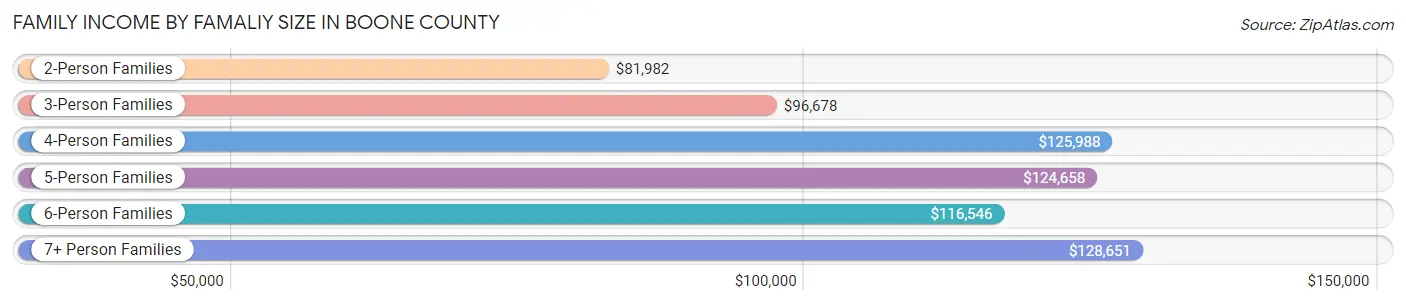
| Income Bracket | # Families | Median Income |
| 2-Person Families | 5,983 (44.3%) | $81,982 |
| 3-Person Families | 2,869 (21.2%) | $96,678 |
| 4-Person Families | 2,317 (17.1%) | $125,988 |
| 5-Person Families | 1,680 (12.4%) | $124,658 |
| 6-Person Families | 362 (2.7%) | $116,546 |
| 7+ Person Families | 304 (2.2%) | $128,651 |
| Total | 13,515 (100.0%) | $101,686 |
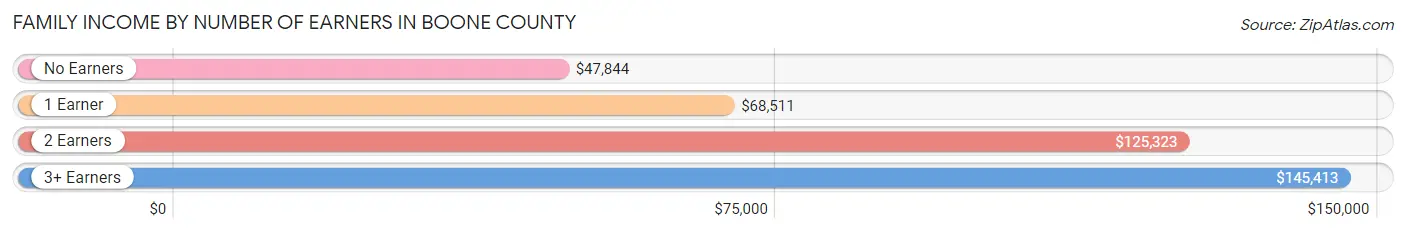
Family Income by Number of Earners in Boone County
The median family income in Boone County is $101,686, with families comprising 3+ earners (2,545) having the highest median family income of $145,413, while families with no earners (1,613) have the lowest median family income of $47,844, accounting for 18.8% and 11.9% of families, respectively.
| Number of Earners | # Families | Median Income |
| No Earners | 1,613 (11.9%) | $47,844 |
| 1 Earner | 4,298 (31.8%) | $68,511 |
| 2 Earners | 5,059 (37.4%) | $125,323 |
| 3+ Earners | 2,545 (18.8%) | $145,413 |
| Total | 13,515 (100.0%) | $101,686 |
Household Income in Boone County
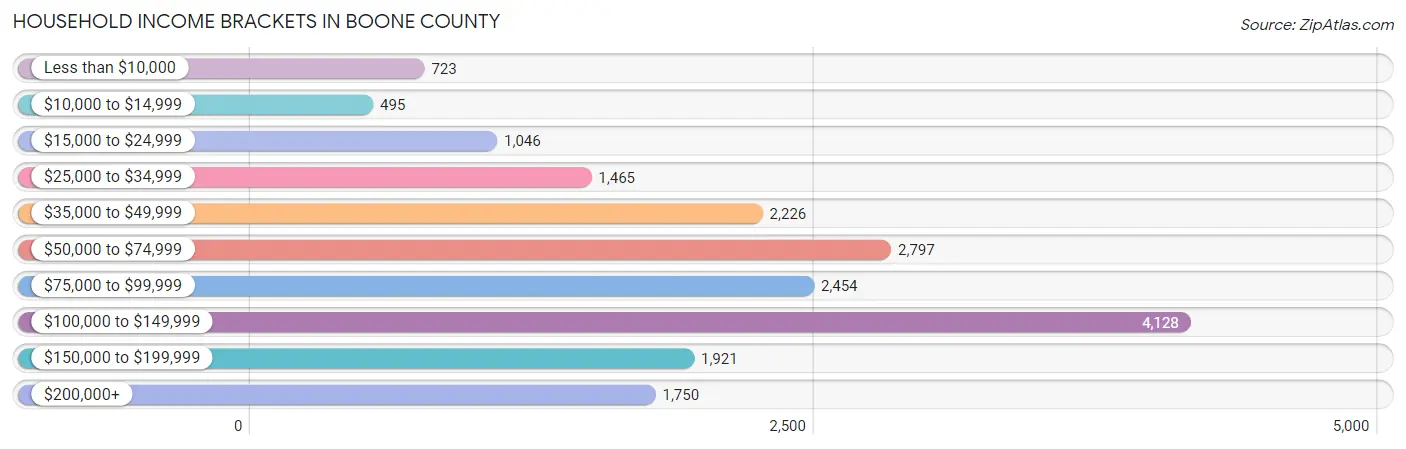
Household Income Brackets in Boone County
With 4,128 households falling in the category, the $100,000 to $149,999 income range is the most frequent in Boone County, accounting for 21.7% of all households. In contrast, only 495 households (2.6%) fall into the $10,000 to $14,999 income bracket, making it the least populous group.
| Income Bracket | # Households | % Households |
| Less than $10,000 | 723 | 3.8% |
| $10,000 to $14,999 | 495 | 2.6% |
| $15,000 to $24,999 | 1,046 | 5.5% |
| $25,000 to $34,999 | 1,465 | 7.7% |
| $35,000 to $49,999 | 2,226 | 11.7% |
| $50,000 to $74,999 | 2,797 | 14.7% |
| $75,000 to $99,999 | 2,454 | 12.9% |
| $100,000 to $149,999 | 4,128 | 21.7% |
| $150,000 to $199,999 | 1,921 | 10.1% |
| $200,000+ | 1,750 | 9.2% |
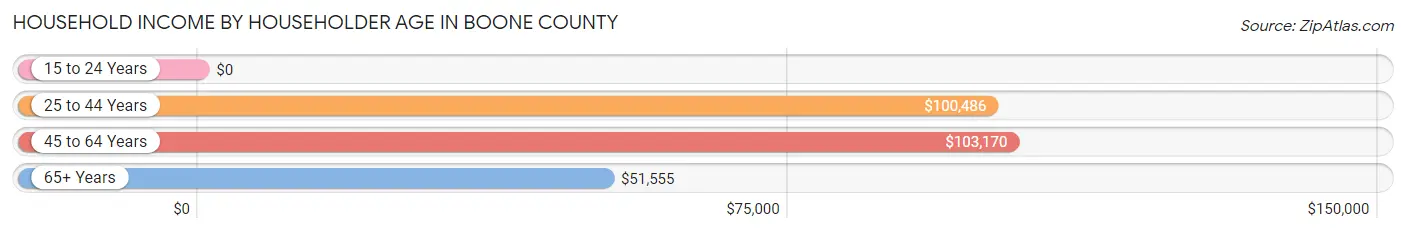
Household Income by Householder Age in Boone County
The median household income in Boone County is $80,502, with the highest median household income of $103,170 found in the 45 to 64 years age bracket for the primary householder. A total of 7,647 households (40.2%) fall into this category. Meanwhile, the 15 to 24 years age bracket for the primary householder has the lowest median household income of $0, with 187 households (1.0%) in this group.
| Income Bracket | # Households | Median Income |
| 15 to 24 Years | 187 (1.0%) | $0 |
| 25 to 44 Years | 5,503 (28.9%) | $100,486 |
| 45 to 64 Years | 7,647 (40.2%) | $103,170 |
| 65+ Years | 5,687 (29.9%) | $51,555 |
| Total | 19,024 (100.0%) | $80,502 |
Poverty in Boone County
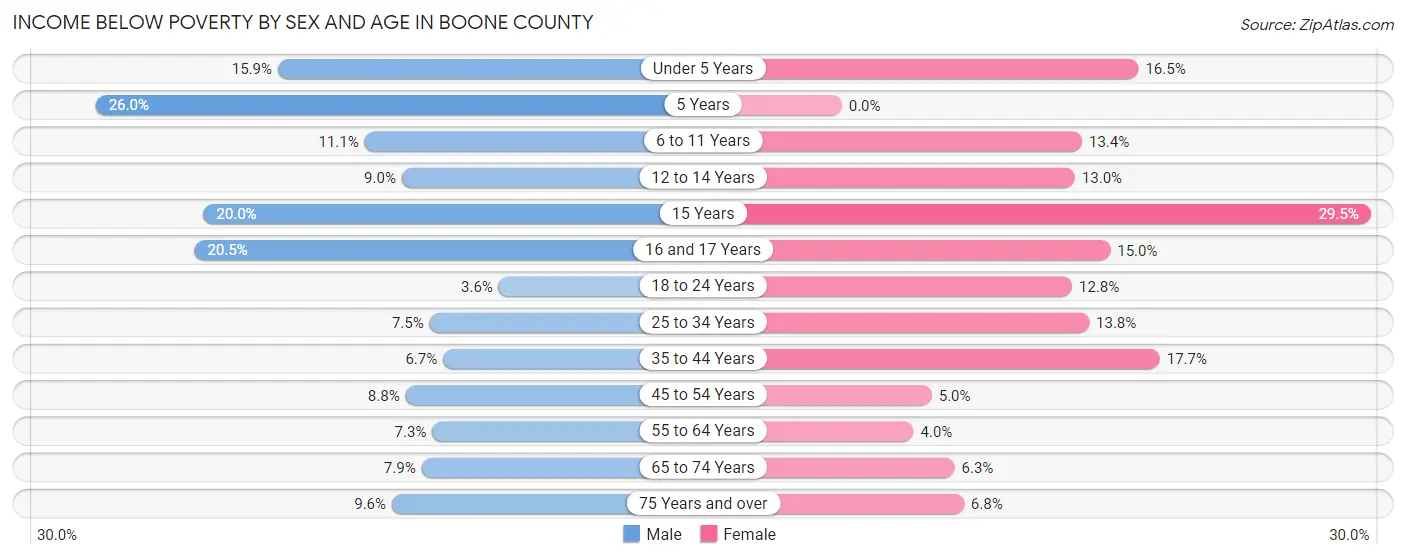
Income Below Poverty by Sex and Age in Boone County
With 9.0% poverty level for males and 10.5% for females among the residents of Boone County, 5 year old males and 15 year old females are the most vulnerable to poverty, with 88 males (26.0%) and 91 females (29.4%) in their respective age groups living below the poverty level.
| Age Bracket | Male | Female |
| Under 5 Years | 228 (15.9%) | 212 (16.5%) |
| 5 Years | 88 (26.0%) | 0 (0.0%) |
| 6 to 11 Years | 237 (11.1%) | 233 (13.4%) |
| 12 to 14 Years | 116 (9.0%) | 163 (13.0%) |
| 15 Years | 91 (20.0%) | 91 (29.4%) |
| 16 and 17 Years | 190 (20.5%) | 147 (14.9%) |
| 18 to 24 Years | 97 (3.6%) | 330 (12.8%) |
| 25 to 34 Years | 210 (7.4%) | 389 (13.8%) |
| 35 to 44 Years | 220 (6.7%) | 571 (17.7%) |
| 45 to 54 Years | 324 (8.8%) | 186 (5.0%) |
| 55 to 64 Years | 259 (7.3%) | 136 (4.0%) |
| 65 to 74 Years | 205 (7.9%) | 159 (6.3%) |
| 75 Years and over | 138 (9.6%) | 130 (6.8%) |
| Total | 2,403 (9.0%) | 2,747 (10.5%) |
Income Above Poverty by Sex and Age in Boone County
According to the poverty statistics in Boone County, males aged 18 to 24 years and females aged 5 years are the age groups that are most secure financially, with 96.4% of males and 100.0% of females in these age groups living above the poverty line.
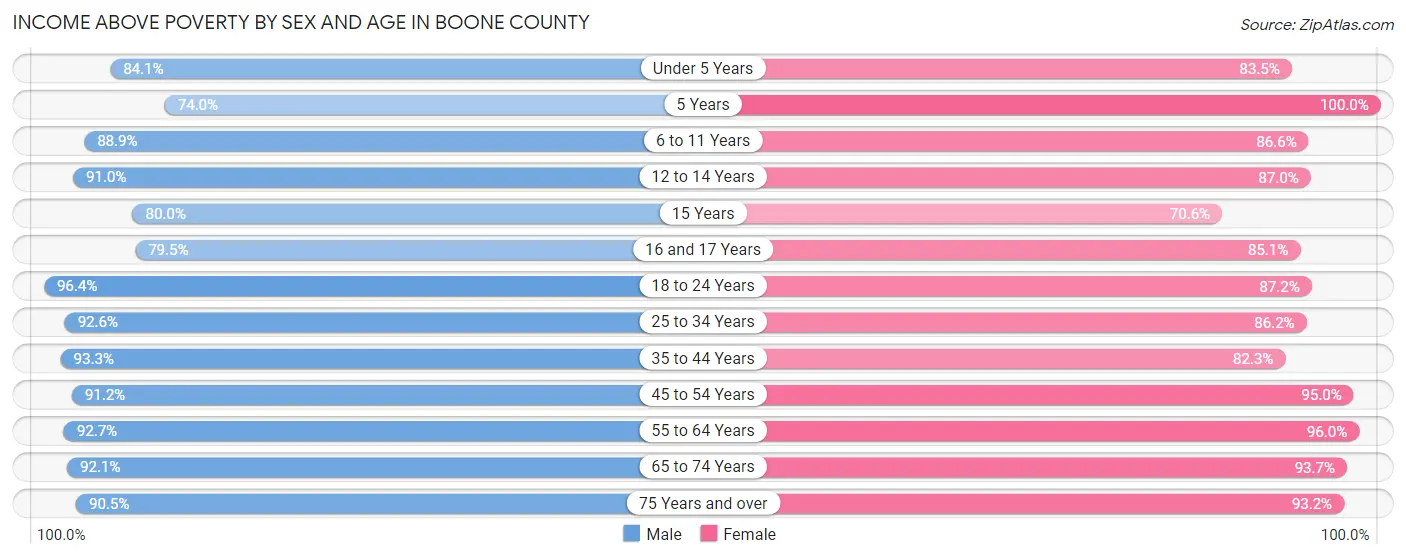
| Age Bracket | Male | Female |
| Under 5 Years | 1,206 (84.1%) | 1,071 (83.5%) |
| 5 Years | 250 (74.0%) | 414 (100.0%) |
| 6 to 11 Years | 1,904 (88.9%) | 1,508 (86.6%) |
| 12 to 14 Years | 1,173 (91.0%) | 1,093 (87.0%) |
| 15 Years | 363 (80.0%) | 218 (70.6%) |
| 16 and 17 Years | 735 (79.5%) | 836 (85.1%) |
| 18 to 24 Years | 2,595 (96.4%) | 2,244 (87.2%) |
| 25 to 34 Years | 2,609 (92.5%) | 2,437 (86.2%) |
| 35 to 44 Years | 3,062 (93.3%) | 2,653 (82.3%) |
| 45 to 54 Years | 3,361 (91.2%) | 3,525 (95.0%) |
| 55 to 64 Years | 3,287 (92.7%) | 3,260 (96.0%) |
| 65 to 74 Years | 2,391 (92.1%) | 2,373 (93.7%) |
| 75 Years and over | 1,307 (90.4%) | 1,781 (93.2%) |
| Total | 24,243 (91.0%) | 23,413 (89.5%) |
Income Below Poverty Among Married-Couple Families in Boone County
The poverty statistics for married-couple families in Boone County show that 3.4% or 357 of the total 10,388 families live below the poverty line. Families with 3 or 4 children have the highest poverty rate of 10.7%, comprising of 109 families. On the other hand, families with 5 or more children have the lowest poverty rate of 0.0%, which includes 0 families.
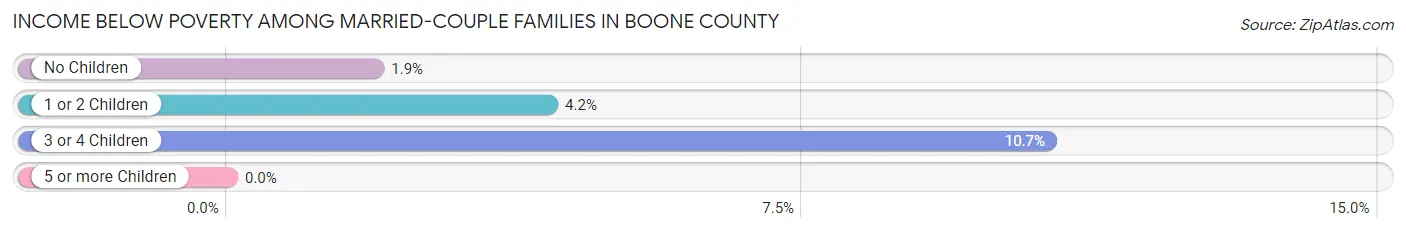
| Children | Above Poverty | Below Poverty |
| No Children | 6,106 (98.1%) | 119 (1.9%) |
| 1 or 2 Children | 2,959 (95.8%) | 129 (4.2%) |
| 3 or 4 Children | 911 (89.3%) | 109 (10.7%) |
| 5 or more Children | 55 (100.0%) | 0 (0.0%) |
| Total | 10,031 (96.6%) | 357 (3.4%) |
Income Below Poverty Among Single-Parent Households in Boone County
According to the poverty data in Boone County, 11.1% or 135 single-father households and 23.2% or 442 single-mother households are living below the poverty line. Among single-father households, those with 3 or 4 children have the highest poverty rate, with 47 households (24.2%) experiencing poverty. Likewise, among single-mother households, those with 5 or more children have the highest poverty rate, with 26 households (100.0%) falling below the poverty line.
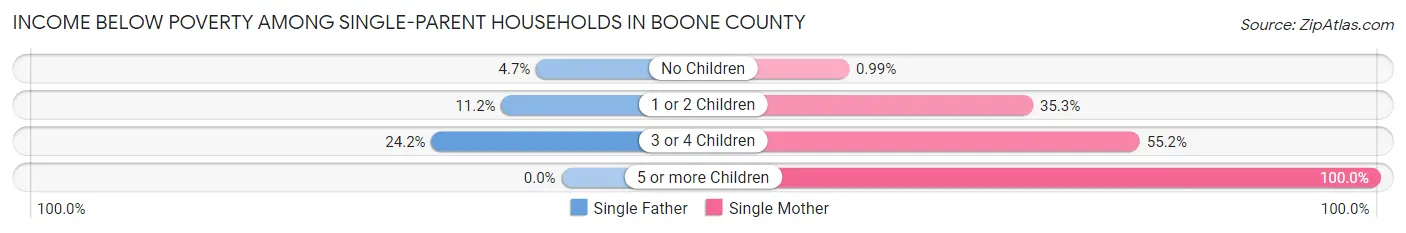
| Children | Single Father | Single Mother |
| No Children | 17 (4.7%) | 8 (1.0%) |
| 1 or 2 Children | 71 (11.2%) | 328 (35.3%) |
| 3 or 4 Children | 47 (24.2%) | 80 (55.2%) |
| 5 or more Children | 0 (0.0%) | 26 (100.0%) |
| Total | 135 (11.1%) | 442 (23.2%) |
Income Below Poverty Among Married-Couple vs Single-Parent Households in Boone County
The poverty data for Boone County shows that 357 of the married-couple family households (3.4%) and 577 of the single-parent households (18.4%) are living below the poverty level. Within the married-couple family households, those with 3 or 4 children have the highest poverty rate, with 109 households (10.7%) falling below the poverty line. Among the single-parent households, those with 5 or more children have the highest poverty rate, with 26 household (47.3%) living below poverty.
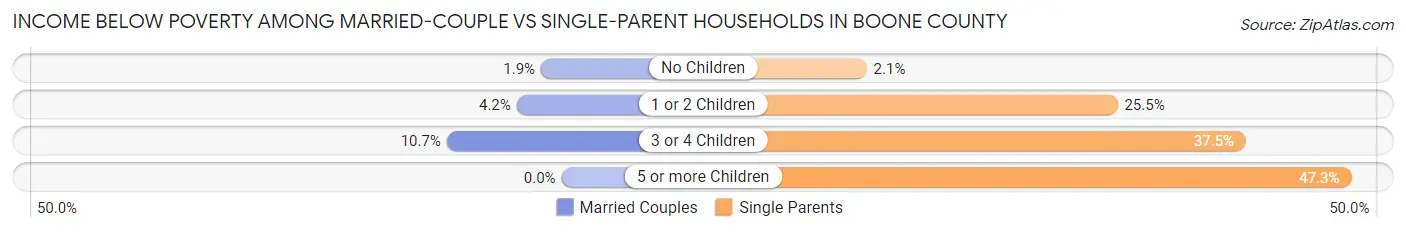
| Children | Married-Couple Families | Single-Parent Households |
| No Children | 119 (1.9%) | 25 (2.1%) |
| 1 or 2 Children | 129 (4.2%) | 399 (25.5%) |
| 3 or 4 Children | 109 (10.7%) | 127 (37.5%) |
| 5 or more Children | 0 (0.0%) | 26 (47.3%) |
| Total | 357 (3.4%) | 577 (18.4%) |
Employment Characteristics in Boone County
Employment by Class of Employer in Boone County
Among the 25,158 employed individuals in Boone County, private company employees (19,571 | 77.8%), local government employees (1,897 | 7.5%), and not-for-profit organizations (1,328 | 5.3%) make up the most common classes of employment.
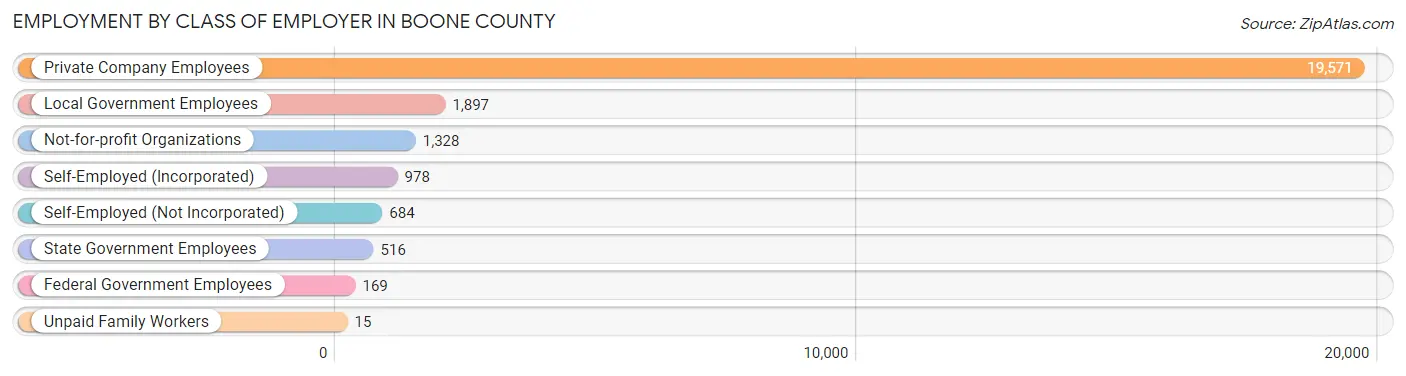
| Employer Class | # Employees | % Employees |
| Private Company Employees | 19,571 | 77.8% |
| Self-Employed (Incorporated) | 978 | 3.9% |
| Self-Employed (Not Incorporated) | 684 | 2.7% |
| Not-for-profit Organizations | 1,328 | 5.3% |
| Local Government Employees | 1,897 | 7.5% |
| State Government Employees | 516 | 2.1% |
| Federal Government Employees | 169 | 0.7% |
| Unpaid Family Workers | 15 | 0.1% |
| Total | 25,158 | 100.0% |
Employment Status by Age in Boone County
According to the labor force statistics for Boone County, out of the total population over 16 years of age (42,461), 66.0% or 28,024 individuals are in the labor force, with 7.7% or 2,158 of them unemployed. The age group with the highest labor force participation rate is 20 to 24 years, with 88.9% or 3,167 individuals in the labor force. Within the labor force, the 16 to 19 years age range has the highest percentage of unemployed individuals, with 20.6% or 360 of them being unemployed.
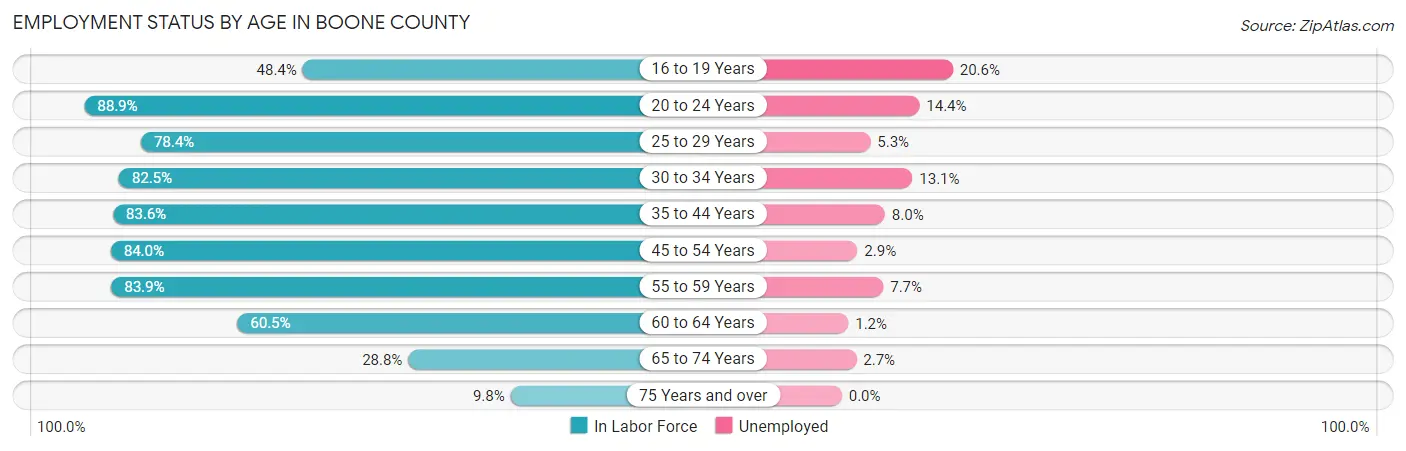
| Age Bracket | In Labor Force | Unemployed |
| 16 to 19 Years | 1,750 (48.4%) | 360 (20.6%) |
| 20 to 24 Years | 3,167 (88.9%) | 456 (14.4%) |
| 25 to 29 Years | 2,245 (78.4%) | 119 (5.3%) |
| 30 to 34 Years | 2,335 (82.5%) | 306 (13.1%) |
| 35 to 44 Years | 5,456 (83.6%) | 436 (8.0%) |
| 45 to 54 Years | 6,228 (84.0%) | 181 (2.9%) |
| 55 to 59 Years | 2,855 (83.9%) | 220 (7.7%) |
| 60 to 64 Years | 2,151 (60.5%) | 26 (1.2%) |
| 65 to 74 Years | 1,497 (28.8%) | 40 (2.7%) |
| 75 Years and over | 342 (9.8%) | 0 (0.0%) |
| Total | 28,024 (66.0%) | 2,158 (7.7%) |
Employment Status by Educational Attainment in Boone County
According to labor force statistics for Boone County, 80.0% of individuals (21,274) out of the total population between 25 and 64 years of age (26,592) are in the labor force, with 6.1% or 1,298 of them being unemployed. The group with the highest labor force participation rate are those with the educational attainment of bachelor's degree or higher, with 85.0% or 5,991 individuals in the labor force. Within the labor force, individuals with high school diploma education have the highest percentage of unemployment, with 7.9% or 464 of them being unemployed.
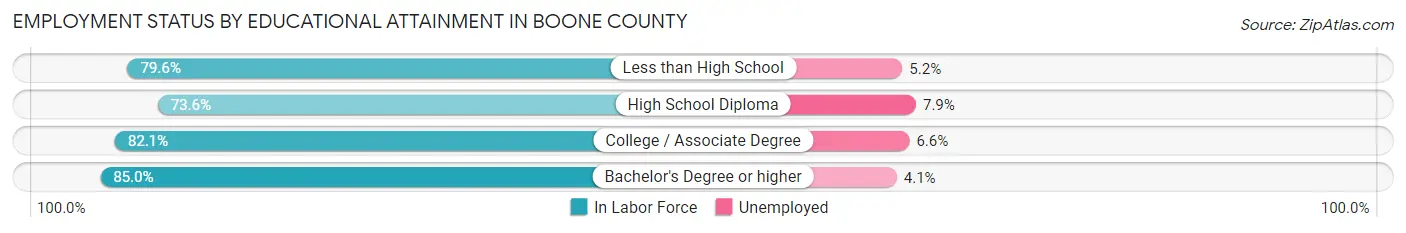
| Educational Attainment | In Labor Force | Unemployed |
| Less than High School | 2,851 (79.6%) | 186 (5.2%) |
| High School Diploma | 5,876 (73.6%) | 631 (7.9%) |
| College / Associate Degree | 6,550 (82.1%) | 527 (6.6%) |
| Bachelor's Degree or higher | 5,991 (85.0%) | 289 (4.1%) |
| Total | 21,274 (80.0%) | 1,622 (6.1%) |
Employment Occupations by Sex in Boone County
Management, Business, Science and Arts Occupations
The most common Management, Business, Science and Arts occupations in Boone County are Management (3,555 | 13.7%), Community & Social Service (1,548 | 6.0%), Health Diagnosing & Treating (1,256 | 4.9%), Education Instruction & Library (1,066 | 4.1%), and Computers, Engineering & Science (983 | 3.8%).
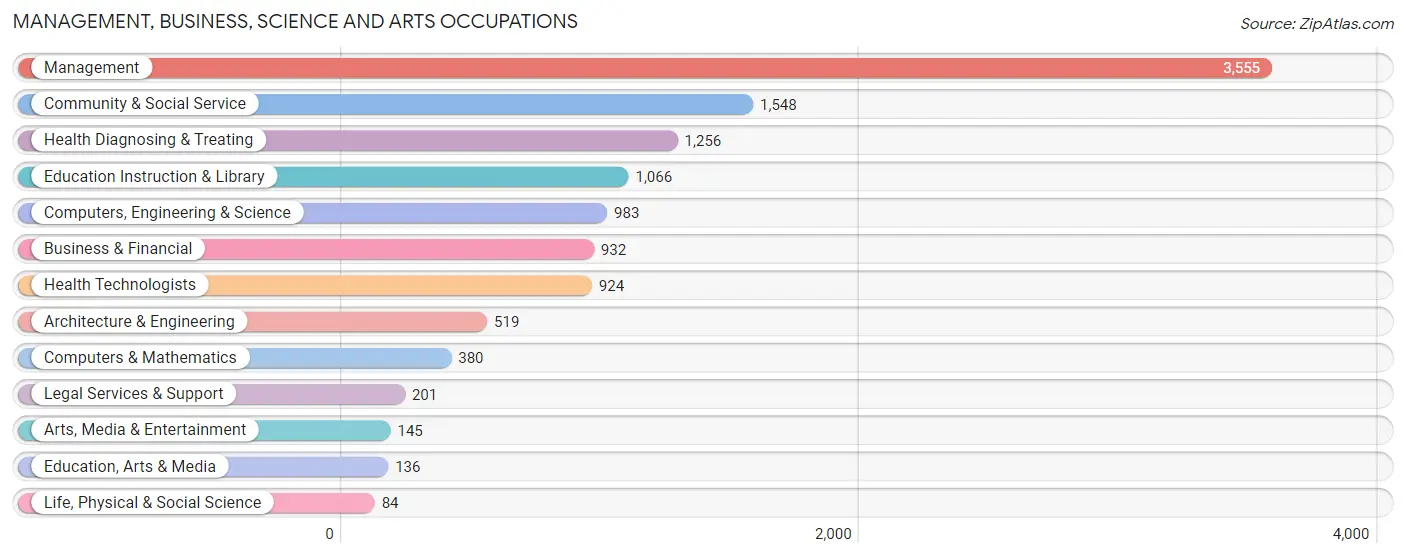
Management, Business, Science and Arts Occupations by Sex
Within the Management, Business, Science and Arts occupations in Boone County, the most male-oriented occupations are Architecture & Engineering (94.2%), Legal Services & Support (92.0%), and Computers, Engineering & Science (79.6%), while the most female-oriented occupations are Education Instruction & Library (85.4%), Community & Social Service (70.6%), and Health Diagnosing & Treating (65.6%).
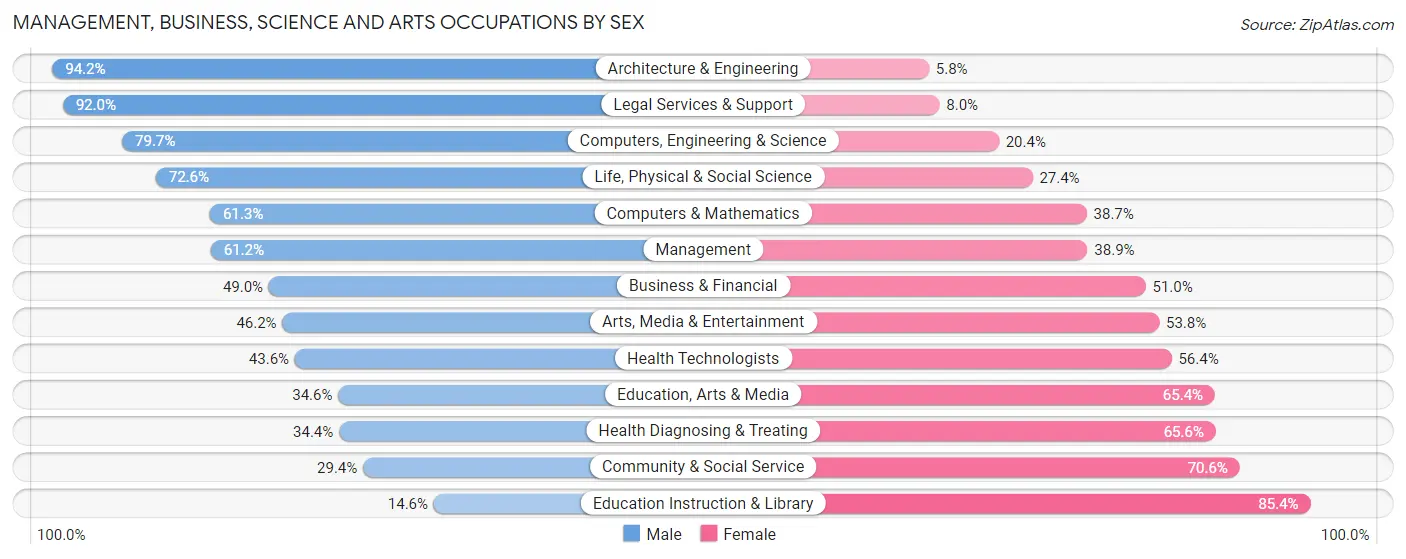
| Occupation | Male | Female |
| Management | 2,174 (61.2%) | 1,381 (38.9%) |
| Business & Financial | 457 (49.0%) | 475 (51.0%) |
| Computers, Engineering & Science | 783 (79.6%) | 200 (20.3%) |
| Computers & Mathematics | 233 (61.3%) | 147 (38.7%) |
| Architecture & Engineering | 489 (94.2%) | 30 (5.8%) |
| Life, Physical & Social Science | 61 (72.6%) | 23 (27.4%) |
| Community & Social Service | 455 (29.4%) | 1,093 (70.6%) |
| Education, Arts & Media | 47 (34.6%) | 89 (65.4%) |
| Legal Services & Support | 185 (92.0%) | 16 (8.0%) |
| Education Instruction & Library | 156 (14.6%) | 910 (85.4%) |
| Arts, Media & Entertainment | 67 (46.2%) | 78 (53.8%) |
| Health Diagnosing & Treating | 432 (34.4%) | 824 (65.6%) |
| Health Technologists | 403 (43.6%) | 521 (56.4%) |
| Total (Category) | 4,301 (52.0%) | 3,973 (48.0%) |
| Total (Overall) | 14,106 (54.5%) | 11,768 (45.5%) |
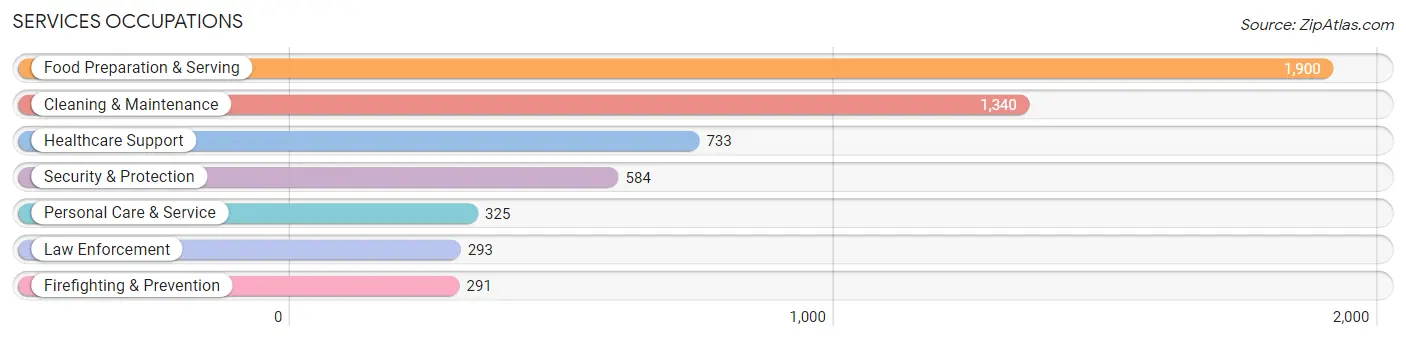
Services Occupations
The most common Services occupations in Boone County are Food Preparation & Serving (1,900 | 7.3%), Cleaning & Maintenance (1,340 | 5.2%), Healthcare Support (733 | 2.8%), Security & Protection (584 | 2.3%), and Personal Care & Service (325 | 1.3%).
Services Occupations by Sex
Within the Services occupations in Boone County, the most male-oriented occupations are Firefighting & Prevention (94.9%), Security & Protection (93.1%), and Law Enforcement (91.5%), while the most female-oriented occupations are Personal Care & Service (85.5%), Healthcare Support (72.2%), and Food Preparation & Serving (71.1%).
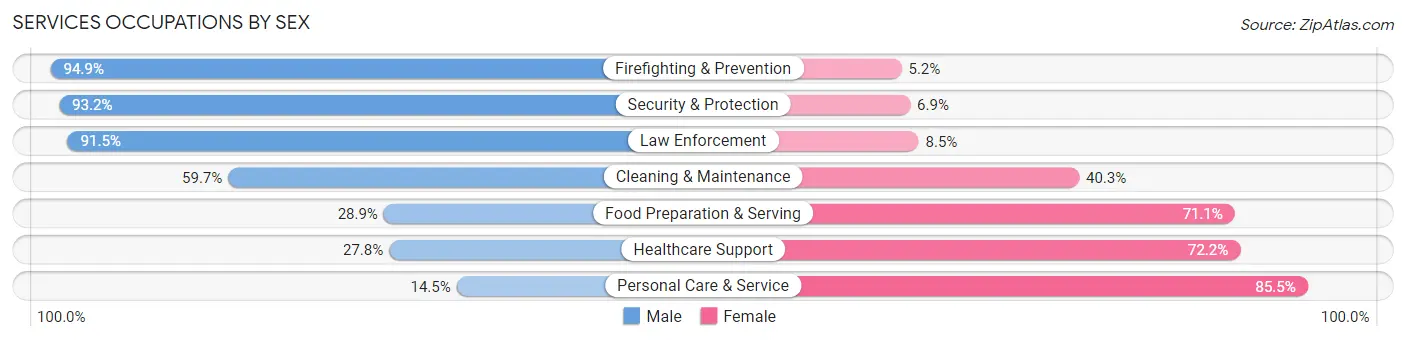
| Occupation | Male | Female |
| Healthcare Support | 204 (27.8%) | 529 (72.2%) |
| Security & Protection | 544 (93.1%) | 40 (6.9%) |
| Firefighting & Prevention | 276 (94.9%) | 15 (5.1%) |
| Law Enforcement | 268 (91.5%) | 25 (8.5%) |
| Food Preparation & Serving | 549 (28.9%) | 1,351 (71.1%) |
| Cleaning & Maintenance | 800 (59.7%) | 540 (40.3%) |
| Personal Care & Service | 47 (14.5%) | 278 (85.5%) |
| Total (Category) | 2,144 (43.9%) | 2,738 (56.1%) |
| Total (Overall) | 14,106 (54.5%) | 11,768 (45.5%) |
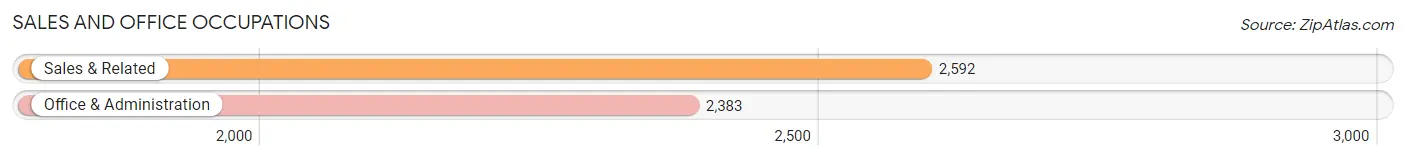
Sales and Office Occupations
The most common Sales and Office occupations in Boone County are Sales & Related (2,592 | 10.0%), and Office & Administration (2,383 | 9.2%).
Sales and Office Occupations by Sex
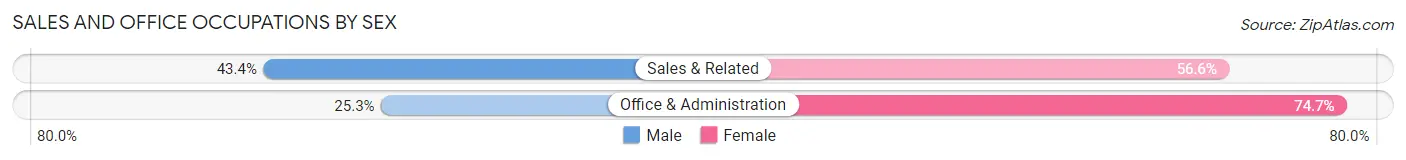
| Occupation | Male | Female |
| Sales & Related | 1,124 (43.4%) | 1,468 (56.6%) |
| Office & Administration | 602 (25.3%) | 1,781 (74.7%) |
| Total (Category) | 1,726 (34.7%) | 3,249 (65.3%) |
| Total (Overall) | 14,106 (54.5%) | 11,768 (45.5%) |
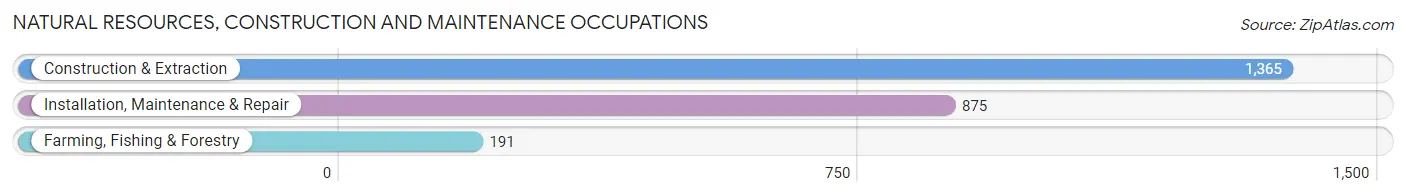
Natural Resources, Construction and Maintenance Occupations
The most common Natural Resources, Construction and Maintenance occupations in Boone County are Construction & Extraction (1,365 | 5.3%), Installation, Maintenance & Repair (875 | 3.4%), and Farming, Fishing & Forestry (191 | 0.7%).
Natural Resources, Construction and Maintenance Occupations by Sex
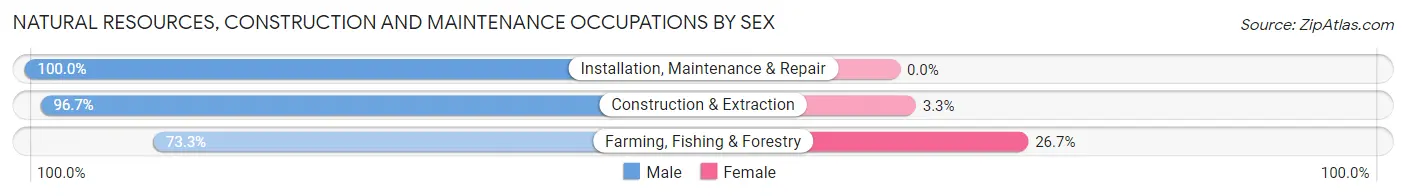
| Occupation | Male | Female |
| Farming, Fishing & Forestry | 140 (73.3%) | 51 (26.7%) |
| Construction & Extraction | 1,320 (96.7%) | 45 (3.3%) |
| Installation, Maintenance & Repair | 875 (100.0%) | 0 (0.0%) |
| Total (Category) | 2,335 (96.1%) | 96 (4.0%) |
| Total (Overall) | 14,106 (54.5%) | 11,768 (45.5%) |
Production, Transportation and Moving Occupations
The most common Production, Transportation and Moving occupations in Boone County are Production (3,063 | 11.8%), Material Moving (1,339 | 5.2%), and Transportation (910 | 3.5%).
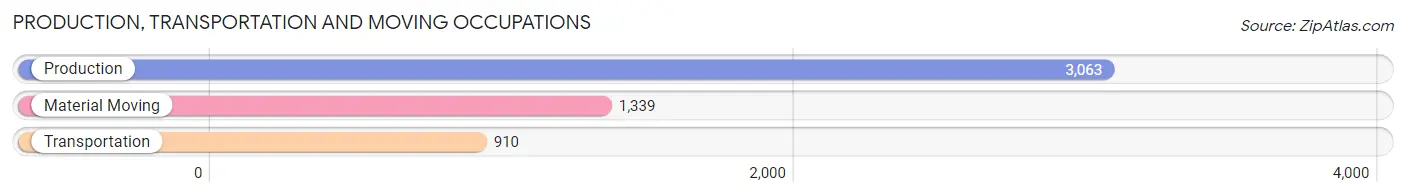
Production, Transportation and Moving Occupations by Sex
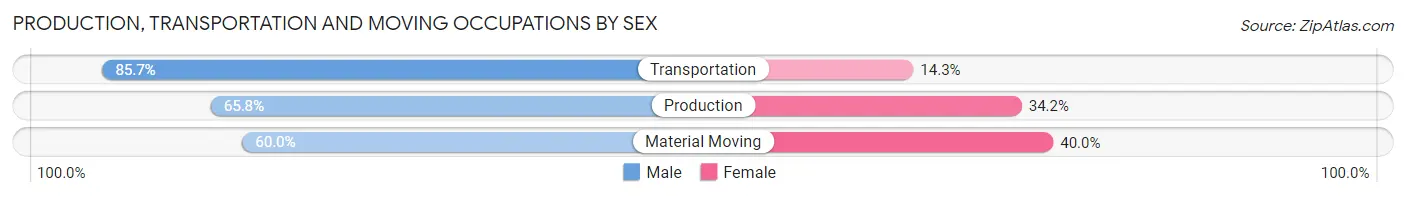
| Occupation | Male | Female |
| Production | 2,016 (65.8%) | 1,047 (34.2%) |
| Transportation | 780 (85.7%) | 130 (14.3%) |
| Material Moving | 804 (60.0%) | 535 (40.0%) |
| Total (Category) | 3,600 (67.8%) | 1,712 (32.2%) |
| Total (Overall) | 14,106 (54.5%) | 11,768 (45.5%) |
Employment Industries by Sex in Boone County
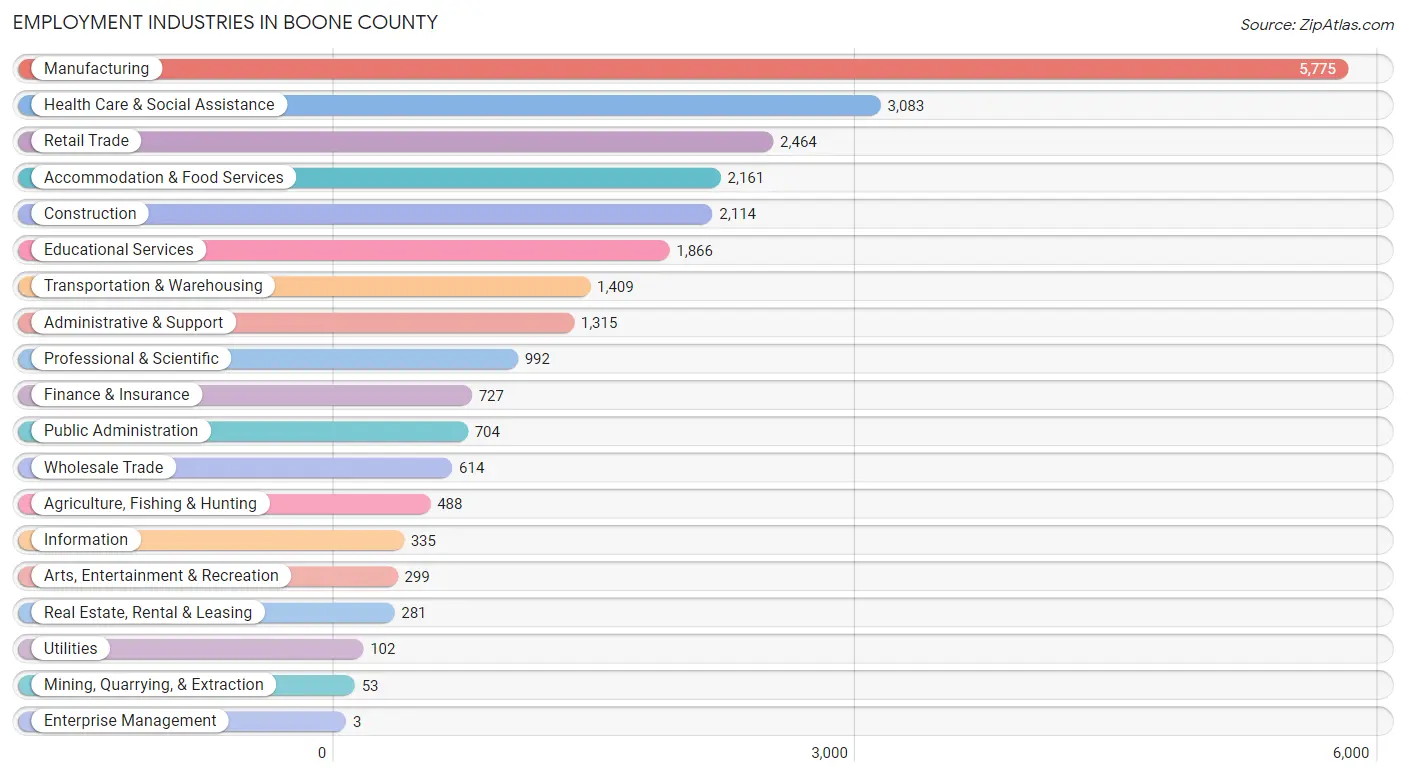
Employment Industries in Boone County
The major employment industries in Boone County include Manufacturing (5,775 | 22.3%), Health Care & Social Assistance (3,083 | 11.9%), Retail Trade (2,464 | 9.5%), Accommodation & Food Services (2,161 | 8.4%), and Construction (2,114 | 8.2%).
Employment Industries by Sex in Boone County
The Boone County industries that see more men than women are Construction (89.2%), Public Administration (74.9%), and Professional & Scientific (70.7%), whereas the industries that tend to have a higher number of women are Enterprise Management (100.0%), Mining, Quarrying, & Extraction (84.9%), and Finance & Insurance (73.0%).
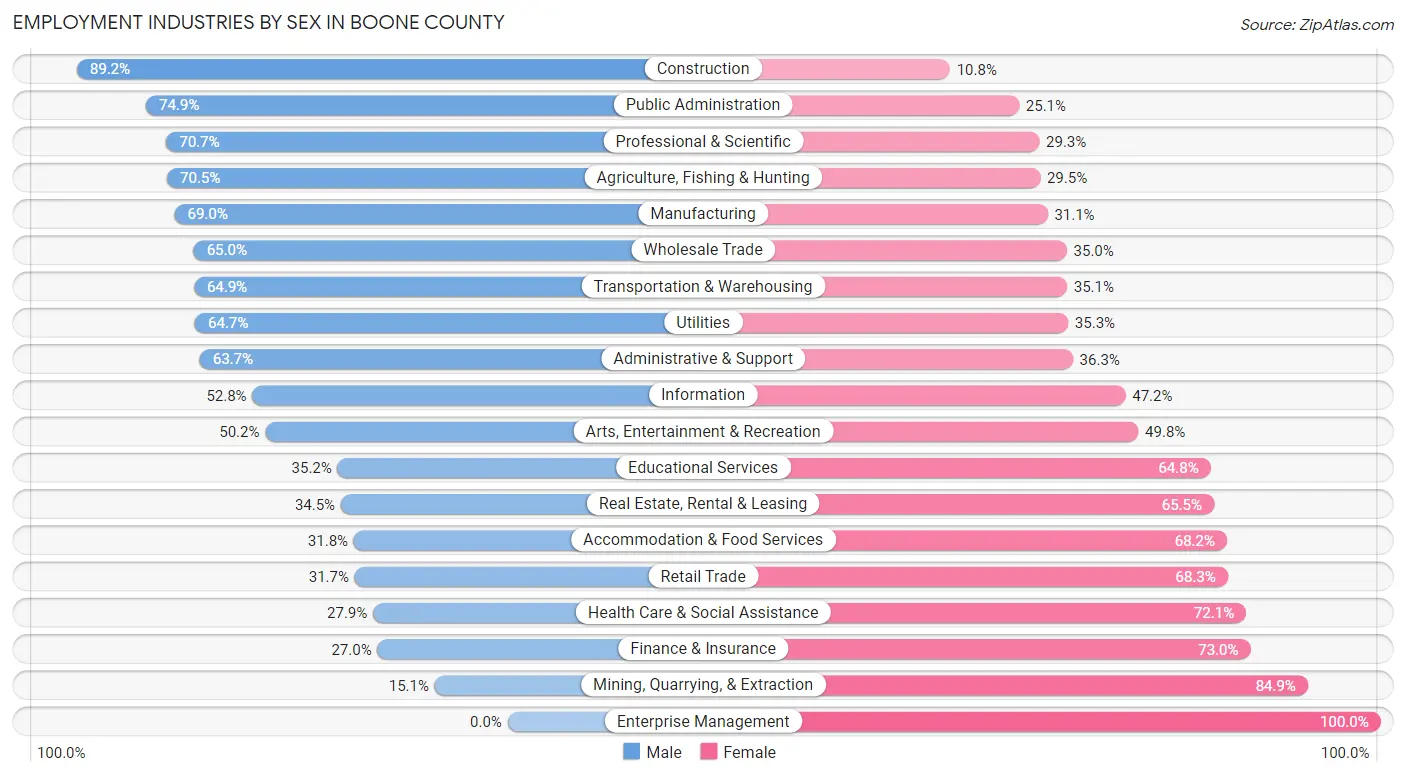
| Industry | Male | Female |
| Agriculture, Fishing & Hunting | 344 (70.5%) | 144 (29.5%) |
| Mining, Quarrying, & Extraction | 8 (15.1%) | 45 (84.9%) |
| Construction | 1,885 (89.2%) | 229 (10.8%) |
| Manufacturing | 3,982 (69.0%) | 1,793 (31.0%) |
| Wholesale Trade | 399 (65.0%) | 215 (35.0%) |
| Retail Trade | 780 (31.7%) | 1,684 (68.3%) |
| Transportation & Warehousing | 915 (64.9%) | 494 (35.1%) |
| Utilities | 66 (64.7%) | 36 (35.3%) |
| Information | 177 (52.8%) | 158 (47.2%) |
| Finance & Insurance | 196 (27.0%) | 531 (73.0%) |
| Real Estate, Rental & Leasing | 97 (34.5%) | 184 (65.5%) |
| Professional & Scientific | 701 (70.7%) | 291 (29.3%) |
| Enterprise Management | 0 (0.0%) | 3 (100.0%) |
| Administrative & Support | 838 (63.7%) | 477 (36.3%) |
| Educational Services | 657 (35.2%) | 1,209 (64.8%) |
| Health Care & Social Assistance | 859 (27.9%) | 2,224 (72.1%) |
| Arts, Entertainment & Recreation | 150 (50.2%) | 149 (49.8%) |
| Accommodation & Food Services | 688 (31.8%) | 1,473 (68.2%) |
| Public Administration | 527 (74.9%) | 177 (25.1%) |
| Total | 14,106 (54.5%) | 11,768 (45.5%) |
Education in Boone County
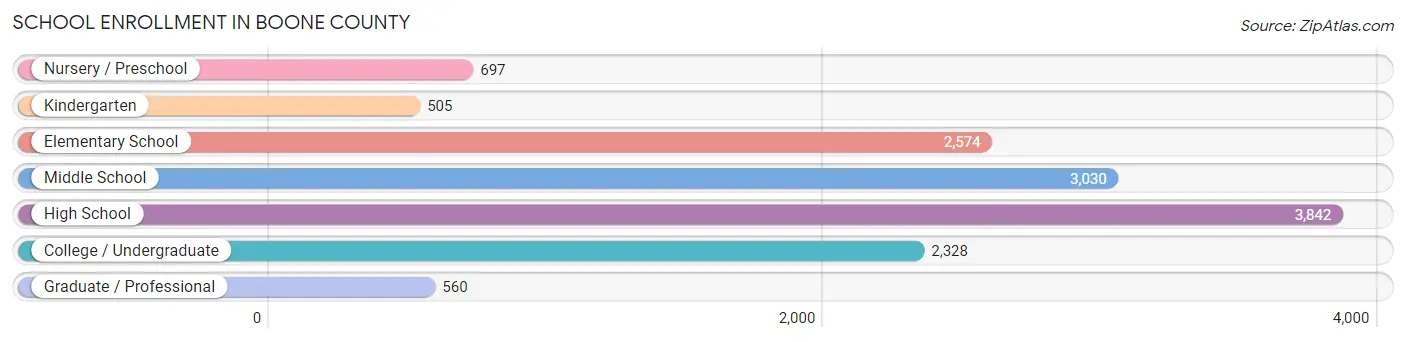
School Enrollment in Boone County
The most common levels of schooling among the 13,536 students in Boone County are high school (3,842 | 28.4%), middle school (3,030 | 22.4%), and elementary school (2,574 | 19.0%).
| School Level | # Students | % Students |
| Nursery / Preschool | 697 | 5.1% |
| Kindergarten | 505 | 3.7% |
| Elementary School | 2,574 | 19.0% |
| Middle School | 3,030 | 22.4% |
| High School | 3,842 | 28.4% |
| College / Undergraduate | 2,328 | 17.2% |
| Graduate / Professional | 560 | 4.1% |
| Total | 13,536 | 100.0% |
School Enrollment by Age by Funding Source in Boone County
Out of a total of 13,536 students who are enrolled in schools in Boone County, 2,680 (19.8%) attend a private institution, while the remaining 10,856 (80.2%) are enrolled in public schools. The age group of 3 to 4 year olds has the highest likelihood of being enrolled in private schools, with 245 (54.9% in the age bracket) enrolled. Conversely, the age group of 20 to 24 year olds has the lowest likelihood of being enrolled in a private school, with 1,123 (86.9% in the age bracket) attending a public institution.
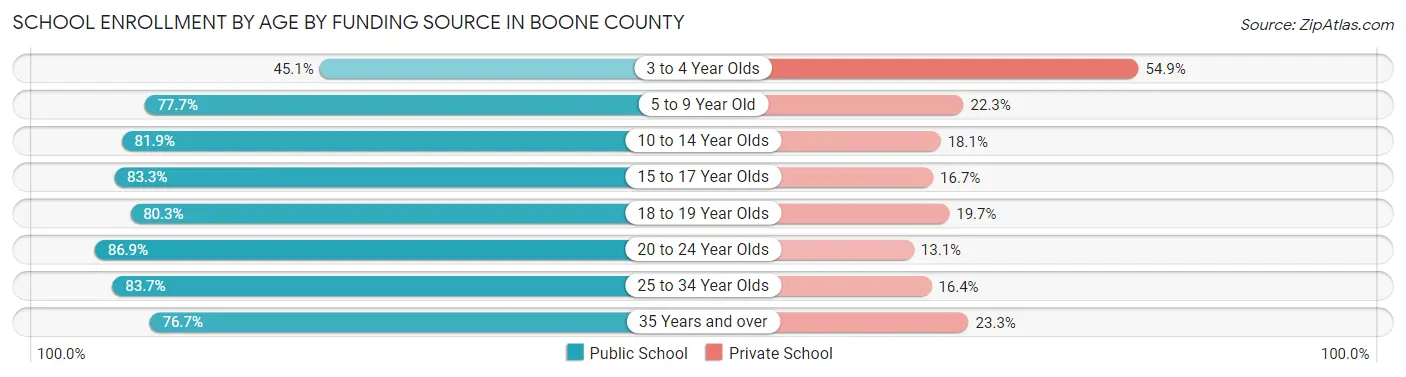
| Age Bracket | Public School | Private School |
| 3 to 4 Year Olds | 201 (45.1%) | 245 (54.9%) |
| 5 to 9 Year Old | 2,186 (77.7%) | 629 (22.3%) |
| 10 to 14 Year Olds | 3,380 (81.9%) | 746 (18.1%) |
| 15 to 17 Year Olds | 2,209 (83.3%) | 442 (16.7%) |
| 18 to 19 Year Olds | 865 (80.3%) | 212 (19.7%) |
| 20 to 24 Year Olds | 1,123 (86.9%) | 169 (13.1%) |
| 25 to 34 Year Olds | 348 (83.7%) | 68 (16.4%) |
| 35 Years and over | 547 (76.7%) | 166 (23.3%) |
| Total | 10,856 (80.2%) | 2,680 (19.8%) |
Educational Attainment by Field of Study in Boone County
Business (1,936 | 21.2%), education (1,557 | 17.1%), science & technology (1,004 | 11.0%), bio, nature & agricultural (694 | 7.6%), and engineering (575 | 6.3%) are the most common fields of study among 9,114 individuals in Boone County who have obtained a bachelor's degree or higher.
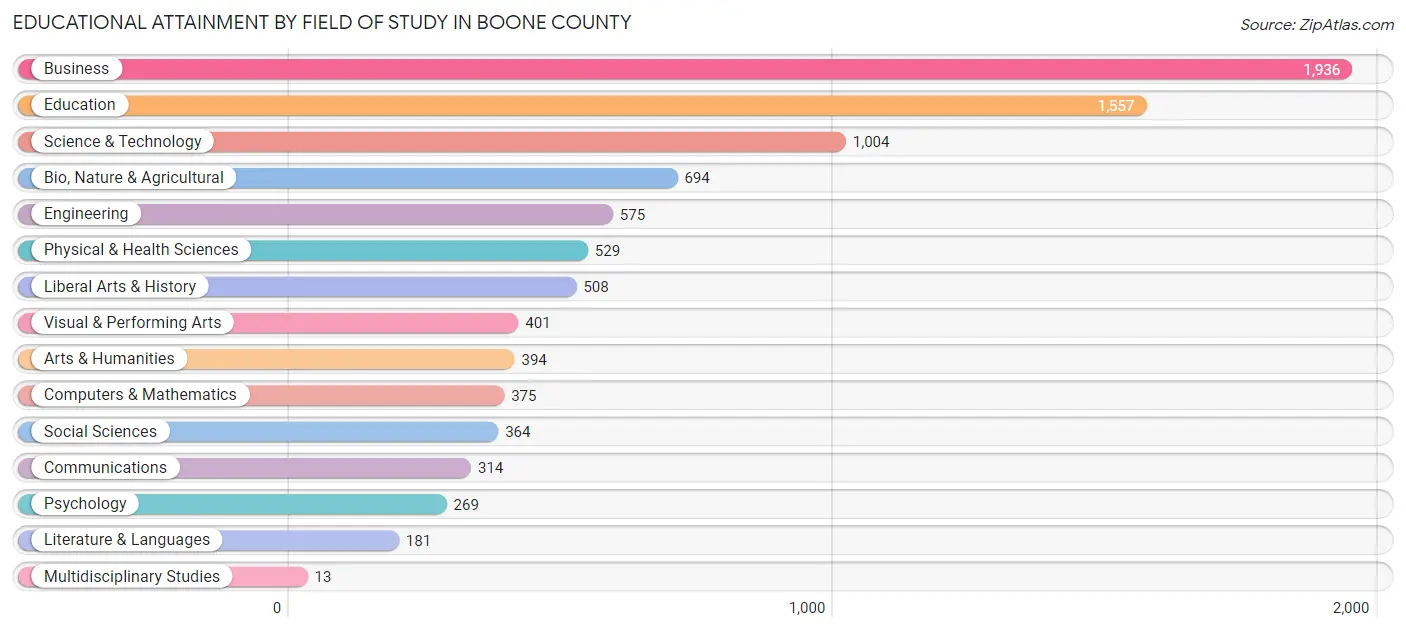
| Field of Study | # Graduates | % Graduates |
| Computers & Mathematics | 375 | 4.1% |
| Bio, Nature & Agricultural | 694 | 7.6% |
| Physical & Health Sciences | 529 | 5.8% |
| Psychology | 269 | 2.9% |
| Social Sciences | 364 | 4.0% |
| Engineering | 575 | 6.3% |
| Multidisciplinary Studies | 13 | 0.1% |
| Science & Technology | 1,004 | 11.0% |
| Business | 1,936 | 21.2% |
| Education | 1,557 | 17.1% |
| Literature & Languages | 181 | 2.0% |
| Liberal Arts & History | 508 | 5.6% |
| Visual & Performing Arts | 401 | 4.4% |
| Communications | 314 | 3.5% |
| Arts & Humanities | 394 | 4.3% |
| Total | 9,114 | 100.0% |
Transportation & Commute in Boone County
Vehicle Availability by Sex in Boone County
The most prevalent vehicle ownership categories in Boone County are males with 2 vehicles (4,596, accounting for 33.6%) and females with 2 vehicles (4,047, making up 40.1%).
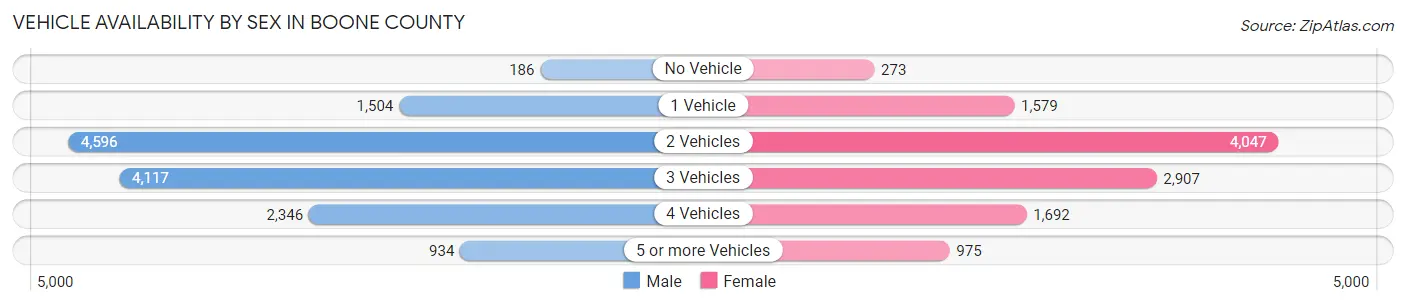
| Vehicles Available | Male | Female |
| No Vehicle | 186 (1.4%) | 273 (2.4%) |
| 1 Vehicle | 1,504 (11.0%) | 1,579 (13.8%) |
| 2 Vehicles | 4,596 (33.6%) | 4,047 (35.3%) |
| 3 Vehicles | 4,117 (30.1%) | 2,907 (25.3%) |
| 4 Vehicles | 2,346 (17.2%) | 1,692 (14.7%) |
| 5 or more Vehicles | 934 (6.8%) | 975 (8.5%) |
| Total | 13,683 (100.0%) | 11,473 (100.0%) |
Commute Time in Boone County
The most frequently occuring commute durations in Boone County are 20 to 24 minutes (4,086 commuters, 17.4%), 10 to 14 minutes (3,090 commuters, 13.1%), and 5 to 9 minutes (3,048 commuters, 13.0%).
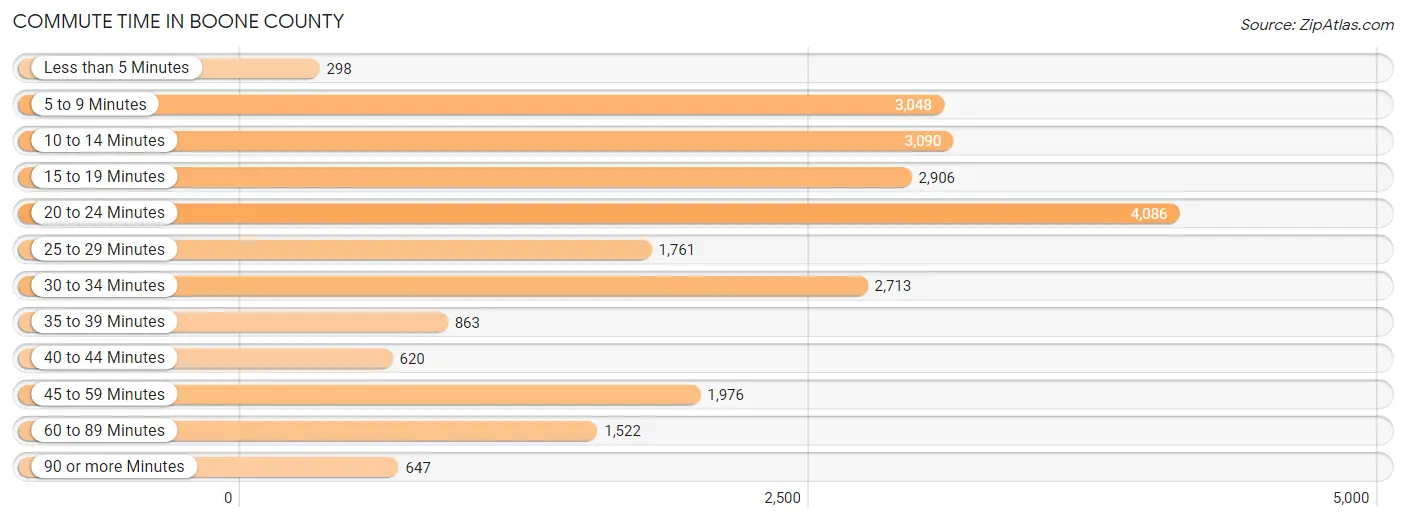
| Commute Time | # Commuters | % Commuters |
| Less than 5 Minutes | 298 | 1.3% |
| 5 to 9 Minutes | 3,048 | 13.0% |
| 10 to 14 Minutes | 3,090 | 13.1% |
| 15 to 19 Minutes | 2,906 | 12.3% |
| 20 to 24 Minutes | 4,086 | 17.4% |
| 25 to 29 Minutes | 1,761 | 7.5% |
| 30 to 34 Minutes | 2,713 | 11.5% |
| 35 to 39 Minutes | 863 | 3.7% |
| 40 to 44 Minutes | 620 | 2.6% |
| 45 to 59 Minutes | 1,976 | 8.4% |
| 60 to 89 Minutes | 1,522 | 6.5% |
| 90 or more Minutes | 647 | 2.8% |
Commute Time by Sex in Boone County
The most common commute times in Boone County are 20 to 24 minutes (2,344 commuters, 18.2%) for males and 15 to 19 minutes (1,807 commuters, 17.0%) for females.
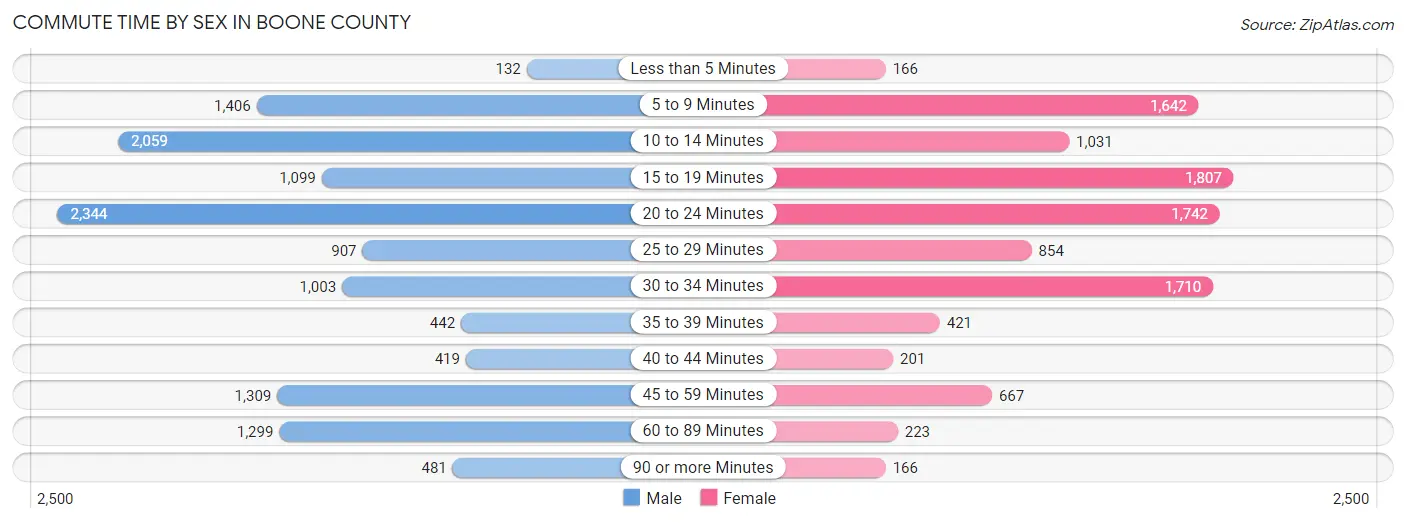
| Commute Time | Male | Female |
| Less than 5 Minutes | 132 (1.0%) | 166 (1.6%) |
| 5 to 9 Minutes | 1,406 (10.9%) | 1,642 (15.4%) |
| 10 to 14 Minutes | 2,059 (16.0%) | 1,031 (9.7%) |
| 15 to 19 Minutes | 1,099 (8.5%) | 1,807 (17.0%) |
| 20 to 24 Minutes | 2,344 (18.2%) | 1,742 (16.4%) |
| 25 to 29 Minutes | 907 (7.0%) | 854 (8.0%) |
| 30 to 34 Minutes | 1,003 (7.8%) | 1,710 (16.1%) |
| 35 to 39 Minutes | 442 (3.4%) | 421 (4.0%) |
| 40 to 44 Minutes | 419 (3.3%) | 201 (1.9%) |
| 45 to 59 Minutes | 1,309 (10.2%) | 667 (6.3%) |
| 60 to 89 Minutes | 1,299 (10.1%) | 223 (2.1%) |
| 90 or more Minutes | 481 (3.7%) | 166 (1.6%) |
Time of Departure to Work by Sex in Boone County
The most frequent times of departure to work in Boone County are 6:00 AM to 6:29 AM (1,631, 12.6%) for males and 7:00 AM to 7:29 AM (1,909, 18.0%) for females.
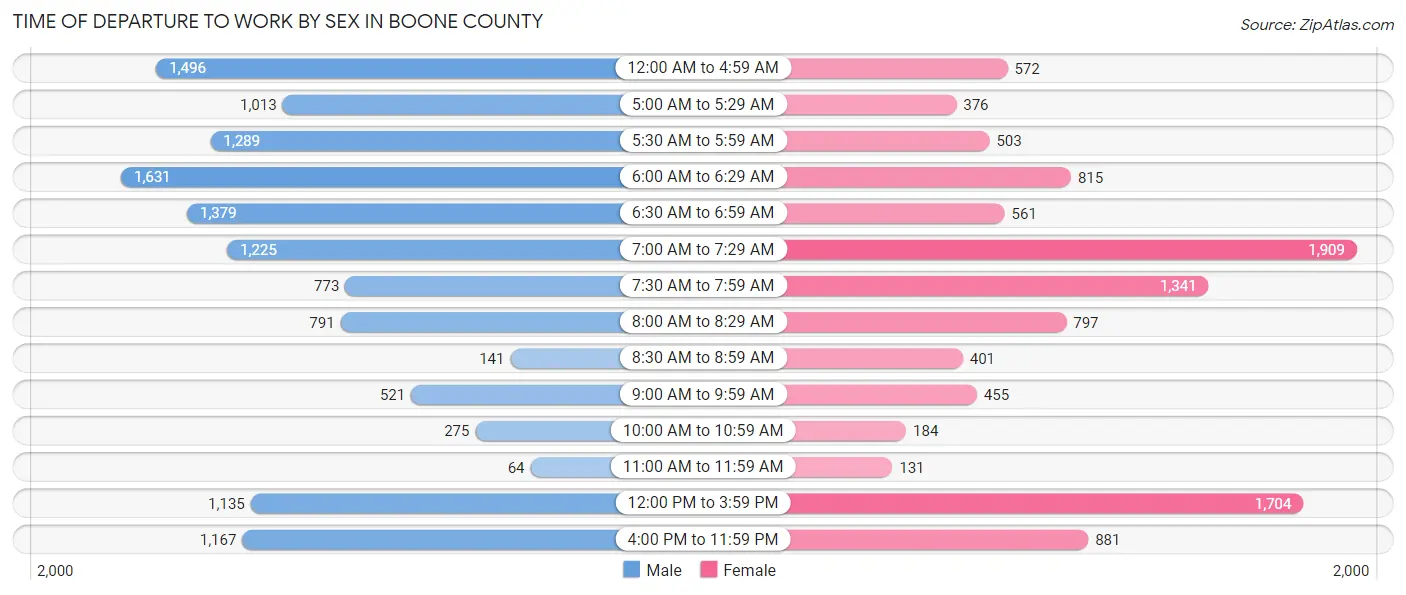
| Time of Departure | Male | Female |
| 12:00 AM to 4:59 AM | 1,496 (11.6%) | 572 (5.4%) |
| 5:00 AM to 5:29 AM | 1,013 (7.9%) | 376 (3.5%) |
| 5:30 AM to 5:59 AM | 1,289 (10.0%) | 503 (4.7%) |
| 6:00 AM to 6:29 AM | 1,631 (12.6%) | 815 (7.7%) |
| 6:30 AM to 6:59 AM | 1,379 (10.7%) | 561 (5.3%) |
| 7:00 AM to 7:29 AM | 1,225 (9.5%) | 1,909 (18.0%) |
| 7:30 AM to 7:59 AM | 773 (6.0%) | 1,341 (12.6%) |
| 8:00 AM to 8:29 AM | 791 (6.1%) | 797 (7.5%) |
| 8:30 AM to 8:59 AM | 141 (1.1%) | 401 (3.8%) |
| 9:00 AM to 9:59 AM | 521 (4.0%) | 455 (4.3%) |
| 10:00 AM to 10:59 AM | 275 (2.1%) | 184 (1.7%) |
| 11:00 AM to 11:59 AM | 64 (0.5%) | 131 (1.2%) |
| 12:00 PM to 3:59 PM | 1,135 (8.8%) | 1,704 (16.0%) |
| 4:00 PM to 11:59 PM | 1,167 (9.0%) | 881 (8.3%) |
| Total | 12,900 (100.0%) | 10,630 (100.0%) |
Housing Occupancy in Boone County
Occupancy by Ownership in Boone County
Of the total 19,024 dwellings in Boone County, owner-occupied units account for 15,968 (83.9%), while renter-occupied units make up 3,056 (16.1%).
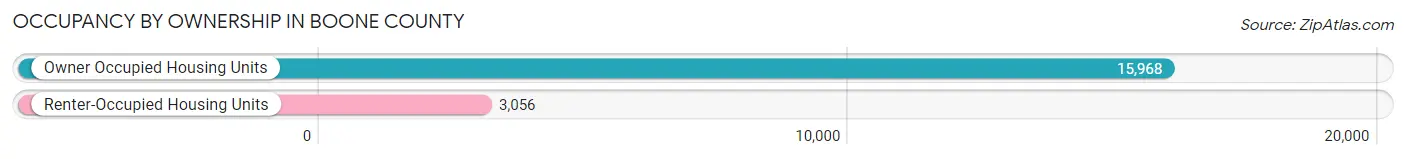
| Occupancy | # Housing Units | % Housing Units |
| Owner Occupied Housing Units | 15,968 | 83.9% |
| Renter-Occupied Housing Units | 3,056 | 16.1% |
| Total Occupied Housing Units | 19,024 | 100.0% |
Occupancy by Household Size in Boone County
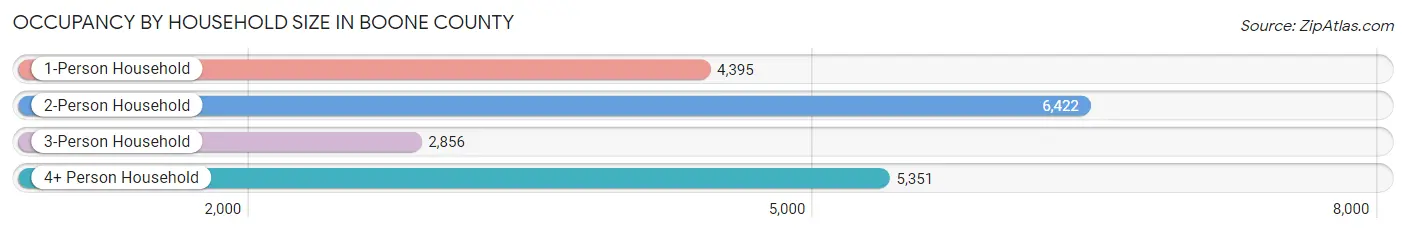
| Household Size | # Housing Units | % Housing Units |
| 1-Person Household | 4,395 | 23.1% |
| 2-Person Household | 6,422 | 33.8% |
| 3-Person Household | 2,856 | 15.0% |
| 4+ Person Household | 5,351 | 28.1% |
| Total Housing Units | 19,024 | 100.0% |
Occupancy by Ownership by Household Size in Boone County
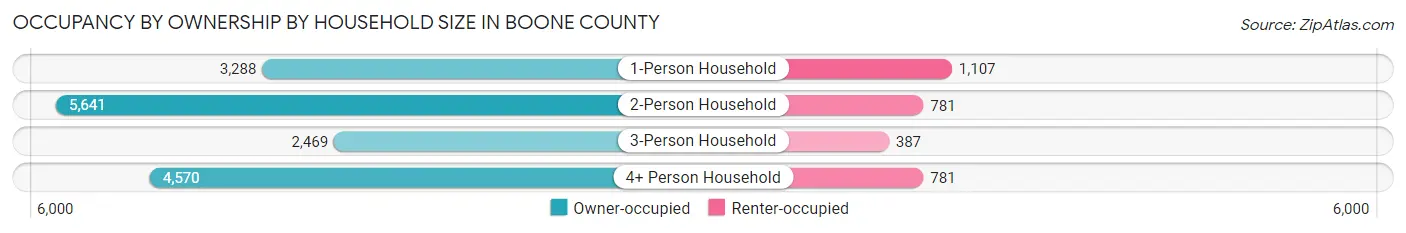
| Household Size | Owner-occupied | Renter-occupied |
| 1-Person Household | 3,288 (74.8%) | 1,107 (25.2%) |
| 2-Person Household | 5,641 (87.8%) | 781 (12.2%) |
| 3-Person Household | 2,469 (86.5%) | 387 (13.6%) |
| 4+ Person Household | 4,570 (85.4%) | 781 (14.6%) |
| Total Housing Units | 15,968 (83.9%) | 3,056 (16.1%) |
Occupancy by Educational Attainment in Boone County
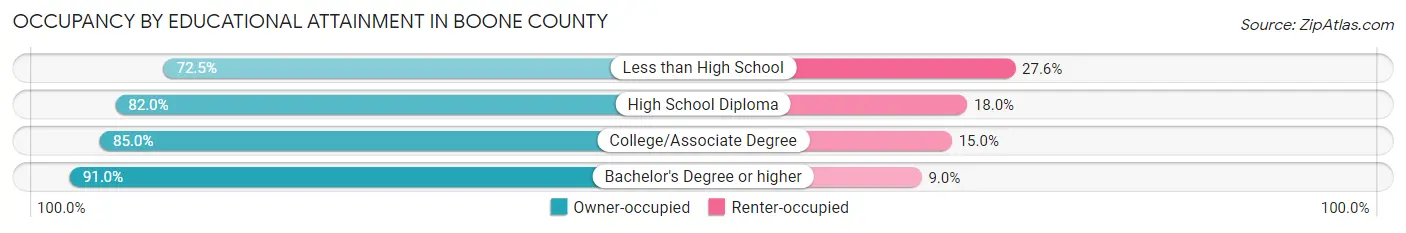
| Household Size | Owner-occupied | Renter-occupied |
| Less than High School | 1,688 (72.5%) | 642 (27.6%) |
| High School Diploma | 4,815 (82.0%) | 1,057 (18.0%) |
| College/Associate Degree | 5,460 (85.0%) | 962 (15.0%) |
| Bachelor's Degree or higher | 4,005 (91.0%) | 395 (9.0%) |
Occupancy by Age of Householder in Boone County
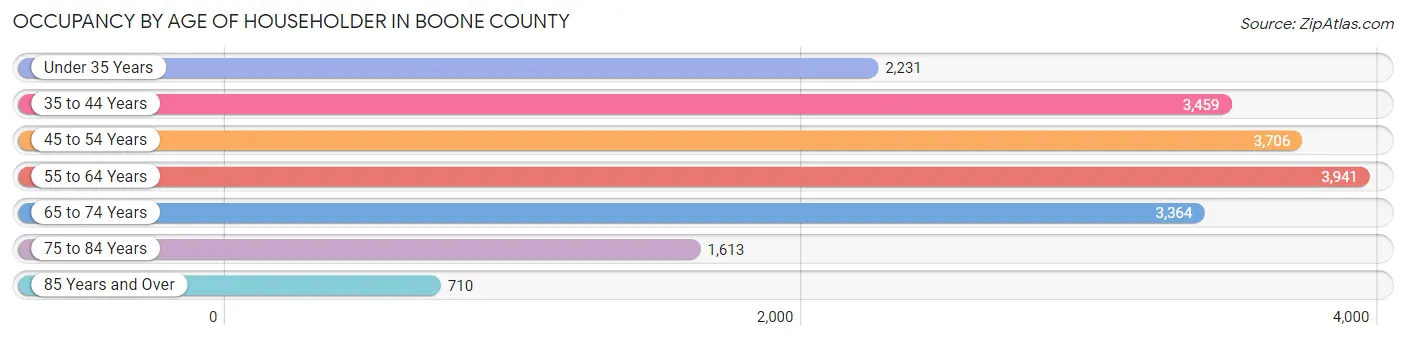
| Age Bracket | # Households | % Households |
| Under 35 Years | 2,231 | 11.7% |
| 35 to 44 Years | 3,459 | 18.2% |
| 45 to 54 Years | 3,706 | 19.5% |
| 55 to 64 Years | 3,941 | 20.7% |
| 65 to 74 Years | 3,364 | 17.7% |
| 75 to 84 Years | 1,613 | 8.5% |
| 85 Years and Over | 710 | 3.7% |
| Total | 19,024 | 100.0% |
Housing Finances in Boone County
Median Income by Occupancy in Boone County
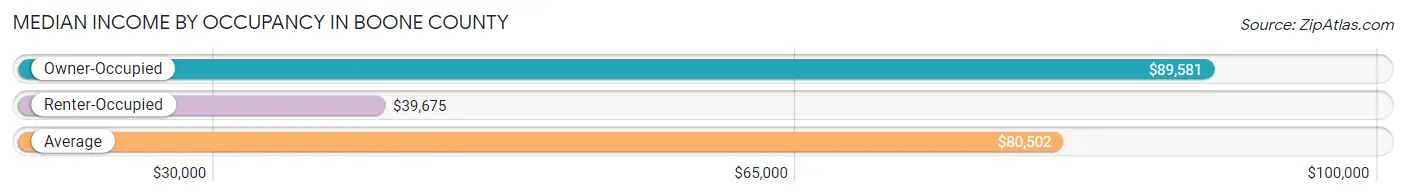
| Occupancy Type | # Households | Median Income |
| Owner-Occupied | 15,968 (83.9%) | $89,581 |
| Renter-Occupied | 3,056 (16.1%) | $39,675 |
| Average | 19,024 (100.0%) | $80,502 |
Occupancy by Householder Income Bracket in Boone County
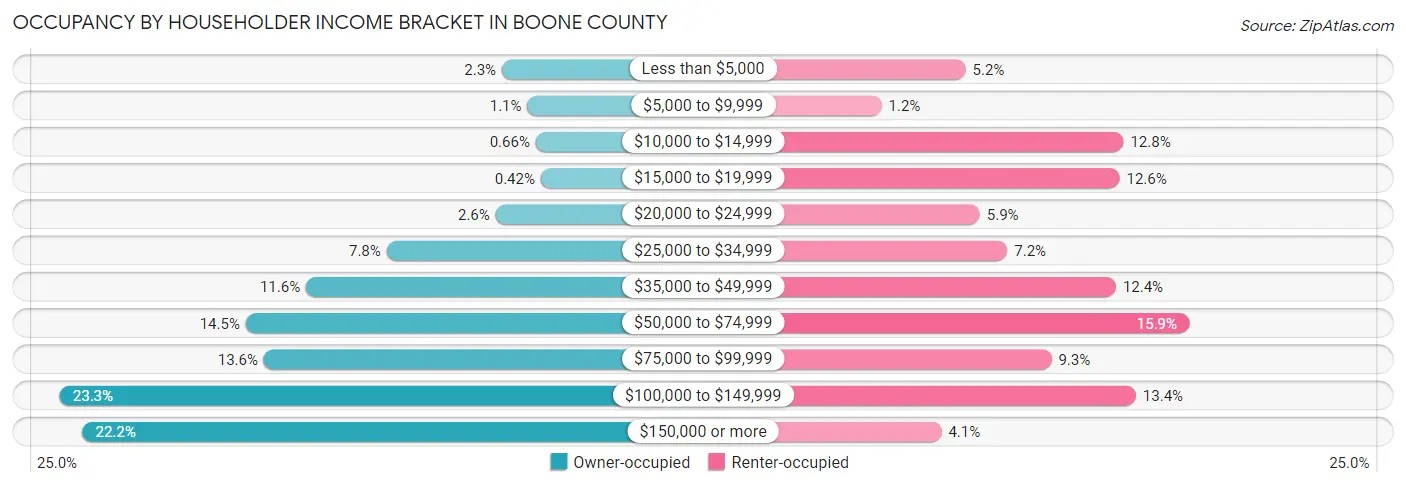
| Income Bracket | Owner-occupied | Renter-occupied |
| Less than $5,000 | 363 (2.3%) | 160 (5.2%) |
| $5,000 to $9,999 | 170 (1.1%) | 38 (1.2%) |
| $10,000 to $14,999 | 106 (0.7%) | 390 (12.8%) |
| $15,000 to $19,999 | 67 (0.4%) | 384 (12.6%) |
| $20,000 to $24,999 | 411 (2.6%) | 181 (5.9%) |
| $25,000 to $34,999 | 1,239 (7.8%) | 221 (7.2%) |
| $35,000 to $49,999 | 1,852 (11.6%) | 379 (12.4%) |
| $50,000 to $74,999 | 2,310 (14.5%) | 485 (15.9%) |
| $75,000 to $99,999 | 2,174 (13.6%) | 285 (9.3%) |
| $100,000 to $149,999 | 3,724 (23.3%) | 408 (13.4%) |
| $150,000 or more | 3,552 (22.2%) | 125 (4.1%) |
| Total | 15,968 (100.0%) | 3,056 (100.0%) |
Monthly Housing Cost Tiers in Boone County
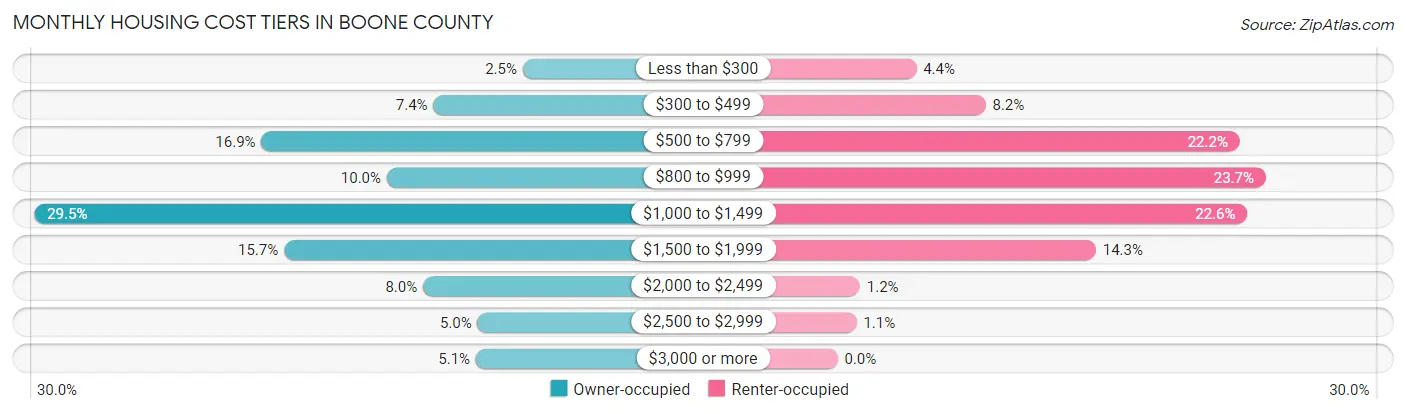
| Monthly Cost | Owner-occupied | Renter-occupied |
| Less than $300 | 396 (2.5%) | 133 (4.3%) |
| $300 to $499 | 1,185 (7.4%) | 250 (8.2%) |
| $500 to $799 | 2,702 (16.9%) | 679 (22.2%) |
| $800 to $999 | 1,596 (10.0%) | 723 (23.7%) |
| $1,000 to $1,499 | 4,705 (29.5%) | 692 (22.6%) |
| $1,500 to $1,999 | 2,502 (15.7%) | 436 (14.3%) |
| $2,000 to $2,499 | 1,276 (8.0%) | 38 (1.2%) |
| $2,500 to $2,999 | 796 (5.0%) | 32 (1.1%) |
| $3,000 or more | 810 (5.1%) | 0 (0.0%) |
| Total | 15,968 (100.0%) | 3,056 (100.0%) |
Physical Housing Characteristics in Boone County
Housing Structures in Boone County
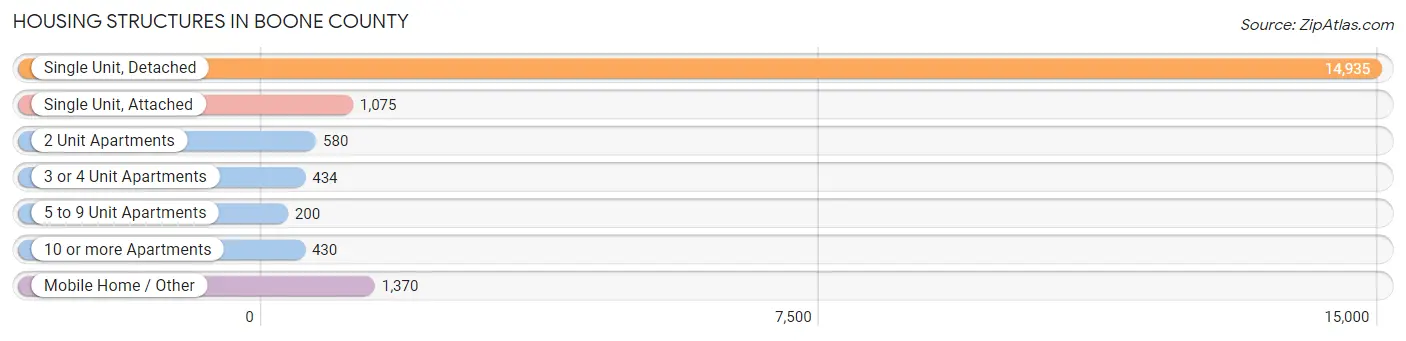
| Structure Type | # Housing Units | % Housing Units |
| Single Unit, Detached | 14,935 | 78.5% |
| Single Unit, Attached | 1,075 | 5.7% |
| 2 Unit Apartments | 580 | 3.0% |
| 3 or 4 Unit Apartments | 434 | 2.3% |
| 5 to 9 Unit Apartments | 200 | 1.1% |
| 10 or more Apartments | 430 | 2.3% |
| Mobile Home / Other | 1,370 | 7.2% |
| Total | 19,024 | 100.0% |
Housing Structures by Occupancy in Boone County
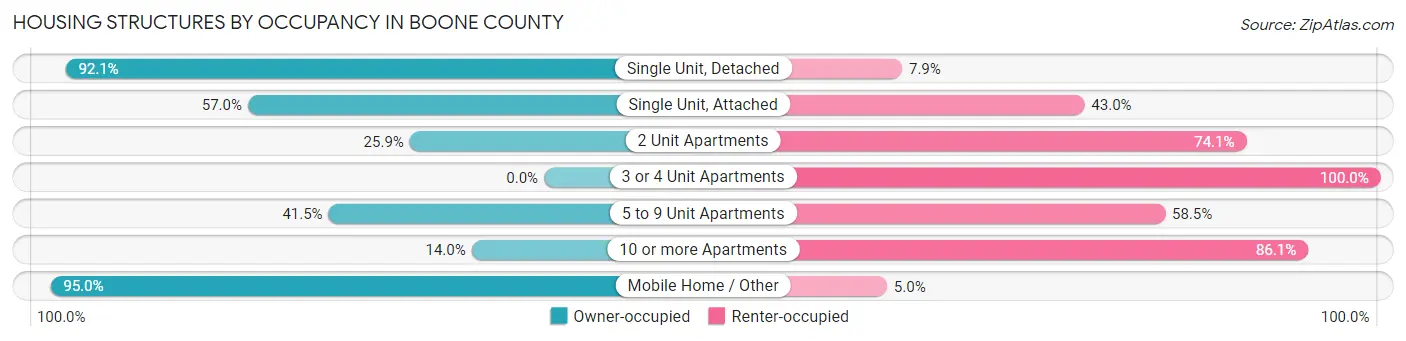
| Structure Type | Owner-occupied | Renter-occupied |
| Single Unit, Detached | 13,760 (92.1%) | 1,175 (7.9%) |
| Single Unit, Attached | 613 (57.0%) | 462 (43.0%) |
| 2 Unit Apartments | 150 (25.9%) | 430 (74.1%) |
| 3 or 4 Unit Apartments | 0 (0.0%) | 434 (100.0%) |
| 5 to 9 Unit Apartments | 83 (41.5%) | 117 (58.5%) |
| 10 or more Apartments | 60 (14.0%) | 370 (86.1%) |
| Mobile Home / Other | 1,302 (95.0%) | 68 (5.0%) |
| Total | 15,968 (83.9%) | 3,056 (16.1%) |
Housing Structures by Number of Rooms in Boone County
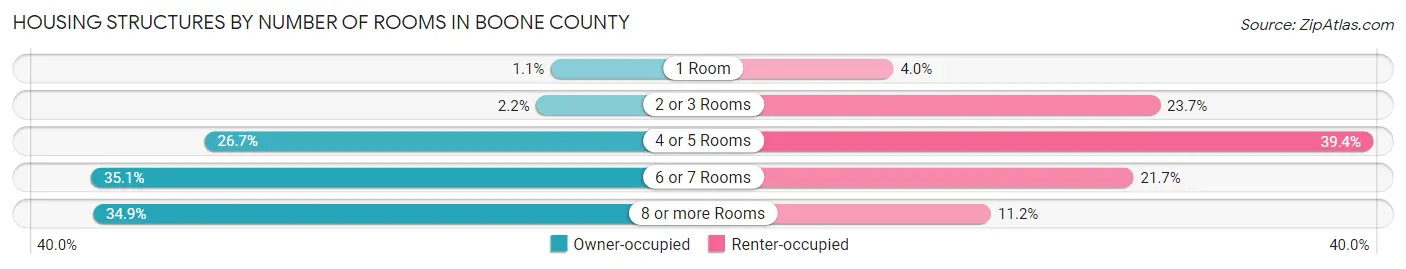
| Number of Rooms | Owner-occupied | Renter-occupied |
| 1 Room | 177 (1.1%) | 121 (4.0%) |
| 2 or 3 Rooms | 352 (2.2%) | 724 (23.7%) |
| 4 or 5 Rooms | 4,261 (26.7%) | 1,205 (39.4%) |
| 6 or 7 Rooms | 5,601 (35.1%) | 664 (21.7%) |
| 8 or more Rooms | 5,577 (34.9%) | 342 (11.2%) |
| Total | 15,968 (100.0%) | 3,056 (100.0%) |
Housing Structure by Heating Type in Boone County
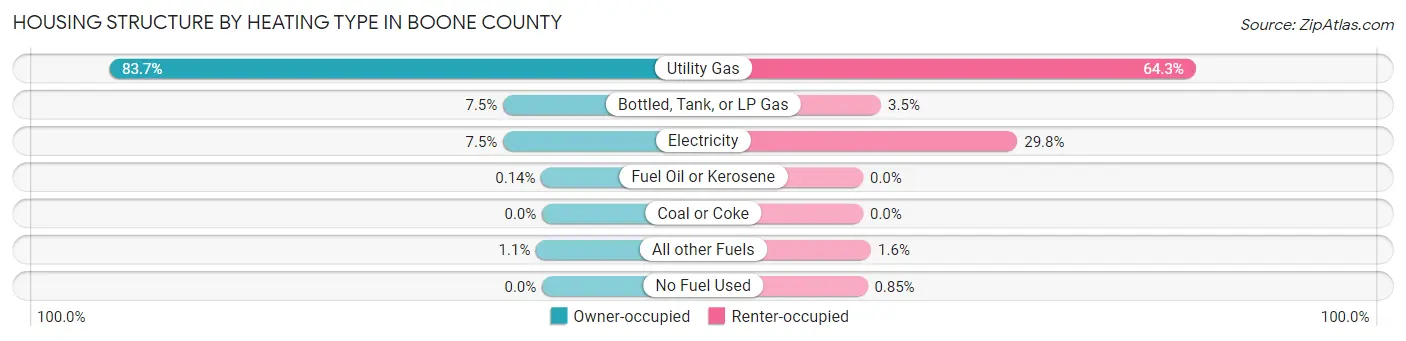
| Heating Type | Owner-occupied | Renter-occupied |
| Utility Gas | 13,362 (83.7%) | 1,964 (64.3%) |
| Bottled, Tank, or LP Gas | 1,202 (7.5%) | 107 (3.5%) |
| Electricity | 1,201 (7.5%) | 911 (29.8%) |
| Fuel Oil or Kerosene | 22 (0.1%) | 0 (0.0%) |
| Coal or Coke | 0 (0.0%) | 0 (0.0%) |
| All other Fuels | 181 (1.1%) | 48 (1.6%) |
| No Fuel Used | 0 (0.0%) | 26 (0.9%) |
| Total | 15,968 (100.0%) | 3,056 (100.0%) |
Household Vehicle Usage in Boone County
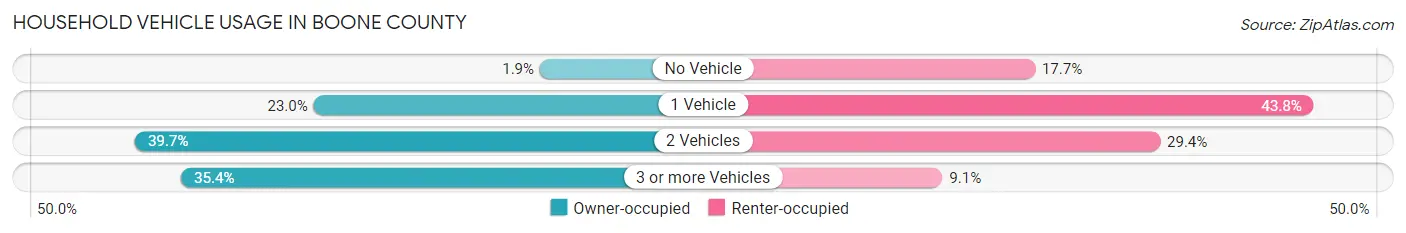
| Vehicles per Household | Owner-occupied | Renter-occupied |
| No Vehicle | 303 (1.9%) | 542 (17.7%) |
| 1 Vehicle | 3,678 (23.0%) | 1,337 (43.8%) |
| 2 Vehicles | 6,337 (39.7%) | 899 (29.4%) |
| 3 or more Vehicles | 5,650 (35.4%) | 278 (9.1%) |
| Total | 15,968 (100.0%) | 3,056 (100.0%) |
Real Estate & Mortgages in Boone County
Real Estate and Mortgage Overview in Boone County
| Characteristic | Without Mortgage | With Mortgage |
| Housing Units | 5,928 | 10,040 |
| Median Property Value | $178,200 | $184,100 |
| Median Household Income | $68,836 | $2,613 |
| Monthly Housing Costs | $690 | $810 |
| Real Estate Taxes | $3,973 | $408 |
Property Value by Mortgage Status in Boone County
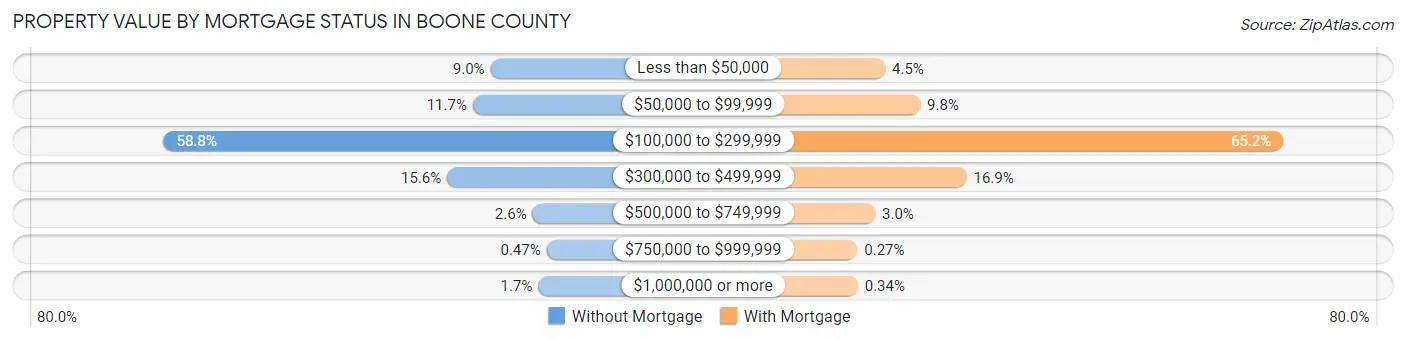
| Property Value | Without Mortgage | With Mortgage |
| Less than $50,000 | 535 (9.0%) | 452 (4.5%) |
| $50,000 to $99,999 | 694 (11.7%) | 988 (9.8%) |
| $100,000 to $299,999 | 3,487 (58.8%) | 6,542 (65.2%) |
| $300,000 to $499,999 | 926 (15.6%) | 1,698 (16.9%) |
| $500,000 to $749,999 | 155 (2.6%) | 299 (3.0%) |
| $750,000 to $999,999 | 28 (0.5%) | 27 (0.3%) |
| $1,000,000 or more | 103 (1.7%) | 34 (0.3%) |
| Total | 5,928 (100.0%) | 10,040 (100.0%) |
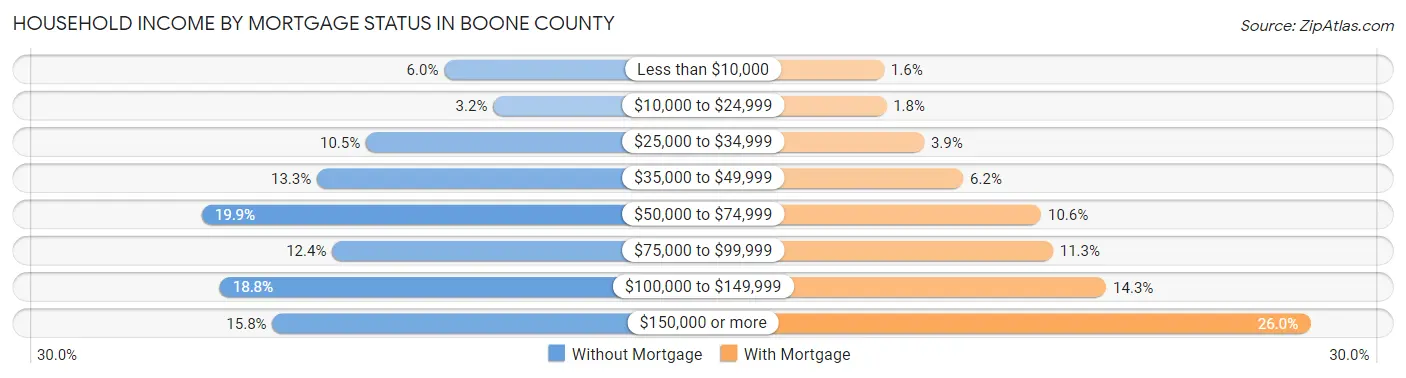
Household Income by Mortgage Status in Boone County
| Household Income | Without Mortgage | With Mortgage |
| Less than $10,000 | 357 (6.0%) | 163 (1.6%) |
| $10,000 to $24,999 | 191 (3.2%) | 176 (1.8%) |
| $25,000 to $34,999 | 622 (10.5%) | 393 (3.9%) |
| $35,000 to $49,999 | 788 (13.3%) | 617 (6.1%) |
| $50,000 to $74,999 | 1,178 (19.9%) | 1,064 (10.6%) |
| $75,000 to $99,999 | 736 (12.4%) | 1,132 (11.3%) |
| $100,000 to $149,999 | 1,117 (18.8%) | 1,438 (14.3%) |
| $150,000 or more | 939 (15.8%) | 2,607 (26.0%) |
| Total | 5,928 (100.0%) | 10,040 (100.0%) |
Property Value to Household Income Ratio in Boone County
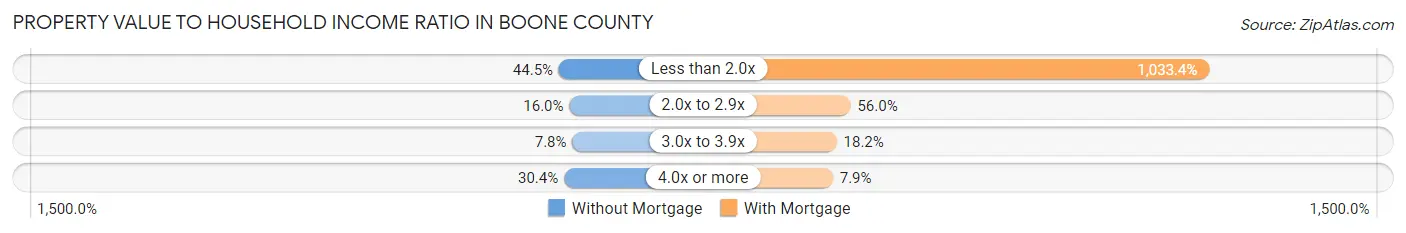
| Value-to-Income Ratio | Without Mortgage | With Mortgage |
| Less than 2.0x | 2,640 (44.5%) | 103,755 (1,033.4%) |
| 2.0x to 2.9x | 947 (16.0%) | 5,624 (56.0%) |
| 3.0x to 3.9x | 461 (7.8%) | 1,824 (18.2%) |
| 4.0x or more | 1,803 (30.4%) | 788 (7.9%) |
| Total | 5,928 (100.0%) | 10,040 (100.0%) |
Real Estate Taxes by Mortgage Status in Boone County
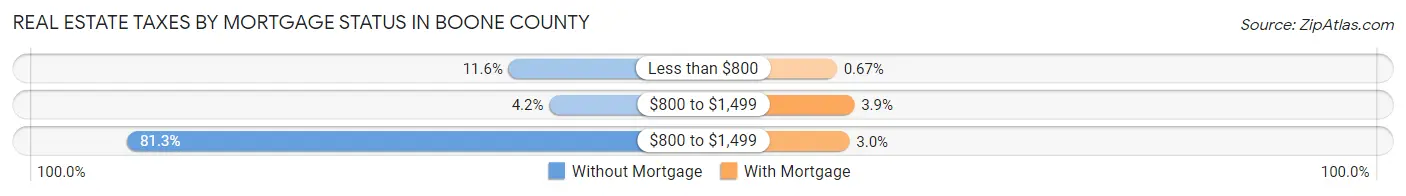
| Property Taxes | Without Mortgage | With Mortgage |
| Less than $800 | 686 (11.6%) | 67 (0.7%) |
| $800 to $1,499 | 247 (4.2%) | 388 (3.9%) |
| $800 to $1,499 | 4,819 (81.3%) | 299 (3.0%) |
| Total | 5,928 (100.0%) | 10,040 (100.0%) |
Health & Disability in Boone County
Health Insurance Coverage by Age in Boone County
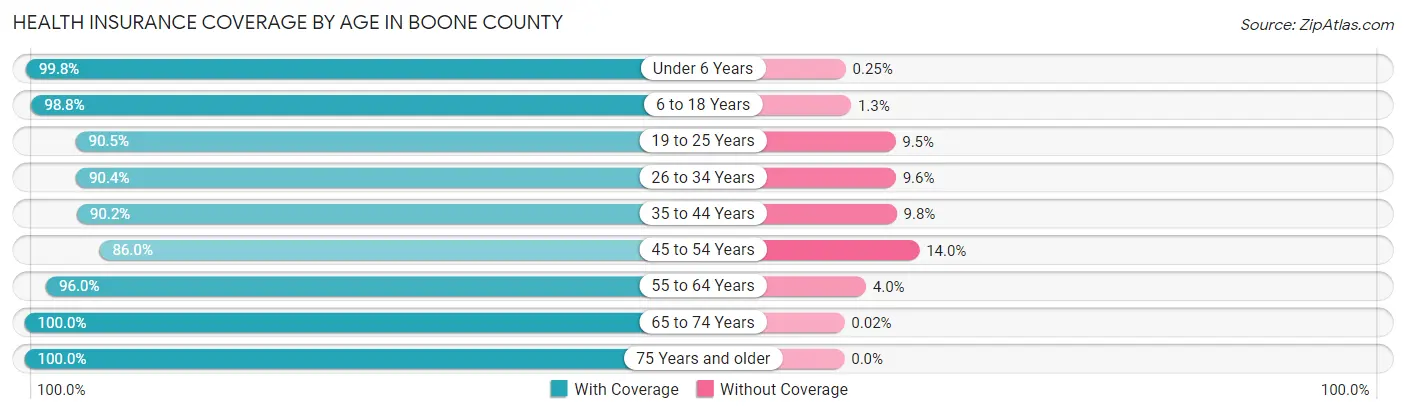
| Age Bracket | With Coverage | Without Coverage |
| Under 6 Years | 3,526 (99.8%) | 9 (0.3%) |
| 6 to 18 Years | 10,230 (98.8%) | 130 (1.3%) |
| 19 to 25 Years | 4,235 (90.5%) | 445 (9.5%) |
| 26 to 34 Years | 4,735 (90.4%) | 502 (9.6%) |
| 35 to 44 Years | 5,871 (90.2%) | 635 (9.8%) |
| 45 to 54 Years | 6,363 (86.0%) | 1,033 (14.0%) |
| 55 to 64 Years | 6,663 (96.0%) | 279 (4.0%) |
| 65 to 74 Years | 5,127 (100.0%) | 1 (0.0%) |
| 75 Years and older | 3,356 (100.0%) | 0 (0.0%) |
| Total | 50,106 (94.3%) | 3,034 (5.7%) |
Health Insurance Coverage by Citizenship Status in Boone County
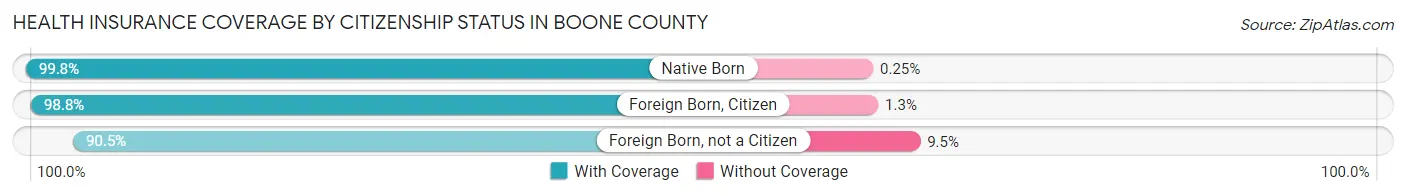
| Citizenship Status | With Coverage | Without Coverage |
| Native Born | 3,526 (99.8%) | 9 (0.3%) |
| Foreign Born, Citizen | 10,230 (98.8%) | 130 (1.3%) |
| Foreign Born, not a Citizen | 4,235 (90.5%) | 445 (9.5%) |
Health Insurance Coverage by Household Income in Boone County
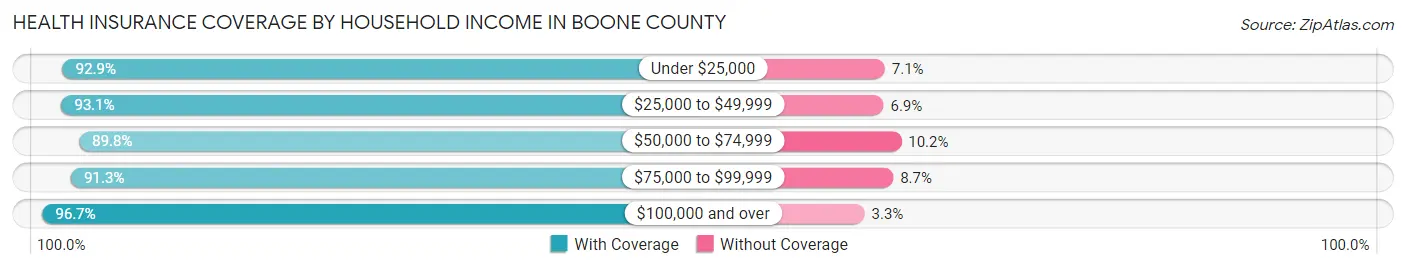
| Household Income | With Coverage | Without Coverage |
| Under $25,000 | 3,492 (92.9%) | 268 (7.1%) |
| $25,000 to $49,999 | 7,229 (93.1%) | 534 (6.9%) |
| $50,000 to $74,999 | 6,228 (89.8%) | 708 (10.2%) |
| $75,000 to $99,999 | 6,251 (91.3%) | 596 (8.7%) |
| $100,000 and over | 26,903 (96.7%) | 927 (3.3%) |
Public vs Private Health Insurance Coverage by Age in Boone County
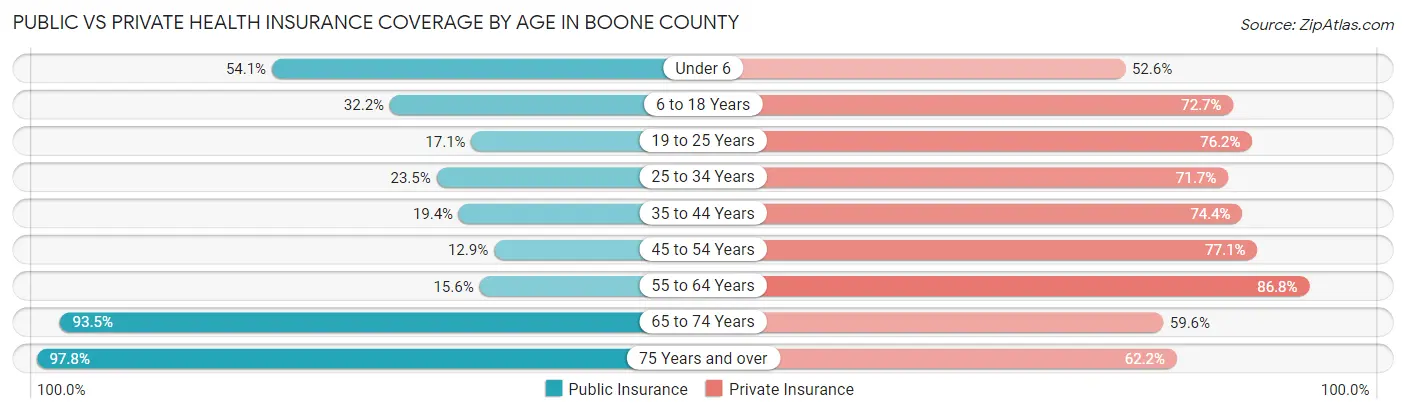
| Age Bracket | Public Insurance | Private Insurance |
| Under 6 | 1,912 (54.1%) | 1,858 (52.6%) |
| 6 to 18 Years | 3,335 (32.2%) | 7,529 (72.7%) |
| 19 to 25 Years | 799 (17.1%) | 3,566 (76.2%) |
| 25 to 34 Years | 1,233 (23.5%) | 3,755 (71.7%) |
| 35 to 44 Years | 1,261 (19.4%) | 4,838 (74.4%) |
| 45 to 54 Years | 952 (12.9%) | 5,705 (77.1%) |
| 55 to 64 Years | 1,081 (15.6%) | 6,024 (86.8%) |
| 65 to 74 Years | 4,794 (93.5%) | 3,056 (59.6%) |
| 75 Years and over | 3,282 (97.8%) | 2,087 (62.2%) |
| Total | 18,649 (35.1%) | 38,418 (72.3%) |
Disability Status by Sex by Age in Boone County
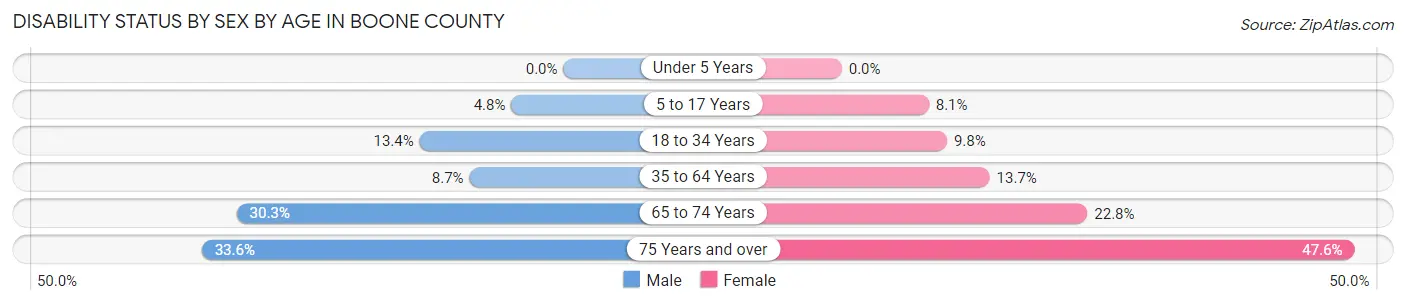
| Age Bracket | Male | Female |
| Under 5 Years | 0 (0.0%) | 0 (0.0%) |
| 5 to 17 Years | 253 (4.8%) | 394 (8.1%) |
| 18 to 34 Years | 735 (13.4%) | 527 (9.8%) |
| 35 to 64 Years | 917 (8.7%) | 1,417 (13.7%) |
| 65 to 74 Years | 787 (30.3%) | 577 (22.8%) |
| 75 Years and over | 485 (33.6%) | 909 (47.6%) |
Disability Class by Sex by Age in Boone County
Disability Class: Hearing Difficulty
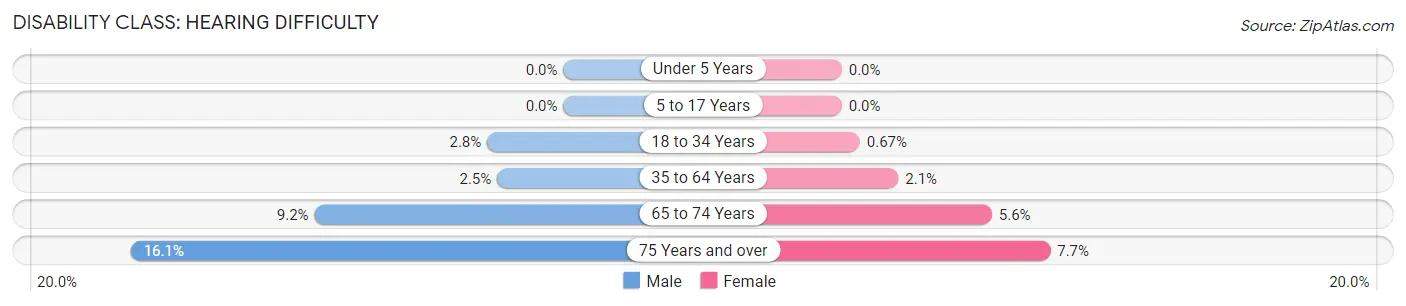
| Age Bracket | Male | Female |
| Under 5 Years | 0 (0.0%) | 0 (0.0%) |
| 5 to 17 Years | 0 (0.0%) | 0 (0.0%) |
| 18 to 34 Years | 156 (2.8%) | 36 (0.7%) |
| 35 to 64 Years | 259 (2.5%) | 217 (2.1%) |
| 65 to 74 Years | 240 (9.2%) | 141 (5.6%) |
| 75 Years and over | 232 (16.1%) | 148 (7.7%) |
Disability Class: Vision Difficulty
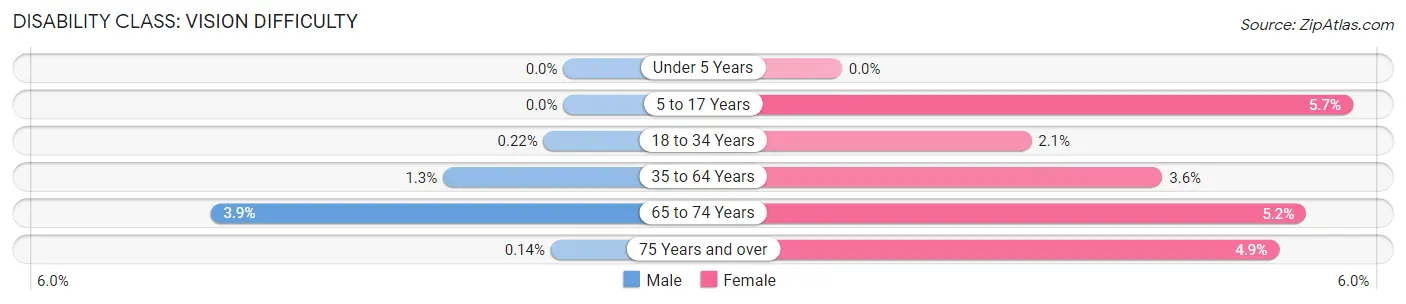
| Age Bracket | Male | Female |
| Under 5 Years | 0 (0.0%) | 0 (0.0%) |
| 5 to 17 Years | 0 (0.0%) | 278 (5.7%) |
| 18 to 34 Years | 12 (0.2%) | 114 (2.1%) |
| 35 to 64 Years | 141 (1.3%) | 369 (3.6%) |
| 65 to 74 Years | 102 (3.9%) | 131 (5.2%) |
| 75 Years and over | 2 (0.1%) | 93 (4.9%) |
Disability Class: Cognitive Difficulty
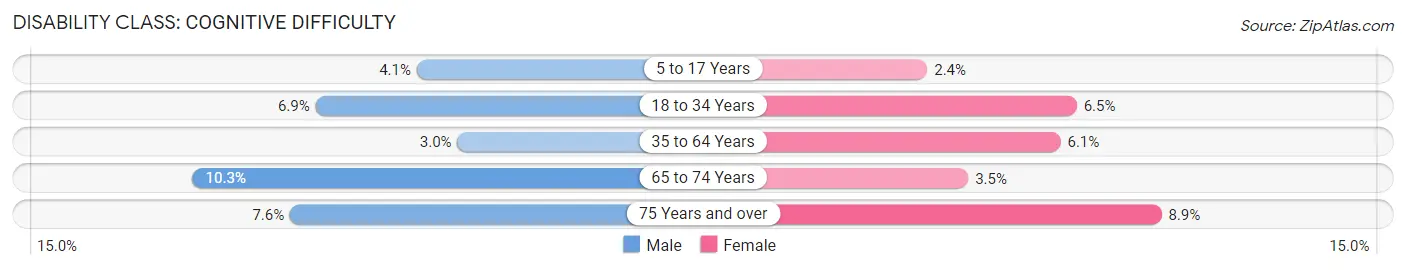
| Age Bracket | Male | Female |
| 5 to 17 Years | 214 (4.1%) | 116 (2.4%) |
| 18 to 34 Years | 380 (6.9%) | 353 (6.5%) |
| 35 to 64 Years | 310 (2.9%) | 629 (6.1%) |
| 65 to 74 Years | 268 (10.3%) | 89 (3.5%) |
| 75 Years and over | 110 (7.6%) | 170 (8.9%) |
Disability Class: Ambulatory Difficulty
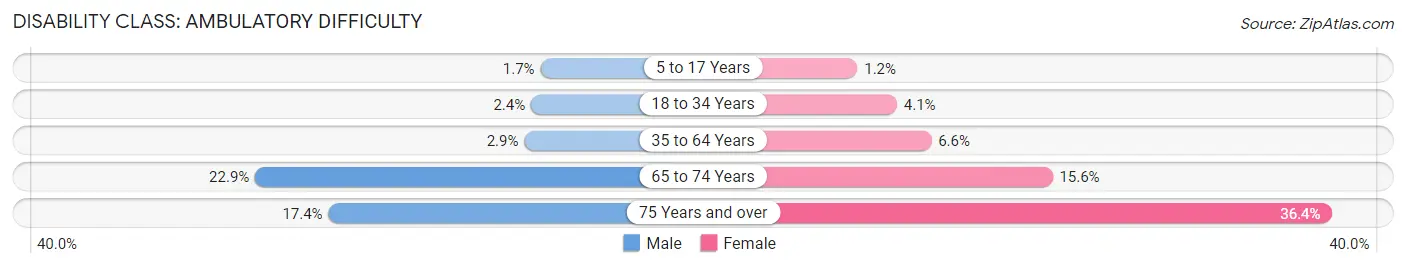
| Age Bracket | Male | Female |
| 5 to 17 Years | 89 (1.7%) | 56 (1.1%) |
| 18 to 34 Years | 132 (2.4%) | 221 (4.1%) |
| 35 to 64 Years | 305 (2.9%) | 686 (6.6%) |
| 65 to 74 Years | 594 (22.9%) | 396 (15.6%) |
| 75 Years and over | 252 (17.4%) | 696 (36.4%) |
Disability Class: Self-Care Difficulty
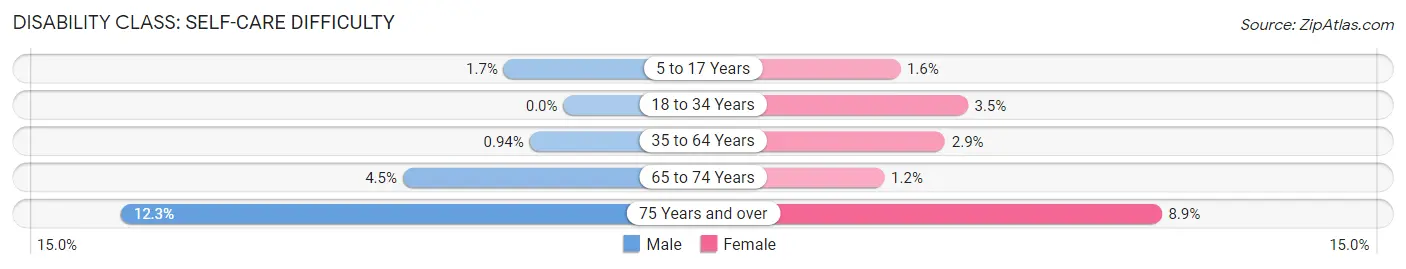
| Age Bracket | Male | Female |
| 5 to 17 Years | 87 (1.7%) | 79 (1.6%) |
| 18 to 34 Years | 0 (0.0%) | 189 (3.5%) |
| 35 to 64 Years | 99 (0.9%) | 296 (2.9%) |
| 65 to 74 Years | 116 (4.5%) | 30 (1.2%) |
| 75 Years and over | 178 (12.3%) | 170 (8.9%) |
Technology Access in Boone County
Computing Device Access in Boone County
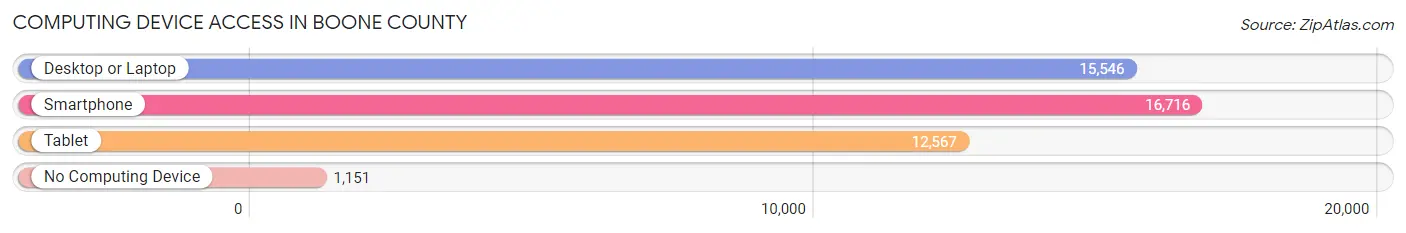
| Device Type | # Households | % Households |
| Desktop or Laptop | 15,546 | 81.7% |
| Smartphone | 16,716 | 87.9% |
| Tablet | 12,567 | 66.1% |
| No Computing Device | 1,151 | 6.0% |
| Total | 19,024 | 100.0% |
Internet Access in Boone County
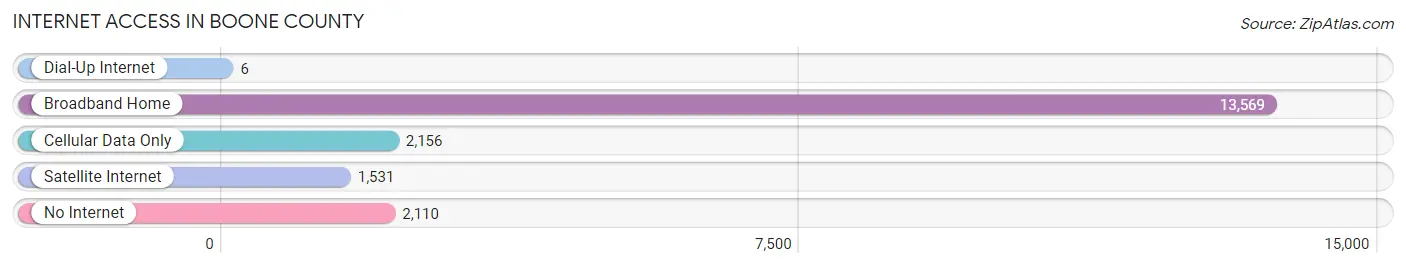
| Internet Type | # Households | % Households |
| Dial-Up Internet | 6 | 0.0% |
| Broadband Home | 13,569 | 71.3% |
| Cellular Data Only | 2,156 | 11.3% |
| Satellite Internet | 1,531 | 8.1% |
| No Internet | 2,110 | 11.1% |
| Total | 19,024 | 100.0% |
Boone County Summary
Boone County, Illinois is located in the northern part of the state, in the heart of the Midwest. It is bordered by Winnebago County to the north, Ogle County to the east, DeKalb County to the south, and McHenry County to the west. The county seat is Belvidere, and the county is named after Daniel Boone, the famous American pioneer and explorer.
Geography
Boone County is located in the northern part of Illinois, in the heart of the Midwest. It is bordered by Winnebago County to the north, Ogle County to the east, DeKalb County to the south, and McHenry County to the west. The county covers an area of 545 square miles, with a population of 54,165 as of the 2010 census. The terrain is mostly flat, with some rolling hills in the northern part of the county. The Kishwaukee River runs through the county, and there are several small lakes and ponds scattered throughout the area.
History
Boone County was formed in 1837 from parts of Winnebago and McHenry counties. It was named after Daniel Boone, the famous American pioneer and explorer. The county seat was originally located in Caledonia, but was moved to Belvidere in 1839. The county was largely agricultural in its early years, with the main crops being wheat, corn, and oats. In the late 19th century, the county began to industrialize, with the establishment of several factories in Belvidere. The county continued to grow and develop throughout the 20th century, and today it is a thriving suburban area.
Economy
Boone County has a diverse economy, with a mix of manufacturing, retail, and service industries. The largest employers in the county are the Belvidere Assembly Plant, which produces vehicles for Chrysler, and the Belvidere Medical Center. Other major employers include the Belvidere School District, the Belvidere Fire Department, and the Boone County Sheriff's Office. The county also has a thriving agricultural sector, with corn, soybeans, and wheat being the main crops.
Demographics
As of the 2010 census, Boone County had a population of 54,165. The racial makeup of the county was 87.3% White, 8.2% Hispanic or Latino, 2.2% African American, 0.7% Asian, 0.3% Native American, and 1.5% from other races. The median household income was $60,945, and the median family income was $71,945. The per capita income was $25,945.
Boone County is a largely suburban area, with a mix of rural and urban areas. The county is home to several small towns, including Belvidere, Poplar Grove, Caledonia, and Capron. The county is served by several school districts, including the Belvidere School District, the Poplar Grove School District, and the Caledonia School District. The county is also home to several higher education institutions, including Rock Valley College and Northern Illinois University.
Common Questions
What is the Total Population of Boone County?
Total Population of Boone County is 53,459.
What is the Total Male Population of Boone County?
Total Male Population of Boone County is 26,938.
What is the Total Female Population of Boone County?
Total Female Population of Boone County is 26,521.
What is the Ratio of Males per 100 Females in Boone County?
There are 101.57 Males per 100 Females in Boone County.
What is the Ratio of Females per 100 Males in Boone County?
There are 98.45 Females per 100 Males in Boone County.
What is the Median Population Age in Boone County?
Median Population Age in Boone County is 39.0 Years.
What is the Average Family Size in Boone County
Average Family Size in Boone County is 3.3 People.
What is the Average Household Size in Boone County
Average Household Size in Boone County is 2.8 People.
What is Per Capita Income in Boone County?
Per Capita income in Boone County is $37,055.
What is the Median Family Income in Boone County?
Median Family Income in Boone County is $101,686.
What is the Median Household income in Boone County?
Median Household Income in Boone County is $80,502.
What is Income or Wage Gap in Boone County?
Income or Wage Gap in Boone County is 38.2%.
Women in Boone County earn 61.8 cents for every dollar earned by a man.
What is Family Income Deficit in Boone County?
Family Income Deficit in Boone County is $12,720.
Families that are below poverty line in Boone County earn $12,720 less on average than the poverty threshold level.
What is Inequality or Gini Index in Boone County?
Inequality or Gini Index in Boone County is 0.42.
How Large is the Labor Force in Boone County?
There are 28,024 People in the Labor Forcein in Boone County.
What is the Percentage of People in the Labor Force in Boone County?
66.0% of People are in the Labor Force in Boone County.
What is the Unemployment Rate in Boone County?
Unemployment Rate in Boone County is 7.7%.