Hampton Bays, NY
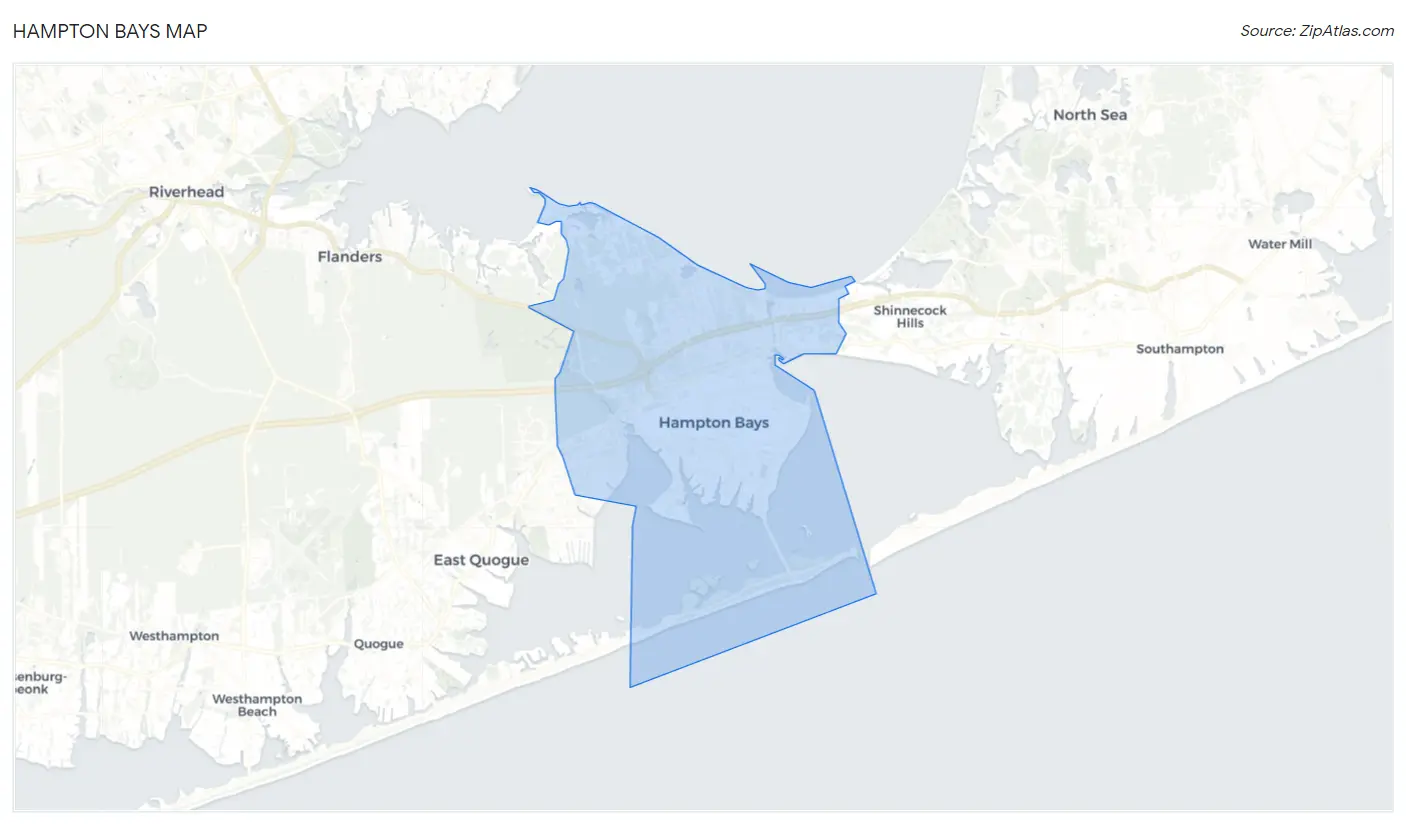
Hampton Bays Map
Hampton Bays Overview
16,939
TOTAL POPULATION
9,044
MALE POPULATION
7,895
FEMALE POPULATION
114.55
MALES / 100 FEMALES
87.30
FEMALES / 100 MALES
44.3
MEDIAN AGE
3.1
AVG FAMILY SIZE
2.7
AVG HOUSEHOLD SIZE
$58,765
PER CAPITA INCOME
$135,382
AVG FAMILY INCOME
$116,526
AVG HOUSEHOLD INCOME
9.4%
WAGE / INCOME GAP [ % ]
90.6¢/ $1
WAGE / INCOME GAP [ $ ]
0.46
INEQUALITY / GINI INDEX
8,858
LABOR FORCE [ PEOPLE ]
62.2%
PERCENT IN LABOR FORCE
3.4%
UNEMPLOYMENT RATE
Hampton Bays Zip Codes
Hampton Bays Area Codes
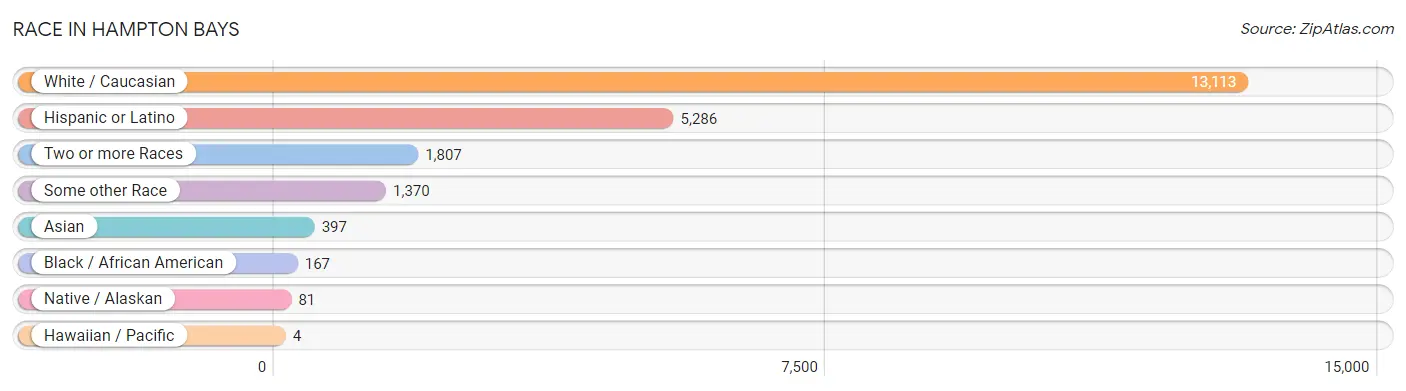
Race in Hampton Bays
The most populous races in Hampton Bays are White / Caucasian (13,113 | 77.4%), Hispanic or Latino (5,286 | 31.2%), and Two or more Races (1,807 | 10.7%).
| Race | # Population | % Population |
| Asian | 397 | 2.3% |
| Black / African American | 167 | 1.0% |
| Hawaiian / Pacific | 4 | 0.0% |
| Hispanic or Latino | 5,286 | 31.2% |
| Native / Alaskan | 81 | 0.5% |
| White / Caucasian | 13,113 | 77.4% |
| Two or more Races | 1,807 | 10.7% |
| Some other Race | 1,370 | 8.1% |
| Total | 16,939 | 100.0% |
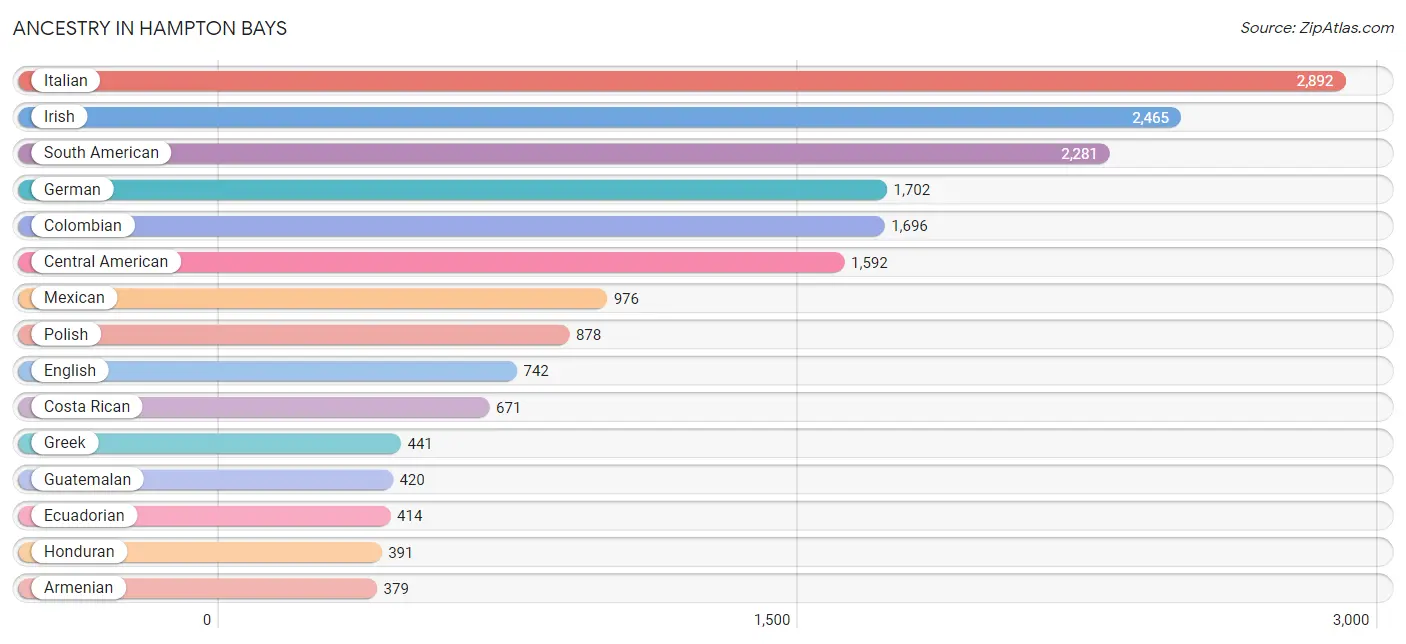
Ancestry in Hampton Bays
The most populous ancestries reported in Hampton Bays are Italian (2,892 | 17.1%), Irish (2,465 | 14.5%), South American (2,281 | 13.5%), German (1,702 | 10.1%), and Colombian (1,696 | 10.0%), together accounting for 65.1% of all Hampton Bays residents.
| Ancestry | # Population | % Population |
| American | 298 | 1.8% |
| Armenian | 379 | 2.2% |
| Austrian | 72 | 0.4% |
| Blackfeet | 18 | 0.1% |
| Bolivian | 5 | 0.0% |
| Brazilian | 44 | 0.3% |
| British | 36 | 0.2% |
| Burmese | 15 | 0.1% |
| Celtic | 12 | 0.1% |
| Central American | 1,592 | 9.4% |
| Central American Indian | 81 | 0.5% |
| Chilean | 71 | 0.4% |
| Colombian | 1,696 | 10.0% |
| Costa Rican | 671 | 4.0% |
| Croatian | 10 | 0.1% |
| Cuban | 55 | 0.3% |
| Czech | 12 | 0.1% |
| Czechoslovakian | 12 | 0.1% |
| Danish | 11 | 0.1% |
| Delaware | 12 | 0.1% |
| Dominican | 16 | 0.1% |
| Dutch | 71 | 0.4% |
| Eastern European | 29 | 0.2% |
| Ecuadorian | 414 | 2.4% |
| English | 742 | 4.4% |
| European | 136 | 0.8% |
| French | 255 | 1.5% |
| French Canadian | 10 | 0.1% |
| German | 1,702 | 10.1% |
| Greek | 441 | 2.6% |
| Guamanian / Chamorro | 4 | 0.0% |
| Guatemalan | 420 | 2.5% |
| Haitian | 1 | 0.0% |
| Honduran | 391 | 2.3% |
| Hungarian | 58 | 0.3% |
| Icelander | 8 | 0.1% |
| Indian (Asian) | 256 | 1.5% |
| Iranian | 23 | 0.1% |
| Irish | 2,465 | 14.5% |
| Israeli | 10 | 0.1% |
| Italian | 2,892 | 17.1% |
| Jamaican | 95 | 0.6% |
| Kenyan | 18 | 0.1% |
| Korean | 88 | 0.5% |
| Latvian | 17 | 0.1% |
| Lithuanian | 27 | 0.2% |
| Maltese | 13 | 0.1% |
| Mexican | 976 | 5.8% |
| Mexican American Indian | 37 | 0.2% |
| Norwegian | 233 | 1.4% |
| Polish | 878 | 5.2% |
| Portuguese | 129 | 0.8% |
| Puerto Rican | 97 | 0.6% |
| Romanian | 19 | 0.1% |
| Russian | 125 | 0.7% |
| Salvadoran | 110 | 0.6% |
| Scandinavian | 12 | 0.1% |
| Scotch-Irish | 34 | 0.2% |
| Scottish | 261 | 1.5% |
| Slovak | 51 | 0.3% |
| South American | 2,281 | 13.5% |
| Spaniard | 61 | 0.4% |
| Spanish | 1 | 0.0% |
| Spanish American | 31 | 0.2% |
| Spanish American Indian | 17 | 0.1% |
| Subsaharan African | 18 | 0.1% |
| Swedish | 74 | 0.4% |
| Swiss | 77 | 0.4% |
| Turkish | 122 | 0.7% |
| Ukrainian | 189 | 1.1% |
| Venezuelan | 95 | 0.6% |
| Welsh | 34 | 0.2% | View All 72 Rows |
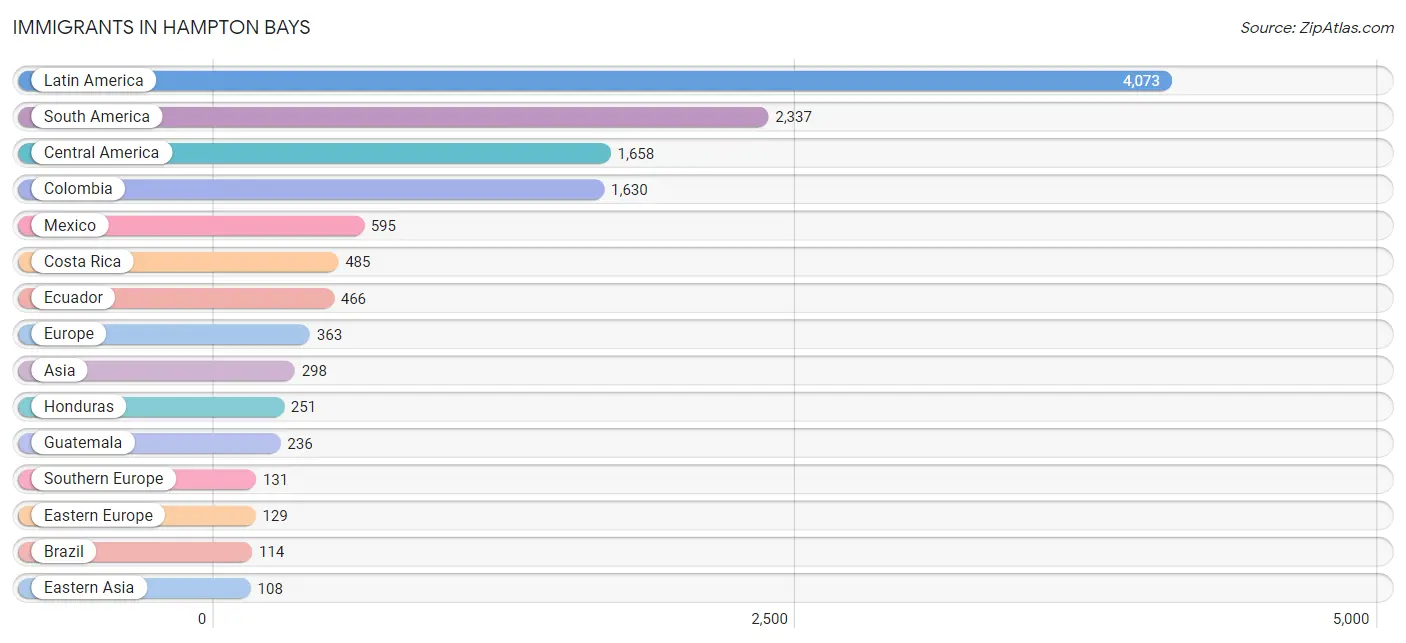
Immigrants in Hampton Bays
The most numerous immigrant groups reported in Hampton Bays came from Latin America (4,073 | 24.0%), South America (2,337 | 13.8%), Central America (1,658 | 9.8%), Colombia (1,630 | 9.6%), and Mexico (595 | 3.5%), together accounting for 60.8% of all Hampton Bays residents.
| Immigration Origin | # Population | % Population |
| Africa | 18 | 0.1% |
| Asia | 298 | 1.8% |
| Brazil | 114 | 0.7% |
| Caribbean | 78 | 0.5% |
| Central America | 1,658 | 9.8% |
| Chile | 60 | 0.4% |
| China | 95 | 0.6% |
| Colombia | 1,630 | 9.6% |
| Costa Rica | 485 | 2.9% |
| Czechoslovakia | 21 | 0.1% |
| Denmark | 11 | 0.1% |
| Eastern Africa | 18 | 0.1% |
| Eastern Asia | 108 | 0.6% |
| Eastern Europe | 129 | 0.8% |
| Ecuador | 466 | 2.8% |
| El Salvador | 91 | 0.5% |
| Europe | 363 | 2.1% |
| France | 38 | 0.2% |
| Germany | 16 | 0.1% |
| Greece | 19 | 0.1% |
| Guatemala | 236 | 1.4% |
| Haiti | 1 | 0.0% |
| Honduras | 251 | 1.5% |
| Iran | 29 | 0.2% |
| Israel | 10 | 0.1% |
| Italy | 87 | 0.5% |
| Jamaica | 63 | 0.4% |
| Kenya | 18 | 0.1% |
| Korea | 13 | 0.1% |
| Latin America | 4,073 | 24.0% |
| Latvia | 17 | 0.1% |
| Mexico | 595 | 3.5% |
| Northern Europe | 49 | 0.3% |
| Pakistan | 66 | 0.4% |
| Philippines | 49 | 0.3% |
| Poland | 72 | 0.4% |
| Portugal | 25 | 0.2% |
| Romania | 19 | 0.1% |
| Scotland | 12 | 0.1% |
| South America | 2,337 | 13.8% |
| South Central Asia | 95 | 0.6% |
| South Eastern Asia | 49 | 0.3% |
| Southern Europe | 131 | 0.8% |
| Turkey | 36 | 0.2% |
| Venezuela | 67 | 0.4% |
| Western Asia | 46 | 0.3% |
| Western Europe | 54 | 0.3% | View All 47 Rows |
Sex and Age in Hampton Bays
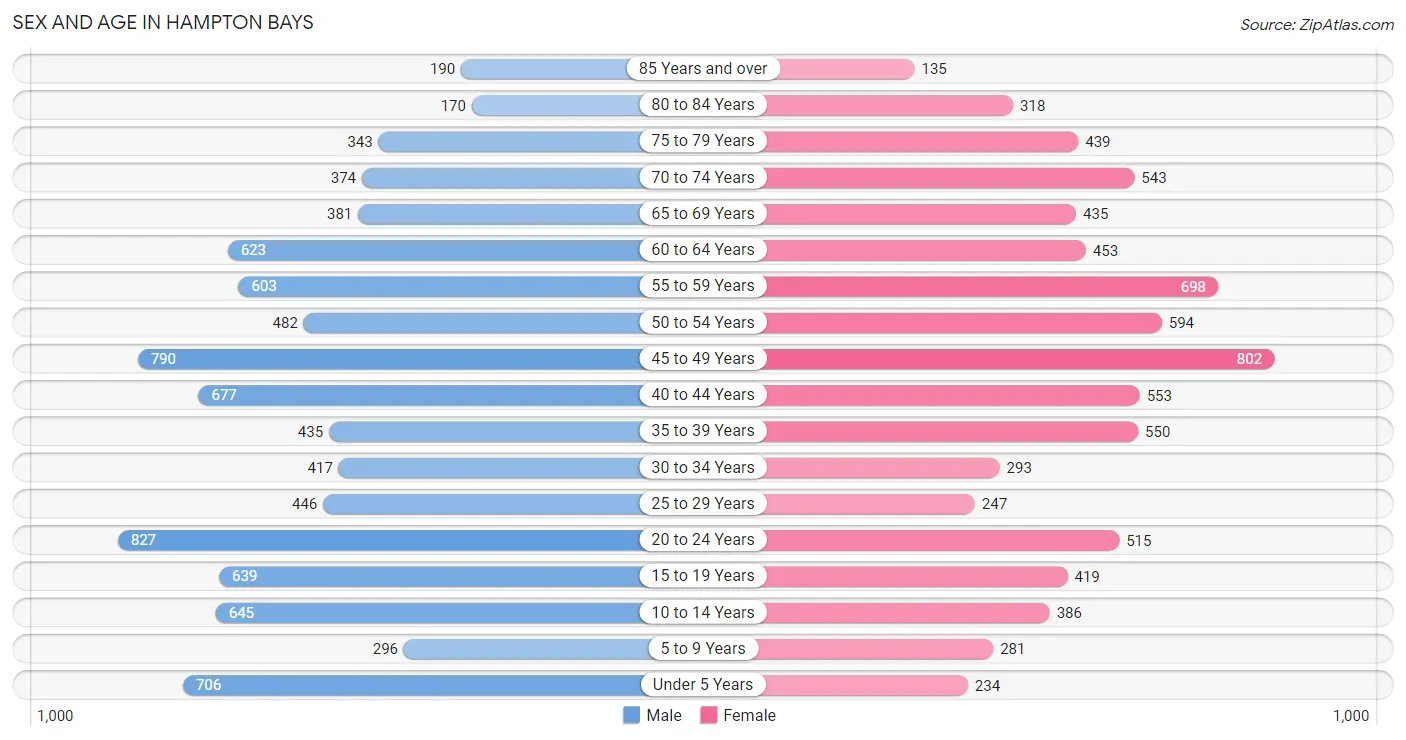
Sex and Age in Hampton Bays
The most populous age groups in Hampton Bays are 20 to 24 Years (827 | 9.1%) for men and 45 to 49 Years (802 | 10.2%) for women.
| Age Bracket | Male | Female |
| Under 5 Years | 706 (7.8%) | 234 (3.0%) |
| 5 to 9 Years | 296 (3.3%) | 281 (3.6%) |
| 10 to 14 Years | 645 (7.1%) | 386 (4.9%) |
| 15 to 19 Years | 639 (7.1%) | 419 (5.3%) |
| 20 to 24 Years | 827 (9.1%) | 515 (6.5%) |
| 25 to 29 Years | 446 (4.9%) | 247 (3.1%) |
| 30 to 34 Years | 417 (4.6%) | 293 (3.7%) |
| 35 to 39 Years | 435 (4.8%) | 550 (7.0%) |
| 40 to 44 Years | 677 (7.5%) | 553 (7.0%) |
| 45 to 49 Years | 790 (8.7%) | 802 (10.2%) |
| 50 to 54 Years | 482 (5.3%) | 594 (7.5%) |
| 55 to 59 Years | 603 (6.7%) | 698 (8.8%) |
| 60 to 64 Years | 623 (6.9%) | 453 (5.7%) |
| 65 to 69 Years | 381 (4.2%) | 435 (5.5%) |
| 70 to 74 Years | 374 (4.1%) | 543 (6.9%) |
| 75 to 79 Years | 343 (3.8%) | 439 (5.6%) |
| 80 to 84 Years | 170 (1.9%) | 318 (4.0%) |
| 85 Years and over | 190 (2.1%) | 135 (1.7%) |
| Total | 9,044 (100.0%) | 7,895 (100.0%) |
Families and Households in Hampton Bays
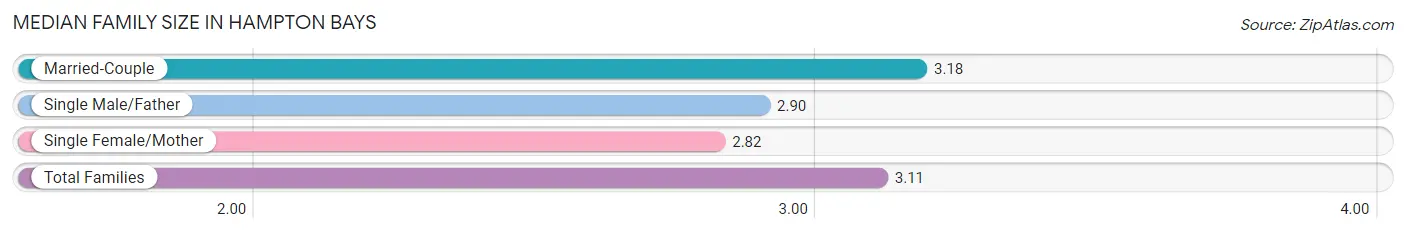
Median Family Size in Hampton Bays
The median family size in Hampton Bays is 3.11 persons per family, with married-couple families (3,486 | 78.5%) accounting for the largest median family size of 3.18 persons per family. On the other hand, single female/mother families (683 | 15.4%) represent the smallest median family size with 2.82 persons per family.
| Family Type | # Families | Family Size |
| Married-Couple | 3,486 (78.5%) | 3.18 |
| Single Male/Father | 273 (6.1%) | 2.90 |
| Single Female/Mother | 683 (15.4%) | 2.82 |
| Total Families | 4,442 (100.0%) | 3.11 |
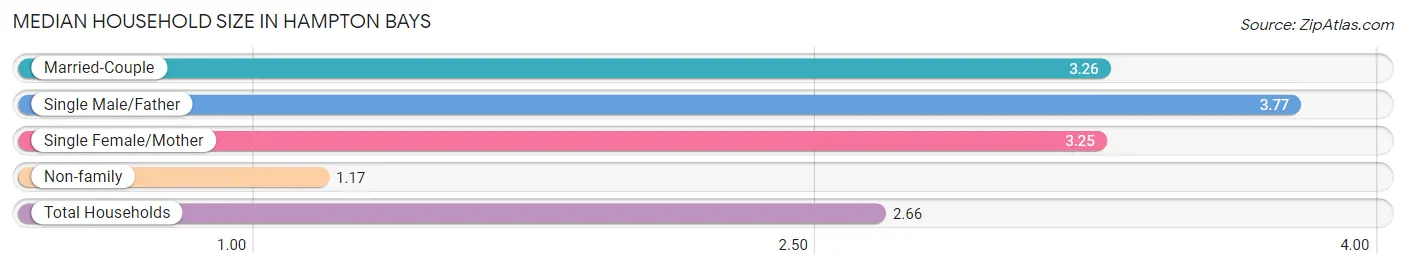
Median Household Size in Hampton Bays
The median household size in Hampton Bays is 2.66 persons per household, with single male/father households (273 | 4.3%) accounting for the largest median household size of 3.77 persons per household. non-family households (1,884 | 29.8%) represent the smallest median household size with 1.17 persons per household.
| Household Type | # Households | Household Size |
| Married-Couple | 3,486 (55.1%) | 3.26 |
| Single Male/Father | 273 (4.3%) | 3.77 |
| Single Female/Mother | 683 (10.8%) | 3.25 |
| Non-family | 1,884 (29.8%) | 1.17 |
| Total Households | 6,326 (100.0%) | 2.66 |
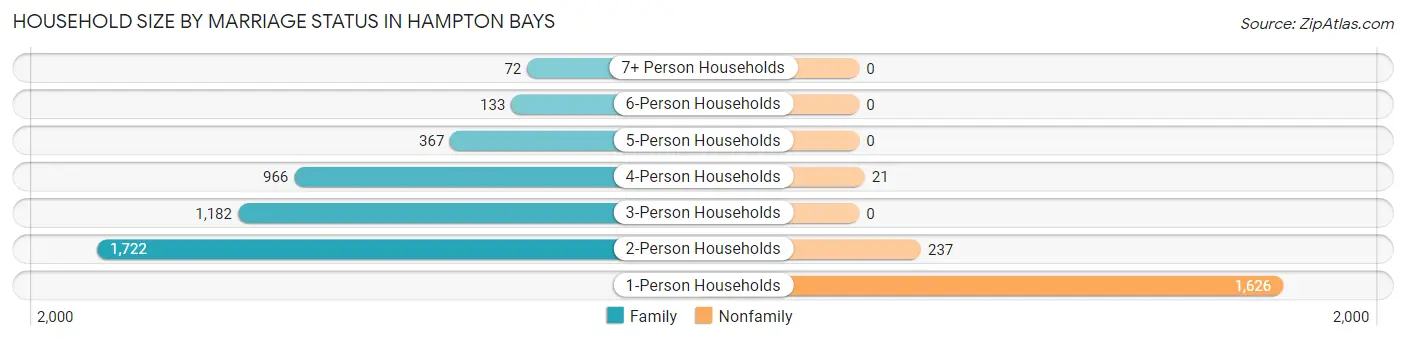
Household Size by Marriage Status in Hampton Bays
Out of a total of 6,326 households in Hampton Bays, 4,442 (70.2%) are family households, while 1,884 (29.8%) are nonfamily households. The most numerous type of family households are 2-person households, comprising 1,722, and the most common type of nonfamily households are 1-person households, comprising 1,626.
| Household Size | Family Households | Nonfamily Households |
| 1-Person Households | - | 1,626 (25.7%) |
| 2-Person Households | 1,722 (27.2%) | 237 (3.7%) |
| 3-Person Households | 1,182 (18.7%) | 0 (0.0%) |
| 4-Person Households | 966 (15.3%) | 21 (0.3%) |
| 5-Person Households | 367 (5.8%) | 0 (0.0%) |
| 6-Person Households | 133 (2.1%) | 0 (0.0%) |
| 7+ Person Households | 72 (1.1%) | 0 (0.0%) |
| Total | 4,442 (70.2%) | 1,884 (29.8%) |
Female Fertility in Hampton Bays
Fertility by Age in Hampton Bays
Average fertility rate in Hampton Bays is 58.0 births per 1,000 women. Women in the age bracket of 20 to 34 years have the highest fertility rate with 157.0 births per 1,000 women. Women in the age bracket of 20 to 34 years acount for 81.8% of all women with births.
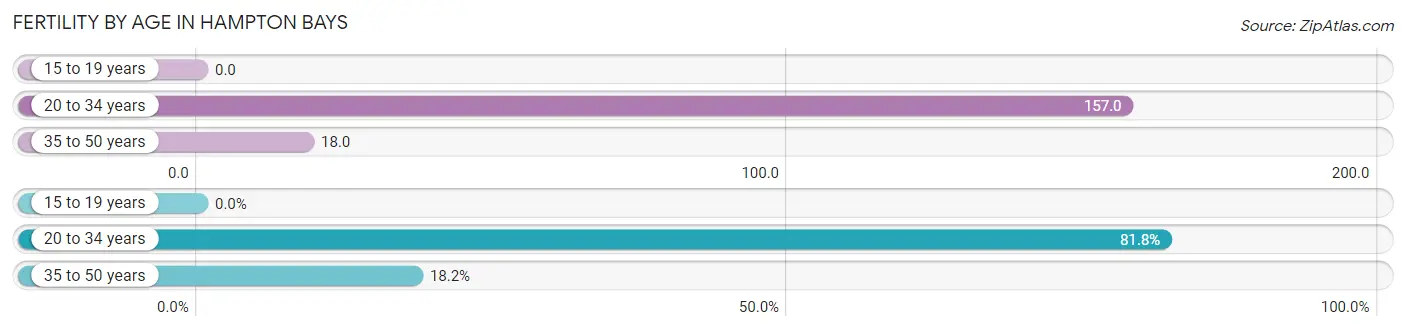
| Age Bracket | Women with Births | Births / 1,000 Women |
| 15 to 19 years | 0 (0.0%) | 0.0 |
| 20 to 34 years | 166 (81.8%) | 157.0 |
| 35 to 50 years | 37 (18.2%) | 18.0 |
| Total | 203 (100.0%) | 58.0 |
Fertility by Age by Marriage Status in Hampton Bays
67.5% of women with births (203) in Hampton Bays are married. The highest percentage of unmarried women with births falls into 35 to 50 years age bracket with 59.5% of them unmarried at the time of birth, while the lowest percentage of unmarried women with births belong to 20 to 34 years age bracket with 26.5% of them unmarried.
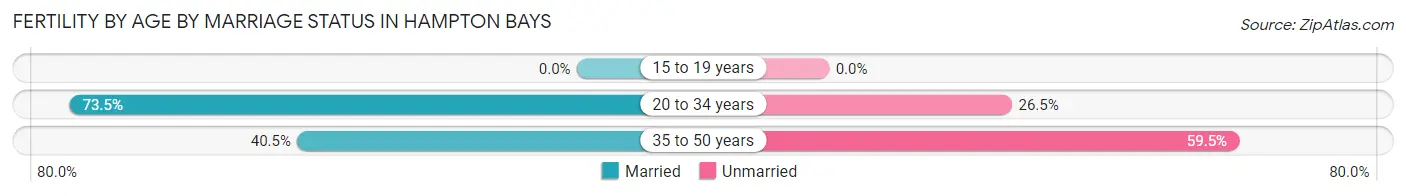
| Age Bracket | Married | Unmarried |
| 15 to 19 years | 0 (0.0%) | 0 (0.0%) |
| 20 to 34 years | 122 (73.5%) | 44 (26.5%) |
| 35 to 50 years | 15 (40.5%) | 22 (59.5%) |
| Total | 137 (67.5%) | 66 (32.5%) |
Fertility by Education in Hampton Bays
Average fertility rate in Hampton Bays is 58.0 births per 1,000 women. Women with the education attainment of graduate degree have the highest fertility rate of 188.0 births per 1,000 women, while women with the education attainment of bachelor's degree have the lowest fertility at 25.0 births per 1,000 women. Women with the education attainment of graduate degree represent 48.3% of all women with births.
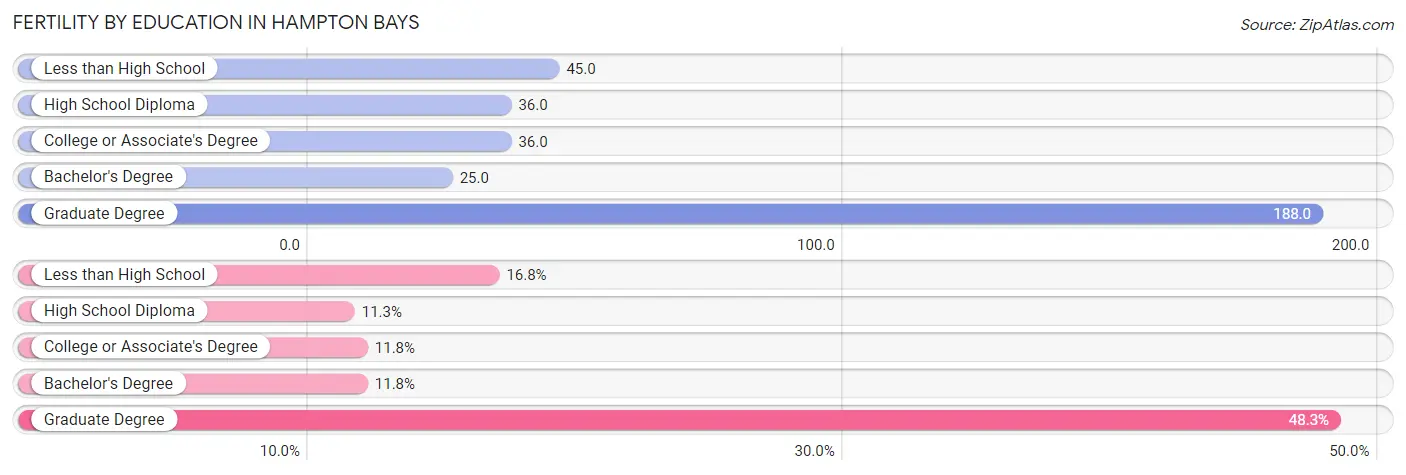
| Educational Attainment | Women with Births | Births / 1,000 Women |
| Less than High School | 34 (16.8%) | 45.0 |
| High School Diploma | 23 (11.3%) | 36.0 |
| College or Associate's Degree | 24 (11.8%) | 36.0 |
| Bachelor's Degree | 24 (11.8%) | 25.0 |
| Graduate Degree | 98 (48.3%) | 188.0 |
| Total | 203 (100.0%) | 58.0 |
Fertility by Education by Marriage Status in Hampton Bays
32.5% of women with births in Hampton Bays are unmarried. Women with the educational attainment of bachelor's degree are most likely to be married with 100.0% of them married at childbirth, while women with the educational attainment of less than high school are least likely to be married with 100.0% of them unmarried at childbirth.
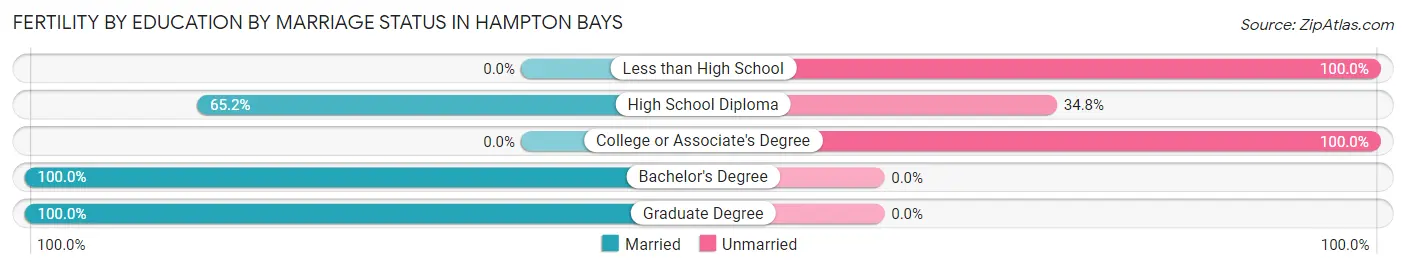
| Educational Attainment | Married | Unmarried |
| Less than High School | 0 (0.0%) | 34 (100.0%) |
| High School Diploma | 15 (65.2%) | 8 (34.8%) |
| College or Associate's Degree | 0 (0.0%) | 24 (100.0%) |
| Bachelor's Degree | 24 (100.0%) | 0 (0.0%) |
| Graduate Degree | 98 (100.0%) | 0 (0.0%) |
| Total | 137 (67.5%) | 66 (32.5%) |
Income in Hampton Bays
Income Overview in Hampton Bays
Per Capita Income in Hampton Bays is $58,765, while median incomes of families and households are $135,382 and $116,526 respectively.
| Characteristic | Number | Measure |
| Per Capita Income | 16,939 | $58,765 |
| Median Family Income | 4,442 | $135,382 |
| Mean Family Income | 4,442 | $165,034 |
| Median Household Income | 6,326 | $116,526 |
| Mean Household Income | 6,326 | $155,936 |
| Income Deficit | 4,442 | $0 |
| Wage / Income Gap (%) | 16,939 | 9.44% |
| Wage / Income Gap ($) | 16,939 | 90.56¢ per $1 |
| Gini / Inequality Index | 16,939 | 0.46 |
Earnings by Sex in Hampton Bays
Average Earnings in Hampton Bays are $50,077, $52,049 for men and $47,138 for women, a difference of 9.4%.
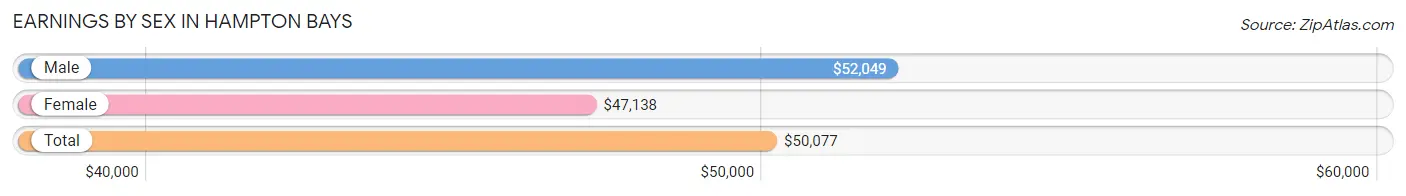
| Sex | Number | Average Earnings |
| Male | 5,205 (56.2%) | $52,049 |
| Female | 4,054 (43.8%) | $47,138 |
| Total | 9,259 (100.0%) | $50,077 |
Earnings by Sex by Income Bracket in Hampton Bays
The most common earnings brackets in Hampton Bays are $100,000+ for men (1,518 | 29.2%) and $100,000+ for women (624 | 15.4%).
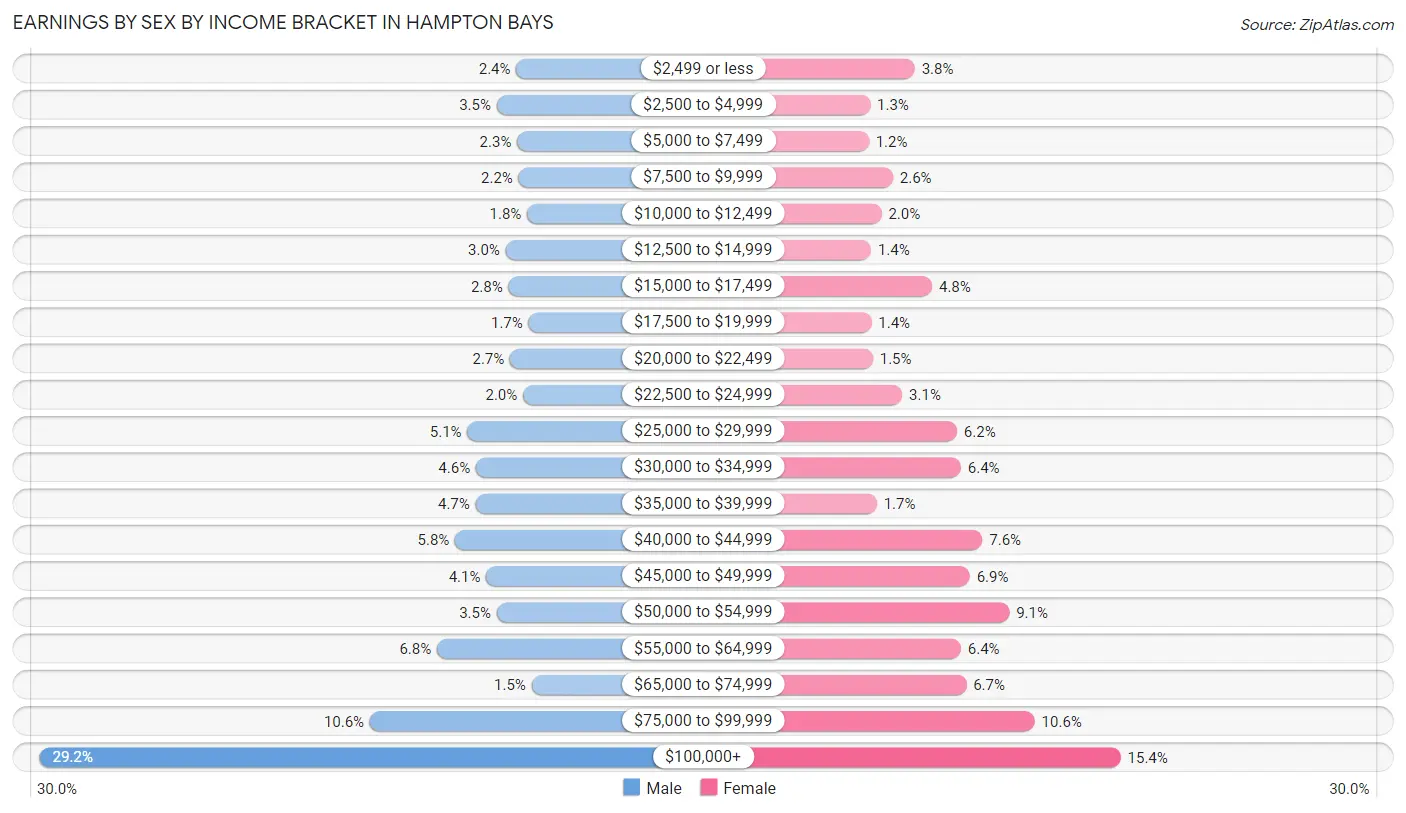
| Income | Male | Female |
| $2,499 or less | 123 (2.4%) | 155 (3.8%) |
| $2,500 to $4,999 | 180 (3.5%) | 53 (1.3%) |
| $5,000 to $7,499 | 120 (2.3%) | 50 (1.2%) |
| $7,500 to $9,999 | 116 (2.2%) | 105 (2.6%) |
| $10,000 to $12,499 | 91 (1.8%) | 79 (1.9%) |
| $12,500 to $14,999 | 154 (3.0%) | 55 (1.4%) |
| $15,000 to $17,499 | 146 (2.8%) | 194 (4.8%) |
| $17,500 to $19,999 | 87 (1.7%) | 56 (1.4%) |
| $20,000 to $22,499 | 141 (2.7%) | 59 (1.5%) |
| $22,500 to $24,999 | 103 (2.0%) | 126 (3.1%) |
| $25,000 to $29,999 | 266 (5.1%) | 251 (6.2%) |
| $30,000 to $34,999 | 241 (4.6%) | 260 (6.4%) |
| $35,000 to $39,999 | 242 (4.6%) | 68 (1.7%) |
| $40,000 to $44,999 | 302 (5.8%) | 309 (7.6%) |
| $45,000 to $49,999 | 211 (4.1%) | 280 (6.9%) |
| $50,000 to $54,999 | 180 (3.5%) | 370 (9.1%) |
| $55,000 to $64,999 | 355 (6.8%) | 260 (6.4%) |
| $65,000 to $74,999 | 78 (1.5%) | 272 (6.7%) |
| $75,000 to $99,999 | 551 (10.6%) | 428 (10.6%) |
| $100,000+ | 1,518 (29.2%) | 624 (15.4%) |
| Total | 5,205 (100.0%) | 4,054 (100.0%) |
Earnings by Sex by Educational Attainment in Hampton Bays
Average earnings in Hampton Bays are $59,242 for men and $51,930 for women, a difference of 12.3%. Men with an educational attainment of graduate degree enjoy the highest average annual earnings of $120,050, while those with less than high school education earn the least with $39,848. Women with an educational attainment of graduate degree earn the most with the average annual earnings of $90,054, while those with less than high school education have the smallest earnings of $32,519.
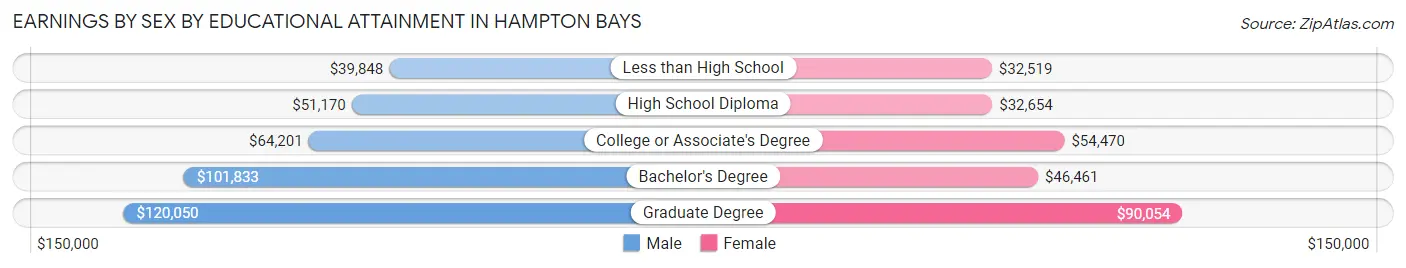
| Educational Attainment | Male Income | Female Income |
| Less than High School | $39,848 | $32,519 |
| High School Diploma | $51,170 | $32,654 |
| College or Associate's Degree | $64,201 | $54,470 |
| Bachelor's Degree | $101,833 | $46,461 |
| Graduate Degree | $120,050 | $90,054 |
| Total | $59,242 | $51,930 |
Family Income in Hampton Bays
Family Income Brackets in Hampton Bays
According to the Hampton Bays family income data, there are 1,350 families falling into the $200,000+ income range, which is the most common income bracket and makes up 30.4% of all families. Conversely, the $10,000 to $14,999 income bracket is the least frequent group with only 13 families (0.3%) belonging to this category.
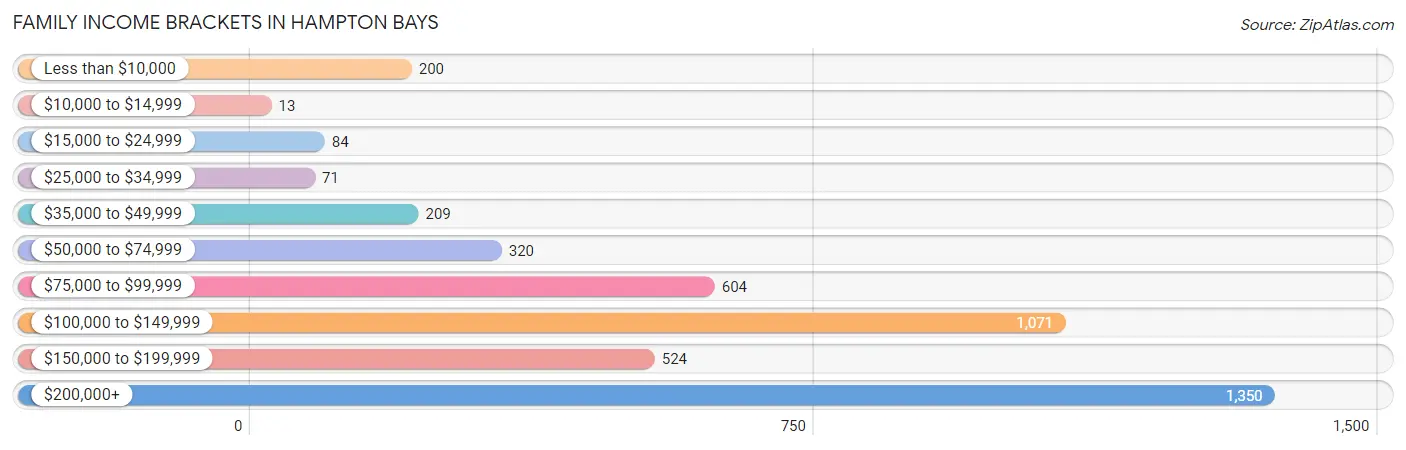
| Income Bracket | # Families | % Families |
| Less than $10,000 | 200 | 4.5% |
| $10,000 to $14,999 | 13 | 0.3% |
| $15,000 to $24,999 | 84 | 1.9% |
| $25,000 to $34,999 | 71 | 1.6% |
| $35,000 to $49,999 | 209 | 4.7% |
| $50,000 to $74,999 | 320 | 7.2% |
| $75,000 to $99,999 | 604 | 13.6% |
| $100,000 to $149,999 | 1,071 | 24.1% |
| $150,000 to $199,999 | 524 | 11.8% |
| $200,000+ | 1,350 | 30.4% |
Family Income by Famaliy Size in Hampton Bays
4-person families (948 | 21.3%) account for the highest median family income in Hampton Bays with $203,152 per family, while 2-person families (1,932 | 43.5%) have the highest median income of $65,521 per family member.
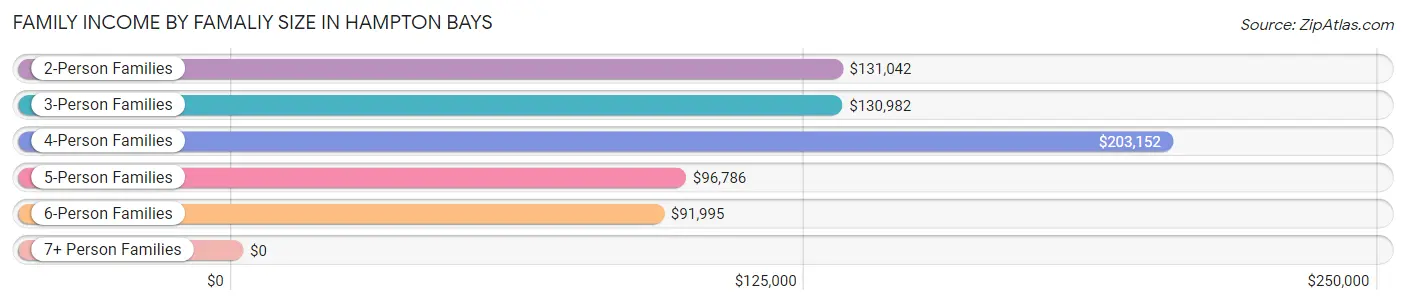
| Income Bracket | # Families | Median Income |
| 2-Person Families | 1,932 (43.5%) | $131,042 |
| 3-Person Families | 1,151 (25.9%) | $130,982 |
| 4-Person Families | 948 (21.3%) | $203,152 |
| 5-Person Families | 272 (6.1%) | $96,786 |
| 6-Person Families | 75 (1.7%) | $91,995 |
| 7+ Person Families | 64 (1.4%) | $0 |
| Total | 4,442 (100.0%) | $135,382 |
Family Income by Number of Earners in Hampton Bays
The median family income in Hampton Bays is $135,382, with families comprising 2 earners (2,080) having the highest median family income of $165,250, while families with 1 earner (896) have the lowest median family income of $92,059, accounting for 46.8% and 20.2% of families, respectively.
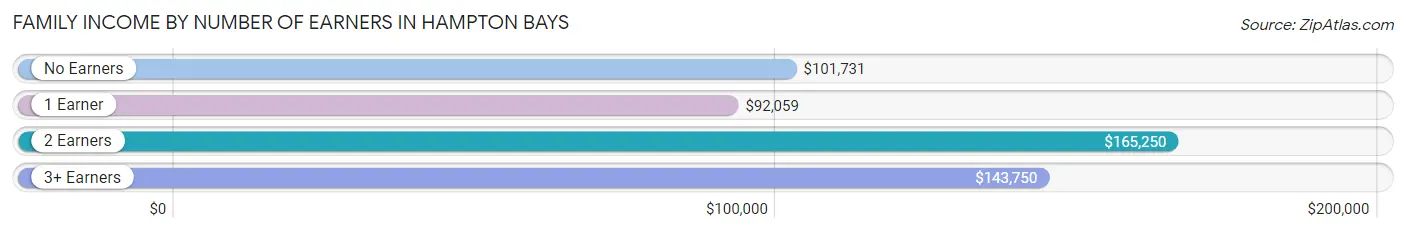
| Number of Earners | # Families | Median Income |
| No Earners | 748 (16.8%) | $101,731 |
| 1 Earner | 896 (20.2%) | $92,059 |
| 2 Earners | 2,080 (46.8%) | $165,250 |
| 3+ Earners | 718 (16.2%) | $143,750 |
| Total | 4,442 (100.0%) | $135,382 |
Household Income in Hampton Bays
Household Income Brackets in Hampton Bays
With 1,733 households falling in the category, the $200,000+ income range is the most frequent in Hampton Bays, accounting for 27.4% of all households. In contrast, only 95 households (1.5%) fall into the $10,000 to $14,999 income bracket, making it the least populous group.
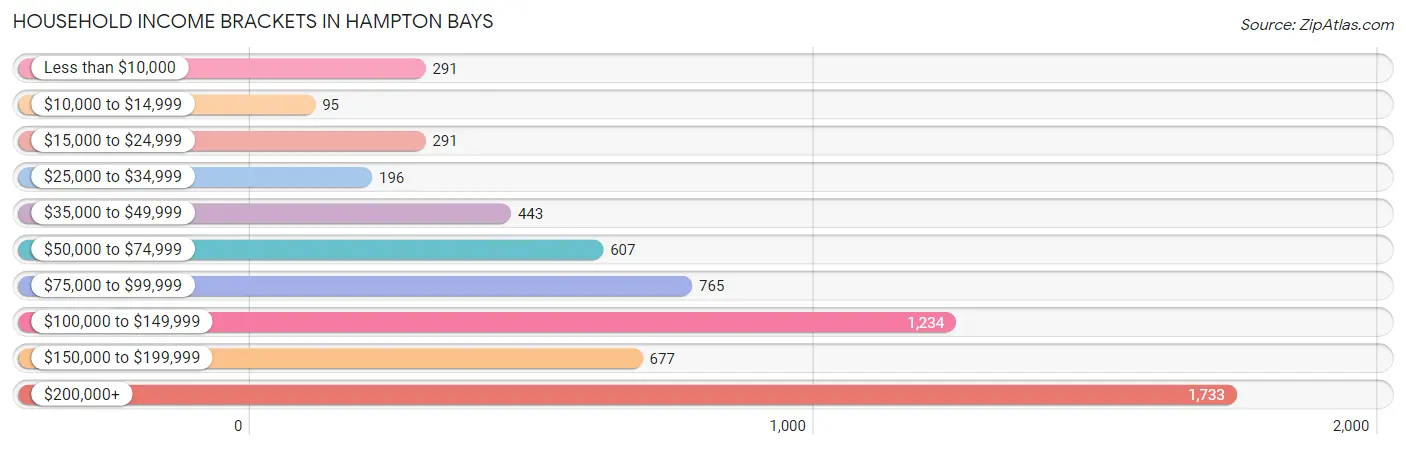
| Income Bracket | # Households | % Households |
| Less than $10,000 | 291 | 4.6% |
| $10,000 to $14,999 | 95 | 1.5% |
| $15,000 to $24,999 | 291 | 4.6% |
| $25,000 to $34,999 | 196 | 3.1% |
| $35,000 to $49,999 | 443 | 7.0% |
| $50,000 to $74,999 | 607 | 9.6% |
| $75,000 to $99,999 | 765 | 12.1% |
| $100,000 to $149,999 | 1,234 | 19.5% |
| $150,000 to $199,999 | 677 | 10.7% |
| $200,000+ | 1,733 | 27.4% |
Household Income by Householder Age in Hampton Bays
The median household income in Hampton Bays is $116,526, with the highest median household income of $142,897 found in the 45 to 64 years age bracket for the primary householder. A total of 2,634 households (41.6%) fall into this category.
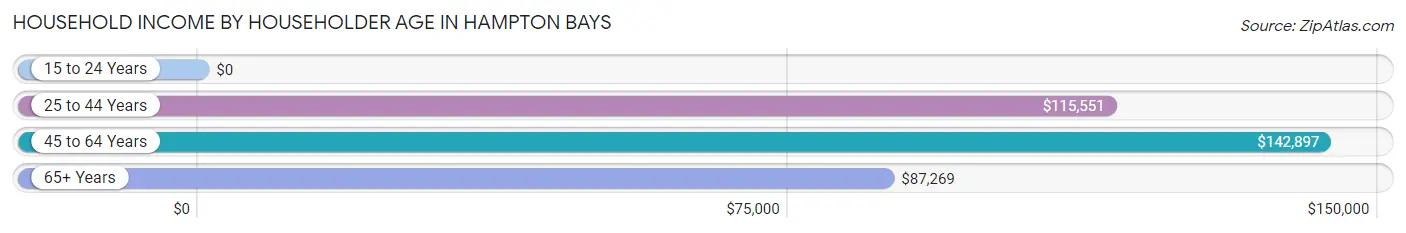
| Income Bracket | # Households | Median Income |
| 15 to 24 Years | 0 (0.0%) | $0 |
| 25 to 44 Years | 1,535 (24.3%) | $115,551 |
| 45 to 64 Years | 2,634 (41.6%) | $142,897 |
| 65+ Years | 2,157 (34.1%) | $87,269 |
| Total | 6,326 (100.0%) | $116,526 |
Poverty in Hampton Bays
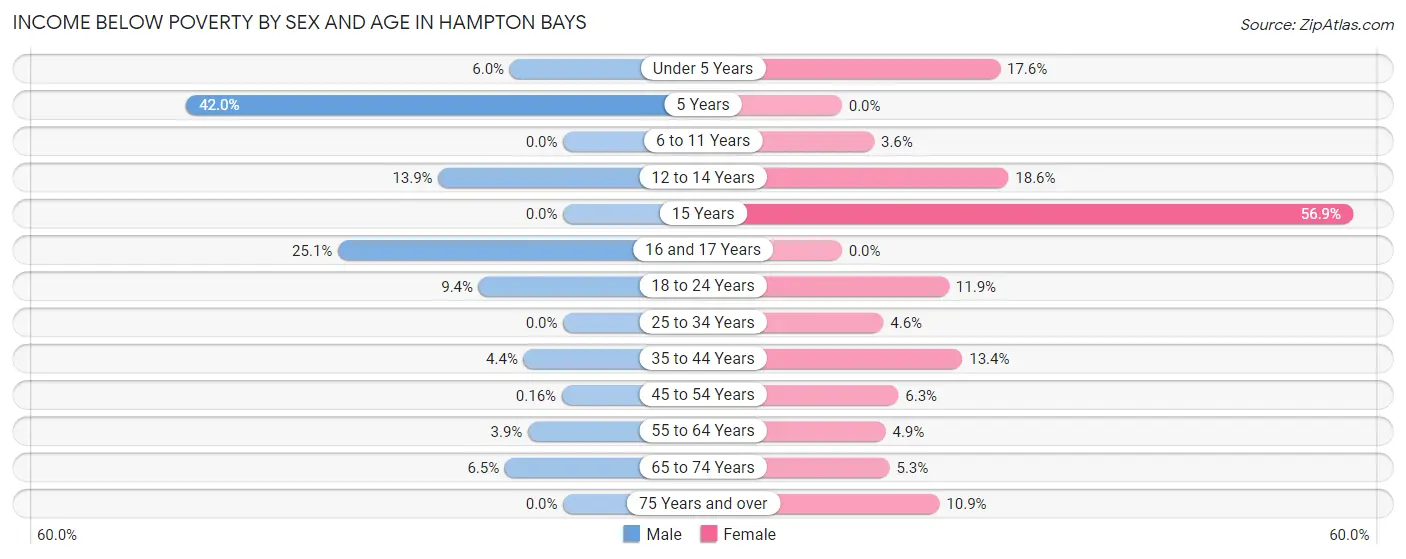
Income Below Poverty by Sex and Age in Hampton Bays
With 5.2% poverty level for males and 9.1% for females among the residents of Hampton Bays, 5 year old males and 15 year old females are the most vulnerable to poverty, with 21 males (42.0%) and 70 females (56.9%) in their respective age groups living below the poverty level.
| Age Bracket | Male | Female |
| Under 5 Years | 42 (5.9%) | 40 (17.6%) |
| 5 Years | 21 (42.0%) | 0 (0.0%) |
| 6 to 11 Years | 0 (0.0%) | 9 (3.6%) |
| 12 to 14 Years | 69 (13.9%) | 64 (18.5%) |
| 15 Years | 0 (0.0%) | 70 (56.9%) |
| 16 and 17 Years | 83 (25.1%) | 0 (0.0%) |
| 18 to 24 Years | 103 (9.4%) | 71 (11.9%) |
| 25 to 34 Years | 0 (0.0%) | 25 (4.6%) |
| 35 to 44 Years | 49 (4.4%) | 148 (13.4%) |
| 45 to 54 Years | 2 (0.2%) | 88 (6.3%) |
| 55 to 64 Years | 48 (3.9%) | 56 (4.9%) |
| 65 to 74 Years | 49 (6.5%) | 52 (5.3%) |
| 75 Years and over | 0 (0.0%) | 97 (10.9%) |
| Total | 466 (5.2%) | 720 (9.1%) |
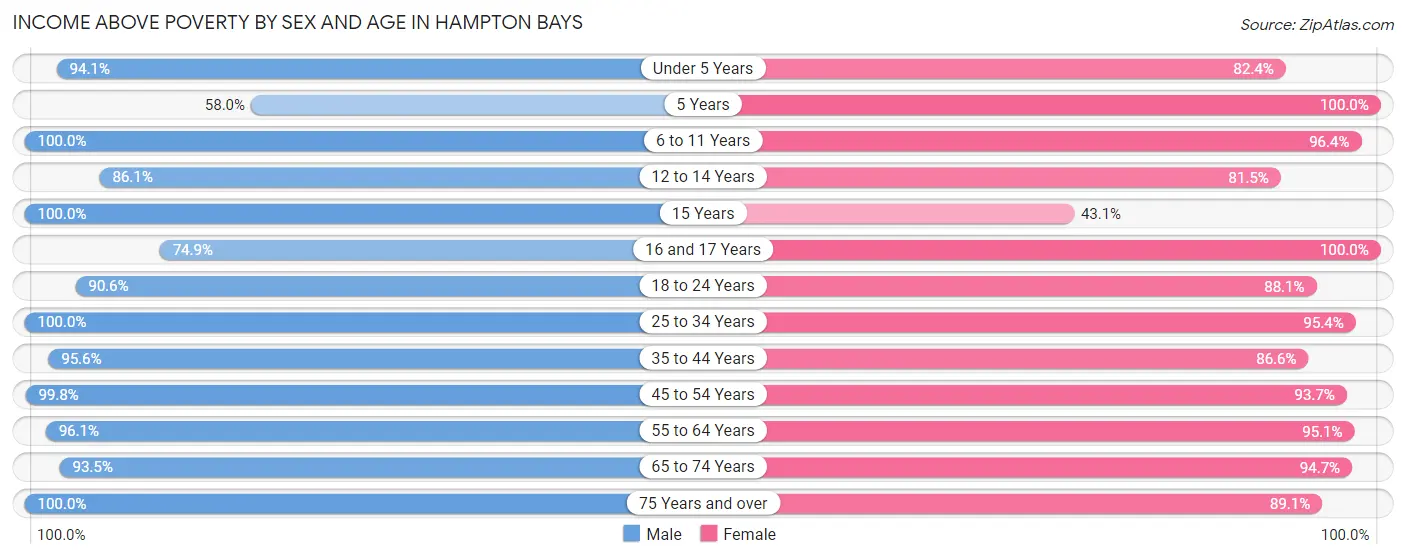
Income Above Poverty by Sex and Age in Hampton Bays
According to the poverty statistics in Hampton Bays, males aged 6 to 11 years and females aged 5 years are the age groups that are most secure financially, with 100.0% of males and 100.0% of females in these age groups living above the poverty line.
| Age Bracket | Male | Female |
| Under 5 Years | 664 (94.1%) | 187 (82.4%) |
| 5 Years | 29 (58.0%) | 71 (100.0%) |
| 6 to 11 Years | 395 (100.0%) | 242 (96.4%) |
| 12 to 14 Years | 427 (86.1%) | 281 (81.5%) |
| 15 Years | 27 (100.0%) | 53 (43.1%) |
| 16 and 17 Years | 248 (74.9%) | 216 (100.0%) |
| 18 to 24 Years | 992 (90.6%) | 524 (88.1%) |
| 25 to 34 Years | 863 (100.0%) | 515 (95.4%) |
| 35 to 44 Years | 1,063 (95.6%) | 955 (86.6%) |
| 45 to 54 Years | 1,270 (99.8%) | 1,308 (93.7%) |
| 55 to 64 Years | 1,178 (96.1%) | 1,095 (95.1%) |
| 65 to 74 Years | 706 (93.5%) | 926 (94.7%) |
| 75 Years and over | 703 (100.0%) | 795 (89.1%) |
| Total | 8,565 (94.8%) | 7,168 (90.9%) |
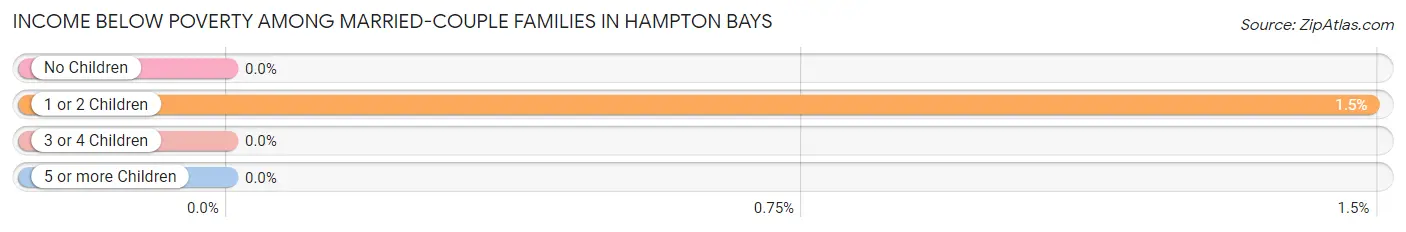
Income Below Poverty Among Married-Couple Families in Hampton Bays
The poverty statistics for married-couple families in Hampton Bays show that 0.6% or 21 of the total 3,486 families live below the poverty line. Families with 1 or 2 children have the highest poverty rate of 1.5%, comprising of 21 families. On the other hand, families with no children have the lowest poverty rate of 0.0%, which includes 0 families.
| Children | Above Poverty | Below Poverty |
| No Children | 1,998 (100.0%) | 0 (0.0%) |
| 1 or 2 Children | 1,384 (98.5%) | 21 (1.5%) |
| 3 or 4 Children | 83 (100.0%) | 0 (0.0%) |
| 5 or more Children | 0 (0.0%) | 0 (0.0%) |
| Total | 3,465 (99.4%) | 21 (0.6%) |
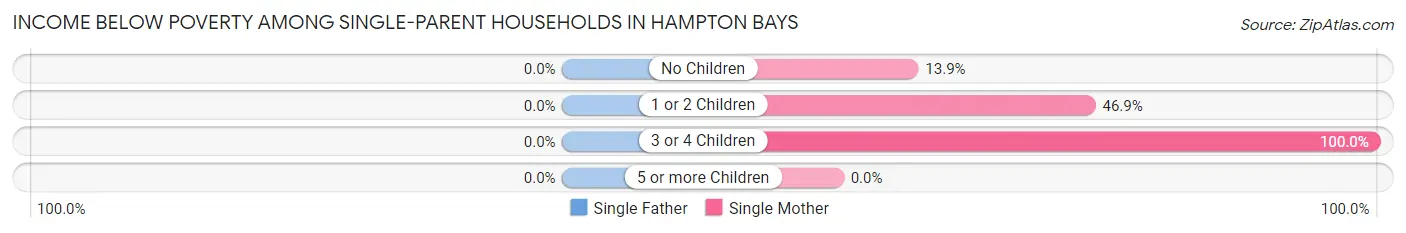
Income Below Poverty Among Single-Parent Households in Hampton Bays
| Children | Single Father | Single Mother |
| No Children | 0 (0.0%) | 49 (13.9%) |
| 1 or 2 Children | 0 (0.0%) | 144 (46.9%) |
| 3 or 4 Children | 0 (0.0%) | 24 (100.0%) |
| 5 or more Children | 0 (0.0%) | 0 (0.0%) |
| Total | 0 (0.0%) | 217 (31.8%) |
Income Below Poverty Among Married-Couple vs Single-Parent Households in Hampton Bays
The poverty data for Hampton Bays shows that 21 of the married-couple family households (0.6%) and 217 of the single-parent households (22.7%) are living below the poverty level. Within the married-couple family households, those with 1 or 2 children have the highest poverty rate, with 21 households (1.5%) falling below the poverty line. Among the single-parent households, those with 3 or 4 children have the highest poverty rate, with 24 household (61.5%) living below poverty.
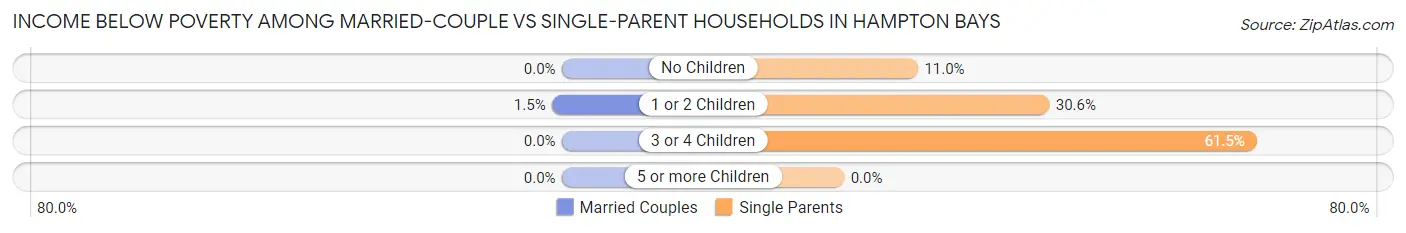
| Children | Married-Couple Families | Single-Parent Households |
| No Children | 0 (0.0%) | 49 (11.0%) |
| 1 or 2 Children | 21 (1.5%) | 144 (30.6%) |
| 3 or 4 Children | 0 (0.0%) | 24 (61.5%) |
| 5 or more Children | 0 (0.0%) | 0 (0.0%) |
| Total | 21 (0.6%) | 217 (22.7%) |
Employment Characteristics in Hampton Bays
Employment by Class of Employer in Hampton Bays
Among the 8,189 employed individuals in Hampton Bays, private company employees (5,178 | 63.2%), self-employed (incorporated) (938 | 11.5%), and local government employees (614 | 7.5%) make up the most common classes of employment.
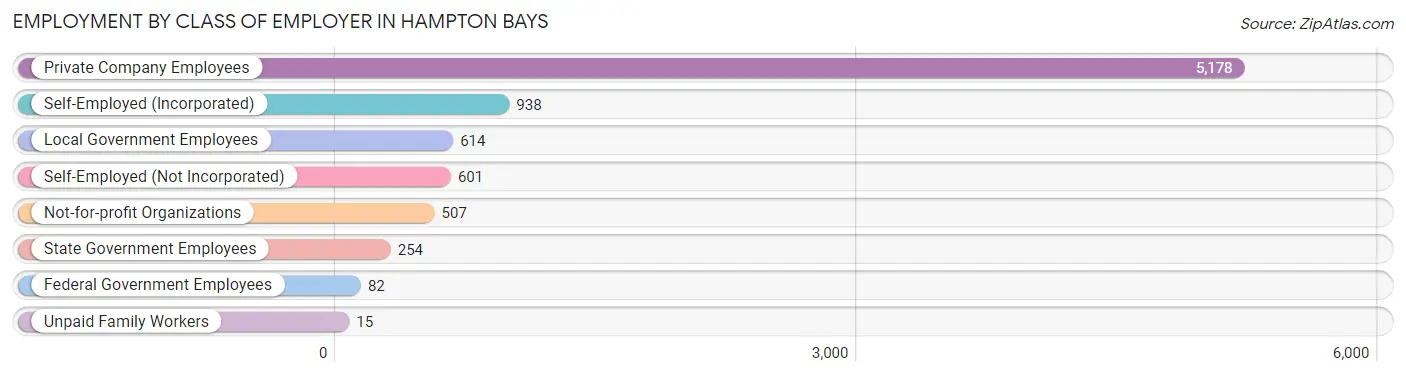
| Employer Class | # Employees | % Employees |
| Private Company Employees | 5,178 | 63.2% |
| Self-Employed (Incorporated) | 938 | 11.5% |
| Self-Employed (Not Incorporated) | 601 | 7.3% |
| Not-for-profit Organizations | 507 | 6.2% |
| Local Government Employees | 614 | 7.5% |
| State Government Employees | 254 | 3.1% |
| Federal Government Employees | 82 | 1.0% |
| Unpaid Family Workers | 15 | 0.2% |
| Total | 8,189 | 100.0% |
Employment Status by Age in Hampton Bays
According to the labor force statistics for Hampton Bays, out of the total population over 16 years of age (14,241), 62.2% or 8,858 individuals are in the labor force, with 3.4% or 301 of them unemployed. The age group with the highest labor force participation rate is 25 to 29 years, with 97.7% or 677 individuals in the labor force. Within the labor force, the 16 to 19 years age range has the highest percentage of unemployed individuals, with 22.5% or 28 of them being unemployed.
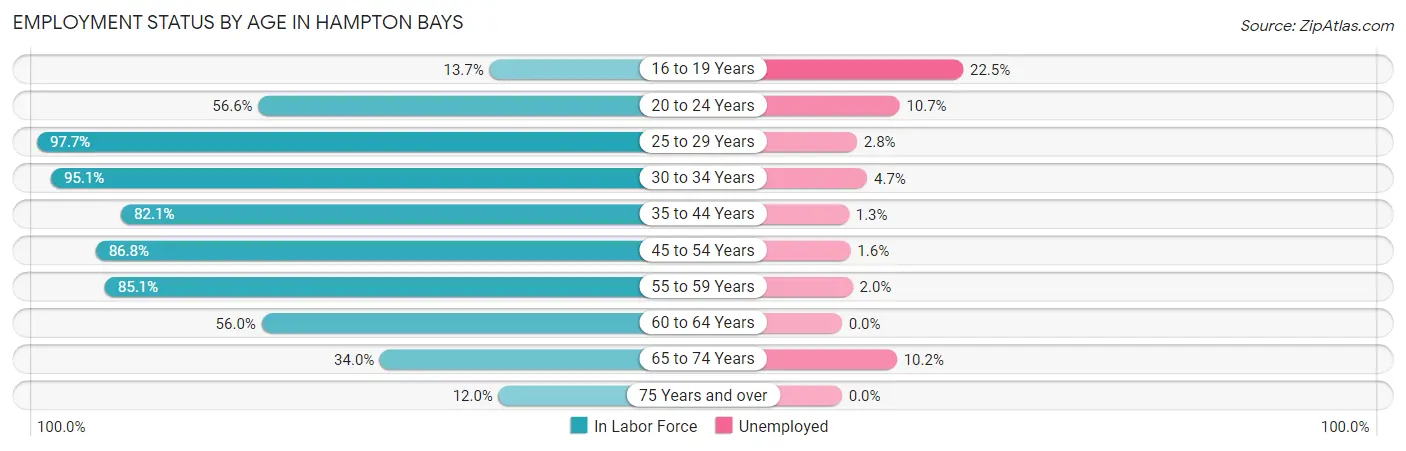
| Age Bracket | In Labor Force | Unemployed |
| 16 to 19 Years | 124 (13.7%) | 28 (22.5%) |
| 20 to 24 Years | 760 (56.6%) | 81 (10.7%) |
| 25 to 29 Years | 677 (97.7%) | 19 (2.8%) |
| 30 to 34 Years | 675 (95.1%) | 32 (4.7%) |
| 35 to 44 Years | 1,819 (82.1%) | 24 (1.3%) |
| 45 to 54 Years | 2,316 (86.8%) | 37 (1.6%) |
| 55 to 59 Years | 1,107 (85.1%) | 22 (2.0%) |
| 60 to 64 Years | 603 (56.0%) | 0 (0.0%) |
| 65 to 74 Years | 589 (34.0%) | 60 (10.2%) |
| 75 Years and over | 191 (12.0%) | 0 (0.0%) |
| Total | 8,858 (62.2%) | 301 (3.4%) |
Employment Status by Educational Attainment in Hampton Bays
According to labor force statistics for Hampton Bays, 83.1% of individuals (7,199) out of the total population between 25 and 64 years of age (8,663) are in the labor force, with 1.8% or 130 of them being unemployed. The group with the highest labor force participation rate are those with the educational attainment of college / associate degree, with 87.0% or 1,890 individuals in the labor force. Within the labor force, individuals with less than high school education have the highest percentage of unemployment, with 4.0% or 39 of them being unemployed.
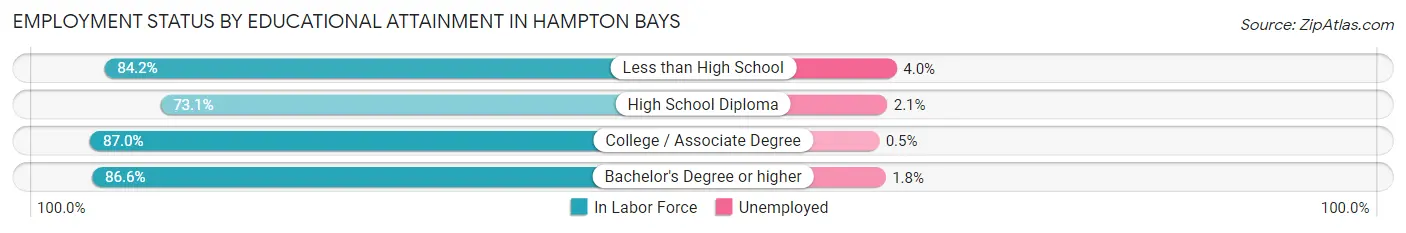
| Educational Attainment | In Labor Force | Unemployed |
| Less than High School | 970 (84.2%) | 46 (4.0%) |
| High School Diploma | 1,556 (73.1%) | 45 (2.1%) |
| College / Associate Degree | 1,890 (87.0%) | 11 (0.5%) |
| Bachelor's Degree or higher | 2,781 (86.6%) | 58 (1.8%) |
| Total | 7,199 (83.1%) | 156 (1.8%) |
Employment Occupations by Sex in Hampton Bays
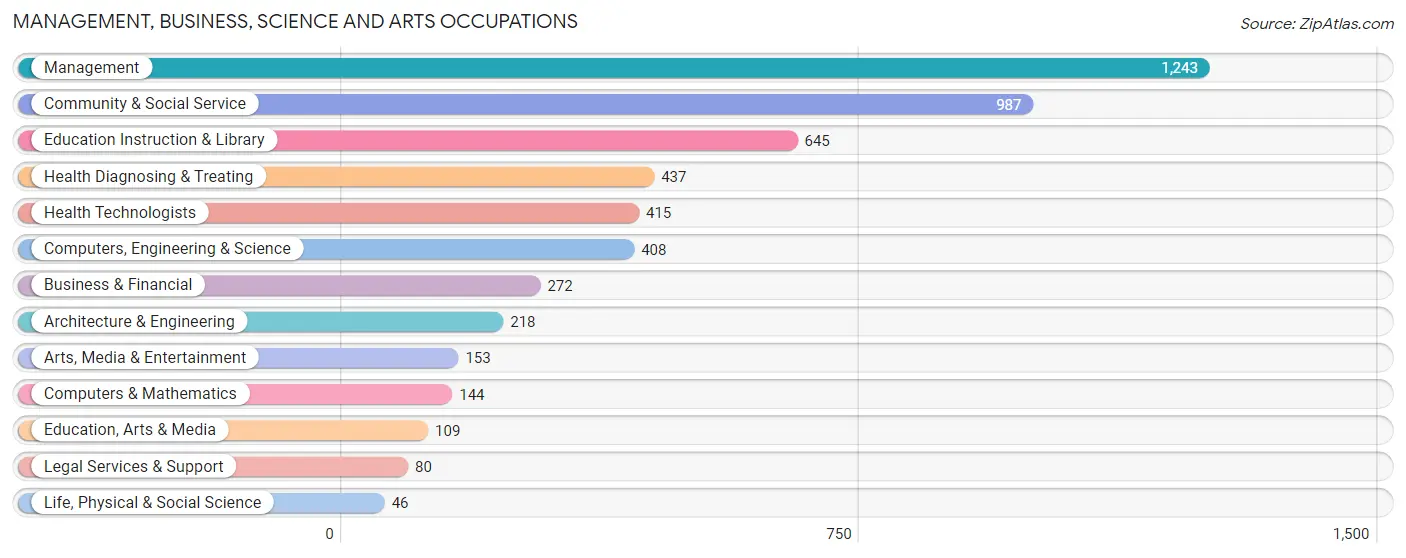
Management, Business, Science and Arts Occupations
The most common Management, Business, Science and Arts occupations in Hampton Bays are Management (1,243 | 14.5%), Community & Social Service (987 | 11.5%), Education Instruction & Library (645 | 7.5%), Health Diagnosing & Treating (437 | 5.1%), and Health Technologists (415 | 4.9%).
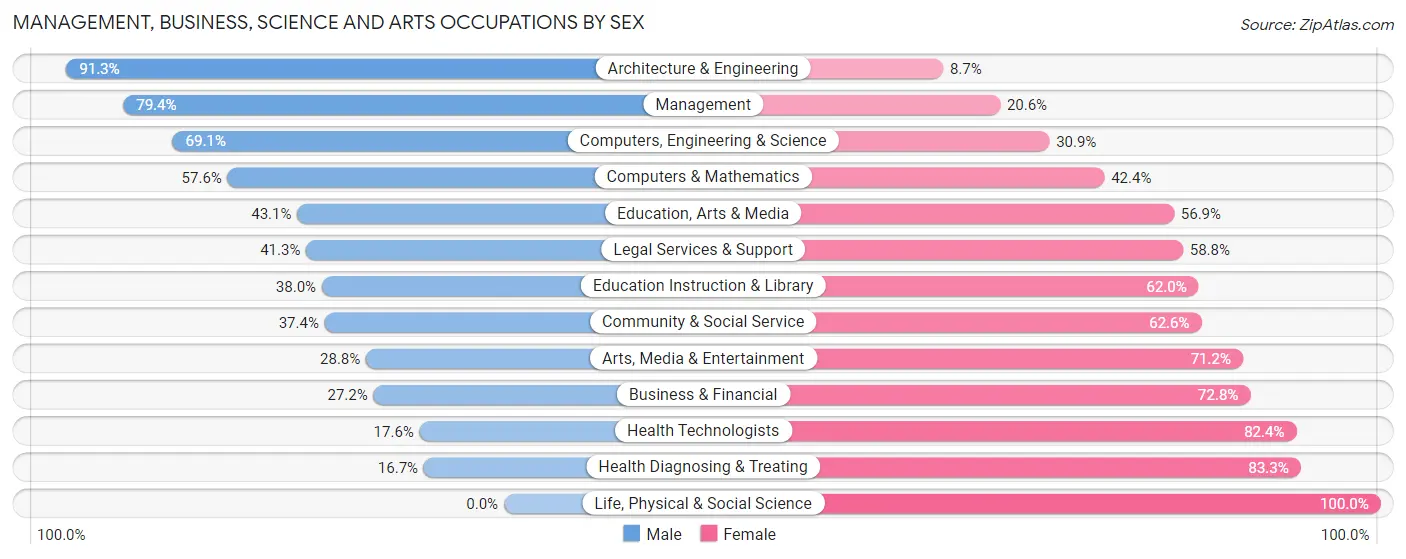
Management, Business, Science and Arts Occupations by Sex
Within the Management, Business, Science and Arts occupations in Hampton Bays, the most male-oriented occupations are Architecture & Engineering (91.3%), Management (79.4%), and Computers, Engineering & Science (69.1%), while the most female-oriented occupations are Life, Physical & Social Science (100.0%), Health Diagnosing & Treating (83.3%), and Health Technologists (82.4%).
| Occupation | Male | Female |
| Management | 987 (79.4%) | 256 (20.6%) |
| Business & Financial | 74 (27.2%) | 198 (72.8%) |
| Computers, Engineering & Science | 282 (69.1%) | 126 (30.9%) |
| Computers & Mathematics | 83 (57.6%) | 61 (42.4%) |
| Architecture & Engineering | 199 (91.3%) | 19 (8.7%) |
| Life, Physical & Social Science | 0 (0.0%) | 46 (100.0%) |
| Community & Social Service | 369 (37.4%) | 618 (62.6%) |
| Education, Arts & Media | 47 (43.1%) | 62 (56.9%) |
| Legal Services & Support | 33 (41.2%) | 47 (58.8%) |
| Education Instruction & Library | 245 (38.0%) | 400 (62.0%) |
| Arts, Media & Entertainment | 44 (28.8%) | 109 (71.2%) |
| Health Diagnosing & Treating | 73 (16.7%) | 364 (83.3%) |
| Health Technologists | 73 (17.6%) | 342 (82.4%) |
| Total (Category) | 1,785 (53.3%) | 1,562 (46.7%) |
| Total (Overall) | 4,784 (55.9%) | 3,770 (44.1%) |
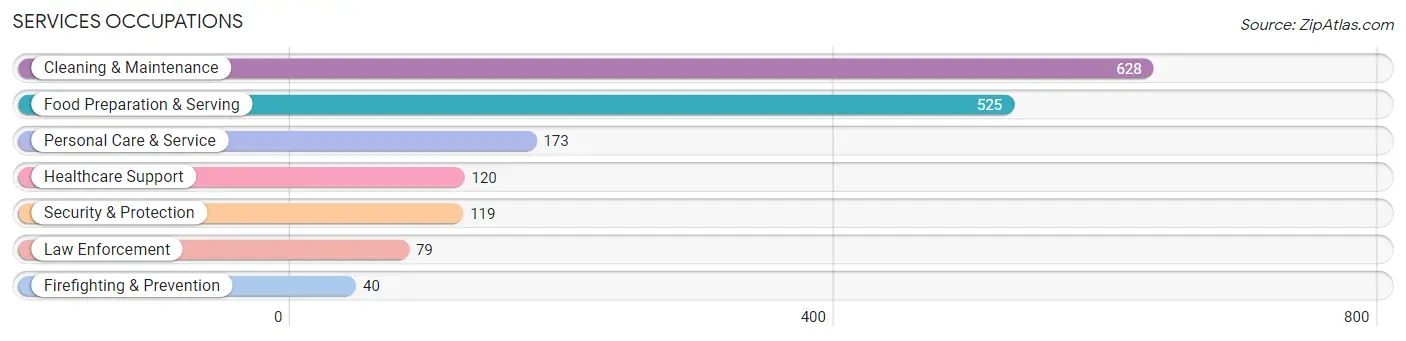
Services Occupations
The most common Services occupations in Hampton Bays are Cleaning & Maintenance (628 | 7.3%), Food Preparation & Serving (525 | 6.1%), Personal Care & Service (173 | 2.0%), Healthcare Support (120 | 1.4%), and Security & Protection (119 | 1.4%).
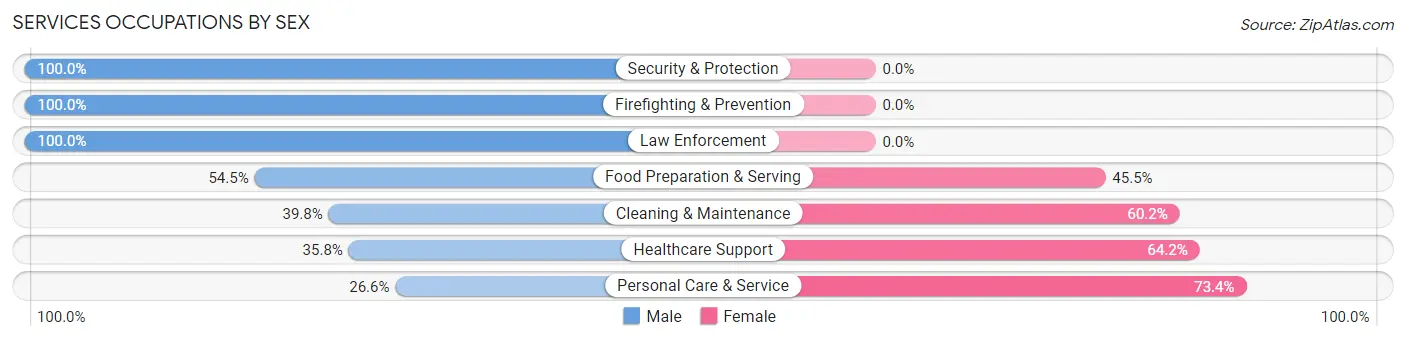
Services Occupations by Sex
Within the Services occupations in Hampton Bays, the most male-oriented occupations are Security & Protection (100.0%), Firefighting & Prevention (100.0%), and Law Enforcement (100.0%), while the most female-oriented occupations are Personal Care & Service (73.4%), Healthcare Support (64.2%), and Cleaning & Maintenance (60.2%).
| Occupation | Male | Female |
| Healthcare Support | 43 (35.8%) | 77 (64.2%) |
| Security & Protection | 119 (100.0%) | 0 (0.0%) |
| Firefighting & Prevention | 40 (100.0%) | 0 (0.0%) |
| Law Enforcement | 79 (100.0%) | 0 (0.0%) |
| Food Preparation & Serving | 286 (54.5%) | 239 (45.5%) |
| Cleaning & Maintenance | 250 (39.8%) | 378 (60.2%) |
| Personal Care & Service | 46 (26.6%) | 127 (73.4%) |
| Total (Category) | 744 (47.5%) | 821 (52.5%) |
| Total (Overall) | 4,784 (55.9%) | 3,770 (44.1%) |
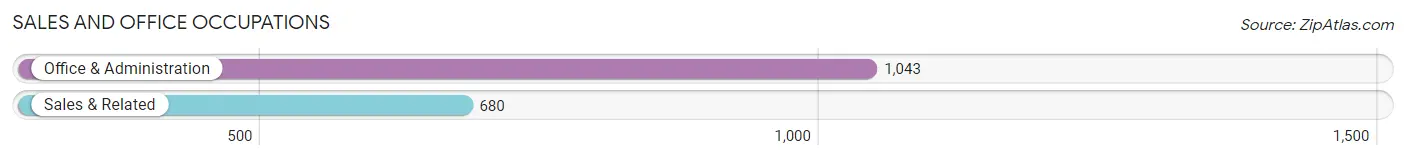
Sales and Office Occupations
The most common Sales and Office occupations in Hampton Bays are Office & Administration (1,043 | 12.2%), and Sales & Related (680 | 8.0%).
Sales and Office Occupations by Sex
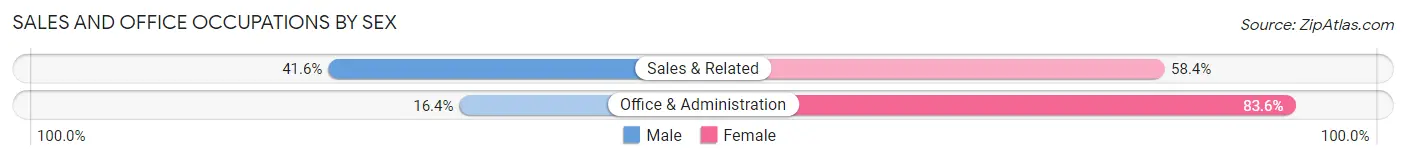
| Occupation | Male | Female |
| Sales & Related | 283 (41.6%) | 397 (58.4%) |
| Office & Administration | 171 (16.4%) | 872 (83.6%) |
| Total (Category) | 454 (26.4%) | 1,269 (73.7%) |
| Total (Overall) | 4,784 (55.9%) | 3,770 (44.1%) |
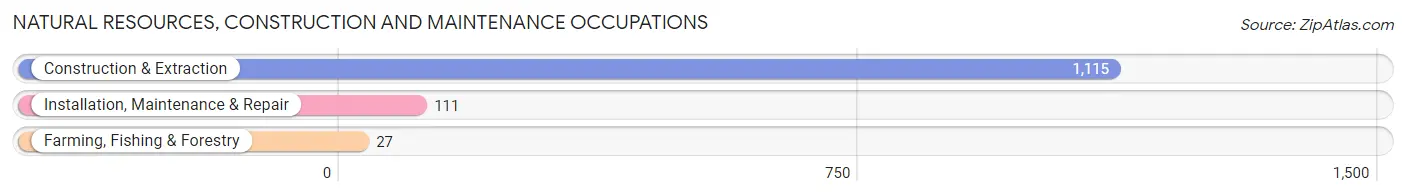
Natural Resources, Construction and Maintenance Occupations
The most common Natural Resources, Construction and Maintenance occupations in Hampton Bays are Construction & Extraction (1,115 | 13.0%), Installation, Maintenance & Repair (111 | 1.3%), and Farming, Fishing & Forestry (27 | 0.3%).
Natural Resources, Construction and Maintenance Occupations by Sex
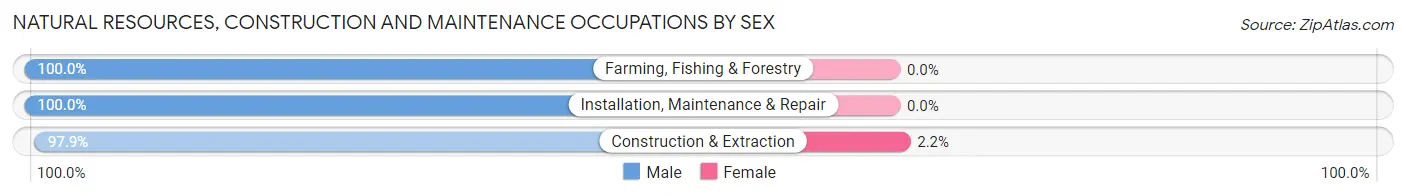
| Occupation | Male | Female |
| Farming, Fishing & Forestry | 27 (100.0%) | 0 (0.0%) |
| Construction & Extraction | 1,091 (97.9%) | 24 (2.1%) |
| Installation, Maintenance & Repair | 111 (100.0%) | 0 (0.0%) |
| Total (Category) | 1,229 (98.1%) | 24 (1.9%) |
| Total (Overall) | 4,784 (55.9%) | 3,770 (44.1%) |
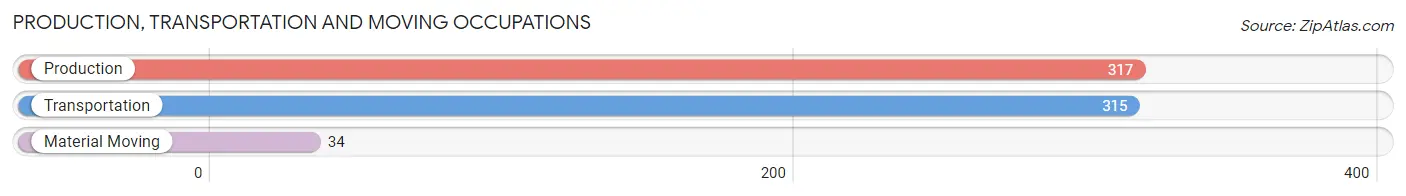
Production, Transportation and Moving Occupations
The most common Production, Transportation and Moving occupations in Hampton Bays are Production (317 | 3.7%), Transportation (315 | 3.7%), and Material Moving (34 | 0.4%).
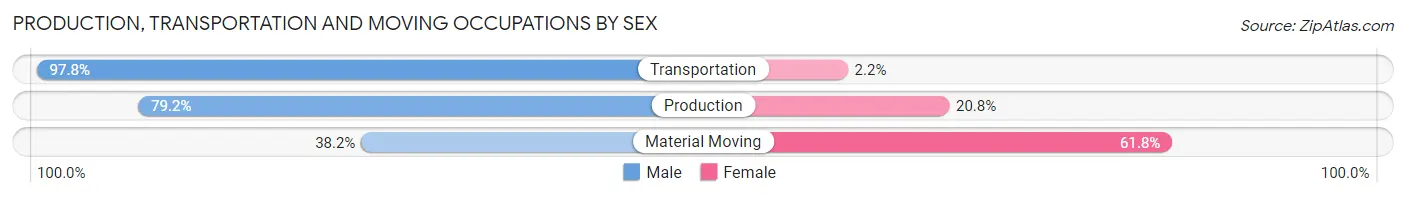
Production, Transportation and Moving Occupations by Sex
| Occupation | Male | Female |
| Production | 251 (79.2%) | 66 (20.8%) |
| Transportation | 308 (97.8%) | 7 (2.2%) |
| Material Moving | 13 (38.2%) | 21 (61.8%) |
| Total (Category) | 572 (85.9%) | 94 (14.1%) |
| Total (Overall) | 4,784 (55.9%) | 3,770 (44.1%) |
Employment Industries by Sex in Hampton Bays
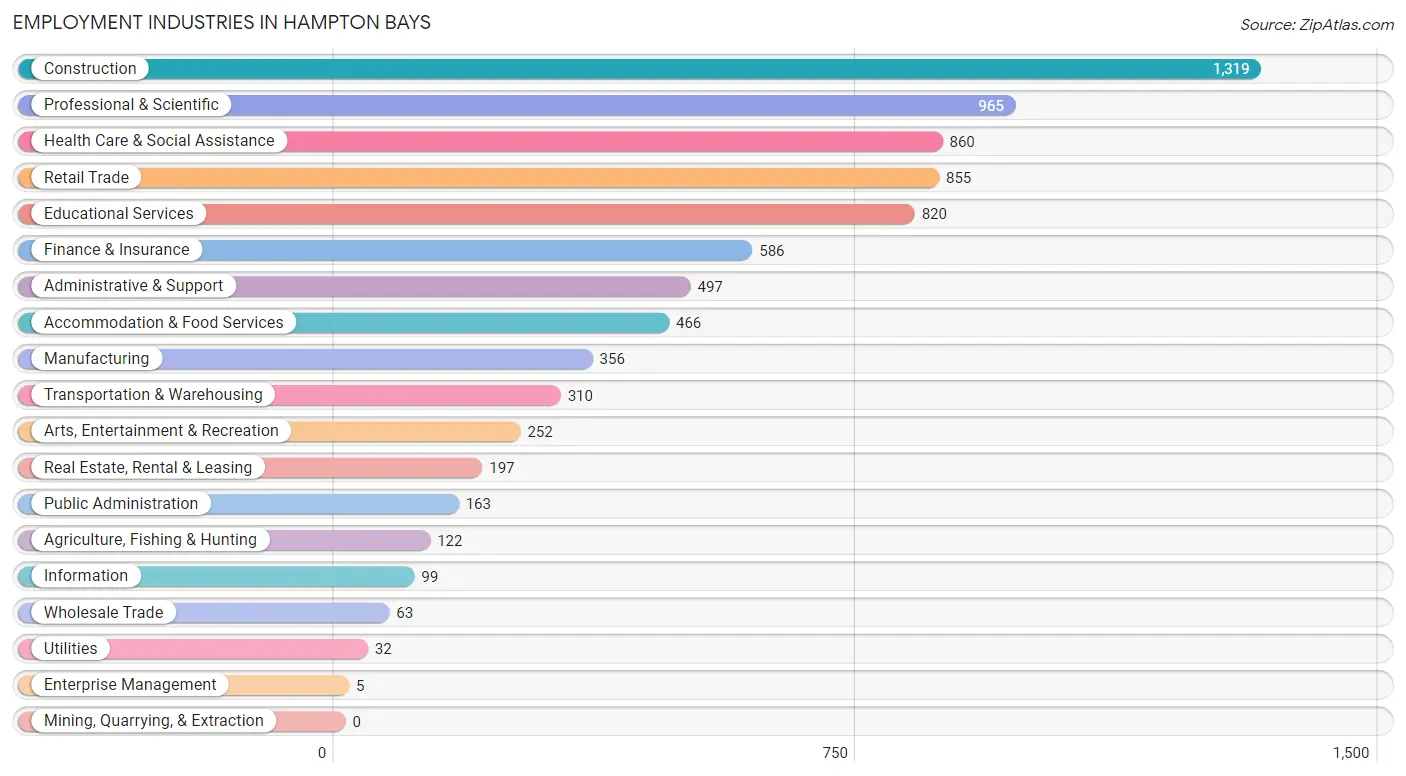
Employment Industries in Hampton Bays
The major employment industries in Hampton Bays include Construction (1,319 | 15.4%), Professional & Scientific (965 | 11.3%), Health Care & Social Assistance (860 | 10.1%), Retail Trade (855 | 10.0%), and Educational Services (820 | 9.6%).
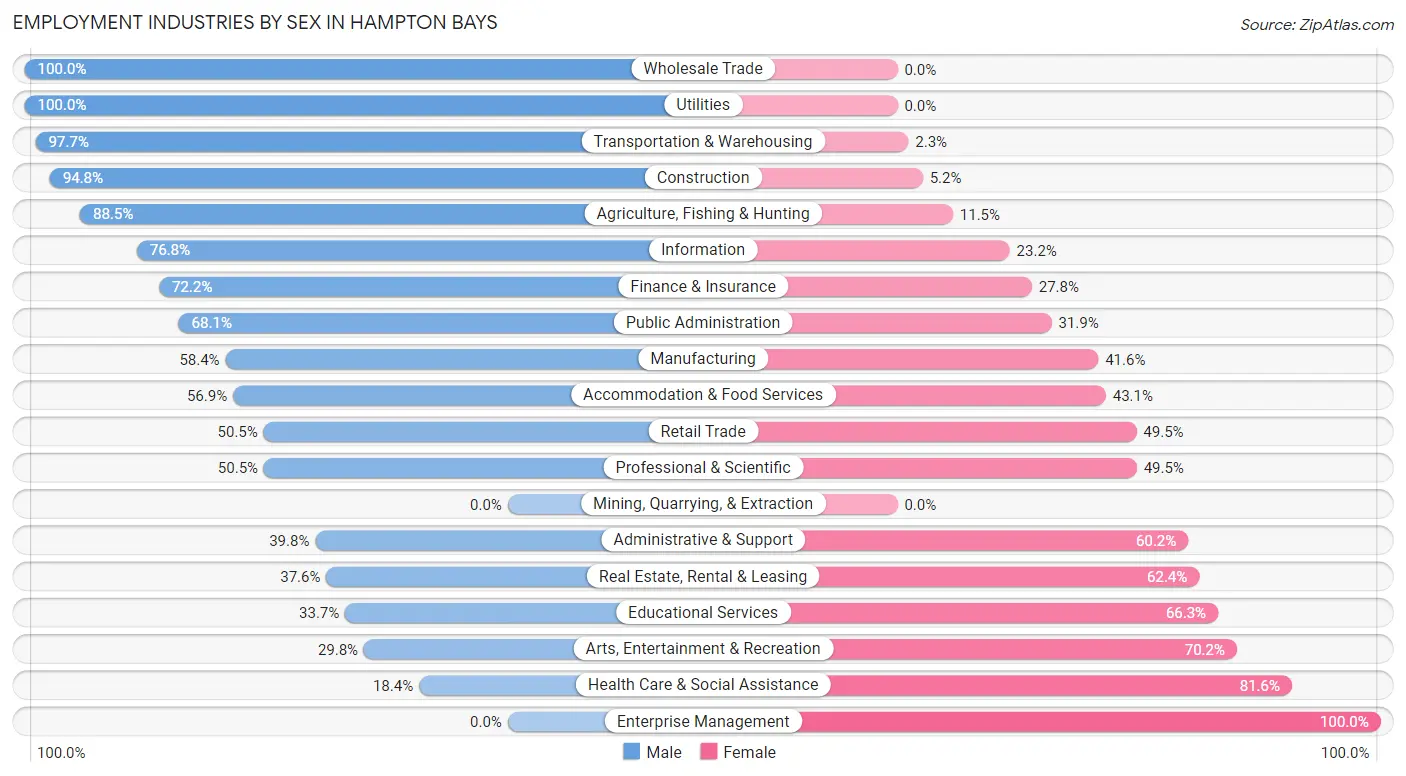
Employment Industries by Sex in Hampton Bays
The Hampton Bays industries that see more men than women are Wholesale Trade (100.0%), Utilities (100.0%), and Transportation & Warehousing (97.7%), whereas the industries that tend to have a higher number of women are Enterprise Management (100.0%), Health Care & Social Assistance (81.6%), and Arts, Entertainment & Recreation (70.2%).
| Industry | Male | Female |
| Agriculture, Fishing & Hunting | 108 (88.5%) | 14 (11.5%) |
| Mining, Quarrying, & Extraction | 0 (0.0%) | 0 (0.0%) |
| Construction | 1,250 (94.8%) | 69 (5.2%) |
| Manufacturing | 208 (58.4%) | 148 (41.6%) |
| Wholesale Trade | 63 (100.0%) | 0 (0.0%) |
| Retail Trade | 432 (50.5%) | 423 (49.5%) |
| Transportation & Warehousing | 303 (97.7%) | 7 (2.3%) |
| Utilities | 32 (100.0%) | 0 (0.0%) |
| Information | 76 (76.8%) | 23 (23.2%) |
| Finance & Insurance | 423 (72.2%) | 163 (27.8%) |
| Real Estate, Rental & Leasing | 74 (37.6%) | 123 (62.4%) |
| Professional & Scientific | 487 (50.5%) | 478 (49.5%) |
| Enterprise Management | 0 (0.0%) | 5 (100.0%) |
| Administrative & Support | 198 (39.8%) | 299 (60.2%) |
| Educational Services | 276 (33.7%) | 544 (66.3%) |
| Health Care & Social Assistance | 158 (18.4%) | 702 (81.6%) |
| Arts, Entertainment & Recreation | 75 (29.8%) | 177 (70.2%) |
| Accommodation & Food Services | 265 (56.9%) | 201 (43.1%) |
| Public Administration | 111 (68.1%) | 52 (31.9%) |
| Total | 4,784 (55.9%) | 3,770 (44.1%) |
Education in Hampton Bays
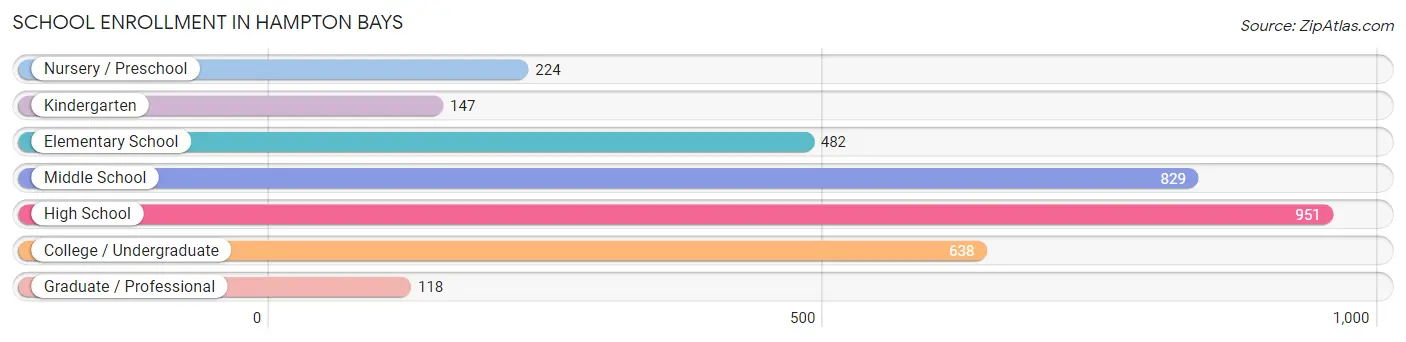
School Enrollment in Hampton Bays
The most common levels of schooling among the 3,389 students in Hampton Bays are high school (951 | 28.1%), middle school (829 | 24.5%), and college / undergraduate (638 | 18.8%).
| School Level | # Students | % Students |
| Nursery / Preschool | 224 | 6.6% |
| Kindergarten | 147 | 4.3% |
| Elementary School | 482 | 14.2% |
| Middle School | 829 | 24.5% |
| High School | 951 | 28.1% |
| College / Undergraduate | 638 | 18.8% |
| Graduate / Professional | 118 | 3.5% |
| Total | 3,389 | 100.0% |
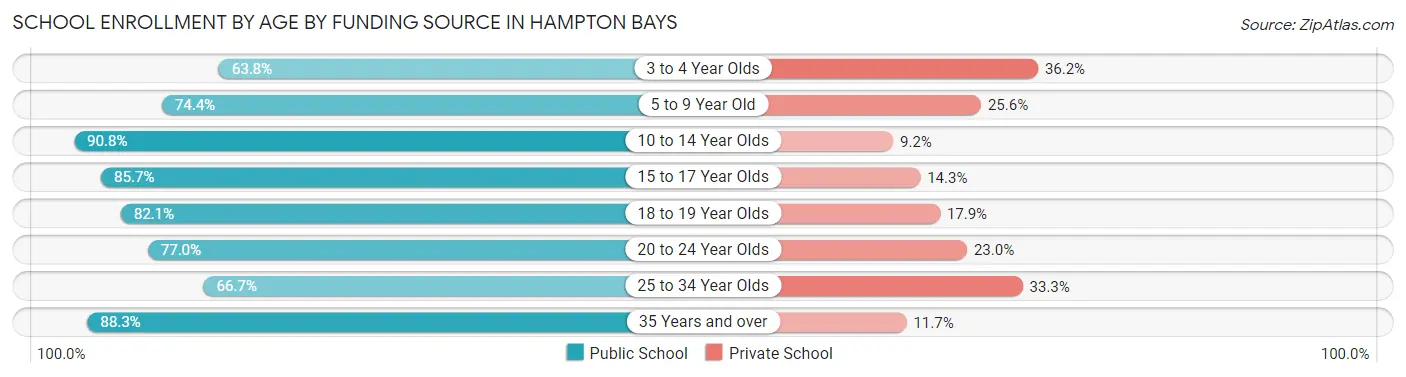
School Enrollment by Age by Funding Source in Hampton Bays
Out of a total of 3,389 students who are enrolled in schools in Hampton Bays, 610 (18.0%) attend a private institution, while the remaining 2,779 (82.0%) are enrolled in public schools. The age group of 3 to 4 year olds has the highest likelihood of being enrolled in private schools, with 97 (36.2% in the age bracket) enrolled. Conversely, the age group of 10 to 14 year olds has the lowest likelihood of being enrolled in a private school, with 936 (90.8% in the age bracket) attending a public institution.
| Age Bracket | Public School | Private School |
| 3 to 4 Year Olds | 171 (63.8%) | 97 (36.2%) |
| 5 to 9 Year Old | 416 (74.4%) | 143 (25.6%) |
| 10 to 14 Year Olds | 936 (90.8%) | 95 (9.2%) |
| 15 to 17 Year Olds | 571 (85.7%) | 95 (14.3%) |
| 18 to 19 Year Olds | 270 (82.1%) | 59 (17.9%) |
| 20 to 24 Year Olds | 285 (77.0%) | 85 (23.0%) |
| 25 to 34 Year Olds | 48 (66.7%) | 24 (33.3%) |
| 35 Years and over | 83 (88.3%) | 11 (11.7%) |
| Total | 2,779 (82.0%) | 610 (18.0%) |
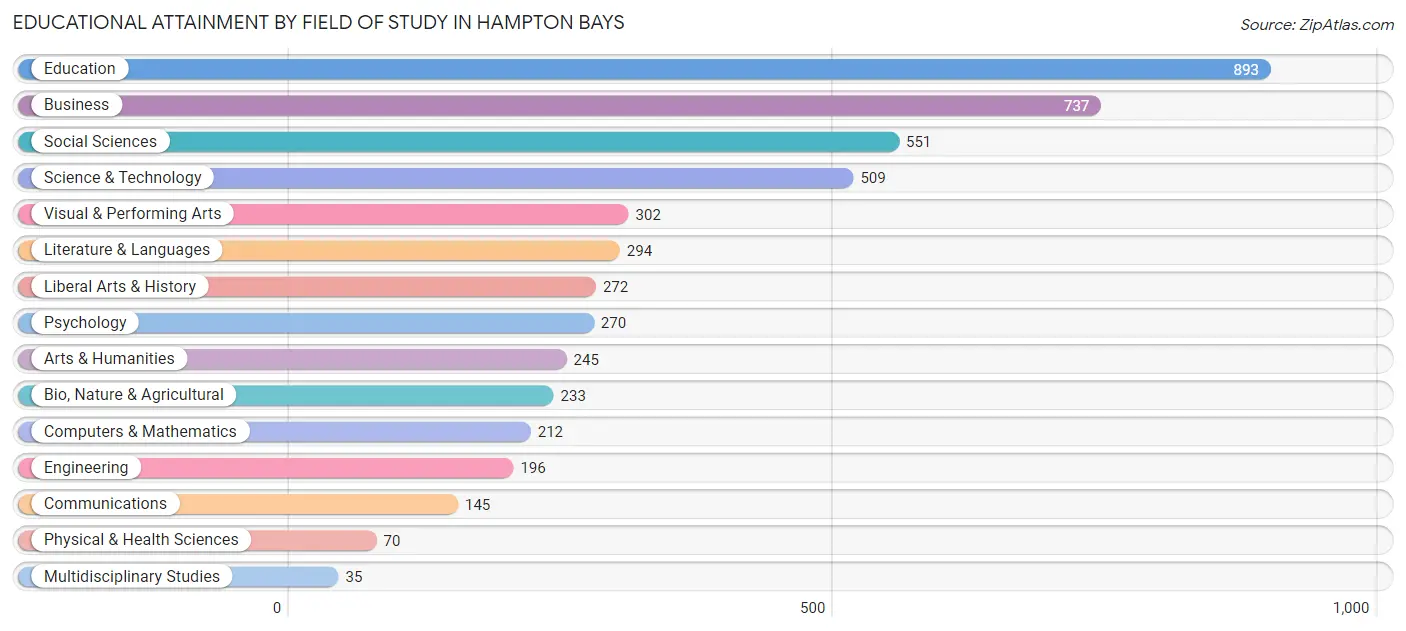
Educational Attainment by Field of Study in Hampton Bays
Education (893 | 18.0%), business (737 | 14.8%), social sciences (551 | 11.1%), science & technology (509 | 10.2%), and visual & performing arts (302 | 6.1%) are the most common fields of study among 4,964 individuals in Hampton Bays who have obtained a bachelor's degree or higher.
| Field of Study | # Graduates | % Graduates |
| Computers & Mathematics | 212 | 4.3% |
| Bio, Nature & Agricultural | 233 | 4.7% |
| Physical & Health Sciences | 70 | 1.4% |
| Psychology | 270 | 5.4% |
| Social Sciences | 551 | 11.1% |
| Engineering | 196 | 4.0% |
| Multidisciplinary Studies | 35 | 0.7% |
| Science & Technology | 509 | 10.2% |
| Business | 737 | 14.8% |
| Education | 893 | 18.0% |
| Literature & Languages | 294 | 5.9% |
| Liberal Arts & History | 272 | 5.5% |
| Visual & Performing Arts | 302 | 6.1% |
| Communications | 145 | 2.9% |
| Arts & Humanities | 245 | 4.9% |
| Total | 4,964 | 100.0% |
Transportation & Commute in Hampton Bays
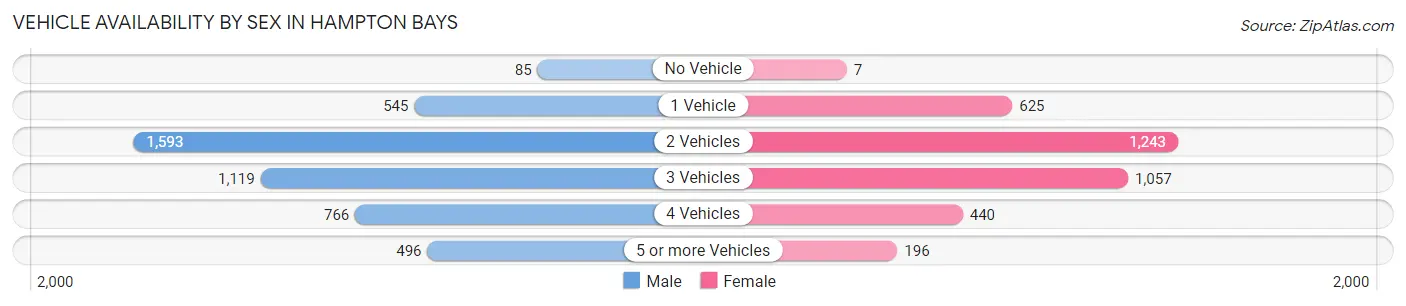
Vehicle Availability by Sex in Hampton Bays
The most prevalent vehicle ownership categories in Hampton Bays are males with 2 vehicles (1,593, accounting for 34.6%) and females with 2 vehicles (1,243, making up 44.7%).
| Vehicles Available | Male | Female |
| No Vehicle | 85 (1.8%) | 7 (0.2%) |
| 1 Vehicle | 545 (11.8%) | 625 (17.5%) |
| 2 Vehicles | 1,593 (34.6%) | 1,243 (34.8%) |
| 3 Vehicles | 1,119 (24.3%) | 1,057 (29.6%) |
| 4 Vehicles | 766 (16.6%) | 440 (12.3%) |
| 5 or more Vehicles | 496 (10.8%) | 196 (5.5%) |
| Total | 4,604 (100.0%) | 3,568 (100.0%) |
Commute Time in Hampton Bays
The most frequently occuring commute durations in Hampton Bays are 20 to 24 minutes (1,263 commuters, 16.7%), 45 to 59 minutes (1,212 commuters, 16.0%), and 60 to 89 minutes (1,050 commuters, 13.9%).
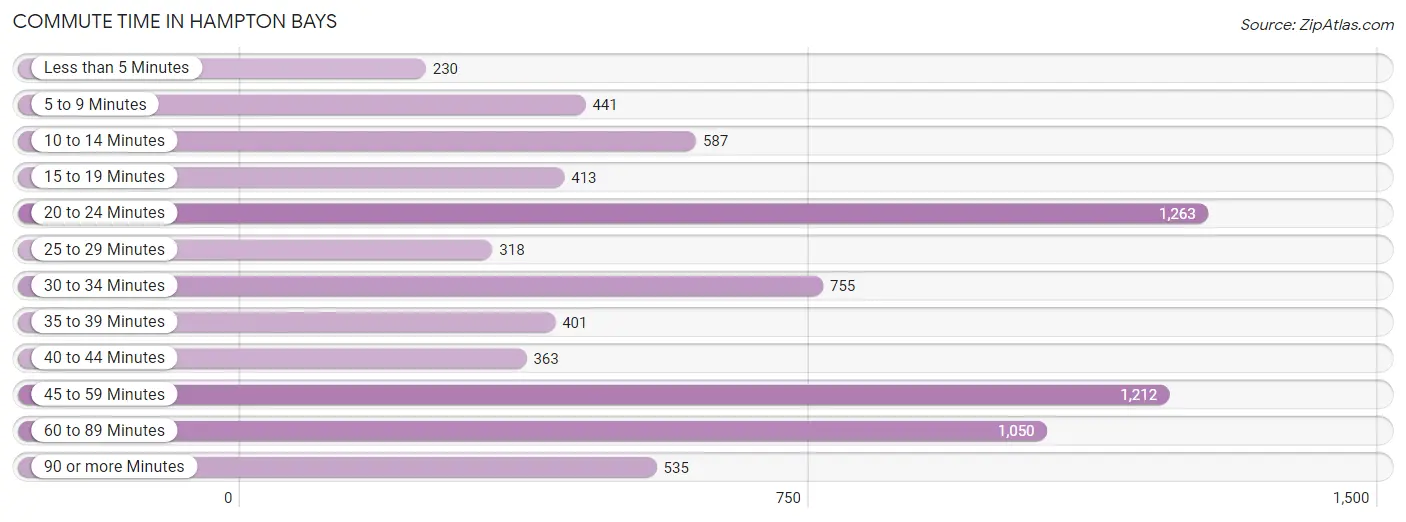
| Commute Time | # Commuters | % Commuters |
| Less than 5 Minutes | 230 | 3.0% |
| 5 to 9 Minutes | 441 | 5.8% |
| 10 to 14 Minutes | 587 | 7.8% |
| 15 to 19 Minutes | 413 | 5.5% |
| 20 to 24 Minutes | 1,263 | 16.7% |
| 25 to 29 Minutes | 318 | 4.2% |
| 30 to 34 Minutes | 755 | 10.0% |
| 35 to 39 Minutes | 401 | 5.3% |
| 40 to 44 Minutes | 363 | 4.8% |
| 45 to 59 Minutes | 1,212 | 16.0% |
| 60 to 89 Minutes | 1,050 | 13.9% |
| 90 or more Minutes | 535 | 7.1% |
Commute Time by Sex in Hampton Bays
The most common commute times in Hampton Bays are 45 to 59 minutes (979 commuters, 22.8%) for males and 20 to 24 minutes (792 commuters, 24.2%) for females.
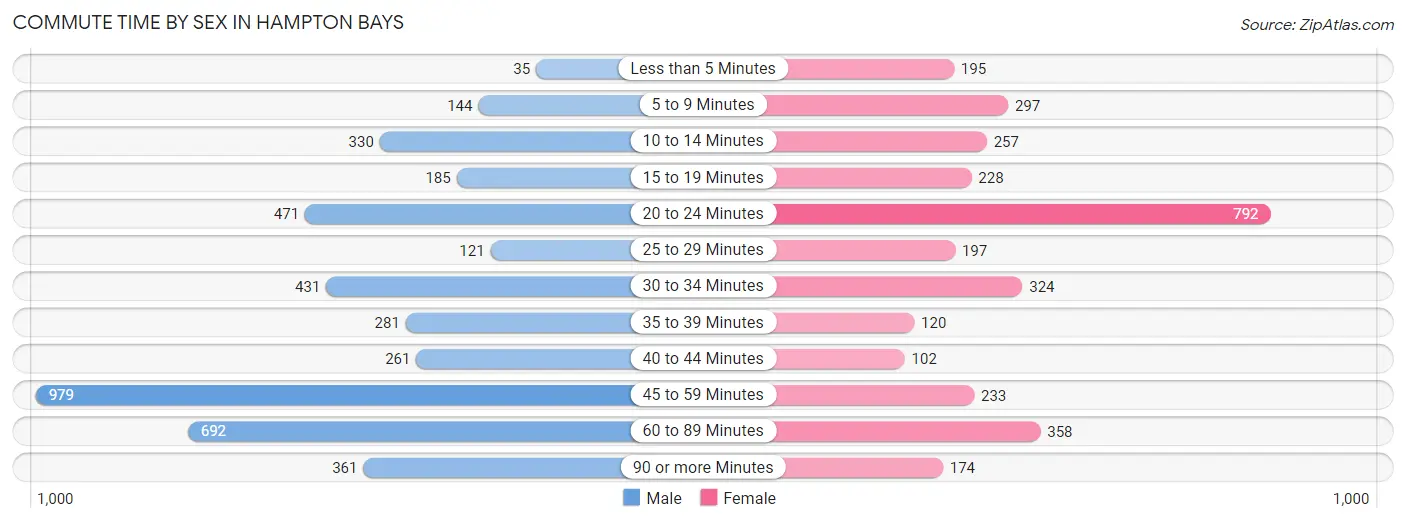
| Commute Time | Male | Female |
| Less than 5 Minutes | 35 (0.8%) | 195 (5.9%) |
| 5 to 9 Minutes | 144 (3.4%) | 297 (9.1%) |
| 10 to 14 Minutes | 330 (7.7%) | 257 (7.8%) |
| 15 to 19 Minutes | 185 (4.3%) | 228 (7.0%) |
| 20 to 24 Minutes | 471 (11.0%) | 792 (24.2%) |
| 25 to 29 Minutes | 121 (2.8%) | 197 (6.0%) |
| 30 to 34 Minutes | 431 (10.0%) | 324 (9.9%) |
| 35 to 39 Minutes | 281 (6.6%) | 120 (3.7%) |
| 40 to 44 Minutes | 261 (6.1%) | 102 (3.1%) |
| 45 to 59 Minutes | 979 (22.8%) | 233 (7.1%) |
| 60 to 89 Minutes | 692 (16.1%) | 358 (10.9%) |
| 90 or more Minutes | 361 (8.4%) | 174 (5.3%) |
Time of Departure to Work by Sex in Hampton Bays
The most frequent times of departure to work in Hampton Bays are 8:00 AM to 8:29 AM (1,070, 24.9%) for males and 8:00 AM to 8:29 AM (727, 22.2%) for females.
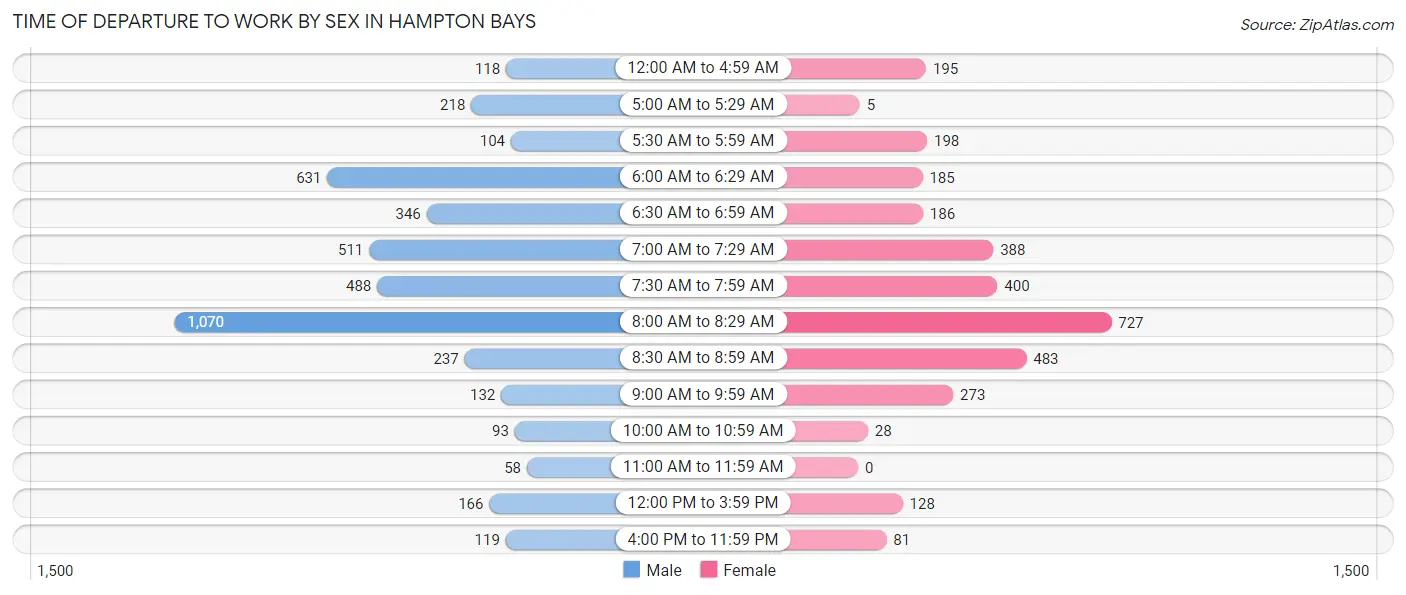
| Time of Departure | Male | Female |
| 12:00 AM to 4:59 AM | 118 (2.8%) | 195 (5.9%) |
| 5:00 AM to 5:29 AM | 218 (5.1%) | 5 (0.2%) |
| 5:30 AM to 5:59 AM | 104 (2.4%) | 198 (6.0%) |
| 6:00 AM to 6:29 AM | 631 (14.7%) | 185 (5.7%) |
| 6:30 AM to 6:59 AM | 346 (8.1%) | 186 (5.7%) |
| 7:00 AM to 7:29 AM | 511 (11.9%) | 388 (11.8%) |
| 7:30 AM to 7:59 AM | 488 (11.4%) | 400 (12.2%) |
| 8:00 AM to 8:29 AM | 1,070 (24.9%) | 727 (22.2%) |
| 8:30 AM to 8:59 AM | 237 (5.5%) | 483 (14.7%) |
| 9:00 AM to 9:59 AM | 132 (3.1%) | 273 (8.3%) |
| 10:00 AM to 10:59 AM | 93 (2.2%) | 28 (0.9%) |
| 11:00 AM to 11:59 AM | 58 (1.3%) | 0 (0.0%) |
| 12:00 PM to 3:59 PM | 166 (3.9%) | 128 (3.9%) |
| 4:00 PM to 11:59 PM | 119 (2.8%) | 81 (2.5%) |
| Total | 4,291 (100.0%) | 3,277 (100.0%) |
Housing Occupancy in Hampton Bays
Occupancy by Ownership in Hampton Bays
Of the total 6,326 dwellings in Hampton Bays, owner-occupied units account for 4,933 (78.0%), while renter-occupied units make up 1,393 (22.0%).
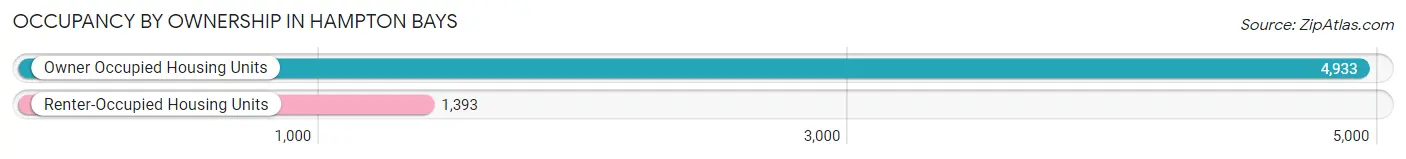
| Occupancy | # Housing Units | % Housing Units |
| Owner Occupied Housing Units | 4,933 | 78.0% |
| Renter-Occupied Housing Units | 1,393 | 22.0% |
| Total Occupied Housing Units | 6,326 | 100.0% |
Occupancy by Household Size in Hampton Bays
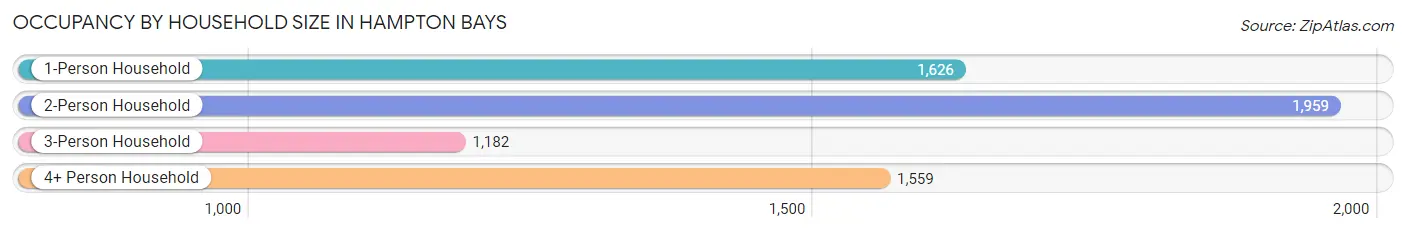
| Household Size | # Housing Units | % Housing Units |
| 1-Person Household | 1,626 | 25.7% |
| 2-Person Household | 1,959 | 31.0% |
| 3-Person Household | 1,182 | 18.7% |
| 4+ Person Household | 1,559 | 24.6% |
| Total Housing Units | 6,326 | 100.0% |
Occupancy by Ownership by Household Size in Hampton Bays
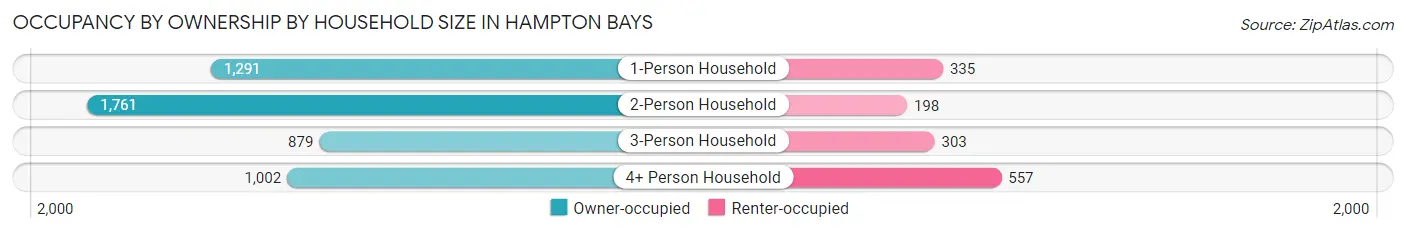
| Household Size | Owner-occupied | Renter-occupied |
| 1-Person Household | 1,291 (79.4%) | 335 (20.6%) |
| 2-Person Household | 1,761 (89.9%) | 198 (10.1%) |
| 3-Person Household | 879 (74.4%) | 303 (25.6%) |
| 4+ Person Household | 1,002 (64.3%) | 557 (35.7%) |
| Total Housing Units | 4,933 (78.0%) | 1,393 (22.0%) |
Occupancy by Educational Attainment in Hampton Bays
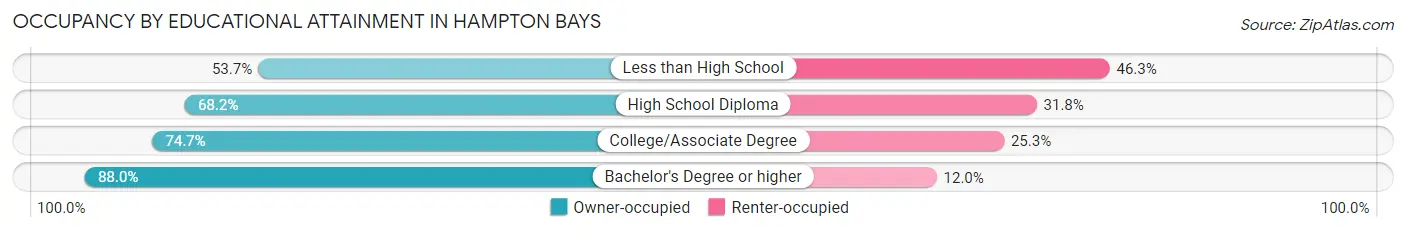
| Household Size | Owner-occupied | Renter-occupied |
| Less than High School | 245 (53.7%) | 211 (46.3%) |
| High School Diploma | 894 (68.2%) | 417 (31.8%) |
| College/Associate Degree | 1,223 (74.7%) | 415 (25.3%) |
| Bachelor's Degree or higher | 2,571 (88.0%) | 350 (12.0%) |
Occupancy by Age of Householder in Hampton Bays
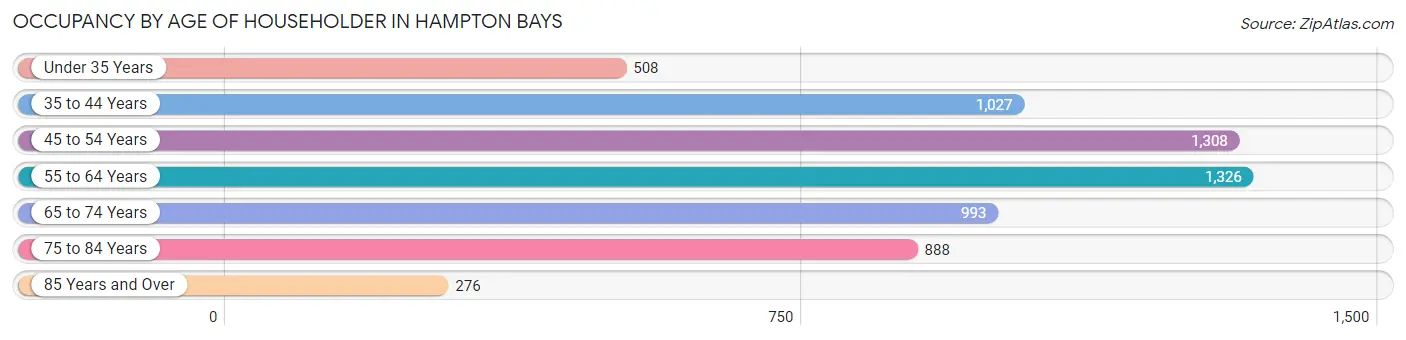
| Age Bracket | # Households | % Households |
| Under 35 Years | 508 | 8.0% |
| 35 to 44 Years | 1,027 | 16.2% |
| 45 to 54 Years | 1,308 | 20.7% |
| 55 to 64 Years | 1,326 | 21.0% |
| 65 to 74 Years | 993 | 15.7% |
| 75 to 84 Years | 888 | 14.0% |
| 85 Years and Over | 276 | 4.4% |
| Total | 6,326 | 100.0% |
Housing Finances in Hampton Bays
Median Income by Occupancy in Hampton Bays
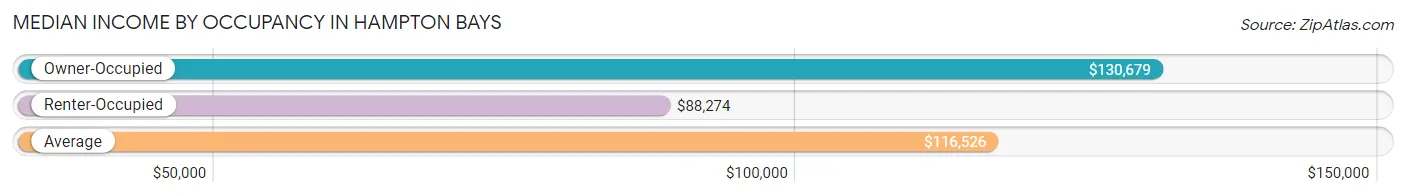
| Occupancy Type | # Households | Median Income |
| Owner-Occupied | 4,933 (78.0%) | $130,679 |
| Renter-Occupied | 1,393 (22.0%) | $88,274 |
| Average | 6,326 (100.0%) | $116,526 |
Occupancy by Householder Income Bracket in Hampton Bays
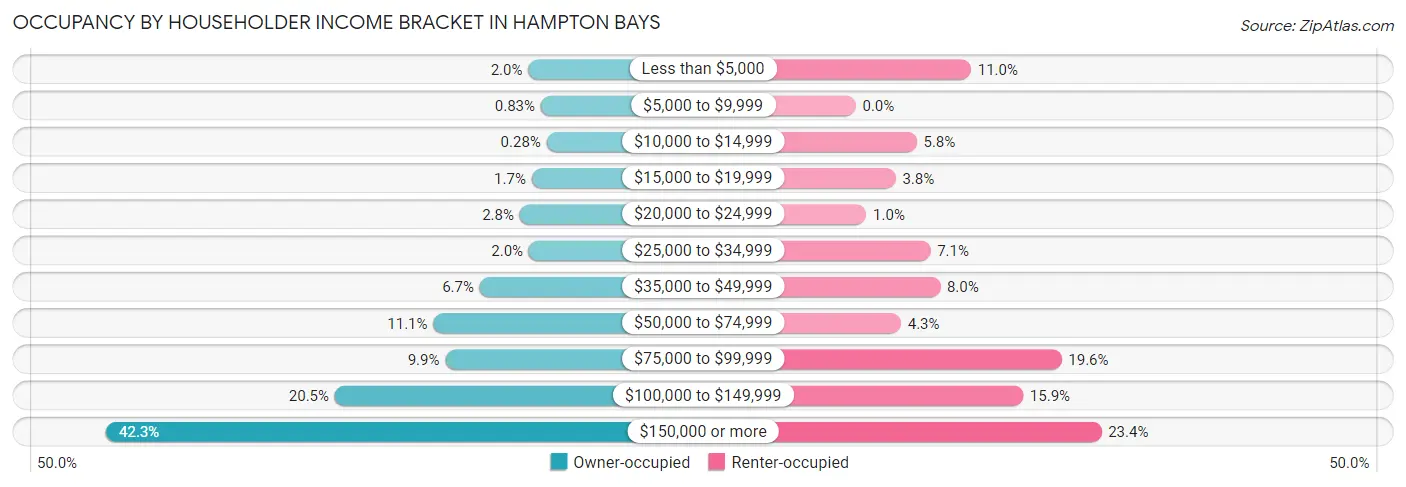
| Income Bracket | Owner-occupied | Renter-occupied |
| Less than $5,000 | 100 (2.0%) | 153 (11.0%) |
| $5,000 to $9,999 | 41 (0.8%) | 0 (0.0%) |
| $10,000 to $14,999 | 14 (0.3%) | 81 (5.8%) |
| $15,000 to $19,999 | 84 (1.7%) | 53 (3.8%) |
| $20,000 to $24,999 | 140 (2.8%) | 14 (1.0%) |
| $25,000 to $34,999 | 97 (2.0%) | 99 (7.1%) |
| $35,000 to $49,999 | 328 (6.7%) | 112 (8.0%) |
| $50,000 to $74,999 | 546 (11.1%) | 60 (4.3%) |
| $75,000 to $99,999 | 490 (9.9%) | 273 (19.6%) |
| $100,000 to $149,999 | 1,009 (20.4%) | 222 (15.9%) |
| $150,000 or more | 2,084 (42.2%) | 326 (23.4%) |
| Total | 4,933 (100.0%) | 1,393 (100.0%) |
Monthly Housing Cost Tiers in Hampton Bays
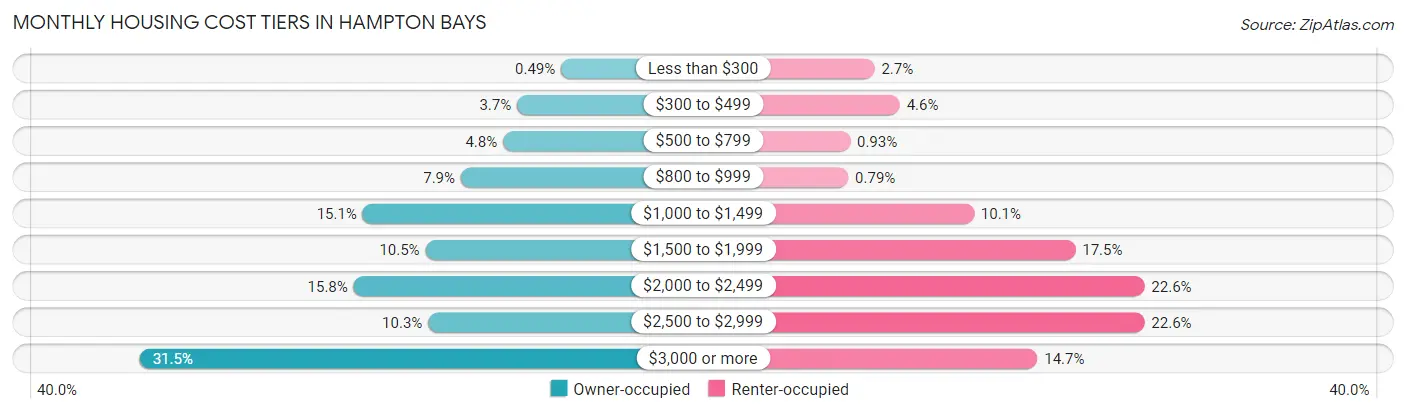
| Monthly Cost | Owner-occupied | Renter-occupied |
| Less than $300 | 24 (0.5%) | 38 (2.7%) |
| $300 to $499 | 184 (3.7%) | 64 (4.6%) |
| $500 to $799 | 235 (4.8%) | 13 (0.9%) |
| $800 to $999 | 388 (7.9%) | 11 (0.8%) |
| $1,000 to $1,499 | 745 (15.1%) | 140 (10.1%) |
| $1,500 to $1,999 | 517 (10.5%) | 244 (17.5%) |
| $2,000 to $2,499 | 778 (15.8%) | 315 (22.6%) |
| $2,500 to $2,999 | 507 (10.3%) | 315 (22.6%) |
| $3,000 or more | 1,555 (31.5%) | 205 (14.7%) |
| Total | 4,933 (100.0%) | 1,393 (100.0%) |
Physical Housing Characteristics in Hampton Bays
Housing Structures in Hampton Bays
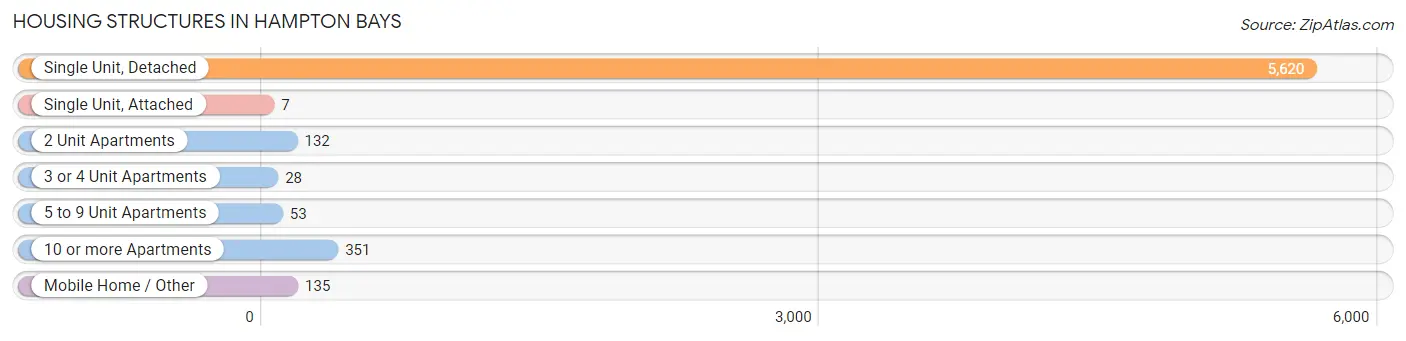
| Structure Type | # Housing Units | % Housing Units |
| Single Unit, Detached | 5,620 | 88.8% |
| Single Unit, Attached | 7 | 0.1% |
| 2 Unit Apartments | 132 | 2.1% |
| 3 or 4 Unit Apartments | 28 | 0.4% |
| 5 to 9 Unit Apartments | 53 | 0.8% |
| 10 or more Apartments | 351 | 5.6% |
| Mobile Home / Other | 135 | 2.1% |
| Total | 6,326 | 100.0% |
Housing Structures by Occupancy in Hampton Bays
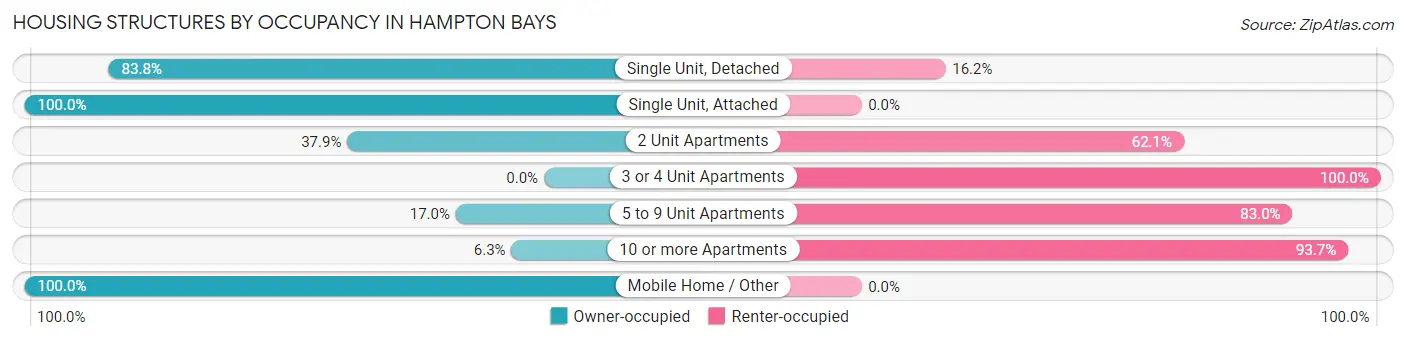
| Structure Type | Owner-occupied | Renter-occupied |
| Single Unit, Detached | 4,710 (83.8%) | 910 (16.2%) |
| Single Unit, Attached | 7 (100.0%) | 0 (0.0%) |
| 2 Unit Apartments | 50 (37.9%) | 82 (62.1%) |
| 3 or 4 Unit Apartments | 0 (0.0%) | 28 (100.0%) |
| 5 to 9 Unit Apartments | 9 (17.0%) | 44 (83.0%) |
| 10 or more Apartments | 22 (6.3%) | 329 (93.7%) |
| Mobile Home / Other | 135 (100.0%) | 0 (0.0%) |
| Total | 4,933 (78.0%) | 1,393 (22.0%) |
Housing Structures by Number of Rooms in Hampton Bays
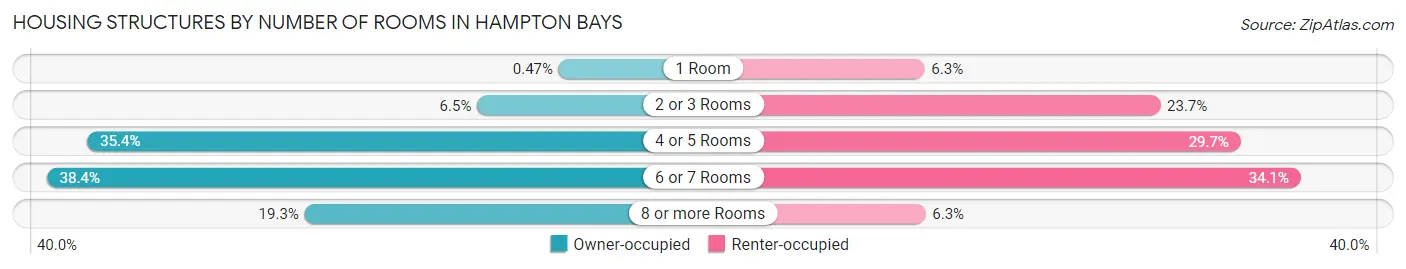
| Number of Rooms | Owner-occupied | Renter-occupied |
| 1 Room | 23 (0.5%) | 87 (6.2%) |
| 2 or 3 Rooms | 321 (6.5%) | 330 (23.7%) |
| 4 or 5 Rooms | 1,745 (35.4%) | 413 (29.6%) |
| 6 or 7 Rooms | 1,893 (38.4%) | 475 (34.1%) |
| 8 or more Rooms | 951 (19.3%) | 88 (6.3%) |
| Total | 4,933 (100.0%) | 1,393 (100.0%) |
Housing Structure by Heating Type in Hampton Bays
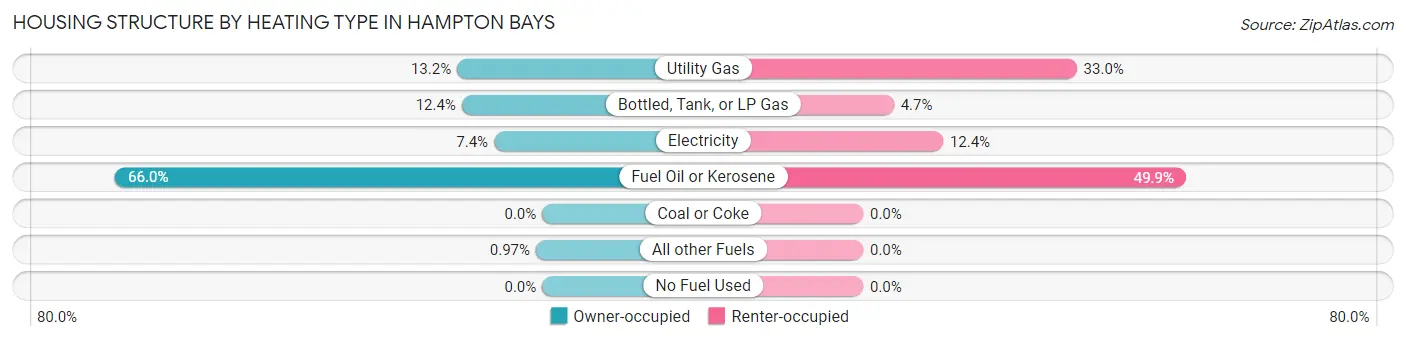
| Heating Type | Owner-occupied | Renter-occupied |
| Utility Gas | 649 (13.2%) | 460 (33.0%) |
| Bottled, Tank, or LP Gas | 613 (12.4%) | 66 (4.7%) |
| Electricity | 367 (7.4%) | 172 (12.3%) |
| Fuel Oil or Kerosene | 3,256 (66.0%) | 695 (49.9%) |
| Coal or Coke | 0 (0.0%) | 0 (0.0%) |
| All other Fuels | 48 (1.0%) | 0 (0.0%) |
| No Fuel Used | 0 (0.0%) | 0 (0.0%) |
| Total | 4,933 (100.0%) | 1,393 (100.0%) |
Household Vehicle Usage in Hampton Bays
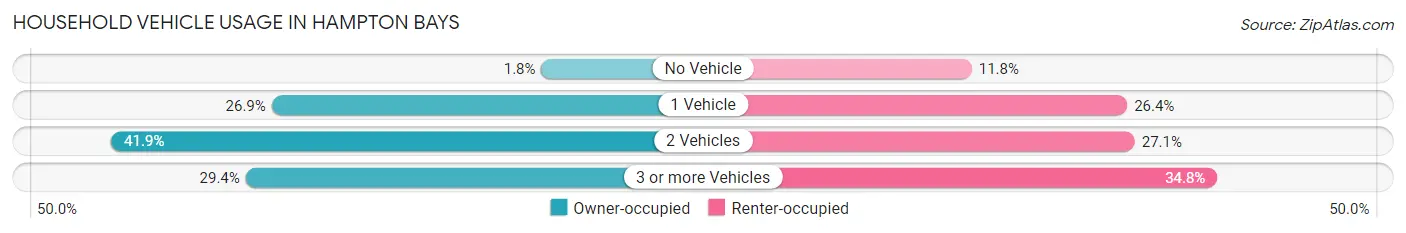
| Vehicles per Household | Owner-occupied | Renter-occupied |
| No Vehicle | 87 (1.8%) | 165 (11.8%) |
| 1 Vehicle | 1,329 (26.9%) | 367 (26.4%) |
| 2 Vehicles | 2,068 (41.9%) | 377 (27.1%) |
| 3 or more Vehicles | 1,449 (29.4%) | 484 (34.7%) |
| Total | 4,933 (100.0%) | 1,393 (100.0%) |
Real Estate & Mortgages in Hampton Bays
Real Estate and Mortgage Overview in Hampton Bays
| Characteristic | Without Mortgage | With Mortgage |
| Housing Units | 2,108 | 2,825 |
| Median Property Value | $621,800 | $664,200 |
| Median Household Income | $101,643 | $1,309 |
| Monthly Housing Costs | $1,153 | $1,533 |
| Real Estate Taxes | $7,820 | $12 |
Property Value by Mortgage Status in Hampton Bays
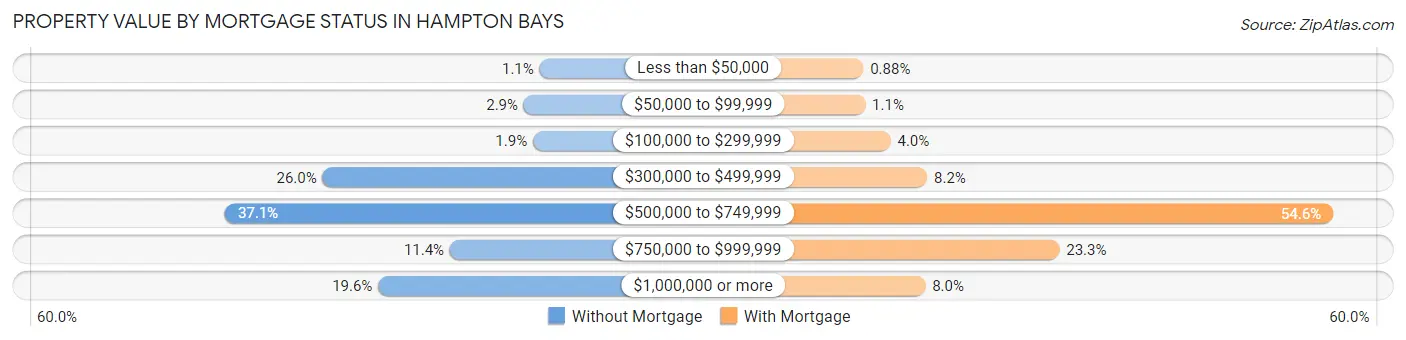
| Property Value | Without Mortgage | With Mortgage |
| Less than $50,000 | 24 (1.1%) | 25 (0.9%) |
| $50,000 to $99,999 | 62 (2.9%) | 31 (1.1%) |
| $100,000 to $299,999 | 40 (1.9%) | 113 (4.0%) |
| $300,000 to $499,999 | 547 (26.0%) | 231 (8.2%) |
| $500,000 to $749,999 | 782 (37.1%) | 1,542 (54.6%) |
| $750,000 to $999,999 | 240 (11.4%) | 658 (23.3%) |
| $1,000,000 or more | 413 (19.6%) | 225 (8.0%) |
| Total | 2,108 (100.0%) | 2,825 (100.0%) |
Household Income by Mortgage Status in Hampton Bays
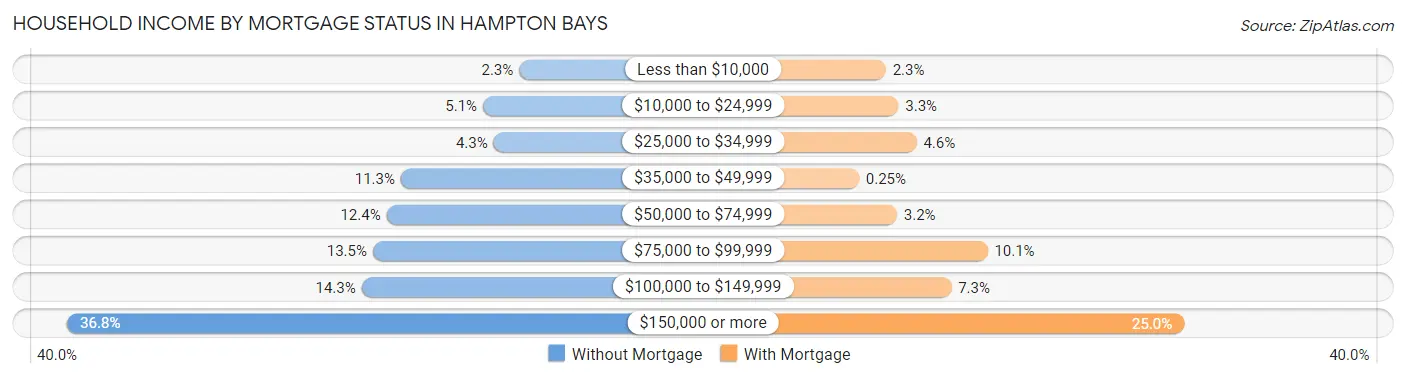
| Household Income | Without Mortgage | With Mortgage |
| Less than $10,000 | 49 (2.3%) | 65 (2.3%) |
| $10,000 to $24,999 | 107 (5.1%) | 92 (3.3%) |
| $25,000 to $34,999 | 90 (4.3%) | 131 (4.6%) |
| $35,000 to $49,999 | 239 (11.3%) | 7 (0.3%) |
| $50,000 to $74,999 | 262 (12.4%) | 89 (3.2%) |
| $75,000 to $99,999 | 284 (13.5%) | 284 (10.1%) |
| $100,000 to $149,999 | 302 (14.3%) | 206 (7.3%) |
| $150,000 or more | 775 (36.8%) | 707 (25.0%) |
| Total | 2,108 (100.0%) | 2,825 (100.0%) |
Property Value to Household Income Ratio in Hampton Bays
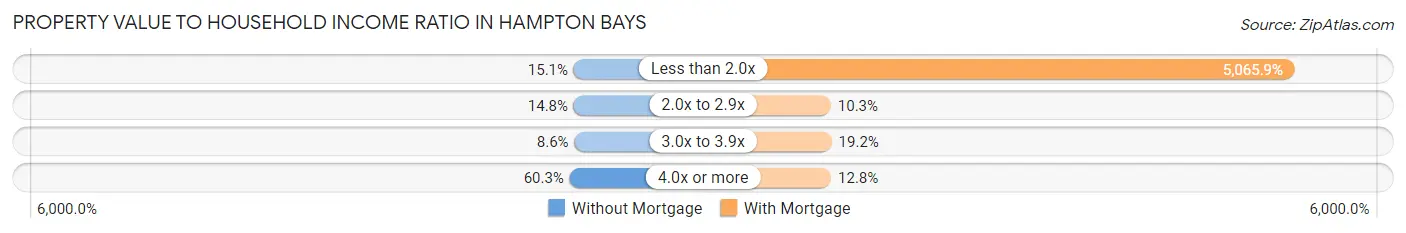
| Value-to-Income Ratio | Without Mortgage | With Mortgage |
| Less than 2.0x | 318 (15.1%) | 143,112 (5,065.9%) |
| 2.0x to 2.9x | 312 (14.8%) | 292 (10.3%) |
| 3.0x to 3.9x | 181 (8.6%) | 541 (19.2%) |
| 4.0x or more | 1,270 (60.3%) | 361 (12.8%) |
| Total | 2,108 (100.0%) | 2,825 (100.0%) |
Real Estate Taxes by Mortgage Status in Hampton Bays
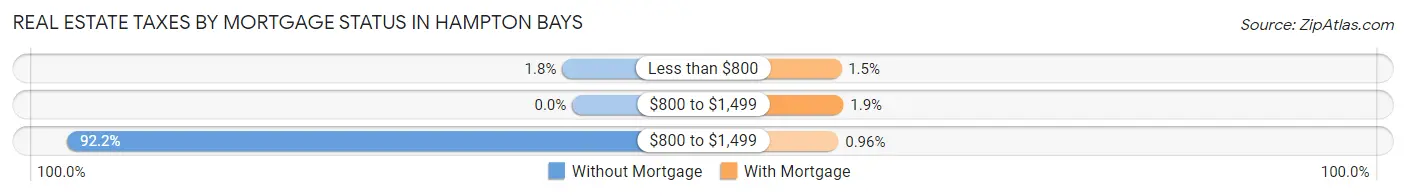
| Property Taxes | Without Mortgage | With Mortgage |
| Less than $800 | 38 (1.8%) | 42 (1.5%) |
| $800 to $1,499 | 0 (0.0%) | 53 (1.9%) |
| $800 to $1,499 | 1,944 (92.2%) | 27 (1.0%) |
| Total | 2,108 (100.0%) | 2,825 (100.0%) |
Health & Disability in Hampton Bays
Health Insurance Coverage by Age in Hampton Bays
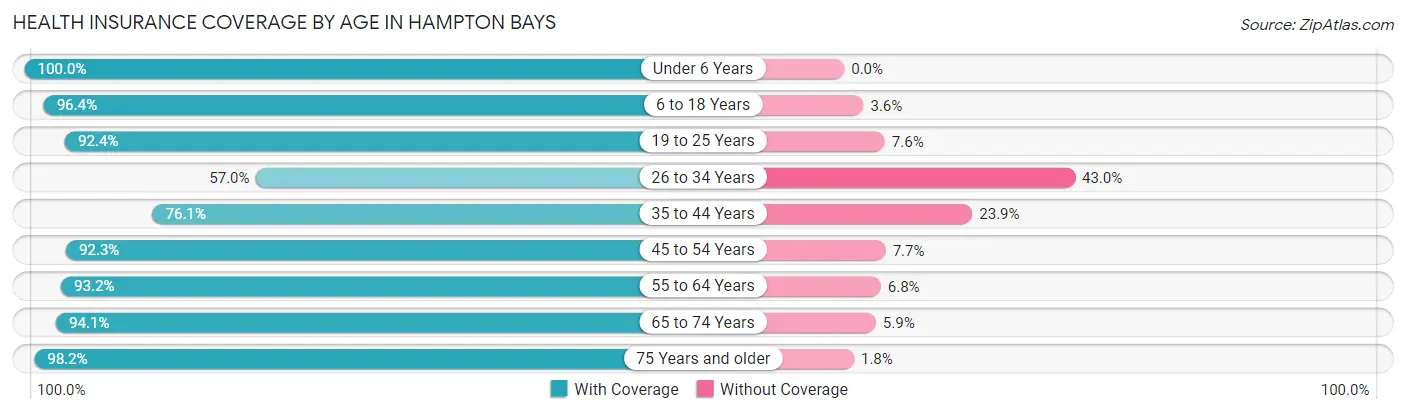
| Age Bracket | With Coverage | Without Coverage |
| Under 6 Years | 1,061 (100.0%) | 0 (0.0%) |
| 6 to 18 Years | 2,293 (96.4%) | 85 (3.6%) |
| 19 to 25 Years | 1,513 (92.4%) | 124 (7.6%) |
| 26 to 34 Years | 719 (57.0%) | 543 (43.0%) |
| 35 to 44 Years | 1,686 (76.1%) | 529 (23.9%) |
| 45 to 54 Years | 2,462 (92.3%) | 206 (7.7%) |
| 55 to 64 Years | 2,215 (93.2%) | 162 (6.8%) |
| 65 to 74 Years | 1,631 (94.1%) | 102 (5.9%) |
| 75 Years and older | 1,566 (98.2%) | 29 (1.8%) |
| Total | 15,146 (89.5%) | 1,780 (10.5%) |
Health Insurance Coverage by Citizenship Status in Hampton Bays
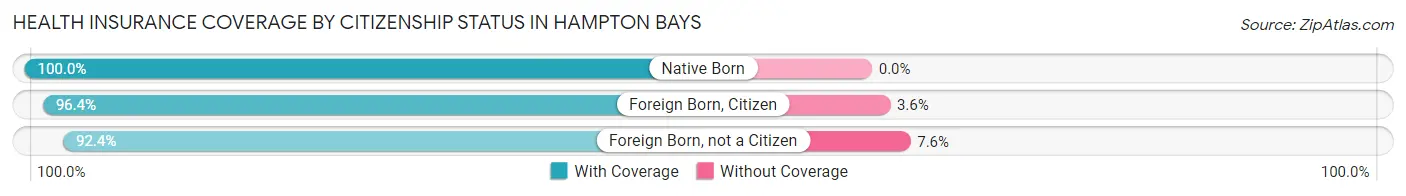
| Citizenship Status | With Coverage | Without Coverage |
| Native Born | 1,061 (100.0%) | 0 (0.0%) |
| Foreign Born, Citizen | 2,293 (96.4%) | 85 (3.6%) |
| Foreign Born, not a Citizen | 1,513 (92.4%) | 124 (7.6%) |
Health Insurance Coverage by Household Income in Hampton Bays
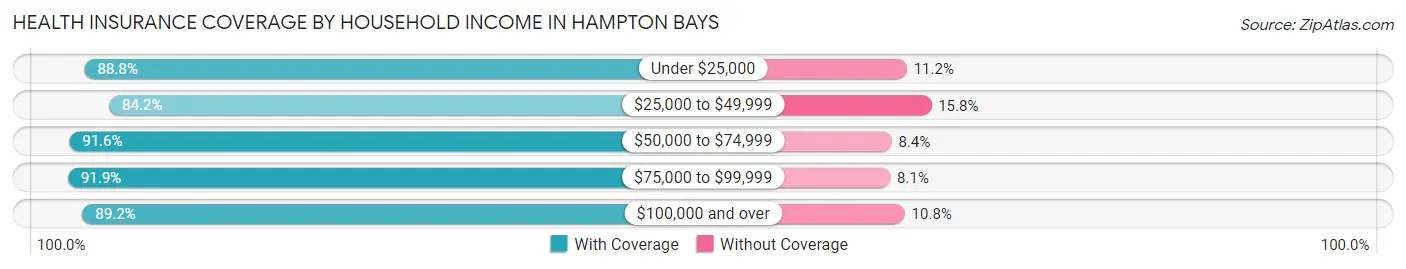
| Household Income | With Coverage | Without Coverage |
| Under $25,000 | 972 (88.8%) | 123 (11.2%) |
| $25,000 to $49,999 | 926 (84.2%) | 174 (15.8%) |
| $50,000 to $74,999 | 1,148 (91.6%) | 105 (8.4%) |
| $75,000 to $99,999 | 2,399 (91.9%) | 212 (8.1%) |
| $100,000 and over | 9,591 (89.2%) | 1,166 (10.8%) |
Public vs Private Health Insurance Coverage by Age in Hampton Bays
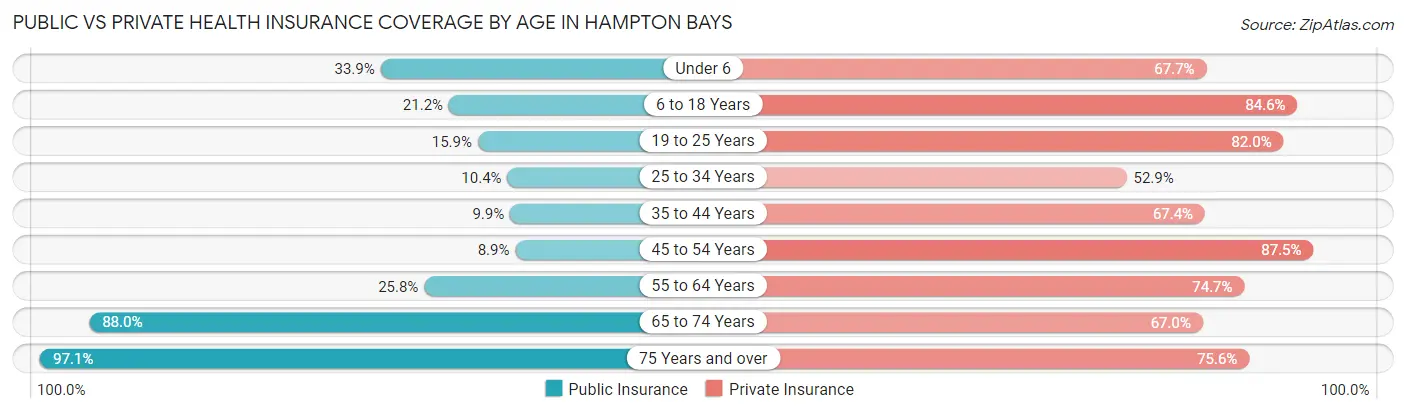
| Age Bracket | Public Insurance | Private Insurance |
| Under 6 | 360 (33.9%) | 718 (67.7%) |
| 6 to 18 Years | 505 (21.2%) | 2,011 (84.6%) |
| 19 to 25 Years | 260 (15.9%) | 1,342 (82.0%) |
| 25 to 34 Years | 131 (10.4%) | 667 (52.8%) |
| 35 to 44 Years | 219 (9.9%) | 1,493 (67.4%) |
| 45 to 54 Years | 238 (8.9%) | 2,335 (87.5%) |
| 55 to 64 Years | 614 (25.8%) | 1,776 (74.7%) |
| 65 to 74 Years | 1,525 (88.0%) | 1,161 (67.0%) |
| 75 Years and over | 1,549 (97.1%) | 1,206 (75.6%) |
| Total | 5,401 (31.9%) | 12,709 (75.1%) |
Disability Status by Sex by Age in Hampton Bays
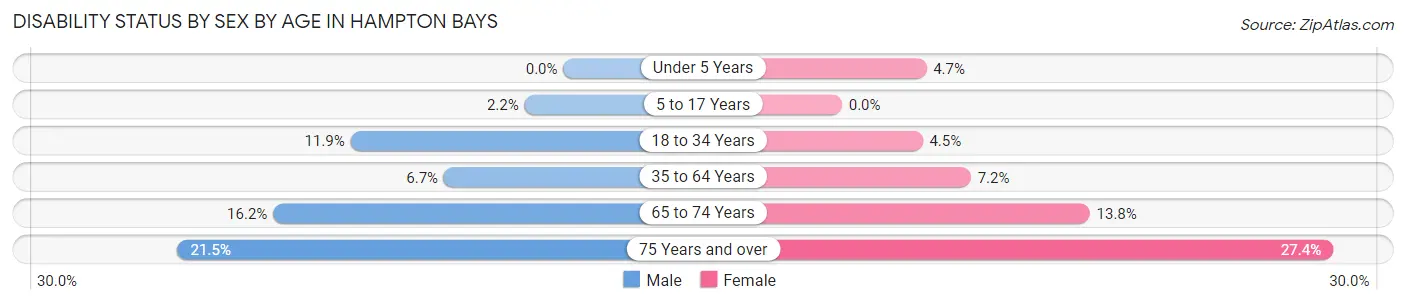
| Age Bracket | Male | Female |
| Under 5 Years | 0 (0.0%) | 11 (4.7%) |
| 5 to 17 Years | 28 (2.2%) | 0 (0.0%) |
| 18 to 34 Years | 232 (11.8%) | 51 (4.5%) |
| 35 to 64 Years | 240 (6.7%) | 262 (7.2%) |
| 65 to 74 Years | 122 (16.2%) | 135 (13.8%) |
| 75 Years and over | 151 (21.5%) | 244 (27.4%) |
Disability Class by Sex by Age in Hampton Bays
Disability Class: Hearing Difficulty
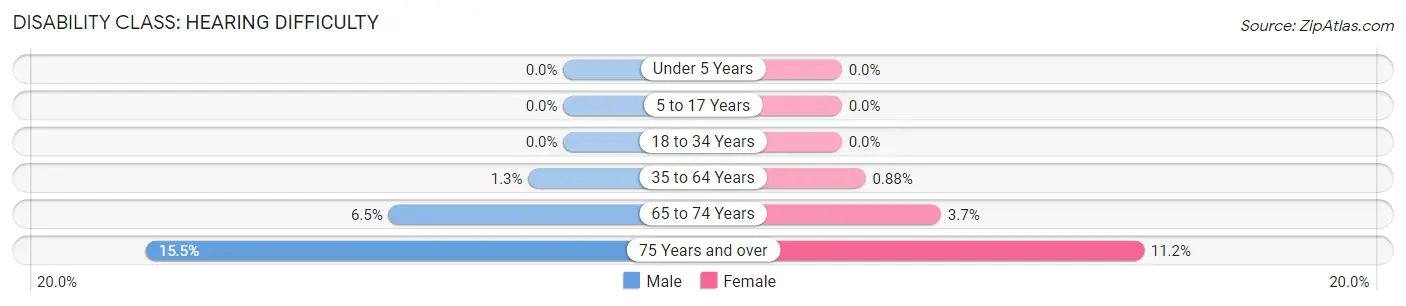
| Age Bracket | Male | Female |
| Under 5 Years | 0 (0.0%) | 0 (0.0%) |
| 5 to 17 Years | 0 (0.0%) | 0 (0.0%) |
| 18 to 34 Years | 0 (0.0%) | 0 (0.0%) |
| 35 to 64 Years | 47 (1.3%) | 32 (0.9%) |
| 65 to 74 Years | 49 (6.5%) | 36 (3.7%) |
| 75 Years and over | 109 (15.5%) | 100 (11.2%) |
Disability Class: Vision Difficulty
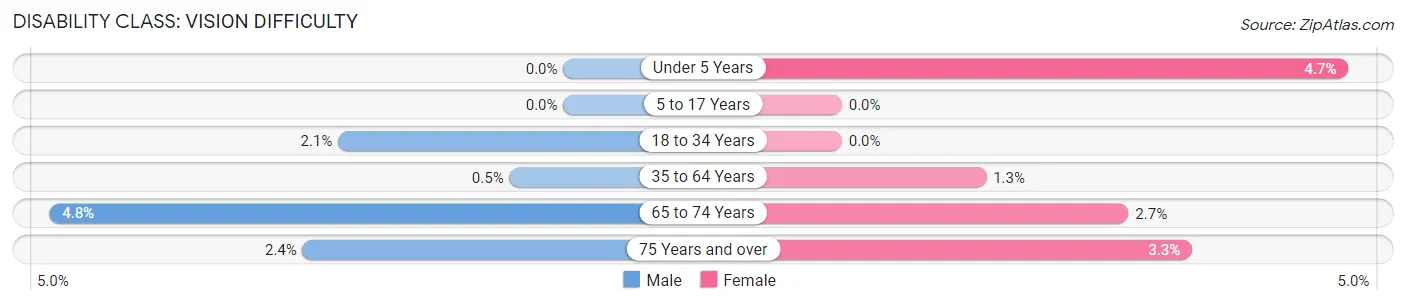
| Age Bracket | Male | Female |
| Under 5 Years | 0 (0.0%) | 11 (4.7%) |
| 5 to 17 Years | 0 (0.0%) | 0 (0.0%) |
| 18 to 34 Years | 41 (2.1%) | 0 (0.0%) |
| 35 to 64 Years | 18 (0.5%) | 49 (1.3%) |
| 65 to 74 Years | 36 (4.8%) | 26 (2.7%) |
| 75 Years and over | 17 (2.4%) | 29 (3.3%) |
Disability Class: Cognitive Difficulty
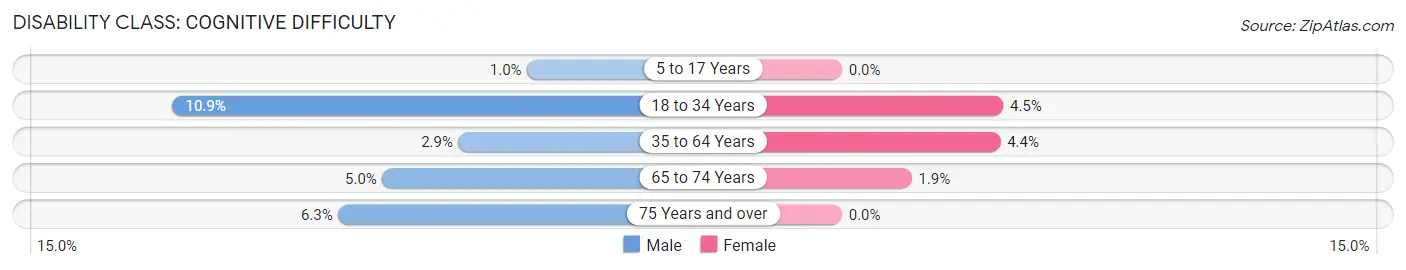
| Age Bracket | Male | Female |
| 5 to 17 Years | 13 (1.0%) | 0 (0.0%) |
| 18 to 34 Years | 213 (10.9%) | 51 (4.5%) |
| 35 to 64 Years | 105 (2.9%) | 161 (4.4%) |
| 65 to 74 Years | 38 (5.0%) | 19 (1.9%) |
| 75 Years and over | 44 (6.3%) | 0 (0.0%) |
Disability Class: Ambulatory Difficulty
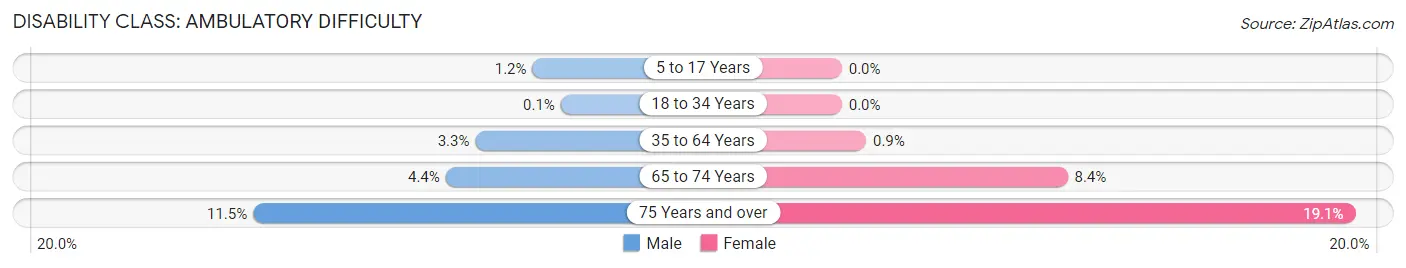
| Age Bracket | Male | Female |
| 5 to 17 Years | 15 (1.1%) | 0 (0.0%) |
| 18 to 34 Years | 2 (0.1%) | 0 (0.0%) |
| 35 to 64 Years | 118 (3.3%) | 33 (0.9%) |
| 65 to 74 Years | 33 (4.4%) | 82 (8.4%) |
| 75 Years and over | 81 (11.5%) | 170 (19.1%) |
Disability Class: Self-Care Difficulty
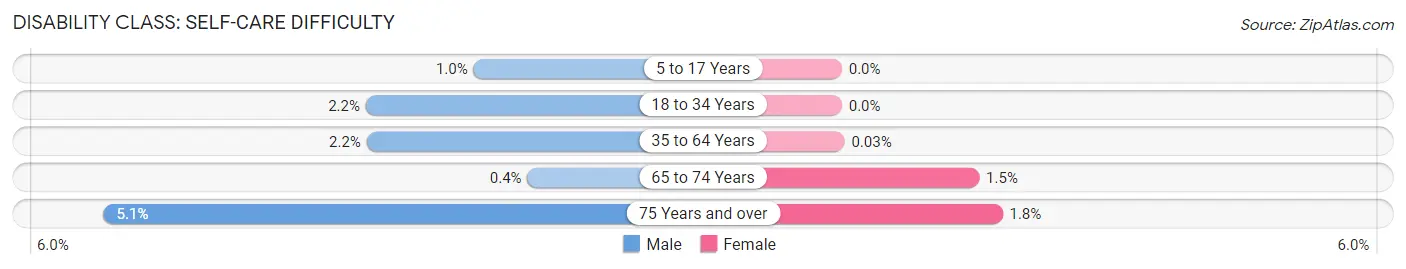
| Age Bracket | Male | Female |
| 5 to 17 Years | 13 (1.0%) | 0 (0.0%) |
| 18 to 34 Years | 43 (2.2%) | 0 (0.0%) |
| 35 to 64 Years | 79 (2.2%) | 1 (0.0%) |
| 65 to 74 Years | 3 (0.4%) | 15 (1.5%) |
| 75 Years and over | 36 (5.1%) | 16 (1.8%) |
Technology Access in Hampton Bays
Computing Device Access in Hampton Bays
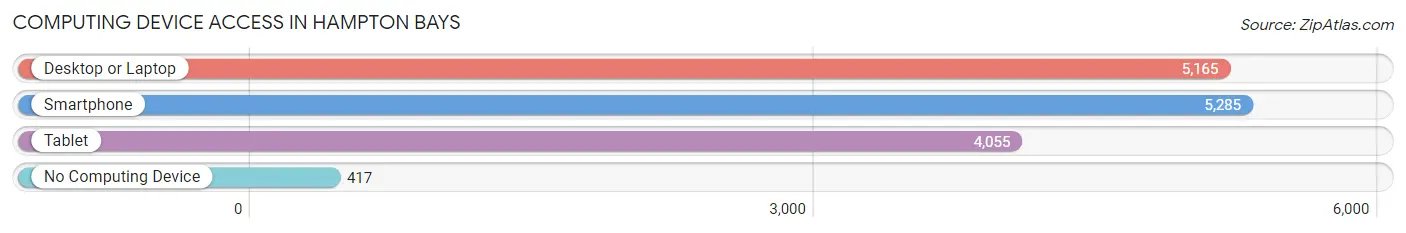
| Device Type | # Households | % Households |
| Desktop or Laptop | 5,165 | 81.7% |
| Smartphone | 5,285 | 83.5% |
| Tablet | 4,055 | 64.1% |
| No Computing Device | 417 | 6.6% |
| Total | 6,326 | 100.0% |
Internet Access in Hampton Bays
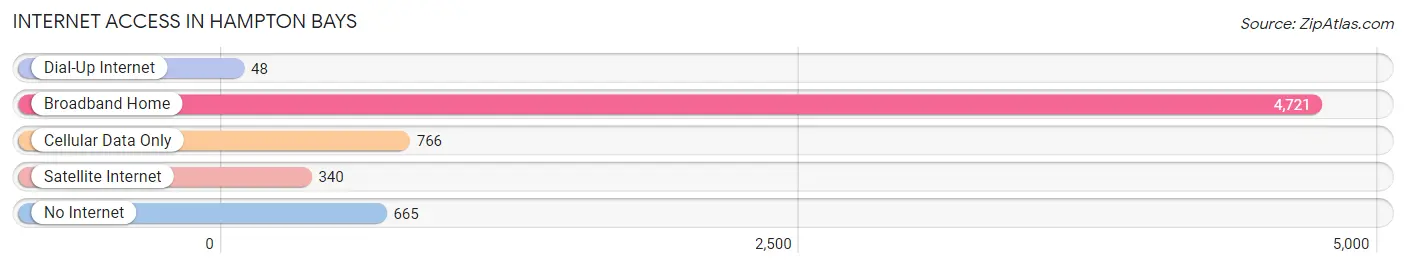
| Internet Type | # Households | % Households |
| Dial-Up Internet | 48 | 0.8% |
| Broadband Home | 4,721 | 74.6% |
| Cellular Data Only | 766 | 12.1% |
| Satellite Internet | 340 | 5.4% |
| No Internet | 665 | 10.5% |
| Total | 6,326 | 100.0% |
Hampton Bays Summary
Hampton Bays is a hamlet located in the Town of Southampton in Suffolk County, New York. It is situated on the South Shore of Long Island, approximately 80 miles east of New York City. The hamlet is bordered by Shinnecock Bay to the south, the Great Peconic Bay to the north, and the Shinnecock Canal to the west.
History
The area now known as Hampton Bays was originally inhabited by the Shinnecock Indians, who were part of the Algonquin Nation. The Shinnecock were a peaceful tribe who lived off the land, fishing, hunting, and gathering shellfish. The first European settlers arrived in the area in the late 1600s, and the hamlet was officially established in 1740.
The hamlet was originally known as Good Ground, and was renamed Hampton Bays in 1878. The name is derived from the fact that the area was a popular spot for whalers and fishermen to anchor their boats in the bay.
Geography
Hampton Bays is located on the South Shore of Long Island, approximately 80 miles east of New York City. The hamlet is bordered by Shinnecock Bay to the south, the Great Peconic Bay to the north, and the Shinnecock Canal to the west. The hamlet is situated on a peninsula, with the Shinnecock Canal forming the western border and the Great Peconic Bay forming the eastern border.
The hamlet is home to several beaches, including Ponquogue Beach, Tiana Beach, and Westhampton Beach. The hamlet is also home to several parks, including the Shinnecock Canal Park, the Tiana Beach Park, and the Westhampton Beach Park.
Economy
The economy of Hampton Bays is largely based on tourism and fishing. The hamlet is home to several marinas, which provide services to recreational and commercial fishermen. The hamlet is also home to several restaurants, bars, and shops, which cater to tourists and locals alike.
The hamlet is also home to several large employers, including the Hampton Bays School District, the Hampton Bays Fire Department, and the Hampton Bays Public Library.
Demographics
As of the 2010 census, the population of Hampton Bays was 13,603. The racial makeup of the hamlet was 87.3% White, 5.2% Hispanic or Latino, 3.2% African American, 1.7% Asian, and 0.8% Native American.
The median household income in Hampton Bays was $68,945, and the median family income was $77,917. The per capita income was $31,945. The unemployment rate was 4.2%.
The largest age group in Hampton Bays was 25-44, which made up 33.2% of the population. The second largest age group was 45-64, which made up 28.2% of the population. The median age was 41.7 years.
Common Questions
What is the Total Population of Hampton Bays?
Total Population of Hampton Bays is 16,939.
What is the Total Male Population of Hampton Bays?
Total Male Population of Hampton Bays is 9,044.
What is the Total Female Population of Hampton Bays?
Total Female Population of Hampton Bays is 7,895.
What is the Ratio of Males per 100 Females in Hampton Bays?
There are 114.55 Males per 100 Females in Hampton Bays.
What is the Ratio of Females per 100 Males in Hampton Bays?
There are 87.30 Females per 100 Males in Hampton Bays.
What is the Median Population Age in Hampton Bays?
Median Population Age in Hampton Bays is 44.3 Years.
What is the Average Family Size in Hampton Bays
Average Family Size in Hampton Bays is 3.1 People.
What is the Average Household Size in Hampton Bays
Average Household Size in Hampton Bays is 2.7 People.
What is Per Capita Income in Hampton Bays?
Per Capita income in Hampton Bays is $58,765.
What is the Median Family Income in Hampton Bays?
Median Family Income in Hampton Bays is $135,382.
What is the Median Household income in Hampton Bays?
Median Household Income in Hampton Bays is $116,526.
What is Income or Wage Gap in Hampton Bays?
Income or Wage Gap in Hampton Bays is 9.4%.
Women in Hampton Bays earn 90.6 cents for every dollar earned by a man.
What is Inequality or Gini Index in Hampton Bays?
Inequality or Gini Index in Hampton Bays is 0.46.
How Large is the Labor Force in Hampton Bays?
There are 8,858 People in the Labor Forcein in Hampton Bays.
What is the Percentage of People in the Labor Force in Hampton Bays?
62.2% of People are in the Labor Force in Hampton Bays.
What is the Unemployment Rate in Hampton Bays?
Unemployment Rate in Hampton Bays is 3.4%.