Floral Park, NY
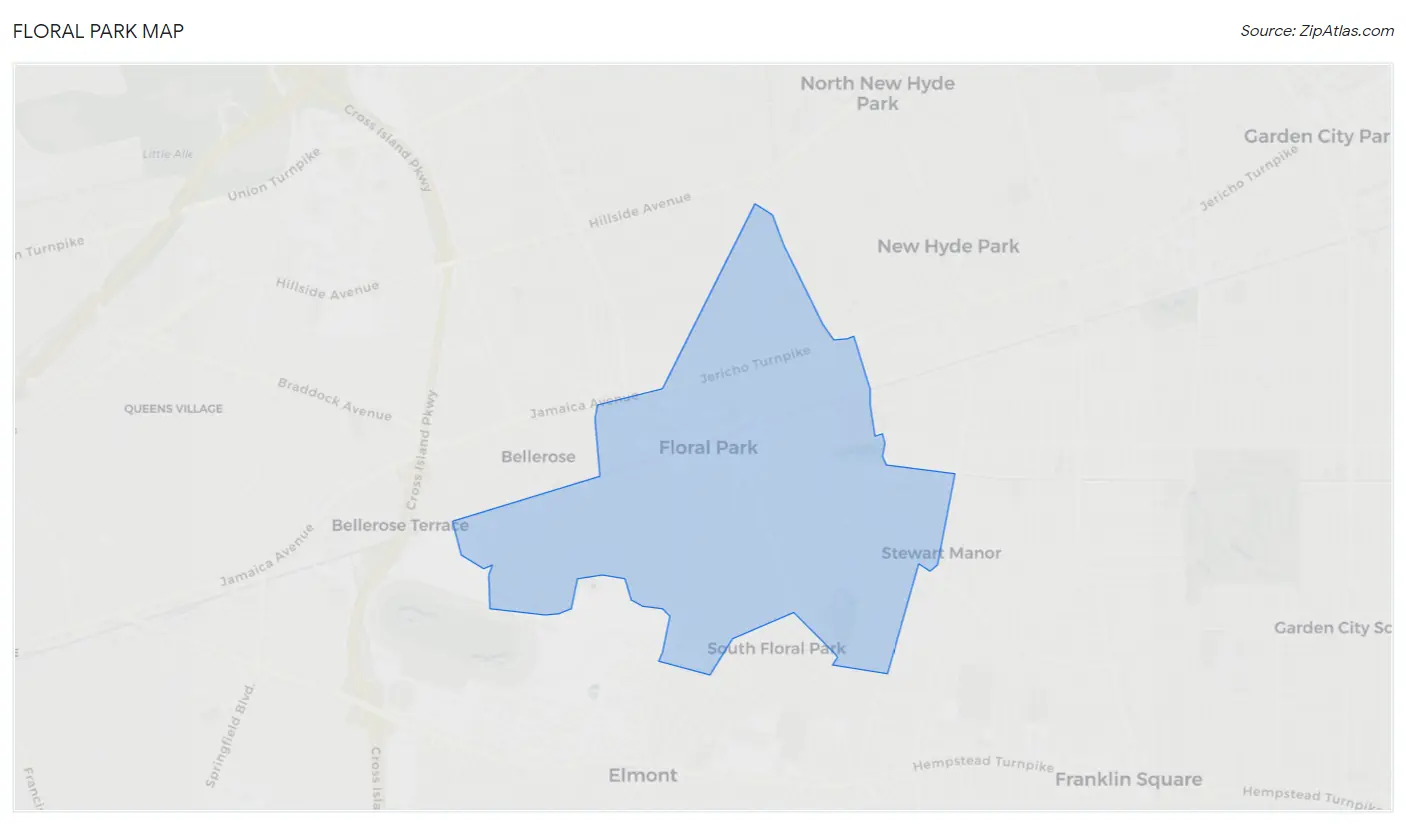
Floral Park Map
Floral Park Overview
15,892
TOTAL POPULATION
8,202
MALE POPULATION
7,690
FEMALE POPULATION
106.66
MALES / 100 FEMALES
93.76
FEMALES / 100 MALES
44.0
MEDIAN AGE
3.3
AVG FAMILY SIZE
2.9
AVG HOUSEHOLD SIZE
$68,568
PER CAPITA INCOME
$183,242
AVG FAMILY INCOME
$153,659
AVG HOUSEHOLD INCOME
28.5%
WAGE / INCOME GAP [ % ]
71.5¢/ $1
WAGE / INCOME GAP [ $ ]
$9,673
FAMILY INCOME DEFICIT
0.44
INEQUALITY / GINI INDEX
8,863
LABOR FORCE [ PEOPLE ]
68.9%
PERCENT IN LABOR FORCE
3.8%
UNEMPLOYMENT RATE
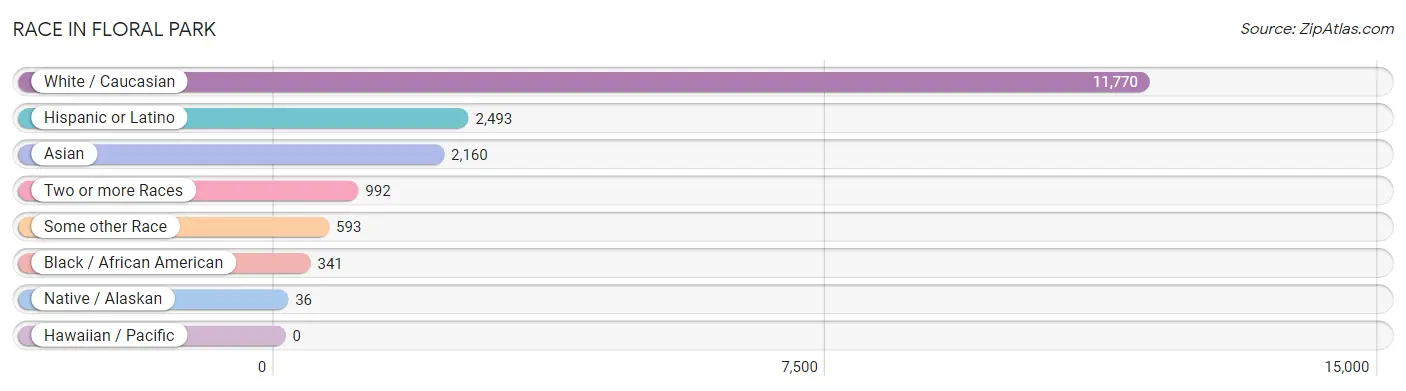
Race in Floral Park
The most populous races in Floral Park are White / Caucasian (11,770 | 74.1%), Hispanic or Latino (2,493 | 15.7%), and Asian (2,160 | 13.6%).
| Race | # Population | % Population |
| Asian | 2,160 | 13.6% |
| Black / African American | 341 | 2.1% |
| Hawaiian / Pacific | 0 | 0.0% |
| Hispanic or Latino | 2,493 | 15.7% |
| Native / Alaskan | 36 | 0.2% |
| White / Caucasian | 11,770 | 74.1% |
| Two or more Races | 992 | 6.2% |
| Some other Race | 593 | 3.7% |
| Total | 15,892 | 100.0% |
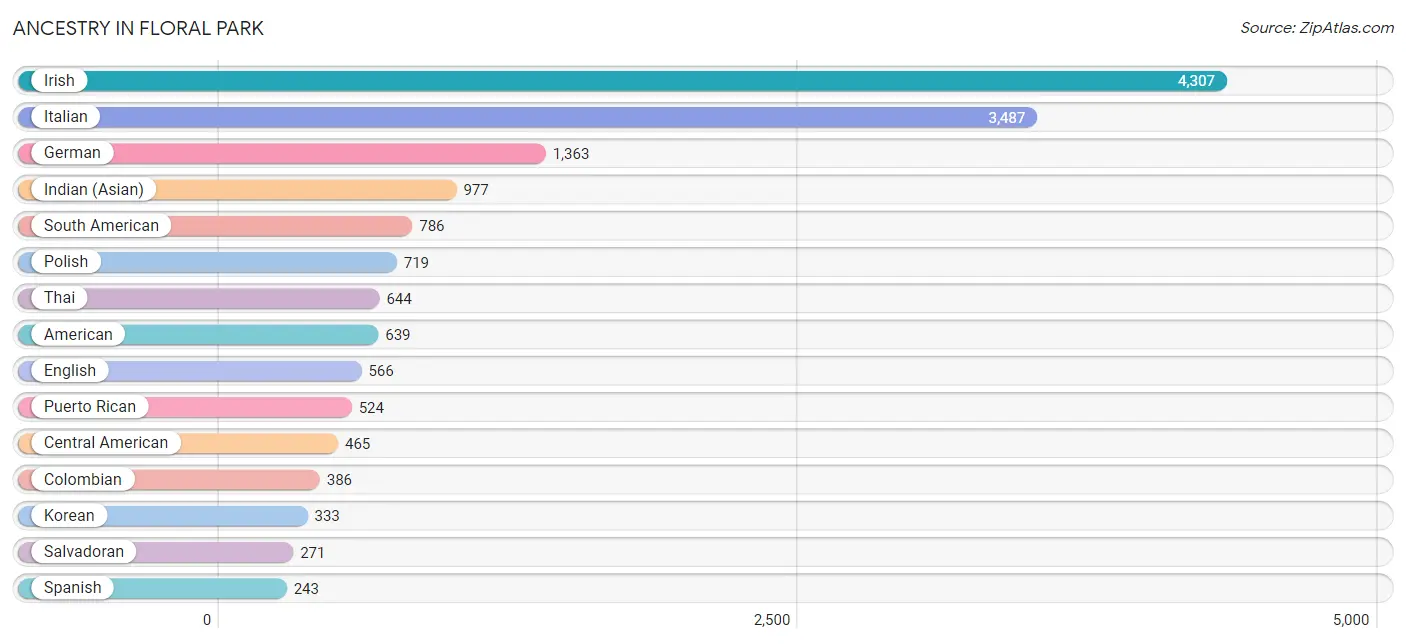
Ancestry in Floral Park
The most populous ancestries reported in Floral Park are Irish (4,307 | 27.1%), Italian (3,487 | 21.9%), German (1,363 | 8.6%), Indian (Asian) (977 | 6.1%), and South American (786 | 5.0%), together accounting for 68.7% of all Floral Park residents.
| Ancestry | # Population | % Population |
| Afghan | 4 | 0.0% |
| Albanian | 24 | 0.2% |
| American | 639 | 4.0% |
| Arab | 8 | 0.1% |
| Argentinean | 99 | 0.6% |
| Armenian | 66 | 0.4% |
| Austrian | 113 | 0.7% |
| Belgian | 7 | 0.0% |
| Bhutanese | 15 | 0.1% |
| British | 148 | 0.9% |
| Burmese | 20 | 0.1% |
| Canadian | 11 | 0.1% |
| Central American | 465 | 2.9% |
| Central American Indian | 16 | 0.1% |
| Chilean | 9 | 0.1% |
| Colombian | 386 | 2.4% |
| Comanche | 1 | 0.0% |
| Croatian | 38 | 0.2% |
| Cuban | 102 | 0.6% |
| Czech | 71 | 0.4% |
| Danish | 71 | 0.4% |
| Dominican | 194 | 1.2% |
| Dutch | 74 | 0.5% |
| Eastern European | 55 | 0.4% |
| Ecuadorian | 82 | 0.5% |
| English | 566 | 3.6% |
| European | 85 | 0.5% |
| Filipino | 19 | 0.1% |
| French | 193 | 1.2% |
| French Canadian | 21 | 0.1% |
| German | 1,363 | 8.6% |
| Greek | 94 | 0.6% |
| Guatemalan | 68 | 0.4% |
| Guyanese | 28 | 0.2% |
| Haitian | 25 | 0.2% |
| Honduran | 92 | 0.6% |
| Hungarian | 118 | 0.7% |
| Indian (Asian) | 977 | 6.1% |
| Iranian | 11 | 0.1% |
| Iraqi | 8 | 0.1% |
| Irish | 4,307 | 27.1% |
| Iroquois | 16 | 0.1% |
| Israeli | 8 | 0.1% |
| Italian | 3,487 | 21.9% |
| Jamaican | 14 | 0.1% |
| Korean | 333 | 2.1% |
| Laotian | 21 | 0.1% |
| Latvian | 29 | 0.2% |
| Lithuanian | 87 | 0.5% |
| Maltese | 32 | 0.2% |
| Mexican | 48 | 0.3% |
| Mexican American Indian | 1 | 0.0% |
| Mongolian | 49 | 0.3% |
| Navajo | 15 | 0.1% |
| Nicaraguan | 34 | 0.2% |
| Northern European | 8 | 0.1% |
| Norwegian | 41 | 0.3% |
| Paraguayan | 60 | 0.4% |
| Peruvian | 112 | 0.7% |
| Polish | 719 | 4.5% |
| Portuguese | 45 | 0.3% |
| Puerto Rican | 524 | 3.3% |
| Romanian | 8 | 0.1% |
| Russian | 53 | 0.3% |
| Salvadoran | 271 | 1.7% |
| Scandinavian | 21 | 0.1% |
| Scotch-Irish | 63 | 0.4% |
| Scottish | 102 | 0.6% |
| Serbian | 19 | 0.1% |
| Slavic | 11 | 0.1% |
| Slovak | 29 | 0.2% |
| Slovene | 24 | 0.2% |
| South American | 786 | 5.0% |
| South American Indian | 11 | 0.1% |
| Spaniard | 36 | 0.2% |
| Spanish | 243 | 1.5% |
| Subsaharan African | 4 | 0.0% |
| Swedish | 33 | 0.2% |
| Swiss | 35 | 0.2% |
| Thai | 644 | 4.1% |
| Trinidadian and Tobagonian | 6 | 0.0% |
| Turkish | 67 | 0.4% |
| Ukrainian | 86 | 0.5% |
| Venezuelan | 24 | 0.2% |
| Welsh | 35 | 0.2% |
| Yugoslavian | 11 | 0.1% | View All 86 Rows |
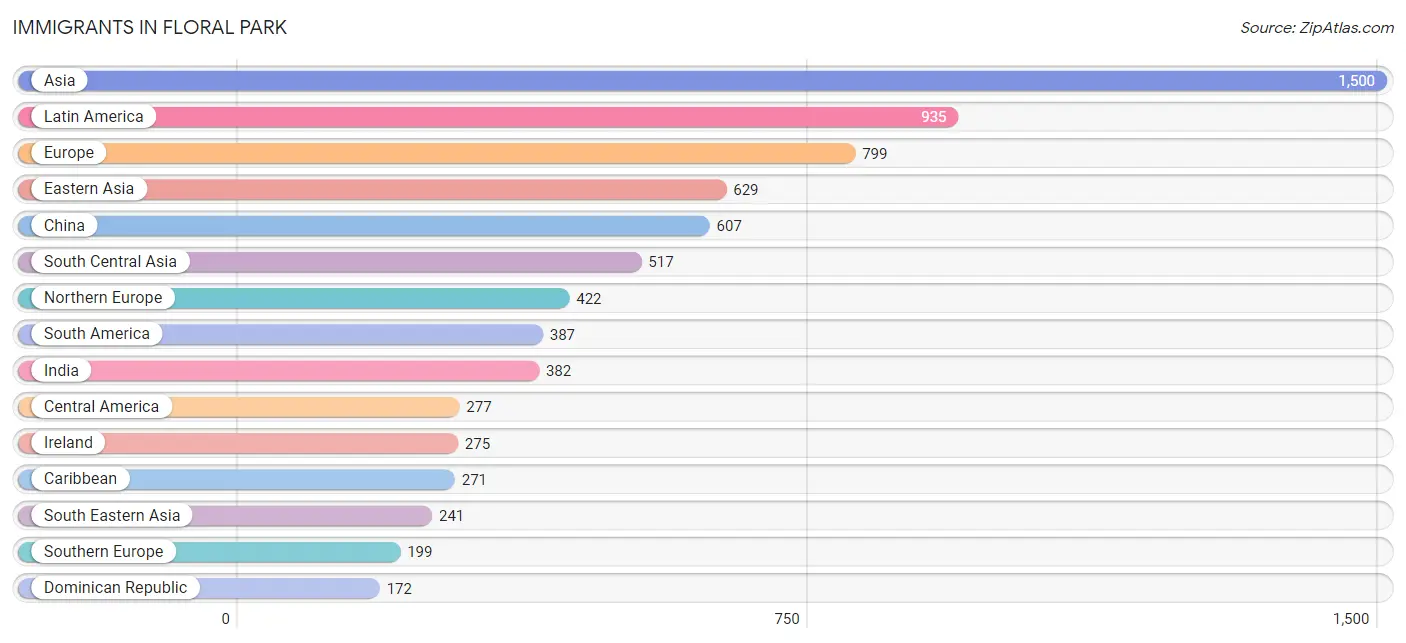
Immigrants in Floral Park
The most numerous immigrant groups reported in Floral Park came from Asia (1,500 | 9.4%), Latin America (935 | 5.9%), Europe (799 | 5.0%), Eastern Asia (629 | 4.0%), and China (607 | 3.8%), together accounting for 28.1% of all Floral Park residents.
| Immigration Origin | # Population | % Population |
| Afghanistan | 8 | 0.1% |
| Africa | 10 | 0.1% |
| Argentina | 85 | 0.5% |
| Asia | 1,500 | 9.4% |
| Austria | 4 | 0.0% |
| Bangladesh | 15 | 0.1% |
| Belarus | 5 | 0.0% |
| Brazil | 36 | 0.2% |
| Canada | 3 | 0.0% |
| Caribbean | 271 | 1.7% |
| Central America | 277 | 1.7% |
| Chile | 9 | 0.1% |
| China | 607 | 3.8% |
| Colombia | 72 | 0.4% |
| Cuba | 21 | 0.1% |
| Dominican Republic | 172 | 1.1% |
| Eastern Africa | 10 | 0.1% |
| Eastern Asia | 629 | 4.0% |
| Eastern Europe | 122 | 0.8% |
| Ecuador | 3 | 0.0% |
| El Salvador | 101 | 0.6% |
| England | 67 | 0.4% |
| Europe | 799 | 5.0% |
| Germany | 52 | 0.3% |
| Guatemala | 106 | 0.7% |
| Guyana | 53 | 0.3% |
| Haiti | 64 | 0.4% |
| Honduras | 36 | 0.2% |
| Hong Kong | 36 | 0.2% |
| Hungary | 50 | 0.3% |
| India | 382 | 2.4% |
| Indonesia | 9 | 0.1% |
| Iran | 37 | 0.2% |
| Iraq | 8 | 0.1% |
| Ireland | 275 | 1.7% |
| Italy | 158 | 1.0% |
| Jamaica | 14 | 0.1% |
| Japan | 9 | 0.1% |
| Korea | 13 | 0.1% |
| Latin America | 935 | 5.9% |
| Malaysia | 66 | 0.4% |
| Nicaragua | 34 | 0.2% |
| Northern Europe | 422 | 2.7% |
| Pakistan | 41 | 0.3% |
| Peru | 74 | 0.5% |
| Philippines | 148 | 0.9% |
| Poland | 51 | 0.3% |
| Romania | 8 | 0.1% |
| South America | 387 | 2.4% |
| South Central Asia | 517 | 3.3% |
| South Eastern Asia | 241 | 1.5% |
| Southern Europe | 199 | 1.3% |
| Spain | 36 | 0.2% |
| Sri Lanka | 34 | 0.2% |
| Sweden | 11 | 0.1% |
| Taiwan | 71 | 0.4% |
| Turkey | 105 | 0.7% |
| Western Asia | 113 | 0.7% |
| Western Europe | 56 | 0.4% | View All 59 Rows |
Sex and Age in Floral Park
Sex and Age in Floral Park
The most populous age groups in Floral Park are 40 to 44 Years (712 | 8.7%) for men and 40 to 44 Years (642 | 8.4%) for women.
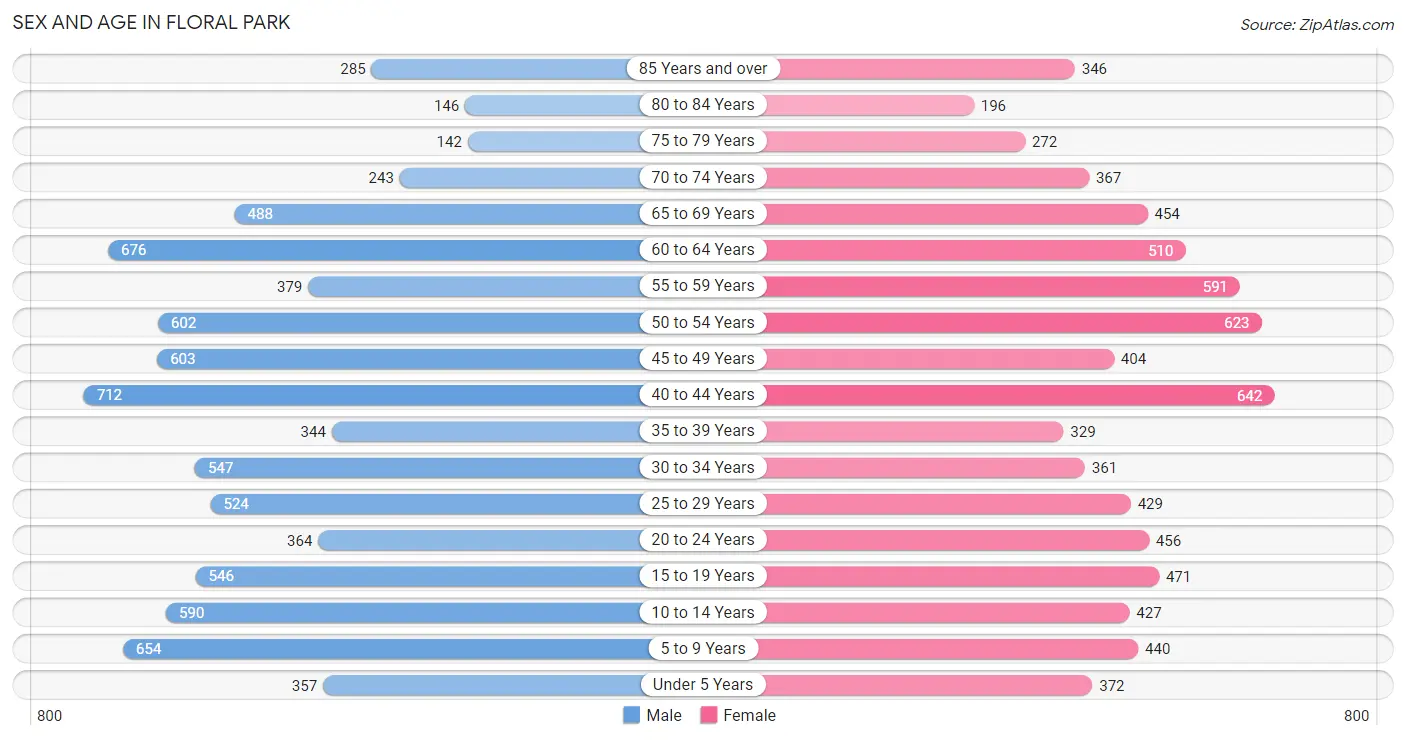
| Age Bracket | Male | Female |
| Under 5 Years | 357 (4.3%) | 372 (4.8%) |
| 5 to 9 Years | 654 (8.0%) | 440 (5.7%) |
| 10 to 14 Years | 590 (7.2%) | 427 (5.6%) |
| 15 to 19 Years | 546 (6.7%) | 471 (6.1%) |
| 20 to 24 Years | 364 (4.4%) | 456 (5.9%) |
| 25 to 29 Years | 524 (6.4%) | 429 (5.6%) |
| 30 to 34 Years | 547 (6.7%) | 361 (4.7%) |
| 35 to 39 Years | 344 (4.2%) | 329 (4.3%) |
| 40 to 44 Years | 712 (8.7%) | 642 (8.4%) |
| 45 to 49 Years | 603 (7.3%) | 404 (5.2%) |
| 50 to 54 Years | 602 (7.3%) | 623 (8.1%) |
| 55 to 59 Years | 379 (4.6%) | 591 (7.7%) |
| 60 to 64 Years | 676 (8.2%) | 510 (6.6%) |
| 65 to 69 Years | 488 (5.9%) | 454 (5.9%) |
| 70 to 74 Years | 243 (3.0%) | 367 (4.8%) |
| 75 to 79 Years | 142 (1.7%) | 272 (3.5%) |
| 80 to 84 Years | 146 (1.8%) | 196 (2.5%) |
| 85 Years and over | 285 (3.5%) | 346 (4.5%) |
| Total | 8,202 (100.0%) | 7,690 (100.0%) |
Families and Households in Floral Park
Median Family Size in Floral Park
The median family size in Floral Park is 3.30 persons per family, with married-couple families (3,759 | 87.2%) accounting for the largest median family size of 3.37 persons per family. On the other hand, single male/father families (188 | 4.4%) represent the smallest median family size with 2.58 persons per family.
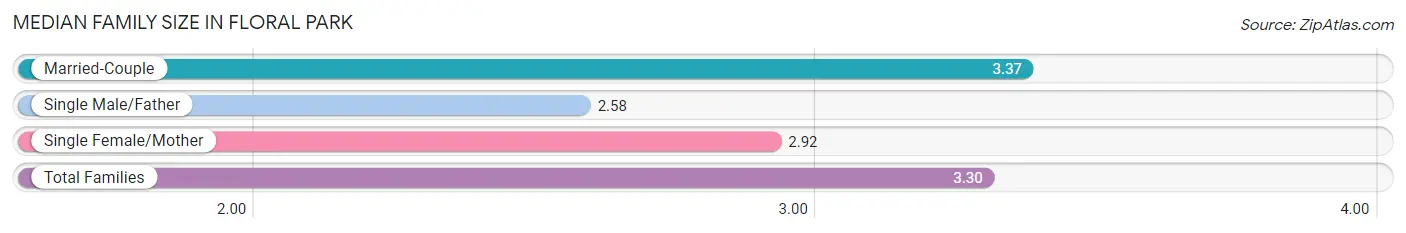
| Family Type | # Families | Family Size |
| Married-Couple | 3,759 (87.2%) | 3.37 |
| Single Male/Father | 188 (4.4%) | 2.58 |
| Single Female/Mother | 365 (8.5%) | 2.92 |
| Total Families | 4,312 (100.0%) | 3.30 |
Median Household Size in Floral Park
The median household size in Floral Park is 2.89 persons per household, with married-couple households (3,759 | 68.4%) accounting for the largest median household size of 3.41 persons per household. non-family households (1,186 | 21.6%) represent the smallest median household size with 1.18 persons per household.
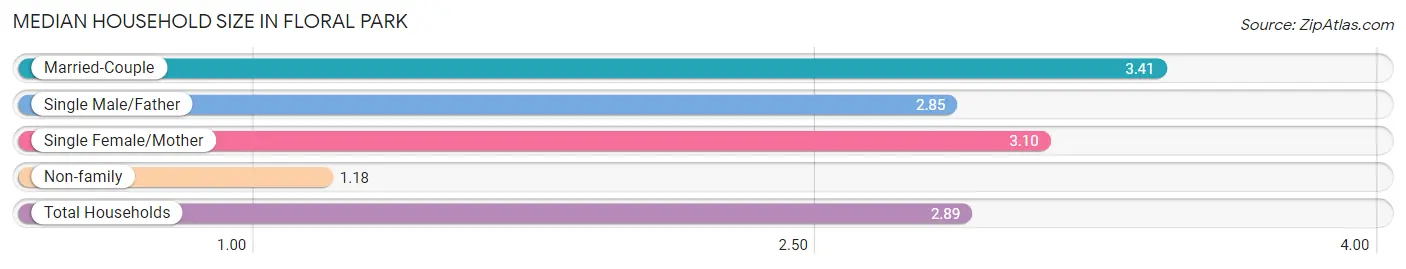
| Household Type | # Households | Household Size |
| Married-Couple | 3,759 (68.4%) | 3.41 |
| Single Male/Father | 188 (3.4%) | 2.85 |
| Single Female/Mother | 365 (6.6%) | 3.10 |
| Non-family | 1,186 (21.6%) | 1.18 |
| Total Households | 5,498 (100.0%) | 2.89 |
Household Size by Marriage Status in Floral Park
Out of a total of 5,498 households in Floral Park, 4,312 (78.4%) are family households, while 1,186 (21.6%) are nonfamily households. The most numerous type of family households are 2-person households, comprising 1,602, and the most common type of nonfamily households are 1-person households, comprising 969.
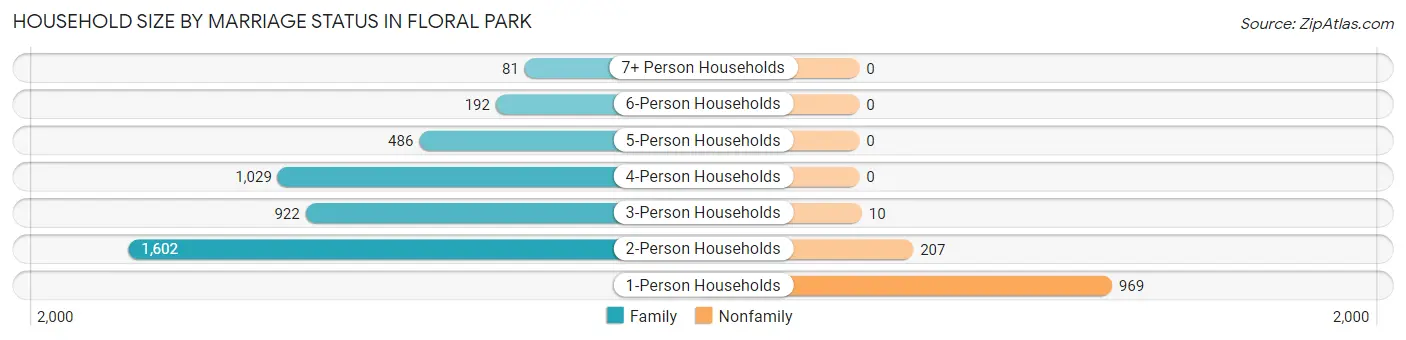
| Household Size | Family Households | Nonfamily Households |
| 1-Person Households | - | 969 (17.6%) |
| 2-Person Households | 1,602 (29.1%) | 207 (3.8%) |
| 3-Person Households | 922 (16.8%) | 10 (0.2%) |
| 4-Person Households | 1,029 (18.7%) | 0 (0.0%) |
| 5-Person Households | 486 (8.8%) | 0 (0.0%) |
| 6-Person Households | 192 (3.5%) | 0 (0.0%) |
| 7+ Person Households | 81 (1.5%) | 0 (0.0%) |
| Total | 4,312 (78.4%) | 1,186 (21.6%) |
Female Fertility in Floral Park
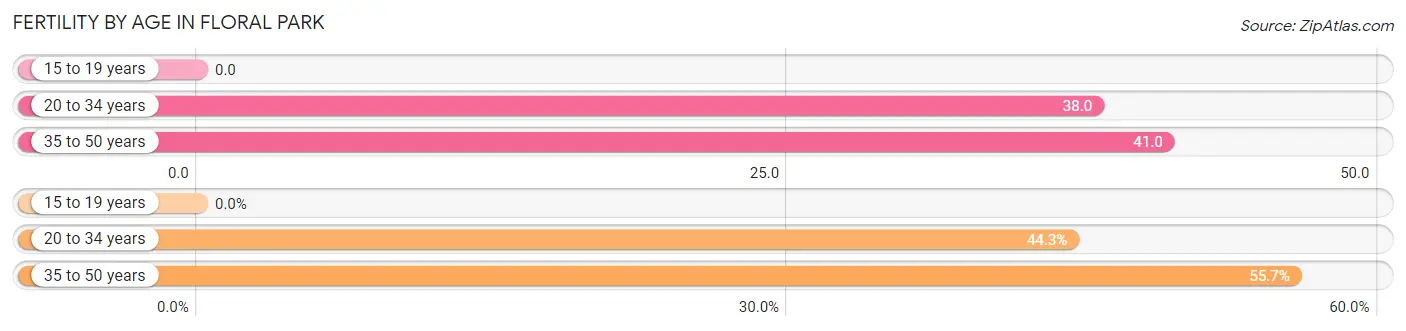
Fertility by Age in Floral Park
Average fertility rate in Floral Park is 33.0 births per 1,000 women. Women in the age bracket of 35 to 50 years have the highest fertility rate with 41.0 births per 1,000 women. Women in the age bracket of 35 to 50 years acount for 55.7% of all women with births.
| Age Bracket | Women with Births | Births / 1,000 Women |
| 15 to 19 years | 0 (0.0%) | 0.0 |
| 20 to 34 years | 47 (44.3%) | 38.0 |
| 35 to 50 years | 59 (55.7%) | 41.0 |
| Total | 106 (100.0%) | 33.0 |
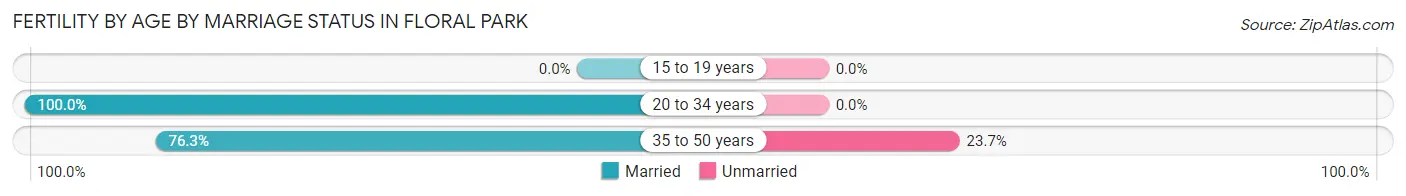
Fertility by Age by Marriage Status in Floral Park
86.8% of women with births (106) in Floral Park are married. The highest percentage of unmarried women with births falls into 35 to 50 years age bracket with 23.7% of them unmarried at the time of birth, while the lowest percentage of unmarried women with births belong to 20 to 34 years age bracket with 0.0% of them unmarried.
| Age Bracket | Married | Unmarried |
| 15 to 19 years | 0 (0.0%) | 0 (0.0%) |
| 20 to 34 years | 47 (100.0%) | 0 (0.0%) |
| 35 to 50 years | 45 (76.3%) | 14 (23.7%) |
| Total | 92 (86.8%) | 14 (13.2%) |
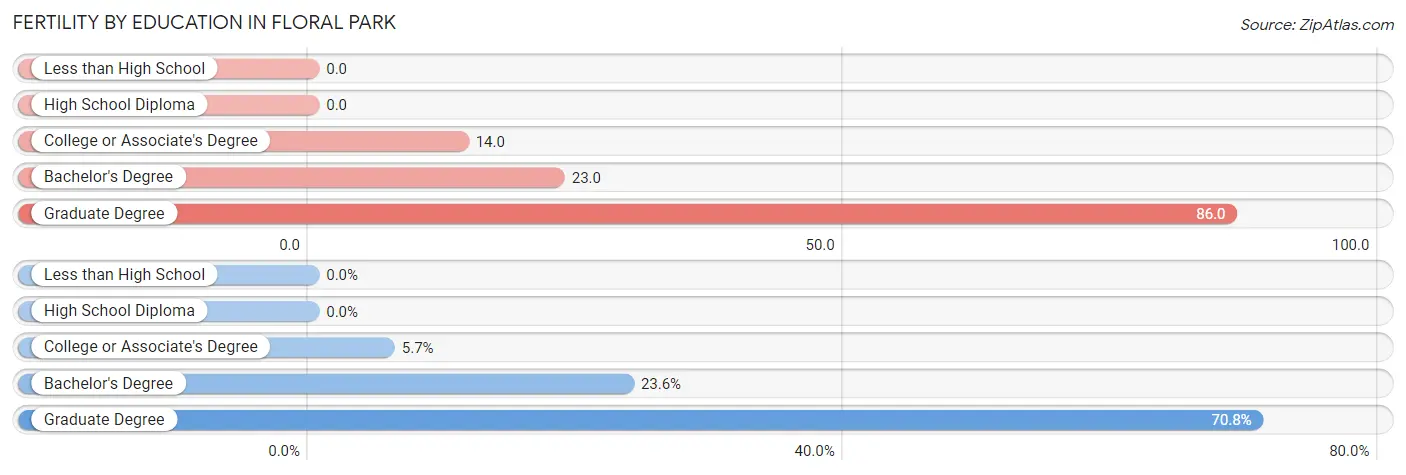
Fertility by Education in Floral Park
| Educational Attainment | Women with Births | Births / 1,000 Women |
| Less than High School | 0 (0.0%) | 0.0 |
| High School Diploma | 0 (0.0%) | 0.0 |
| College or Associate's Degree | 6 (5.7%) | 14.0 |
| Bachelor's Degree | 25 (23.6%) | 23.0 |
| Graduate Degree | 75 (70.8%) | 86.0 |
| Total | 106 (100.0%) | 33.0 |
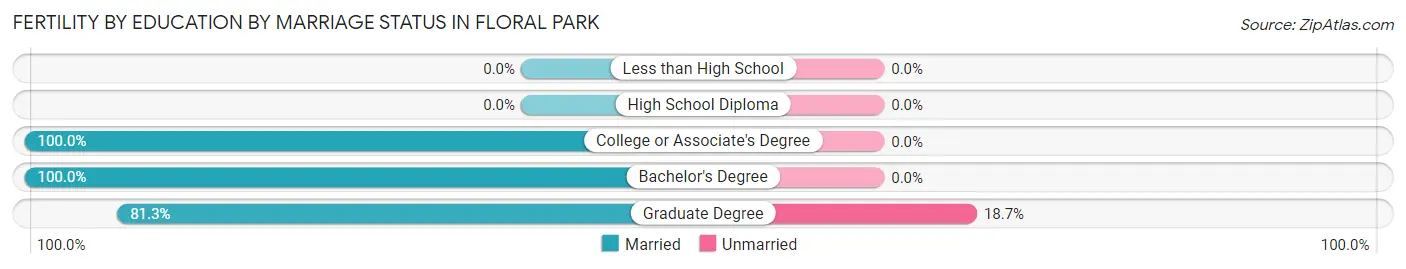
Fertility by Education by Marriage Status in Floral Park
13.2% of women with births in Floral Park are unmarried. Women with the educational attainment of college or associate's degree are most likely to be married with 100.0% of them married at childbirth, while women with the educational attainment of graduate degree are least likely to be married with 18.7% of them unmarried at childbirth.
| Educational Attainment | Married | Unmarried |
| Less than High School | 0 (0.0%) | 0 (0.0%) |
| High School Diploma | 0 (0.0%) | 0 (0.0%) |
| College or Associate's Degree | 6 (100.0%) | 0 (0.0%) |
| Bachelor's Degree | 25 (100.0%) | 0 (0.0%) |
| Graduate Degree | 61 (81.3%) | 14 (18.7%) |
| Total | 92 (86.8%) | 14 (13.2%) |
Income in Floral Park
Income Overview in Floral Park
Per Capita Income in Floral Park is $68,568, while median incomes of families and households are $183,242 and $153,659 respectively.
| Characteristic | Number | Measure |
| Per Capita Income | 15,892 | $68,568 |
| Median Family Income | 4,312 | $183,242 |
| Mean Family Income | 4,312 | $219,059 |
| Median Household Income | 5,498 | $153,659 |
| Mean Household Income | 5,498 | $193,958 |
| Income Deficit | 4,312 | $9,673 |
| Wage / Income Gap (%) | 15,892 | 28.46% |
| Wage / Income Gap ($) | 15,892 | 71.54¢ per $1 |
| Gini / Inequality Index | 15,892 | 0.44 |
Earnings by Sex in Floral Park
Average Earnings in Floral Park are $74,239, $83,617 for men and $59,820 for women, a difference of 28.5%.
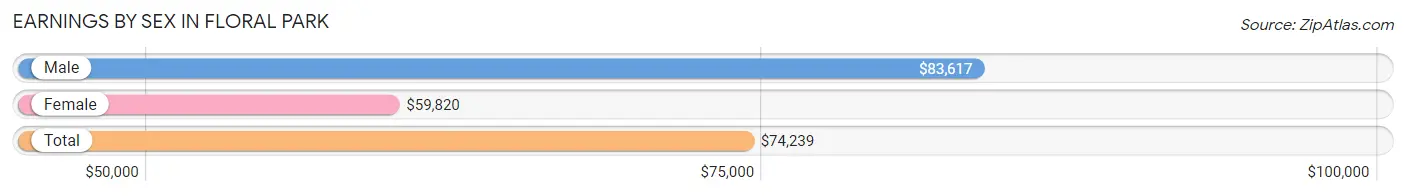
| Sex | Number | Average Earnings |
| Male | 5,014 (54.6%) | $83,617 |
| Female | 4,168 (45.4%) | $59,820 |
| Total | 9,182 (100.0%) | $74,239 |
Earnings by Sex by Income Bracket in Floral Park
The most common earnings brackets in Floral Park are $100,000+ for men (2,070 | 41.3%) and $100,000+ for women (1,327 | 31.8%).
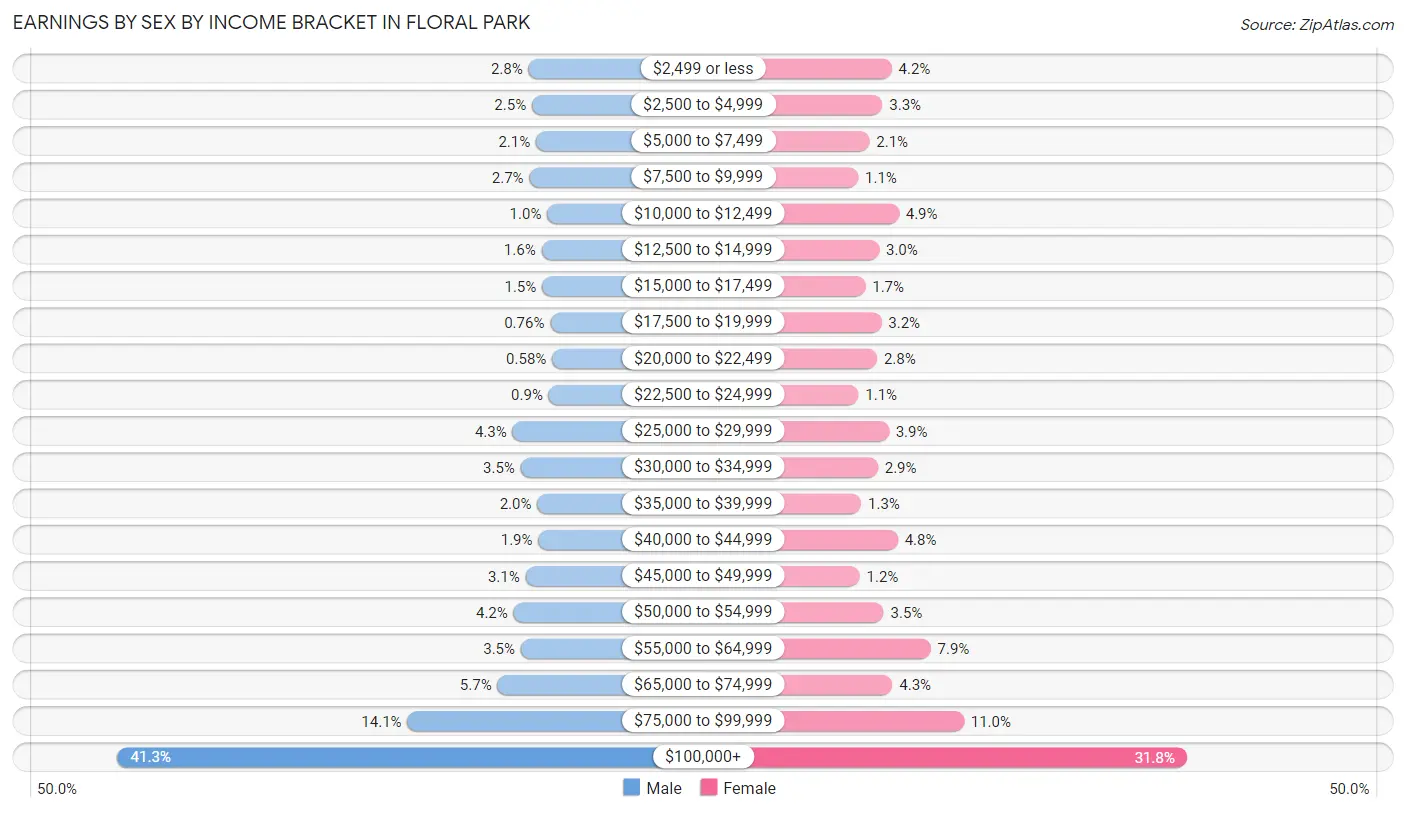
| Income | Male | Female |
| $2,499 or less | 140 (2.8%) | 175 (4.2%) |
| $2,500 to $4,999 | 124 (2.5%) | 139 (3.3%) |
| $5,000 to $7,499 | 105 (2.1%) | 88 (2.1%) |
| $7,500 to $9,999 | 136 (2.7%) | 44 (1.1%) |
| $10,000 to $12,499 | 52 (1.0%) | 203 (4.9%) |
| $12,500 to $14,999 | 79 (1.6%) | 126 (3.0%) |
| $15,000 to $17,499 | 76 (1.5%) | 72 (1.7%) |
| $17,500 to $19,999 | 38 (0.8%) | 135 (3.2%) |
| $20,000 to $22,499 | 29 (0.6%) | 118 (2.8%) |
| $22,500 to $24,999 | 45 (0.9%) | 45 (1.1%) |
| $25,000 to $29,999 | 215 (4.3%) | 164 (3.9%) |
| $30,000 to $34,999 | 177 (3.5%) | 121 (2.9%) |
| $35,000 to $39,999 | 99 (2.0%) | 56 (1.3%) |
| $40,000 to $44,999 | 94 (1.9%) | 199 (4.8%) |
| $45,000 to $49,999 | 154 (3.1%) | 50 (1.2%) |
| $50,000 to $54,999 | 210 (4.2%) | 144 (3.5%) |
| $55,000 to $64,999 | 176 (3.5%) | 327 (7.9%) |
| $65,000 to $74,999 | 286 (5.7%) | 178 (4.3%) |
| $75,000 to $99,999 | 709 (14.1%) | 457 (11.0%) |
| $100,000+ | 2,070 (41.3%) | 1,327 (31.8%) |
| Total | 5,014 (100.0%) | 4,168 (100.0%) |
Earnings by Sex by Educational Attainment in Floral Park
Average earnings in Floral Park are $93,143 for men and $71,193 for women, a difference of 23.6%. Men with an educational attainment of graduate degree enjoy the highest average annual earnings of $121,136, while those with less than high school education earn the least with $29,522. Women with an educational attainment of graduate degree earn the most with the average annual earnings of $108,750, while those with high school diploma education have the smallest earnings of $17,664.
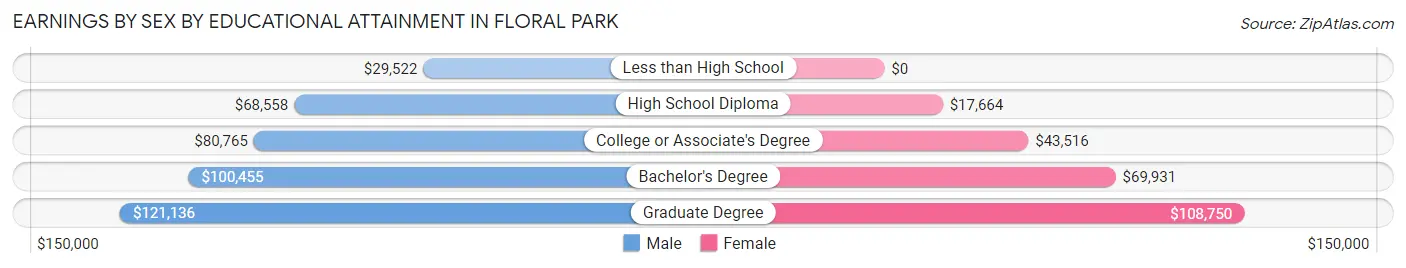
| Educational Attainment | Male Income | Female Income |
| Less than High School | $29,522 | $0 |
| High School Diploma | $68,558 | $17,664 |
| College or Associate's Degree | $80,765 | $43,516 |
| Bachelor's Degree | $100,455 | $69,931 |
| Graduate Degree | $121,136 | $108,750 |
| Total | $93,143 | $71,193 |
Family Income in Floral Park
Family Income Brackets in Floral Park
According to the Floral Park family income data, there are 1,846 families falling into the $200,000+ income range, which is the most common income bracket and makes up 42.8% of all families. Conversely, the less than $10,000 income bracket is the least frequent group with only 13 families (0.3%) belonging to this category.
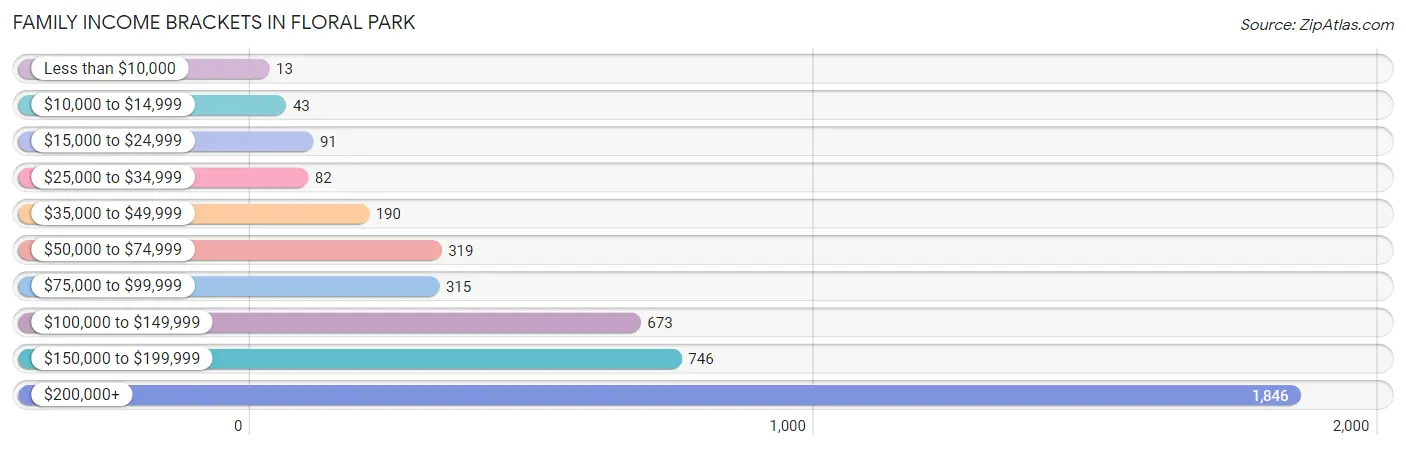
| Income Bracket | # Families | % Families |
| Less than $10,000 | 13 | 0.3% |
| $10,000 to $14,999 | 43 | 1.0% |
| $15,000 to $24,999 | 91 | 2.1% |
| $25,000 to $34,999 | 82 | 1.9% |
| $35,000 to $49,999 | 190 | 4.4% |
| $50,000 to $74,999 | 319 | 7.4% |
| $75,000 to $99,999 | 315 | 7.3% |
| $100,000 to $149,999 | 673 | 15.6% |
| $150,000 to $199,999 | 746 | 17.3% |
| $200,000+ | 1,846 | 42.8% |
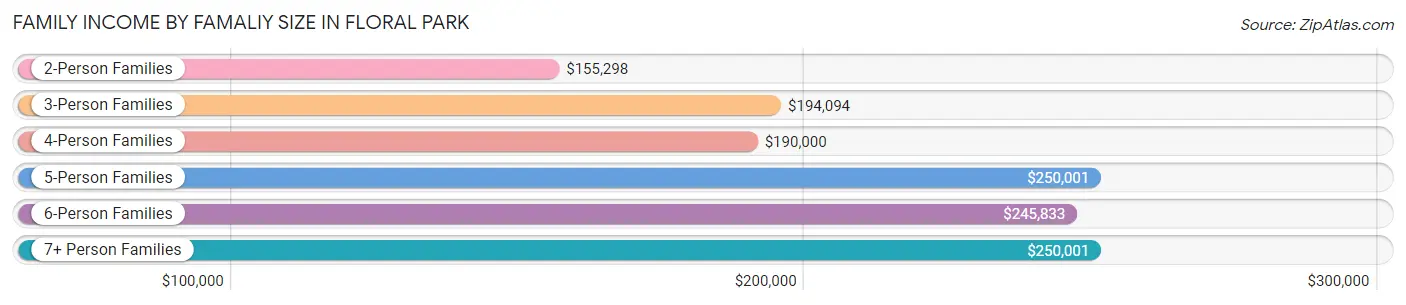
Family Income by Famaliy Size in Floral Park
5-person families (526 | 12.2%) account for the highest median family income in Floral Park with $250,001 per family, while 2-person families (1,665 | 38.6%) have the highest median income of $77,649 per family member.
| Income Bracket | # Families | Median Income |
| 2-Person Families | 1,665 (38.6%) | $155,298 |
| 3-Person Families | 885 (20.5%) | $194,094 |
| 4-Person Families | 1,032 (23.9%) | $190,000 |
| 5-Person Families | 526 (12.2%) | $250,001 |
| 6-Person Families | 146 (3.4%) | $245,833 |
| 7+ Person Families | 58 (1.3%) | $250,001 |
| Total | 4,312 (100.0%) | $183,242 |
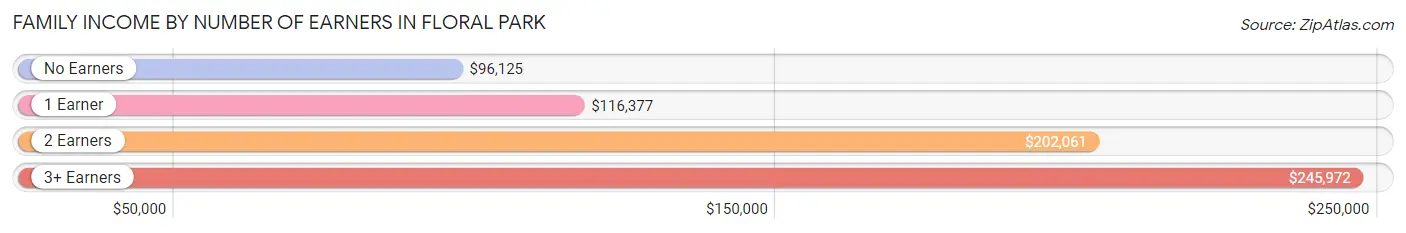
Family Income by Number of Earners in Floral Park
The median family income in Floral Park is $183,242, with families comprising 3+ earners (862) having the highest median family income of $245,972, while families with no earners (465) have the lowest median family income of $96,125, accounting for 20.0% and 10.8% of families, respectively.
| Number of Earners | # Families | Median Income |
| No Earners | 465 (10.8%) | $96,125 |
| 1 Earner | 875 (20.3%) | $116,377 |
| 2 Earners | 2,110 (48.9%) | $202,061 |
| 3+ Earners | 862 (20.0%) | $245,972 |
| Total | 4,312 (100.0%) | $183,242 |
Household Income in Floral Park
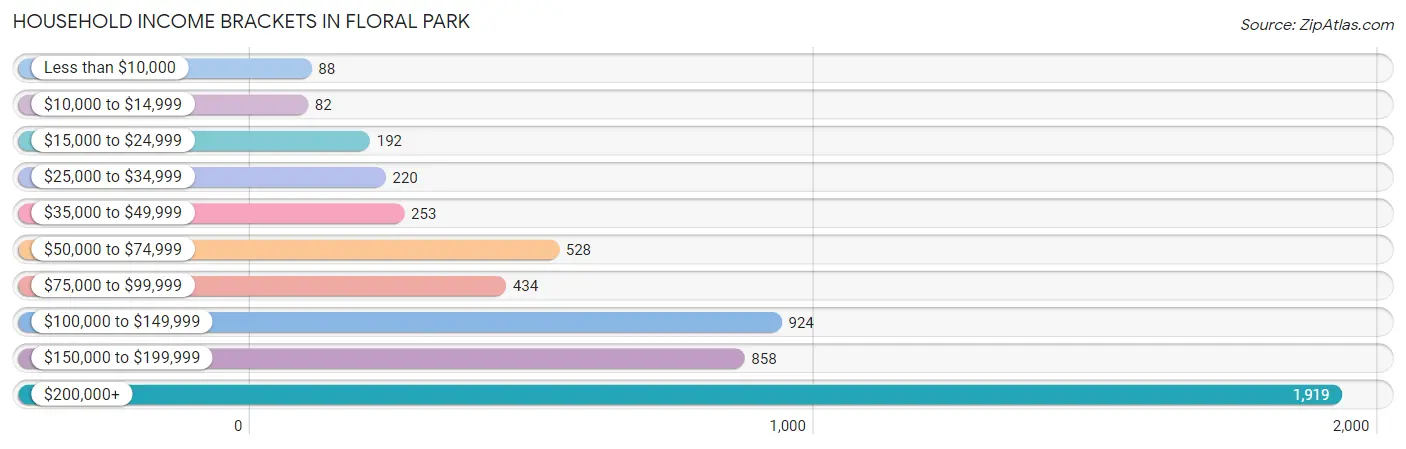
Household Income Brackets in Floral Park
With 1,919 households falling in the category, the $200,000+ income range is the most frequent in Floral Park, accounting for 34.9% of all households. In contrast, only 82 households (1.5%) fall into the $10,000 to $14,999 income bracket, making it the least populous group.
| Income Bracket | # Households | % Households |
| Less than $10,000 | 88 | 1.6% |
| $10,000 to $14,999 | 82 | 1.5% |
| $15,000 to $24,999 | 192 | 3.5% |
| $25,000 to $34,999 | 220 | 4.0% |
| $35,000 to $49,999 | 253 | 4.6% |
| $50,000 to $74,999 | 528 | 9.6% |
| $75,000 to $99,999 | 434 | 7.9% |
| $100,000 to $149,999 | 924 | 16.8% |
| $150,000 to $199,999 | 858 | 15.6% |
| $200,000+ | 1,919 | 34.9% |
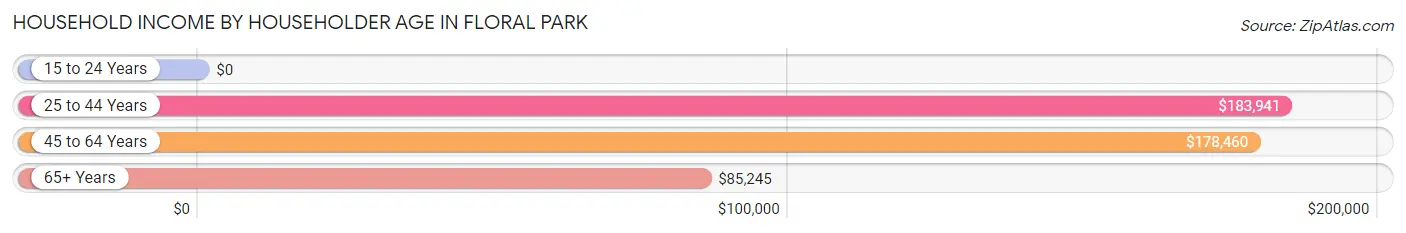
Household Income by Householder Age in Floral Park
The median household income in Floral Park is $153,659, with the highest median household income of $183,941 found in the 25 to 44 years age bracket for the primary householder. A total of 1,513 households (27.5%) fall into this category.
| Income Bracket | # Households | Median Income |
| 15 to 24 Years | 0 (0.0%) | $0 |
| 25 to 44 Years | 1,513 (27.5%) | $183,941 |
| 45 to 64 Years | 2,321 (42.2%) | $178,460 |
| 65+ Years | 1,664 (30.3%) | $85,245 |
| Total | 5,498 (100.0%) | $153,659 |
Poverty in Floral Park
Income Below Poverty by Sex and Age in Floral Park
With 3.7% poverty level for males and 3.5% for females among the residents of Floral Park, 5 year old males and 16 and 17 year old females are the most vulnerable to poverty, with 10 males (8.2%) and 25 females (11.5%) in their respective age groups living below the poverty level.
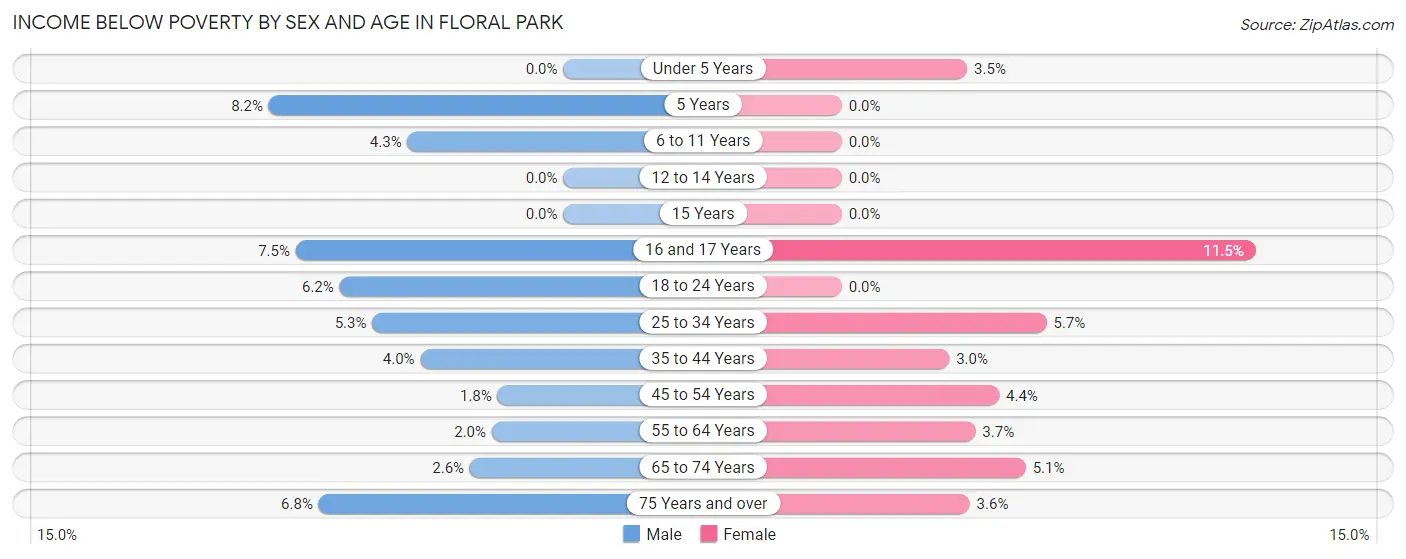
| Age Bracket | Male | Female |
| Under 5 Years | 0 (0.0%) | 13 (3.5%) |
| 5 Years | 10 (8.2%) | 0 (0.0%) |
| 6 to 11 Years | 35 (4.3%) | 0 (0.0%) |
| 12 to 14 Years | 0 (0.0%) | 0 (0.0%) |
| 15 Years | 0 (0.0%) | 0 (0.0%) |
| 16 and 17 Years | 14 (7.4%) | 25 (11.5%) |
| 18 to 24 Years | 41 (6.2%) | 0 (0.0%) |
| 25 to 34 Years | 57 (5.3%) | 45 (5.7%) |
| 35 to 44 Years | 42 (4.0%) | 29 (3.0%) |
| 45 to 54 Years | 22 (1.8%) | 45 (4.4%) |
| 55 to 64 Years | 21 (2.0%) | 41 (3.7%) |
| 65 to 74 Years | 19 (2.6%) | 42 (5.1%) |
| 75 Years and over | 39 (6.8%) | 29 (3.6%) |
| Total | 300 (3.7%) | 269 (3.5%) |
Income Above Poverty by Sex and Age in Floral Park
According to the poverty statistics in Floral Park, males aged under 5 years and females aged 5 years are the age groups that are most secure financially, with 100.0% of males and 100.0% of females in these age groups living above the poverty line.
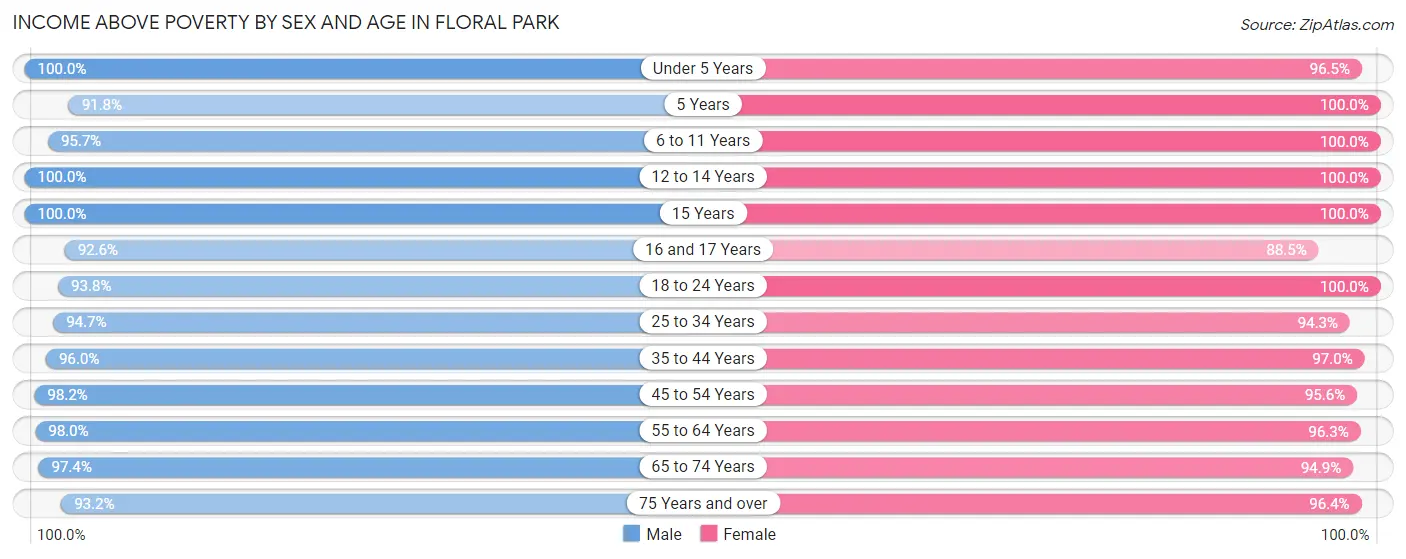
| Age Bracket | Male | Female |
| Under 5 Years | 357 (100.0%) | 359 (96.5%) |
| 5 Years | 112 (91.8%) | 183 (100.0%) |
| 6 to 11 Years | 771 (95.7%) | 420 (100.0%) |
| 12 to 14 Years | 315 (100.0%) | 258 (100.0%) |
| 15 Years | 64 (100.0%) | 124 (100.0%) |
| 16 and 17 Years | 174 (92.5%) | 192 (88.5%) |
| 18 to 24 Years | 617 (93.8%) | 586 (100.0%) |
| 25 to 34 Years | 1,014 (94.7%) | 745 (94.3%) |
| 35 to 44 Years | 1,014 (96.0%) | 942 (97.0%) |
| 45 to 54 Years | 1,183 (98.2%) | 982 (95.6%) |
| 55 to 64 Years | 1,034 (98.0%) | 1,060 (96.3%) |
| 65 to 74 Years | 712 (97.4%) | 779 (94.9%) |
| 75 Years and over | 534 (93.2%) | 785 (96.4%) |
| Total | 7,901 (96.3%) | 7,415 (96.5%) |
Income Below Poverty Among Married-Couple Families in Floral Park
The poverty statistics for married-couple families in Floral Park show that 2.2% or 83 of the total 3,759 families live below the poverty line. Families with 1 or 2 children have the highest poverty rate of 3.4%, comprising of 51 families. On the other hand, families with 3 or 4 children have the lowest poverty rate of 0.0%, which includes 0 families.
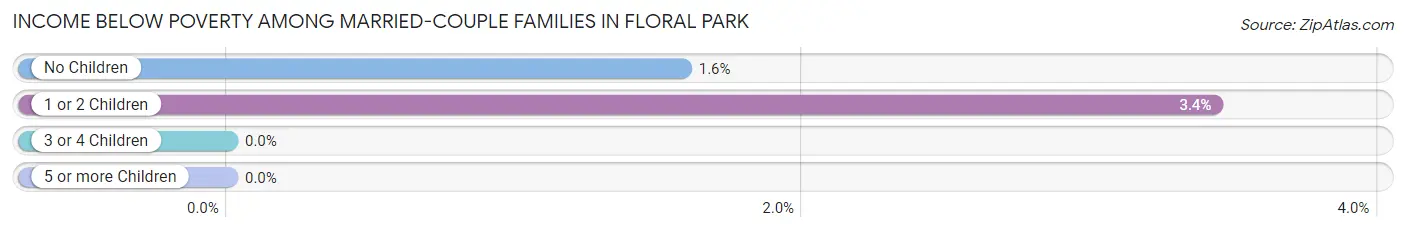
| Children | Above Poverty | Below Poverty |
| No Children | 1,997 (98.4%) | 32 (1.6%) |
| 1 or 2 Children | 1,436 (96.6%) | 51 (3.4%) |
| 3 or 4 Children | 238 (100.0%) | 0 (0.0%) |
| 5 or more Children | 5 (100.0%) | 0 (0.0%) |
| Total | 3,676 (97.8%) | 83 (2.2%) |
Income Below Poverty Among Single-Parent Households in Floral Park
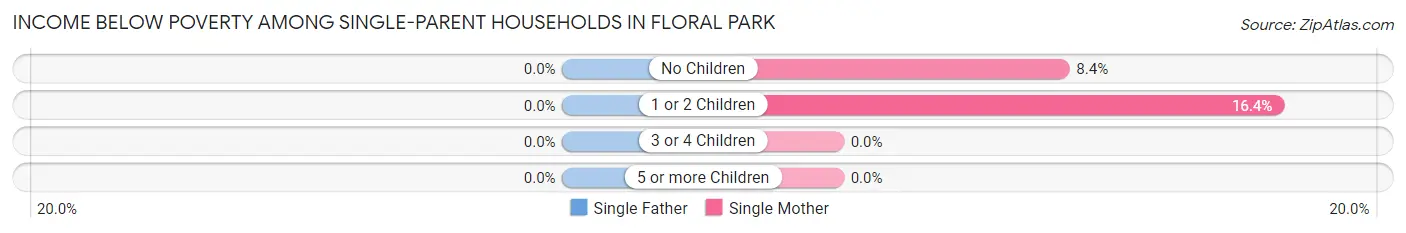
| Children | Single Father | Single Mother |
| No Children | 0 (0.0%) | 18 (8.4%) |
| 1 or 2 Children | 0 (0.0%) | 21 (16.4%) |
| 3 or 4 Children | 0 (0.0%) | 0 (0.0%) |
| 5 or more Children | 0 (0.0%) | 0 (0.0%) |
| Total | 0 (0.0%) | 39 (10.7%) |
Income Below Poverty Among Married-Couple vs Single-Parent Households in Floral Park
The poverty data for Floral Park shows that 83 of the married-couple family households (2.2%) and 39 of the single-parent households (7.0%) are living below the poverty level. Within the married-couple family households, those with 1 or 2 children have the highest poverty rate, with 51 households (3.4%) falling below the poverty line. Among the single-parent households, those with 1 or 2 children have the highest poverty rate, with 21 household (10.7%) living below poverty.
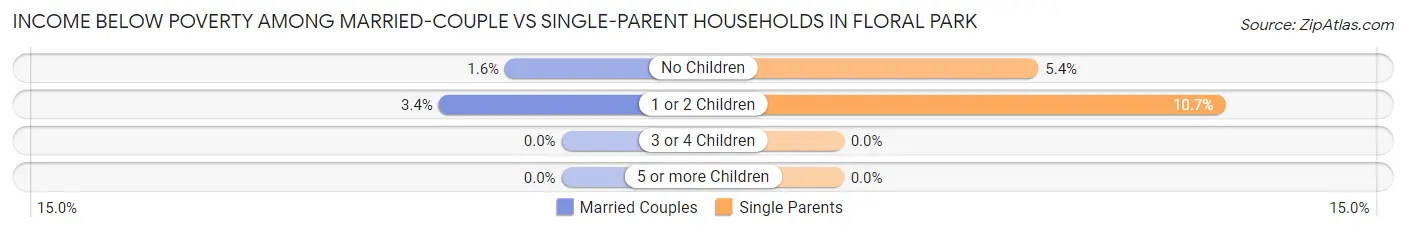
| Children | Married-Couple Families | Single-Parent Households |
| No Children | 32 (1.6%) | 18 (5.4%) |
| 1 or 2 Children | 51 (3.4%) | 21 (10.7%) |
| 3 or 4 Children | 0 (0.0%) | 0 (0.0%) |
| 5 or more Children | 0 (0.0%) | 0 (0.0%) |
| Total | 83 (2.2%) | 39 (7.0%) |
Employment Characteristics in Floral Park
Employment by Class of Employer in Floral Park
Among the 8,309 employed individuals in Floral Park, private company employees (4,834 | 58.2%), local government employees (1,401 | 16.9%), and not-for-profit organizations (994 | 12.0%) make up the most common classes of employment.
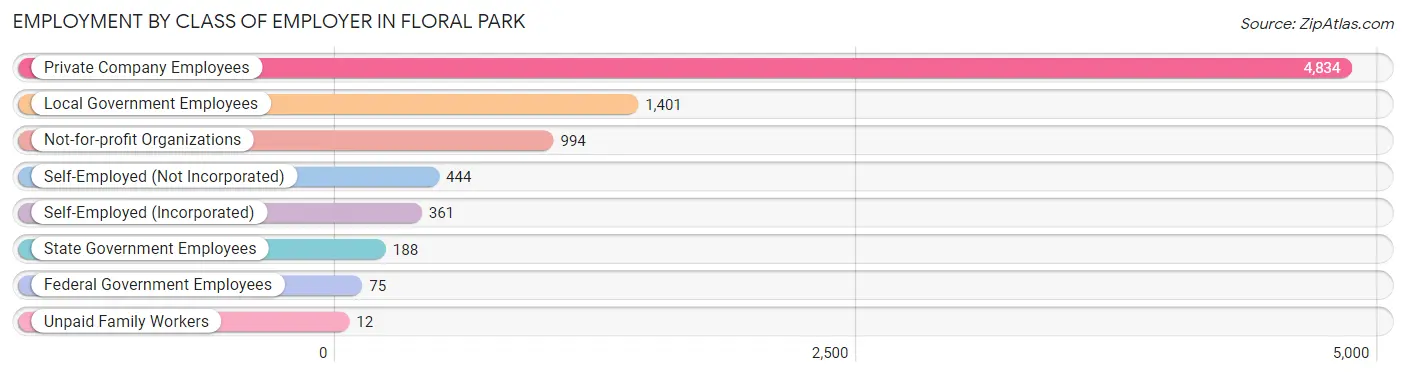
| Employer Class | # Employees | % Employees |
| Private Company Employees | 4,834 | 58.2% |
| Self-Employed (Incorporated) | 361 | 4.3% |
| Self-Employed (Not Incorporated) | 444 | 5.3% |
| Not-for-profit Organizations | 994 | 12.0% |
| Local Government Employees | 1,401 | 16.9% |
| State Government Employees | 188 | 2.3% |
| Federal Government Employees | 75 | 0.9% |
| Unpaid Family Workers | 12 | 0.1% |
| Total | 8,309 | 100.0% |
Employment Status by Age in Floral Park
According to the labor force statistics for Floral Park, out of the total population over 16 years of age (12,864), 68.9% or 8,863 individuals are in the labor force, with 3.8% or 337 of them unemployed. The age group with the highest labor force participation rate is 30 to 34 years, with 96.4% or 875 individuals in the labor force. Within the labor force, the 20 to 24 years age range has the highest percentage of unemployed individuals, with 12.8% or 61 of them being unemployed.
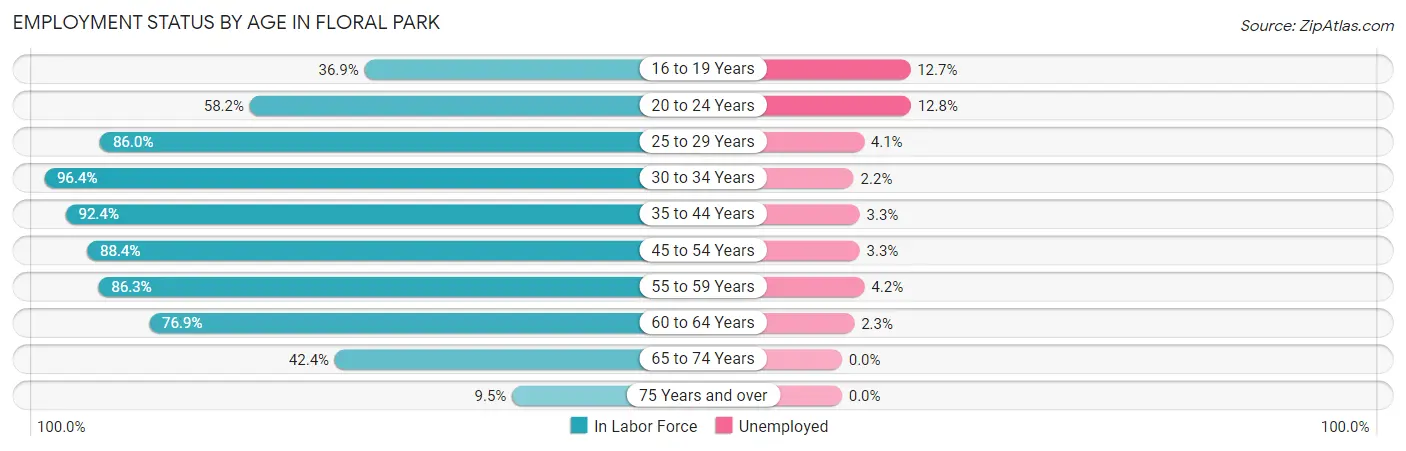
| Age Bracket | In Labor Force | Unemployed |
| 16 to 19 Years | 306 (36.9%) | 39 (12.7%) |
| 20 to 24 Years | 477 (58.2%) | 61 (12.8%) |
| 25 to 29 Years | 820 (86.0%) | 34 (4.1%) |
| 30 to 34 Years | 875 (96.4%) | 19 (2.2%) |
| 35 to 44 Years | 1,873 (92.4%) | 62 (3.3%) |
| 45 to 54 Years | 1,973 (88.4%) | 65 (3.3%) |
| 55 to 59 Years | 837 (86.3%) | 35 (4.2%) |
| 60 to 64 Years | 912 (76.9%) | 21 (2.3%) |
| 65 to 74 Years | 658 (42.4%) | 0 (0.0%) |
| 75 Years and over | 132 (9.5%) | 0 (0.0%) |
| Total | 8,863 (68.9%) | 337 (3.8%) |
Employment Status by Educational Attainment in Floral Park
According to labor force statistics for Floral Park, 88.1% of individuals (7,291) out of the total population between 25 and 64 years of age (8,276) are in the labor force, with 3.3% or 241 of them being unemployed. The group with the highest labor force participation rate are those with the educational attainment of bachelor's degree or higher, with 92.7% or 5,177 individuals in the labor force. Within the labor force, individuals with less than high school education have the highest percentage of unemployment, with 12.1% or 34 of them being unemployed.
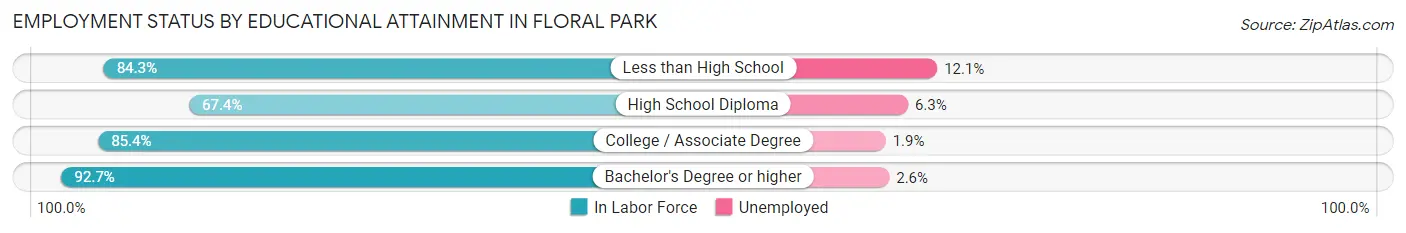
| Educational Attainment | In Labor Force | Unemployed |
| Less than High School | 280 (84.3%) | 40 (12.1%) |
| High School Diploma | 696 (67.4%) | 65 (6.3%) |
| College / Associate Degree | 1,132 (85.4%) | 25 (1.9%) |
| Bachelor's Degree or higher | 5,177 (92.7%) | 145 (2.6%) |
| Total | 7,291 (88.1%) | 273 (3.3%) |
Employment Occupations by Sex in Floral Park
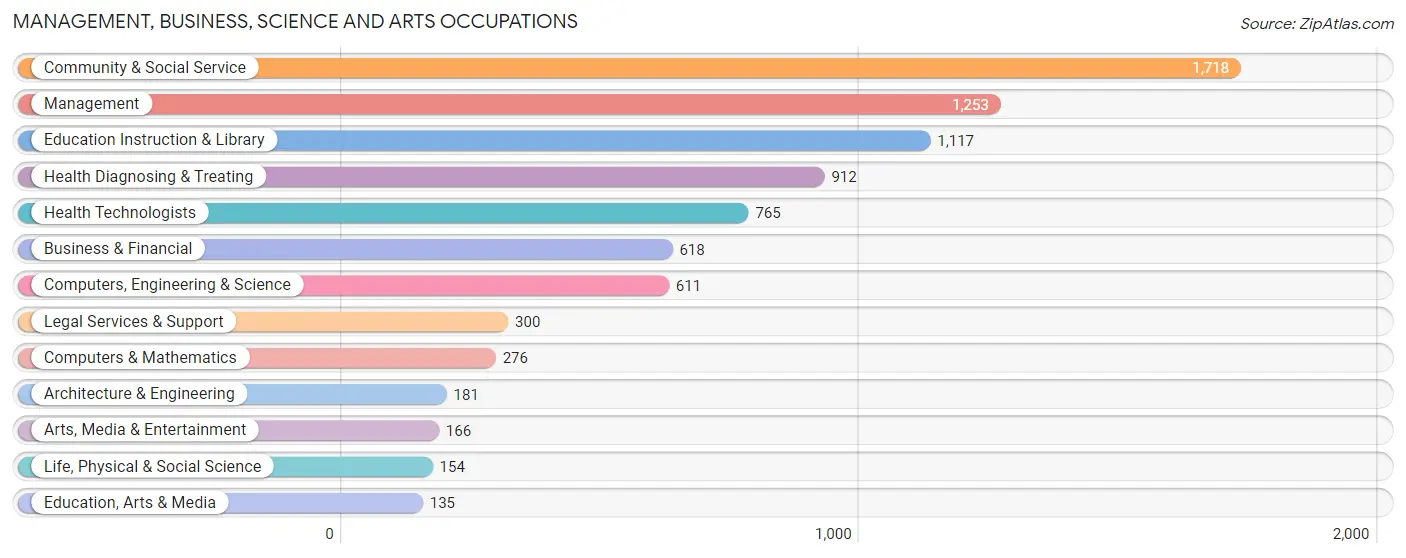
Management, Business, Science and Arts Occupations
The most common Management, Business, Science and Arts occupations in Floral Park are Community & Social Service (1,718 | 20.2%), Management (1,253 | 14.7%), Education Instruction & Library (1,117 | 13.1%), Health Diagnosing & Treating (912 | 10.7%), and Health Technologists (765 | 9.0%).
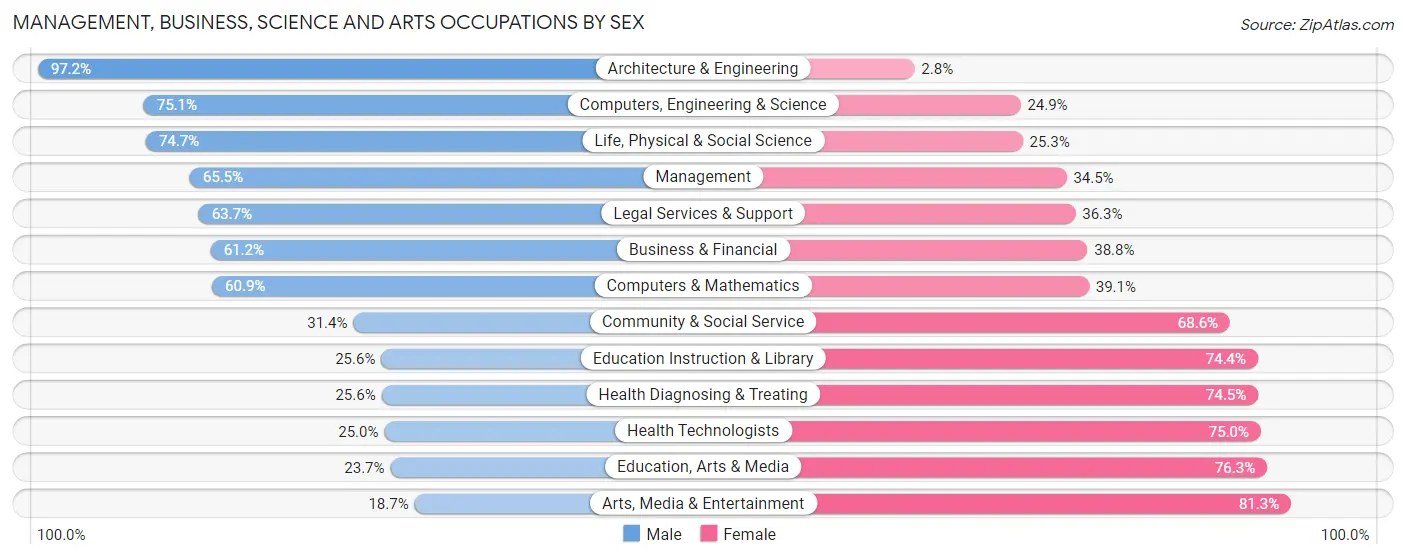
Management, Business, Science and Arts Occupations by Sex
Within the Management, Business, Science and Arts occupations in Floral Park, the most male-oriented occupations are Architecture & Engineering (97.2%), Computers, Engineering & Science (75.1%), and Life, Physical & Social Science (74.7%), while the most female-oriented occupations are Arts, Media & Entertainment (81.3%), Education, Arts & Media (76.3%), and Health Technologists (75.0%).
| Occupation | Male | Female |
| Management | 821 (65.5%) | 432 (34.5%) |
| Business & Financial | 378 (61.2%) | 240 (38.8%) |
| Computers, Engineering & Science | 459 (75.1%) | 152 (24.9%) |
| Computers & Mathematics | 168 (60.9%) | 108 (39.1%) |
| Architecture & Engineering | 176 (97.2%) | 5 (2.8%) |
| Life, Physical & Social Science | 115 (74.7%) | 39 (25.3%) |
| Community & Social Service | 540 (31.4%) | 1,178 (68.6%) |
| Education, Arts & Media | 32 (23.7%) | 103 (76.3%) |
| Legal Services & Support | 191 (63.7%) | 109 (36.3%) |
| Education Instruction & Library | 286 (25.6%) | 831 (74.4%) |
| Arts, Media & Entertainment | 31 (18.7%) | 135 (81.3%) |
| Health Diagnosing & Treating | 233 (25.6%) | 679 (74.5%) |
| Health Technologists | 191 (25.0%) | 574 (75.0%) |
| Total (Category) | 2,431 (47.5%) | 2,681 (52.4%) |
| Total (Overall) | 4,679 (54.9%) | 3,845 (45.1%) |
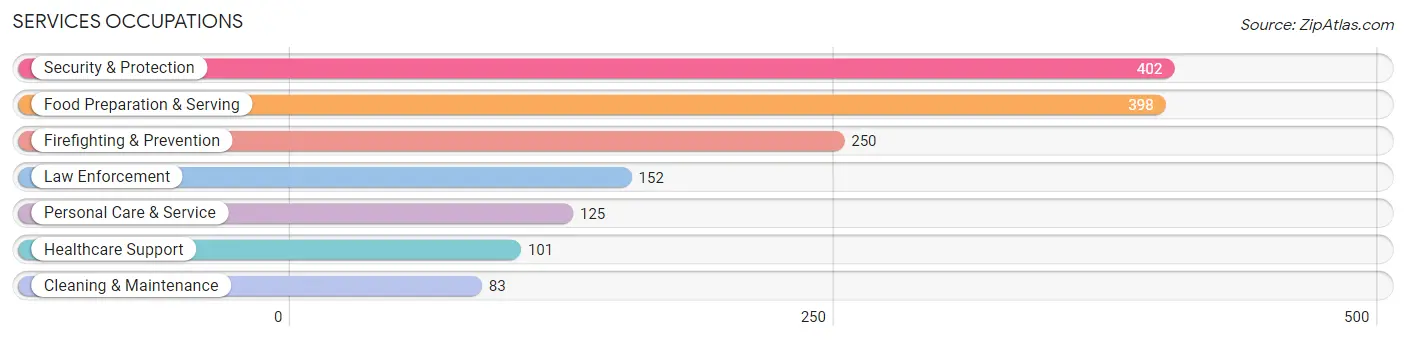
Services Occupations
The most common Services occupations in Floral Park are Security & Protection (402 | 4.7%), Food Preparation & Serving (398 | 4.7%), Firefighting & Prevention (250 | 2.9%), Law Enforcement (152 | 1.8%), and Personal Care & Service (125 | 1.5%).
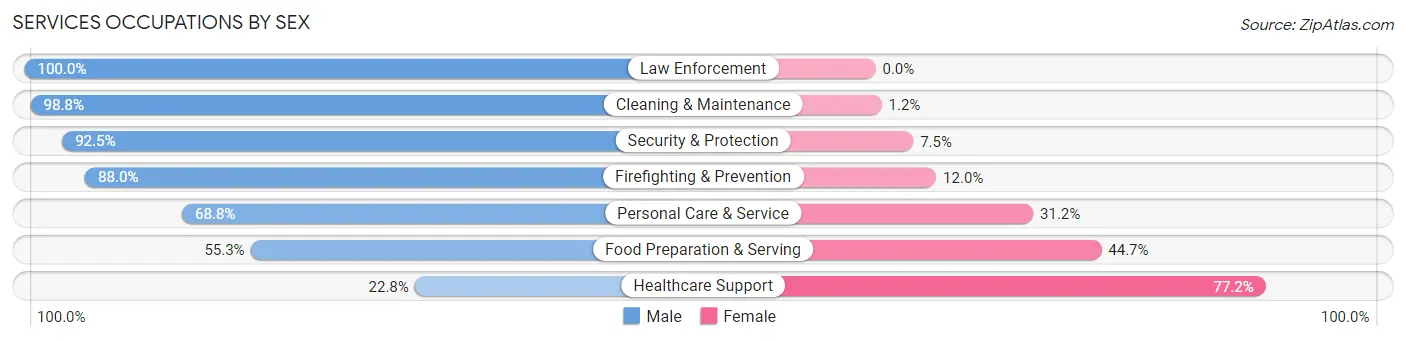
Services Occupations by Sex
Within the Services occupations in Floral Park, the most male-oriented occupations are Law Enforcement (100.0%), Cleaning & Maintenance (98.8%), and Security & Protection (92.5%), while the most female-oriented occupations are Healthcare Support (77.2%), Food Preparation & Serving (44.7%), and Personal Care & Service (31.2%).
| Occupation | Male | Female |
| Healthcare Support | 23 (22.8%) | 78 (77.2%) |
| Security & Protection | 372 (92.5%) | 30 (7.5%) |
| Firefighting & Prevention | 220 (88.0%) | 30 (12.0%) |
| Law Enforcement | 152 (100.0%) | 0 (0.0%) |
| Food Preparation & Serving | 220 (55.3%) | 178 (44.7%) |
| Cleaning & Maintenance | 82 (98.8%) | 1 (1.2%) |
| Personal Care & Service | 86 (68.8%) | 39 (31.2%) |
| Total (Category) | 783 (70.6%) | 326 (29.4%) |
| Total (Overall) | 4,679 (54.9%) | 3,845 (45.1%) |
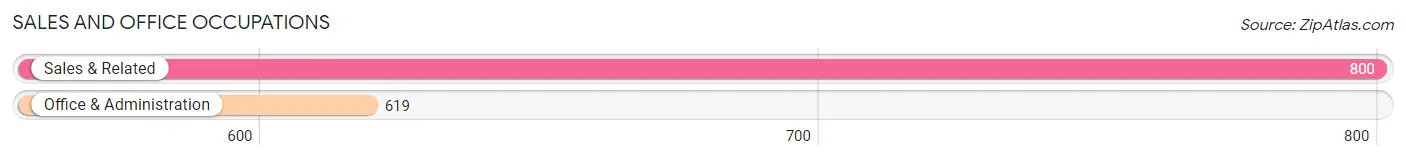
Sales and Office Occupations
The most common Sales and Office occupations in Floral Park are Sales & Related (800 | 9.4%), and Office & Administration (619 | 7.3%).
Sales and Office Occupations by Sex
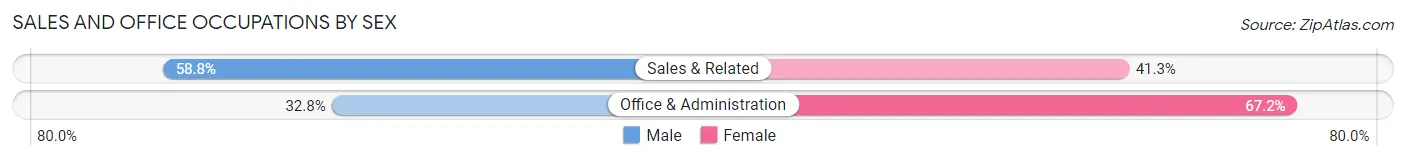
| Occupation | Male | Female |
| Sales & Related | 470 (58.8%) | 330 (41.2%) |
| Office & Administration | 203 (32.8%) | 416 (67.2%) |
| Total (Category) | 673 (47.4%) | 746 (52.6%) |
| Total (Overall) | 4,679 (54.9%) | 3,845 (45.1%) |
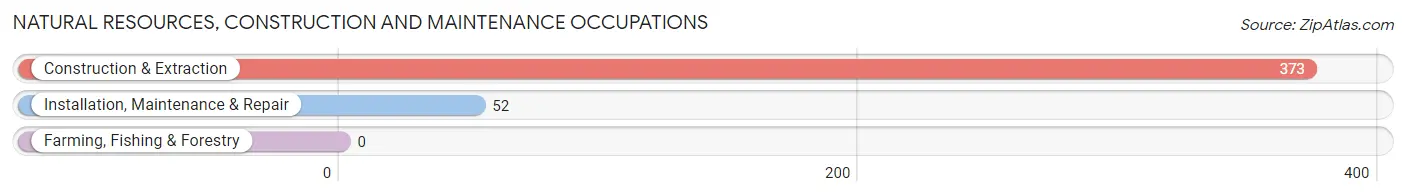
Natural Resources, Construction and Maintenance Occupations
The most common Natural Resources, Construction and Maintenance occupations in Floral Park are Construction & Extraction (373 | 4.4%), and Installation, Maintenance & Repair (52 | 0.6%).
Natural Resources, Construction and Maintenance Occupations by Sex
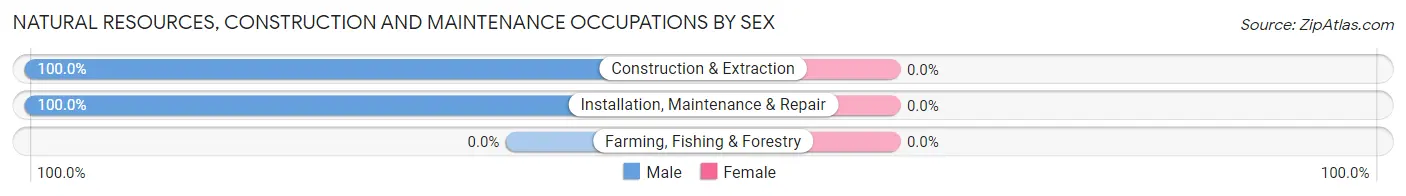
| Occupation | Male | Female |
| Farming, Fishing & Forestry | 0 (0.0%) | 0 (0.0%) |
| Construction & Extraction | 373 (100.0%) | 0 (0.0%) |
| Installation, Maintenance & Repair | 52 (100.0%) | 0 (0.0%) |
| Total (Category) | 425 (100.0%) | 0 (0.0%) |
| Total (Overall) | 4,679 (54.9%) | 3,845 (45.1%) |
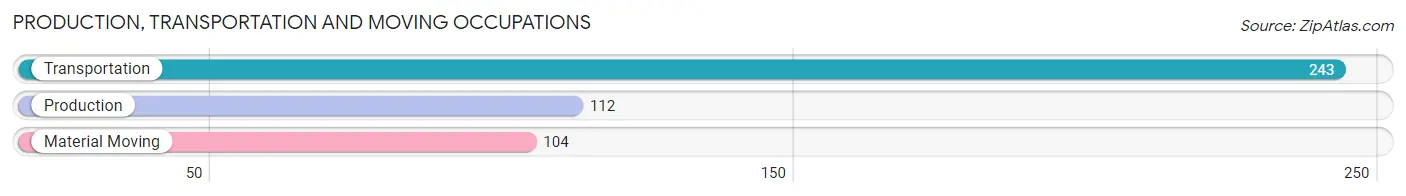
Production, Transportation and Moving Occupations
The most common Production, Transportation and Moving occupations in Floral Park are Transportation (243 | 2.9%), Production (112 | 1.3%), and Material Moving (104 | 1.2%).
Production, Transportation and Moving Occupations by Sex
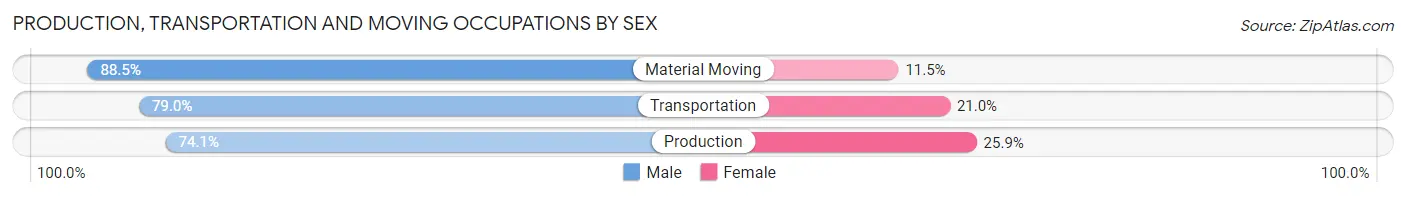
| Occupation | Male | Female |
| Production | 83 (74.1%) | 29 (25.9%) |
| Transportation | 192 (79.0%) | 51 (21.0%) |
| Material Moving | 92 (88.5%) | 12 (11.5%) |
| Total (Category) | 367 (80.0%) | 92 (20.0%) |
| Total (Overall) | 4,679 (54.9%) | 3,845 (45.1%) |
Employment Industries by Sex in Floral Park
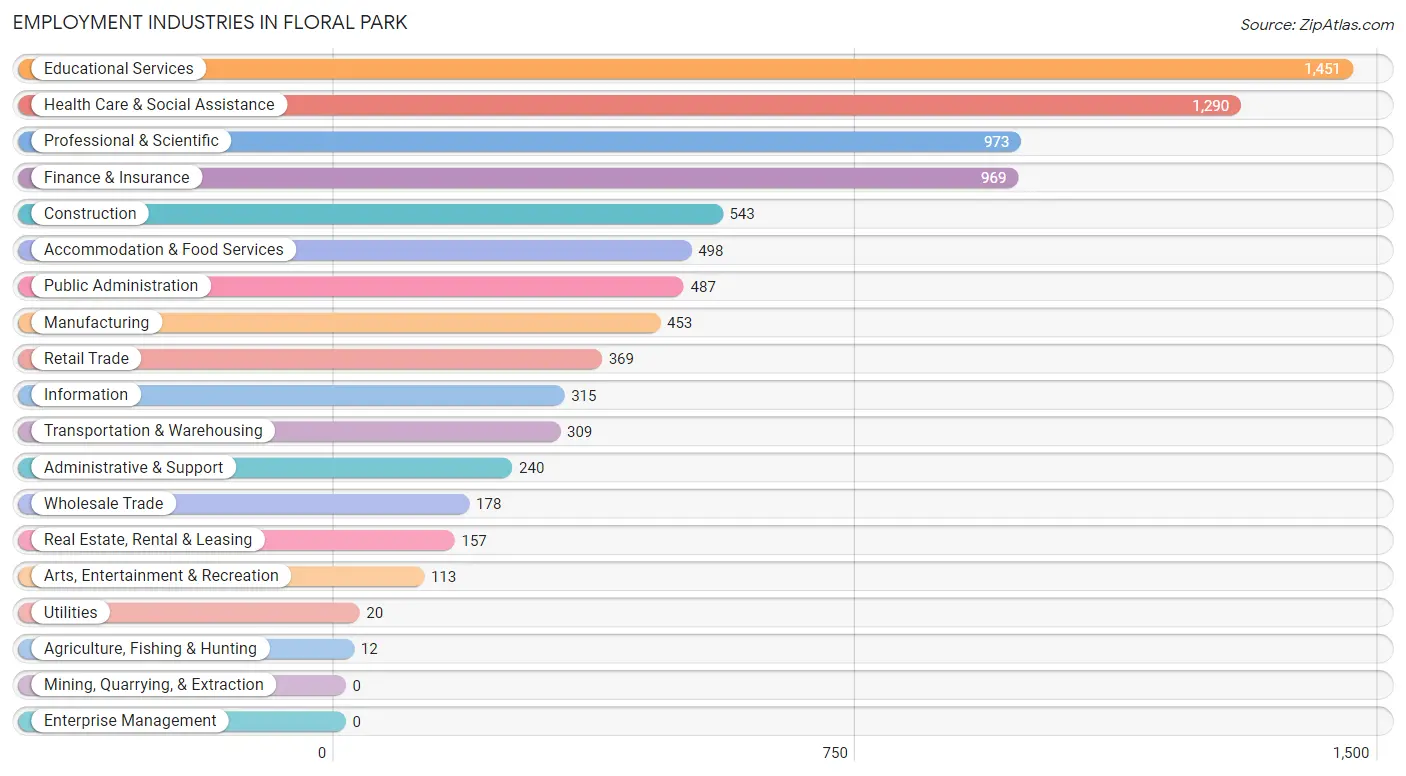
Employment Industries in Floral Park
The major employment industries in Floral Park include Educational Services (1,451 | 17.0%), Health Care & Social Assistance (1,290 | 15.1%), Professional & Scientific (973 | 11.4%), Finance & Insurance (969 | 11.4%), and Construction (543 | 6.4%).
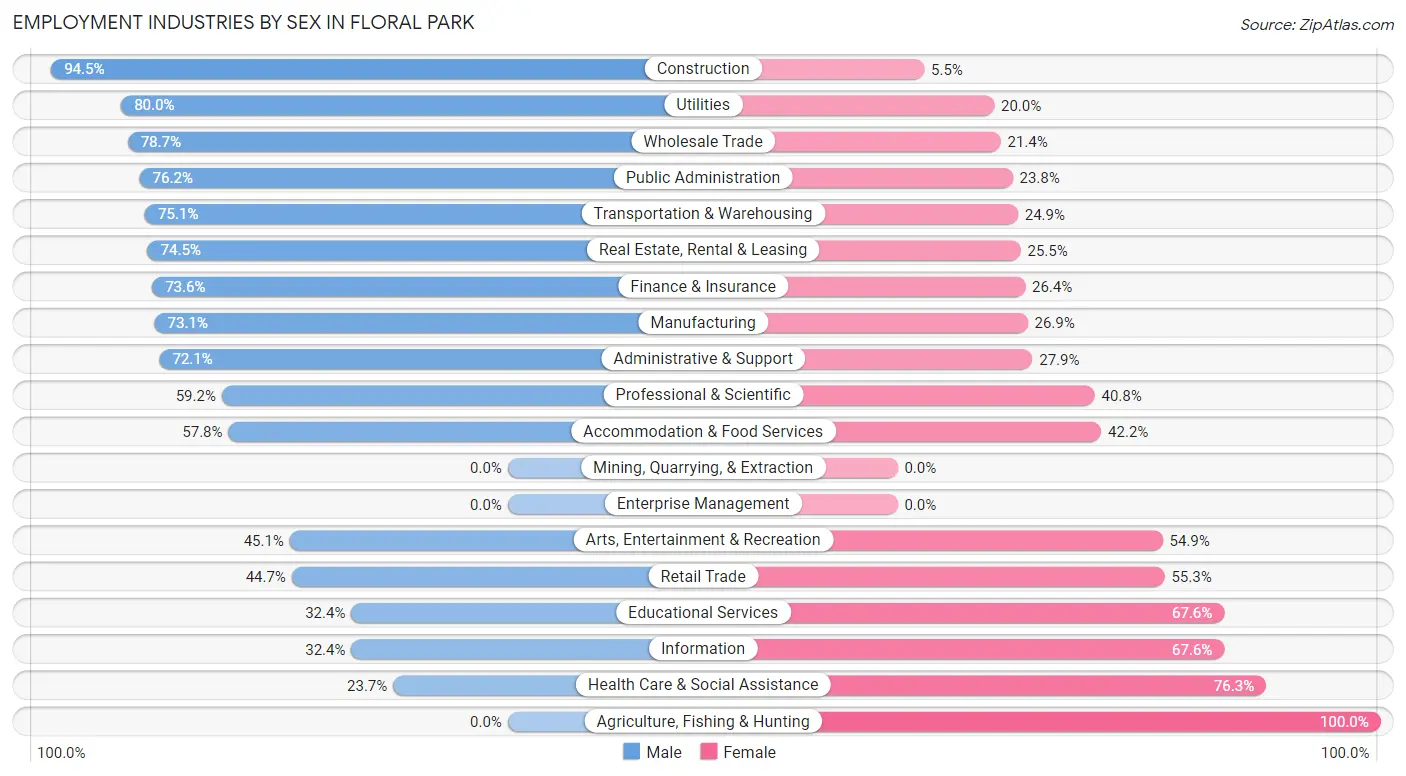
Employment Industries by Sex in Floral Park
The Floral Park industries that see more men than women are Construction (94.5%), Utilities (80.0%), and Wholesale Trade (78.6%), whereas the industries that tend to have a higher number of women are Agriculture, Fishing & Hunting (100.0%), Health Care & Social Assistance (76.3%), and Information (67.6%).
| Industry | Male | Female |
| Agriculture, Fishing & Hunting | 0 (0.0%) | 12 (100.0%) |
| Mining, Quarrying, & Extraction | 0 (0.0%) | 0 (0.0%) |
| Construction | 513 (94.5%) | 30 (5.5%) |
| Manufacturing | 331 (73.1%) | 122 (26.9%) |
| Wholesale Trade | 140 (78.6%) | 38 (21.3%) |
| Retail Trade | 165 (44.7%) | 204 (55.3%) |
| Transportation & Warehousing | 232 (75.1%) | 77 (24.9%) |
| Utilities | 16 (80.0%) | 4 (20.0%) |
| Information | 102 (32.4%) | 213 (67.6%) |
| Finance & Insurance | 713 (73.6%) | 256 (26.4%) |
| Real Estate, Rental & Leasing | 117 (74.5%) | 40 (25.5%) |
| Professional & Scientific | 576 (59.2%) | 397 (40.8%) |
| Enterprise Management | 0 (0.0%) | 0 (0.0%) |
| Administrative & Support | 173 (72.1%) | 67 (27.9%) |
| Educational Services | 470 (32.4%) | 981 (67.6%) |
| Health Care & Social Assistance | 306 (23.7%) | 984 (76.3%) |
| Arts, Entertainment & Recreation | 51 (45.1%) | 62 (54.9%) |
| Accommodation & Food Services | 288 (57.8%) | 210 (42.2%) |
| Public Administration | 371 (76.2%) | 116 (23.8%) |
| Total | 4,679 (54.9%) | 3,845 (45.1%) |
Education in Floral Park
School Enrollment in Floral Park
The most common levels of schooling among the 4,049 students in Floral Park are high school (868 | 21.4%), middle school (798 | 19.7%), and elementary school (772 | 19.1%).
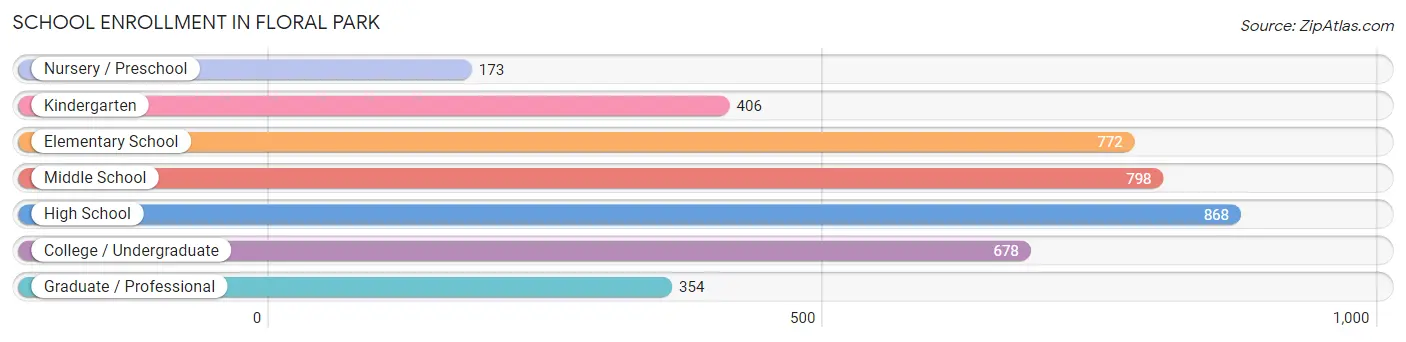
| School Level | # Students | % Students |
| Nursery / Preschool | 173 | 4.3% |
| Kindergarten | 406 | 10.0% |
| Elementary School | 772 | 19.1% |
| Middle School | 798 | 19.7% |
| High School | 868 | 21.4% |
| College / Undergraduate | 678 | 16.7% |
| Graduate / Professional | 354 | 8.7% |
| Total | 4,049 | 100.0% |
School Enrollment by Age by Funding Source in Floral Park
Out of a total of 4,049 students who are enrolled in schools in Floral Park, 1,219 (30.1%) attend a private institution, while the remaining 2,830 (69.9%) are enrolled in public schools. The age group of 18 to 19 year olds has the highest likelihood of being enrolled in private schools, with 205 (54.4% in the age bracket) enrolled. Conversely, the age group of 5 to 9 year old has the lowest likelihood of being enrolled in a private school, with 924 (84.9% in the age bracket) attending a public institution.
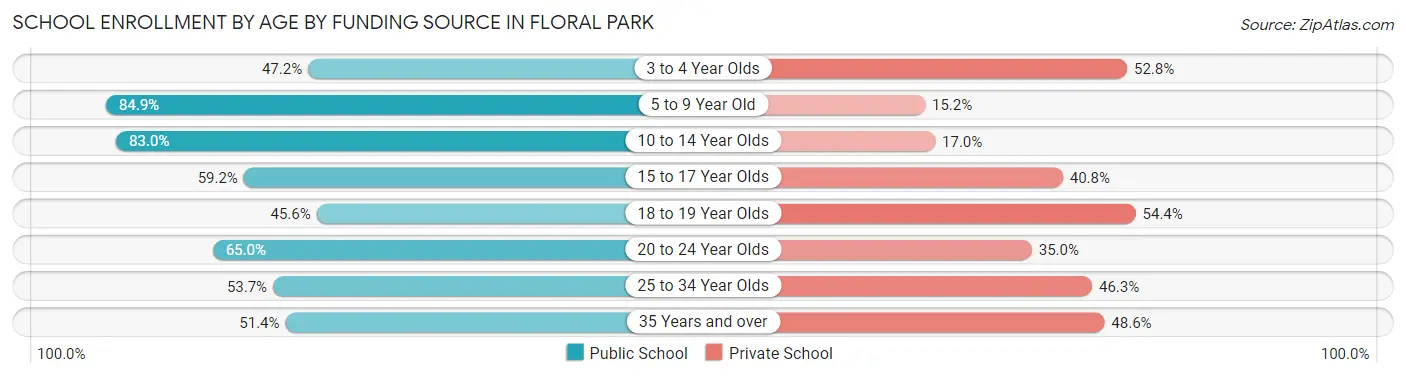
| Age Bracket | Public School | Private School |
| 3 to 4 Year Olds | 102 (47.2%) | 114 (52.8%) |
| 5 to 9 Year Old | 924 (84.9%) | 165 (15.1%) |
| 10 to 14 Year Olds | 804 (83.0%) | 165 (17.0%) |
| 15 to 17 Year Olds | 351 (59.2%) | 242 (40.8%) |
| 18 to 19 Year Olds | 172 (45.6%) | 205 (54.4%) |
| 20 to 24 Year Olds | 291 (65.0%) | 157 (35.0%) |
| 25 to 34 Year Olds | 79 (53.7%) | 68 (46.3%) |
| 35 Years and over | 108 (51.4%) | 102 (48.6%) |
| Total | 2,830 (69.9%) | 1,219 (30.1%) |
Educational Attainment by Field of Study in Floral Park
Science & technology (1,340 | 18.5%), business (1,243 | 17.2%), education (782 | 10.8%), social sciences (654 | 9.0%), and arts & humanities (551 | 7.6%) are the most common fields of study among 7,234 individuals in Floral Park who have obtained a bachelor's degree or higher.
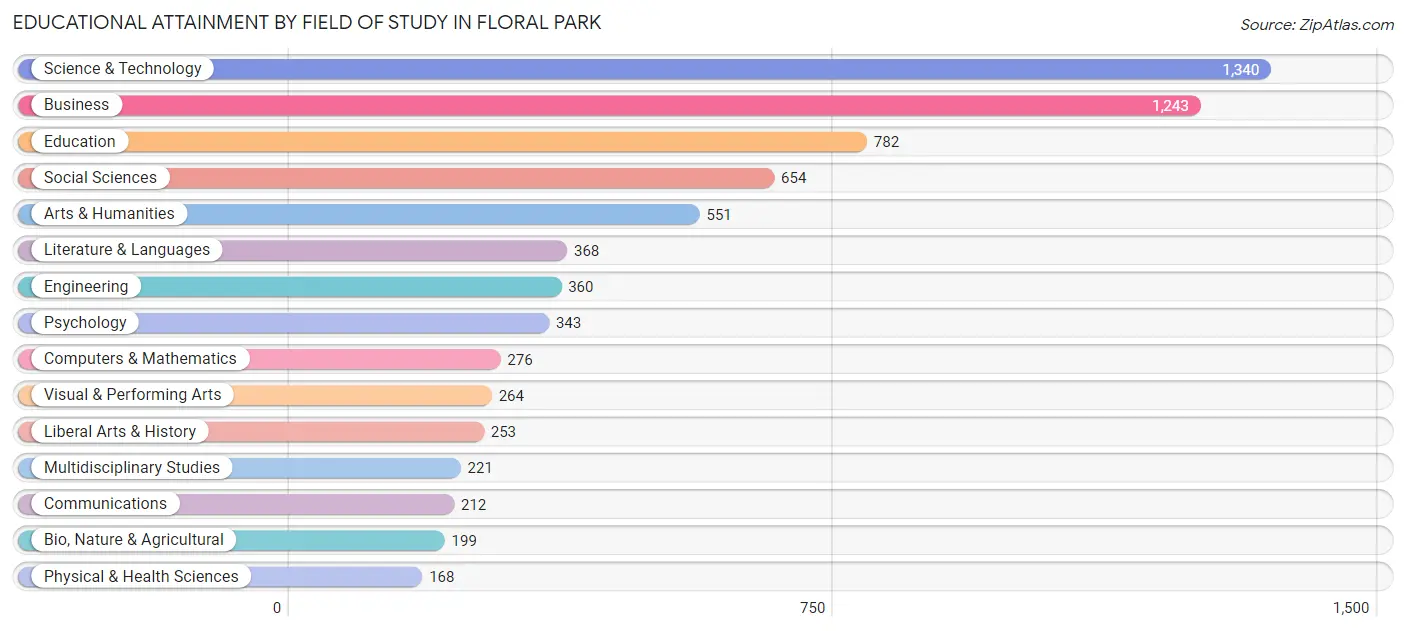
| Field of Study | # Graduates | % Graduates |
| Computers & Mathematics | 276 | 3.8% |
| Bio, Nature & Agricultural | 199 | 2.8% |
| Physical & Health Sciences | 168 | 2.3% |
| Psychology | 343 | 4.7% |
| Social Sciences | 654 | 9.0% |
| Engineering | 360 | 5.0% |
| Multidisciplinary Studies | 221 | 3.1% |
| Science & Technology | 1,340 | 18.5% |
| Business | 1,243 | 17.2% |
| Education | 782 | 10.8% |
| Literature & Languages | 368 | 5.1% |
| Liberal Arts & History | 253 | 3.5% |
| Visual & Performing Arts | 264 | 3.6% |
| Communications | 212 | 2.9% |
| Arts & Humanities | 551 | 7.6% |
| Total | 7,234 | 100.0% |
Transportation & Commute in Floral Park
Vehicle Availability by Sex in Floral Park
The most prevalent vehicle ownership categories in Floral Park are males with 2 vehicles (2,255, accounting for 49.4%) and females with 2 vehicles (1,726, making up 60.6%).
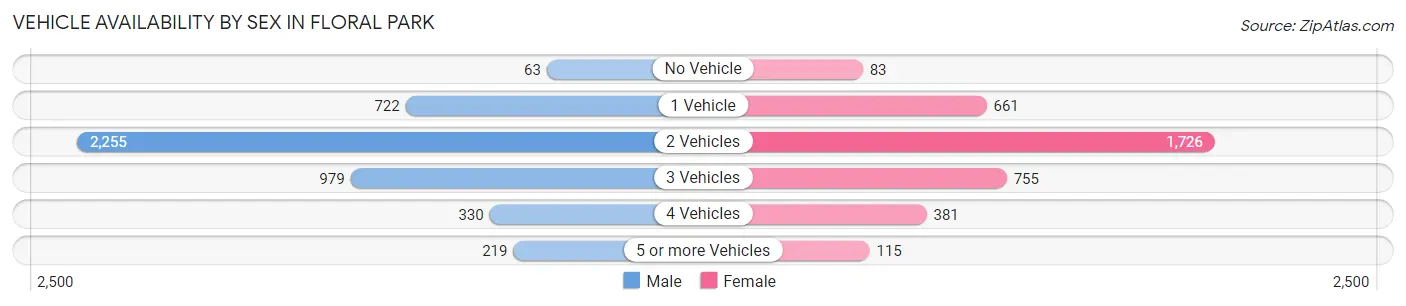
| Vehicles Available | Male | Female |
| No Vehicle | 63 (1.4%) | 83 (2.2%) |
| 1 Vehicle | 722 (15.8%) | 661 (17.8%) |
| 2 Vehicles | 2,255 (49.4%) | 1,726 (46.4%) |
| 3 Vehicles | 979 (21.4%) | 755 (20.3%) |
| 4 Vehicles | 330 (7.2%) | 381 (10.2%) |
| 5 or more Vehicles | 219 (4.8%) | 115 (3.1%) |
| Total | 4,568 (100.0%) | 3,721 (100.0%) |
Commute Time in Floral Park
The most frequently occuring commute durations in Floral Park are 60 to 89 minutes (1,018 commuters, 13.8%), 45 to 59 minutes (966 commuters, 13.1%), and 30 to 34 minutes (863 commuters, 11.7%).
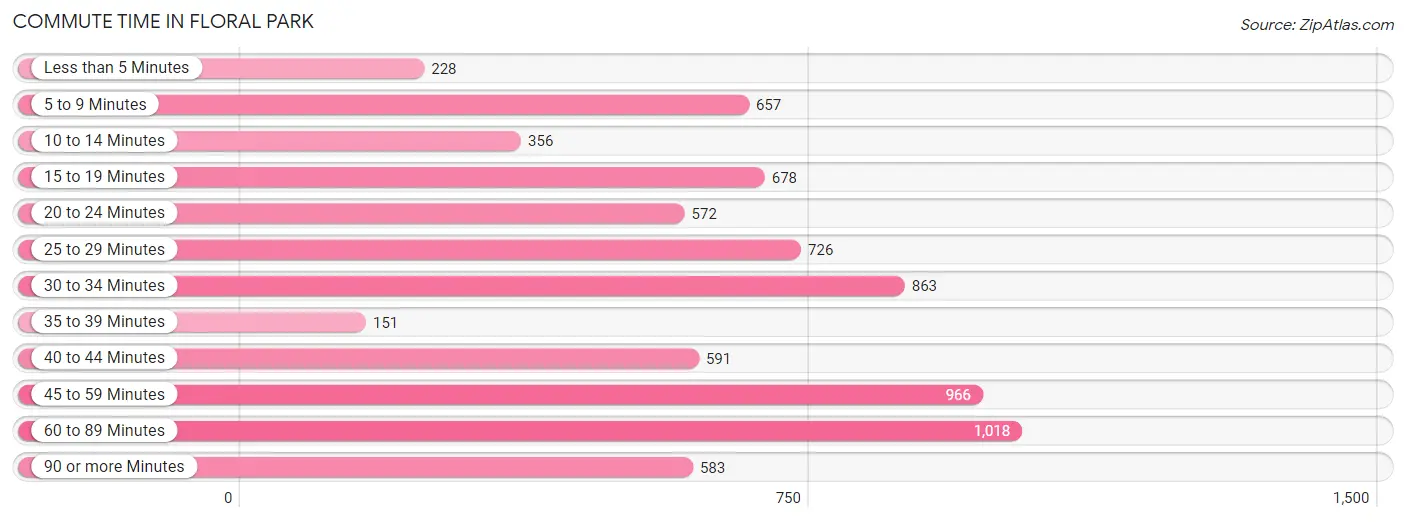
| Commute Time | # Commuters | % Commuters |
| Less than 5 Minutes | 228 | 3.1% |
| 5 to 9 Minutes | 657 | 8.9% |
| 10 to 14 Minutes | 356 | 4.8% |
| 15 to 19 Minutes | 678 | 9.2% |
| 20 to 24 Minutes | 572 | 7.7% |
| 25 to 29 Minutes | 726 | 9.8% |
| 30 to 34 Minutes | 863 | 11.7% |
| 35 to 39 Minutes | 151 | 2.0% |
| 40 to 44 Minutes | 591 | 8.0% |
| 45 to 59 Minutes | 966 | 13.1% |
| 60 to 89 Minutes | 1,018 | 13.8% |
| 90 or more Minutes | 583 | 7.9% |
Commute Time by Sex in Floral Park
The most common commute times in Floral Park are 60 to 89 minutes (601 commuters, 14.8%) for males and 60 to 89 minutes (417 commuters, 12.5%) for females.
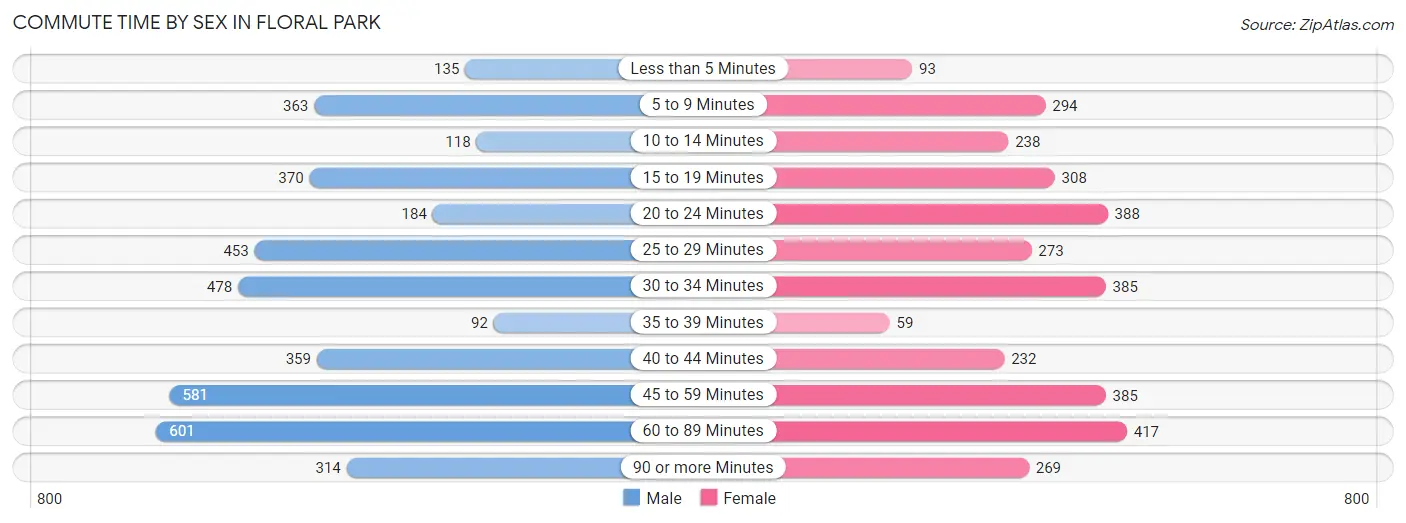
| Commute Time | Male | Female |
| Less than 5 Minutes | 135 (3.3%) | 93 (2.8%) |
| 5 to 9 Minutes | 363 (9.0%) | 294 (8.8%) |
| 10 to 14 Minutes | 118 (2.9%) | 238 (7.1%) |
| 15 to 19 Minutes | 370 (9.1%) | 308 (9.2%) |
| 20 to 24 Minutes | 184 (4.5%) | 388 (11.6%) |
| 25 to 29 Minutes | 453 (11.2%) | 273 (8.2%) |
| 30 to 34 Minutes | 478 (11.8%) | 385 (11.5%) |
| 35 to 39 Minutes | 92 (2.3%) | 59 (1.8%) |
| 40 to 44 Minutes | 359 (8.9%) | 232 (6.9%) |
| 45 to 59 Minutes | 581 (14.3%) | 385 (11.5%) |
| 60 to 89 Minutes | 601 (14.8%) | 417 (12.5%) |
| 90 or more Minutes | 314 (7.8%) | 269 (8.1%) |
Time of Departure to Work by Sex in Floral Park
The most frequent times of departure to work in Floral Park are 8:00 AM to 8:29 AM (575, 14.2%) for males and 7:00 AM to 7:29 AM (720, 21.5%) for females.
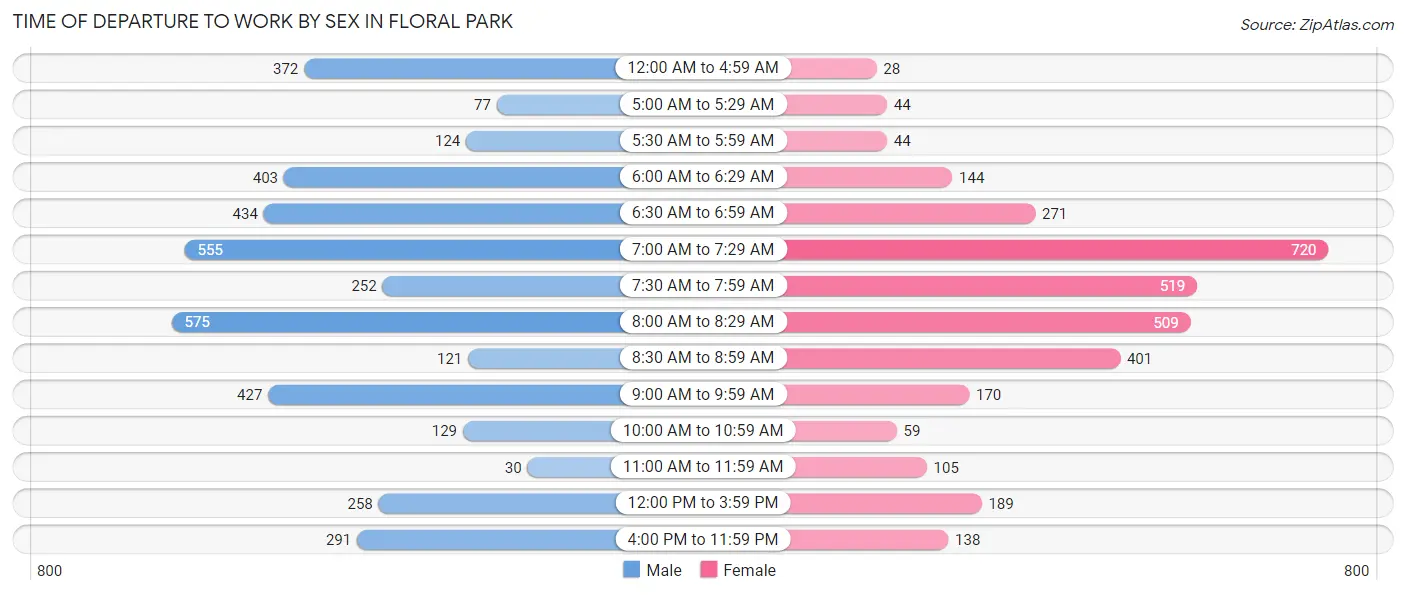
| Time of Departure | Male | Female |
| 12:00 AM to 4:59 AM | 372 (9.2%) | 28 (0.8%) |
| 5:00 AM to 5:29 AM | 77 (1.9%) | 44 (1.3%) |
| 5:30 AM to 5:59 AM | 124 (3.1%) | 44 (1.3%) |
| 6:00 AM to 6:29 AM | 403 (10.0%) | 144 (4.3%) |
| 6:30 AM to 6:59 AM | 434 (10.7%) | 271 (8.1%) |
| 7:00 AM to 7:29 AM | 555 (13.7%) | 720 (21.5%) |
| 7:30 AM to 7:59 AM | 252 (6.2%) | 519 (15.5%) |
| 8:00 AM to 8:29 AM | 575 (14.2%) | 509 (15.2%) |
| 8:30 AM to 8:59 AM | 121 (3.0%) | 401 (12.0%) |
| 9:00 AM to 9:59 AM | 427 (10.5%) | 170 (5.1%) |
| 10:00 AM to 10:59 AM | 129 (3.2%) | 59 (1.8%) |
| 11:00 AM to 11:59 AM | 30 (0.7%) | 105 (3.1%) |
| 12:00 PM to 3:59 PM | 258 (6.4%) | 189 (5.7%) |
| 4:00 PM to 11:59 PM | 291 (7.2%) | 138 (4.1%) |
| Total | 4,048 (100.0%) | 3,341 (100.0%) |
Housing Occupancy in Floral Park
Occupancy by Ownership in Floral Park
Of the total 5,498 dwellings in Floral Park, owner-occupied units account for 4,767 (86.7%), while renter-occupied units make up 731 (13.3%).
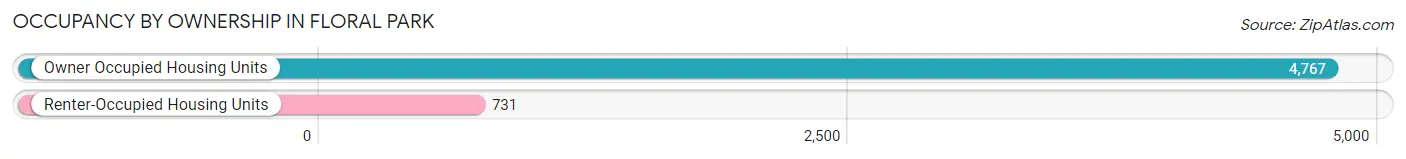
| Occupancy | # Housing Units | % Housing Units |
| Owner Occupied Housing Units | 4,767 | 86.7% |
| Renter-Occupied Housing Units | 731 | 13.3% |
| Total Occupied Housing Units | 5,498 | 100.0% |
Occupancy by Household Size in Floral Park
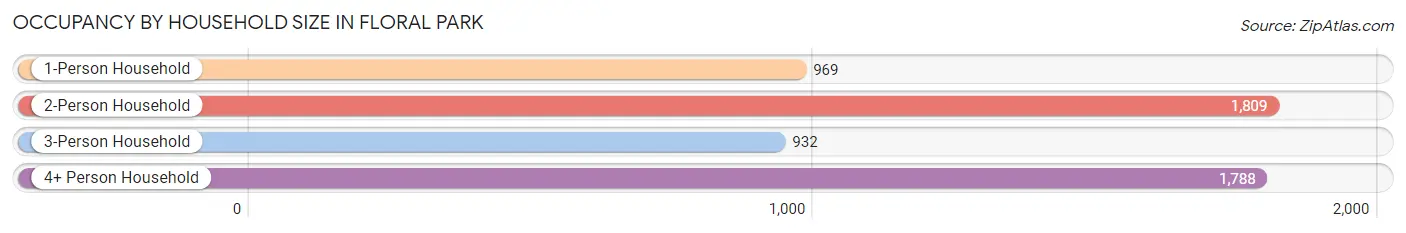
| Household Size | # Housing Units | % Housing Units |
| 1-Person Household | 969 | 17.6% |
| 2-Person Household | 1,809 | 32.9% |
| 3-Person Household | 932 | 17.0% |
| 4+ Person Household | 1,788 | 32.5% |
| Total Housing Units | 5,498 | 100.0% |
Occupancy by Ownership by Household Size in Floral Park
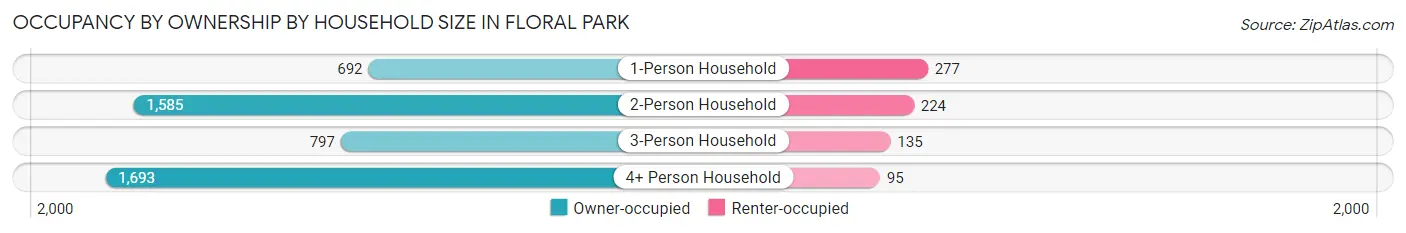
| Household Size | Owner-occupied | Renter-occupied |
| 1-Person Household | 692 (71.4%) | 277 (28.6%) |
| 2-Person Household | 1,585 (87.6%) | 224 (12.4%) |
| 3-Person Household | 797 (85.5%) | 135 (14.5%) |
| 4+ Person Household | 1,693 (94.7%) | 95 (5.3%) |
| Total Housing Units | 4,767 (86.7%) | 731 (13.3%) |
Occupancy by Educational Attainment in Floral Park
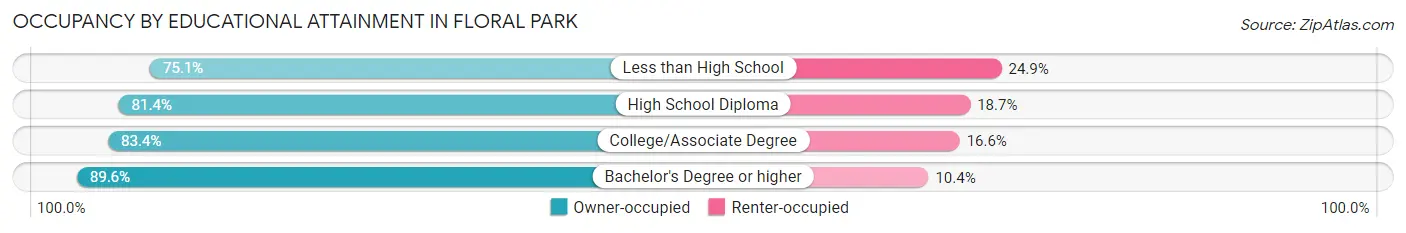
| Household Size | Owner-occupied | Renter-occupied |
| Less than High School | 139 (75.1%) | 46 (24.9%) |
| High School Diploma | 737 (81.4%) | 169 (18.6%) |
| College/Associate Degree | 796 (83.4%) | 158 (16.6%) |
| Bachelor's Degree or higher | 3,095 (89.6%) | 358 (10.4%) |
Occupancy by Age of Householder in Floral Park
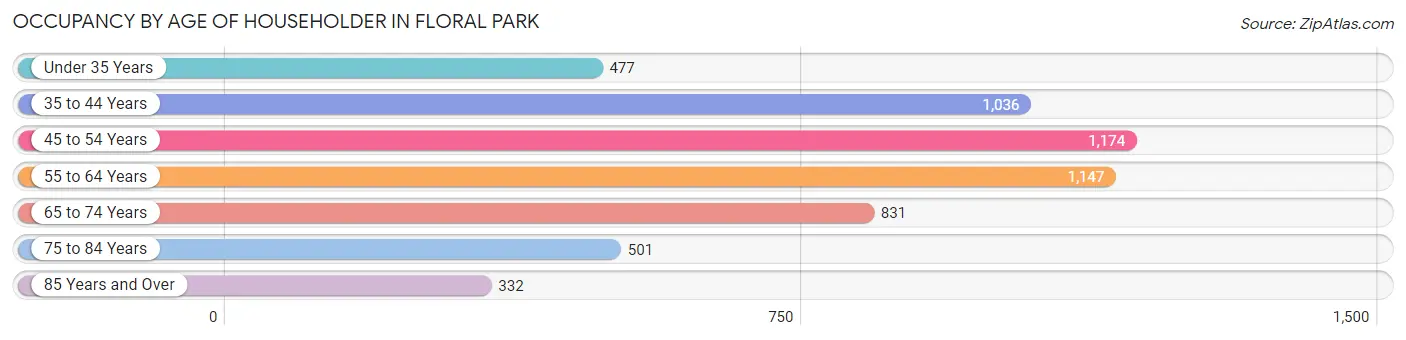
| Age Bracket | # Households | % Households |
| Under 35 Years | 477 | 8.7% |
| 35 to 44 Years | 1,036 | 18.8% |
| 45 to 54 Years | 1,174 | 21.3% |
| 55 to 64 Years | 1,147 | 20.9% |
| 65 to 74 Years | 831 | 15.1% |
| 75 to 84 Years | 501 | 9.1% |
| 85 Years and Over | 332 | 6.0% |
| Total | 5,498 | 100.0% |
Housing Finances in Floral Park
Median Income by Occupancy in Floral Park
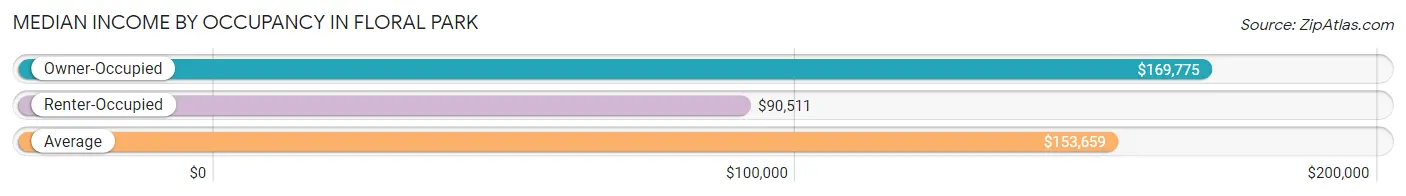
| Occupancy Type | # Households | Median Income |
| Owner-Occupied | 4,767 (86.7%) | $169,775 |
| Renter-Occupied | 731 (13.3%) | $90,511 |
| Average | 5,498 (100.0%) | $153,659 |
Occupancy by Householder Income Bracket in Floral Park
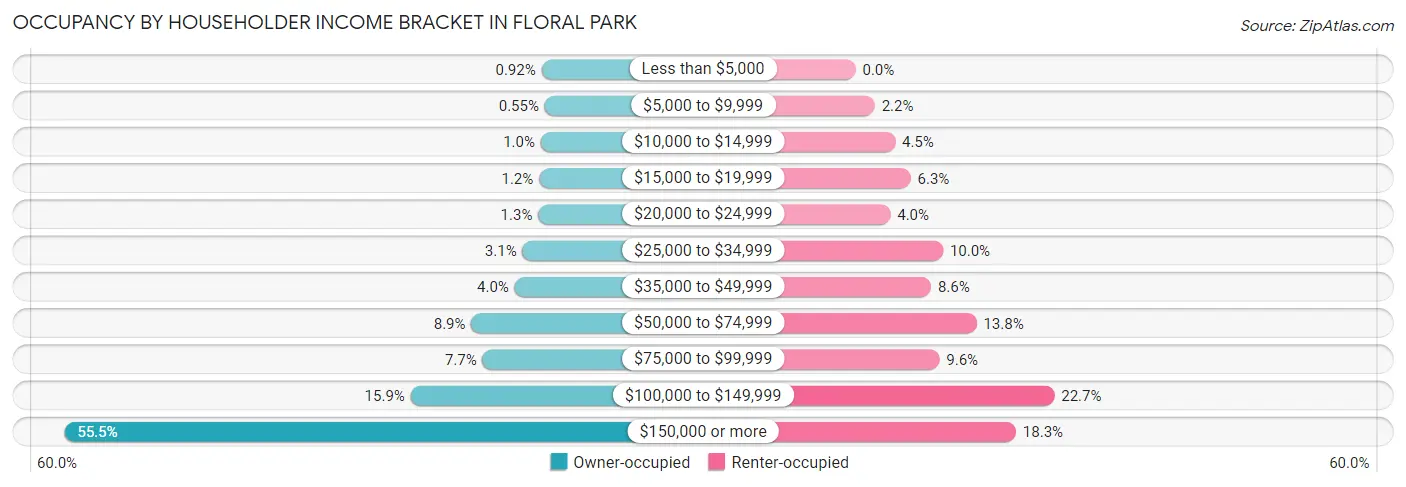
| Income Bracket | Owner-occupied | Renter-occupied |
| Less than $5,000 | 44 (0.9%) | 0 (0.0%) |
| $5,000 to $9,999 | 26 (0.5%) | 16 (2.2%) |
| $10,000 to $14,999 | 48 (1.0%) | 33 (4.5%) |
| $15,000 to $19,999 | 57 (1.2%) | 46 (6.3%) |
| $20,000 to $24,999 | 62 (1.3%) | 29 (4.0%) |
| $25,000 to $34,999 | 148 (3.1%) | 73 (10.0%) |
| $35,000 to $49,999 | 190 (4.0%) | 63 (8.6%) |
| $50,000 to $74,999 | 426 (8.9%) | 101 (13.8%) |
| $75,000 to $99,999 | 365 (7.7%) | 70 (9.6%) |
| $100,000 to $149,999 | 757 (15.9%) | 166 (22.7%) |
| $150,000 or more | 2,644 (55.5%) | 134 (18.3%) |
| Total | 4,767 (100.0%) | 731 (100.0%) |
Monthly Housing Cost Tiers in Floral Park
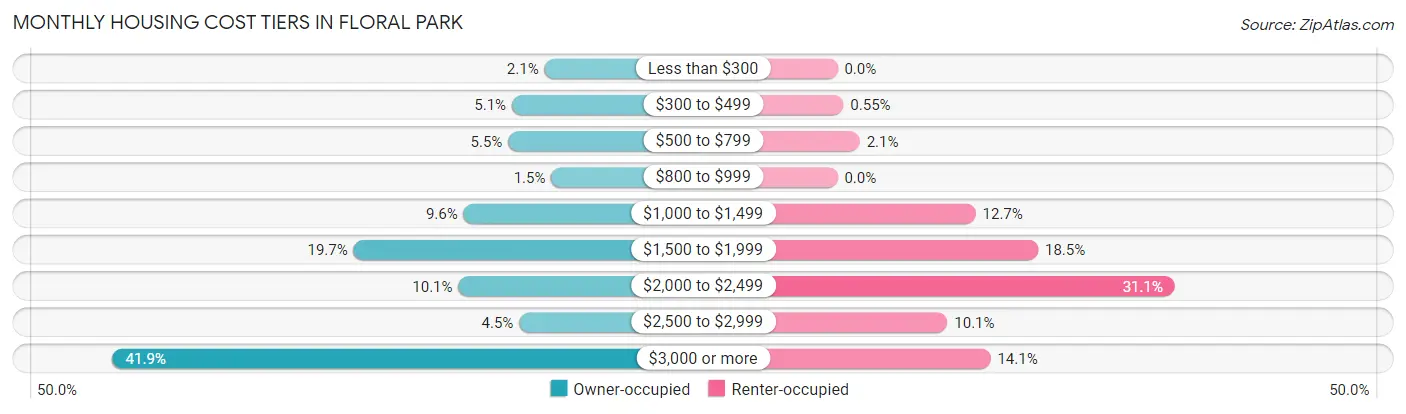
| Monthly Cost | Owner-occupied | Renter-occupied |
| Less than $300 | 102 (2.1%) | 0 (0.0%) |
| $300 to $499 | 245 (5.1%) | 4 (0.5%) |
| $500 to $799 | 261 (5.5%) | 15 (2.1%) |
| $800 to $999 | 72 (1.5%) | 0 (0.0%) |
| $1,000 to $1,499 | 457 (9.6%) | 93 (12.7%) |
| $1,500 to $1,999 | 940 (19.7%) | 135 (18.5%) |
| $2,000 to $2,499 | 480 (10.1%) | 227 (31.0%) |
| $2,500 to $2,999 | 213 (4.5%) | 74 (10.1%) |
| $3,000 or more | 1,997 (41.9%) | 103 (14.1%) |
| Total | 4,767 (100.0%) | 731 (100.0%) |
Physical Housing Characteristics in Floral Park
Housing Structures in Floral Park
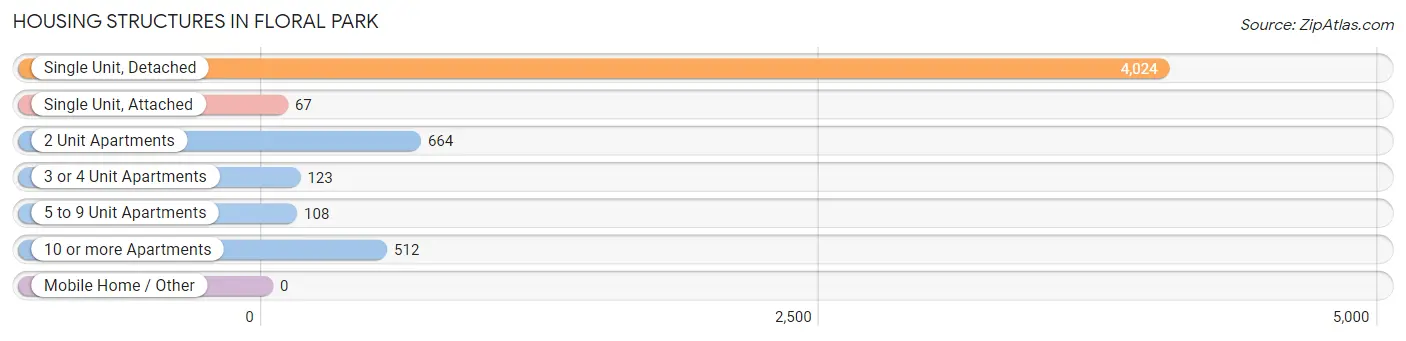
| Structure Type | # Housing Units | % Housing Units |
| Single Unit, Detached | 4,024 | 73.2% |
| Single Unit, Attached | 67 | 1.2% |
| 2 Unit Apartments | 664 | 12.1% |
| 3 or 4 Unit Apartments | 123 | 2.2% |
| 5 to 9 Unit Apartments | 108 | 2.0% |
| 10 or more Apartments | 512 | 9.3% |
| Mobile Home / Other | 0 | 0.0% |
| Total | 5,498 | 100.0% |
Housing Structures by Occupancy in Floral Park
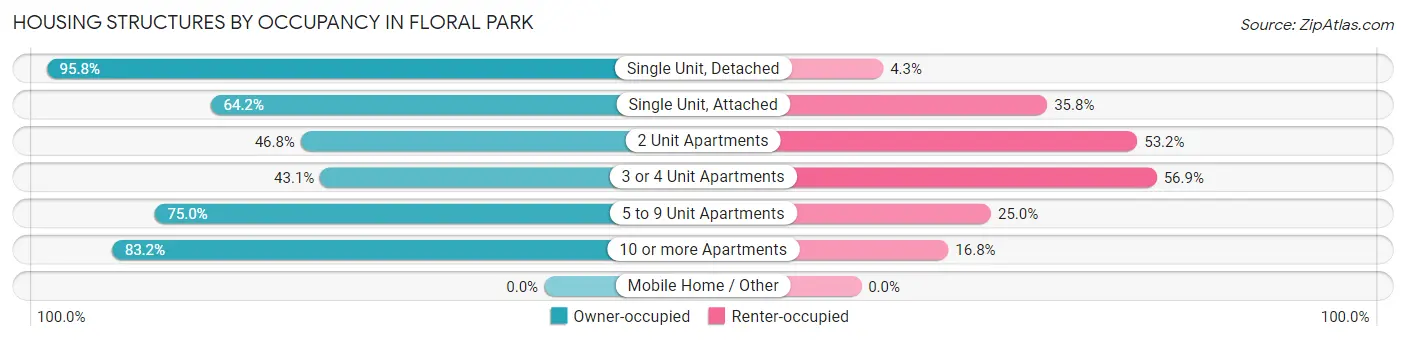
| Structure Type | Owner-occupied | Renter-occupied |
| Single Unit, Detached | 3,853 (95.8%) | 171 (4.3%) |
| Single Unit, Attached | 43 (64.2%) | 24 (35.8%) |
| 2 Unit Apartments | 311 (46.8%) | 353 (53.2%) |
| 3 or 4 Unit Apartments | 53 (43.1%) | 70 (56.9%) |
| 5 to 9 Unit Apartments | 81 (75.0%) | 27 (25.0%) |
| 10 or more Apartments | 426 (83.2%) | 86 (16.8%) |
| Mobile Home / Other | 0 (0.0%) | 0 (0.0%) |
| Total | 4,767 (86.7%) | 731 (13.3%) |
Housing Structures by Number of Rooms in Floral Park
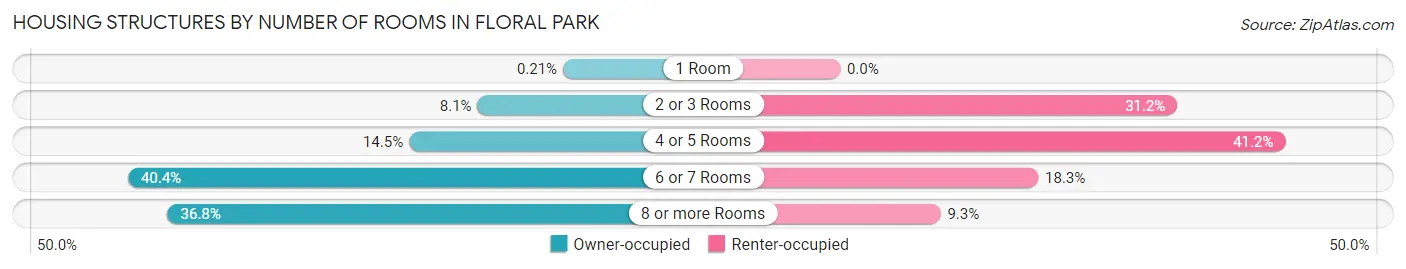
| Number of Rooms | Owner-occupied | Renter-occupied |
| 1 Room | 10 (0.2%) | 0 (0.0%) |
| 2 or 3 Rooms | 387 (8.1%) | 228 (31.2%) |
| 4 or 5 Rooms | 689 (14.4%) | 301 (41.2%) |
| 6 or 7 Rooms | 1,928 (40.4%) | 134 (18.3%) |
| 8 or more Rooms | 1,753 (36.8%) | 68 (9.3%) |
| Total | 4,767 (100.0%) | 731 (100.0%) |
Housing Structure by Heating Type in Floral Park
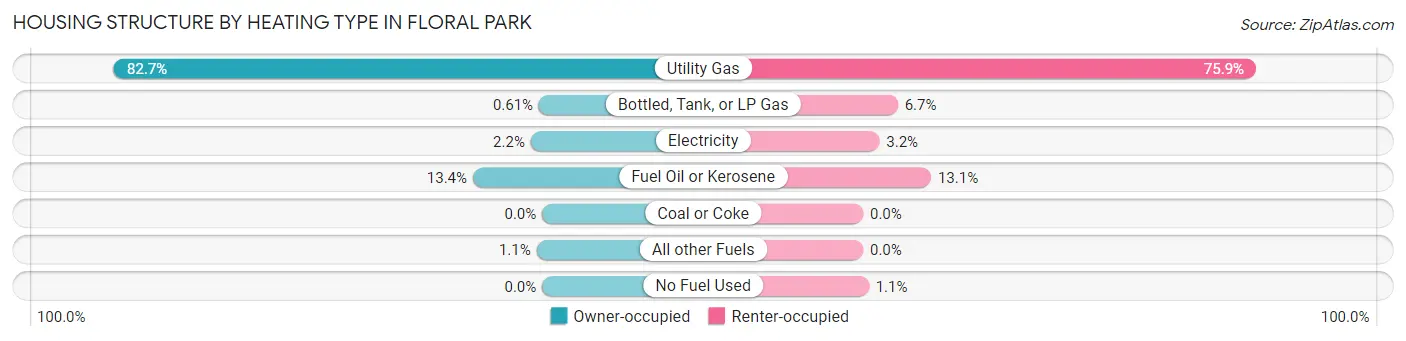
| Heating Type | Owner-occupied | Renter-occupied |
| Utility Gas | 3,944 (82.7%) | 555 (75.9%) |
| Bottled, Tank, or LP Gas | 29 (0.6%) | 49 (6.7%) |
| Electricity | 105 (2.2%) | 23 (3.2%) |
| Fuel Oil or Kerosene | 638 (13.4%) | 96 (13.1%) |
| Coal or Coke | 0 (0.0%) | 0 (0.0%) |
| All other Fuels | 51 (1.1%) | 0 (0.0%) |
| No Fuel Used | 0 (0.0%) | 8 (1.1%) |
| Total | 4,767 (100.0%) | 731 (100.0%) |
Household Vehicle Usage in Floral Park
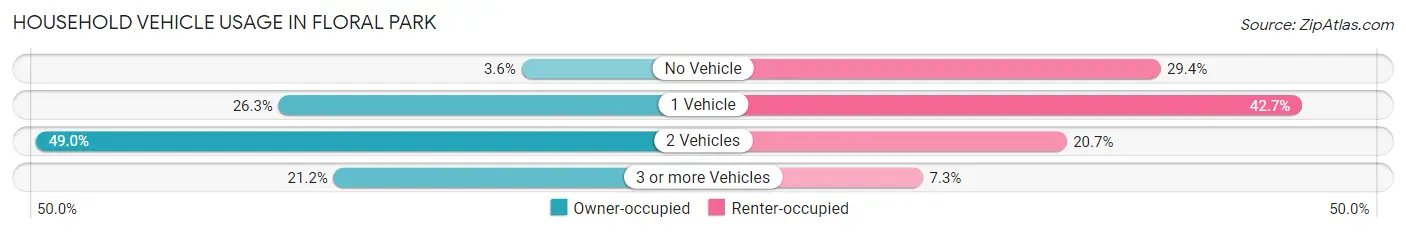
| Vehicles per Household | Owner-occupied | Renter-occupied |
| No Vehicle | 172 (3.6%) | 215 (29.4%) |
| 1 Vehicle | 1,253 (26.3%) | 312 (42.7%) |
| 2 Vehicles | 2,334 (49.0%) | 151 (20.7%) |
| 3 or more Vehicles | 1,008 (21.1%) | 53 (7.2%) |
| Total | 4,767 (100.0%) | 731 (100.0%) |
Real Estate & Mortgages in Floral Park
Real Estate and Mortgage Overview in Floral Park
| Characteristic | Without Mortgage | With Mortgage |
| Housing Units | 2,112 | 2,655 |
| Median Property Value | $626,900 | $751,800 |
| Median Household Income | $118,876 | $1,801 |
| Monthly Housing Costs | $1,501 | $1,982 |
| Real Estate Taxes | $10,001 | $59 |
Property Value by Mortgage Status in Floral Park
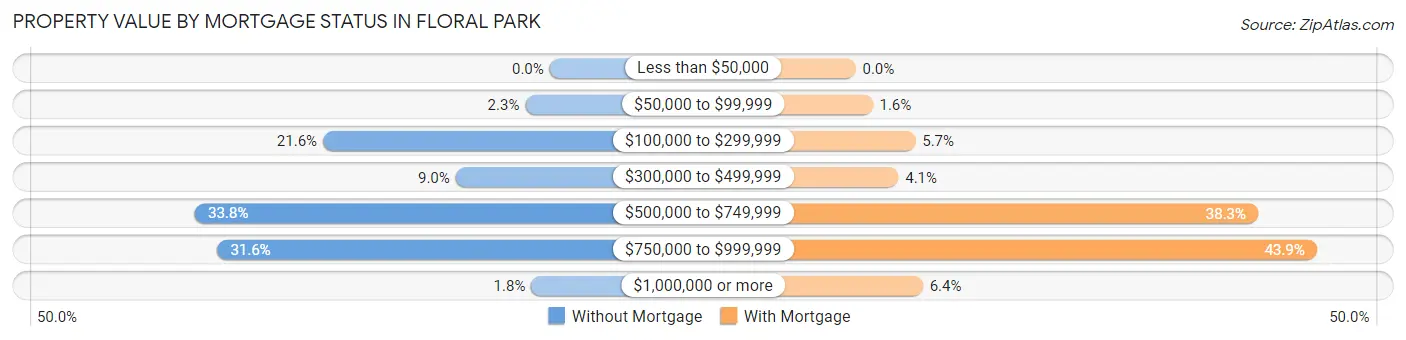
| Property Value | Without Mortgage | With Mortgage |
| Less than $50,000 | 0 (0.0%) | 0 (0.0%) |
| $50,000 to $99,999 | 49 (2.3%) | 43 (1.6%) |
| $100,000 to $299,999 | 456 (21.6%) | 151 (5.7%) |
| $300,000 to $499,999 | 189 (8.9%) | 108 (4.1%) |
| $500,000 to $749,999 | 713 (33.8%) | 1,017 (38.3%) |
| $750,000 to $999,999 | 668 (31.6%) | 1,166 (43.9%) |
| $1,000,000 or more | 37 (1.8%) | 170 (6.4%) |
| Total | 2,112 (100.0%) | 2,655 (100.0%) |
Household Income by Mortgage Status in Floral Park
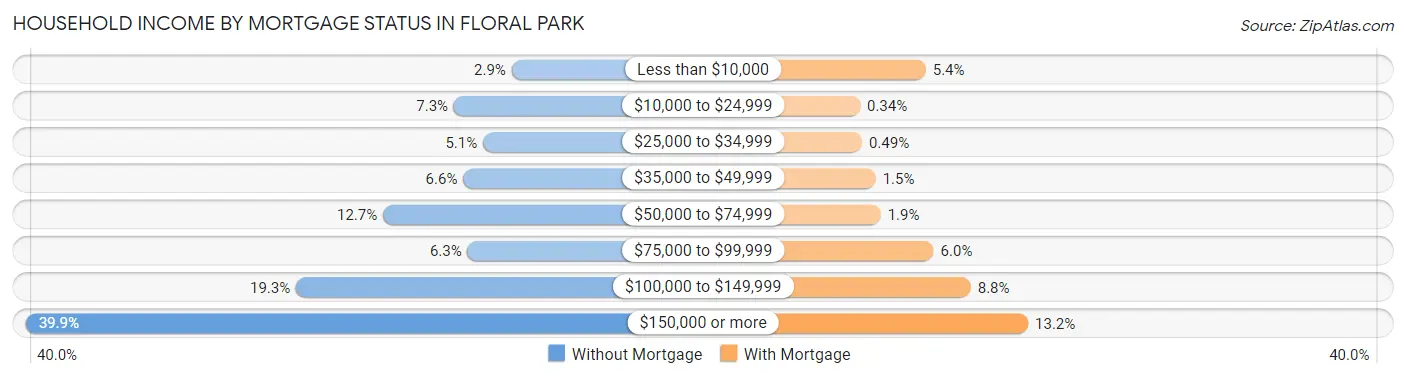
| Household Income | Without Mortgage | With Mortgage |
| Less than $10,000 | 61 (2.9%) | 142 (5.3%) |
| $10,000 to $24,999 | 154 (7.3%) | 9 (0.3%) |
| $25,000 to $34,999 | 107 (5.1%) | 13 (0.5%) |
| $35,000 to $49,999 | 139 (6.6%) | 41 (1.5%) |
| $50,000 to $74,999 | 268 (12.7%) | 51 (1.9%) |
| $75,000 to $99,999 | 132 (6.2%) | 158 (5.9%) |
| $100,000 to $149,999 | 408 (19.3%) | 233 (8.8%) |
| $150,000 or more | 843 (39.9%) | 349 (13.2%) |
| Total | 2,112 (100.0%) | 2,655 (100.0%) |
Property Value to Household Income Ratio in Floral Park
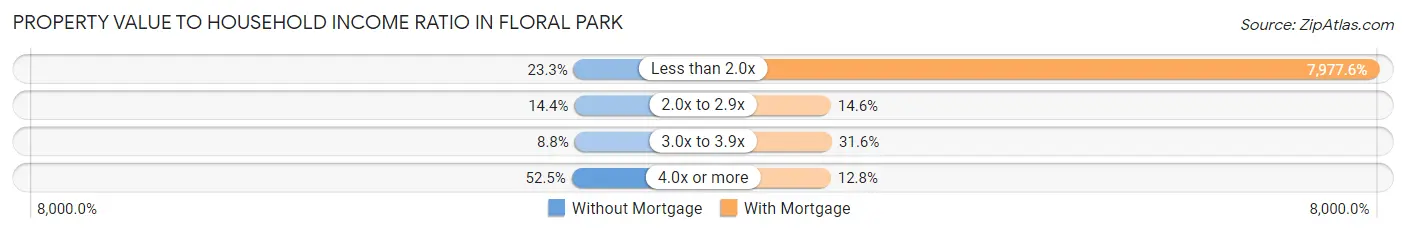
| Value-to-Income Ratio | Without Mortgage | With Mortgage |
| Less than 2.0x | 493 (23.3%) | 211,806 (7,977.6%) |
| 2.0x to 2.9x | 305 (14.4%) | 387 (14.6%) |
| 3.0x to 3.9x | 185 (8.8%) | 838 (31.6%) |
| 4.0x or more | 1,108 (52.5%) | 339 (12.8%) |
| Total | 2,112 (100.0%) | 2,655 (100.0%) |
Real Estate Taxes by Mortgage Status in Floral Park
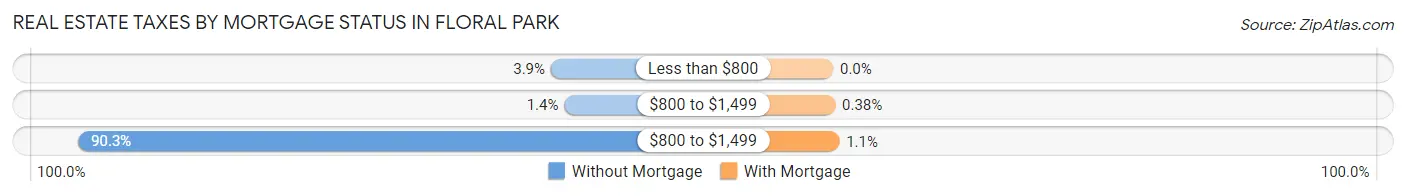
| Property Taxes | Without Mortgage | With Mortgage |
| Less than $800 | 82 (3.9%) | 0 (0.0%) |
| $800 to $1,499 | 30 (1.4%) | 10 (0.4%) |
| $800 to $1,499 | 1,906 (90.2%) | 30 (1.1%) |
| Total | 2,112 (100.0%) | 2,655 (100.0%) |
Health & Disability in Floral Park
Health Insurance Coverage by Age in Floral Park
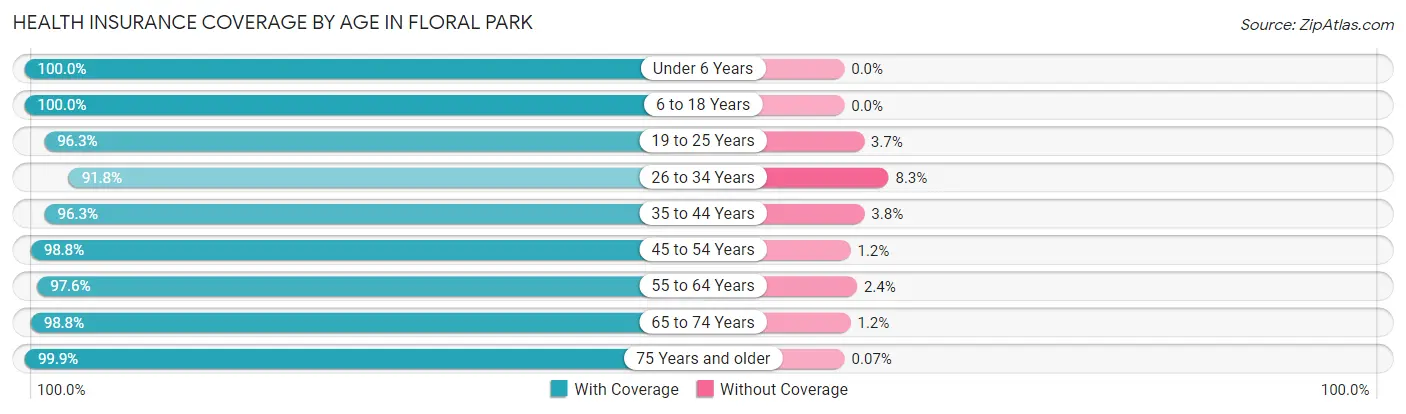
| Age Bracket | With Coverage | Without Coverage |
| Under 6 Years | 1,034 (100.0%) | 0 (0.0%) |
| 6 to 18 Years | 2,682 (100.0%) | 0 (0.0%) |
| 19 to 25 Years | 1,212 (96.3%) | 46 (3.7%) |
| 26 to 34 Years | 1,435 (91.7%) | 129 (8.3%) |
| 35 to 44 Years | 1,951 (96.3%) | 76 (3.7%) |
| 45 to 54 Years | 2,206 (98.8%) | 26 (1.2%) |
| 55 to 64 Years | 2,105 (97.6%) | 51 (2.4%) |
| 65 to 74 Years | 1,534 (98.8%) | 18 (1.2%) |
| 75 Years and older | 1,386 (99.9%) | 1 (0.1%) |
| Total | 15,545 (97.8%) | 347 (2.2%) |
Health Insurance Coverage by Citizenship Status in Floral Park
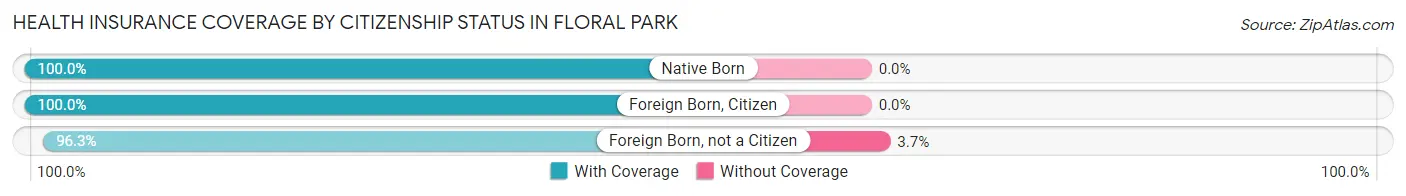
| Citizenship Status | With Coverage | Without Coverage |
| Native Born | 1,034 (100.0%) | 0 (0.0%) |
| Foreign Born, Citizen | 2,682 (100.0%) | 0 (0.0%) |
| Foreign Born, not a Citizen | 1,212 (96.3%) | 46 (3.7%) |
Health Insurance Coverage by Household Income in Floral Park
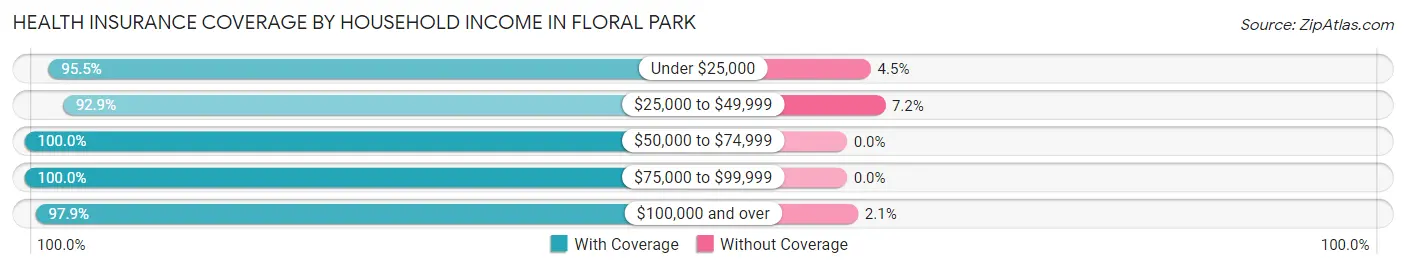
| Household Income | With Coverage | Without Coverage |
| Under $25,000 | 599 (95.5%) | 28 (4.5%) |
| $25,000 to $49,999 | 896 (92.8%) | 69 (7.1%) |
| $50,000 to $74,999 | 1,119 (100.0%) | 0 (0.0%) |
| $75,000 to $99,999 | 1,142 (100.0%) | 0 (0.0%) |
| $100,000 and over | 11,761 (97.9%) | 250 (2.1%) |
Public vs Private Health Insurance Coverage by Age in Floral Park
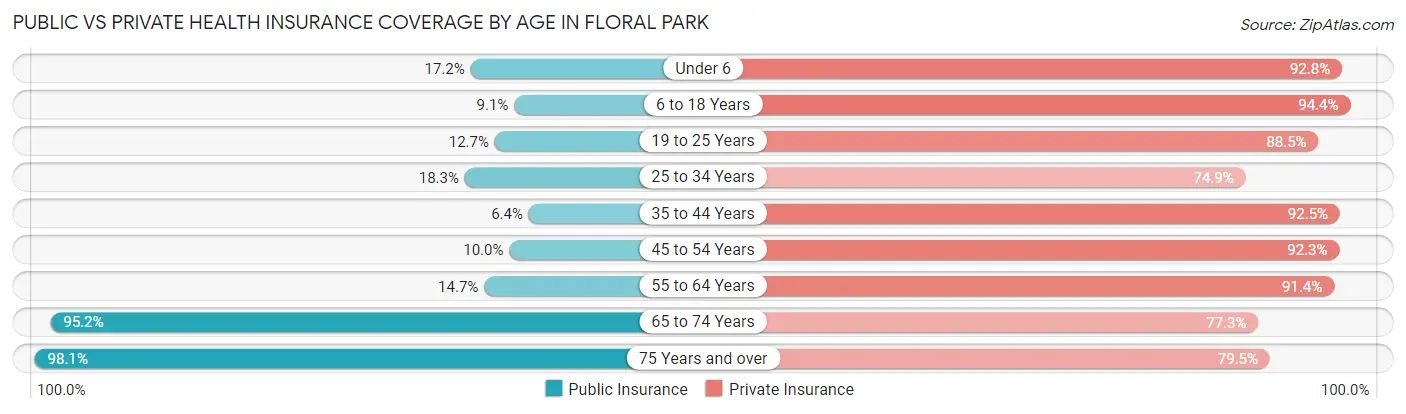
| Age Bracket | Public Insurance | Private Insurance |
| Under 6 | 178 (17.2%) | 960 (92.8%) |
| 6 to 18 Years | 245 (9.1%) | 2,531 (94.4%) |
| 19 to 25 Years | 160 (12.7%) | 1,113 (88.5%) |
| 25 to 34 Years | 286 (18.3%) | 1,172 (74.9%) |
| 35 to 44 Years | 130 (6.4%) | 1,874 (92.4%) |
| 45 to 54 Years | 224 (10.0%) | 2,061 (92.3%) |
| 55 to 64 Years | 317 (14.7%) | 1,970 (91.4%) |
| 65 to 74 Years | 1,478 (95.2%) | 1,200 (77.3%) |
| 75 Years and over | 1,361 (98.1%) | 1,102 (79.4%) |
| Total | 4,379 (27.6%) | 13,983 (88.0%) |
Disability Status by Sex by Age in Floral Park
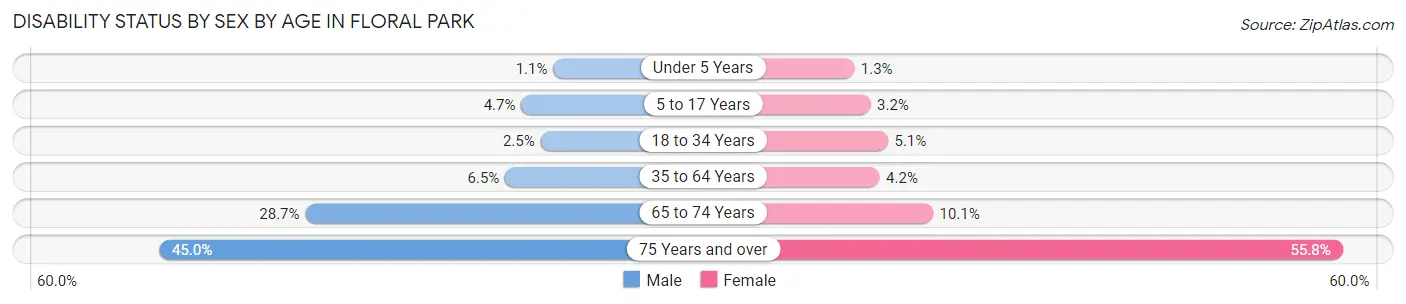
| Age Bracket | Male | Female |
| Under 5 Years | 4 (1.1%) | 5 (1.3%) |
| 5 to 17 Years | 70 (4.7%) | 38 (3.2%) |
| 18 to 34 Years | 44 (2.5%) | 70 (5.1%) |
| 35 to 64 Years | 215 (6.5%) | 129 (4.2%) |
| 65 to 74 Years | 210 (28.7%) | 83 (10.1%) |
| 75 Years and over | 258 (45.0%) | 454 (55.8%) |
Disability Class by Sex by Age in Floral Park
Disability Class: Hearing Difficulty
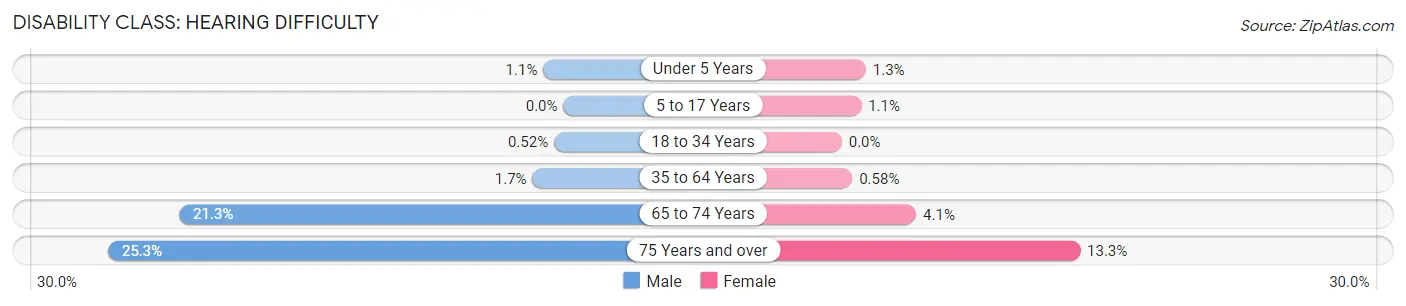
| Age Bracket | Male | Female |
| Under 5 Years | 4 (1.1%) | 5 (1.3%) |
| 5 to 17 Years | 0 (0.0%) | 13 (1.1%) |
| 18 to 34 Years | 9 (0.5%) | 0 (0.0%) |
| 35 to 64 Years | 57 (1.7%) | 18 (0.6%) |
| 65 to 74 Years | 156 (21.3%) | 34 (4.1%) |
| 75 Years and over | 145 (25.3%) | 108 (13.3%) |
Disability Class: Vision Difficulty
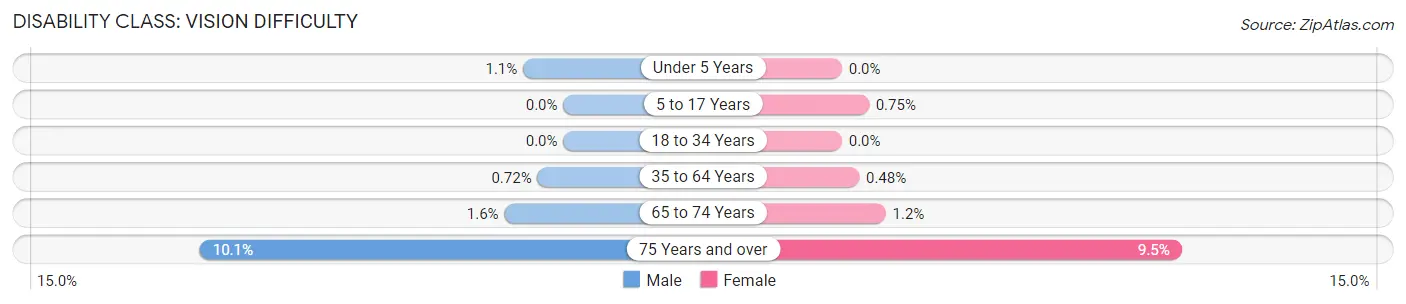
| Age Bracket | Male | Female |
| Under 5 Years | 4 (1.1%) | 0 (0.0%) |
| 5 to 17 Years | 0 (0.0%) | 9 (0.7%) |
| 18 to 34 Years | 0 (0.0%) | 0 (0.0%) |
| 35 to 64 Years | 24 (0.7%) | 15 (0.5%) |
| 65 to 74 Years | 12 (1.6%) | 10 (1.2%) |
| 75 Years and over | 58 (10.1%) | 77 (9.5%) |
Disability Class: Cognitive Difficulty
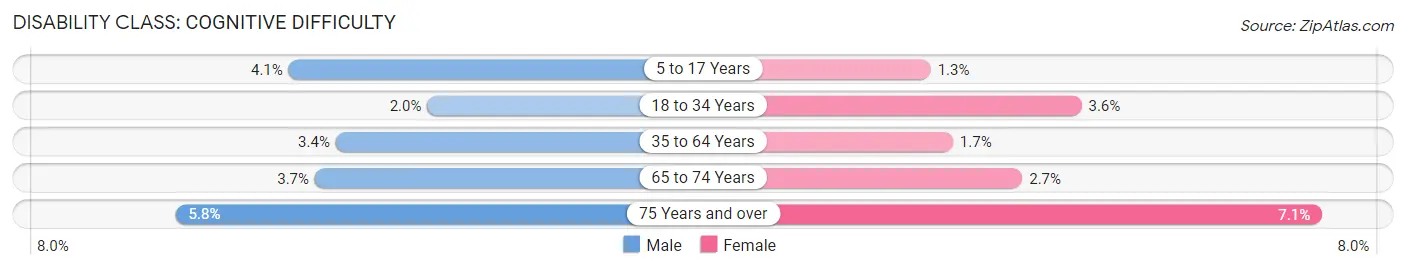
| Age Bracket | Male | Female |
| 5 to 17 Years | 61 (4.1%) | 16 (1.3%) |
| 18 to 34 Years | 35 (2.0%) | 49 (3.6%) |
| 35 to 64 Years | 112 (3.4%) | 51 (1.7%) |
| 65 to 74 Years | 27 (3.7%) | 22 (2.7%) |
| 75 Years and over | 33 (5.8%) | 58 (7.1%) |
Disability Class: Ambulatory Difficulty
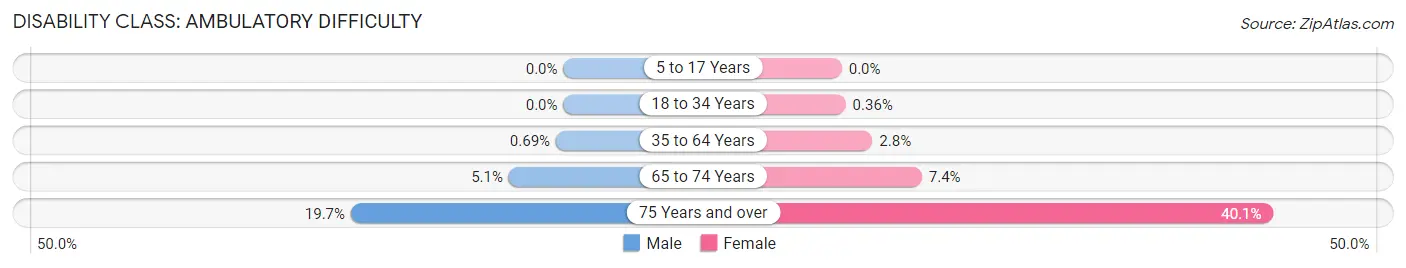
| Age Bracket | Male | Female |
| 5 to 17 Years | 0 (0.0%) | 0 (0.0%) |
| 18 to 34 Years | 0 (0.0%) | 5 (0.4%) |
| 35 to 64 Years | 23 (0.7%) | 88 (2.8%) |
| 65 to 74 Years | 37 (5.1%) | 61 (7.4%) |
| 75 Years and over | 113 (19.7%) | 326 (40.1%) |
Disability Class: Self-Care Difficulty
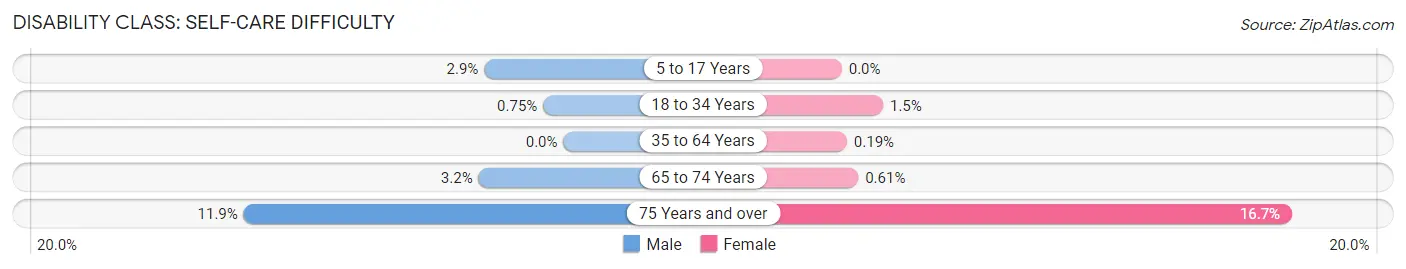
| Age Bracket | Male | Female |
| 5 to 17 Years | 44 (2.9%) | 0 (0.0%) |
| 18 to 34 Years | 13 (0.7%) | 21 (1.5%) |
| 35 to 64 Years | 0 (0.0%) | 6 (0.2%) |
| 65 to 74 Years | 23 (3.2%) | 5 (0.6%) |
| 75 Years and over | 68 (11.9%) | 136 (16.7%) |
Technology Access in Floral Park
Computing Device Access in Floral Park
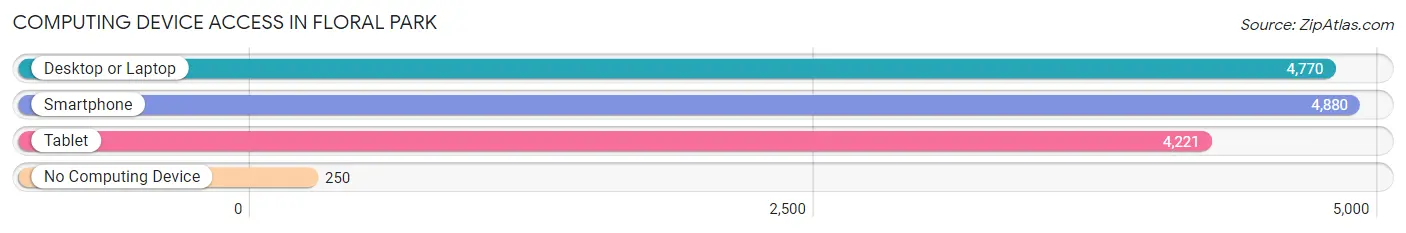
| Device Type | # Households | % Households |
| Desktop or Laptop | 4,770 | 86.8% |
| Smartphone | 4,880 | 88.8% |
| Tablet | 4,221 | 76.8% |
| No Computing Device | 250 | 4.5% |
| Total | 5,498 | 100.0% |
Internet Access in Floral Park
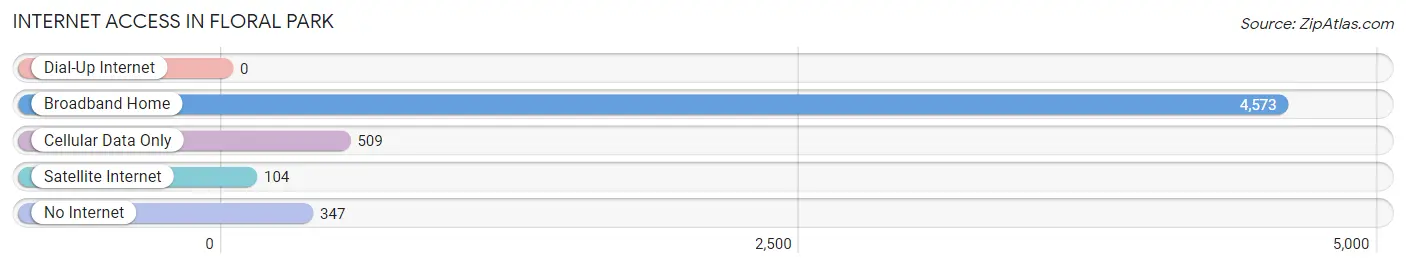
| Internet Type | # Households | % Households |
| Dial-Up Internet | 0 | 0.0% |
| Broadband Home | 4,573 | 83.2% |
| Cellular Data Only | 509 | 9.3% |
| Satellite Internet | 104 | 1.9% |
| No Internet | 347 | 6.3% |
| Total | 5,498 | 100.0% |
Floral Park Summary
Floral Park is a village located in Nassau County, New York, United States. It is located on Long Island, approximately 18 miles east of Manhattan. The village is part of the Town of Hempstead and is bordered by the villages of Bellerose, New Hyde Park, Stewart Manor, and Garden City. As of the 2010 census, the village had a population of 16,452.
History
The area now known as Floral Park was originally part of the Hempstead Plains, a vast area of grassland that stretched from the Atlantic Ocean to the Hempstead Harbor. The area was first settled by Europeans in the 1640s, when Dutch and English settlers began to move into the area. The area was originally known as East Hinsdale, and was part of the Town of Hempstead.
In 1874, the Long Island Rail Road opened a station in the area, which was named Floral Park Station. The station was named after the nearby Floral Park Hotel, which was built in 1868. The hotel was named after the many flower gardens that were planted in the area.
In 1908, the village of Floral Park was incorporated. The village was named after the hotel and the many flower gardens in the area.
Geography
Floral Park is located at 40°42'17" North, 73°41'17" West (40.704722, -73.688056). According to the United States Census Bureau, the village has a total area of 2.2 square miles, all of it land.
The village is located on the Hempstead Plains, a vast area of grassland that stretches from the Atlantic Ocean to the Hempstead Harbor. The village is bordered by the villages of Bellerose, New Hyde Park, Stewart Manor, and Garden City.
Economy
Floral Park is a primarily residential community, with a small commercial district located along Jericho Turnpike. The village is home to several small businesses, including restaurants, retail stores, and professional services.
The village is also home to several large employers, including Northwell Health, a healthcare provider, and the Floral Park-Bellerose School District, which serves the village and the surrounding area.
Demographics
As of the 2010 census, there were 16,452 people, 5,845 households, and 4,717 families residing in the village. The population density was 7,400.3 people per square mile. There were 6,093 housing units at an average density of 2,743.3 per square mile. The racial makeup of the village was 79.2% White, 5.2% African American, 0.2% Native American, 8.3% Asian, 0.1% Pacific Islander, 4.2% from other races, and 2.9% from two or more races. Hispanic or Latino of any race were 11.7% of the population.
There were 5,845 households, out of which 33.2% had children under the age of 18 living with them, 62.2% were married couples living together, 10.2% had a female householder with no husband present, and 23.7% were non-families. 19.7% of all households were made up of individuals, and 9.3% had someone living alone who was 65 years of age or older. The average household size was 2.79 and the average family size was 3.23.
In the village, the population was spread out, with 23.2% under the age of 18, 6.2% from 18 to 24, 28.2% from 25 to 44, 27.2% from 45 to 64, and 15.2% who were 65 years of age or older. The median age was 40 years. For every 100 females, there were 93.2 males. For every 100 females age 18 and over, there were 90.2 males.
The median income for a household in the village was $87,845, and the median income for a family was $99,945. Males had a median income of $62,917 versus $45,938 for females. The per capita income for the village was $35,945. About 2.2% of families and 3.2% of the population were below the poverty line, including 3.7% of those under age 18 and 4.2% of those age 65 or over.
Common Questions
What is the Total Population of Floral Park?
Total Population of Floral Park is 15,892.
What is the Total Male Population of Floral Park?
Total Male Population of Floral Park is 8,202.
What is the Total Female Population of Floral Park?
Total Female Population of Floral Park is 7,690.
What is the Ratio of Males per 100 Females in Floral Park?
There are 106.66 Males per 100 Females in Floral Park.
What is the Ratio of Females per 100 Males in Floral Park?
There are 93.76 Females per 100 Males in Floral Park.
What is the Median Population Age in Floral Park?
Median Population Age in Floral Park is 44.0 Years.
What is the Average Family Size in Floral Park
Average Family Size in Floral Park is 3.3 People.
What is the Average Household Size in Floral Park
Average Household Size in Floral Park is 2.9 People.
What is Per Capita Income in Floral Park?
Per Capita income in Floral Park is $68,568.
What is the Median Family Income in Floral Park?
Median Family Income in Floral Park is $183,242.
What is the Median Household income in Floral Park?
Median Household Income in Floral Park is $153,659.
What is Income or Wage Gap in Floral Park?
Income or Wage Gap in Floral Park is 28.5%.
Women in Floral Park earn 71.5 cents for every dollar earned by a man.
What is Family Income Deficit in Floral Park?
Family Income Deficit in Floral Park is $9,673.
Families that are below poverty line in Floral Park earn $9,673 less on average than the poverty threshold level.
What is Inequality or Gini Index in Floral Park?
Inequality or Gini Index in Floral Park is 0.44.
How Large is the Labor Force in Floral Park?
There are 8,863 People in the Labor Forcein in Floral Park.
What is the Percentage of People in the Labor Force in Floral Park?
68.9% of People are in the Labor Force in Floral Park.
What is the Unemployment Rate in Floral Park?
Unemployment Rate in Floral Park is 3.8%.