Huntington Station, NY
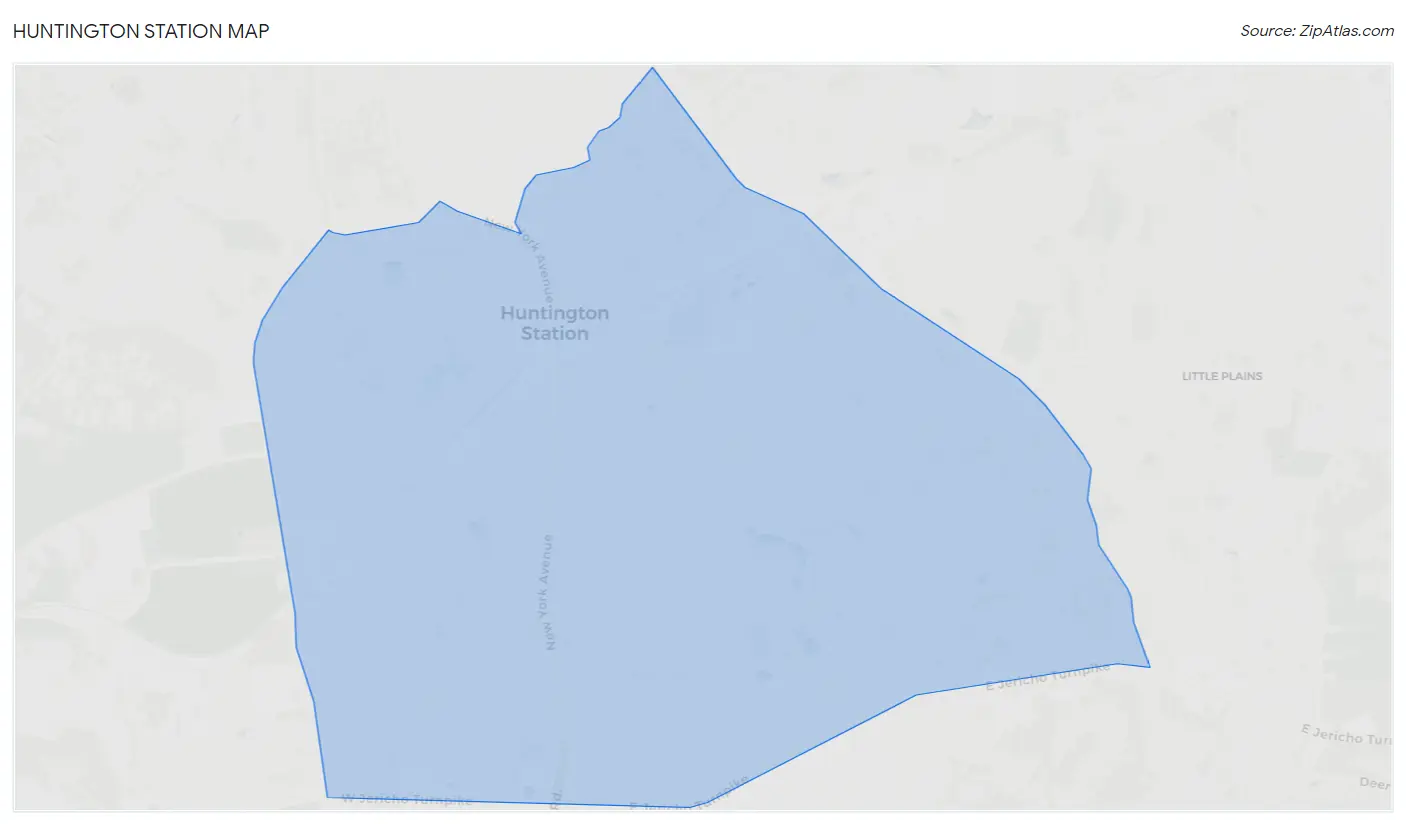
Huntington Station Map
Huntington Station Overview
34,588
TOTAL POPULATION
17,433
MALE POPULATION
17,155
FEMALE POPULATION
101.62
MALES / 100 FEMALES
98.41
FEMALES / 100 MALES
39.9
MEDIAN AGE
3.5
AVG FAMILY SIZE
3.1
AVG HOUSEHOLD SIZE
$47,450
PER CAPITA INCOME
$131,291
AVG FAMILY INCOME
$122,226
AVG HOUSEHOLD INCOME
29.7%
WAGE / INCOME GAP [ % ]
70.3¢/ $1
WAGE / INCOME GAP [ $ ]
0.40
INEQUALITY / GINI INDEX
19,519
LABOR FORCE [ PEOPLE ]
68.9%
PERCENT IN LABOR FORCE
5.7%
UNEMPLOYMENT RATE
Huntington Station Zip Codes
Huntington Station Area Codes
Race in Huntington Station
The most populous races in Huntington Station are White / Caucasian (21,426 | 62.0%), Hispanic or Latino (11,037 | 31.9%), and Some other Race (5,275 | 15.2%).
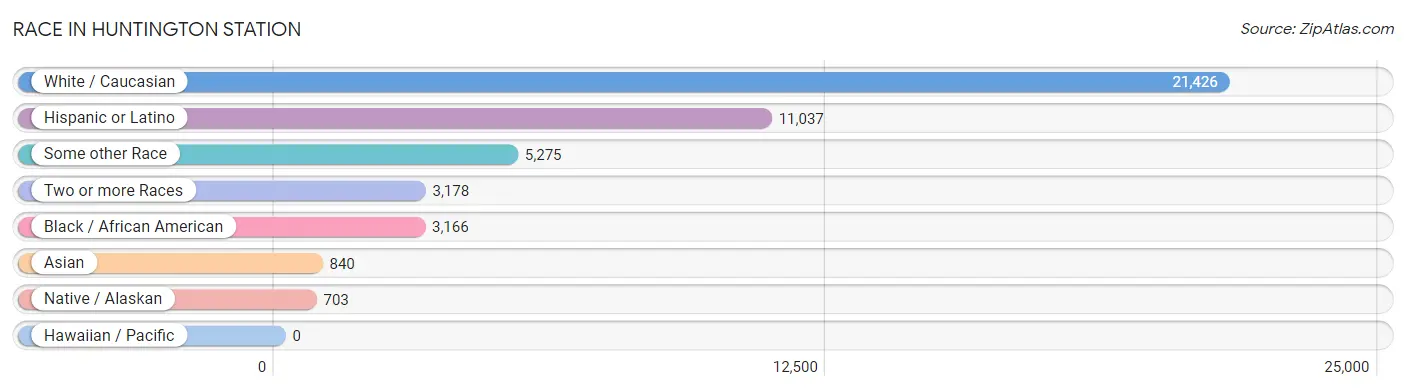
| Race | # Population | % Population |
| Asian | 840 | 2.4% |
| Black / African American | 3,166 | 9.1% |
| Hawaiian / Pacific | 0 | 0.0% |
| Hispanic or Latino | 11,037 | 31.9% |
| Native / Alaskan | 703 | 2.0% |
| White / Caucasian | 21,426 | 62.0% |
| Two or more Races | 3,178 | 9.2% |
| Some other Race | 5,275 | 15.2% |
| Total | 34,588 | 100.0% |
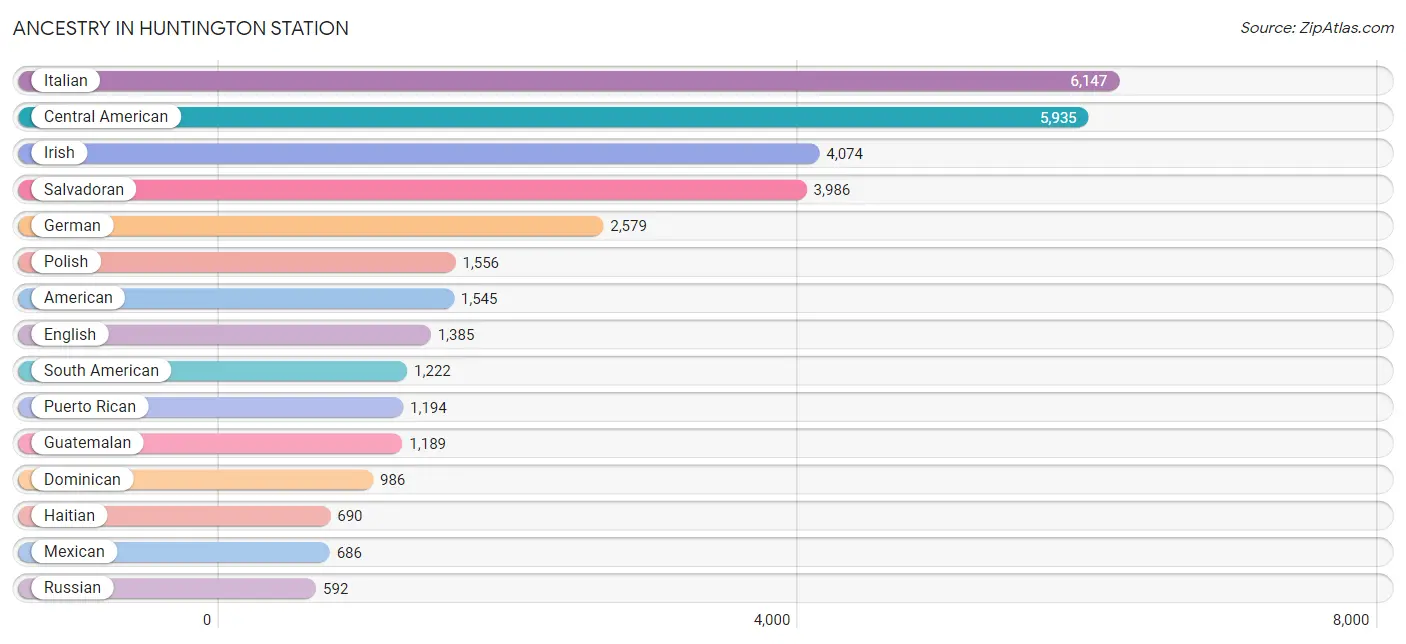
Ancestry in Huntington Station
The most populous ancestries reported in Huntington Station are Italian (6,147 | 17.8%), Central American (5,935 | 17.2%), Irish (4,074 | 11.8%), Salvadoran (3,986 | 11.5%), and German (2,579 | 7.5%), together accounting for 65.7% of all Huntington Station residents.
| Ancestry | # Population | % Population |
| African | 187 | 0.5% |
| Albanian | 22 | 0.1% |
| American | 1,545 | 4.5% |
| Arab | 14 | 0.0% |
| Argentinean | 19 | 0.1% |
| Armenian | 79 | 0.2% |
| Australian | 7 | 0.0% |
| Austrian | 211 | 0.6% |
| Barbadian | 65 | 0.2% |
| Belgian | 11 | 0.0% |
| Bermudan | 4 | 0.0% |
| Bhutanese | 22 | 0.1% |
| Brazilian | 71 | 0.2% |
| British | 20 | 0.1% |
| British West Indian | 61 | 0.2% |
| Burmese | 125 | 0.4% |
| Canadian | 20 | 0.1% |
| Central American | 5,935 | 17.2% |
| Central American Indian | 127 | 0.4% |
| Cherokee | 19 | 0.1% |
| Chilean | 66 | 0.2% |
| Colombian | 510 | 1.5% |
| Costa Rican | 126 | 0.4% |
| Croatian | 10 | 0.0% |
| Cuban | 71 | 0.2% |
| Czech | 19 | 0.1% |
| Danish | 135 | 0.4% |
| Dominican | 986 | 2.9% |
| Dutch | 56 | 0.2% |
| Eastern European | 239 | 0.7% |
| Ecuadorian | 411 | 1.2% |
| Egyptian | 4 | 0.0% |
| English | 1,385 | 4.0% |
| Estonian | 10 | 0.0% |
| European | 197 | 0.6% |
| Finnish | 30 | 0.1% |
| French | 231 | 0.7% |
| French American Indian | 16 | 0.1% |
| French Canadian | 19 | 0.1% |
| German | 2,579 | 7.5% |
| Ghanaian | 69 | 0.2% |
| Greek | 443 | 1.3% |
| Guatemalan | 1,189 | 3.4% |
| Guyanese | 17 | 0.1% |
| Haitian | 690 | 2.0% |
| Honduran | 440 | 1.3% |
| Hungarian | 203 | 0.6% |
| Indian (Asian) | 441 | 1.3% |
| Iranian | 72 | 0.2% |
| Iraqi | 10 | 0.0% |
| Irish | 4,074 | 11.8% |
| Israeli | 9 | 0.0% |
| Italian | 6,147 | 17.8% |
| Jamaican | 64 | 0.2% |
| Korean | 89 | 0.3% |
| Lithuanian | 107 | 0.3% |
| Mexican | 686 | 2.0% |
| Nicaraguan | 194 | 0.6% |
| Nigerian | 131 | 0.4% |
| Northern European | 10 | 0.0% |
| Norwegian | 364 | 1.1% |
| Pakistani | 12 | 0.0% |
| Peruvian | 174 | 0.5% |
| Polish | 1,556 | 4.5% |
| Portuguese | 26 | 0.1% |
| Puerto Rican | 1,194 | 3.5% |
| Romanian | 69 | 0.2% |
| Russian | 592 | 1.7% |
| Salvadoran | 3,986 | 11.5% |
| Scandinavian | 34 | 0.1% |
| Scotch-Irish | 67 | 0.2% |
| Scottish | 385 | 1.1% |
| Serbian | 12 | 0.0% |
| Slovak | 41 | 0.1% |
| South American | 1,222 | 3.5% |
| South American Indian | 84 | 0.2% |
| Spaniard | 228 | 0.7% |
| Spanish | 18 | 0.1% |
| Sri Lankan | 216 | 0.6% |
| Subsaharan African | 387 | 1.1% |
| Swedish | 250 | 0.7% |
| Swiss | 23 | 0.1% |
| Thai | 150 | 0.4% |
| Trinidadian and Tobagonian | 9 | 0.0% |
| Turkish | 58 | 0.2% |
| Ukrainian | 45 | 0.1% |
| Venezuelan | 42 | 0.1% |
| Welsh | 55 | 0.2% |
| West Indian | 99 | 0.3% | View All 89 Rows |
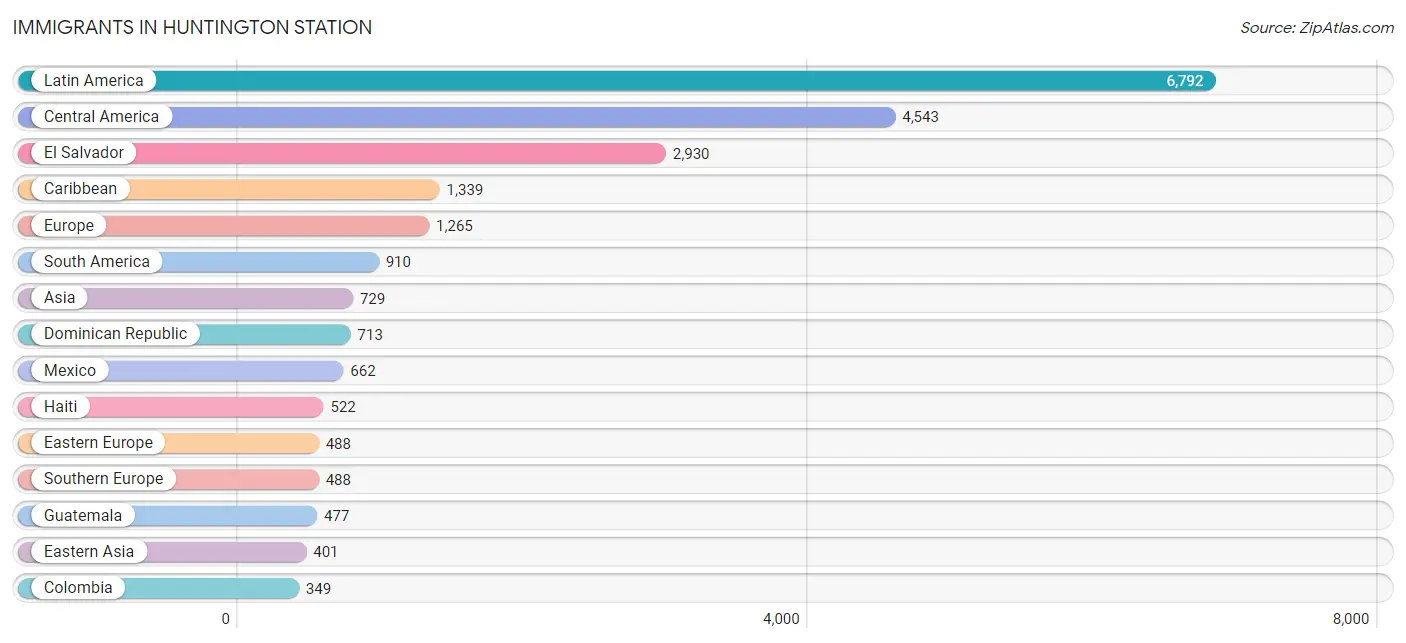
Immigrants in Huntington Station
The most numerous immigrant groups reported in Huntington Station came from Latin America (6,792 | 19.6%), Central America (4,543 | 13.1%), El Salvador (2,930 | 8.5%), Caribbean (1,339 | 3.9%), and Europe (1,265 | 3.7%), together accounting for 48.8% of all Huntington Station residents.
| Immigration Origin | # Population | % Population |
| Africa | 263 | 0.8% |
| Albania | 10 | 0.0% |
| Asia | 729 | 2.1% |
| Australia | 7 | 0.0% |
| Austria | 3 | 0.0% |
| Barbados | 13 | 0.0% |
| Belgium | 2 | 0.0% |
| Brazil | 66 | 0.2% |
| Canada | 24 | 0.1% |
| Caribbean | 1,339 | 3.9% |
| Central America | 4,543 | 13.1% |
| Chile | 58 | 0.2% |
| China | 243 | 0.7% |
| Colombia | 349 | 1.0% |
| Costa Rica | 69 | 0.2% |
| Cuba | 15 | 0.0% |
| Dominica | 4 | 0.0% |
| Dominican Republic | 713 | 2.1% |
| Eastern Africa | 29 | 0.1% |
| Eastern Asia | 401 | 1.2% |
| Eastern Europe | 488 | 1.4% |
| Ecuador | 169 | 0.5% |
| Egypt | 74 | 0.2% |
| El Salvador | 2,930 | 8.5% |
| England | 11 | 0.0% |
| Europe | 1,265 | 3.7% |
| Germany | 86 | 0.3% |
| Ghana | 54 | 0.2% |
| Greece | 71 | 0.2% |
| Grenada | 7 | 0.0% |
| Guatemala | 477 | 1.4% |
| Guyana | 10 | 0.0% |
| Haiti | 522 | 1.5% |
| Honduras | 183 | 0.5% |
| Hong Kong | 77 | 0.2% |
| Hungary | 32 | 0.1% |
| India | 62 | 0.2% |
| Iran | 48 | 0.1% |
| Ireland | 46 | 0.1% |
| Italy | 252 | 0.7% |
| Jamaica | 56 | 0.2% |
| Korea | 158 | 0.5% |
| Latin America | 6,792 | 19.6% |
| Mexico | 662 | 1.9% |
| Nicaragua | 164 | 0.5% |
| Nigeria | 65 | 0.2% |
| Northern Africa | 74 | 0.2% |
| Northern Europe | 198 | 0.6% |
| Norway | 18 | 0.1% |
| Oceania | 7 | 0.0% |
| Pakistan | 40 | 0.1% |
| Panama | 58 | 0.2% |
| Peru | 216 | 0.6% |
| Philippines | 47 | 0.1% |
| Poland | 329 | 0.9% |
| Portugal | 42 | 0.1% |
| Russia | 81 | 0.2% |
| Scotland | 123 | 0.4% |
| Serbia | 23 | 0.1% |
| South Africa | 41 | 0.1% |
| South America | 910 | 2.6% |
| South Central Asia | 179 | 0.5% |
| South Eastern Asia | 104 | 0.3% |
| Southern Europe | 488 | 1.4% |
| Spain | 123 | 0.4% |
| Taiwan | 15 | 0.0% |
| Thailand | 7 | 0.0% |
| Trinidad and Tobago | 9 | 0.0% |
| Turkey | 34 | 0.1% |
| Ukraine | 13 | 0.0% |
| Uzbekistan | 29 | 0.1% |
| Venezuela | 42 | 0.1% |
| Vietnam | 50 | 0.1% |
| Western Africa | 119 | 0.3% |
| Western Asia | 45 | 0.1% |
| Western Europe | 91 | 0.3% | View All 76 Rows |
Sex and Age in Huntington Station
Sex and Age in Huntington Station
The most populous age groups in Huntington Station are 55 to 59 Years (1,467 | 8.4%) for men and 55 to 59 Years (1,658 | 9.7%) for women.
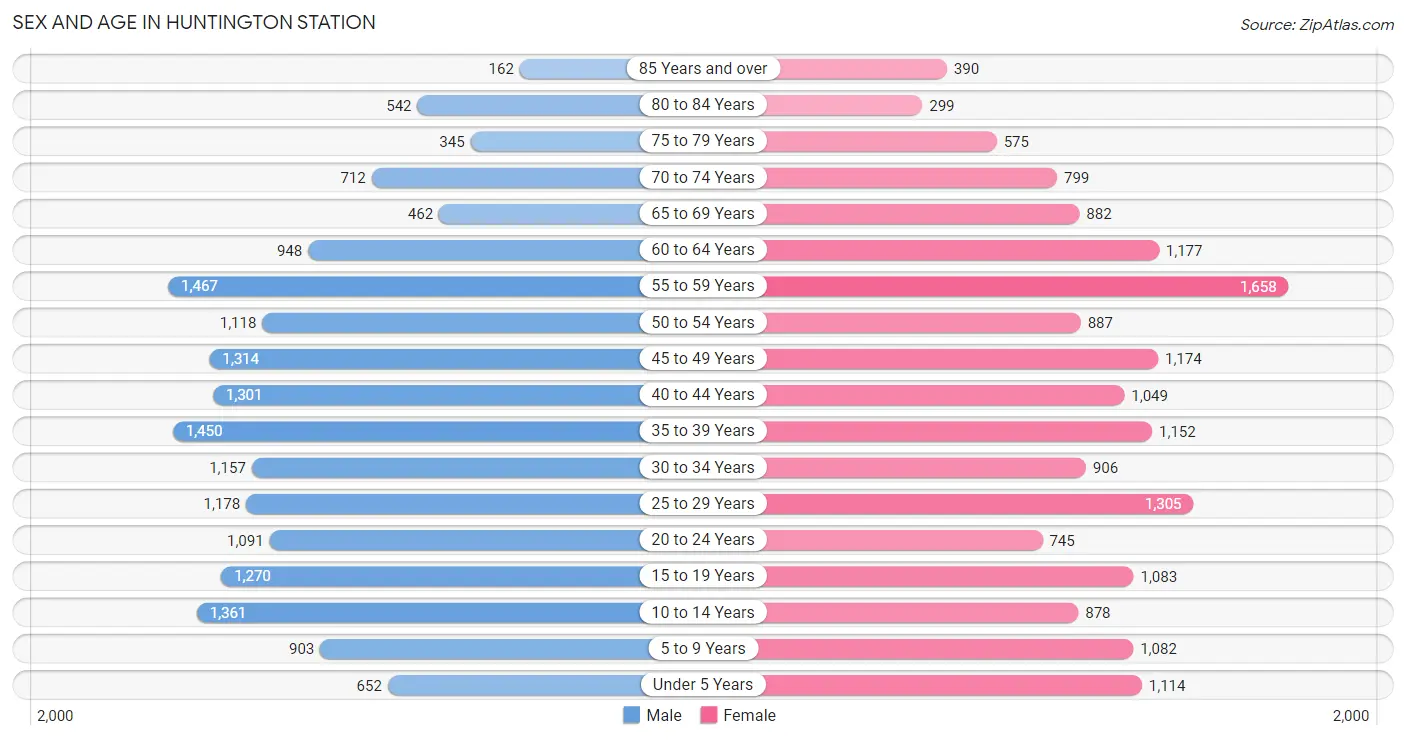
| Age Bracket | Male | Female |
| Under 5 Years | 652 (3.7%) | 1,114 (6.5%) |
| 5 to 9 Years | 903 (5.2%) | 1,082 (6.3%) |
| 10 to 14 Years | 1,361 (7.8%) | 878 (5.1%) |
| 15 to 19 Years | 1,270 (7.3%) | 1,083 (6.3%) |
| 20 to 24 Years | 1,091 (6.3%) | 745 (4.3%) |
| 25 to 29 Years | 1,178 (6.8%) | 1,305 (7.6%) |
| 30 to 34 Years | 1,157 (6.6%) | 906 (5.3%) |
| 35 to 39 Years | 1,450 (8.3%) | 1,152 (6.7%) |
| 40 to 44 Years | 1,301 (7.5%) | 1,049 (6.1%) |
| 45 to 49 Years | 1,314 (7.5%) | 1,174 (6.8%) |
| 50 to 54 Years | 1,118 (6.4%) | 887 (5.2%) |
| 55 to 59 Years | 1,467 (8.4%) | 1,658 (9.7%) |
| 60 to 64 Years | 948 (5.4%) | 1,177 (6.9%) |
| 65 to 69 Years | 462 (2.6%) | 882 (5.1%) |
| 70 to 74 Years | 712 (4.1%) | 799 (4.7%) |
| 75 to 79 Years | 345 (2.0%) | 575 (3.4%) |
| 80 to 84 Years | 542 (3.1%) | 299 (1.7%) |
| 85 Years and over | 162 (0.9%) | 390 (2.3%) |
| Total | 17,433 (100.0%) | 17,155 (100.0%) |
Families and Households in Huntington Station
Median Family Size in Huntington Station
The median family size in Huntington Station is 3.49 persons per family, with single female/mother families (1,394 | 17.2%) accounting for the largest median family size of 3.76 persons per family. On the other hand, single male/father families (595 | 7.3%) represent the smallest median family size with 2.98 persons per family.
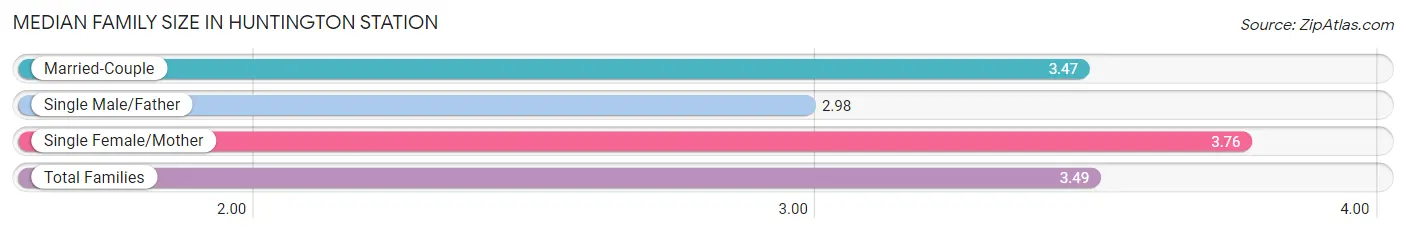
| Family Type | # Families | Family Size |
| Married-Couple | 6,141 (75.5%) | 3.47 |
| Single Male/Father | 595 (7.3%) | 2.98 |
| Single Female/Mother | 1,394 (17.2%) | 3.76 |
| Total Families | 8,130 (100.0%) | 3.49 |
Median Household Size in Huntington Station
The median household size in Huntington Station is 3.12 persons per household, with single female/mother households (1,394 | 12.7%) accounting for the largest median household size of 4.51 persons per household. non-family households (2,881 | 26.2%) represent the smallest median household size with 1.31 persons per household.
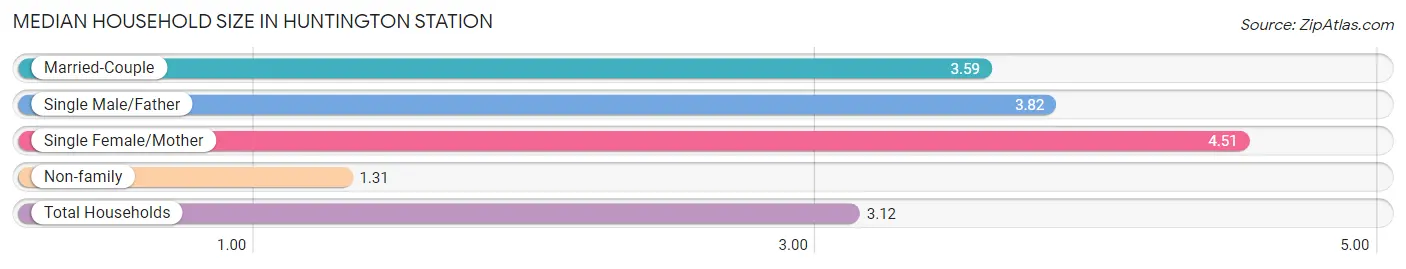
| Household Type | # Households | Household Size |
| Married-Couple | 6,141 (55.8%) | 3.59 |
| Single Male/Father | 595 (5.4%) | 3.82 |
| Single Female/Mother | 1,394 (12.7%) | 4.51 |
| Non-family | 2,881 (26.2%) | 1.31 |
| Total Households | 11,011 (100.0%) | 3.12 |
Household Size by Marriage Status in Huntington Station
Out of a total of 11,011 households in Huntington Station, 8,130 (73.8%) are family households, while 2,881 (26.2%) are nonfamily households. The most numerous type of family households are 2-person households, comprising 2,584, and the most common type of nonfamily households are 1-person households, comprising 2,177.
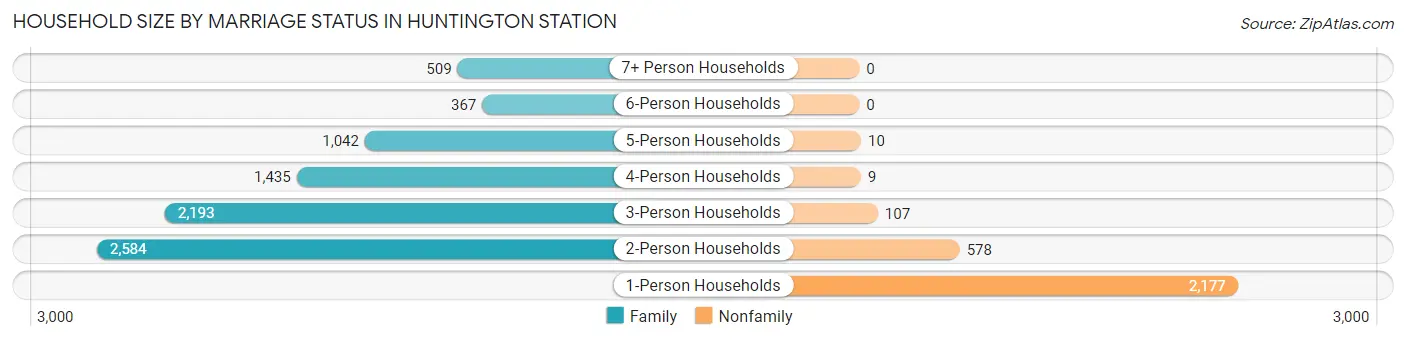
| Household Size | Family Households | Nonfamily Households |
| 1-Person Households | - | 2,177 (19.8%) |
| 2-Person Households | 2,584 (23.5%) | 578 (5.2%) |
| 3-Person Households | 2,193 (19.9%) | 107 (1.0%) |
| 4-Person Households | 1,435 (13.0%) | 9 (0.1%) |
| 5-Person Households | 1,042 (9.5%) | 10 (0.1%) |
| 6-Person Households | 367 (3.3%) | 0 (0.0%) |
| 7+ Person Households | 509 (4.6%) | 0 (0.0%) |
| Total | 8,130 (73.8%) | 2,881 (26.2%) |
Female Fertility in Huntington Station
Fertility by Age in Huntington Station
Average fertility rate in Huntington Station is 44.0 births per 1,000 women. Women in the age bracket of 20 to 34 years have the highest fertility rate with 63.0 births per 1,000 women. Women in the age bracket of 20 to 34 years acount for 55.4% of all women with births.
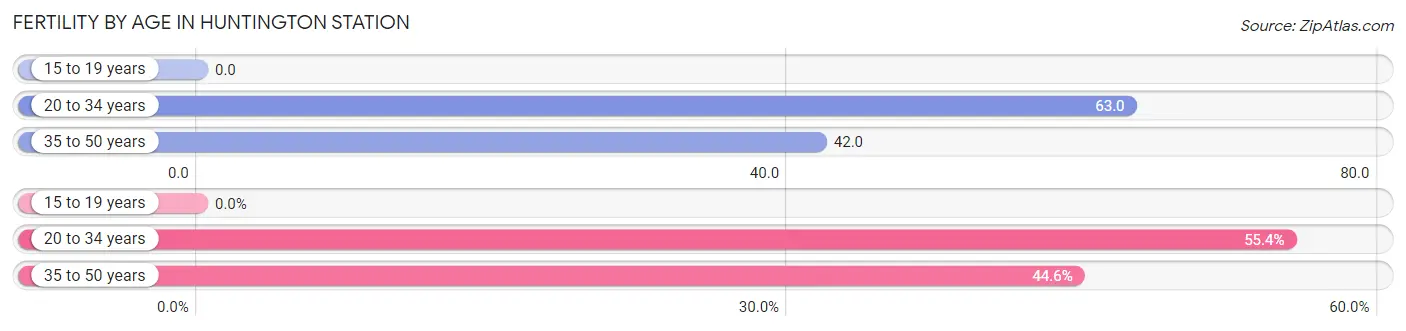
| Age Bracket | Women with Births | Births / 1,000 Women |
| 15 to 19 years | 0 (0.0%) | 0.0 |
| 20 to 34 years | 185 (55.4%) | 63.0 |
| 35 to 50 years | 149 (44.6%) | 42.0 |
| Total | 334 (100.0%) | 44.0 |
Fertility by Age by Marriage Status in Huntington Station
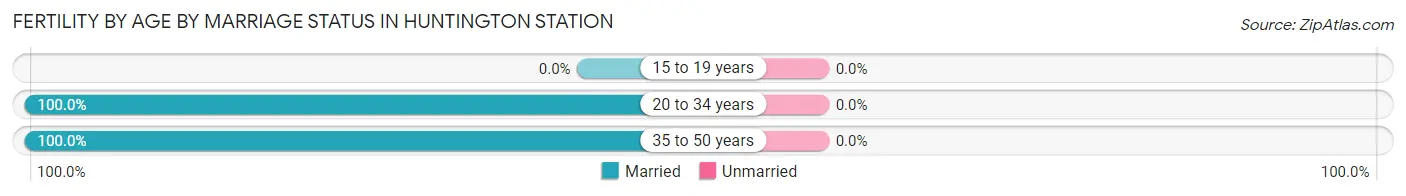
| Age Bracket | Married | Unmarried |
| 15 to 19 years | 0 (0.0%) | 0 (0.0%) |
| 20 to 34 years | 185 (100.0%) | 0 (0.0%) |
| 35 to 50 years | 149 (100.0%) | 0 (0.0%) |
| Total | 334 (100.0%) | 0 (0.0%) |
Fertility by Education in Huntington Station
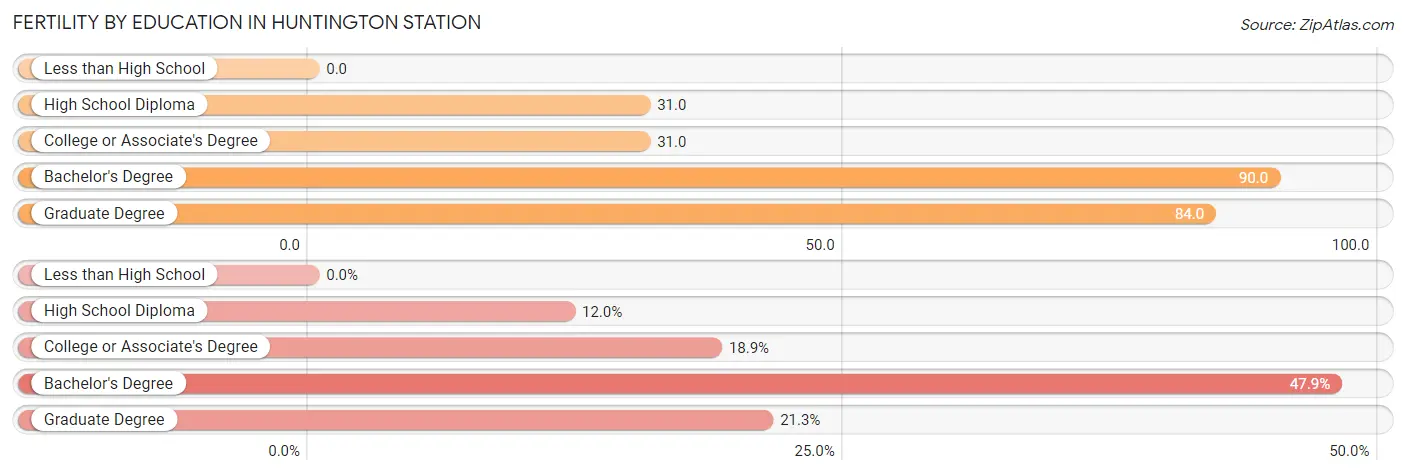
| Educational Attainment | Women with Births | Births / 1,000 Women |
| Less than High School | 0 (0.0%) | 0.0 |
| High School Diploma | 40 (12.0%) | 31.0 |
| College or Associate's Degree | 63 (18.9%) | 31.0 |
| Bachelor's Degree | 160 (47.9%) | 90.0 |
| Graduate Degree | 71 (21.3%) | 84.0 |
| Total | 334 (100.0%) | 44.0 |
Fertility by Education by Marriage Status in Huntington Station
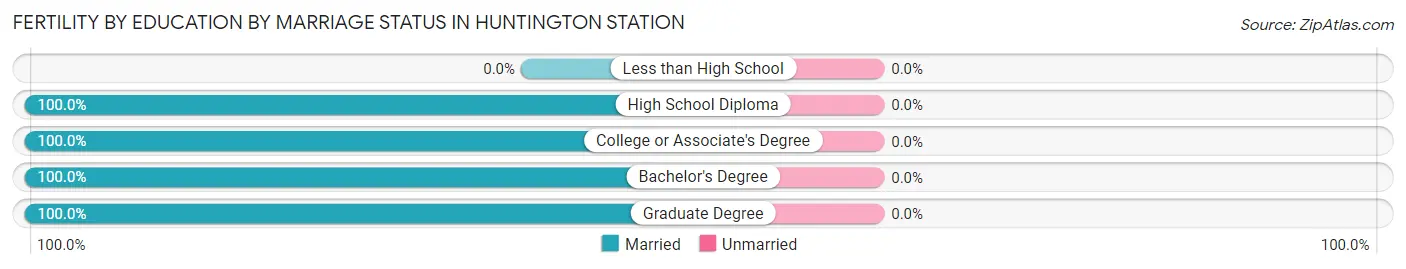
| Educational Attainment | Married | Unmarried |
| Less than High School | 0 (0.0%) | 0 (0.0%) |
| High School Diploma | 40 (100.0%) | 0 (0.0%) |
| College or Associate's Degree | 63 (100.0%) | 0 (0.0%) |
| Bachelor's Degree | 160 (100.0%) | 0 (0.0%) |
| Graduate Degree | 71 (100.0%) | 0 (0.0%) |
| Total | 334 (100.0%) | 0 (0.0%) |
Income in Huntington Station
Income Overview in Huntington Station
Per Capita Income in Huntington Station is $47,450, while median incomes of families and households are $131,291 and $122,226 respectively.
| Characteristic | Number | Measure |
| Per Capita Income | 34,588 | $47,450 |
| Median Family Income | 8,130 | $131,291 |
| Mean Family Income | 8,130 | $150,349 |
| Median Household Income | 11,011 | $122,226 |
| Mean Household Income | 11,011 | $141,235 |
| Income Deficit | 8,130 | $0 |
| Wage / Income Gap (%) | 34,588 | 29.73% |
| Wage / Income Gap ($) | 34,588 | 70.27¢ per $1 |
| Gini / Inequality Index | 34,588 | 0.40 |
Earnings by Sex in Huntington Station
Average Earnings in Huntington Station are $47,451, $58,543 for men and $41,136 for women, a difference of 29.7%.
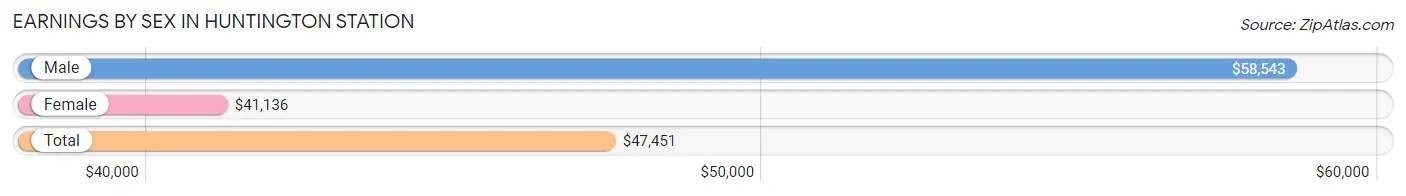
| Sex | Number | Average Earnings |
| Male | 10,904 (54.4%) | $58,543 |
| Female | 9,124 (45.6%) | $41,136 |
| Total | 20,028 (100.0%) | $47,451 |
Earnings by Sex by Income Bracket in Huntington Station
The most common earnings brackets in Huntington Station are $100,000+ for men (3,043 | 27.9%) and $100,000+ for women (1,618 | 17.7%).
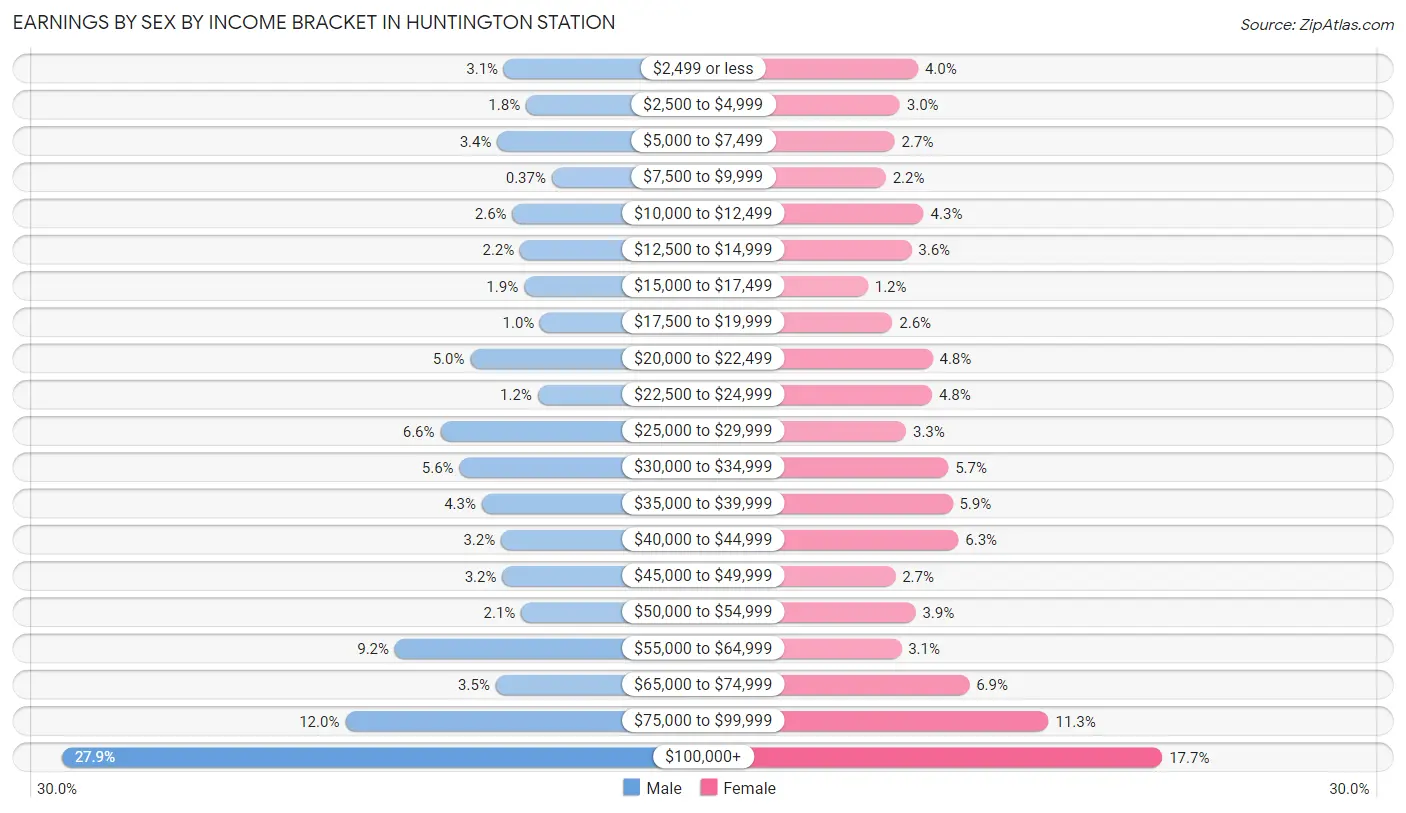
| Income | Male | Female |
| $2,499 or less | 334 (3.1%) | 365 (4.0%) |
| $2,500 to $4,999 | 198 (1.8%) | 272 (3.0%) |
| $5,000 to $7,499 | 374 (3.4%) | 245 (2.7%) |
| $7,500 to $9,999 | 40 (0.4%) | 200 (2.2%) |
| $10,000 to $12,499 | 281 (2.6%) | 394 (4.3%) |
| $12,500 to $14,999 | 234 (2.1%) | 331 (3.6%) |
| $15,000 to $17,499 | 210 (1.9%) | 108 (1.2%) |
| $17,500 to $19,999 | 111 (1.0%) | 234 (2.6%) |
| $20,000 to $22,499 | 540 (5.0%) | 440 (4.8%) |
| $22,500 to $24,999 | 126 (1.2%) | 437 (4.8%) |
| $25,000 to $29,999 | 723 (6.6%) | 304 (3.3%) |
| $30,000 to $34,999 | 606 (5.6%) | 520 (5.7%) |
| $35,000 to $39,999 | 469 (4.3%) | 542 (5.9%) |
| $40,000 to $44,999 | 351 (3.2%) | 572 (6.3%) |
| $45,000 to $49,999 | 344 (3.2%) | 248 (2.7%) |
| $50,000 to $54,999 | 228 (2.1%) | 352 (3.9%) |
| $55,000 to $64,999 | 1,002 (9.2%) | 279 (3.1%) |
| $65,000 to $74,999 | 384 (3.5%) | 628 (6.9%) |
| $75,000 to $99,999 | 1,306 (12.0%) | 1,035 (11.3%) |
| $100,000+ | 3,043 (27.9%) | 1,618 (17.7%) |
| Total | 10,904 (100.0%) | 9,124 (100.0%) |
Earnings by Sex by Educational Attainment in Huntington Station
Average earnings in Huntington Station are $64,277 for men and $46,430 for women, a difference of 27.8%. Men with an educational attainment of graduate degree enjoy the highest average annual earnings of $101,808, while those with less than high school education earn the least with $42,312. Women with an educational attainment of graduate degree earn the most with the average annual earnings of $95,082, while those with less than high school education have the smallest earnings of $21,598.
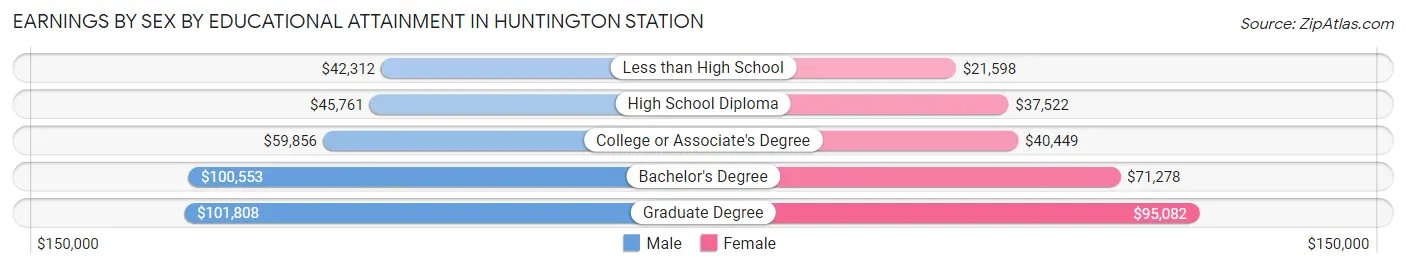
| Educational Attainment | Male Income | Female Income |
| Less than High School | $42,312 | $21,598 |
| High School Diploma | $45,761 | $37,522 |
| College or Associate's Degree | $59,856 | $40,449 |
| Bachelor's Degree | $100,553 | $71,278 |
| Graduate Degree | $101,808 | $95,082 |
| Total | $64,277 | $46,430 |
Family Income in Huntington Station
Family Income Brackets in Huntington Station
According to the Huntington Station family income data, there are 2,130 families falling into the $200,000+ income range, which is the most common income bracket and makes up 26.2% of all families. Conversely, the $10,000 to $14,999 income bracket is the least frequent group with only 41 families (0.5%) belonging to this category.
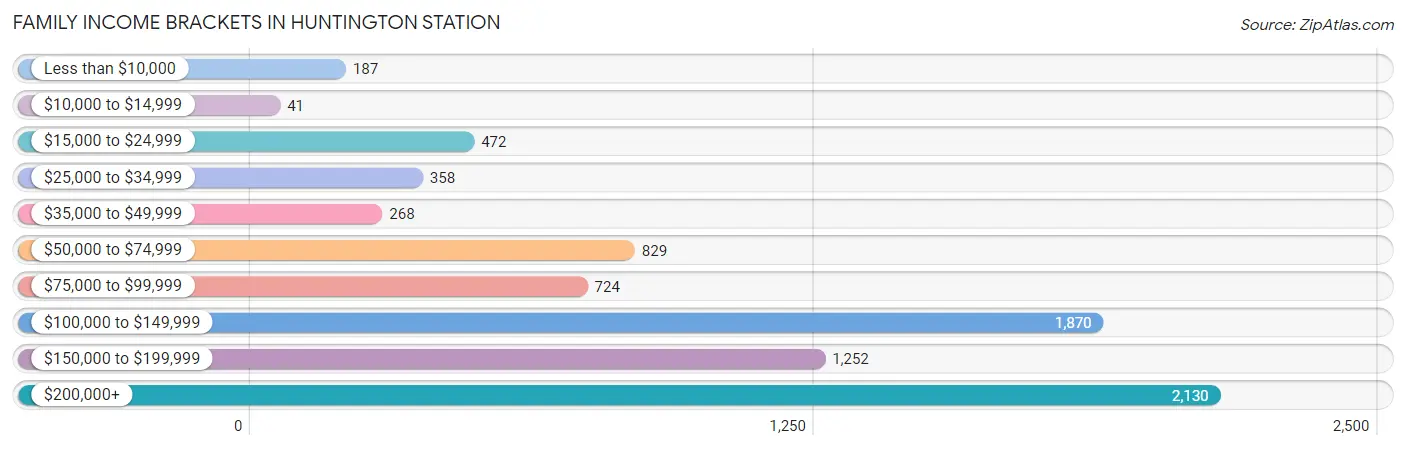
| Income Bracket | # Families | % Families |
| Less than $10,000 | 187 | 2.3% |
| $10,000 to $14,999 | 41 | 0.5% |
| $15,000 to $24,999 | 472 | 5.8% |
| $25,000 to $34,999 | 358 | 4.4% |
| $35,000 to $49,999 | 268 | 3.3% |
| $50,000 to $74,999 | 829 | 10.2% |
| $75,000 to $99,999 | 724 | 8.9% |
| $100,000 to $149,999 | 1,870 | 23.0% |
| $150,000 to $199,999 | 1,252 | 15.4% |
| $200,000+ | 2,130 | 26.2% |
Family Income by Famaliy Size in Huntington Station
6-person families (77 | 0.9%) account for the highest median family income in Huntington Station with $232,321 per family, while 2-person families (2,961 | 36.4%) have the highest median income of $58,452 per family member.
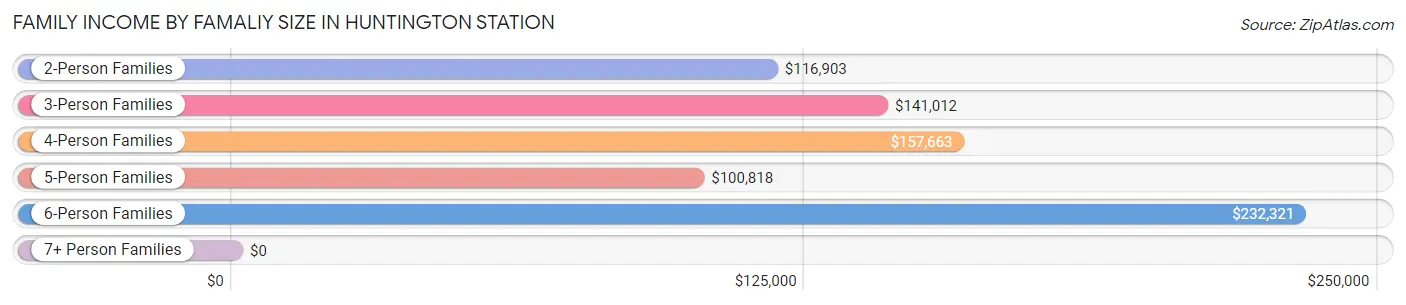
| Income Bracket | # Families | Median Income |
| 2-Person Families | 2,961 (36.4%) | $116,903 |
| 3-Person Families | 2,181 (26.8%) | $141,012 |
| 4-Person Families | 1,536 (18.9%) | $157,663 |
| 5-Person Families | 1,029 (12.7%) | $100,818 |
| 6-Person Families | 77 (0.9%) | $232,321 |
| 7+ Person Families | 346 (4.3%) | $0 |
| Total | 8,130 (100.0%) | $131,291 |
Family Income by Number of Earners in Huntington Station
The median family income in Huntington Station is $131,291, with families comprising 3+ earners (1,622) having the highest median family income of $181,702, while families with no earners (963) have the lowest median family income of $48,036, accounting for 20.0% and 11.8% of families, respectively.
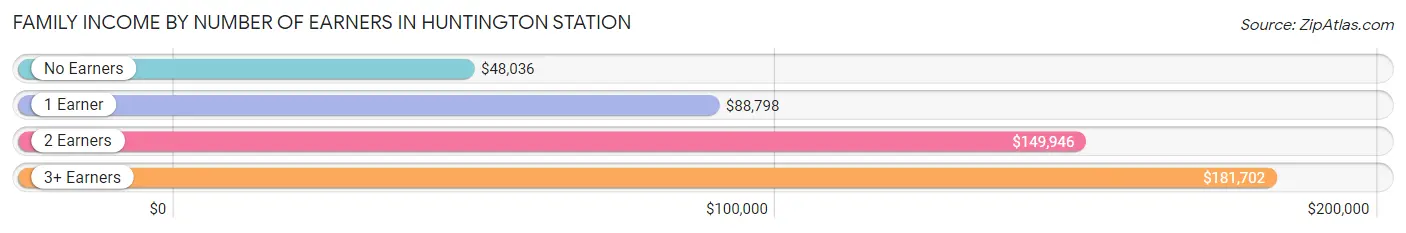
| Number of Earners | # Families | Median Income |
| No Earners | 963 (11.8%) | $48,036 |
| 1 Earner | 1,795 (22.1%) | $88,798 |
| 2 Earners | 3,750 (46.1%) | $149,946 |
| 3+ Earners | 1,622 (20.0%) | $181,702 |
| Total | 8,130 (100.0%) | $131,291 |
Household Income in Huntington Station
Household Income Brackets in Huntington Station
With 2,511 households falling in the category, the $100,000 to $149,999 income range is the most frequent in Huntington Station, accounting for 22.8% of all households. In contrast, only 154 households (1.4%) fall into the $10,000 to $14,999 income bracket, making it the least populous group.
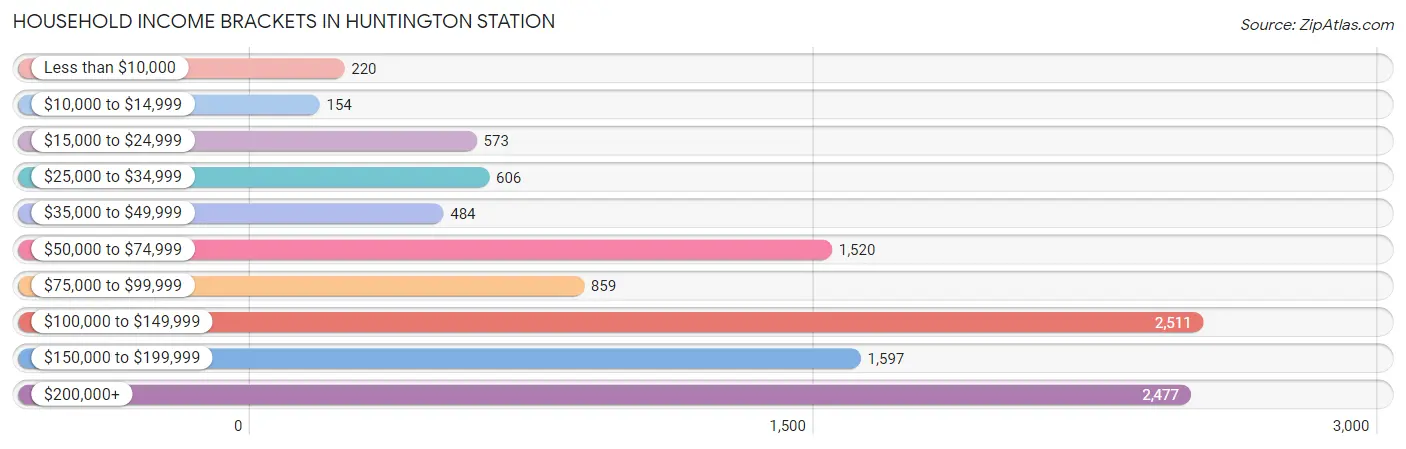
| Income Bracket | # Households | % Households |
| Less than $10,000 | 220 | 2.0% |
| $10,000 to $14,999 | 154 | 1.4% |
| $15,000 to $24,999 | 573 | 5.2% |
| $25,000 to $34,999 | 606 | 5.5% |
| $35,000 to $49,999 | 484 | 4.4% |
| $50,000 to $74,999 | 1,520 | 13.8% |
| $75,000 to $99,999 | 859 | 7.8% |
| $100,000 to $149,999 | 2,511 | 22.8% |
| $150,000 to $199,999 | 1,597 | 14.5% |
| $200,000+ | 2,477 | 22.5% |
Household Income by Householder Age in Huntington Station
The median household income in Huntington Station is $122,226, with the highest median household income of $150,742 found in the 45 to 64 years age bracket for the primary householder. A total of 4,539 households (41.2%) fall into this category. Meanwhile, the 15 to 24 years age bracket for the primary householder has the lowest median household income of $0, with 108 households (1.0%) in this group.
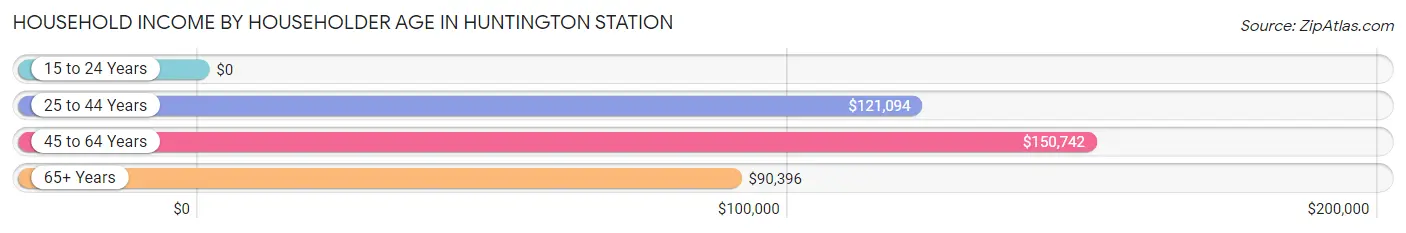
| Income Bracket | # Households | Median Income |
| 15 to 24 Years | 108 (1.0%) | $0 |
| 25 to 44 Years | 3,339 (30.3%) | $121,094 |
| 45 to 64 Years | 4,539 (41.2%) | $150,742 |
| 65+ Years | 3,025 (27.5%) | $90,396 |
| Total | 11,011 (100.0%) | $122,226 |
Poverty in Huntington Station
Income Below Poverty by Sex and Age in Huntington Station
With 10.3% poverty level for males and 12.3% for females among the residents of Huntington Station, 16 and 17 year old males and under 5 year old females are the most vulnerable to poverty, with 140 males (34.0%) and 287 females (26.6%) in their respective age groups living below the poverty level.
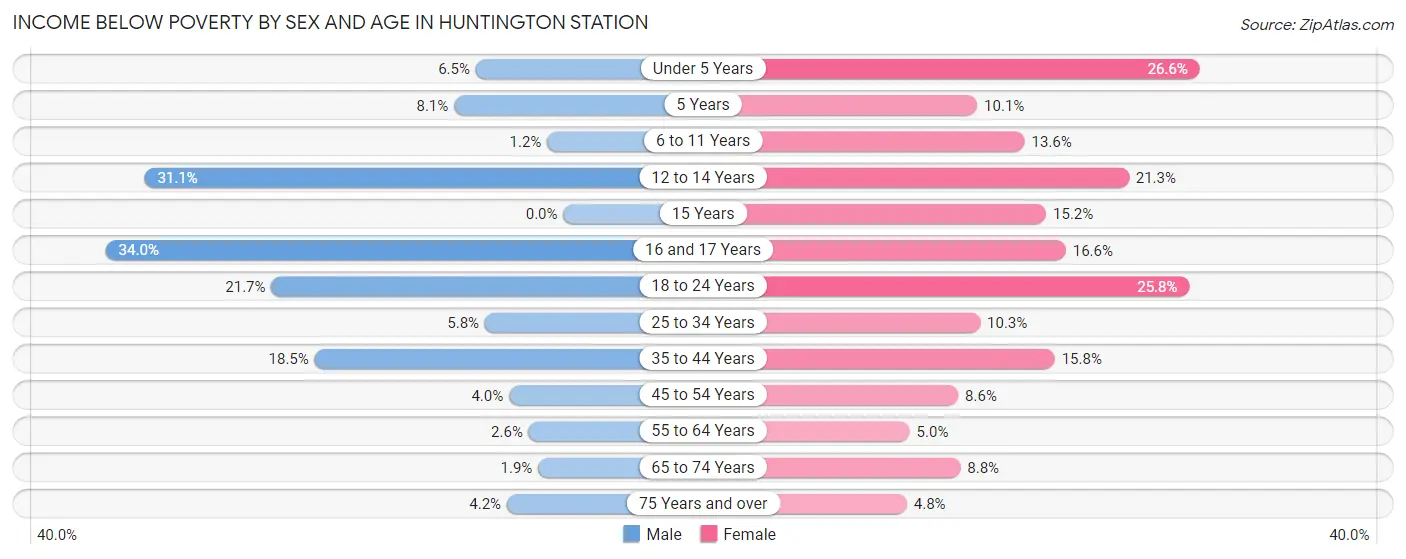
| Age Bracket | Male | Female |
| Under 5 Years | 41 (6.5%) | 287 (26.6%) |
| 5 Years | 15 (8.1%) | 20 (10.1%) |
| 6 to 11 Years | 12 (1.2%) | 150 (13.6%) |
| 12 to 14 Years | 288 (31.1%) | 130 (21.3%) |
| 15 Years | 0 (0.0%) | 32 (15.2%) |
| 16 and 17 Years | 140 (34.0%) | 82 (16.6%) |
| 18 to 24 Years | 410 (21.7%) | 290 (25.8%) |
| 25 to 34 Years | 136 (5.8%) | 227 (10.3%) |
| 35 to 44 Years | 508 (18.5%) | 348 (15.8%) |
| 45 to 54 Years | 98 (4.0%) | 178 (8.6%) |
| 55 to 64 Years | 62 (2.6%) | 143 (5.0%) |
| 65 to 74 Years | 22 (1.9%) | 148 (8.8%) |
| 75 Years and over | 44 (4.2%) | 61 (4.8%) |
| Total | 1,776 (10.3%) | 2,096 (12.3%) |
Income Above Poverty by Sex and Age in Huntington Station
According to the poverty statistics in Huntington Station, males aged 15 years and females aged 75 years and over are the age groups that are most secure financially, with 100.0% of males and 95.2% of females in these age groups living above the poverty line.
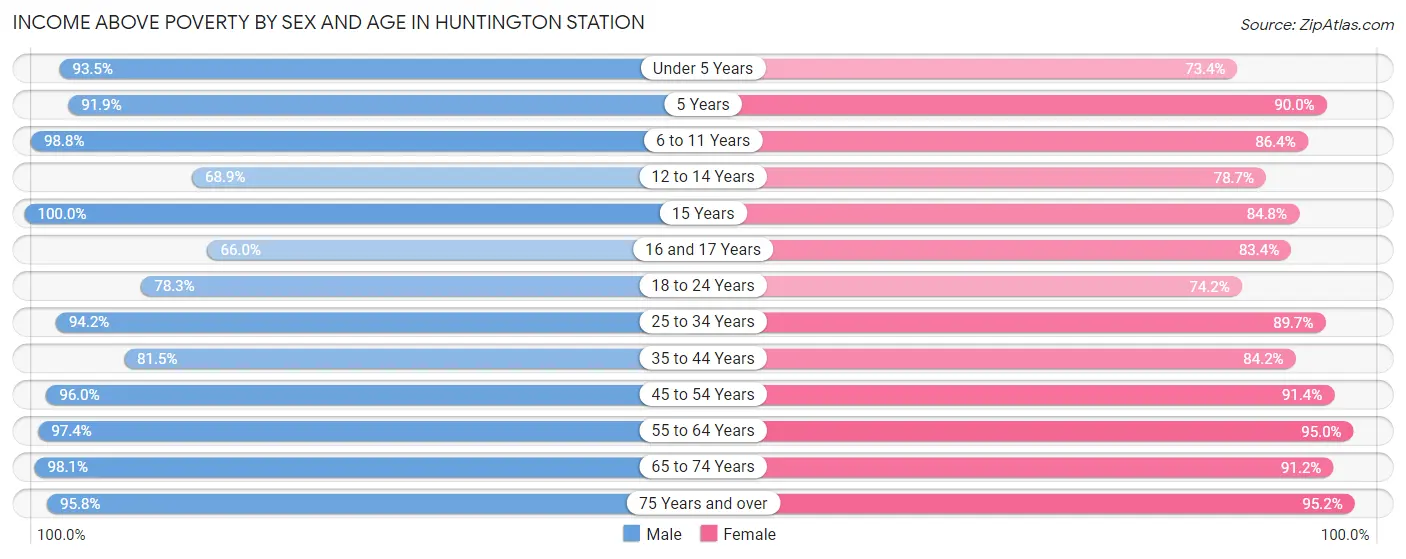
| Age Bracket | Male | Female |
| Under 5 Years | 590 (93.5%) | 793 (73.4%) |
| 5 Years | 170 (91.9%) | 179 (89.9%) |
| 6 to 11 Years | 991 (98.8%) | 955 (86.4%) |
| 12 to 14 Years | 638 (68.9%) | 480 (78.7%) |
| 15 Years | 58 (100.0%) | 179 (84.8%) |
| 16 and 17 Years | 272 (66.0%) | 411 (83.4%) |
| 18 to 24 Years | 1,481 (78.3%) | 834 (74.2%) |
| 25 to 34 Years | 2,199 (94.2%) | 1,984 (89.7%) |
| 35 to 44 Years | 2,243 (81.5%) | 1,853 (84.2%) |
| 45 to 54 Years | 2,334 (96.0%) | 1,883 (91.4%) |
| 55 to 64 Years | 2,353 (97.4%) | 2,692 (95.0%) |
| 65 to 74 Years | 1,152 (98.1%) | 1,533 (91.2%) |
| 75 Years and over | 1,005 (95.8%) | 1,203 (95.2%) |
| Total | 15,486 (89.7%) | 14,979 (87.7%) |
Income Below Poverty Among Married-Couple Families in Huntington Station
The poverty statistics for married-couple families in Huntington Station show that 6.6% or 405 of the total 6,141 families live below the poverty line. Families with 1 or 2 children have the highest poverty rate of 15.5%, comprising of 332 families. On the other hand, families with 5 or more children have the lowest poverty rate of 0.0%, which includes 0 families.
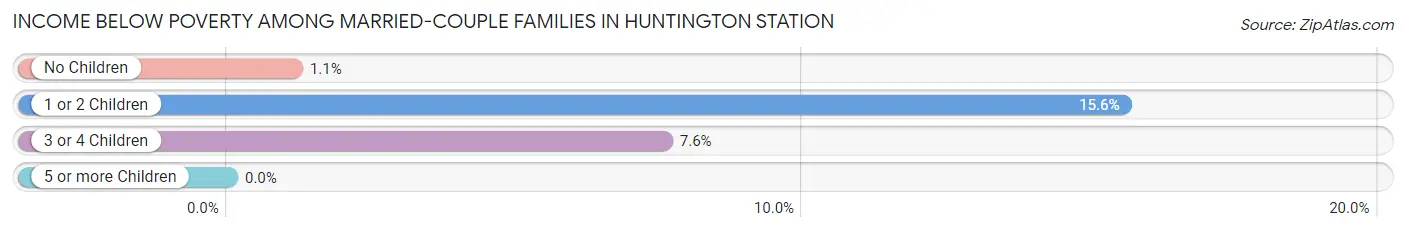
| Children | Above Poverty | Below Poverty |
| No Children | 3,507 (98.9%) | 40 (1.1%) |
| 1 or 2 Children | 1,803 (84.5%) | 332 (15.5%) |
| 3 or 4 Children | 403 (92.4%) | 33 (7.6%) |
| 5 or more Children | 23 (100.0%) | 0 (0.0%) |
| Total | 5,736 (93.4%) | 405 (6.6%) |
Income Below Poverty Among Single-Parent Households in Huntington Station
According to the poverty data in Huntington Station, 5.7% or 34 single-father households and 16.1% or 225 single-mother households are living below the poverty line. Among single-father households, those with 1 or 2 children have the highest poverty rate, with 21 households (11.4%) experiencing poverty. Likewise, among single-mother households, those with 3 or 4 children have the highest poverty rate, with 53 households (36.3%) falling below the poverty line.
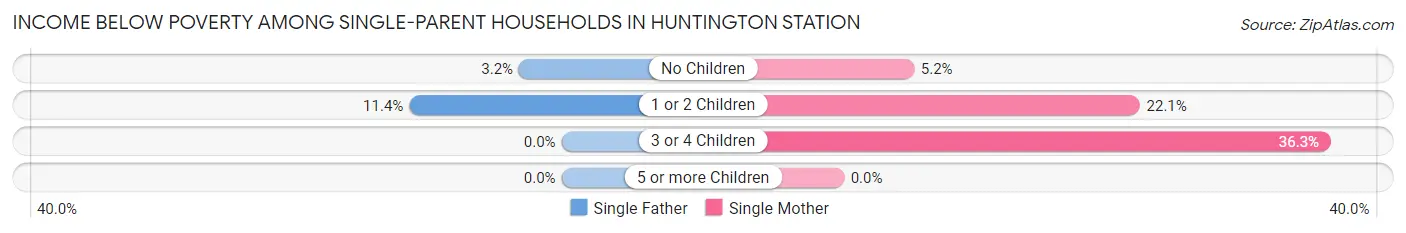
| Children | Single Father | Single Mother |
| No Children | 13 (3.2%) | 32 (5.2%) |
| 1 or 2 Children | 21 (11.4%) | 140 (22.1%) |
| 3 or 4 Children | 0 (0.0%) | 53 (36.3%) |
| 5 or more Children | 0 (0.0%) | 0 (0.0%) |
| Total | 34 (5.7%) | 225 (16.1%) |
Income Below Poverty Among Married-Couple vs Single-Parent Households in Huntington Station
The poverty data for Huntington Station shows that 405 of the married-couple family households (6.6%) and 259 of the single-parent households (13.0%) are living below the poverty level. Within the married-couple family households, those with 1 or 2 children have the highest poverty rate, with 332 households (15.5%) falling below the poverty line. Among the single-parent households, those with 3 or 4 children have the highest poverty rate, with 53 household (36.3%) living below poverty.
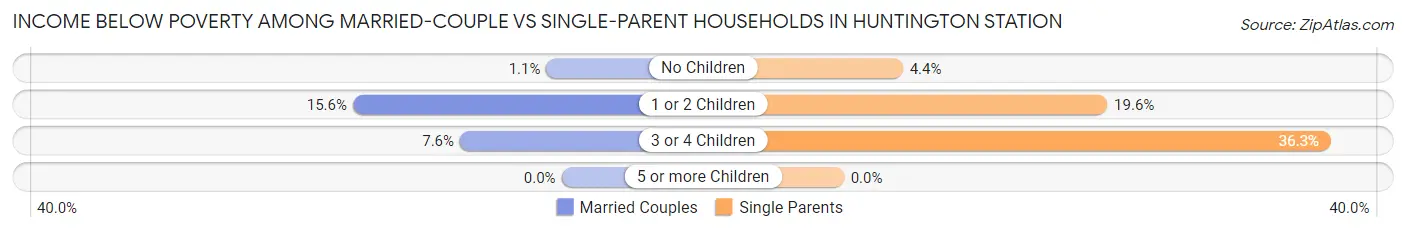
| Children | Married-Couple Families | Single-Parent Households |
| No Children | 40 (1.1%) | 45 (4.4%) |
| 1 or 2 Children | 332 (15.5%) | 161 (19.6%) |
| 3 or 4 Children | 33 (7.6%) | 53 (36.3%) |
| 5 or more Children | 0 (0.0%) | 0 (0.0%) |
| Total | 405 (6.6%) | 259 (13.0%) |
Employment Characteristics in Huntington Station
Employment by Class of Employer in Huntington Station
Among the 18,136 employed individuals in Huntington Station, private company employees (11,641 | 64.2%), not-for-profit organizations (1,939 | 10.7%), and local government employees (1,670 | 9.2%) make up the most common classes of employment.
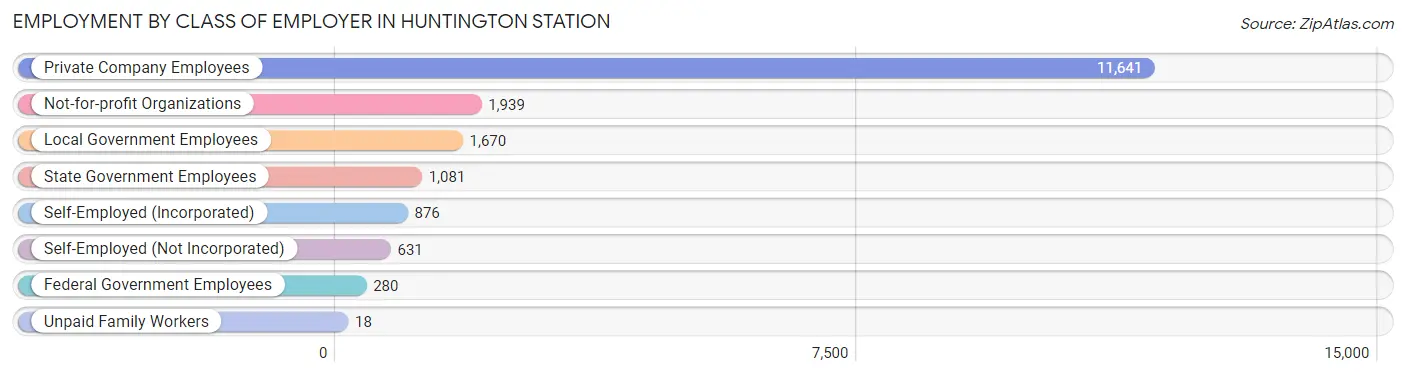
| Employer Class | # Employees | % Employees |
| Private Company Employees | 11,641 | 64.2% |
| Self-Employed (Incorporated) | 876 | 4.8% |
| Self-Employed (Not Incorporated) | 631 | 3.5% |
| Not-for-profit Organizations | 1,939 | 10.7% |
| Local Government Employees | 1,670 | 9.2% |
| State Government Employees | 1,081 | 6.0% |
| Federal Government Employees | 280 | 1.5% |
| Unpaid Family Workers | 18 | 0.1% |
| Total | 18,136 | 100.0% |
Employment Status by Age in Huntington Station
According to the labor force statistics for Huntington Station, out of the total population over 16 years of age (28,329), 68.9% or 19,519 individuals are in the labor force, with 5.7% or 1,113 of them unemployed. The age group with the highest labor force participation rate is 25 to 29 years, with 87.7% or 2,178 individuals in the labor force. Within the labor force, the 16 to 19 years age range has the highest percentage of unemployed individuals, with 17.4% or 132 of them being unemployed.
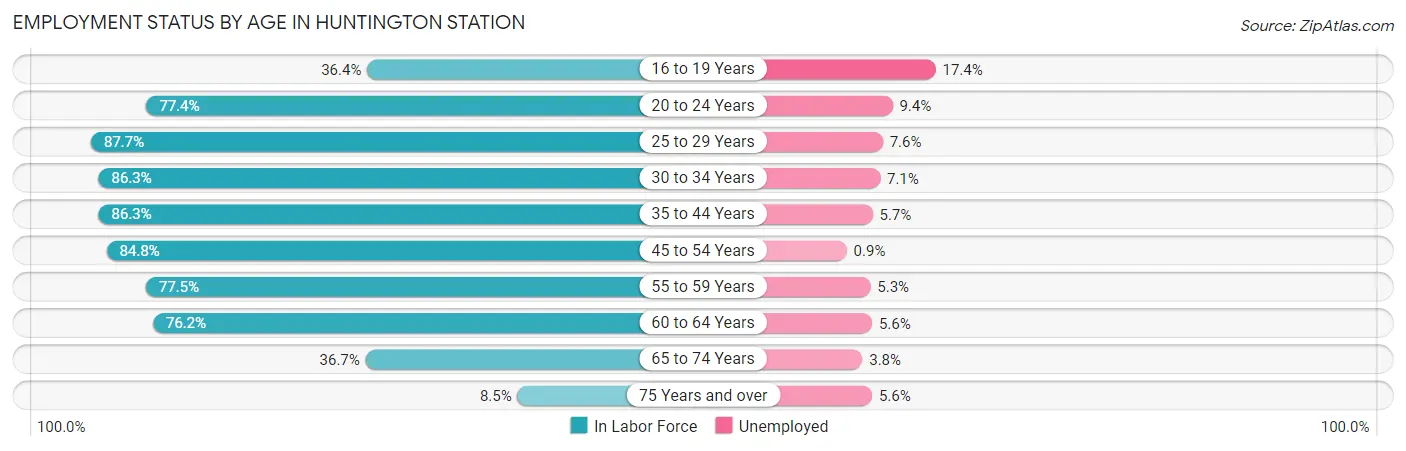
| Age Bracket | In Labor Force | Unemployed |
| 16 to 19 Years | 759 (36.4%) | 132 (17.4%) |
| 20 to 24 Years | 1,421 (77.4%) | 134 (9.4%) |
| 25 to 29 Years | 2,178 (87.7%) | 166 (7.6%) |
| 30 to 34 Years | 1,780 (86.3%) | 126 (7.1%) |
| 35 to 44 Years | 4,274 (86.3%) | 244 (5.7%) |
| 45 to 54 Years | 3,810 (84.8%) | 34 (0.9%) |
| 55 to 59 Years | 2,422 (77.5%) | 128 (5.3%) |
| 60 to 64 Years | 1,619 (76.2%) | 91 (5.6%) |
| 65 to 74 Years | 1,048 (36.7%) | 40 (3.8%) |
| 75 Years and over | 197 (8.5%) | 11 (5.6%) |
| Total | 19,519 (68.9%) | 1,113 (5.7%) |
Employment Status by Educational Attainment in Huntington Station
According to labor force statistics for Huntington Station, 83.6% of individuals (16,085) out of the total population between 25 and 64 years of age (19,241) are in the labor force, with 4.9% or 788 of them being unemployed. The group with the highest labor force participation rate are those with the educational attainment of bachelor's degree or higher, with 90.6% or 6,998 individuals in the labor force. Within the labor force, individuals with less than high school education have the highest percentage of unemployment, with 13.5% or 316 of them being unemployed.
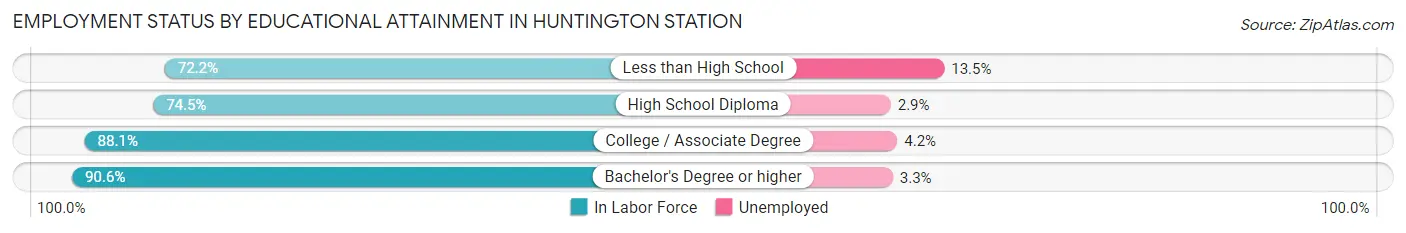
| Educational Attainment | In Labor Force | Unemployed |
| Less than High School | 2,341 (72.2%) | 438 (13.5%) |
| High School Diploma | 3,030 (74.5%) | 118 (2.9%) |
| College / Associate Degree | 3,707 (88.1%) | 177 (4.2%) |
| Bachelor's Degree or higher | 6,998 (90.6%) | 255 (3.3%) |
| Total | 16,085 (83.6%) | 943 (4.9%) |
Employment Occupations by Sex in Huntington Station
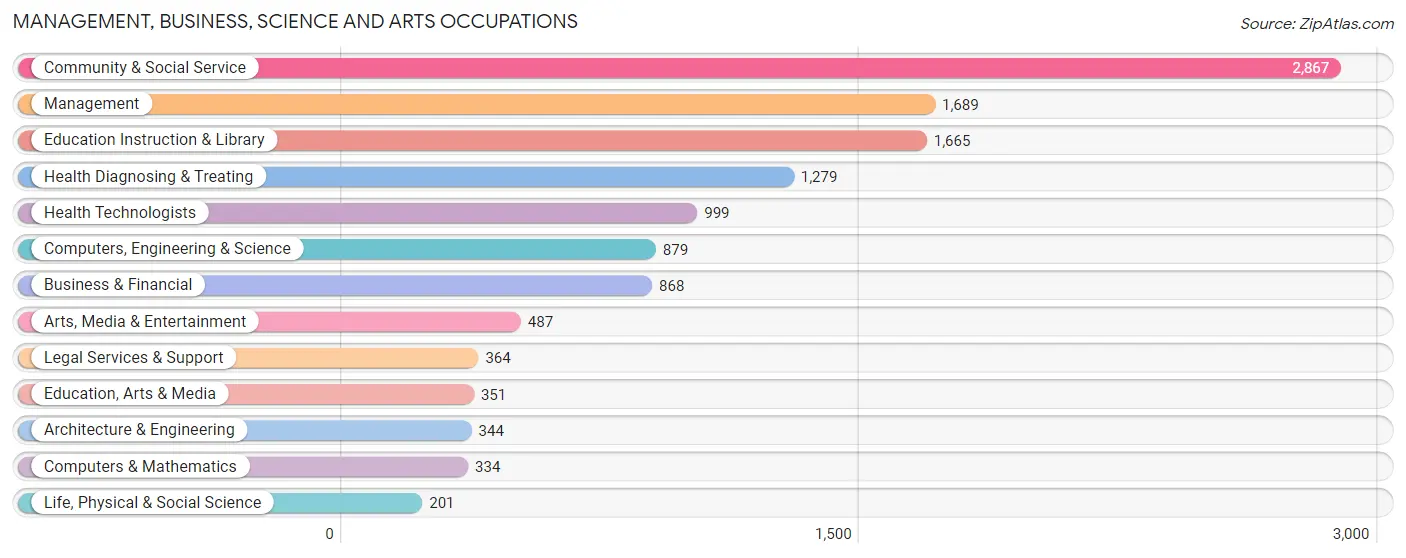
Management, Business, Science and Arts Occupations
The most common Management, Business, Science and Arts occupations in Huntington Station are Community & Social Service (2,867 | 15.6%), Management (1,689 | 9.2%), Education Instruction & Library (1,665 | 9.0%), Health Diagnosing & Treating (1,279 | 7.0%), and Health Technologists (999 | 5.4%).
Management, Business, Science and Arts Occupations by Sex
Within the Management, Business, Science and Arts occupations in Huntington Station, the most male-oriented occupations are Architecture & Engineering (96.5%), Computers, Engineering & Science (72.4%), and Computers & Mathematics (71.6%), while the most female-oriented occupations are Education Instruction & Library (73.2%), Life, Physical & Social Science (67.7%), and Health Technologists (65.1%).
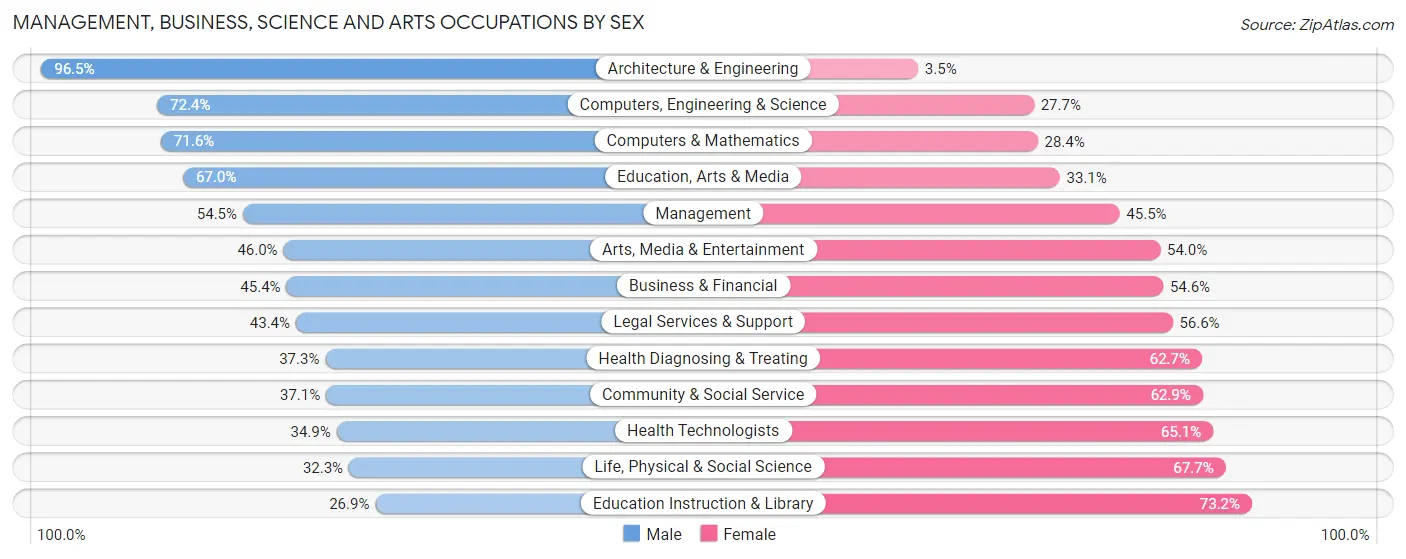
| Occupation | Male | Female |
| Management | 920 (54.5%) | 769 (45.5%) |
| Business & Financial | 394 (45.4%) | 474 (54.6%) |
| Computers, Engineering & Science | 636 (72.4%) | 243 (27.7%) |
| Computers & Mathematics | 239 (71.6%) | 95 (28.4%) |
| Architecture & Engineering | 332 (96.5%) | 12 (3.5%) |
| Life, Physical & Social Science | 65 (32.3%) | 136 (67.7%) |
| Community & Social Service | 1,064 (37.1%) | 1,803 (62.9%) |
| Education, Arts & Media | 235 (66.9%) | 116 (33.1%) |
| Legal Services & Support | 158 (43.4%) | 206 (56.6%) |
| Education Instruction & Library | 447 (26.9%) | 1,218 (73.2%) |
| Arts, Media & Entertainment | 224 (46.0%) | 263 (54.0%) |
| Health Diagnosing & Treating | 477 (37.3%) | 802 (62.7%) |
| Health Technologists | 349 (34.9%) | 650 (65.1%) |
| Total (Category) | 3,491 (46.0%) | 4,091 (54.0%) |
| Total (Overall) | 9,964 (54.1%) | 8,436 (45.9%) |
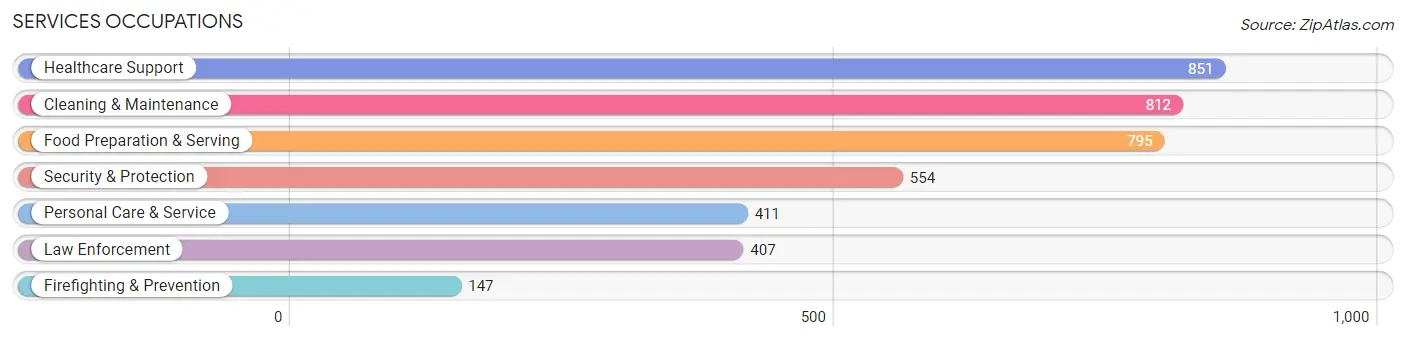
Services Occupations
The most common Services occupations in Huntington Station are Healthcare Support (851 | 4.6%), Cleaning & Maintenance (812 | 4.4%), Food Preparation & Serving (795 | 4.3%), Security & Protection (554 | 3.0%), and Personal Care & Service (411 | 2.2%).
Services Occupations by Sex
Within the Services occupations in Huntington Station, the most male-oriented occupations are Firefighting & Prevention (83.0%), Security & Protection (82.1%), and Law Enforcement (81.8%), while the most female-oriented occupations are Personal Care & Service (79.1%), Healthcare Support (73.4%), and Food Preparation & Serving (36.9%).
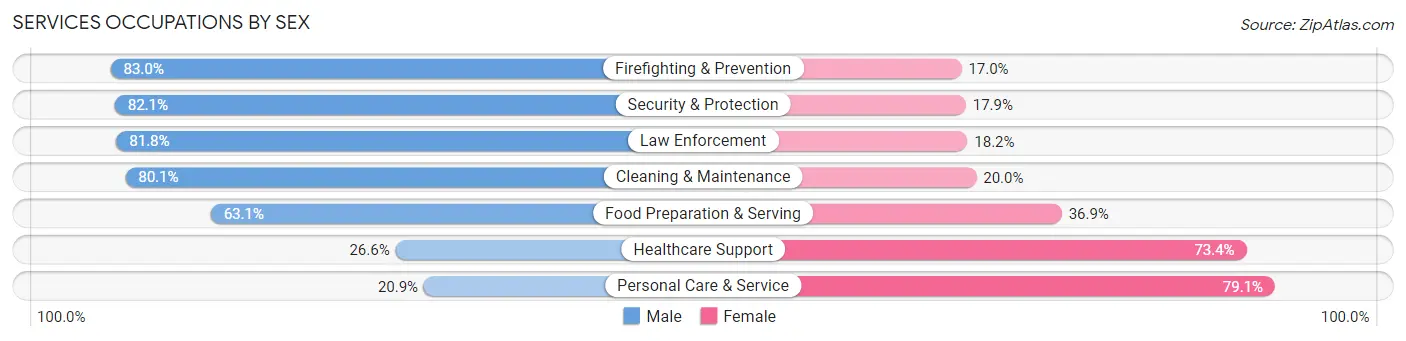
| Occupation | Male | Female |
| Healthcare Support | 226 (26.6%) | 625 (73.4%) |
| Security & Protection | 455 (82.1%) | 99 (17.9%) |
| Firefighting & Prevention | 122 (83.0%) | 25 (17.0%) |
| Law Enforcement | 333 (81.8%) | 74 (18.2%) |
| Food Preparation & Serving | 502 (63.1%) | 293 (36.9%) |
| Cleaning & Maintenance | 650 (80.0%) | 162 (20.0%) |
| Personal Care & Service | 86 (20.9%) | 325 (79.1%) |
| Total (Category) | 1,919 (56.1%) | 1,504 (43.9%) |
| Total (Overall) | 9,964 (54.1%) | 8,436 (45.9%) |
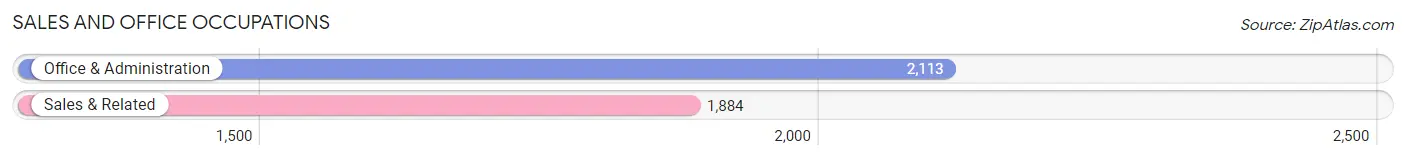
Sales and Office Occupations
The most common Sales and Office occupations in Huntington Station are Office & Administration (2,113 | 11.5%), and Sales & Related (1,884 | 10.2%).
Sales and Office Occupations by Sex
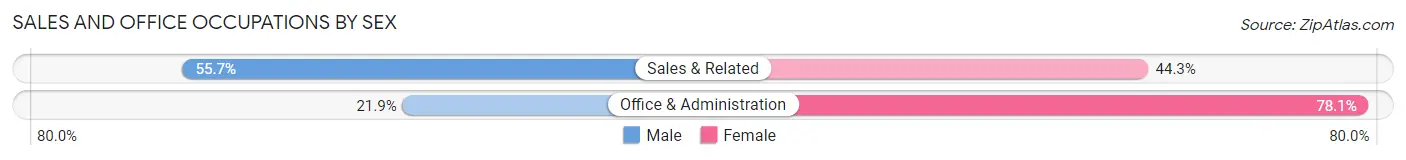
| Occupation | Male | Female |
| Sales & Related | 1,049 (55.7%) | 835 (44.3%) |
| Office & Administration | 462 (21.9%) | 1,651 (78.1%) |
| Total (Category) | 1,511 (37.8%) | 2,486 (62.2%) |
| Total (Overall) | 9,964 (54.1%) | 8,436 (45.9%) |
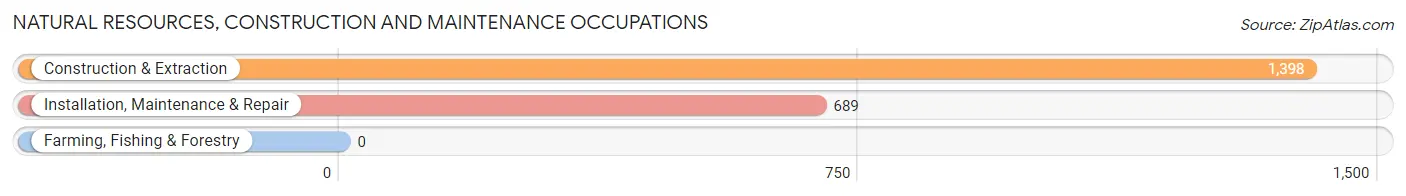
Natural Resources, Construction and Maintenance Occupations
The most common Natural Resources, Construction and Maintenance occupations in Huntington Station are Construction & Extraction (1,398 | 7.6%), and Installation, Maintenance & Repair (689 | 3.7%).
Natural Resources, Construction and Maintenance Occupations by Sex
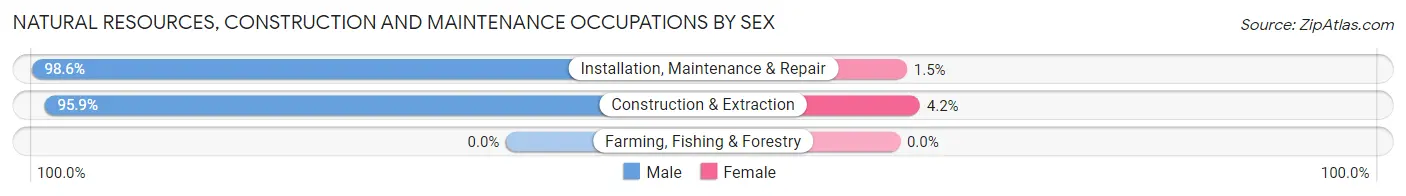
| Occupation | Male | Female |
| Farming, Fishing & Forestry | 0 (0.0%) | 0 (0.0%) |
| Construction & Extraction | 1,340 (95.9%) | 58 (4.2%) |
| Installation, Maintenance & Repair | 679 (98.6%) | 10 (1.5%) |
| Total (Category) | 2,019 (96.7%) | 68 (3.3%) |
| Total (Overall) | 9,964 (54.1%) | 8,436 (45.9%) |
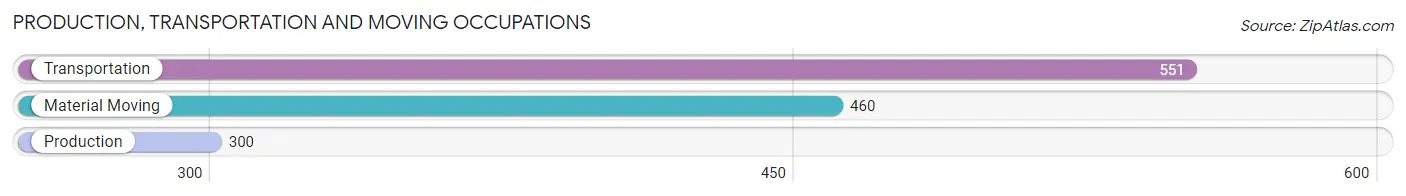
Production, Transportation and Moving Occupations
The most common Production, Transportation and Moving occupations in Huntington Station are Transportation (551 | 3.0%), Material Moving (460 | 2.5%), and Production (300 | 1.6%).
Production, Transportation and Moving Occupations by Sex
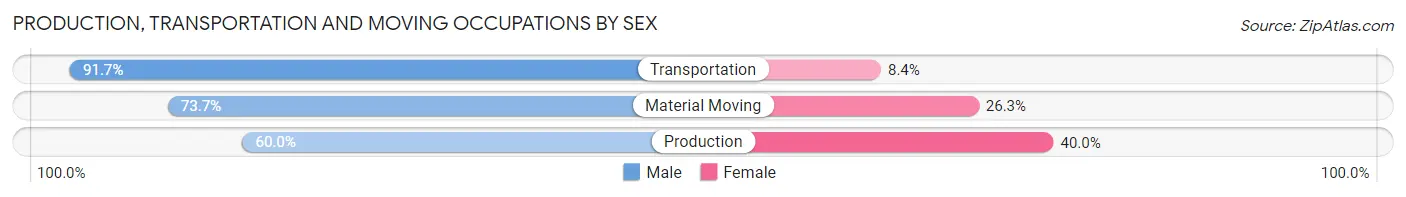
| Occupation | Male | Female |
| Production | 180 (60.0%) | 120 (40.0%) |
| Transportation | 505 (91.6%) | 46 (8.4%) |
| Material Moving | 339 (73.7%) | 121 (26.3%) |
| Total (Category) | 1,024 (78.1%) | 287 (21.9%) |
| Total (Overall) | 9,964 (54.1%) | 8,436 (45.9%) |
Employment Industries by Sex in Huntington Station
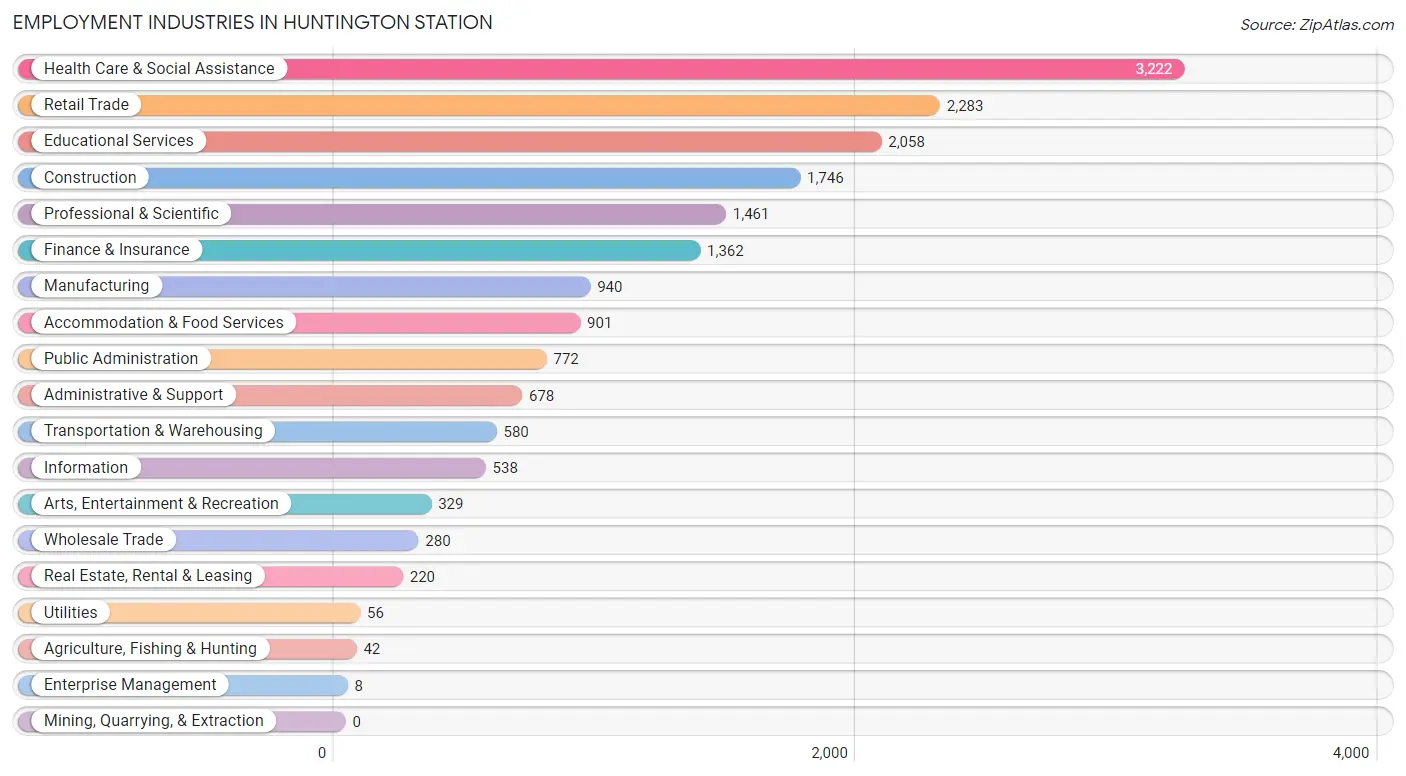
Employment Industries in Huntington Station
The major employment industries in Huntington Station include Health Care & Social Assistance (3,222 | 17.5%), Retail Trade (2,283 | 12.4%), Educational Services (2,058 | 11.2%), Construction (1,746 | 9.5%), and Professional & Scientific (1,461 | 7.9%).
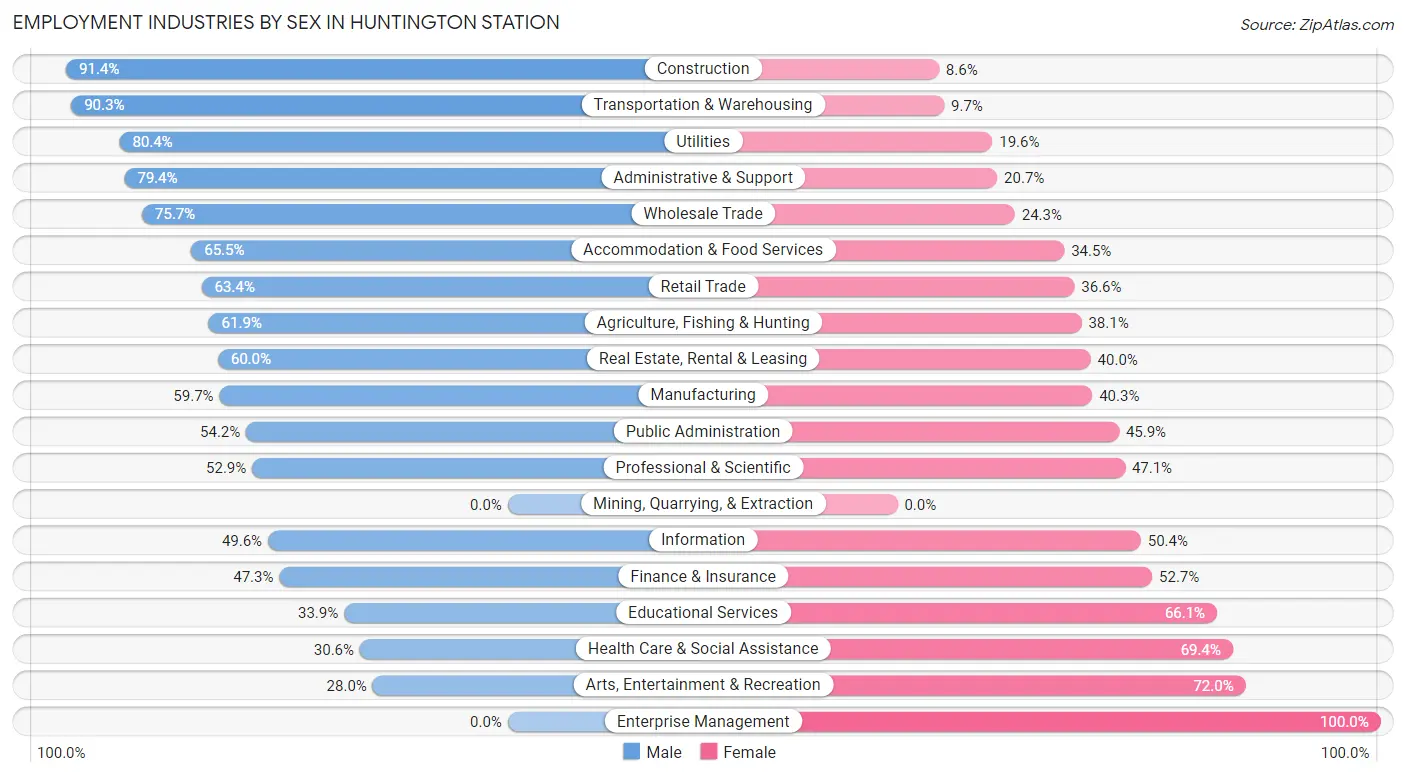
Employment Industries by Sex in Huntington Station
The Huntington Station industries that see more men than women are Construction (91.4%), Transportation & Warehousing (90.3%), and Utilities (80.4%), whereas the industries that tend to have a higher number of women are Enterprise Management (100.0%), Arts, Entertainment & Recreation (72.0%), and Health Care & Social Assistance (69.4%).
| Industry | Male | Female |
| Agriculture, Fishing & Hunting | 26 (61.9%) | 16 (38.1%) |
| Mining, Quarrying, & Extraction | 0 (0.0%) | 0 (0.0%) |
| Construction | 1,596 (91.4%) | 150 (8.6%) |
| Manufacturing | 561 (59.7%) | 379 (40.3%) |
| Wholesale Trade | 212 (75.7%) | 68 (24.3%) |
| Retail Trade | 1,447 (63.4%) | 836 (36.6%) |
| Transportation & Warehousing | 524 (90.3%) | 56 (9.7%) |
| Utilities | 45 (80.4%) | 11 (19.6%) |
| Information | 267 (49.6%) | 271 (50.4%) |
| Finance & Insurance | 644 (47.3%) | 718 (52.7%) |
| Real Estate, Rental & Leasing | 132 (60.0%) | 88 (40.0%) |
| Professional & Scientific | 773 (52.9%) | 688 (47.1%) |
| Enterprise Management | 0 (0.0%) | 8 (100.0%) |
| Administrative & Support | 538 (79.3%) | 140 (20.6%) |
| Educational Services | 697 (33.9%) | 1,361 (66.1%) |
| Health Care & Social Assistance | 986 (30.6%) | 2,236 (69.4%) |
| Arts, Entertainment & Recreation | 92 (28.0%) | 237 (72.0%) |
| Accommodation & Food Services | 590 (65.5%) | 311 (34.5%) |
| Public Administration | 418 (54.1%) | 354 (45.9%) |
| Total | 9,964 (54.1%) | 8,436 (45.9%) |
Education in Huntington Station
School Enrollment in Huntington Station
The most common levels of schooling among the 8,736 students in Huntington Station are high school (2,148 | 24.6%), college / undergraduate (1,847 | 21.1%), and middle school (1,731 | 19.8%).
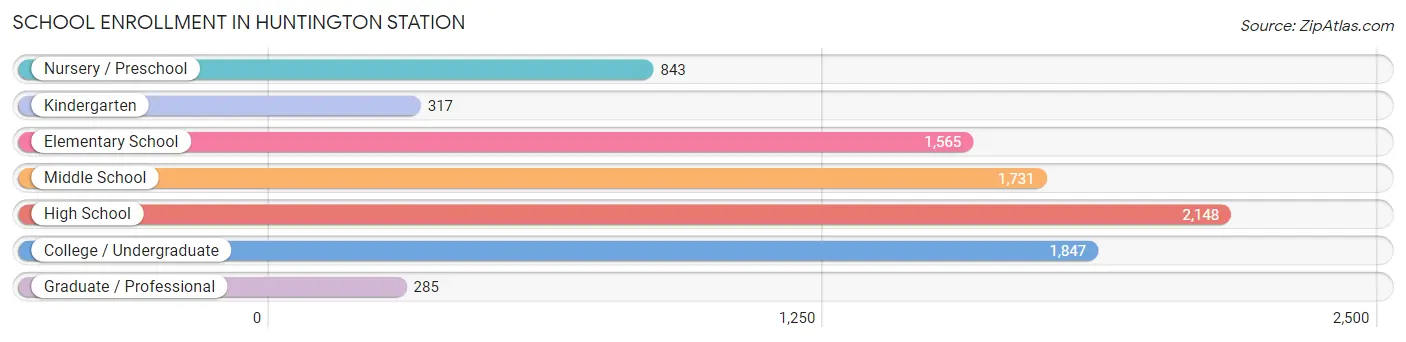
| School Level | # Students | % Students |
| Nursery / Preschool | 843 | 9.7% |
| Kindergarten | 317 | 3.6% |
| Elementary School | 1,565 | 17.9% |
| Middle School | 1,731 | 19.8% |
| High School | 2,148 | 24.6% |
| College / Undergraduate | 1,847 | 21.1% |
| Graduate / Professional | 285 | 3.3% |
| Total | 8,736 | 100.0% |
School Enrollment by Age by Funding Source in Huntington Station
Out of a total of 8,736 students who are enrolled in schools in Huntington Station, 1,354 (15.5%) attend a private institution, while the remaining 7,382 (84.5%) are enrolled in public schools. The age group of 35 years and over has the highest likelihood of being enrolled in private schools, with 205 (56.8% in the age bracket) enrolled. Conversely, the age group of 18 to 19 year olds has the lowest likelihood of being enrolled in a private school, with 1,021 (97.8% in the age bracket) attending a public institution.
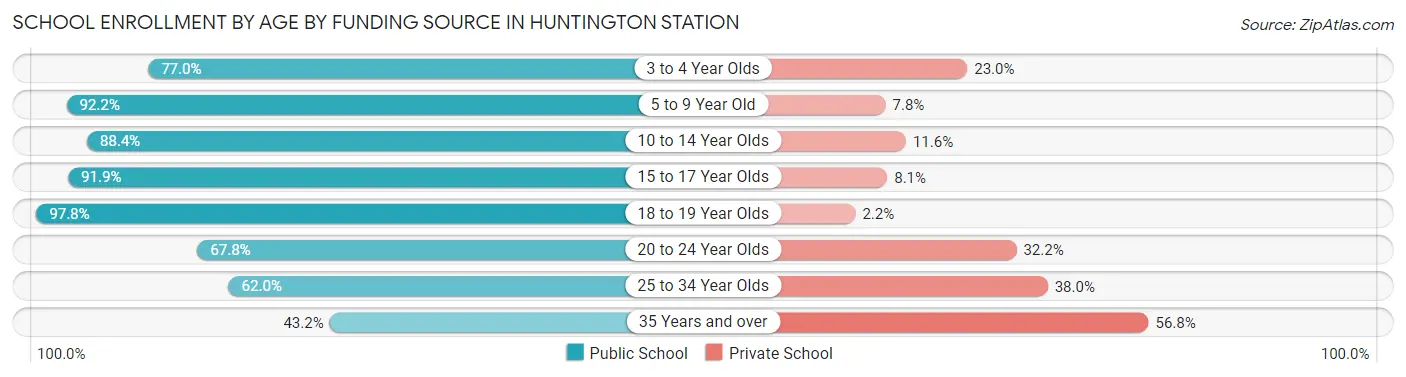
| Age Bracket | Public School | Private School |
| 3 to 4 Year Olds | 585 (77.0%) | 175 (23.0%) |
| 5 to 9 Year Old | 1,748 (92.2%) | 148 (7.8%) |
| 10 to 14 Year Olds | 1,979 (88.4%) | 260 (11.6%) |
| 15 to 17 Year Olds | 1,041 (91.9%) | 92 (8.1%) |
| 18 to 19 Year Olds | 1,021 (97.8%) | 23 (2.2%) |
| 20 to 24 Year Olds | 516 (67.8%) | 245 (32.2%) |
| 25 to 34 Year Olds | 336 (62.0%) | 206 (38.0%) |
| 35 Years and over | 156 (43.2%) | 205 (56.8%) |
| Total | 7,382 (84.5%) | 1,354 (15.5%) |
Educational Attainment by Field of Study in Huntington Station
Business (2,080 | 20.5%), science & technology (1,302 | 12.8%), education (1,136 | 11.2%), social sciences (794 | 7.8%), and arts & humanities (749 | 7.4%) are the most common fields of study among 10,139 individuals in Huntington Station who have obtained a bachelor's degree or higher.
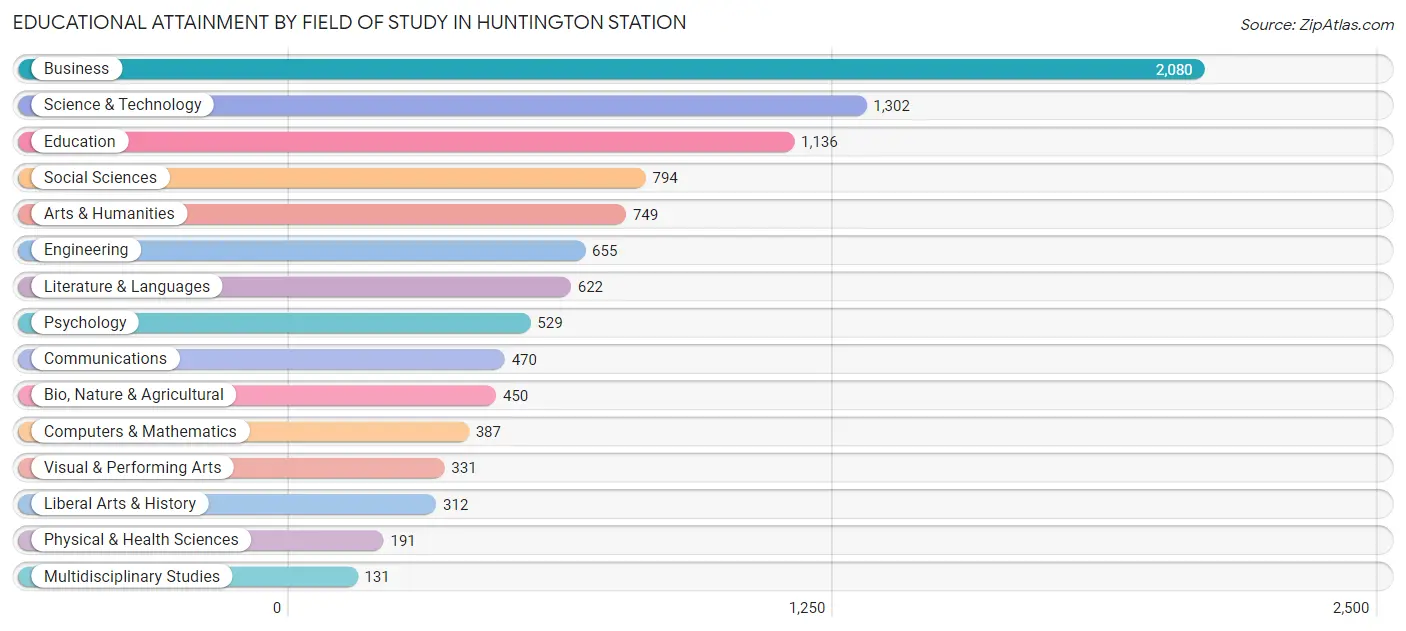
| Field of Study | # Graduates | % Graduates |
| Computers & Mathematics | 387 | 3.8% |
| Bio, Nature & Agricultural | 450 | 4.4% |
| Physical & Health Sciences | 191 | 1.9% |
| Psychology | 529 | 5.2% |
| Social Sciences | 794 | 7.8% |
| Engineering | 655 | 6.5% |
| Multidisciplinary Studies | 131 | 1.3% |
| Science & Technology | 1,302 | 12.8% |
| Business | 2,080 | 20.5% |
| Education | 1,136 | 11.2% |
| Literature & Languages | 622 | 6.1% |
| Liberal Arts & History | 312 | 3.1% |
| Visual & Performing Arts | 331 | 3.3% |
| Communications | 470 | 4.6% |
| Arts & Humanities | 749 | 7.4% |
| Total | 10,139 | 100.0% |
Transportation & Commute in Huntington Station
Vehicle Availability by Sex in Huntington Station
The most prevalent vehicle ownership categories in Huntington Station are males with 2 vehicles (3,633, accounting for 37.0%) and females with 2 vehicles (2,716, making up 43.9%).
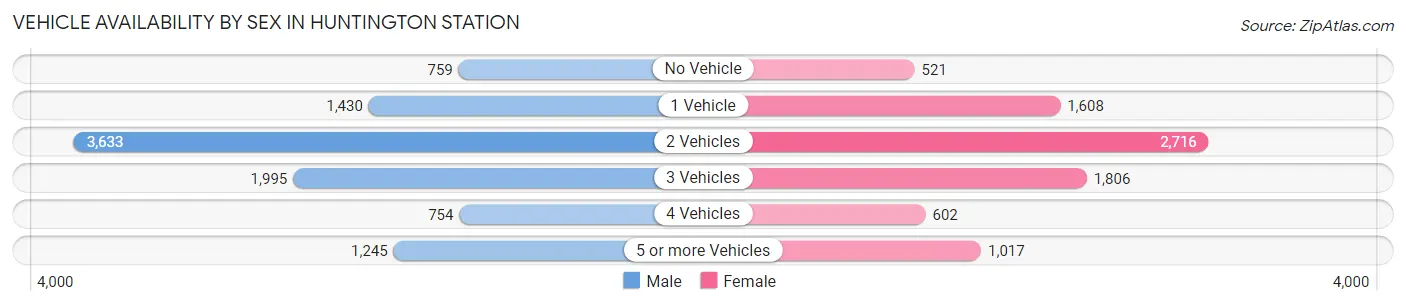
| Vehicles Available | Male | Female |
| No Vehicle | 759 (7.7%) | 521 (6.3%) |
| 1 Vehicle | 1,430 (14.6%) | 1,608 (19.4%) |
| 2 Vehicles | 3,633 (37.0%) | 2,716 (32.8%) |
| 3 Vehicles | 1,995 (20.3%) | 1,806 (21.8%) |
| 4 Vehicles | 754 (7.7%) | 602 (7.3%) |
| 5 or more Vehicles | 1,245 (12.7%) | 1,017 (12.3%) |
| Total | 9,816 (100.0%) | 8,270 (100.0%) |
Commute Time in Huntington Station
The most frequently occuring commute durations in Huntington Station are 30 to 34 minutes (1,967 commuters, 12.0%), 15 to 19 minutes (1,918 commuters, 11.7%), and 45 to 59 minutes (1,725 commuters, 10.5%).
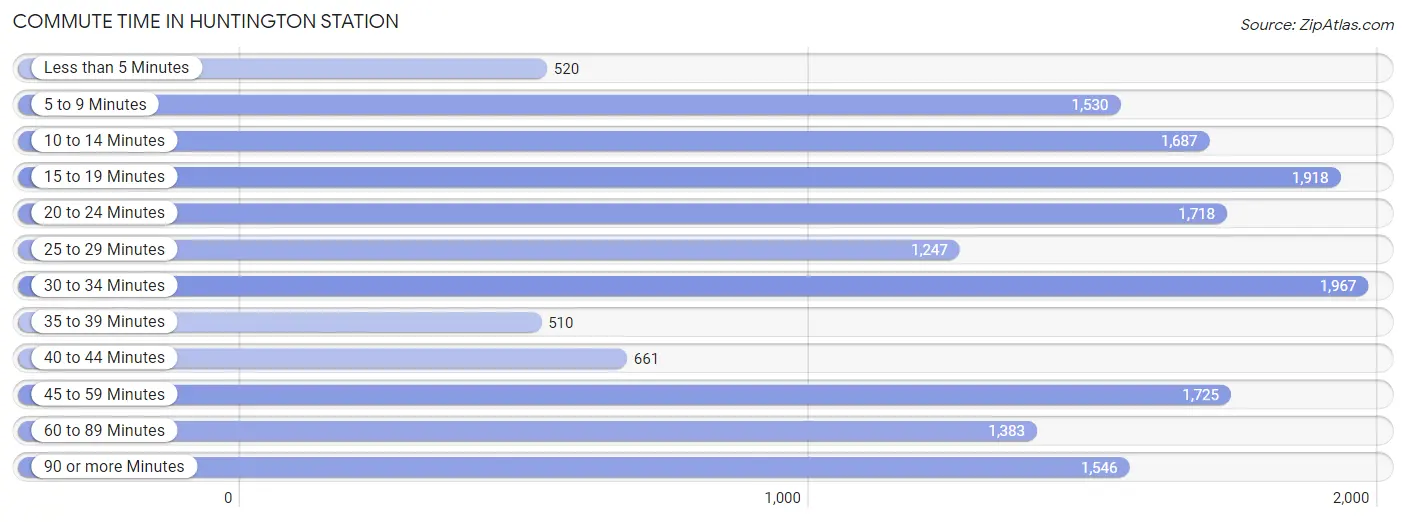
| Commute Time | # Commuters | % Commuters |
| Less than 5 Minutes | 520 | 3.2% |
| 5 to 9 Minutes | 1,530 | 9.3% |
| 10 to 14 Minutes | 1,687 | 10.3% |
| 15 to 19 Minutes | 1,918 | 11.7% |
| 20 to 24 Minutes | 1,718 | 10.5% |
| 25 to 29 Minutes | 1,247 | 7.6% |
| 30 to 34 Minutes | 1,967 | 12.0% |
| 35 to 39 Minutes | 510 | 3.1% |
| 40 to 44 Minutes | 661 | 4.0% |
| 45 to 59 Minutes | 1,725 | 10.5% |
| 60 to 89 Minutes | 1,383 | 8.4% |
| 90 or more Minutes | 1,546 | 9.4% |
Commute Time by Sex in Huntington Station
The most common commute times in Huntington Station are 20 to 24 minutes (1,119 commuters, 12.4%) for males and 30 to 34 minutes (1,101 commuters, 14.8%) for females.
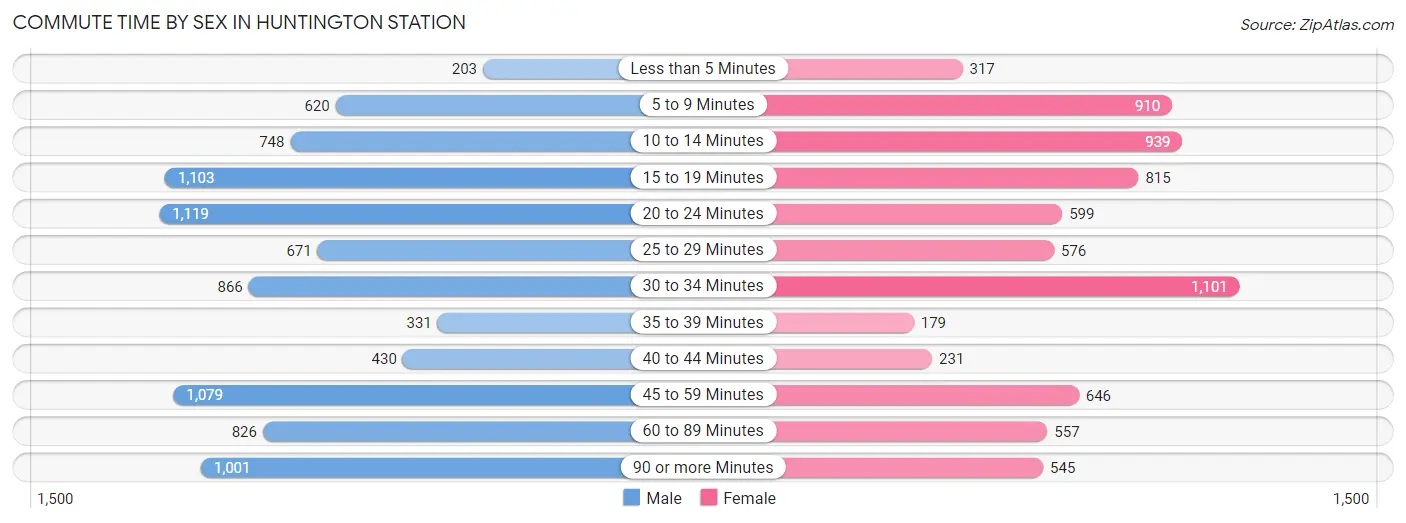
| Commute Time | Male | Female |
| Less than 5 Minutes | 203 (2.3%) | 317 (4.3%) |
| 5 to 9 Minutes | 620 (6.9%) | 910 (12.3%) |
| 10 to 14 Minutes | 748 (8.3%) | 939 (12.7%) |
| 15 to 19 Minutes | 1,103 (12.3%) | 815 (11.0%) |
| 20 to 24 Minutes | 1,119 (12.4%) | 599 (8.1%) |
| 25 to 29 Minutes | 671 (7.5%) | 576 (7.8%) |
| 30 to 34 Minutes | 866 (9.6%) | 1,101 (14.8%) |
| 35 to 39 Minutes | 331 (3.7%) | 179 (2.4%) |
| 40 to 44 Minutes | 430 (4.8%) | 231 (3.1%) |
| 45 to 59 Minutes | 1,079 (12.0%) | 646 (8.7%) |
| 60 to 89 Minutes | 826 (9.2%) | 557 (7.5%) |
| 90 or more Minutes | 1,001 (11.1%) | 545 (7.3%) |
Time of Departure to Work by Sex in Huntington Station
The most frequent times of departure to work in Huntington Station are 7:00 AM to 7:29 AM (1,867, 20.7%) for males and 8:00 AM to 8:29 AM (1,349, 18.2%) for females.
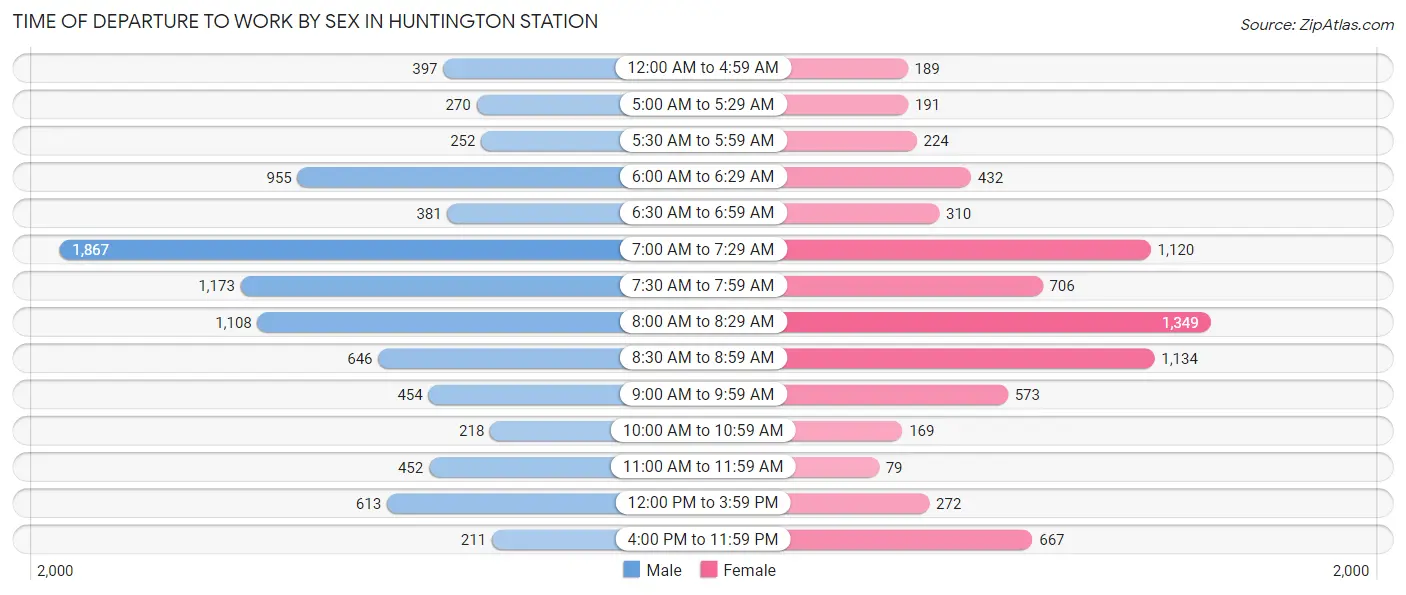
| Time of Departure | Male | Female |
| 12:00 AM to 4:59 AM | 397 (4.4%) | 189 (2.5%) |
| 5:00 AM to 5:29 AM | 270 (3.0%) | 191 (2.6%) |
| 5:30 AM to 5:59 AM | 252 (2.8%) | 224 (3.0%) |
| 6:00 AM to 6:29 AM | 955 (10.6%) | 432 (5.8%) |
| 6:30 AM to 6:59 AM | 381 (4.2%) | 310 (4.2%) |
| 7:00 AM to 7:29 AM | 1,867 (20.7%) | 1,120 (15.1%) |
| 7:30 AM to 7:59 AM | 1,173 (13.0%) | 706 (9.5%) |
| 8:00 AM to 8:29 AM | 1,108 (12.3%) | 1,349 (18.2%) |
| 8:30 AM to 8:59 AM | 646 (7.2%) | 1,134 (15.3%) |
| 9:00 AM to 9:59 AM | 454 (5.1%) | 573 (7.7%) |
| 10:00 AM to 10:59 AM | 218 (2.4%) | 169 (2.3%) |
| 11:00 AM to 11:59 AM | 452 (5.0%) | 79 (1.1%) |
| 12:00 PM to 3:59 PM | 613 (6.8%) | 272 (3.7%) |
| 4:00 PM to 11:59 PM | 211 (2.4%) | 667 (9.0%) |
| Total | 8,997 (100.0%) | 7,415 (100.0%) |
Housing Occupancy in Huntington Station
Occupancy by Ownership in Huntington Station
Of the total 11,011 dwellings in Huntington Station, owner-occupied units account for 8,508 (77.3%), while renter-occupied units make up 2,503 (22.7%).
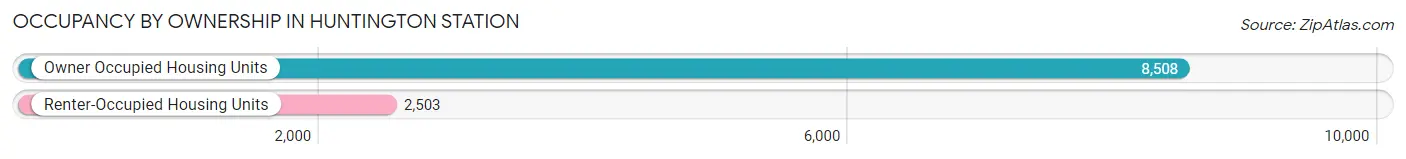
| Occupancy | # Housing Units | % Housing Units |
| Owner Occupied Housing Units | 8,508 | 77.3% |
| Renter-Occupied Housing Units | 2,503 | 22.7% |
| Total Occupied Housing Units | 11,011 | 100.0% |
Occupancy by Household Size in Huntington Station
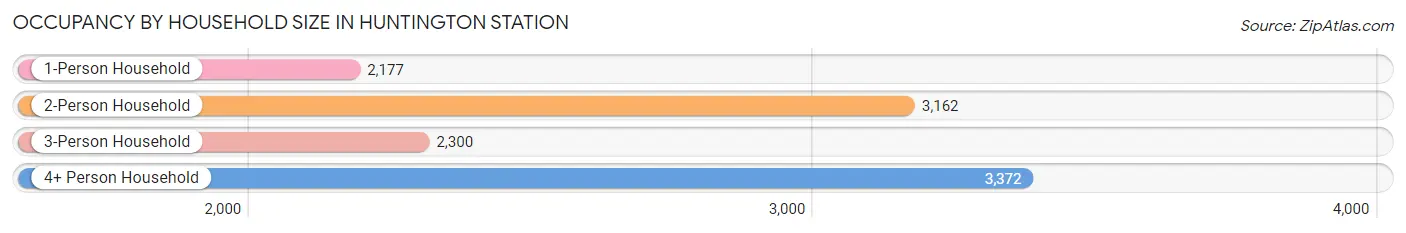
| Household Size | # Housing Units | % Housing Units |
| 1-Person Household | 2,177 | 19.8% |
| 2-Person Household | 3,162 | 28.7% |
| 3-Person Household | 2,300 | 20.9% |
| 4+ Person Household | 3,372 | 30.6% |
| Total Housing Units | 11,011 | 100.0% |
Occupancy by Ownership by Household Size in Huntington Station
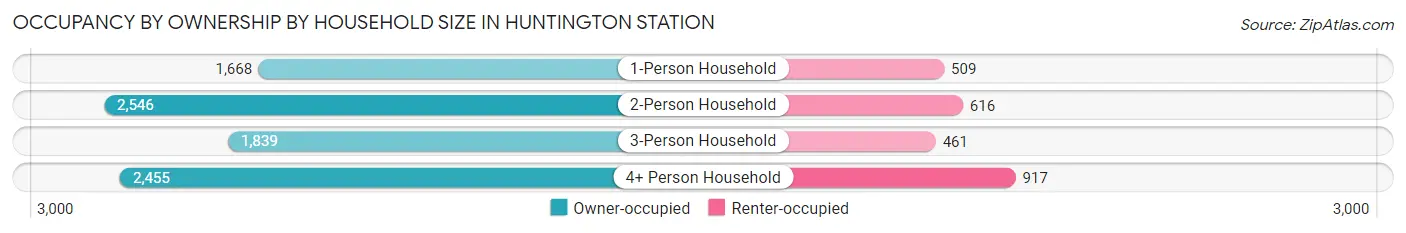
| Household Size | Owner-occupied | Renter-occupied |
| 1-Person Household | 1,668 (76.6%) | 509 (23.4%) |
| 2-Person Household | 2,546 (80.5%) | 616 (19.5%) |
| 3-Person Household | 1,839 (80.0%) | 461 (20.0%) |
| 4+ Person Household | 2,455 (72.8%) | 917 (27.2%) |
| Total Housing Units | 8,508 (77.3%) | 2,503 (22.7%) |
Occupancy by Educational Attainment in Huntington Station
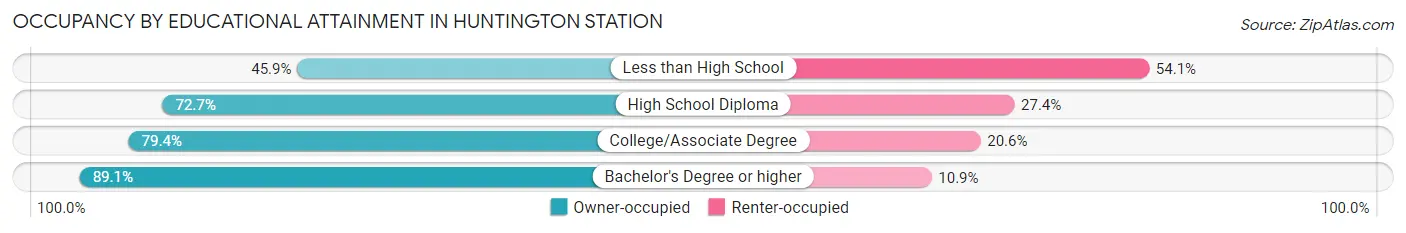
| Household Size | Owner-occupied | Renter-occupied |
| Less than High School | 768 (45.9%) | 904 (54.1%) |
| High School Diploma | 1,453 (72.7%) | 547 (27.4%) |
| College/Associate Degree | 2,038 (79.4%) | 530 (20.6%) |
| Bachelor's Degree or higher | 4,249 (89.1%) | 522 (10.9%) |
Occupancy by Age of Householder in Huntington Station
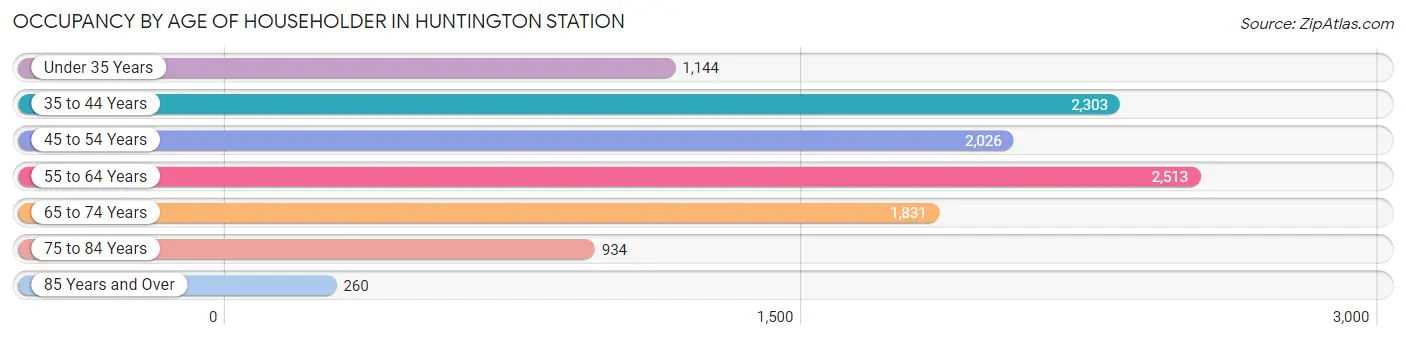
| Age Bracket | # Households | % Households |
| Under 35 Years | 1,144 | 10.4% |
| 35 to 44 Years | 2,303 | 20.9% |
| 45 to 54 Years | 2,026 | 18.4% |
| 55 to 64 Years | 2,513 | 22.8% |
| 65 to 74 Years | 1,831 | 16.6% |
| 75 to 84 Years | 934 | 8.5% |
| 85 Years and Over | 260 | 2.4% |
| Total | 11,011 | 100.0% |
Housing Finances in Huntington Station
Median Income by Occupancy in Huntington Station
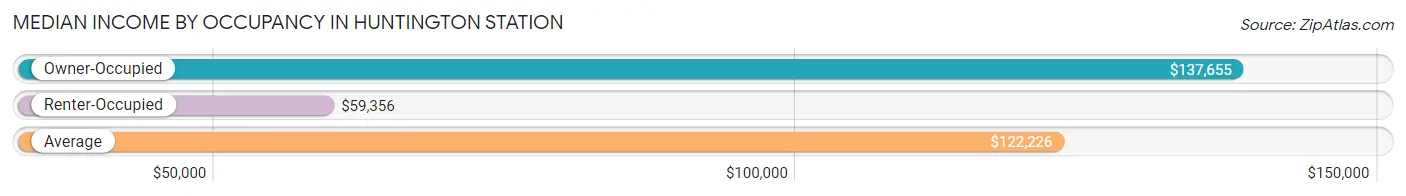
| Occupancy Type | # Households | Median Income |
| Owner-Occupied | 8,508 (77.3%) | $137,655 |
| Renter-Occupied | 2,503 (22.7%) | $59,356 |
| Average | 11,011 (100.0%) | $122,226 |
Occupancy by Householder Income Bracket in Huntington Station
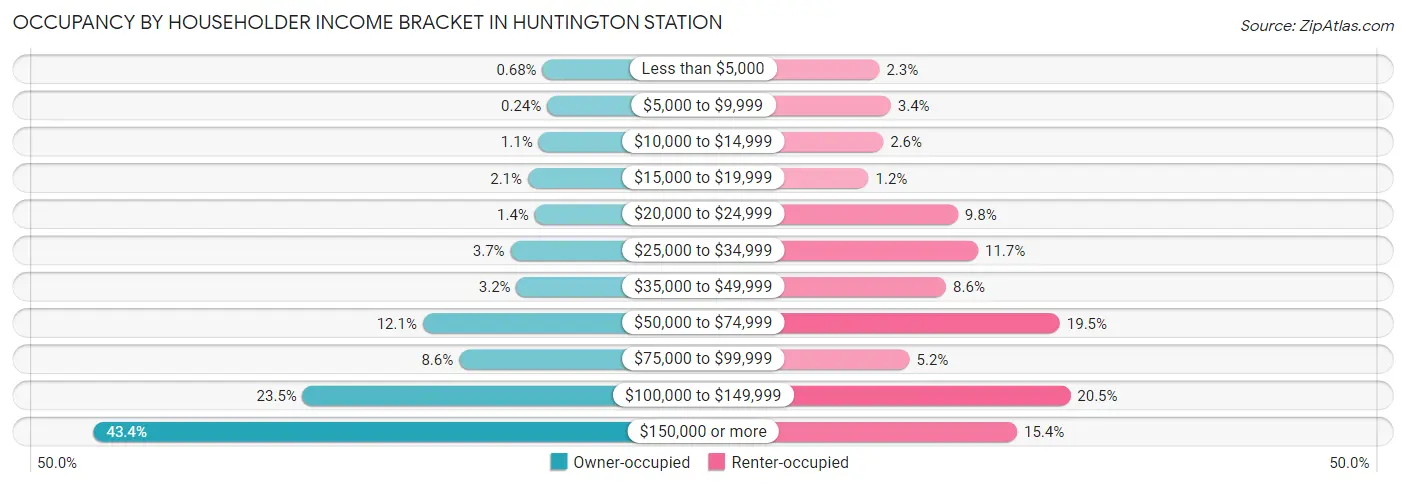
| Income Bracket | Owner-occupied | Renter-occupied |
| Less than $5,000 | 58 (0.7%) | 57 (2.3%) |
| $5,000 to $9,999 | 20 (0.2%) | 84 (3.4%) |
| $10,000 to $14,999 | 90 (1.1%) | 66 (2.6%) |
| $15,000 to $19,999 | 176 (2.1%) | 31 (1.2%) |
| $20,000 to $24,999 | 121 (1.4%) | 244 (9.8%) |
| $25,000 to $34,999 | 317 (3.7%) | 292 (11.7%) |
| $35,000 to $49,999 | 269 (3.2%) | 216 (8.6%) |
| $50,000 to $74,999 | 1,028 (12.1%) | 487 (19.5%) |
| $75,000 to $99,999 | 733 (8.6%) | 129 (5.1%) |
| $100,000 to $149,999 | 2,001 (23.5%) | 512 (20.5%) |
| $150,000 or more | 3,695 (43.4%) | 385 (15.4%) |
| Total | 8,508 (100.0%) | 2,503 (100.0%) |
Monthly Housing Cost Tiers in Huntington Station
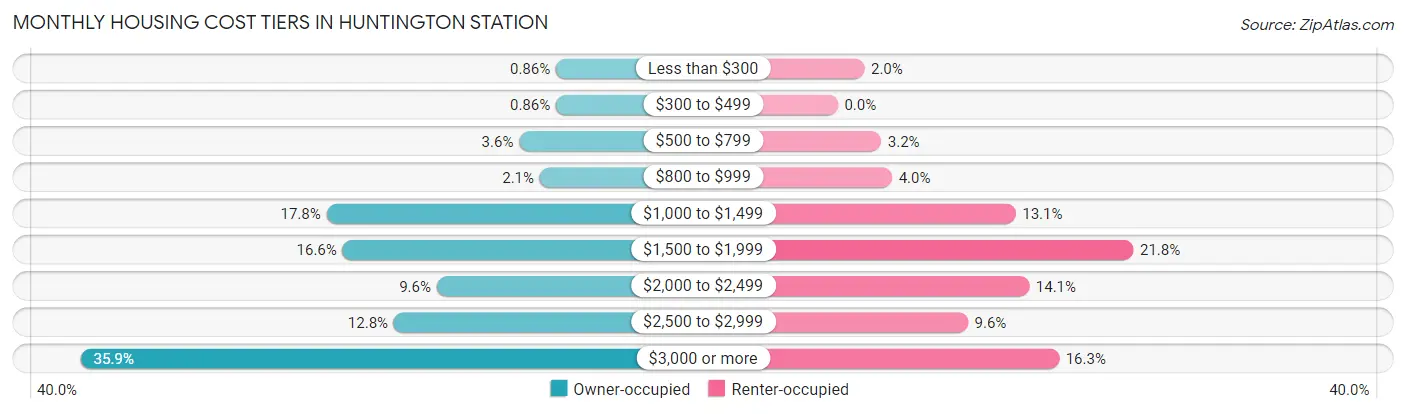
| Monthly Cost | Owner-occupied | Renter-occupied |
| Less than $300 | 73 (0.9%) | 49 (2.0%) |
| $300 to $499 | 73 (0.9%) | 0 (0.0%) |
| $500 to $799 | 304 (3.6%) | 80 (3.2%) |
| $800 to $999 | 174 (2.1%) | 100 (4.0%) |
| $1,000 to $1,499 | 1,511 (17.8%) | 328 (13.1%) |
| $1,500 to $1,999 | 1,411 (16.6%) | 545 (21.8%) |
| $2,000 to $2,499 | 820 (9.6%) | 353 (14.1%) |
| $2,500 to $2,999 | 1,089 (12.8%) | 240 (9.6%) |
| $3,000 or more | 3,053 (35.9%) | 408 (16.3%) |
| Total | 8,508 (100.0%) | 2,503 (100.0%) |
Physical Housing Characteristics in Huntington Station
Housing Structures in Huntington Station
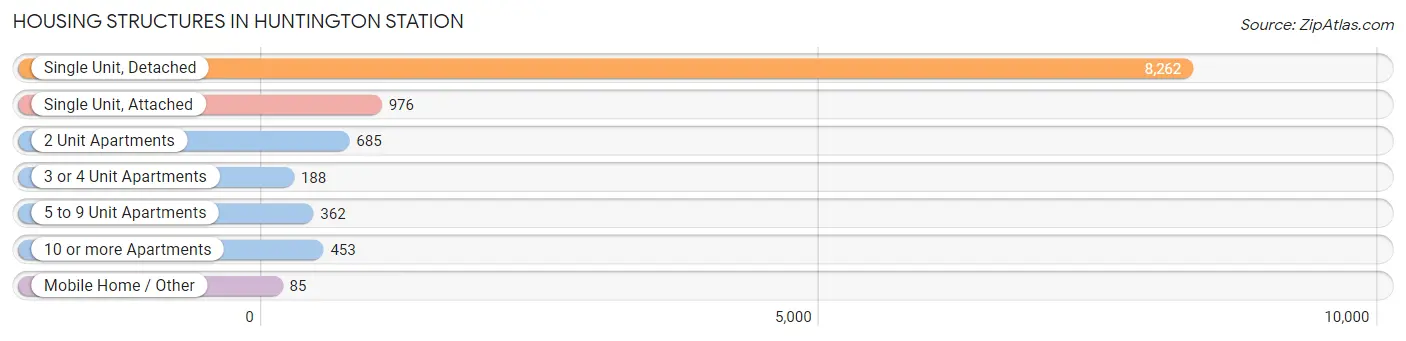
| Structure Type | # Housing Units | % Housing Units |
| Single Unit, Detached | 8,262 | 75.0% |
| Single Unit, Attached | 976 | 8.9% |
| 2 Unit Apartments | 685 | 6.2% |
| 3 or 4 Unit Apartments | 188 | 1.7% |
| 5 to 9 Unit Apartments | 362 | 3.3% |
| 10 or more Apartments | 453 | 4.1% |
| Mobile Home / Other | 85 | 0.8% |
| Total | 11,011 | 100.0% |
Housing Structures by Occupancy in Huntington Station
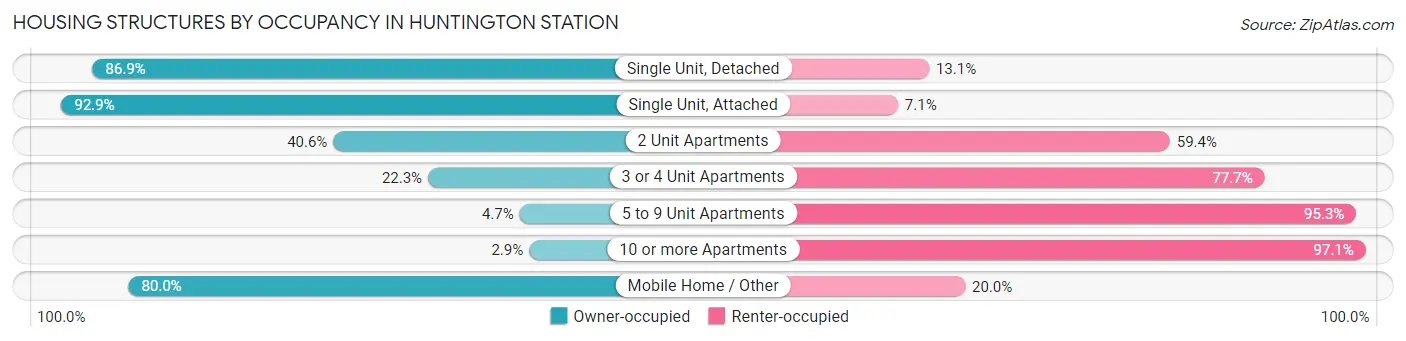
| Structure Type | Owner-occupied | Renter-occupied |
| Single Unit, Detached | 7,183 (86.9%) | 1,079 (13.1%) |
| Single Unit, Attached | 907 (92.9%) | 69 (7.1%) |
| 2 Unit Apartments | 278 (40.6%) | 407 (59.4%) |
| 3 or 4 Unit Apartments | 42 (22.3%) | 146 (77.7%) |
| 5 to 9 Unit Apartments | 17 (4.7%) | 345 (95.3%) |
| 10 or more Apartments | 13 (2.9%) | 440 (97.1%) |
| Mobile Home / Other | 68 (80.0%) | 17 (20.0%) |
| Total | 8,508 (77.3%) | 2,503 (22.7%) |
Housing Structures by Number of Rooms in Huntington Station
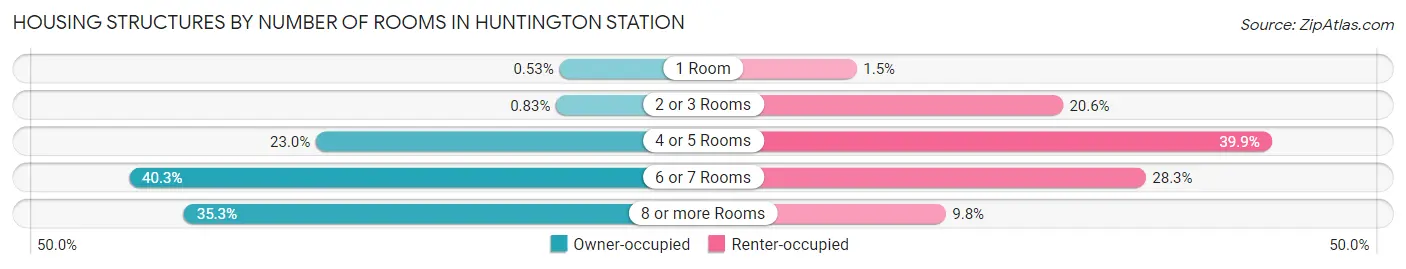
| Number of Rooms | Owner-occupied | Renter-occupied |
| 1 Room | 45 (0.5%) | 38 (1.5%) |
| 2 or 3 Rooms | 71 (0.8%) | 515 (20.6%) |
| 4 or 5 Rooms | 1,960 (23.0%) | 999 (39.9%) |
| 6 or 7 Rooms | 3,431 (40.3%) | 707 (28.2%) |
| 8 or more Rooms | 3,001 (35.3%) | 244 (9.8%) |
| Total | 8,508 (100.0%) | 2,503 (100.0%) |
Housing Structure by Heating Type in Huntington Station
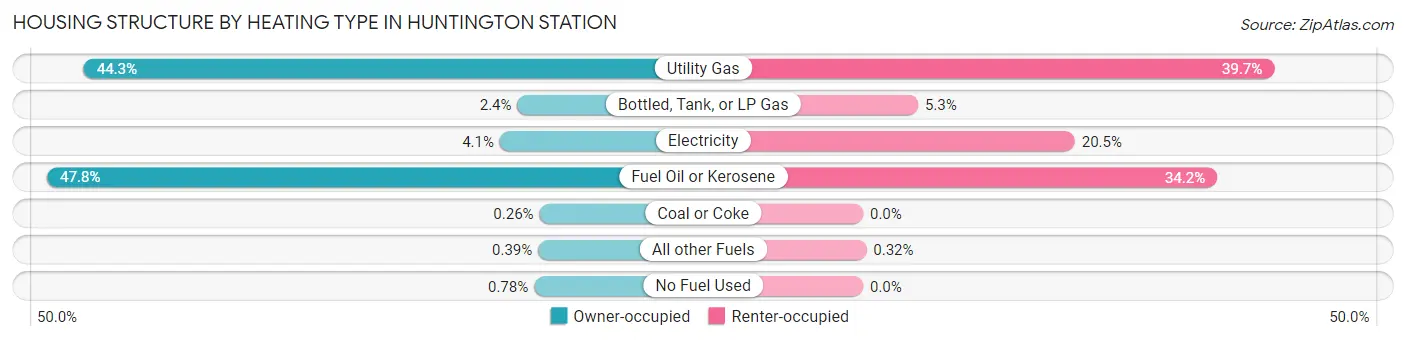
| Heating Type | Owner-occupied | Renter-occupied |
| Utility Gas | 3,767 (44.3%) | 994 (39.7%) |
| Bottled, Tank, or LP Gas | 203 (2.4%) | 133 (5.3%) |
| Electricity | 348 (4.1%) | 512 (20.5%) |
| Fuel Oil or Kerosene | 4,069 (47.8%) | 856 (34.2%) |
| Coal or Coke | 22 (0.3%) | 0 (0.0%) |
| All other Fuels | 33 (0.4%) | 8 (0.3%) |
| No Fuel Used | 66 (0.8%) | 0 (0.0%) |
| Total | 8,508 (100.0%) | 2,503 (100.0%) |
Household Vehicle Usage in Huntington Station
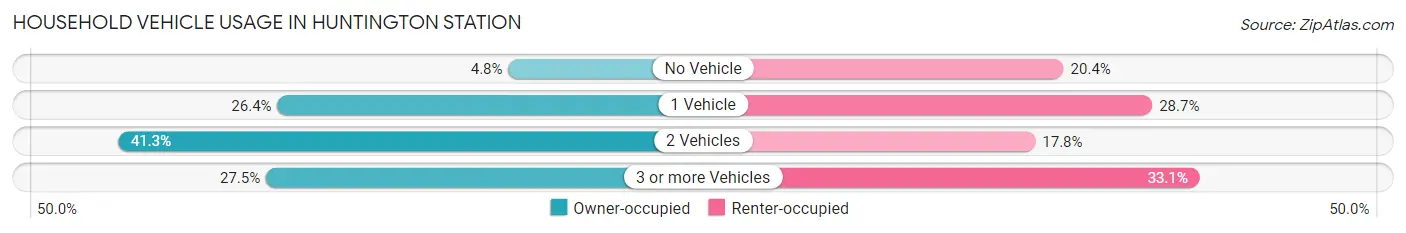
| Vehicles per Household | Owner-occupied | Renter-occupied |
| No Vehicle | 412 (4.8%) | 511 (20.4%) |
| 1 Vehicle | 2,246 (26.4%) | 718 (28.7%) |
| 2 Vehicles | 3,514 (41.3%) | 445 (17.8%) |
| 3 or more Vehicles | 2,336 (27.5%) | 829 (33.1%) |
| Total | 8,508 (100.0%) | 2,503 (100.0%) |
Real Estate & Mortgages in Huntington Station
Real Estate and Mortgage Overview in Huntington Station
| Characteristic | Without Mortgage | With Mortgage |
| Housing Units | 3,116 | 5,392 |
| Median Property Value | $490,800 | $484,600 |
| Median Household Income | $105,872 | $2,701 |
| Monthly Housing Costs | $1,391 | $3,010 |
| Real Estate Taxes | $10,001 | $33 |
Property Value by Mortgage Status in Huntington Station
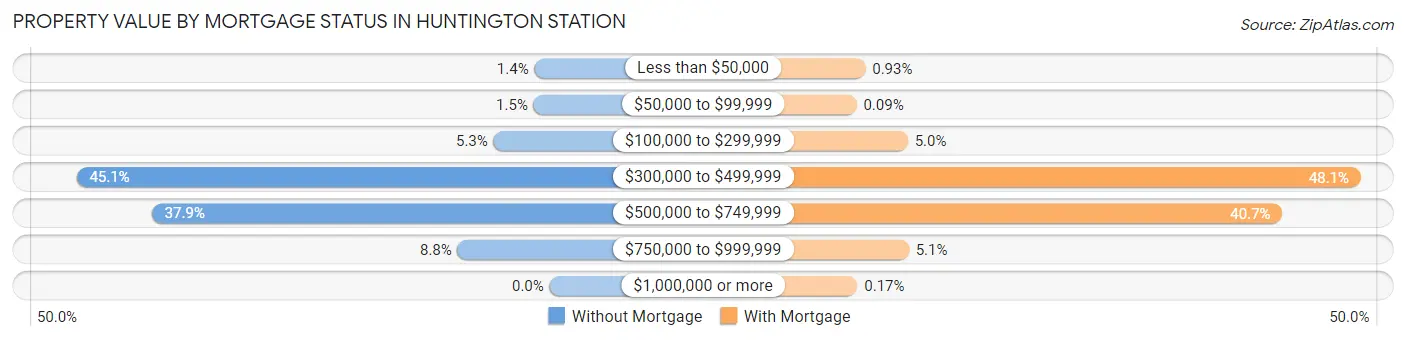
| Property Value | Without Mortgage | With Mortgage |
| Less than $50,000 | 45 (1.4%) | 50 (0.9%) |
| $50,000 to $99,999 | 47 (1.5%) | 5 (0.1%) |
| $100,000 to $299,999 | 166 (5.3%) | 268 (5.0%) |
| $300,000 to $499,999 | 1,404 (45.1%) | 2,595 (48.1%) |
| $500,000 to $749,999 | 1,181 (37.9%) | 2,192 (40.6%) |
| $750,000 to $999,999 | 273 (8.8%) | 273 (5.1%) |
| $1,000,000 or more | 0 (0.0%) | 9 (0.2%) |
| Total | 3,116 (100.0%) | 5,392 (100.0%) |
Household Income by Mortgage Status in Huntington Station
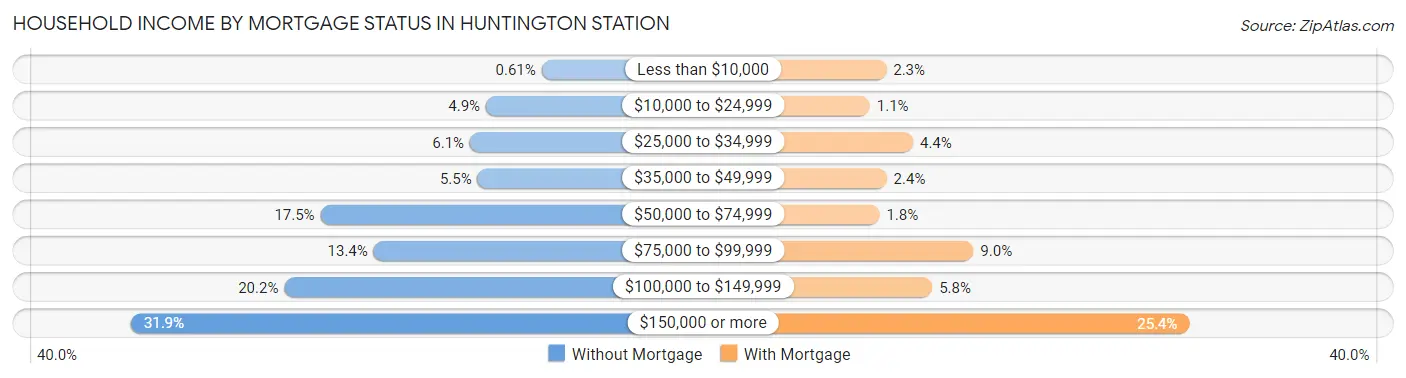
| Household Income | Without Mortgage | With Mortgage |
| Less than $10,000 | 19 (0.6%) | 126 (2.3%) |
| $10,000 to $24,999 | 151 (4.9%) | 59 (1.1%) |
| $25,000 to $34,999 | 189 (6.1%) | 236 (4.4%) |
| $35,000 to $49,999 | 171 (5.5%) | 128 (2.4%) |
| $50,000 to $74,999 | 544 (17.5%) | 98 (1.8%) |
| $75,000 to $99,999 | 418 (13.4%) | 484 (9.0%) |
| $100,000 to $149,999 | 630 (20.2%) | 315 (5.8%) |
| $150,000 or more | 994 (31.9%) | 1,371 (25.4%) |
| Total | 3,116 (100.0%) | 5,392 (100.0%) |
Property Value to Household Income Ratio in Huntington Station
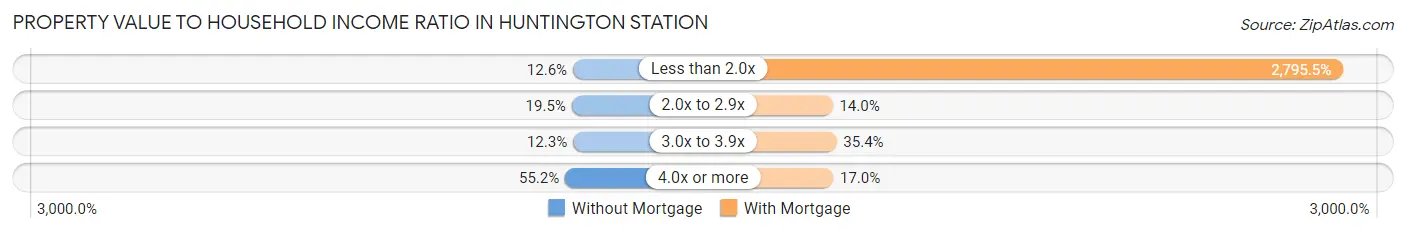
| Value-to-Income Ratio | Without Mortgage | With Mortgage |
| Less than 2.0x | 394 (12.6%) | 150,735 (2,795.5%) |
| 2.0x to 2.9x | 608 (19.5%) | 752 (14.0%) |
| 3.0x to 3.9x | 382 (12.3%) | 1,907 (35.4%) |
| 4.0x or more | 1,721 (55.2%) | 917 (17.0%) |
| Total | 3,116 (100.0%) | 5,392 (100.0%) |
Real Estate Taxes by Mortgage Status in Huntington Station
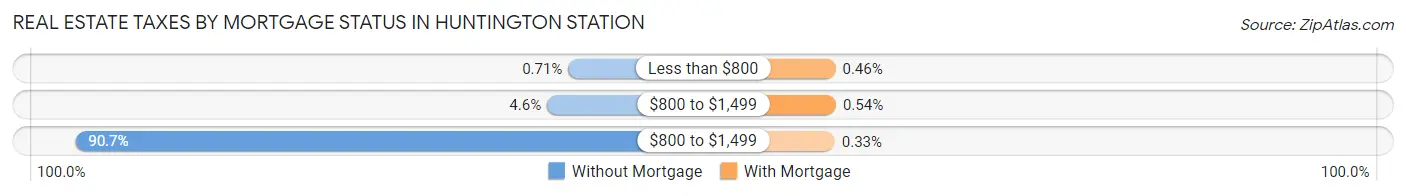
| Property Taxes | Without Mortgage | With Mortgage |
| Less than $800 | 22 (0.7%) | 25 (0.5%) |
| $800 to $1,499 | 143 (4.6%) | 29 (0.5%) |
| $800 to $1,499 | 2,827 (90.7%) | 18 (0.3%) |
| Total | 3,116 (100.0%) | 5,392 (100.0%) |
Health & Disability in Huntington Station
Health Insurance Coverage by Age in Huntington Station
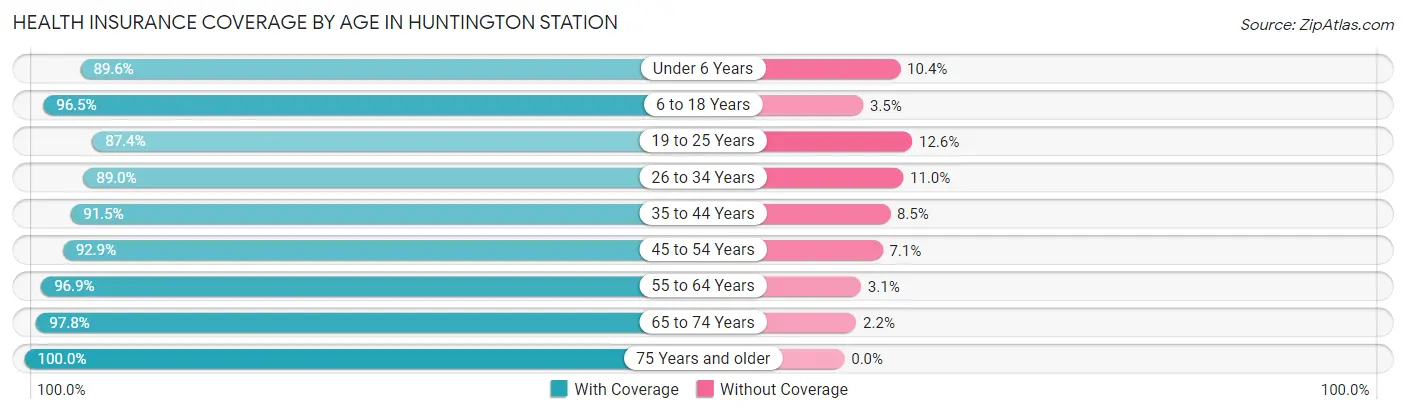
| Age Bracket | With Coverage | Without Coverage |
| Under 6 Years | 1,961 (89.6%) | 228 (10.4%) |
| 6 to 18 Years | 5,589 (96.5%) | 202 (3.5%) |
| 19 to 25 Years | 2,324 (87.4%) | 336 (12.6%) |
| 26 to 34 Years | 3,637 (89.0%) | 448 (11.0%) |
| 35 to 44 Years | 4,530 (91.5%) | 422 (8.5%) |
| 45 to 54 Years | 4,173 (92.9%) | 320 (7.1%) |
| 55 to 64 Years | 5,087 (96.9%) | 163 (3.1%) |
| 65 to 74 Years | 2,792 (97.8%) | 63 (2.2%) |
| 75 Years and older | 2,313 (100.0%) | 0 (0.0%) |
| Total | 32,406 (93.7%) | 2,182 (6.3%) |
Health Insurance Coverage by Citizenship Status in Huntington Station
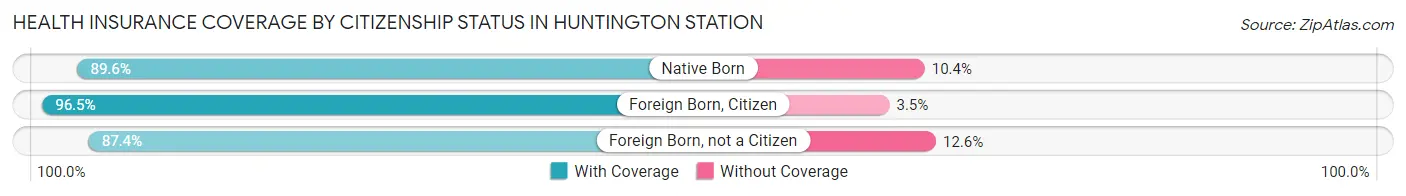
| Citizenship Status | With Coverage | Without Coverage |
| Native Born | 1,961 (89.6%) | 228 (10.4%) |
| Foreign Born, Citizen | 5,589 (96.5%) | 202 (3.5%) |
| Foreign Born, not a Citizen | 2,324 (87.4%) | 336 (12.6%) |
Health Insurance Coverage by Household Income in Huntington Station
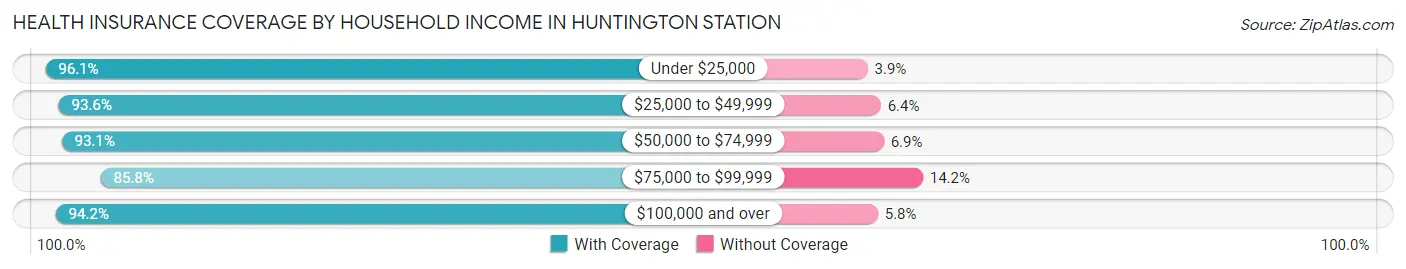
| Household Income | With Coverage | Without Coverage |
| Under $25,000 | 2,660 (96.1%) | 108 (3.9%) |
| $25,000 to $49,999 | 2,090 (93.6%) | 142 (6.4%) |
| $50,000 to $74,999 | 3,888 (93.1%) | 289 (6.9%) |
| $75,000 to $99,999 | 1,741 (85.8%) | 289 (14.2%) |
| $100,000 and over | 21,818 (94.2%) | 1,345 (5.8%) |
Public vs Private Health Insurance Coverage by Age in Huntington Station
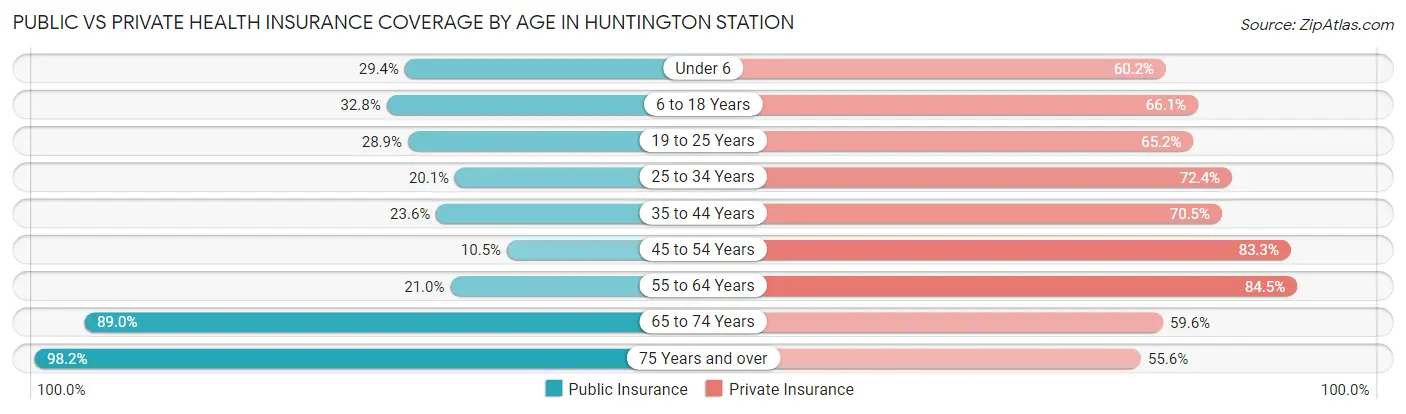
| Age Bracket | Public Insurance | Private Insurance |
| Under 6 | 644 (29.4%) | 1,317 (60.2%) |
| 6 to 18 Years | 1,901 (32.8%) | 3,827 (66.1%) |
| 19 to 25 Years | 768 (28.9%) | 1,735 (65.2%) |
| 25 to 34 Years | 822 (20.1%) | 2,958 (72.4%) |
| 35 to 44 Years | 1,169 (23.6%) | 3,493 (70.5%) |
| 45 to 54 Years | 471 (10.5%) | 3,744 (83.3%) |
| 55 to 64 Years | 1,102 (21.0%) | 4,436 (84.5%) |
| 65 to 74 Years | 2,540 (89.0%) | 1,702 (59.6%) |
| 75 Years and over | 2,272 (98.2%) | 1,285 (55.6%) |
| Total | 11,689 (33.8%) | 24,497 (70.8%) |
Disability Status by Sex by Age in Huntington Station
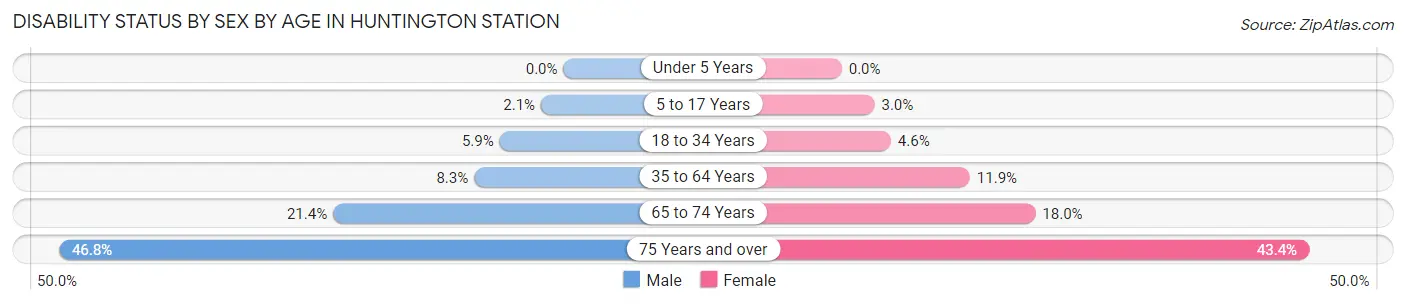
| Age Bracket | Male | Female |
| Under 5 Years | 0 (0.0%) | 0 (0.0%) |
| 5 to 17 Years | 57 (2.1%) | 81 (3.0%) |
| 18 to 34 Years | 250 (5.9%) | 152 (4.6%) |
| 35 to 64 Years | 630 (8.3%) | 844 (11.9%) |
| 65 to 74 Years | 251 (21.4%) | 302 (18.0%) |
| 75 Years and over | 491 (46.8%) | 548 (43.3%) |
Disability Class by Sex by Age in Huntington Station
Disability Class: Hearing Difficulty
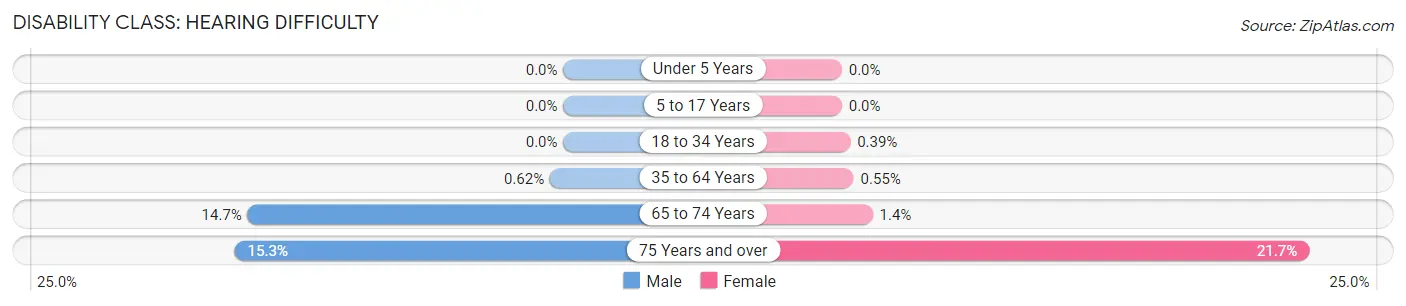
| Age Bracket | Male | Female |
| Under 5 Years | 0 (0.0%) | 0 (0.0%) |
| 5 to 17 Years | 0 (0.0%) | 0 (0.0%) |
| 18 to 34 Years | 0 (0.0%) | 13 (0.4%) |
| 35 to 64 Years | 47 (0.6%) | 39 (0.5%) |
| 65 to 74 Years | 172 (14.6%) | 24 (1.4%) |
| 75 Years and over | 160 (15.2%) | 274 (21.7%) |
Disability Class: Vision Difficulty
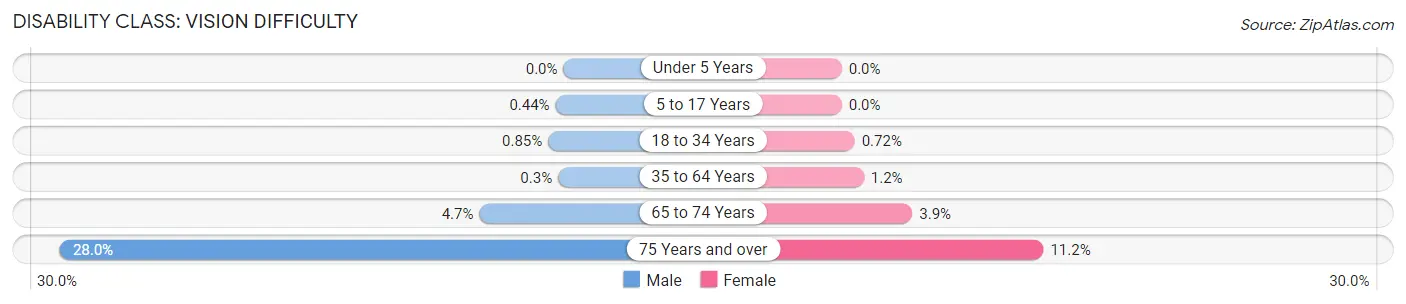
| Age Bracket | Male | Female |
| Under 5 Years | 0 (0.0%) | 0 (0.0%) |
| 5 to 17 Years | 12 (0.4%) | 0 (0.0%) |
| 18 to 34 Years | 36 (0.9%) | 24 (0.7%) |
| 35 to 64 Years | 23 (0.3%) | 87 (1.2%) |
| 65 to 74 Years | 55 (4.7%) | 66 (3.9%) |
| 75 Years and over | 294 (28.0%) | 142 (11.2%) |
Disability Class: Cognitive Difficulty
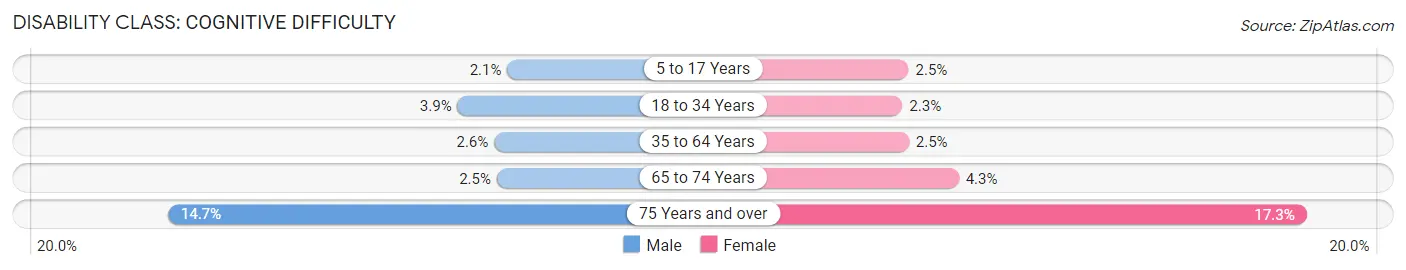
| Age Bracket | Male | Female |
| 5 to 17 Years | 57 (2.1%) | 66 (2.5%) |
| 18 to 34 Years | 166 (3.9%) | 75 (2.2%) |
| 35 to 64 Years | 195 (2.6%) | 177 (2.5%) |
| 65 to 74 Years | 29 (2.5%) | 73 (4.3%) |
| 75 Years and over | 154 (14.7%) | 218 (17.2%) |
Disability Class: Ambulatory Difficulty
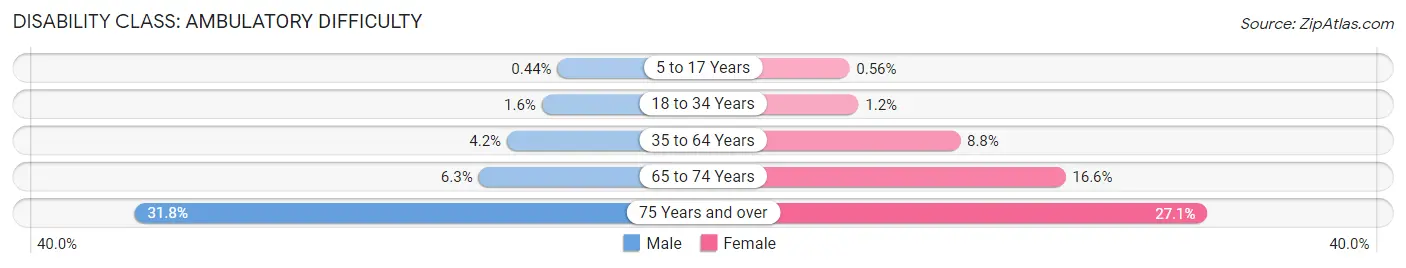
| Age Bracket | Male | Female |
| 5 to 17 Years | 12 (0.4%) | 15 (0.6%) |
| 18 to 34 Years | 68 (1.6%) | 41 (1.2%) |
| 35 to 64 Years | 318 (4.2%) | 623 (8.8%) |
| 65 to 74 Years | 74 (6.3%) | 279 (16.6%) |
| 75 Years and over | 334 (31.8%) | 343 (27.1%) |
Disability Class: Self-Care Difficulty
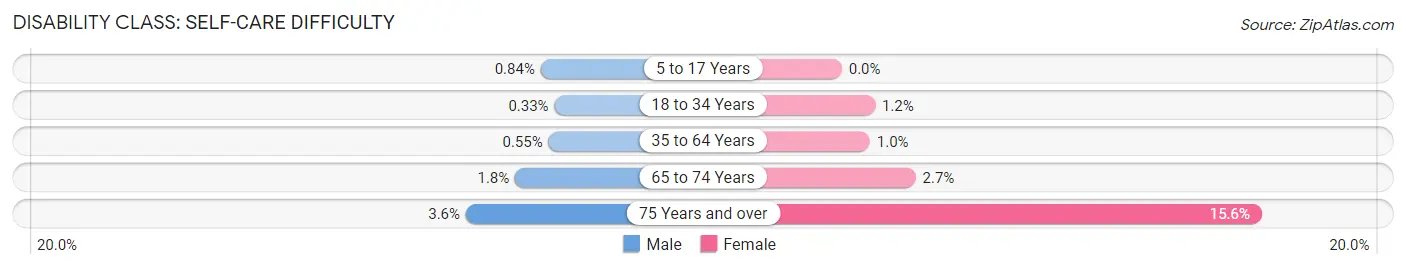
| Age Bracket | Male | Female |
| 5 to 17 Years | 23 (0.8%) | 0 (0.0%) |
| 18 to 34 Years | 14 (0.3%) | 41 (1.2%) |
| 35 to 64 Years | 42 (0.5%) | 74 (1.0%) |
| 65 to 74 Years | 21 (1.8%) | 46 (2.7%) |
| 75 Years and over | 38 (3.6%) | 197 (15.6%) |
Technology Access in Huntington Station
Computing Device Access in Huntington Station
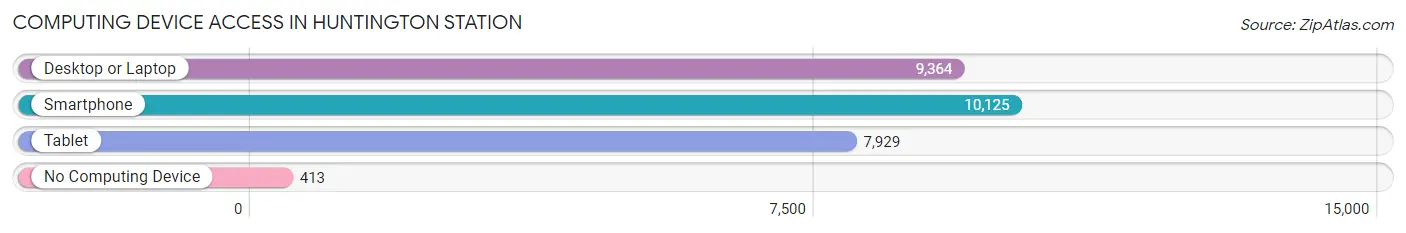
| Device Type | # Households | % Households |
| Desktop or Laptop | 9,364 | 85.0% |
| Smartphone | 10,125 | 91.9% |
| Tablet | 7,929 | 72.0% |
| No Computing Device | 413 | 3.7% |
| Total | 11,011 | 100.0% |
Internet Access in Huntington Station
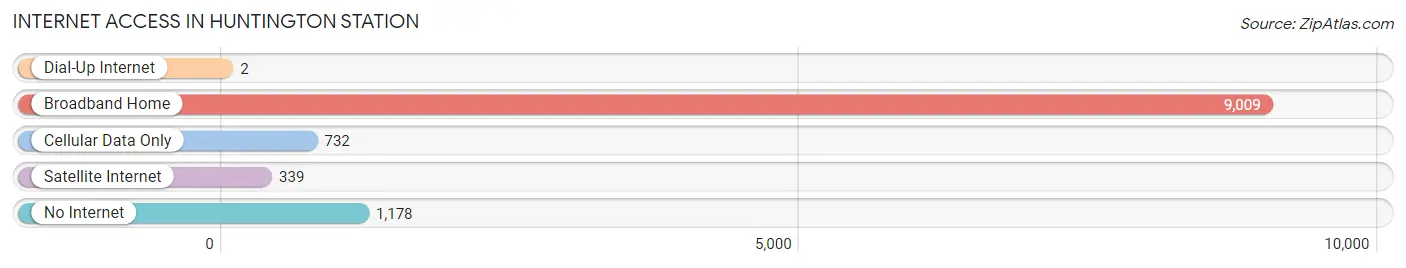
| Internet Type | # Households | % Households |
| Dial-Up Internet | 2 | 0.0% |
| Broadband Home | 9,009 | 81.8% |
| Cellular Data Only | 732 | 6.7% |
| Satellite Internet | 339 | 3.1% |
| No Internet | 1,178 | 10.7% |
| Total | 11,011 | 100.0% |
Huntington Station Summary
Huntington Station is a hamlet and census-designated place (CDP) located in the Town of Huntington in Suffolk County, New York, United States. The population was 33,029 at the 2010 census.
History
Huntington Station was originally known as "Fairground" and was a stop on the Long Island Rail Road. It was renamed "Huntington Station" in 1871 after Collis P. Huntington, a railroad magnate and one of the founders of the Central Pacific Railroad.
The area was originally settled by Europeans in the 1650s. The area was originally part of the Town of Huntington, but was annexed by the Town of Babylon in 1872. It was returned to the Town of Huntington in 1875.
Geography
Huntington Station is located at 40°51'25" North, 73°25'17" West (40.856944, -73.421389). According to the United States Census Bureau, the CDP has a total area of 4.2 square miles (10.8 km2), all land.
Economy
Huntington Station is home to many businesses, including retail stores, restaurants, and professional services. The area is also home to a number of industrial and manufacturing businesses.
Demographics
As of the census of 2000, there were 33,029 people, 11,845 households, and 8,072 families residing in the CDP. The population density was 7,845.3 per square mile (3,026.2/km2). There were 12,093 housing units at an average density of 2,890.3/sq mi (1,114.2/km2). The racial makeup of the CDP was 79.2% White, 8.2% African American, 0.2% Native American, 5.2% Asian, 0.1% Pacific Islander, 4.3% from other races, and 2.9% from two or more races. Hispanic or Latino of any race were 11.7% of the population.
There were 11,845 households, out of which 33.2% had children under the age of 18 living with them, 48.2% were married couples living together, 14.2% had a female householder with no husband present, and 32.2% were non-families. 25.2% of all households were made up of individuals, and 9.2% had someone living alone who was 65 years of age or older. The average household size was 2.76 and the average family size was 3.33.
In the CDP, the population was spread out, with 24.7% under the age of 18, 8.2% from 18 to 24, 32.2% from 25 to 44, 22.2% from 45 to 64, and 12.7% who were 65 years of age or older. The median age was 36 years. For every 100 females, there were 94.2 males. For every 100 females age 18 and over, there were 90.7 males.
The median income for a household in the CDP was $54,945, and the median income for a family was $62,845. Males had a median income of $41,945 versus $32,845 for females. The per capita income for the CDP was $23,945. About 5.2% of families and 7.2% of the population were below the poverty line, including 9.2% of those under age 18 and 6.2% of those age 65 or over.
Common Questions
What is the Total Population of Huntington Station?
Total Population of Huntington Station is 34,588.
What is the Total Male Population of Huntington Station?
Total Male Population of Huntington Station is 17,433.
What is the Total Female Population of Huntington Station?
Total Female Population of Huntington Station is 17,155.
What is the Ratio of Males per 100 Females in Huntington Station?
There are 101.62 Males per 100 Females in Huntington Station.
What is the Ratio of Females per 100 Males in Huntington Station?
There are 98.41 Females per 100 Males in Huntington Station.
What is the Median Population Age in Huntington Station?
Median Population Age in Huntington Station is 39.9 Years.
What is the Average Family Size in Huntington Station
Average Family Size in Huntington Station is 3.5 People.
What is the Average Household Size in Huntington Station
Average Household Size in Huntington Station is 3.1 People.
What is Per Capita Income in Huntington Station?
Per Capita income in Huntington Station is $47,450.
What is the Median Family Income in Huntington Station?
Median Family Income in Huntington Station is $131,291.
What is the Median Household income in Huntington Station?
Median Household Income in Huntington Station is $122,226.
What is Income or Wage Gap in Huntington Station?
Income or Wage Gap in Huntington Station is 29.7%.
Women in Huntington Station earn 70.3 cents for every dollar earned by a man.
What is Inequality or Gini Index in Huntington Station?
Inequality or Gini Index in Huntington Station is 0.40.
How Large is the Labor Force in Huntington Station?
There are 19,519 People in the Labor Forcein in Huntington Station.
What is the Percentage of People in the Labor Force in Huntington Station?
68.9% of People are in the Labor Force in Huntington Station.
What is the Unemployment Rate in Huntington Station?
Unemployment Rate in Huntington Station is 5.7%.