Liberty, NY
Liberty Map
Liberty Overview
5,030
TOTAL POPULATION
2,429
MALE POPULATION
2,601
FEMALE POPULATION
93.39
MALES / 100 FEMALES
107.08
FEMALES / 100 MALES
32.2
MEDIAN AGE
3.9
AVG FAMILY SIZE
2.8
AVG HOUSEHOLD SIZE
$21,472
PER CAPITA INCOME
$52,712
AVG FAMILY INCOME
$43,594
AVG HOUSEHOLD INCOME
2.8%
WAGE / INCOME GAP [ % ]
97.2¢/ $1
WAGE / INCOME GAP [ $ ]
0.44
INEQUALITY / GINI INDEX
2,105
LABOR FORCE [ PEOPLE ]
57.4%
PERCENT IN LABOR FORCE
7.6%
UNEMPLOYMENT RATE
Liberty Zip Codes
Liberty Area Codes
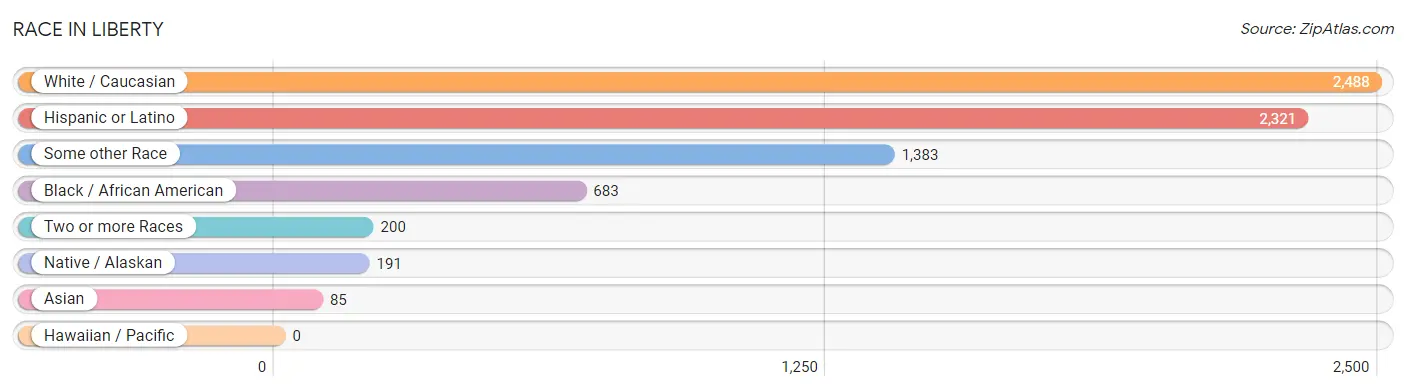
Race in Liberty
The most populous races in Liberty are White / Caucasian (2,488 | 49.5%), Hispanic or Latino (2,321 | 46.1%), and Some other Race (1,383 | 27.5%).
| Race | # Population | % Population |
| Asian | 85 | 1.7% |
| Black / African American | 683 | 13.6% |
| Hawaiian / Pacific | 0 | 0.0% |
| Hispanic or Latino | 2,321 | 46.1% |
| Native / Alaskan | 191 | 3.8% |
| White / Caucasian | 2,488 | 49.5% |
| Two or more Races | 200 | 4.0% |
| Some other Race | 1,383 | 27.5% |
| Total | 5,030 | 100.0% |
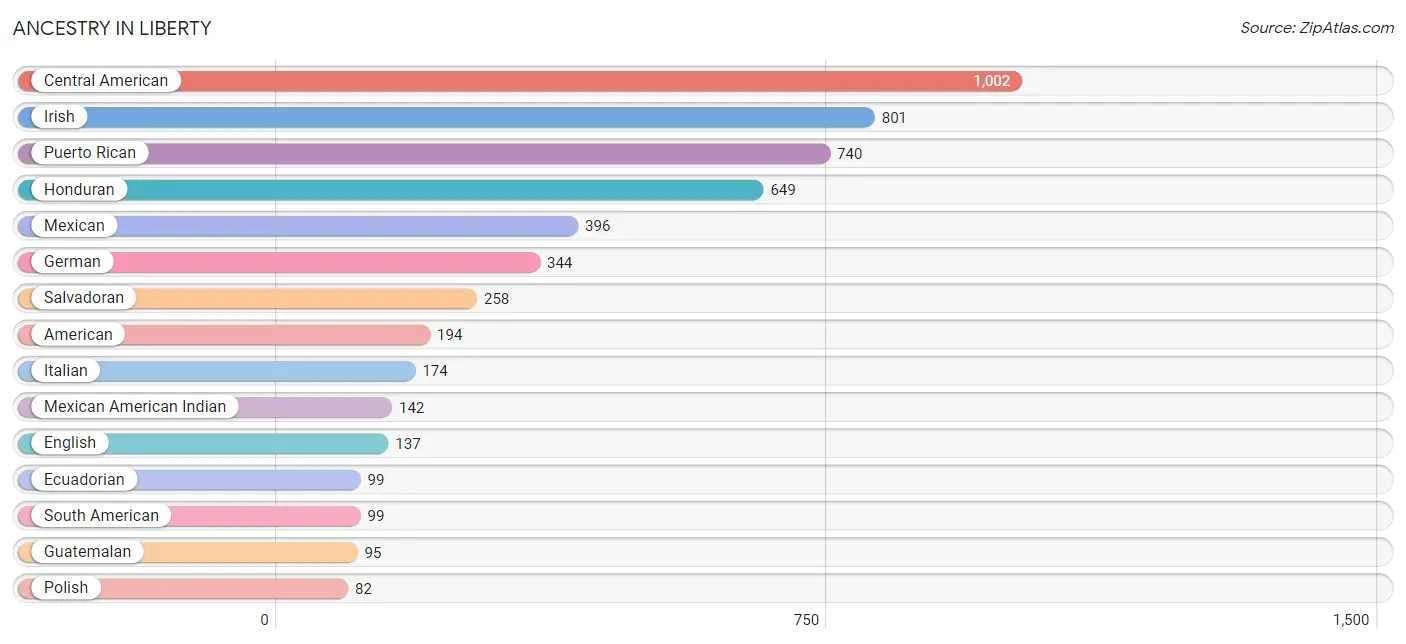
Ancestry in Liberty
The most populous ancestries reported in Liberty are Central American (1,002 | 19.9%), Irish (801 | 15.9%), Puerto Rican (740 | 14.7%), Honduran (649 | 12.9%), and Mexican (396 | 7.9%), together accounting for 71.3% of all Liberty residents.
| Ancestry | # Population | % Population |
| American | 194 | 3.9% |
| Brazilian | 41 | 0.8% |
| British | 31 | 0.6% |
| Canadian | 37 | 0.7% |
| Central American | 1,002 | 19.9% |
| Central American Indian | 58 | 1.1% |
| Cherokee | 28 | 0.6% |
| Delaware | 4 | 0.1% |
| Dominican | 25 | 0.5% |
| Dutch | 48 | 0.9% |
| Eastern European | 8 | 0.2% |
| Ecuadorian | 99 | 2.0% |
| English | 137 | 2.7% |
| European | 19 | 0.4% |
| Filipino | 13 | 0.3% |
| French | 16 | 0.3% |
| German | 344 | 6.8% |
| Greek | 9 | 0.2% |
| Guatemalan | 95 | 1.9% |
| Honduran | 649 | 12.9% |
| Hungarian | 6 | 0.1% |
| Irish | 801 | 15.9% |
| Italian | 174 | 3.5% |
| Korean | 10 | 0.2% |
| Latvian | 2 | 0.0% |
| Mexican | 396 | 7.9% |
| Mexican American Indian | 142 | 2.8% |
| Northern European | 15 | 0.3% |
| Polish | 82 | 1.6% |
| Portuguese | 11 | 0.2% |
| Puerto Rican | 740 | 14.7% |
| Russian | 29 | 0.6% |
| Salvadoran | 258 | 5.1% |
| Scottish | 36 | 0.7% |
| Slavic | 6 | 0.1% |
| South American | 99 | 2.0% |
| Swedish | 7 | 0.1% |
| Thai | 72 | 1.4% |
| Ukrainian | 15 | 0.3% |
| Welsh | 8 | 0.2% | View All 40 Rows |
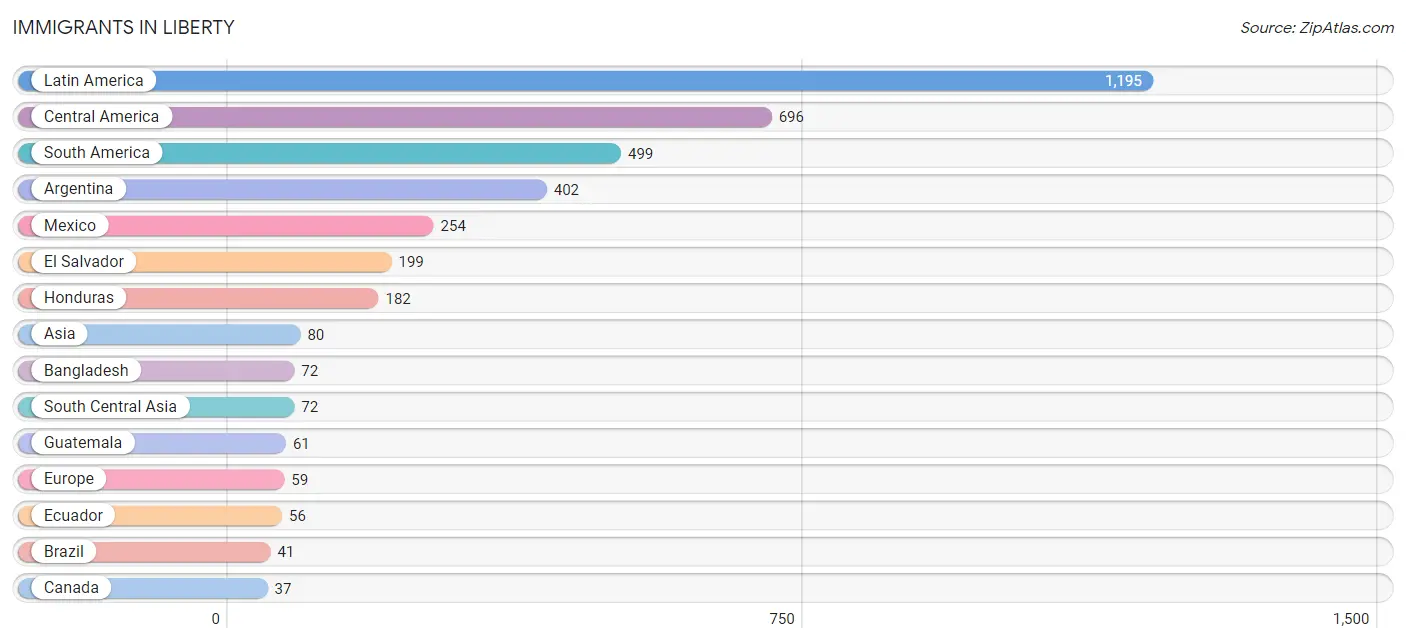
Immigrants in Liberty
The most numerous immigrant groups reported in Liberty came from Latin America (1,195 | 23.8%), Central America (696 | 13.8%), South America (499 | 9.9%), Argentina (402 | 8.0%), and Mexico (254 | 5.1%), together accounting for 60.6% of all Liberty residents.
| Immigration Origin | # Population | % Population |
| Argentina | 402 | 8.0% |
| Asia | 80 | 1.6% |
| Bangladesh | 72 | 1.4% |
| Brazil | 41 | 0.8% |
| Canada | 37 | 0.7% |
| Central America | 696 | 13.8% |
| China | 8 | 0.2% |
| Eastern Asia | 8 | 0.2% |
| Eastern Europe | 34 | 0.7% |
| Ecuador | 56 | 1.1% |
| El Salvador | 199 | 4.0% |
| England | 12 | 0.2% |
| Europe | 59 | 1.2% |
| Germany | 13 | 0.3% |
| Guatemala | 61 | 1.2% |
| Honduras | 182 | 3.6% |
| Latin America | 1,195 | 23.8% |
| Mexico | 254 | 5.1% |
| Northern Europe | 12 | 0.2% |
| Russia | 8 | 0.2% |
| South America | 499 | 9.9% |
| South Central Asia | 72 | 1.4% |
| Taiwan | 8 | 0.2% |
| Ukraine | 26 | 0.5% |
| Western Europe | 13 | 0.3% | View All 25 Rows |
Sex and Age in Liberty
Sex and Age in Liberty
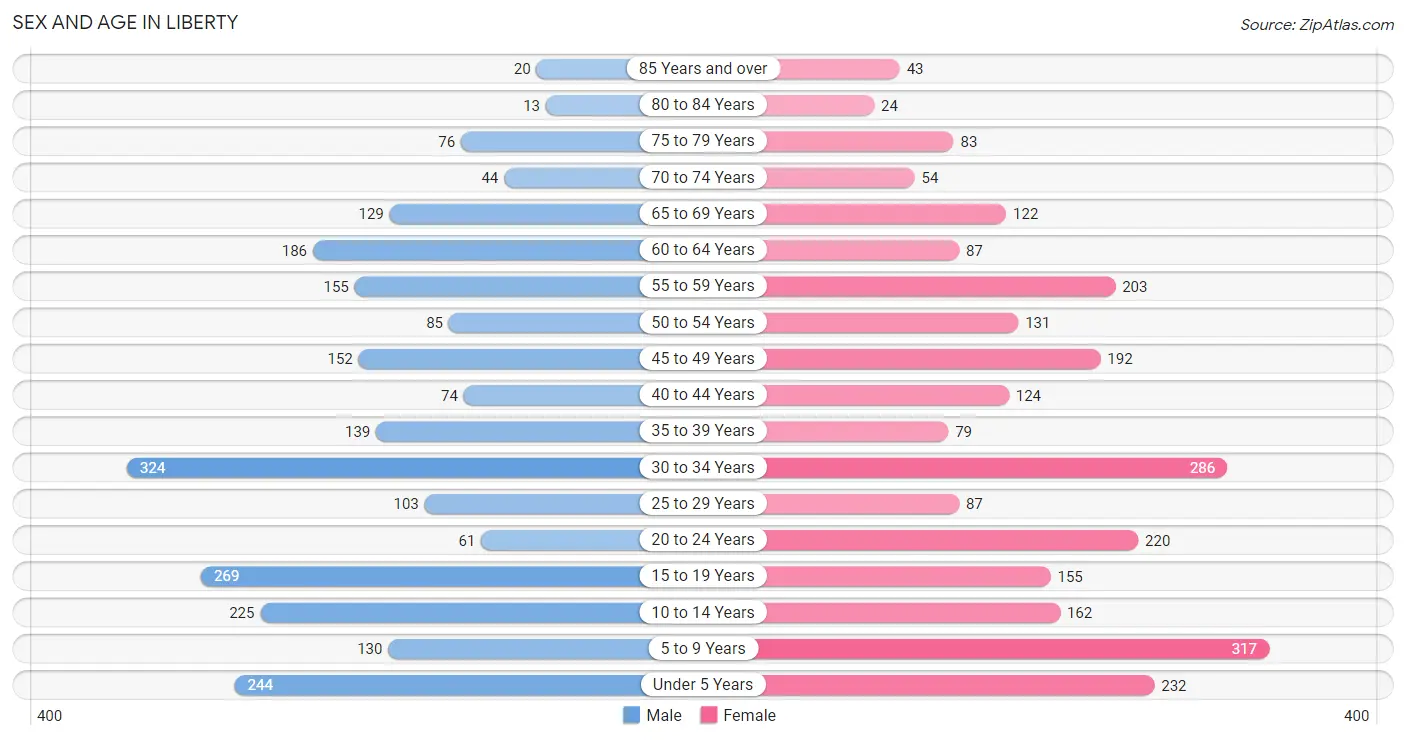
The most populous age groups in Liberty are 30 to 34 Years (324 | 13.3%) for men and 5 to 9 Years (317 | 12.2%) for women.
| Age Bracket | Male | Female |
| Under 5 Years | 244 (10.1%) | 232 (8.9%) |
| 5 to 9 Years | 130 (5.3%) | 317 (12.2%) |
| 10 to 14 Years | 225 (9.3%) | 162 (6.2%) |
| 15 to 19 Years | 269 (11.1%) | 155 (6.0%) |
| 20 to 24 Years | 61 (2.5%) | 220 (8.5%) |
| 25 to 29 Years | 103 (4.2%) | 87 (3.3%) |
| 30 to 34 Years | 324 (13.3%) | 286 (11.0%) |
| 35 to 39 Years | 139 (5.7%) | 79 (3.0%) |
| 40 to 44 Years | 74 (3.0%) | 124 (4.8%) |
| 45 to 49 Years | 152 (6.3%) | 192 (7.4%) |
| 50 to 54 Years | 85 (3.5%) | 131 (5.0%) |
| 55 to 59 Years | 155 (6.4%) | 203 (7.8%) |
| 60 to 64 Years | 186 (7.7%) | 87 (3.3%) |
| 65 to 69 Years | 129 (5.3%) | 122 (4.7%) |
| 70 to 74 Years | 44 (1.8%) | 54 (2.1%) |
| 75 to 79 Years | 76 (3.1%) | 83 (3.2%) |
| 80 to 84 Years | 13 (0.5%) | 24 (0.9%) |
| 85 Years and over | 20 (0.8%) | 43 (1.7%) |
| Total | 2,429 (100.0%) | 2,601 (100.0%) |
Families and Households in Liberty
Median Family Size in Liberty
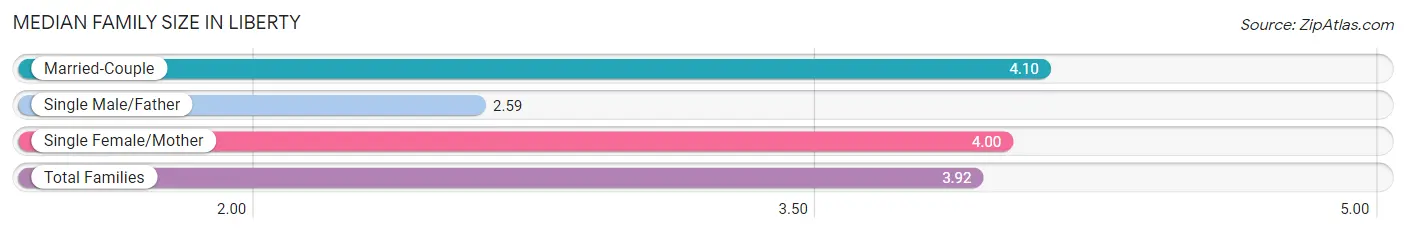
The median family size in Liberty is 3.92 persons per family, with married-couple families (608 | 62.5%) accounting for the largest median family size of 4.1 persons per family. On the other hand, single male/father families (99 | 10.2%) represent the smallest median family size with 2.59 persons per family.
| Family Type | # Families | Family Size |
| Married-Couple | 608 (62.5%) | 4.10 |
| Single Male/Father | 99 (10.2%) | 2.59 |
| Single Female/Mother | 265 (27.3%) | 4.00 |
| Total Families | 972 (100.0%) | 3.92 |
Median Household Size in Liberty
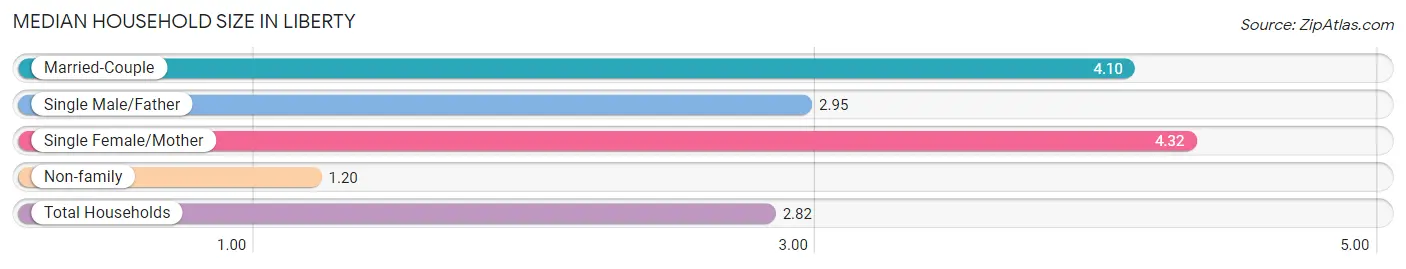
The median household size in Liberty is 2.82 persons per household, with single female/mother households (265 | 15.5%) accounting for the largest median household size of 4.32 persons per household. non-family households (735 | 43.1%) represent the smallest median household size with 1.20 persons per household.
| Household Type | # Households | Household Size |
| Married-Couple | 608 (35.6%) | 4.10 |
| Single Male/Father | 99 (5.8%) | 2.95 |
| Single Female/Mother | 265 (15.5%) | 4.32 |
| Non-family | 735 (43.1%) | 1.20 |
| Total Households | 1,707 (100.0%) | 2.82 |
Household Size by Marriage Status in Liberty
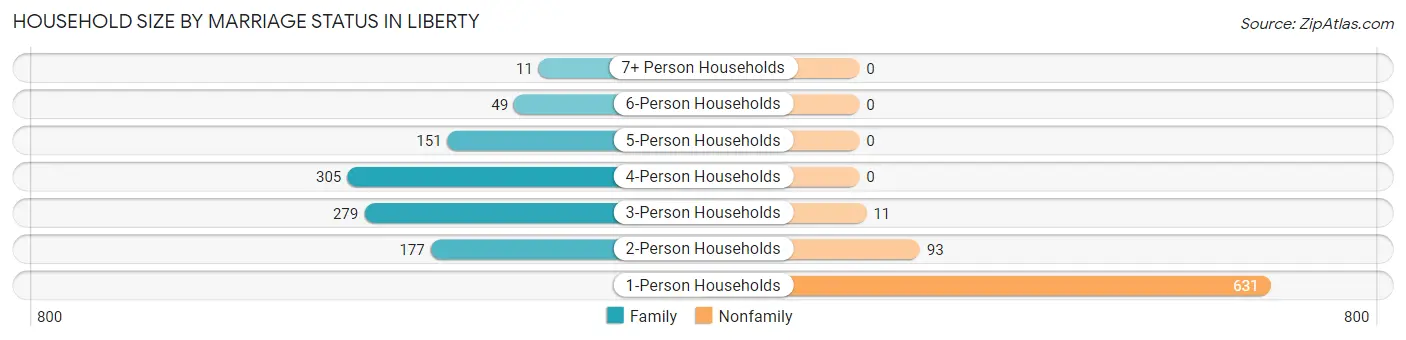
Out of a total of 1,707 households in Liberty, 972 (56.9%) are family households, while 735 (43.1%) are nonfamily households. The most numerous type of family households are 4-person households, comprising 305, and the most common type of nonfamily households are 1-person households, comprising 631.
| Household Size | Family Households | Nonfamily Households |
| 1-Person Households | - | 631 (37.0%) |
| 2-Person Households | 177 (10.4%) | 93 (5.4%) |
| 3-Person Households | 279 (16.3%) | 11 (0.6%) |
| 4-Person Households | 305 (17.9%) | 0 (0.0%) |
| 5-Person Households | 151 (8.8%) | 0 (0.0%) |
| 6-Person Households | 49 (2.9%) | 0 (0.0%) |
| 7+ Person Households | 11 (0.6%) | 0 (0.0%) |
| Total | 972 (56.9%) | 735 (43.1%) |
Female Fertility in Liberty
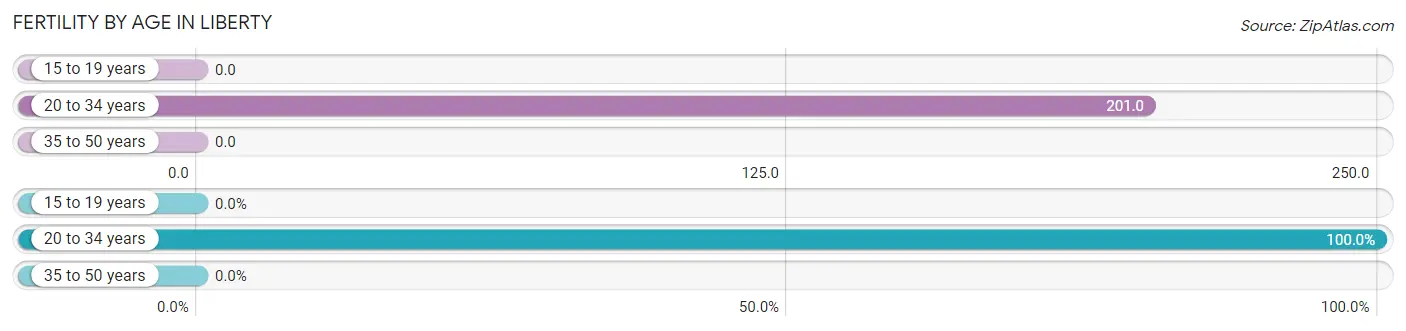
Fertility by Age in Liberty
Average fertility rate in Liberty is 101.0 births per 1,000 women. Women in the age bracket of 20 to 34 years have the highest fertility rate with 201.0 births per 1,000 women. Women in the age bracket of 20 to 34 years acount for 100.0% of all women with births.
| Age Bracket | Women with Births | Births / 1,000 Women |
| 15 to 19 years | 0 (0.0%) | 0.0 |
| 20 to 34 years | 119 (100.0%) | 201.0 |
| 35 to 50 years | 0 (0.0%) | 0.0 |
| Total | 119 (100.0%) | 101.0 |
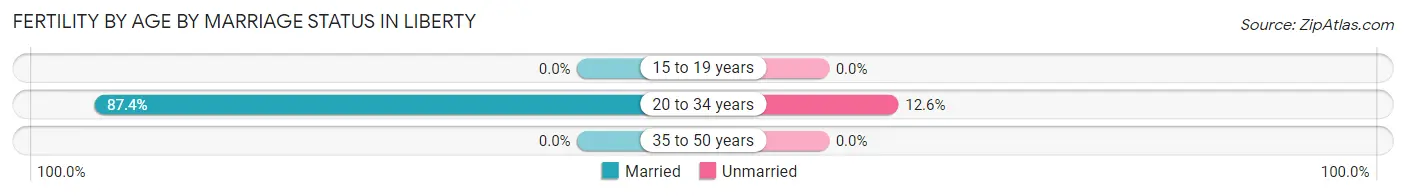
Fertility by Age by Marriage Status in Liberty
87.4% of women with births (119) in Liberty are married. The highest percentage of unmarried women with births falls into 20 to 34 years age bracket with 12.6% of them unmarried at the time of birth, while the lowest percentage of unmarried women with births belong to 20 to 34 years age bracket with 12.6% of them unmarried.
| Age Bracket | Married | Unmarried |
| 15 to 19 years | 0 (0.0%) | 0 (0.0%) |
| 20 to 34 years | 104 (87.4%) | 15 (12.6%) |
| 35 to 50 years | 0 (0.0%) | 0 (0.0%) |
| Total | 104 (87.4%) | 15 (12.6%) |
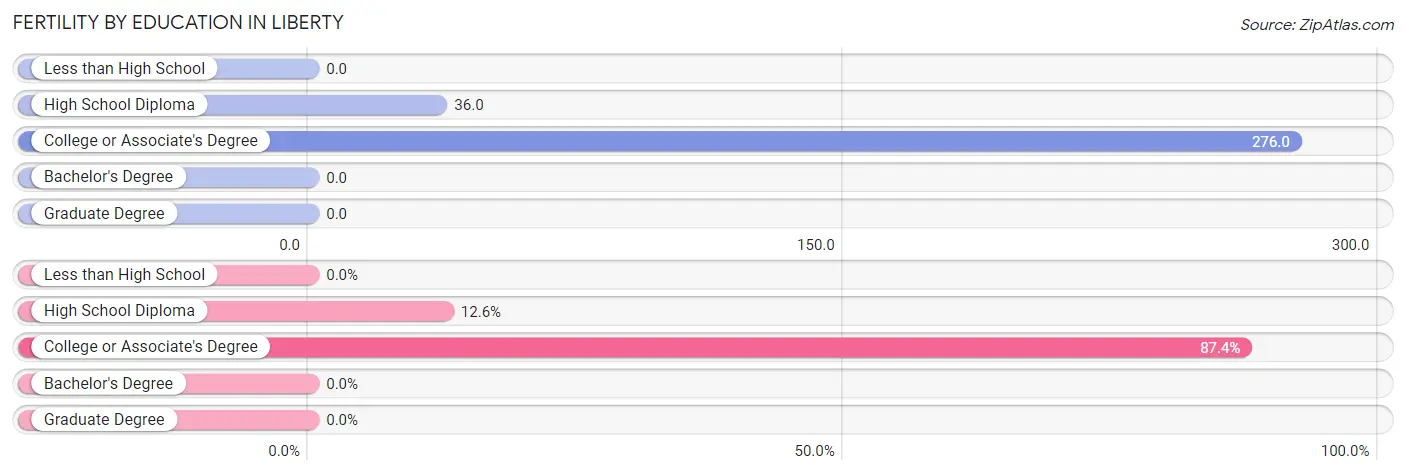
Fertility by Education in Liberty
| Educational Attainment | Women with Births | Births / 1,000 Women |
| Less than High School | 0 (0.0%) | 0.0 |
| High School Diploma | 15 (12.6%) | 36.0 |
| College or Associate's Degree | 104 (87.4%) | 276.0 |
| Bachelor's Degree | 0 (0.0%) | 0.0 |
| Graduate Degree | 0 (0.0%) | 0.0 |
| Total | 119 (100.0%) | 101.0 |
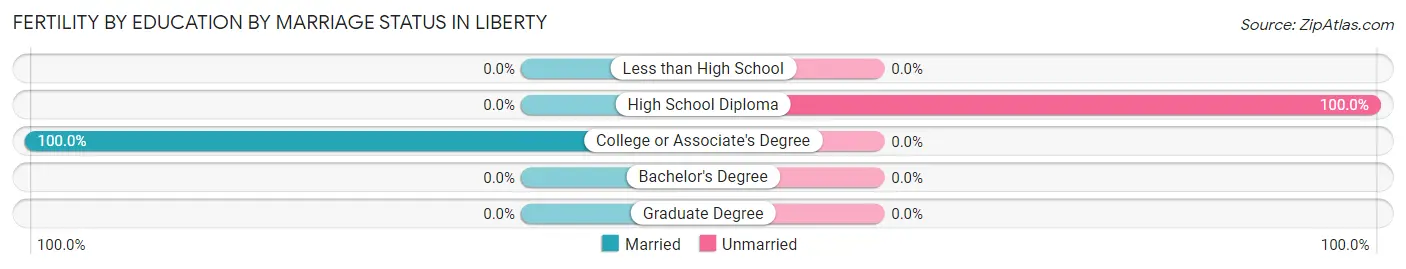
Fertility by Education by Marriage Status in Liberty
12.6% of women with births in Liberty are unmarried. Women with the educational attainment of college or associate's degree are most likely to be married with 100.0% of them married at childbirth, while women with the educational attainment of high school diploma are least likely to be married with 100.0% of them unmarried at childbirth.
| Educational Attainment | Married | Unmarried |
| Less than High School | 0 (0.0%) | 0 (0.0%) |
| High School Diploma | 0 (0.0%) | 15 (100.0%) |
| College or Associate's Degree | 104 (100.0%) | 0 (0.0%) |
| Bachelor's Degree | 0 (0.0%) | 0 (0.0%) |
| Graduate Degree | 0 (0.0%) | 0 (0.0%) |
| Total | 104 (87.4%) | 15 (12.6%) |
Income in Liberty
Income Overview in Liberty
Per Capita Income in Liberty is $21,472, while median incomes of families and households are $52,712 and $43,594 respectively.
| Characteristic | Number | Measure |
| Per Capita Income | 5,030 | $21,472 |
| Median Family Income | 972 | $52,712 |
| Mean Family Income | 972 | $72,051 |
| Median Household Income | 1,707 | $43,594 |
| Mean Household Income | 1,707 | $59,873 |
| Income Deficit | 972 | $0 |
| Wage / Income Gap (%) | 5,030 | 2.78% |
| Wage / Income Gap ($) | 5,030 | 97.22¢ per $1 |
| Gini / Inequality Index | 5,030 | 0.44 |
Earnings by Sex in Liberty
Average Earnings in Liberty are $29,167, $28,803 for men and $29,628 for women, a difference of 2.8%.
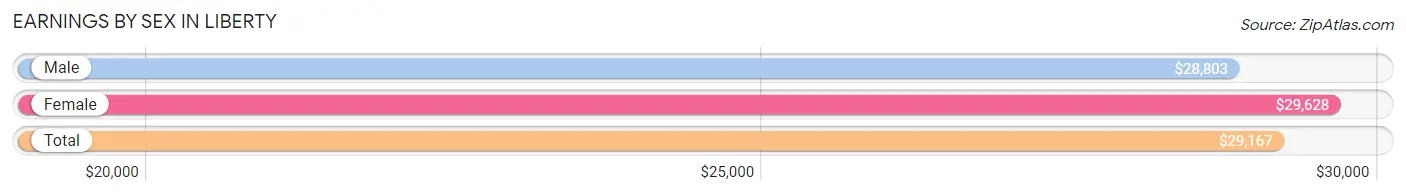
| Sex | Number | Average Earnings |
| Male | 1,167 (49.2%) | $28,803 |
| Female | 1,205 (50.8%) | $29,628 |
| Total | 2,372 (100.0%) | $29,167 |
Earnings by Sex by Income Bracket in Liberty
The most common earnings brackets in Liberty are $12,500 to $14,999 for men (154 | 13.2%) and $2,499 or less for women (210 | 17.4%).
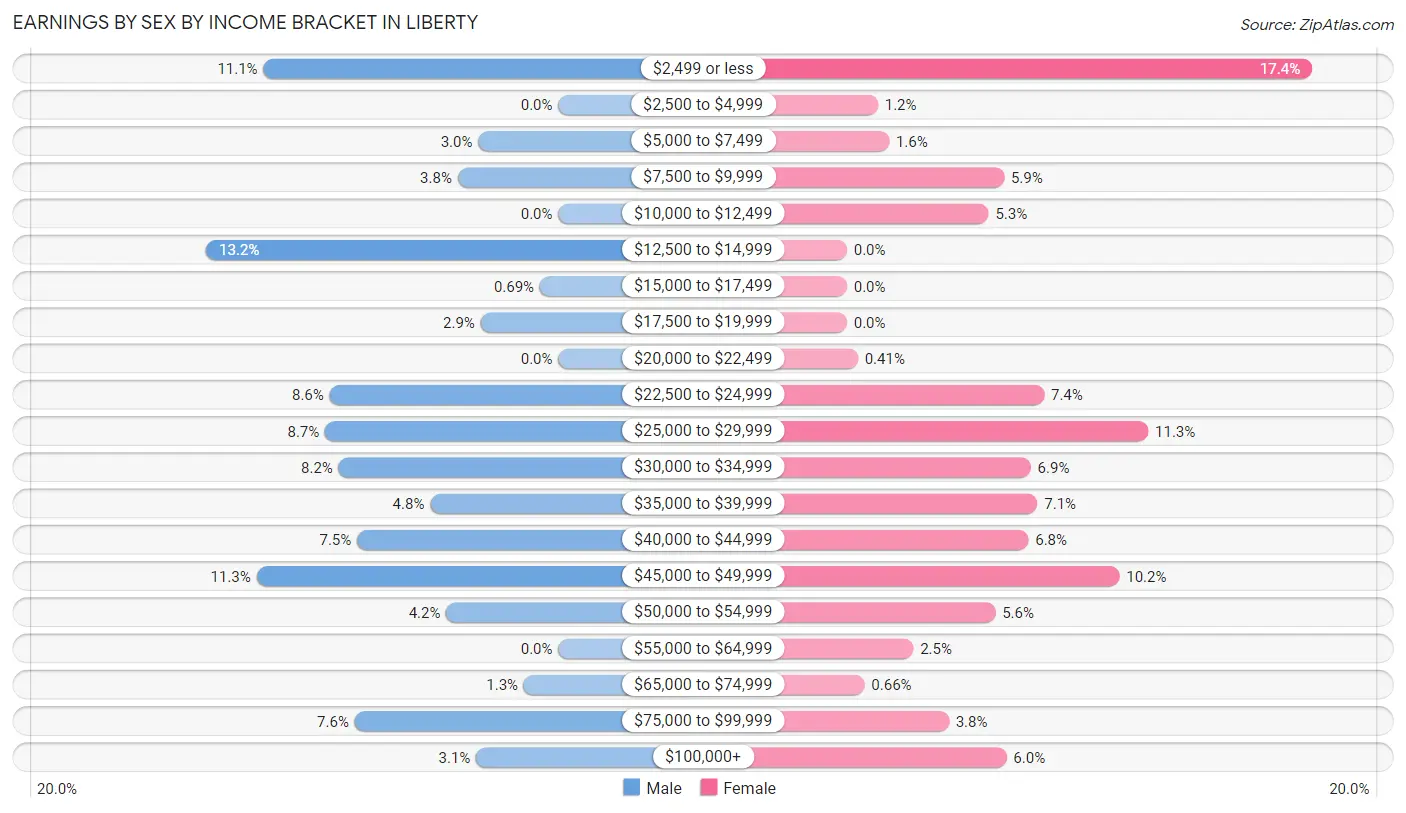
| Income | Male | Female |
| $2,499 or less | 129 (11.1%) | 210 (17.4%) |
| $2,500 to $4,999 | 0 (0.0%) | 14 (1.2%) |
| $5,000 to $7,499 | 35 (3.0%) | 19 (1.6%) |
| $7,500 to $9,999 | 44 (3.8%) | 71 (5.9%) |
| $10,000 to $12,499 | 0 (0.0%) | 64 (5.3%) |
| $12,500 to $14,999 | 154 (13.2%) | 0 (0.0%) |
| $15,000 to $17,499 | 8 (0.7%) | 0 (0.0%) |
| $17,500 to $19,999 | 34 (2.9%) | 0 (0.0%) |
| $20,000 to $22,499 | 0 (0.0%) | 5 (0.4%) |
| $22,500 to $24,999 | 100 (8.6%) | 89 (7.4%) |
| $25,000 to $29,999 | 102 (8.7%) | 136 (11.3%) |
| $30,000 to $34,999 | 96 (8.2%) | 83 (6.9%) |
| $35,000 to $39,999 | 56 (4.8%) | 86 (7.1%) |
| $40,000 to $44,999 | 88 (7.5%) | 82 (6.8%) |
| $45,000 to $49,999 | 132 (11.3%) | 123 (10.2%) |
| $50,000 to $54,999 | 49 (4.2%) | 67 (5.6%) |
| $55,000 to $64,999 | 0 (0.0%) | 30 (2.5%) |
| $65,000 to $74,999 | 15 (1.3%) | 8 (0.7%) |
| $75,000 to $99,999 | 89 (7.6%) | 46 (3.8%) |
| $100,000+ | 36 (3.1%) | 72 (6.0%) |
| Total | 1,167 (100.0%) | 1,205 (100.0%) |
Earnings by Sex by Educational Attainment in Liberty
Average earnings in Liberty are $27,846 for men and $34,000 for women, a difference of 18.1%. Men with an educational attainment of college or associate's degree enjoy the highest average annual earnings of $45,515, while those with bachelor's degree education earn the least with $9,034. Women with an educational attainment of college or associate's degree earn the most with the average annual earnings of $39,072, while those with high school diploma education have the smallest earnings of $28,547.
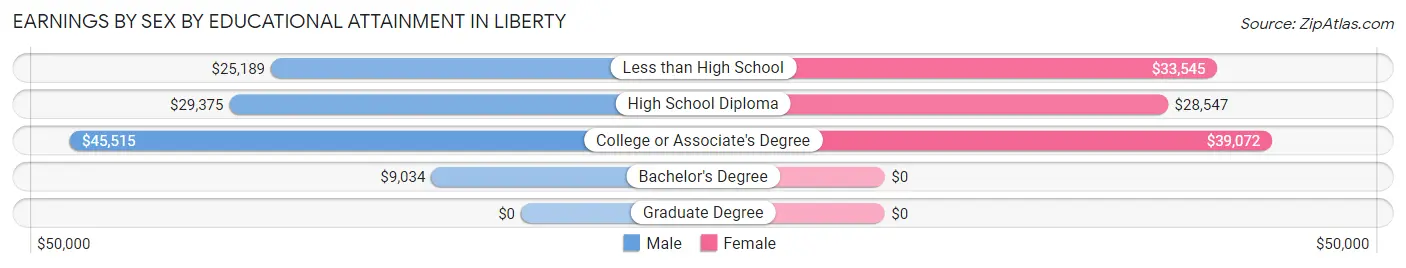
| Educational Attainment | Male Income | Female Income |
| Less than High School | $25,189 | $33,545 |
| High School Diploma | $29,375 | $28,547 |
| College or Associate's Degree | $45,515 | $39,072 |
| Bachelor's Degree | $9,034 | $0 |
| Graduate Degree | - | - |
| Total | $27,846 | $34,000 |
Family Income in Liberty
Family Income Brackets in Liberty
According to the Liberty family income data, there are 277 families falling into the $35,000 to $49,999 income range, which is the most common income bracket and makes up 28.5% of all families. Conversely, the $150,000 to $199,999 income bracket is the least frequent group with only 17 families (1.8%) belonging to this category.
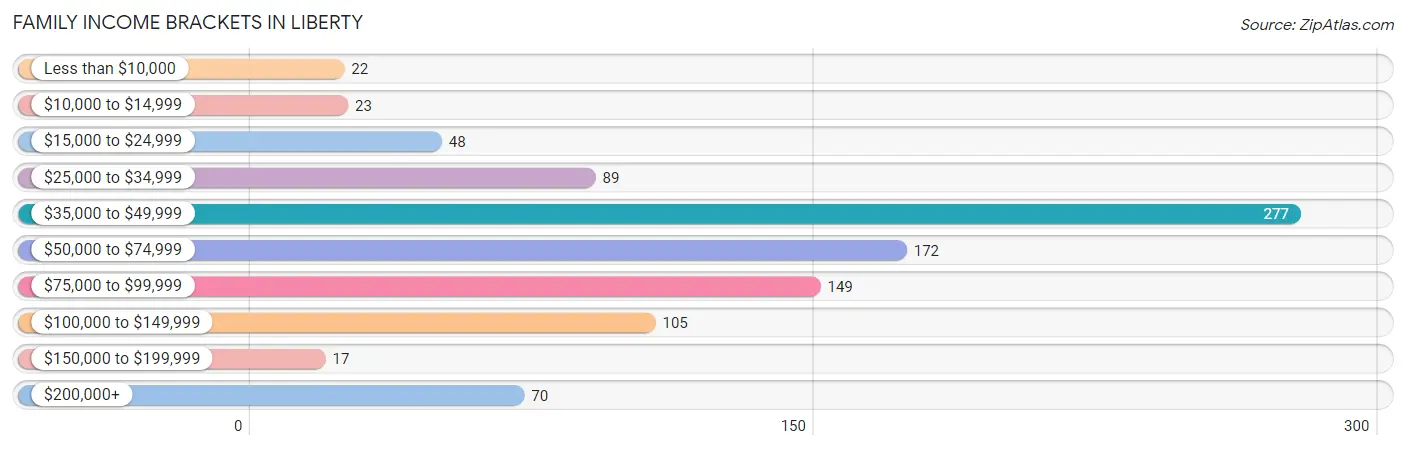
| Income Bracket | # Families | % Families |
| Less than $10,000 | 22 | 2.3% |
| $10,000 to $14,999 | 23 | 2.4% |
| $15,000 to $24,999 | 48 | 4.9% |
| $25,000 to $34,999 | 89 | 9.2% |
| $35,000 to $49,999 | 277 | 28.5% |
| $50,000 to $74,999 | 172 | 17.7% |
| $75,000 to $99,999 | 149 | 15.3% |
| $100,000 to $149,999 | 105 | 10.8% |
| $150,000 to $199,999 | 17 | 1.7% |
| $200,000+ | 70 | 7.2% |
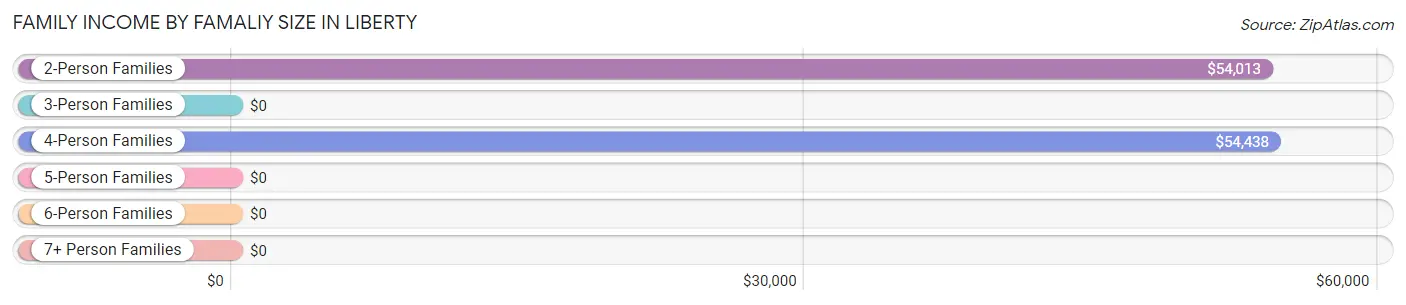
Family Income by Famaliy Size in Liberty
4-person families (258 | 26.5%) account for the highest median family income in Liberty with $54,438 per family, while 2-person families (177 | 18.2%) have the highest median income of $27,006 per family member.
| Income Bracket | # Families | Median Income |
| 2-Person Families | 177 (18.2%) | $54,013 |
| 3-Person Families | 339 (34.9%) | $0 |
| 4-Person Families | 258 (26.5%) | $54,438 |
| 5-Person Families | 155 (16.0%) | $0 |
| 6-Person Families | 43 (4.4%) | $0 |
| 7+ Person Families | 0 (0.0%) | $0 |
| Total | 972 (100.0%) | $52,712 |
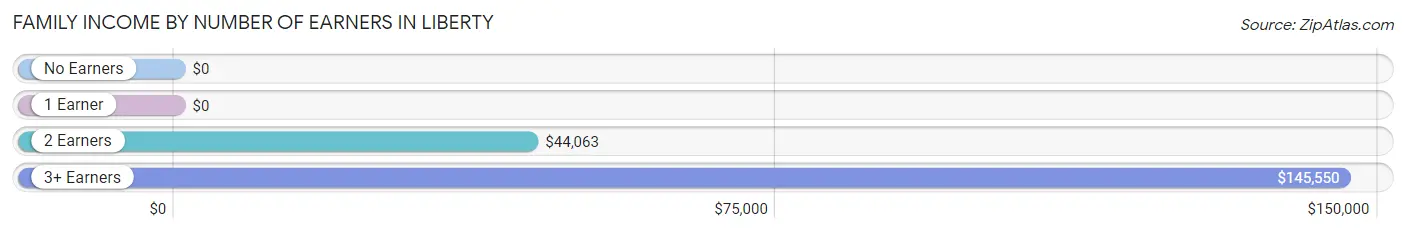
Family Income by Number of Earners in Liberty
| Number of Earners | # Families | Median Income |
| No Earners | 57 (5.9%) | $0 |
| 1 Earner | 188 (19.3%) | $0 |
| 2 Earners | 586 (60.3%) | $44,063 |
| 3+ Earners | 141 (14.5%) | $145,550 |
| Total | 972 (100.0%) | $52,712 |
Household Income in Liberty
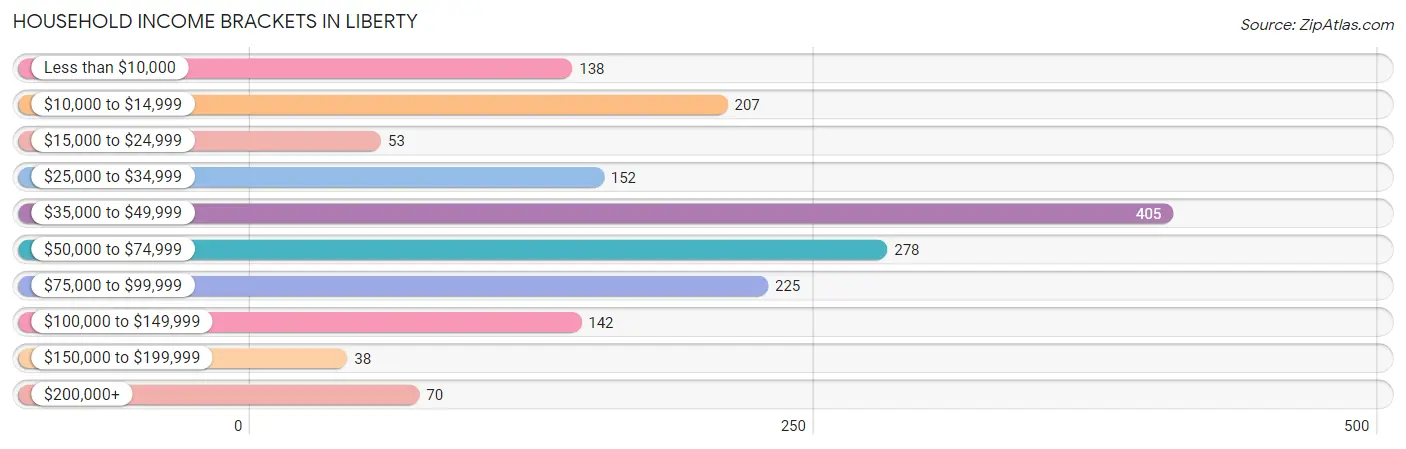
Household Income Brackets in Liberty
With 405 households falling in the category, the $35,000 to $49,999 income range is the most frequent in Liberty, accounting for 23.7% of all households. In contrast, only 38 households (2.2%) fall into the $150,000 to $199,999 income bracket, making it the least populous group.
| Income Bracket | # Households | % Households |
| Less than $10,000 | 138 | 8.1% |
| $10,000 to $14,999 | 207 | 12.1% |
| $15,000 to $24,999 | 53 | 3.1% |
| $25,000 to $34,999 | 152 | 8.9% |
| $35,000 to $49,999 | 405 | 23.7% |
| $50,000 to $74,999 | 278 | 16.3% |
| $75,000 to $99,999 | 225 | 13.2% |
| $100,000 to $149,999 | 142 | 8.3% |
| $150,000 to $199,999 | 38 | 2.2% |
| $200,000+ | 70 | 4.1% |
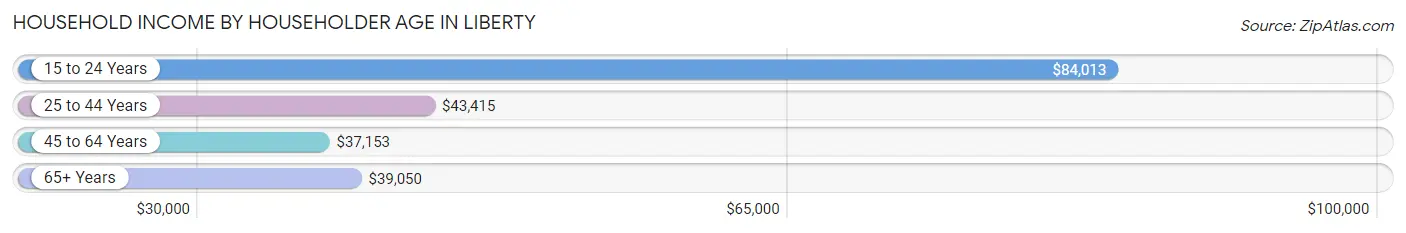
Household Income by Householder Age in Liberty
The median household income in Liberty is $43,594, with the highest median household income of $84,013 found in the 15 to 24 years age bracket for the primary householder. A total of 83 households (4.9%) fall into this category. Meanwhile, the 45 to 64 years age bracket for the primary householder has the lowest median household income of $37,153, with 770 households (45.1%) in this group.
| Income Bracket | # Households | Median Income |
| 15 to 24 Years | 83 (4.9%) | $84,013 |
| 25 to 44 Years | 511 (29.9%) | $43,415 |
| 45 to 64 Years | 770 (45.1%) | $37,153 |
| 65+ Years | 343 (20.1%) | $39,050 |
| Total | 1,707 (100.0%) | $43,594 |
Poverty in Liberty
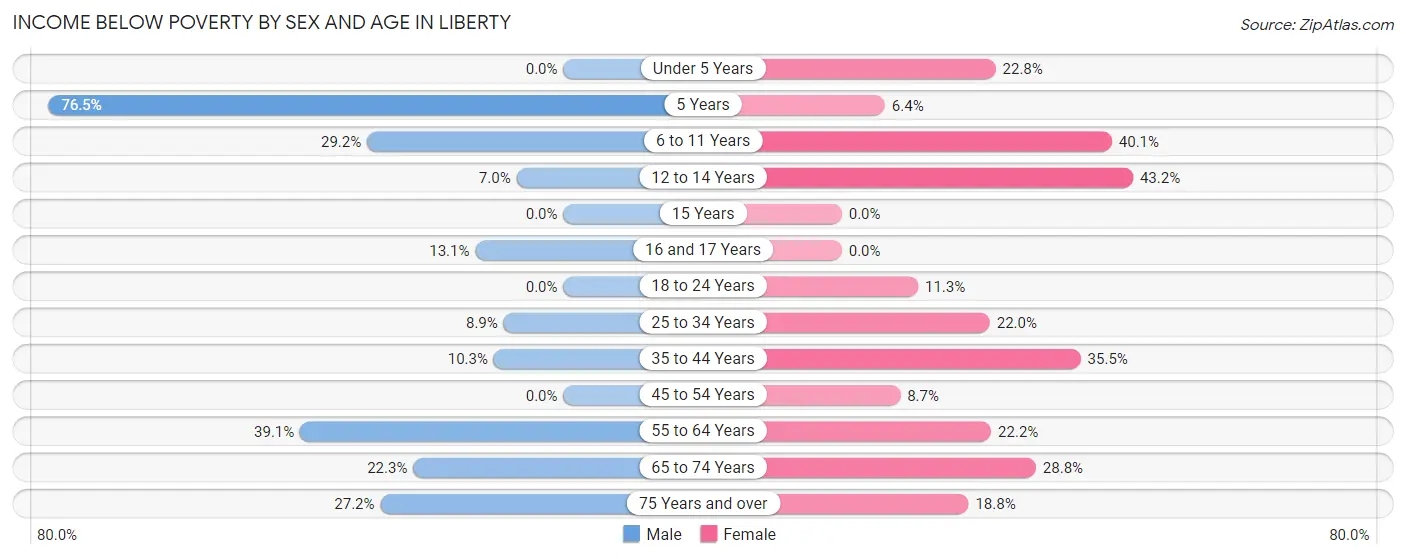
Income Below Poverty by Sex and Age in Liberty
With 14.7% poverty level for males and 20.1% for females among the residents of Liberty, 5 year old males and 12 to 14 year old females are the most vulnerable to poverty, with 13 males (76.5%) and 16 females (43.2%) in their respective age groups living below the poverty level.
| Age Bracket | Male | Female |
| Under 5 Years | 0 (0.0%) | 53 (22.8%) |
| 5 Years | 13 (76.5%) | 16 (6.4%) |
| 6 to 11 Years | 65 (29.1%) | 77 (40.1%) |
| 12 to 14 Years | 8 (7.0%) | 16 (43.2%) |
| 15 Years | 0 (0.0%) | 0 (0.0%) |
| 16 and 17 Years | 14 (13.1%) | 0 (0.0%) |
| 18 to 24 Years | 0 (0.0%) | 36 (11.3%) |
| 25 to 34 Years | 37 (8.9%) | 82 (22.0%) |
| 35 to 44 Years | 22 (10.3%) | 72 (35.5%) |
| 45 to 54 Years | 0 (0.0%) | 28 (8.7%) |
| 55 to 64 Years | 129 (39.1%) | 63 (22.2%) |
| 65 to 74 Years | 35 (22.3%) | 49 (28.8%) |
| 75 Years and over | 25 (27.2%) | 19 (18.8%) |
| Total | 348 (14.7%) | 511 (20.1%) |
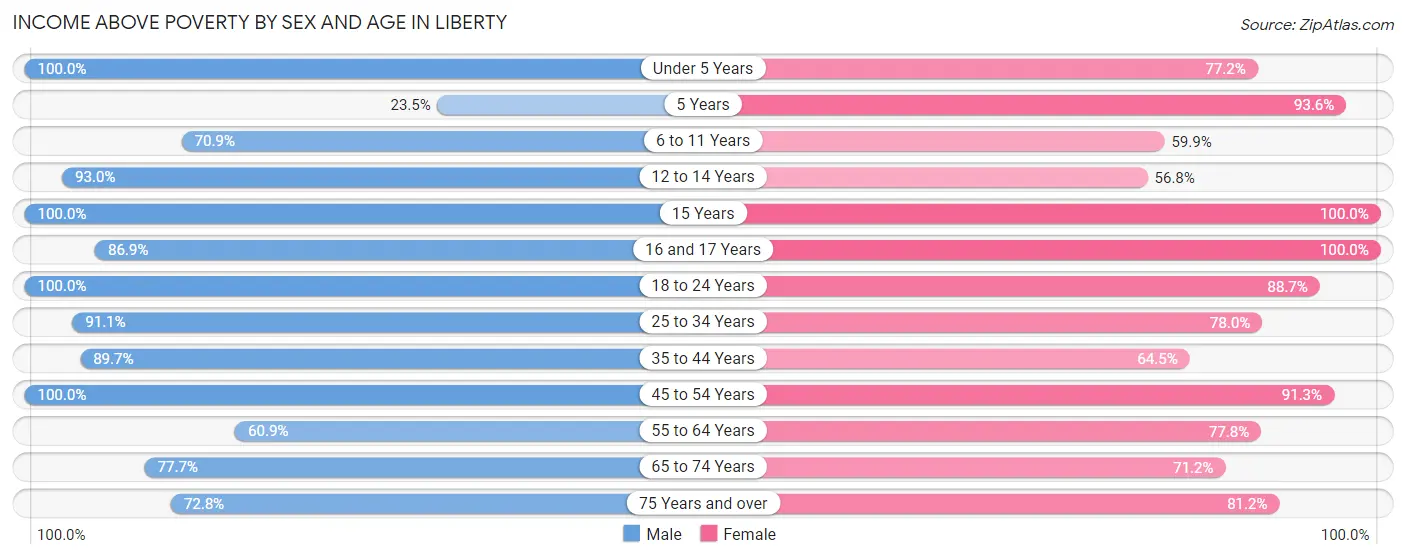
Income Above Poverty by Sex and Age in Liberty
According to the poverty statistics in Liberty, males aged under 5 years and females aged 15 years are the age groups that are most secure financially, with 100.0% of males and 100.0% of females in these age groups living above the poverty line.
| Age Bracket | Male | Female |
| Under 5 Years | 244 (100.0%) | 179 (77.2%) |
| 5 Years | 4 (23.5%) | 234 (93.6%) |
| 6 to 11 Years | 158 (70.9%) | 115 (59.9%) |
| 12 to 14 Years | 107 (93.0%) | 21 (56.8%) |
| 15 Years | 13 (100.0%) | 40 (100.0%) |
| 16 and 17 Years | 93 (86.9%) | 17 (100.0%) |
| 18 to 24 Years | 205 (100.0%) | 282 (88.7%) |
| 25 to 34 Years | 380 (91.1%) | 291 (78.0%) |
| 35 to 44 Years | 191 (89.7%) | 131 (64.5%) |
| 45 to 54 Years | 237 (100.0%) | 295 (91.3%) |
| 55 to 64 Years | 201 (60.9%) | 221 (77.8%) |
| 65 to 74 Years | 122 (77.7%) | 121 (71.2%) |
| 75 Years and over | 67 (72.8%) | 82 (81.2%) |
| Total | 2,022 (85.3%) | 2,029 (79.9%) |
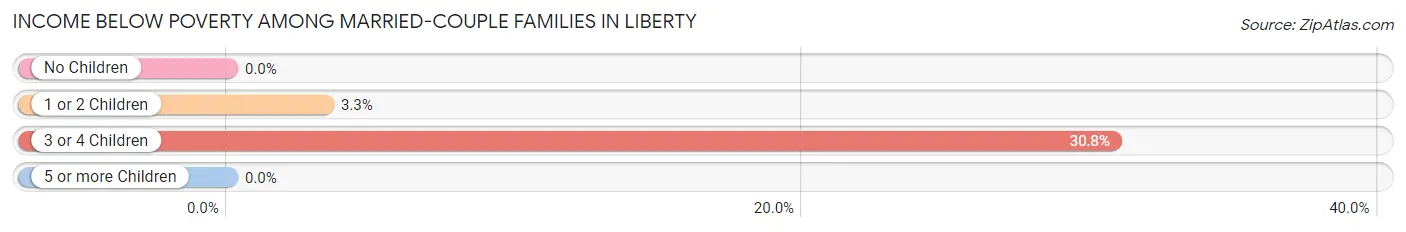
Income Below Poverty Among Married-Couple Families in Liberty
The poverty statistics for married-couple families in Liberty show that 7.1% or 43 of the total 608 families live below the poverty line. Families with 3 or 4 children have the highest poverty rate of 30.8%, comprising of 32 families. On the other hand, families with no children have the lowest poverty rate of 0.0%, which includes 0 families.
| Children | Above Poverty | Below Poverty |
| No Children | 175 (100.0%) | 0 (0.0%) |
| 1 or 2 Children | 318 (96.7%) | 11 (3.3%) |
| 3 or 4 Children | 72 (69.2%) | 32 (30.8%) |
| 5 or more Children | 0 (0.0%) | 0 (0.0%) |
| Total | 565 (92.9%) | 43 (7.1%) |
Income Below Poverty Among Single-Parent Households in Liberty
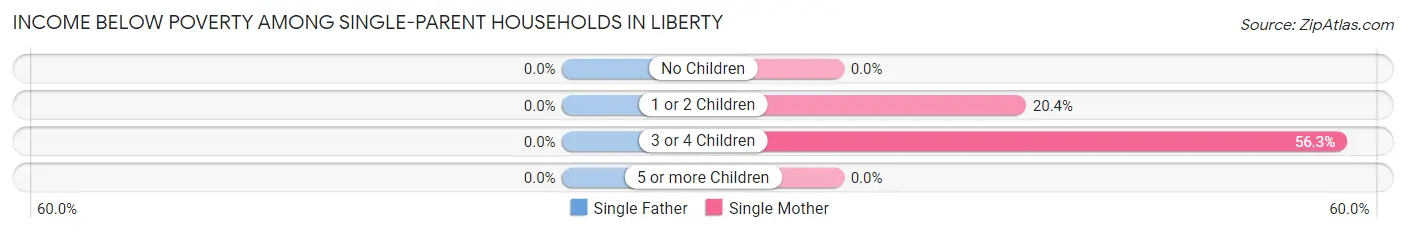
| Children | Single Father | Single Mother |
| No Children | 0 (0.0%) | 0 (0.0%) |
| 1 or 2 Children | 0 (0.0%) | 34 (20.4%) |
| 3 or 4 Children | 0 (0.0%) | 36 (56.2%) |
| 5 or more Children | 0 (0.0%) | 0 (0.0%) |
| Total | 0 (0.0%) | 70 (26.4%) |
Income Below Poverty Among Married-Couple vs Single-Parent Households in Liberty
The poverty data for Liberty shows that 43 of the married-couple family households (7.1%) and 70 of the single-parent households (19.2%) are living below the poverty level. Within the married-couple family households, those with 3 or 4 children have the highest poverty rate, with 32 households (30.8%) falling below the poverty line. Among the single-parent households, those with 3 or 4 children have the highest poverty rate, with 36 household (56.2%) living below poverty.
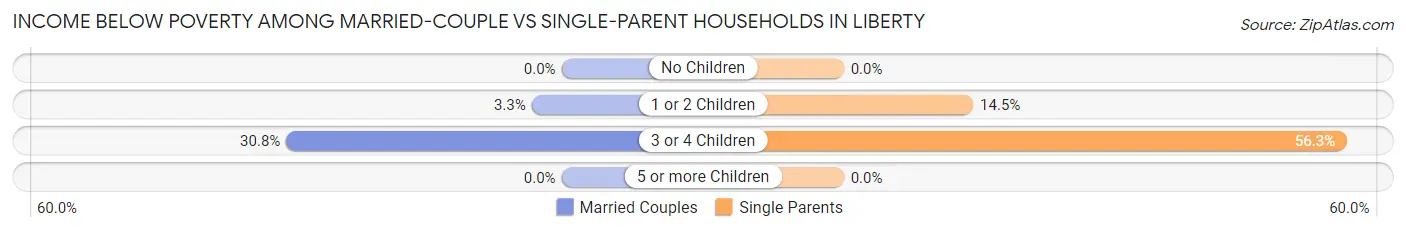
| Children | Married-Couple Families | Single-Parent Households |
| No Children | 0 (0.0%) | 0 (0.0%) |
| 1 or 2 Children | 11 (3.3%) | 34 (14.5%) |
| 3 or 4 Children | 32 (30.8%) | 36 (56.2%) |
| 5 or more Children | 0 (0.0%) | 0 (0.0%) |
| Total | 43 (7.1%) | 70 (19.2%) |
Employment Characteristics in Liberty
Employment by Class of Employer in Liberty
Among the 1,895 employed individuals in Liberty, private company employees (1,358 | 71.7%), local government employees (187 | 9.9%), and not-for-profit organizations (185 | 9.8%) make up the most common classes of employment.
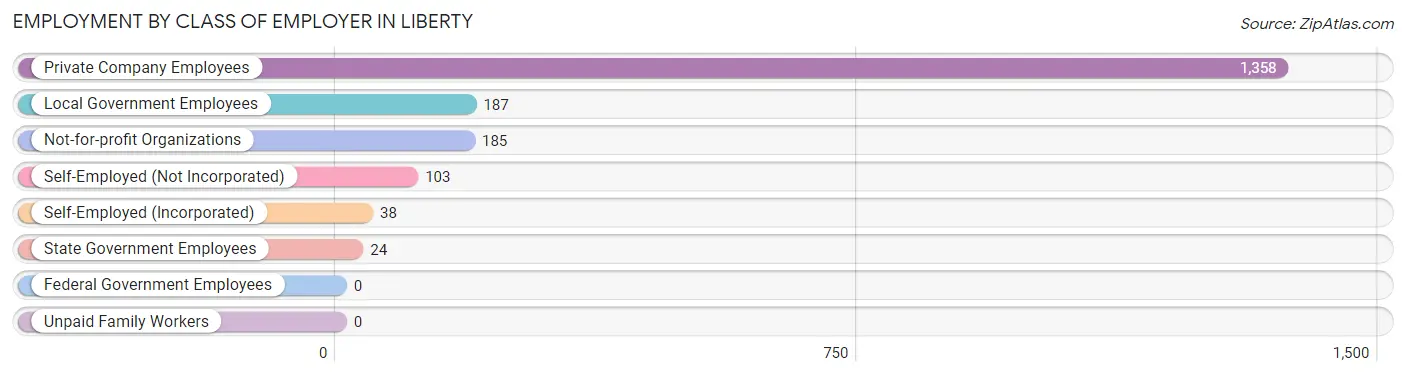
| Employer Class | # Employees | % Employees |
| Private Company Employees | 1,358 | 71.7% |
| Self-Employed (Incorporated) | 38 | 2.0% |
| Self-Employed (Not Incorporated) | 103 | 5.4% |
| Not-for-profit Organizations | 185 | 9.8% |
| Local Government Employees | 187 | 9.9% |
| State Government Employees | 24 | 1.3% |
| Federal Government Employees | 0 | 0.0% |
| Unpaid Family Workers | 0 | 0.0% |
| Total | 1,895 | 100.0% |
Employment Status by Age in Liberty
According to the labor force statistics for Liberty, out of the total population over 16 years of age (3,667), 57.4% or 2,105 individuals are in the labor force, with 7.6% or 160 of them unemployed. The age group with the highest labor force participation rate is 35 to 44 years, with 95.2% or 396 individuals in the labor force. Within the labor force, the 65 to 74 years age range has the highest percentage of unemployed individuals, with 43.3% or 52 of them being unemployed.
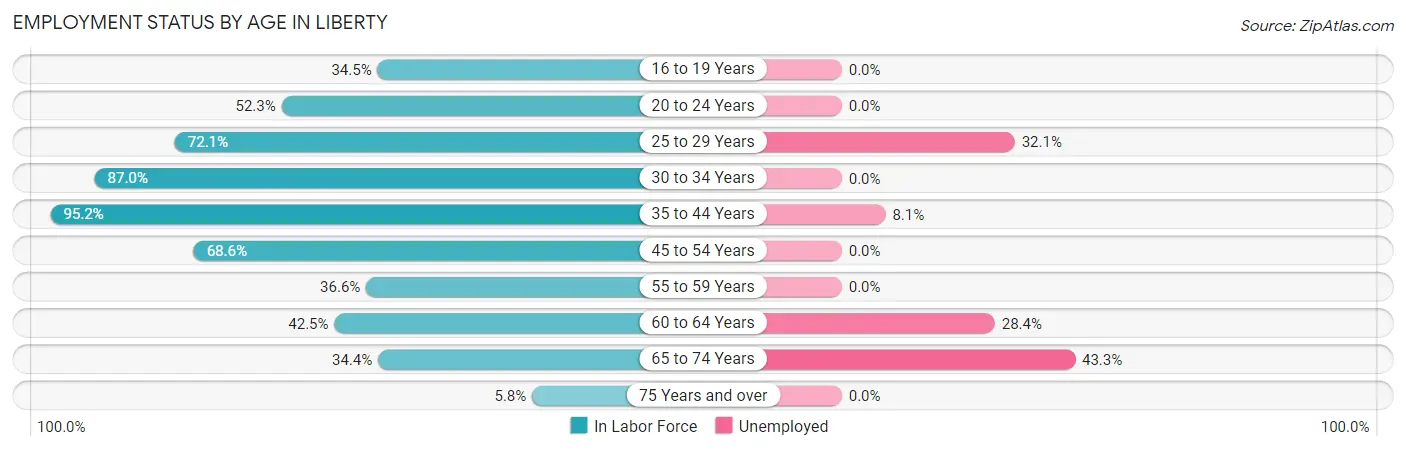
| Age Bracket | In Labor Force | Unemployed |
| 16 to 19 Years | 128 (34.5%) | 0 (0.0%) |
| 20 to 24 Years | 147 (52.3%) | 0 (0.0%) |
| 25 to 29 Years | 137 (72.1%) | 44 (32.1%) |
| 30 to 34 Years | 531 (87.0%) | 0 (0.0%) |
| 35 to 44 Years | 396 (95.2%) | 32 (8.1%) |
| 45 to 54 Years | 384 (68.6%) | 0 (0.0%) |
| 55 to 59 Years | 131 (36.6%) | 0 (0.0%) |
| 60 to 64 Years | 116 (42.5%) | 33 (28.4%) |
| 65 to 74 Years | 120 (34.4%) | 52 (43.3%) |
| 75 Years and over | 15 (5.8%) | 0 (0.0%) |
| Total | 2,105 (57.4%) | 160 (7.6%) |
Employment Status by Educational Attainment in Liberty
According to labor force statistics for Liberty, 70.4% of individuals (1,695) out of the total population between 25 and 64 years of age (2,407) are in the labor force, with 6.4% or 108 of them being unemployed. The group with the highest labor force participation rate are those with the educational attainment of college / associate degree, with 86.7% or 458 individuals in the labor force. Within the labor force, individuals with bachelor's degree or higher education have the highest percentage of unemployment, with 17.9% or 44 of them being unemployed.
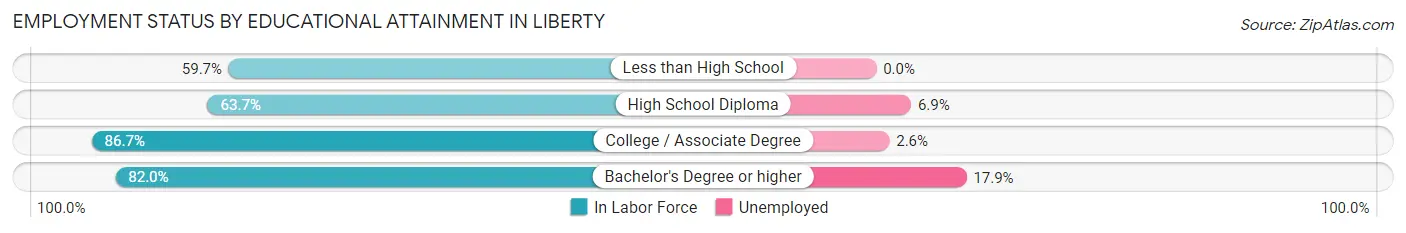
| Educational Attainment | In Labor Force | Unemployed |
| Less than High School | 219 (59.7%) | 0 (0.0%) |
| High School Diploma | 772 (63.7%) | 84 (6.9%) |
| College / Associate Degree | 458 (86.7%) | 14 (2.6%) |
| Bachelor's Degree or higher | 246 (82.0%) | 54 (17.9%) |
| Total | 1,695 (70.4%) | 154 (6.4%) |
Employment Occupations by Sex in Liberty
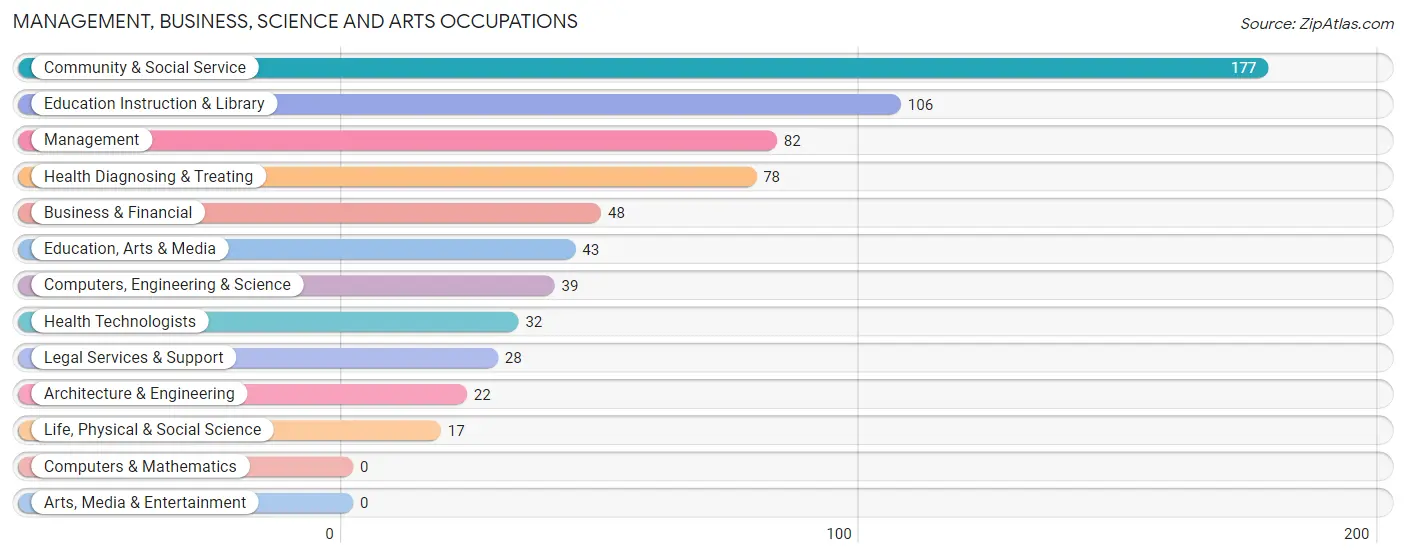
Management, Business, Science and Arts Occupations
The most common Management, Business, Science and Arts occupations in Liberty are Community & Social Service (177 | 9.1%), Education Instruction & Library (106 | 5.4%), Management (82 | 4.2%), Health Diagnosing & Treating (78 | 4.0%), and Business & Financial (48 | 2.5%).
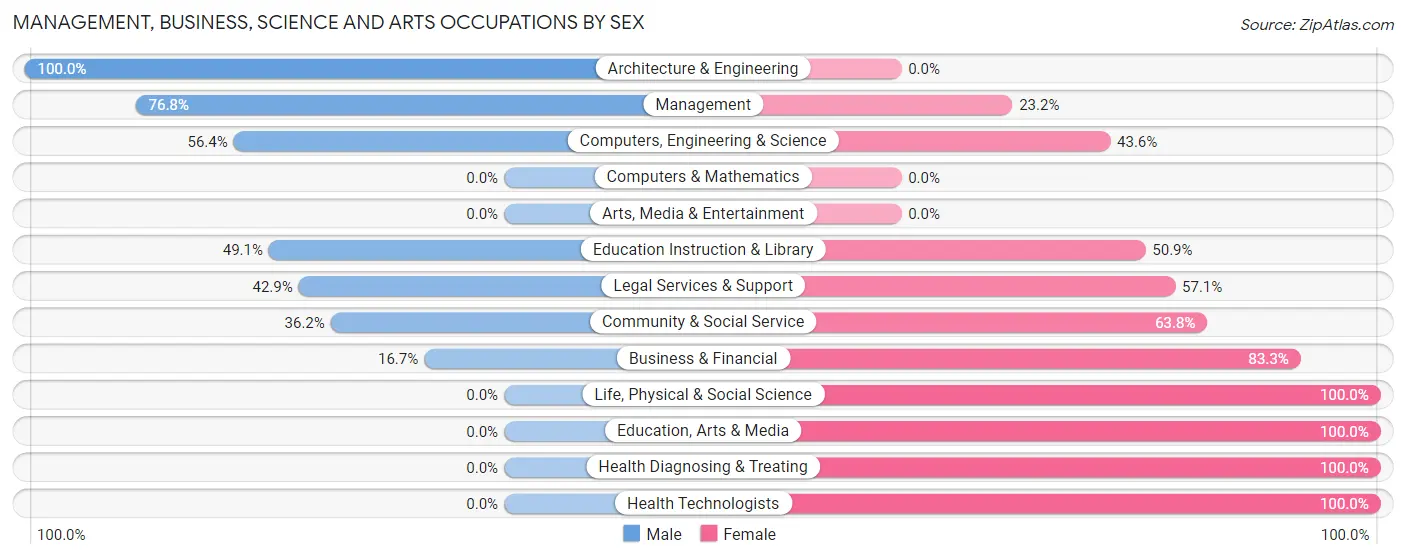
Management, Business, Science and Arts Occupations by Sex
Within the Management, Business, Science and Arts occupations in Liberty, the most male-oriented occupations are Architecture & Engineering (100.0%), Management (76.8%), and Computers, Engineering & Science (56.4%), while the most female-oriented occupations are Life, Physical & Social Science (100.0%), Education, Arts & Media (100.0%), and Health Diagnosing & Treating (100.0%).
| Occupation | Male | Female |
| Management | 63 (76.8%) | 19 (23.2%) |
| Business & Financial | 8 (16.7%) | 40 (83.3%) |
| Computers, Engineering & Science | 22 (56.4%) | 17 (43.6%) |
| Computers & Mathematics | 0 (0.0%) | 0 (0.0%) |
| Architecture & Engineering | 22 (100.0%) | 0 (0.0%) |
| Life, Physical & Social Science | 0 (0.0%) | 17 (100.0%) |
| Community & Social Service | 64 (36.2%) | 113 (63.8%) |
| Education, Arts & Media | 0 (0.0%) | 43 (100.0%) |
| Legal Services & Support | 12 (42.9%) | 16 (57.1%) |
| Education Instruction & Library | 52 (49.1%) | 54 (50.9%) |
| Arts, Media & Entertainment | 0 (0.0%) | 0 (0.0%) |
| Health Diagnosing & Treating | 0 (0.0%) | 78 (100.0%) |
| Health Technologists | 0 (0.0%) | 32 (100.0%) |
| Total (Category) | 157 (37.0%) | 267 (63.0%) |
| Total (Overall) | 979 (50.4%) | 965 (49.6%) |
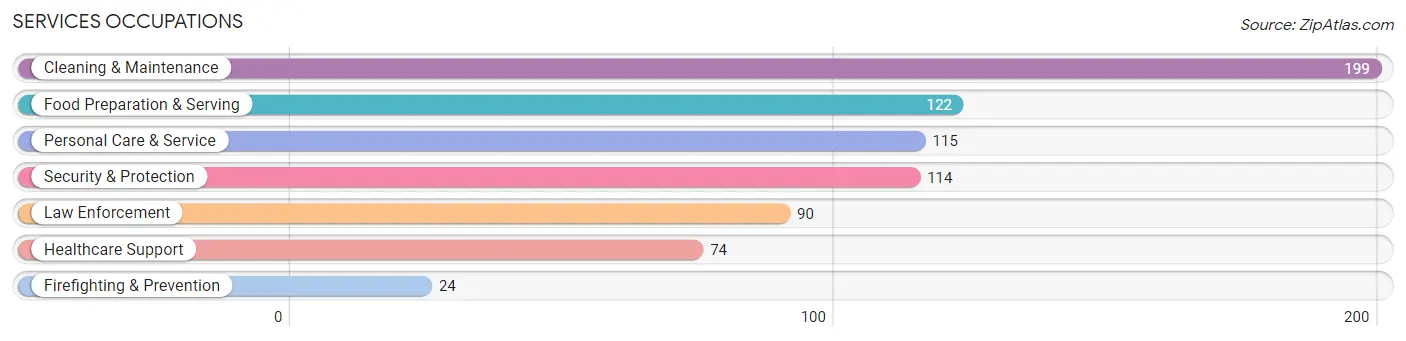
Services Occupations
The most common Services occupations in Liberty are Cleaning & Maintenance (199 | 10.2%), Food Preparation & Serving (122 | 6.3%), Personal Care & Service (115 | 5.9%), Security & Protection (114 | 5.9%), and Law Enforcement (90 | 4.6%).
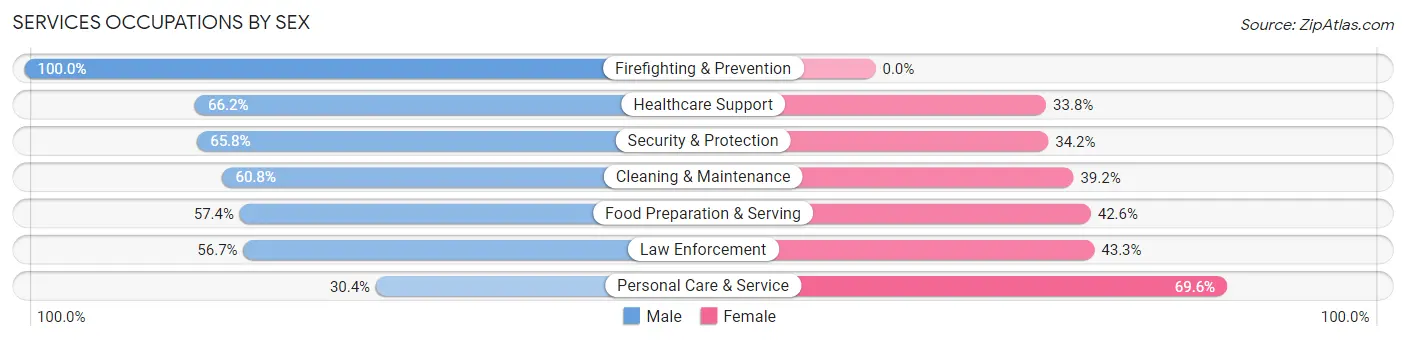
Services Occupations by Sex
Within the Services occupations in Liberty, the most male-oriented occupations are Firefighting & Prevention (100.0%), Healthcare Support (66.2%), and Security & Protection (65.8%), while the most female-oriented occupations are Personal Care & Service (69.6%), Law Enforcement (43.3%), and Food Preparation & Serving (42.6%).
| Occupation | Male | Female |
| Healthcare Support | 49 (66.2%) | 25 (33.8%) |
| Security & Protection | 75 (65.8%) | 39 (34.2%) |
| Firefighting & Prevention | 24 (100.0%) | 0 (0.0%) |
| Law Enforcement | 51 (56.7%) | 39 (43.3%) |
| Food Preparation & Serving | 70 (57.4%) | 52 (42.6%) |
| Cleaning & Maintenance | 121 (60.8%) | 78 (39.2%) |
| Personal Care & Service | 35 (30.4%) | 80 (69.6%) |
| Total (Category) | 350 (56.1%) | 274 (43.9%) |
| Total (Overall) | 979 (50.4%) | 965 (49.6%) |
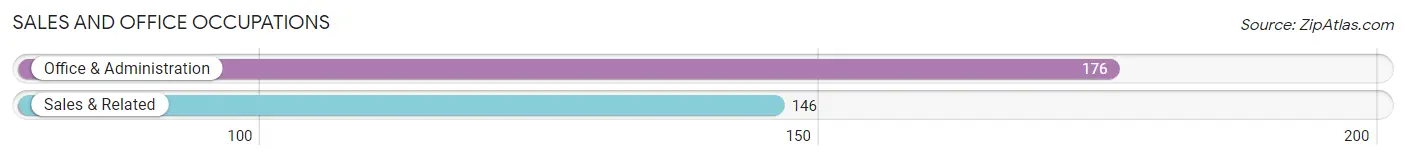
Sales and Office Occupations
The most common Sales and Office occupations in Liberty are Office & Administration (176 | 9.0%), and Sales & Related (146 | 7.5%).
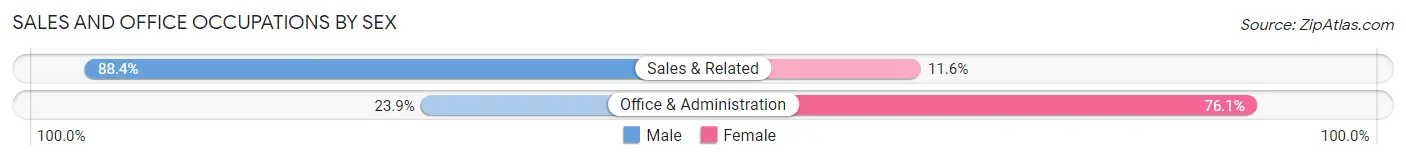
Sales and Office Occupations by Sex
| Occupation | Male | Female |
| Sales & Related | 129 (88.4%) | 17 (11.6%) |
| Office & Administration | 42 (23.9%) | 134 (76.1%) |
| Total (Category) | 171 (53.1%) | 151 (46.9%) |
| Total (Overall) | 979 (50.4%) | 965 (49.6%) |
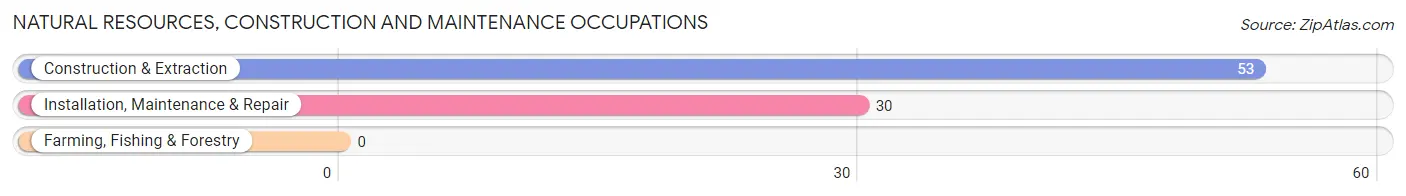
Natural Resources, Construction and Maintenance Occupations
The most common Natural Resources, Construction and Maintenance occupations in Liberty are Construction & Extraction (53 | 2.7%), and Installation, Maintenance & Repair (30 | 1.5%).
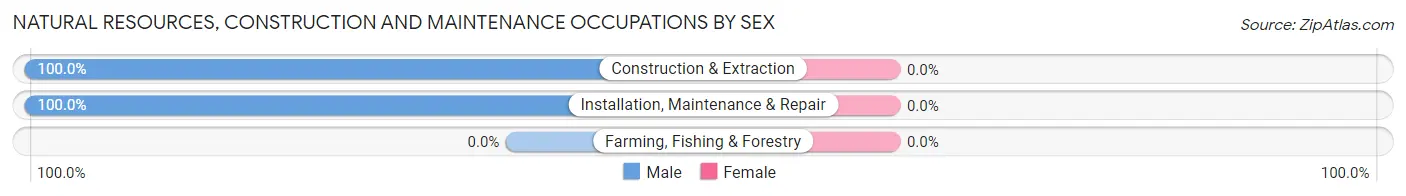
Natural Resources, Construction and Maintenance Occupations by Sex
| Occupation | Male | Female |
| Farming, Fishing & Forestry | 0 (0.0%) | 0 (0.0%) |
| Construction & Extraction | 53 (100.0%) | 0 (0.0%) |
| Installation, Maintenance & Repair | 30 (100.0%) | 0 (0.0%) |
| Total (Category) | 83 (100.0%) | 0 (0.0%) |
| Total (Overall) | 979 (50.4%) | 965 (49.6%) |
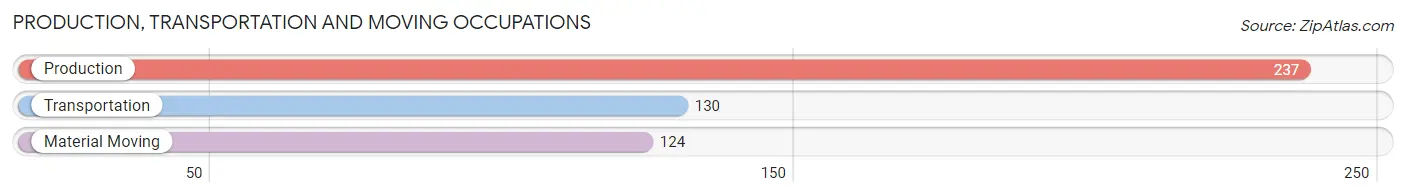
Production, Transportation and Moving Occupations
The most common Production, Transportation and Moving occupations in Liberty are Production (237 | 12.2%), Transportation (130 | 6.7%), and Material Moving (124 | 6.4%).
Production, Transportation and Moving Occupations by Sex
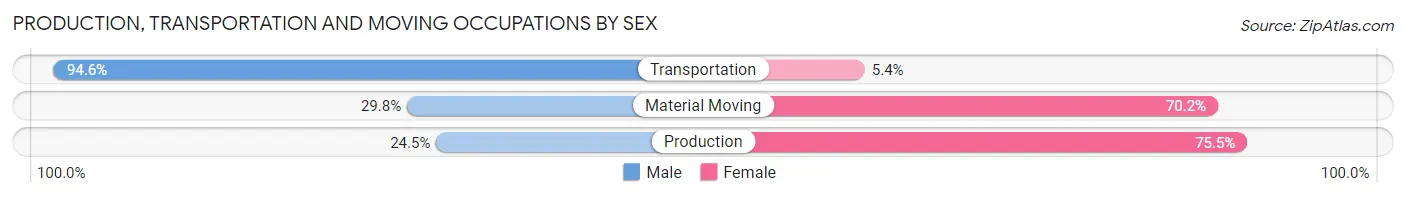
| Occupation | Male | Female |
| Production | 58 (24.5%) | 179 (75.5%) |
| Transportation | 123 (94.6%) | 7 (5.4%) |
| Material Moving | 37 (29.8%) | 87 (70.2%) |
| Total (Category) | 218 (44.4%) | 273 (55.6%) |
| Total (Overall) | 979 (50.4%) | 965 (49.6%) |
Employment Industries by Sex in Liberty
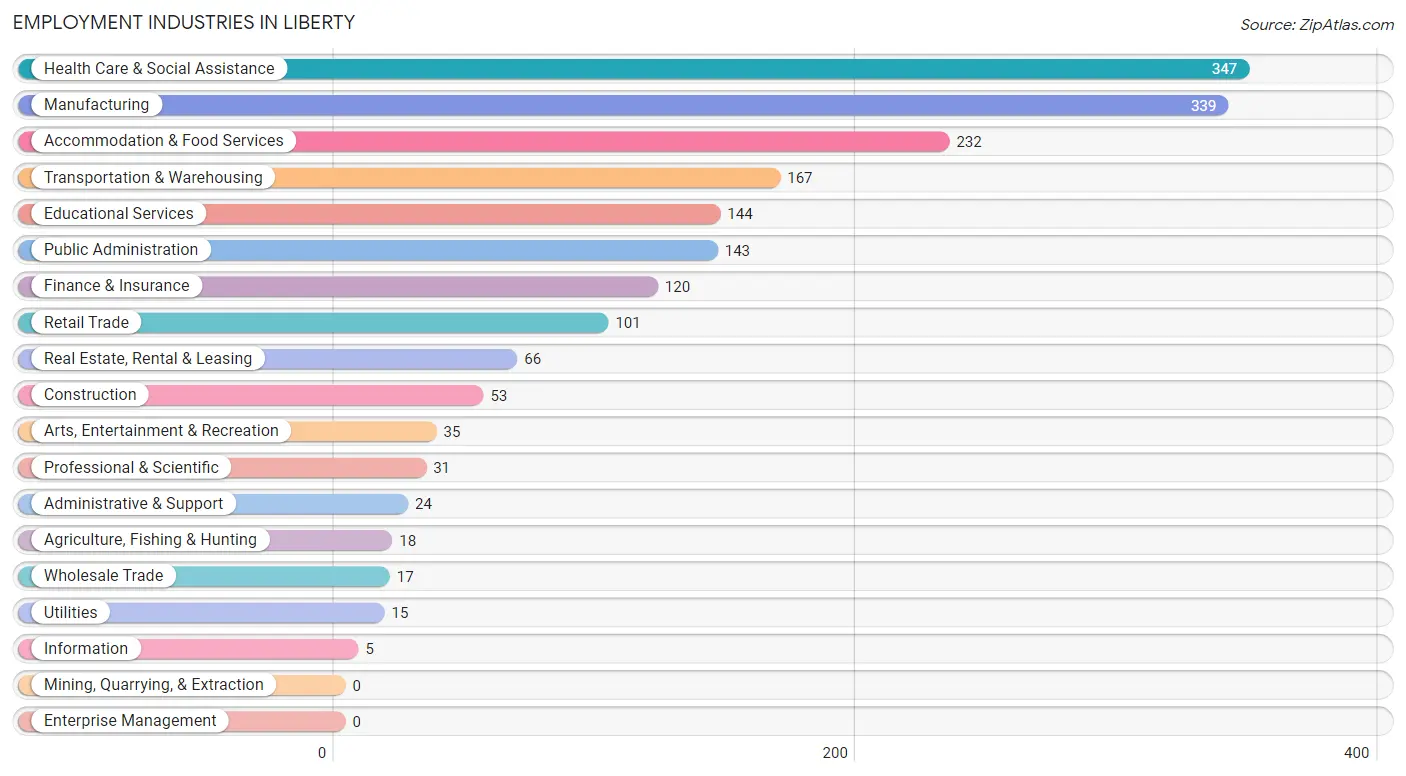
Employment Industries in Liberty
The major employment industries in Liberty include Health Care & Social Assistance (347 | 17.8%), Manufacturing (339 | 17.4%), Accommodation & Food Services (232 | 11.9%), Transportation & Warehousing (167 | 8.6%), and Educational Services (144 | 7.4%).
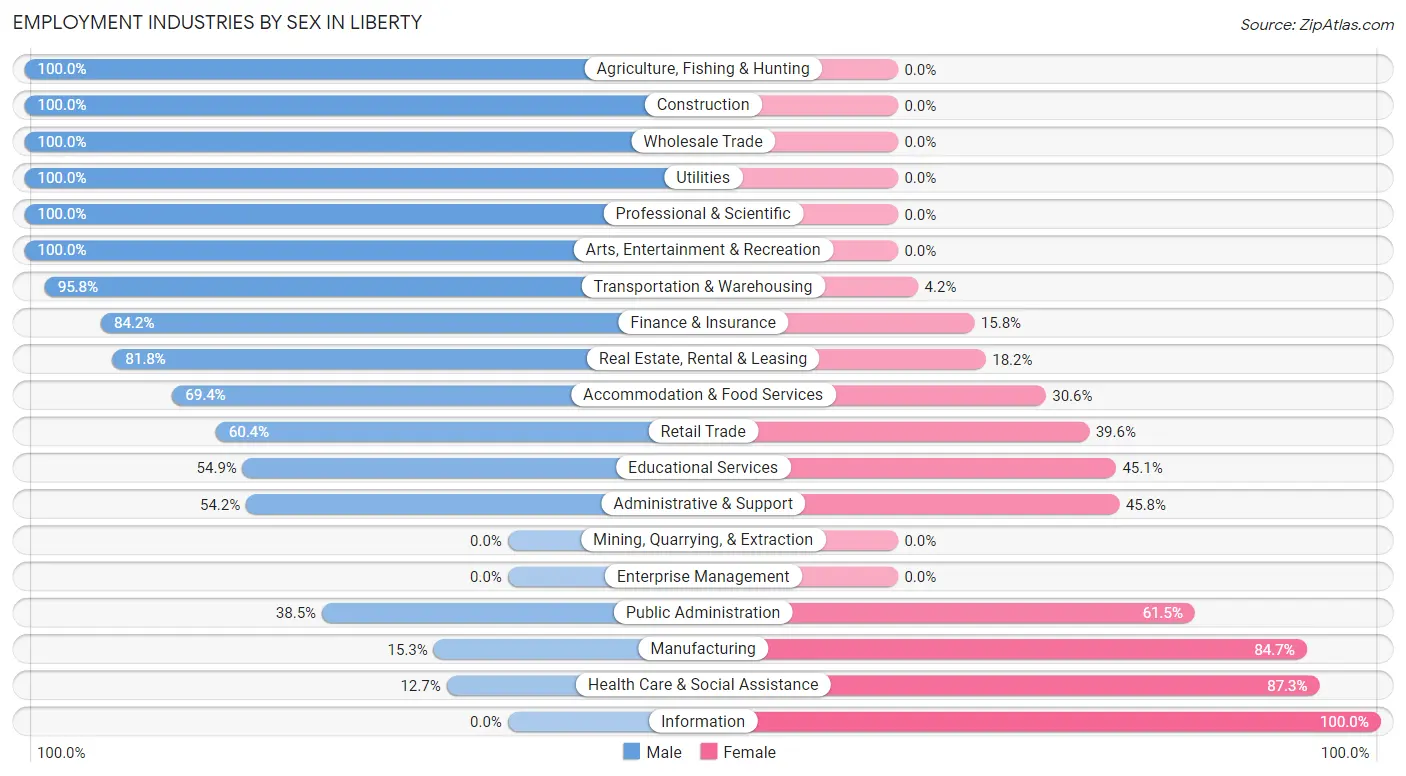
Employment Industries by Sex in Liberty
The Liberty industries that see more men than women are Agriculture, Fishing & Hunting (100.0%), Construction (100.0%), and Wholesale Trade (100.0%), whereas the industries that tend to have a higher number of women are Information (100.0%), Health Care & Social Assistance (87.3%), and Manufacturing (84.7%).
| Industry | Male | Female |
| Agriculture, Fishing & Hunting | 18 (100.0%) | 0 (0.0%) |
| Mining, Quarrying, & Extraction | 0 (0.0%) | 0 (0.0%) |
| Construction | 53 (100.0%) | 0 (0.0%) |
| Manufacturing | 52 (15.3%) | 287 (84.7%) |
| Wholesale Trade | 17 (100.0%) | 0 (0.0%) |
| Retail Trade | 61 (60.4%) | 40 (39.6%) |
| Transportation & Warehousing | 160 (95.8%) | 7 (4.2%) |
| Utilities | 15 (100.0%) | 0 (0.0%) |
| Information | 0 (0.0%) | 5 (100.0%) |
| Finance & Insurance | 101 (84.2%) | 19 (15.8%) |
| Real Estate, Rental & Leasing | 54 (81.8%) | 12 (18.2%) |
| Professional & Scientific | 31 (100.0%) | 0 (0.0%) |
| Enterprise Management | 0 (0.0%) | 0 (0.0%) |
| Administrative & Support | 13 (54.2%) | 11 (45.8%) |
| Educational Services | 79 (54.9%) | 65 (45.1%) |
| Health Care & Social Assistance | 44 (12.7%) | 303 (87.3%) |
| Arts, Entertainment & Recreation | 35 (100.0%) | 0 (0.0%) |
| Accommodation & Food Services | 161 (69.4%) | 71 (30.6%) |
| Public Administration | 55 (38.5%) | 88 (61.5%) |
| Total | 979 (50.4%) | 965 (49.6%) |
Education in Liberty
School Enrollment in Liberty
The most common levels of schooling among the 1,198 students in Liberty are middle school (284 | 23.7%), high school (275 | 23.0%), and college / undergraduate (265 | 22.1%).
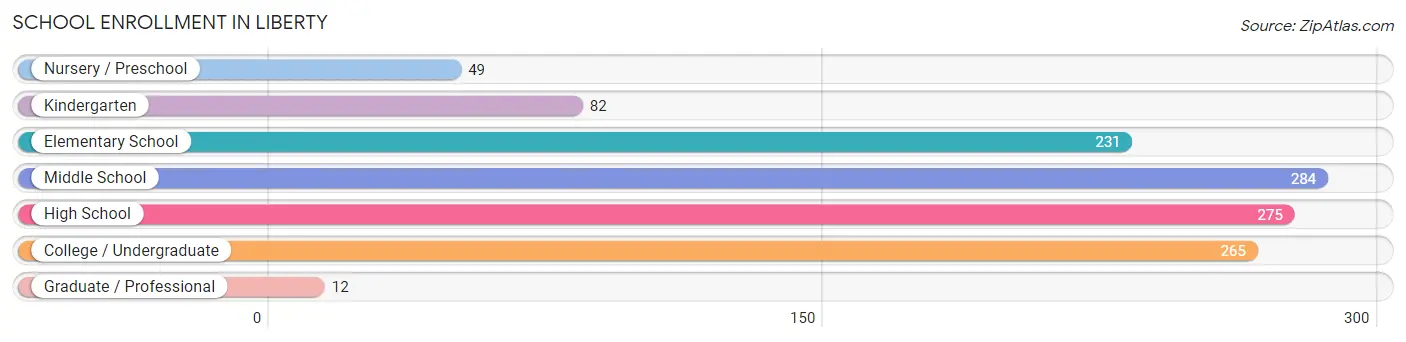
| School Level | # Students | % Students |
| Nursery / Preschool | 49 | 4.1% |
| Kindergarten | 82 | 6.8% |
| Elementary School | 231 | 19.3% |
| Middle School | 284 | 23.7% |
| High School | 275 | 23.0% |
| College / Undergraduate | 265 | 22.1% |
| Graduate / Professional | 12 | 1.0% |
| Total | 1,198 | 100.0% |
School Enrollment by Age by Funding Source in Liberty
Out of a total of 1,198 students who are enrolled in schools in Liberty, 102 (8.5%) attend a private institution, while the remaining 1,096 (91.5%) are enrolled in public schools. The age group of 10 to 14 year olds has the highest likelihood of being enrolled in private schools, with 62 (16.0% in the age bracket) enrolled. Conversely, the age group of 3 to 4 year olds has the lowest likelihood of being enrolled in a private school, with 23 (100.0% in the age bracket) attending a public institution.
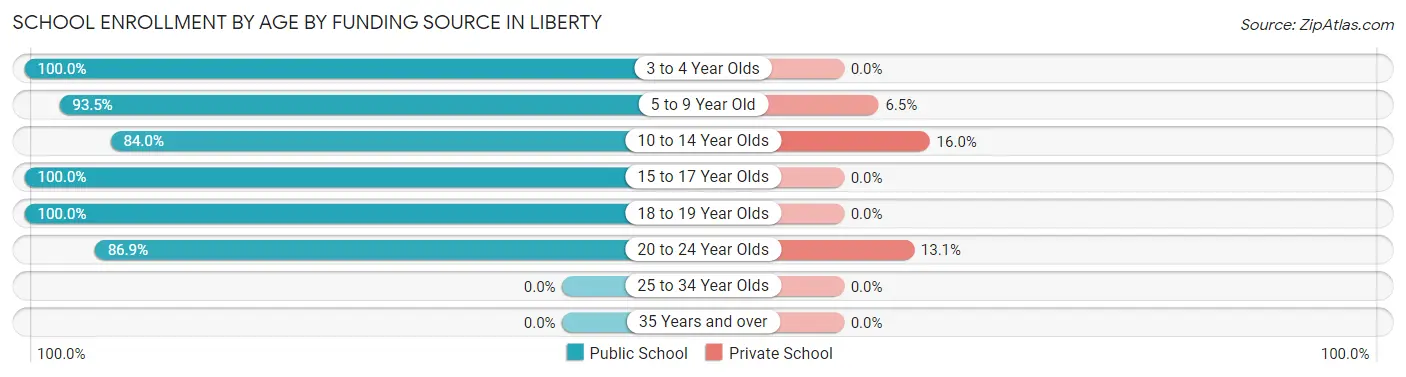
| Age Bracket | Public School | Private School |
| 3 to 4 Year Olds | 23 (100.0%) | 0 (0.0%) |
| 5 to 9 Year Old | 245 (93.5%) | 17 (6.5%) |
| 10 to 14 Year Olds | 325 (84.0%) | 62 (16.0%) |
| 15 to 17 Year Olds | 177 (100.0%) | 0 (0.0%) |
| 18 to 19 Year Olds | 173 (100.0%) | 0 (0.0%) |
| 20 to 24 Year Olds | 153 (86.9%) | 23 (13.1%) |
| 25 to 34 Year Olds | 0 (0.0%) | 0 (0.0%) |
| 35 Years and over | 0 (0.0%) | 0 (0.0%) |
| Total | 1,096 (91.5%) | 102 (8.5%) |
Educational Attainment by Field of Study in Liberty
Education (110 | 25.3%), engineering (44 | 10.1%), visual & performing arts (43 | 9.9%), business (42 | 9.7%), and arts & humanities (38 | 8.7%) are the most common fields of study among 435 individuals in Liberty who have obtained a bachelor's degree or higher.
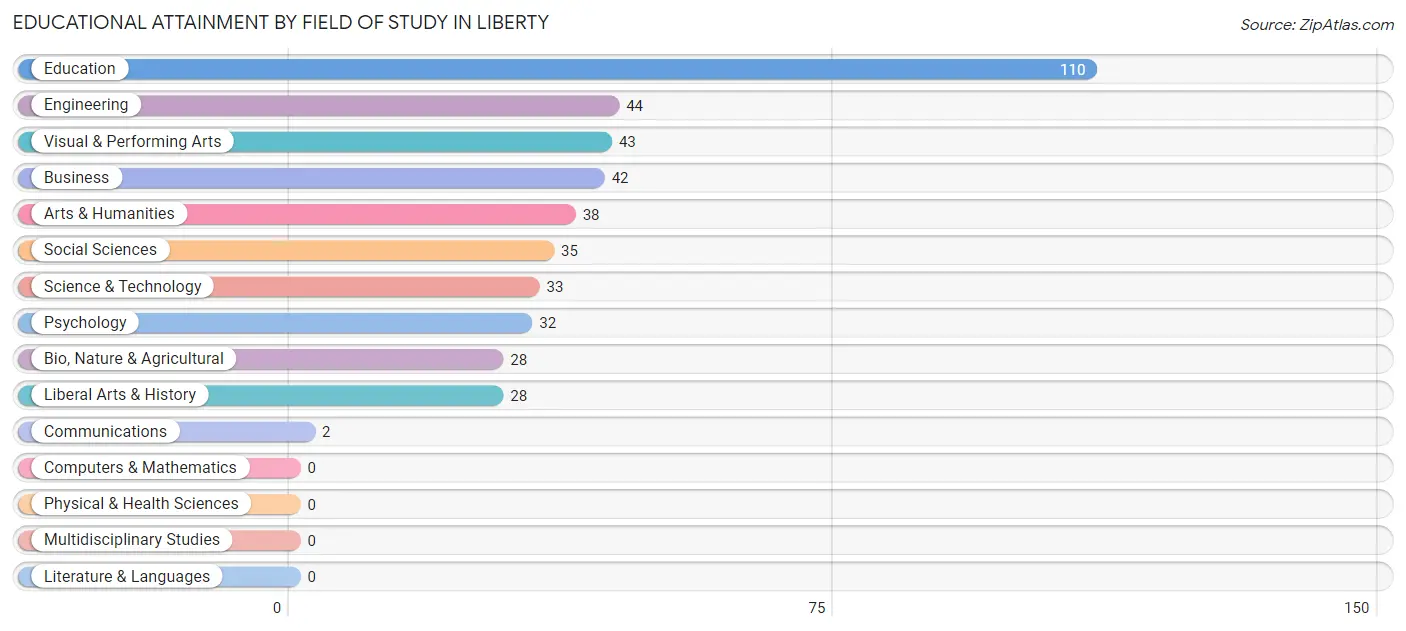
| Field of Study | # Graduates | % Graduates |
| Computers & Mathematics | 0 | 0.0% |
| Bio, Nature & Agricultural | 28 | 6.4% |
| Physical & Health Sciences | 0 | 0.0% |
| Psychology | 32 | 7.4% |
| Social Sciences | 35 | 8.1% |
| Engineering | 44 | 10.1% |
| Multidisciplinary Studies | 0 | 0.0% |
| Science & Technology | 33 | 7.6% |
| Business | 42 | 9.7% |
| Education | 110 | 25.3% |
| Literature & Languages | 0 | 0.0% |
| Liberal Arts & History | 28 | 6.4% |
| Visual & Performing Arts | 43 | 9.9% |
| Communications | 2 | 0.5% |
| Arts & Humanities | 38 | 8.7% |
| Total | 435 | 100.0% |
Transportation & Commute in Liberty
Vehicle Availability by Sex in Liberty
The most prevalent vehicle ownership categories in Liberty are males with 1 vehicle (363, accounting for 38.3%) and females with 1 vehicle (340, making up 38.4%).
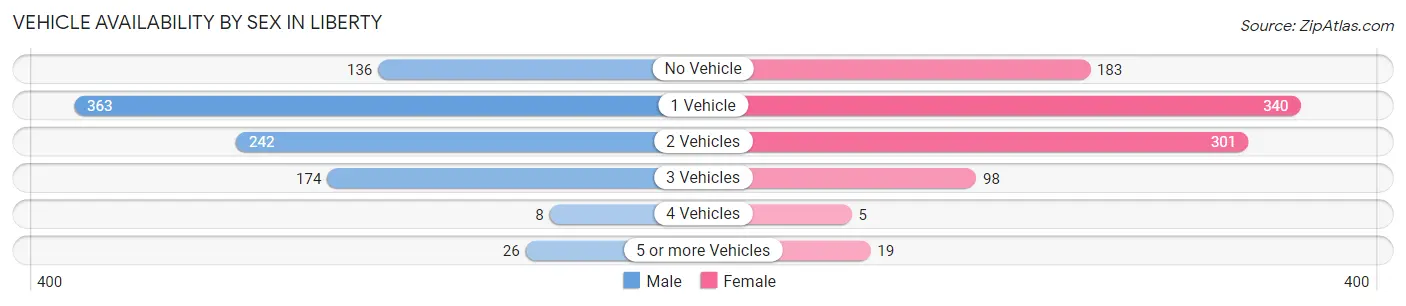
| Vehicles Available | Male | Female |
| No Vehicle | 136 (14.3%) | 183 (19.3%) |
| 1 Vehicle | 363 (38.3%) | 340 (35.9%) |
| 2 Vehicles | 242 (25.5%) | 301 (31.8%) |
| 3 Vehicles | 174 (18.3%) | 98 (10.4%) |
| 4 Vehicles | 8 (0.8%) | 5 (0.5%) |
| 5 or more Vehicles | 26 (2.7%) | 19 (2.0%) |
| Total | 949 (100.0%) | 946 (100.0%) |
Commute Time in Liberty
The most frequently occuring commute durations in Liberty are 15 to 19 minutes (387 commuters, 21.4%), 20 to 24 minutes (356 commuters, 19.7%), and 5 to 9 minutes (288 commuters, 15.9%).
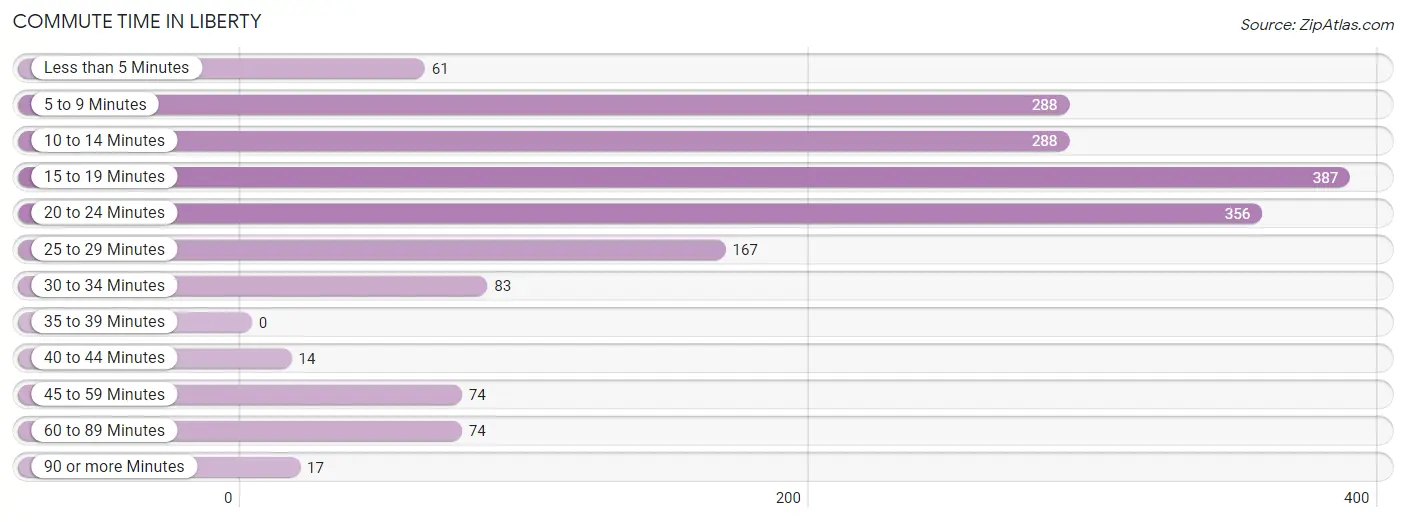
| Commute Time | # Commuters | % Commuters |
| Less than 5 Minutes | 61 | 3.4% |
| 5 to 9 Minutes | 288 | 15.9% |
| 10 to 14 Minutes | 288 | 15.9% |
| 15 to 19 Minutes | 387 | 21.4% |
| 20 to 24 Minutes | 356 | 19.7% |
| 25 to 29 Minutes | 167 | 9.2% |
| 30 to 34 Minutes | 83 | 4.6% |
| 35 to 39 Minutes | 0 | 0.0% |
| 40 to 44 Minutes | 14 | 0.8% |
| 45 to 59 Minutes | 74 | 4.1% |
| 60 to 89 Minutes | 74 | 4.1% |
| 90 or more Minutes | 17 | 0.9% |
Commute Time by Sex in Liberty
The most common commute times in Liberty are 20 to 24 minutes (219 commuters, 25.1%) for males and 15 to 19 minutes (231 commuters, 24.6%) for females.
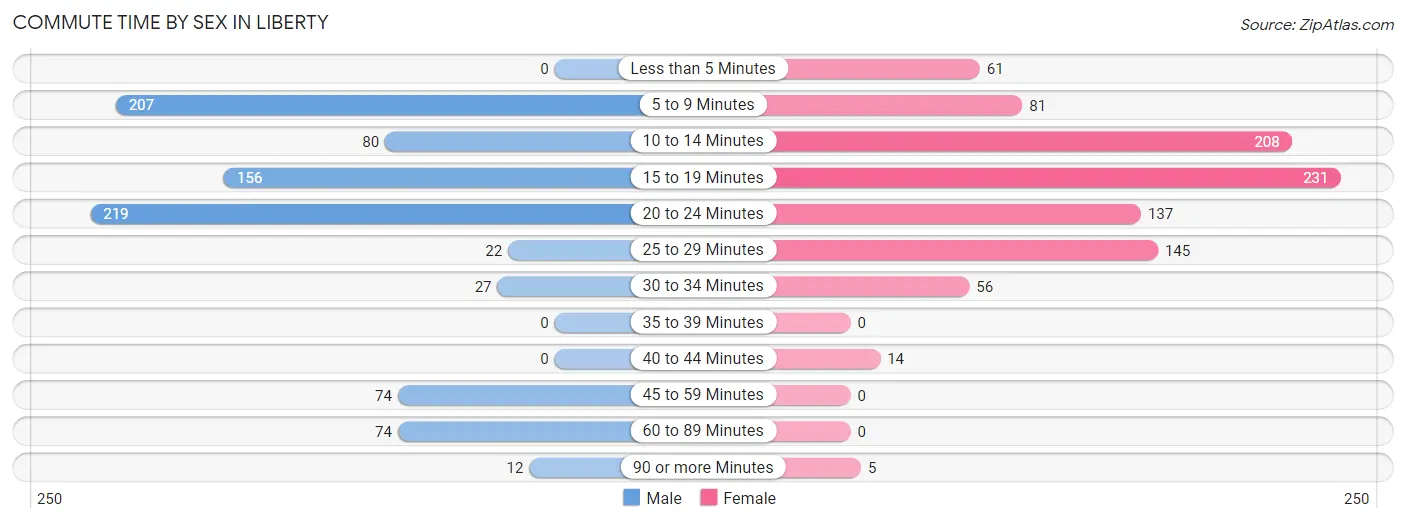
| Commute Time | Male | Female |
| Less than 5 Minutes | 0 (0.0%) | 61 (6.5%) |
| 5 to 9 Minutes | 207 (23.8%) | 81 (8.6%) |
| 10 to 14 Minutes | 80 (9.2%) | 208 (22.2%) |
| 15 to 19 Minutes | 156 (17.9%) | 231 (24.6%) |
| 20 to 24 Minutes | 219 (25.1%) | 137 (14.6%) |
| 25 to 29 Minutes | 22 (2.5%) | 145 (15.5%) |
| 30 to 34 Minutes | 27 (3.1%) | 56 (6.0%) |
| 35 to 39 Minutes | 0 (0.0%) | 0 (0.0%) |
| 40 to 44 Minutes | 0 (0.0%) | 14 (1.5%) |
| 45 to 59 Minutes | 74 (8.5%) | 0 (0.0%) |
| 60 to 89 Minutes | 74 (8.5%) | 0 (0.0%) |
| 90 or more Minutes | 12 (1.4%) | 5 (0.5%) |
Time of Departure to Work by Sex in Liberty
The most frequent times of departure to work in Liberty are 4:00 PM to 11:59 PM (144, 16.5%) for males and 7:30 AM to 7:59 AM (221, 23.6%) for females.
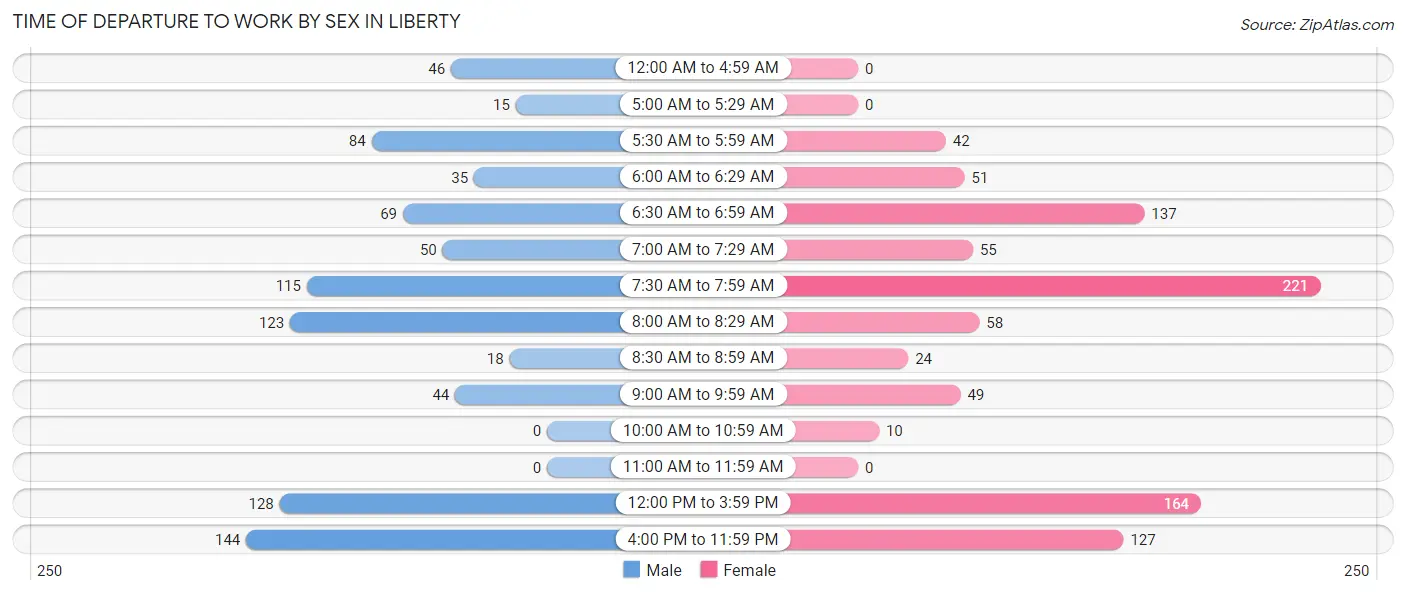
| Time of Departure | Male | Female |
| 12:00 AM to 4:59 AM | 46 (5.3%) | 0 (0.0%) |
| 5:00 AM to 5:29 AM | 15 (1.7%) | 0 (0.0%) |
| 5:30 AM to 5:59 AM | 84 (9.6%) | 42 (4.5%) |
| 6:00 AM to 6:29 AM | 35 (4.0%) | 51 (5.4%) |
| 6:30 AM to 6:59 AM | 69 (7.9%) | 137 (14.6%) |
| 7:00 AM to 7:29 AM | 50 (5.7%) | 55 (5.9%) |
| 7:30 AM to 7:59 AM | 115 (13.2%) | 221 (23.6%) |
| 8:00 AM to 8:29 AM | 123 (14.1%) | 58 (6.2%) |
| 8:30 AM to 8:59 AM | 18 (2.1%) | 24 (2.6%) |
| 9:00 AM to 9:59 AM | 44 (5.1%) | 49 (5.2%) |
| 10:00 AM to 10:59 AM | 0 (0.0%) | 10 (1.1%) |
| 11:00 AM to 11:59 AM | 0 (0.0%) | 0 (0.0%) |
| 12:00 PM to 3:59 PM | 128 (14.7%) | 164 (17.5%) |
| 4:00 PM to 11:59 PM | 144 (16.5%) | 127 (13.5%) |
| Total | 871 (100.0%) | 938 (100.0%) |
Housing Occupancy in Liberty
Occupancy by Ownership in Liberty
Of the total 1,707 dwellings in Liberty, owner-occupied units account for 468 (27.4%), while renter-occupied units make up 1,239 (72.6%).
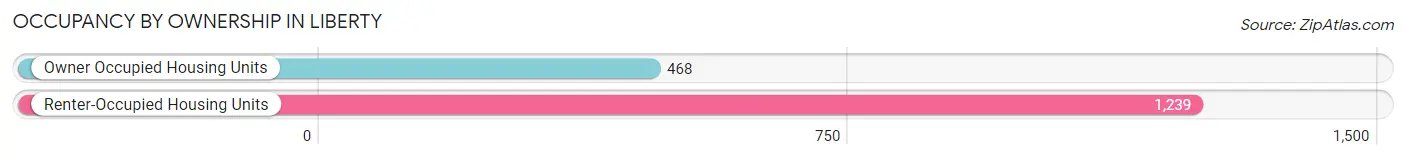
| Occupancy | # Housing Units | % Housing Units |
| Owner Occupied Housing Units | 468 | 27.4% |
| Renter-Occupied Housing Units | 1,239 | 72.6% |
| Total Occupied Housing Units | 1,707 | 100.0% |
Occupancy by Household Size in Liberty
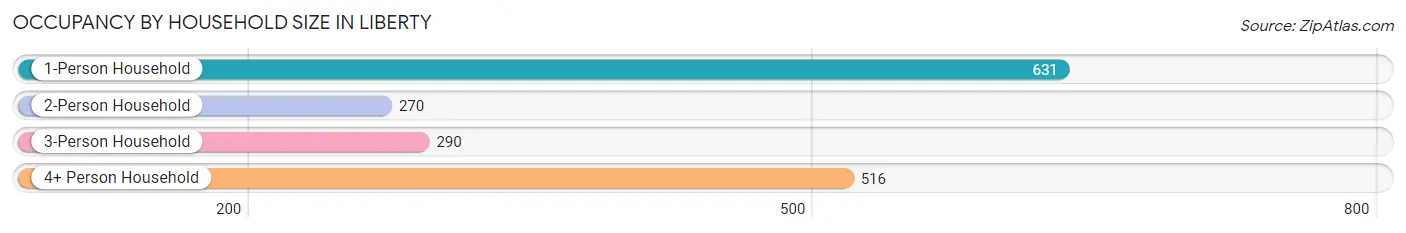
| Household Size | # Housing Units | % Housing Units |
| 1-Person Household | 631 | 37.0% |
| 2-Person Household | 270 | 15.8% |
| 3-Person Household | 290 | 17.0% |
| 4+ Person Household | 516 | 30.2% |
| Total Housing Units | 1,707 | 100.0% |
Occupancy by Ownership by Household Size in Liberty
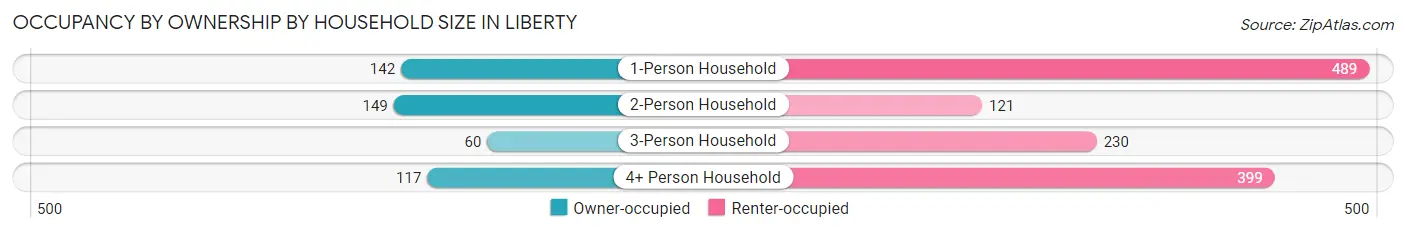
| Household Size | Owner-occupied | Renter-occupied |
| 1-Person Household | 142 (22.5%) | 489 (77.5%) |
| 2-Person Household | 149 (55.2%) | 121 (44.8%) |
| 3-Person Household | 60 (20.7%) | 230 (79.3%) |
| 4+ Person Household | 117 (22.7%) | 399 (77.3%) |
| Total Housing Units | 468 (27.4%) | 1,239 (72.6%) |
Occupancy by Educational Attainment in Liberty
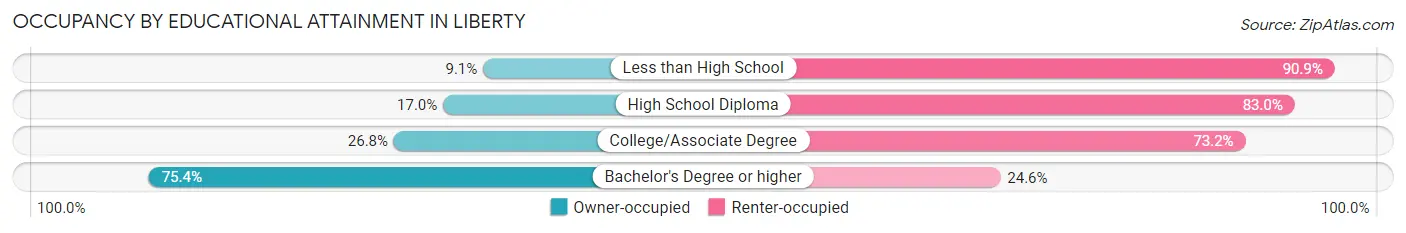
| Household Size | Owner-occupied | Renter-occupied |
| Less than High School | 19 (9.1%) | 190 (90.9%) |
| High School Diploma | 137 (17.0%) | 668 (83.0%) |
| College/Associate Degree | 116 (26.8%) | 317 (73.2%) |
| Bachelor's Degree or higher | 196 (75.4%) | 64 (24.6%) |
Occupancy by Age of Householder in Liberty
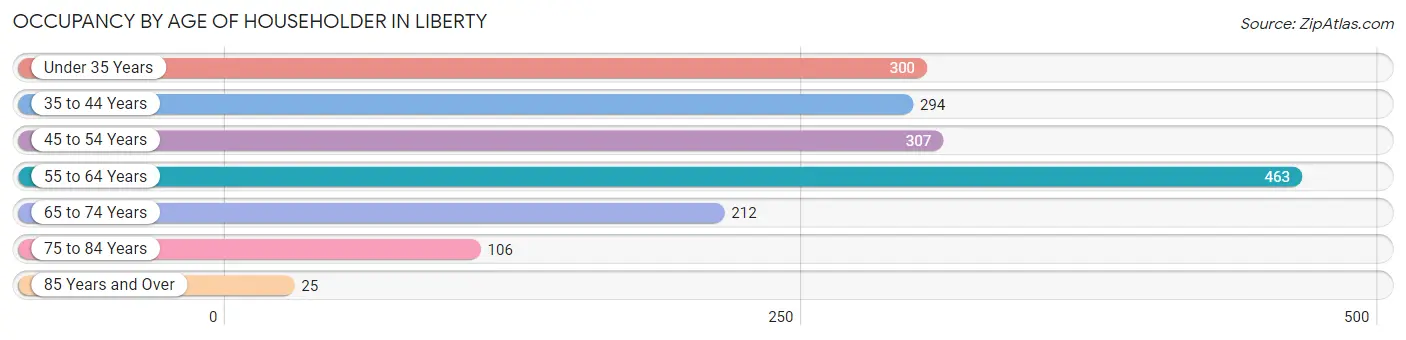
| Age Bracket | # Households | % Households |
| Under 35 Years | 300 | 17.6% |
| 35 to 44 Years | 294 | 17.2% |
| 45 to 54 Years | 307 | 18.0% |
| 55 to 64 Years | 463 | 27.1% |
| 65 to 74 Years | 212 | 12.4% |
| 75 to 84 Years | 106 | 6.2% |
| 85 Years and Over | 25 | 1.5% |
| Total | 1,707 | 100.0% |
Housing Finances in Liberty
Median Income by Occupancy in Liberty
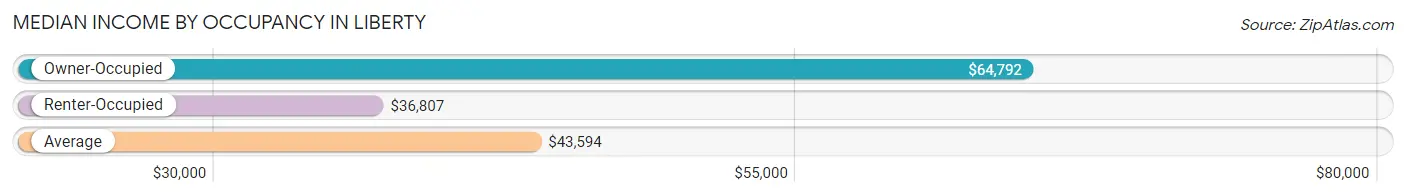
| Occupancy Type | # Households | Median Income |
| Owner-Occupied | 468 (27.4%) | $64,792 |
| Renter-Occupied | 1,239 (72.6%) | $36,807 |
| Average | 1,707 (100.0%) | $43,594 |
Occupancy by Householder Income Bracket in Liberty
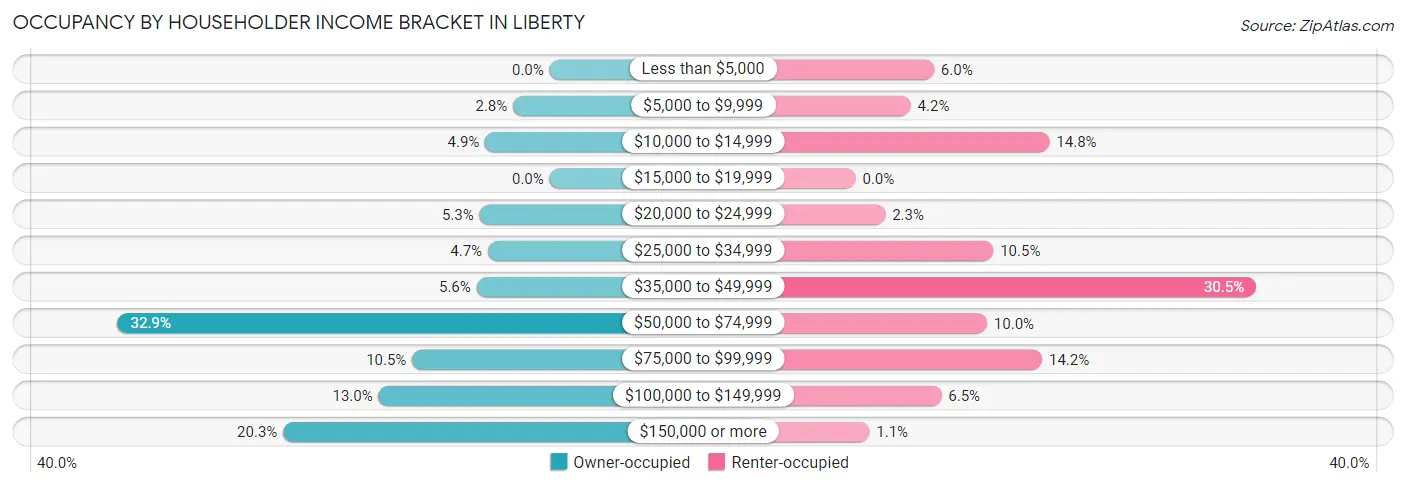
| Income Bracket | Owner-occupied | Renter-occupied |
| Less than $5,000 | 0 (0.0%) | 74 (6.0%) |
| $5,000 to $9,999 | 13 (2.8%) | 52 (4.2%) |
| $10,000 to $14,999 | 23 (4.9%) | 183 (14.8%) |
| $15,000 to $19,999 | 0 (0.0%) | 0 (0.0%) |
| $20,000 to $24,999 | 25 (5.3%) | 28 (2.3%) |
| $25,000 to $34,999 | 22 (4.7%) | 130 (10.5%) |
| $35,000 to $49,999 | 26 (5.6%) | 378 (30.5%) |
| $50,000 to $74,999 | 154 (32.9%) | 124 (10.0%) |
| $75,000 to $99,999 | 49 (10.5%) | 176 (14.2%) |
| $100,000 to $149,999 | 61 (13.0%) | 81 (6.5%) |
| $150,000 or more | 95 (20.3%) | 13 (1.1%) |
| Total | 468 (100.0%) | 1,239 (100.0%) |
Monthly Housing Cost Tiers in Liberty
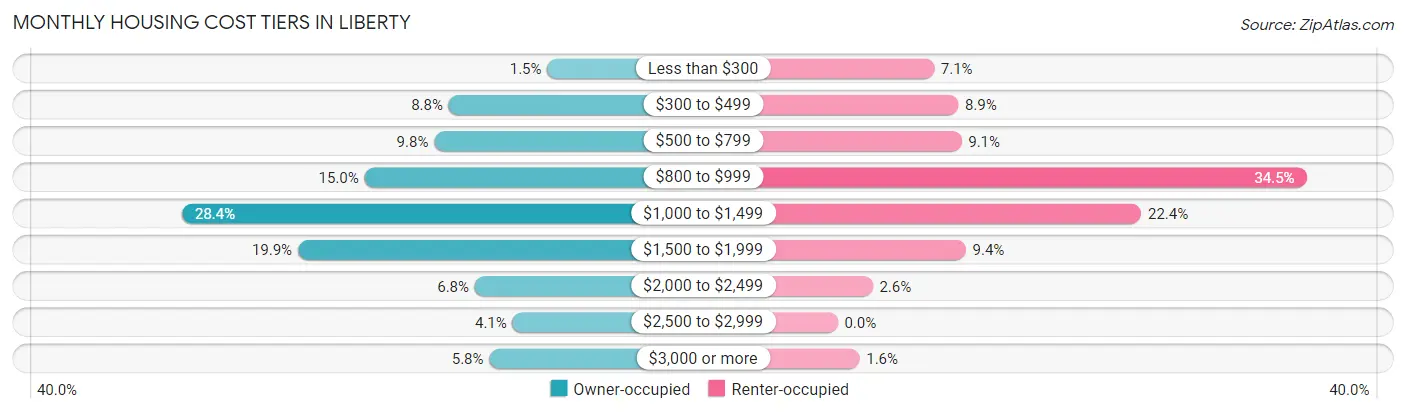
| Monthly Cost | Owner-occupied | Renter-occupied |
| Less than $300 | 7 (1.5%) | 88 (7.1%) |
| $300 to $499 | 41 (8.8%) | 110 (8.9%) |
| $500 to $799 | 46 (9.8%) | 113 (9.1%) |
| $800 to $999 | 70 (15.0%) | 428 (34.5%) |
| $1,000 to $1,499 | 133 (28.4%) | 277 (22.4%) |
| $1,500 to $1,999 | 93 (19.9%) | 117 (9.4%) |
| $2,000 to $2,499 | 32 (6.8%) | 32 (2.6%) |
| $2,500 to $2,999 | 19 (4.1%) | 0 (0.0%) |
| $3,000 or more | 27 (5.8%) | 20 (1.6%) |
| Total | 468 (100.0%) | 1,239 (100.0%) |
Physical Housing Characteristics in Liberty
Housing Structures in Liberty
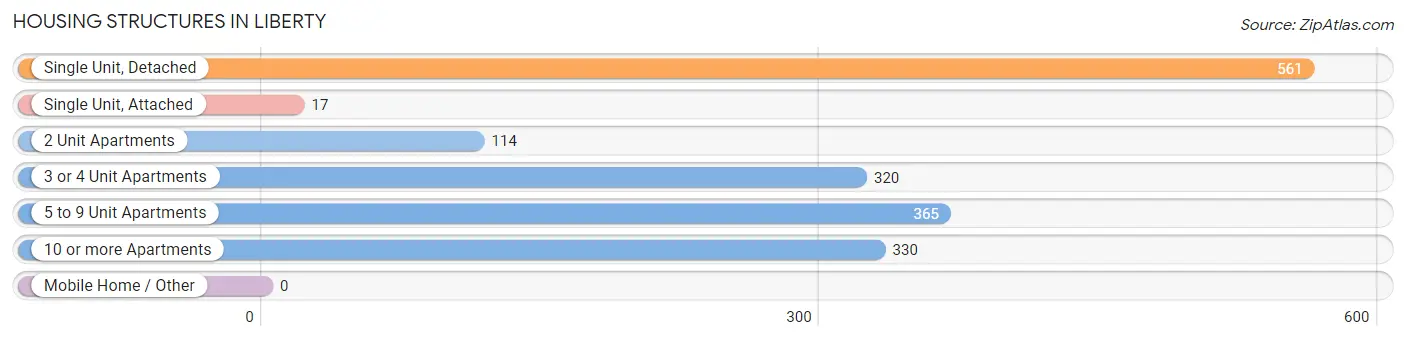
| Structure Type | # Housing Units | % Housing Units |
| Single Unit, Detached | 561 | 32.9% |
| Single Unit, Attached | 17 | 1.0% |
| 2 Unit Apartments | 114 | 6.7% |
| 3 or 4 Unit Apartments | 320 | 18.8% |
| 5 to 9 Unit Apartments | 365 | 21.4% |
| 10 or more Apartments | 330 | 19.3% |
| Mobile Home / Other | 0 | 0.0% |
| Total | 1,707 | 100.0% |
Housing Structures by Occupancy in Liberty
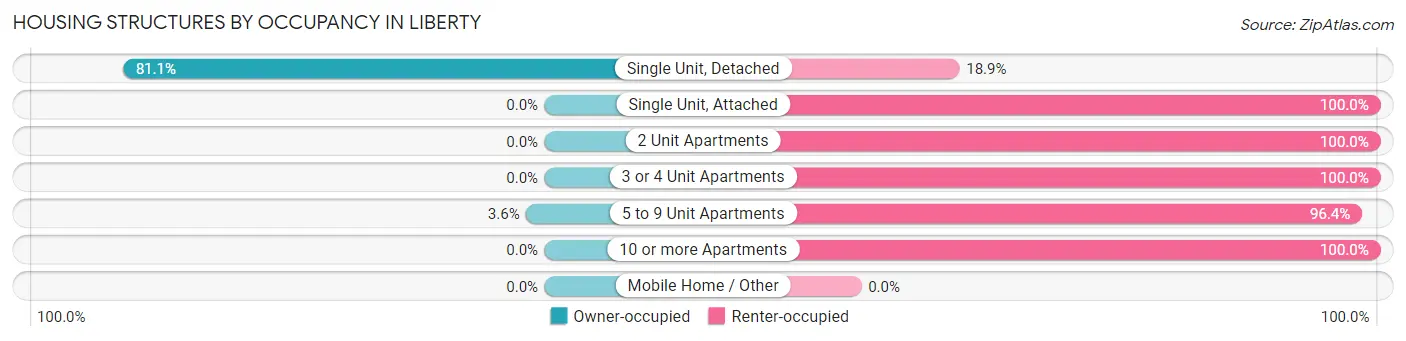
| Structure Type | Owner-occupied | Renter-occupied |
| Single Unit, Detached | 455 (81.1%) | 106 (18.9%) |
| Single Unit, Attached | 0 (0.0%) | 17 (100.0%) |
| 2 Unit Apartments | 0 (0.0%) | 114 (100.0%) |
| 3 or 4 Unit Apartments | 0 (0.0%) | 320 (100.0%) |
| 5 to 9 Unit Apartments | 13 (3.6%) | 352 (96.4%) |
| 10 or more Apartments | 0 (0.0%) | 330 (100.0%) |
| Mobile Home / Other | 0 (0.0%) | 0 (0.0%) |
| Total | 468 (27.4%) | 1,239 (72.6%) |
Housing Structures by Number of Rooms in Liberty
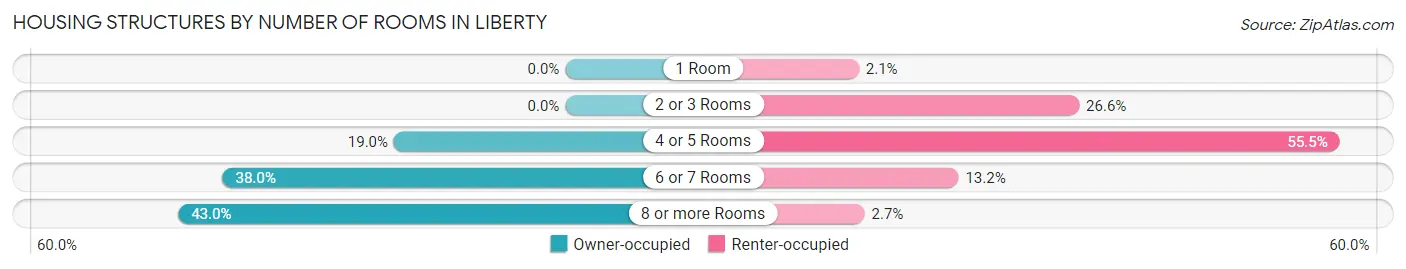
| Number of Rooms | Owner-occupied | Renter-occupied |
| 1 Room | 0 (0.0%) | 26 (2.1%) |
| 2 or 3 Rooms | 0 (0.0%) | 329 (26.6%) |
| 4 or 5 Rooms | 89 (19.0%) | 687 (55.4%) |
| 6 or 7 Rooms | 178 (38.0%) | 163 (13.2%) |
| 8 or more Rooms | 201 (42.9%) | 34 (2.7%) |
| Total | 468 (100.0%) | 1,239 (100.0%) |
Housing Structure by Heating Type in Liberty
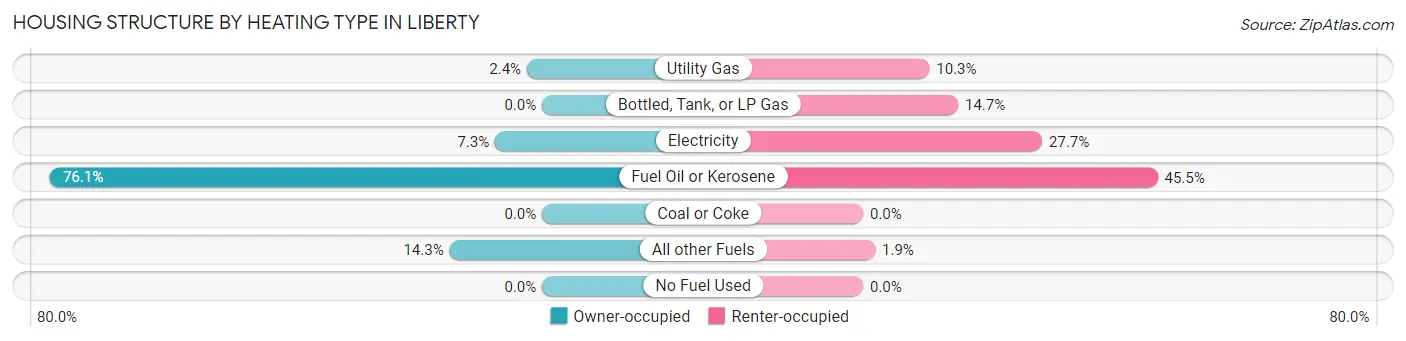
| Heating Type | Owner-occupied | Renter-occupied |
| Utility Gas | 11 (2.4%) | 127 (10.2%) |
| Bottled, Tank, or LP Gas | 0 (0.0%) | 182 (14.7%) |
| Electricity | 34 (7.3%) | 343 (27.7%) |
| Fuel Oil or Kerosene | 356 (76.1%) | 564 (45.5%) |
| Coal or Coke | 0 (0.0%) | 0 (0.0%) |
| All other Fuels | 67 (14.3%) | 23 (1.9%) |
| No Fuel Used | 0 (0.0%) | 0 (0.0%) |
| Total | 468 (100.0%) | 1,239 (100.0%) |
Household Vehicle Usage in Liberty
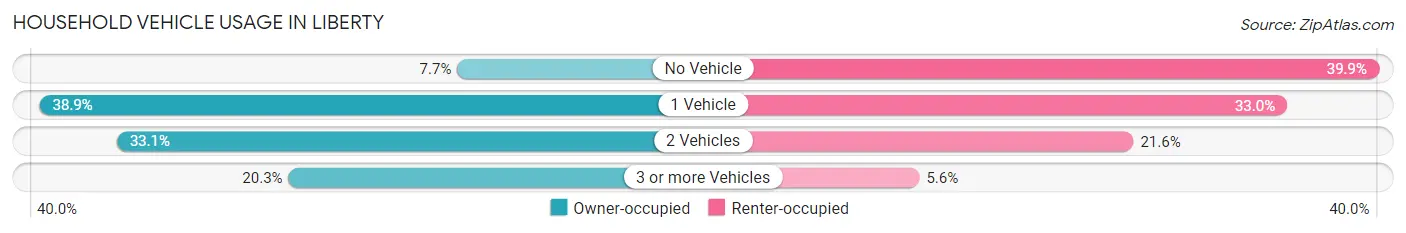
| Vehicles per Household | Owner-occupied | Renter-occupied |
| No Vehicle | 36 (7.7%) | 494 (39.9%) |
| 1 Vehicle | 182 (38.9%) | 409 (33.0%) |
| 2 Vehicles | 155 (33.1%) | 267 (21.5%) |
| 3 or more Vehicles | 95 (20.3%) | 69 (5.6%) |
| Total | 468 (100.0%) | 1,239 (100.0%) |
Real Estate & Mortgages in Liberty
Real Estate and Mortgage Overview in Liberty
| Characteristic | Without Mortgage | With Mortgage |
| Housing Units | 252 | 216 |
| Median Property Value | $116,700 | $154,000 |
| Median Household Income | $63,111 | $82 |
| Monthly Housing Costs | $897 | $19 |
| Real Estate Taxes | $4,700 | $0 |
Property Value by Mortgage Status in Liberty
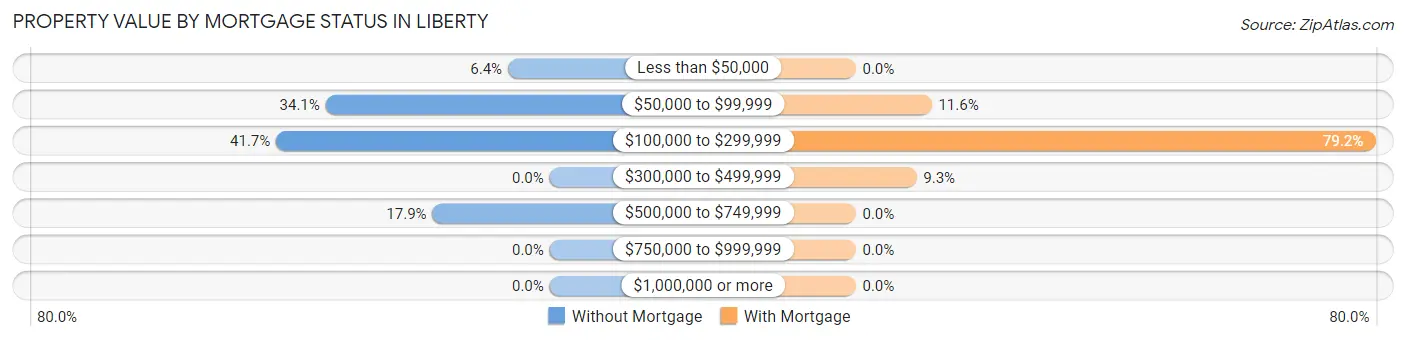
| Property Value | Without Mortgage | With Mortgage |
| Less than $50,000 | 16 (6.4%) | 0 (0.0%) |
| $50,000 to $99,999 | 86 (34.1%) | 25 (11.6%) |
| $100,000 to $299,999 | 105 (41.7%) | 171 (79.2%) |
| $300,000 to $499,999 | 0 (0.0%) | 20 (9.3%) |
| $500,000 to $749,999 | 45 (17.9%) | 0 (0.0%) |
| $750,000 to $999,999 | 0 (0.0%) | 0 (0.0%) |
| $1,000,000 or more | 0 (0.0%) | 0 (0.0%) |
| Total | 252 (100.0%) | 216 (100.0%) |
Household Income by Mortgage Status in Liberty
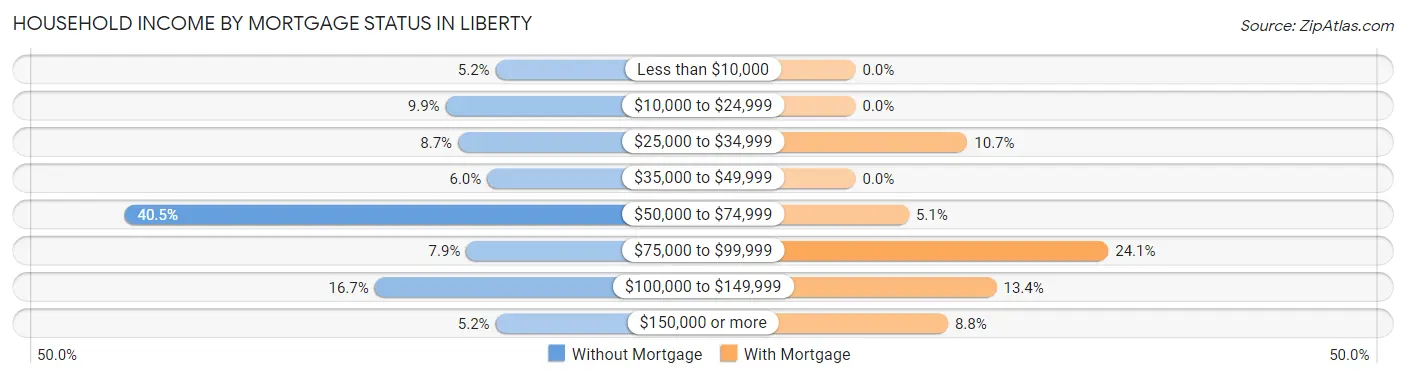
| Household Income | Without Mortgage | With Mortgage |
| Less than $10,000 | 13 (5.2%) | 0 (0.0%) |
| $10,000 to $24,999 | 25 (9.9%) | 0 (0.0%) |
| $25,000 to $34,999 | 22 (8.7%) | 23 (10.6%) |
| $35,000 to $49,999 | 15 (5.9%) | 0 (0.0%) |
| $50,000 to $74,999 | 102 (40.5%) | 11 (5.1%) |
| $75,000 to $99,999 | 20 (7.9%) | 52 (24.1%) |
| $100,000 to $149,999 | 42 (16.7%) | 29 (13.4%) |
| $150,000 or more | 13 (5.2%) | 19 (8.8%) |
| Total | 252 (100.0%) | 216 (100.0%) |
Property Value to Household Income Ratio in Liberty
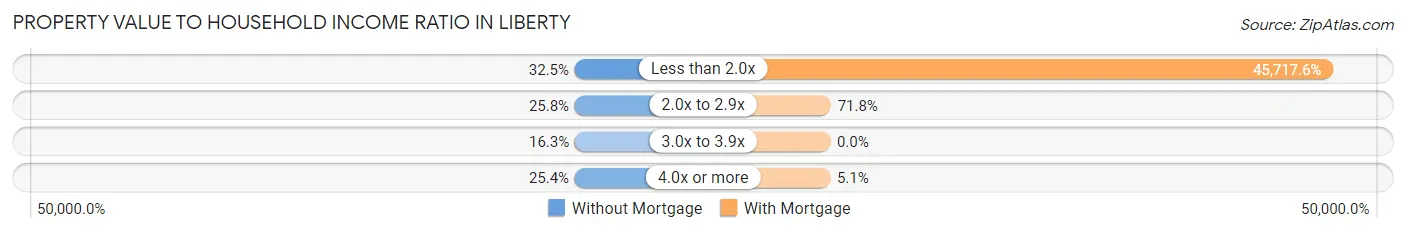
| Value-to-Income Ratio | Without Mortgage | With Mortgage |
| Less than 2.0x | 82 (32.5%) | 98,750 (45,717.6%) |
| 2.0x to 2.9x | 65 (25.8%) | 155 (71.8%) |
| 3.0x to 3.9x | 41 (16.3%) | 0 (0.0%) |
| 4.0x or more | 64 (25.4%) | 11 (5.1%) |
| Total | 252 (100.0%) | 216 (100.0%) |
Real Estate Taxes by Mortgage Status in Liberty
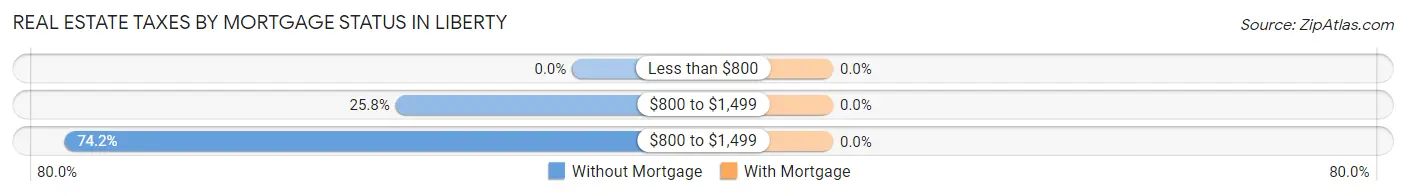
| Property Taxes | Without Mortgage | With Mortgage |
| Less than $800 | 0 (0.0%) | 0 (0.0%) |
| $800 to $1,499 | 65 (25.8%) | 0 (0.0%) |
| $800 to $1,499 | 187 (74.2%) | 0 (0.0%) |
| Total | 252 (100.0%) | 216 (100.0%) |
Health & Disability in Liberty
Health Insurance Coverage by Age in Liberty
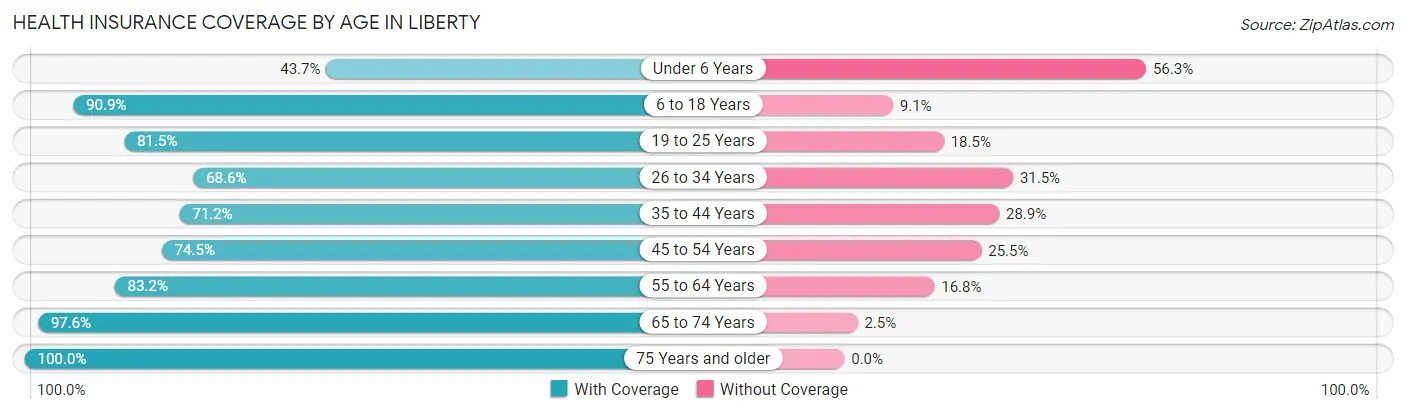
| Age Bracket | With Coverage | Without Coverage |
| Under 6 Years | 325 (43.7%) | 418 (56.3%) |
| 6 to 18 Years | 853 (90.9%) | 85 (9.1%) |
| 19 to 25 Years | 290 (81.5%) | 66 (18.5%) |
| 26 to 34 Years | 523 (68.5%) | 240 (31.5%) |
| 35 to 44 Years | 296 (71.2%) | 120 (28.8%) |
| 45 to 54 Years | 417 (74.5%) | 143 (25.5%) |
| 55 to 64 Years | 511 (83.2%) | 103 (16.8%) |
| 65 to 74 Years | 319 (97.6%) | 8 (2.5%) |
| 75 Years and older | 193 (100.0%) | 0 (0.0%) |
| Total | 3,727 (75.9%) | 1,183 (24.1%) |
Health Insurance Coverage by Citizenship Status in Liberty
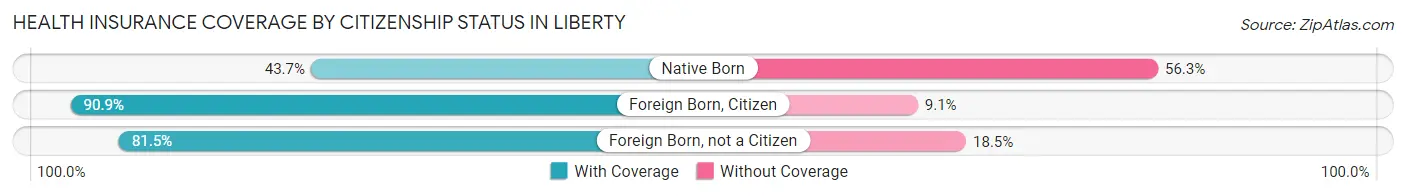
| Citizenship Status | With Coverage | Without Coverage |
| Native Born | 325 (43.7%) | 418 (56.3%) |
| Foreign Born, Citizen | 853 (90.9%) | 85 (9.1%) |
| Foreign Born, not a Citizen | 290 (81.5%) | 66 (18.5%) |
Health Insurance Coverage by Household Income in Liberty
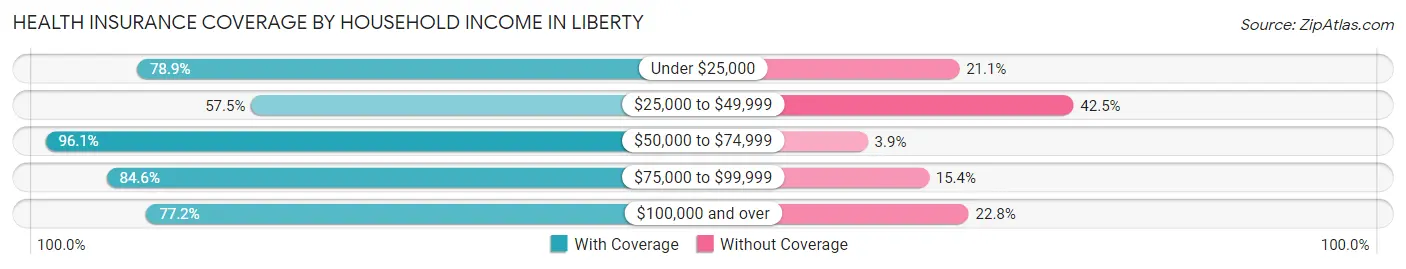
| Household Income | With Coverage | Without Coverage |
| Under $25,000 | 461 (78.9%) | 123 (21.1%) |
| $25,000 to $49,999 | 961 (57.5%) | 709 (42.5%) |
| $50,000 to $74,999 | 910 (96.1%) | 37 (3.9%) |
| $75,000 to $99,999 | 606 (84.6%) | 110 (15.4%) |
| $100,000 and over | 690 (77.2%) | 204 (22.8%) |
Public vs Private Health Insurance Coverage by Age in Liberty
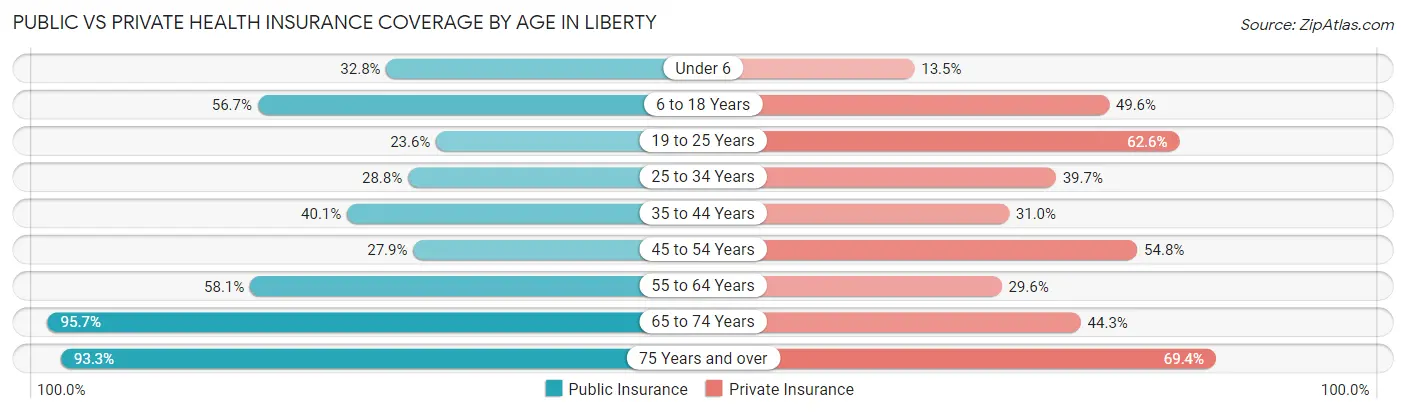
| Age Bracket | Public Insurance | Private Insurance |
| Under 6 | 244 (32.8%) | 100 (13.5%) |
| 6 to 18 Years | 532 (56.7%) | 465 (49.6%) |
| 19 to 25 Years | 84 (23.6%) | 223 (62.6%) |
| 25 to 34 Years | 220 (28.8%) | 303 (39.7%) |
| 35 to 44 Years | 167 (40.1%) | 129 (31.0%) |
| 45 to 54 Years | 156 (27.9%) | 307 (54.8%) |
| 55 to 64 Years | 357 (58.1%) | 182 (29.6%) |
| 65 to 74 Years | 313 (95.7%) | 145 (44.3%) |
| 75 Years and over | 180 (93.3%) | 134 (69.4%) |
| Total | 2,253 (45.9%) | 1,988 (40.5%) |
Disability Status by Sex by Age in Liberty
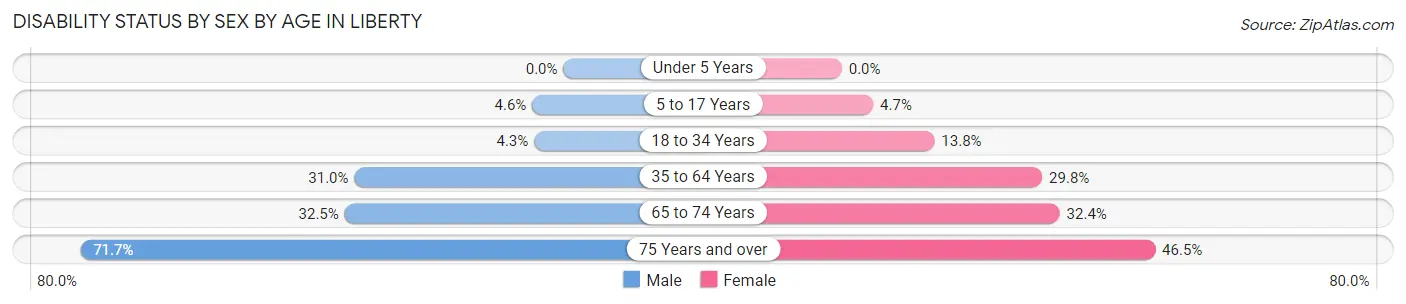
| Age Bracket | Male | Female |
| Under 5 Years | 0 (0.0%) | 0 (0.0%) |
| 5 to 17 Years | 22 (4.6%) | 25 (4.7%) |
| 18 to 34 Years | 27 (4.3%) | 95 (13.8%) |
| 35 to 64 Years | 242 (31.0%) | 241 (29.7%) |
| 65 to 74 Years | 51 (32.5%) | 55 (32.4%) |
| 75 Years and over | 66 (71.7%) | 47 (46.5%) |
Disability Class by Sex by Age in Liberty
Disability Class: Hearing Difficulty
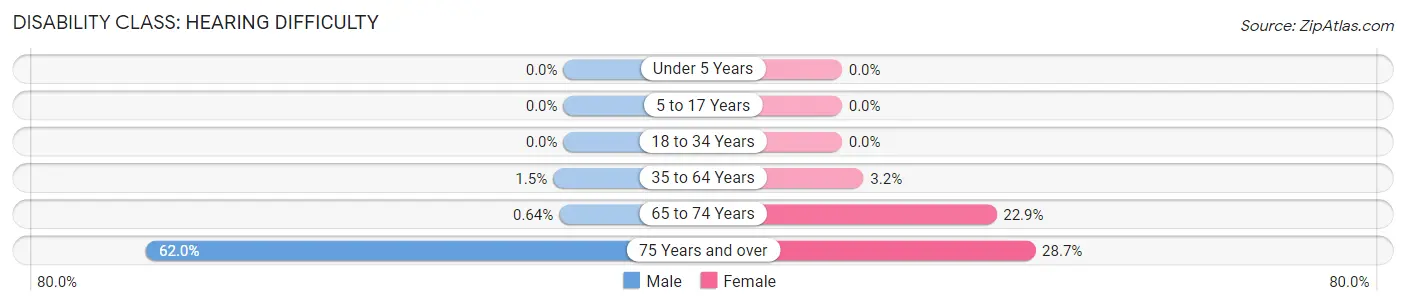
| Age Bracket | Male | Female |
| Under 5 Years | 0 (0.0%) | 0 (0.0%) |
| 5 to 17 Years | 0 (0.0%) | 0 (0.0%) |
| 18 to 34 Years | 0 (0.0%) | 0 (0.0%) |
| 35 to 64 Years | 12 (1.5%) | 26 (3.2%) |
| 65 to 74 Years | 1 (0.6%) | 39 (22.9%) |
| 75 Years and over | 57 (62.0%) | 29 (28.7%) |
Disability Class: Vision Difficulty
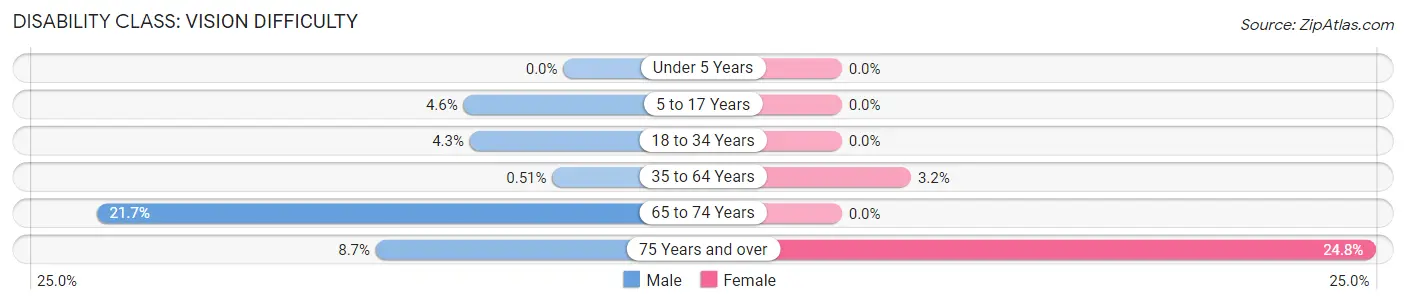
| Age Bracket | Male | Female |
| Under 5 Years | 0 (0.0%) | 0 (0.0%) |
| 5 to 17 Years | 22 (4.6%) | 0 (0.0%) |
| 18 to 34 Years | 27 (4.3%) | 0 (0.0%) |
| 35 to 64 Years | 4 (0.5%) | 26 (3.2%) |
| 65 to 74 Years | 34 (21.7%) | 0 (0.0%) |
| 75 Years and over | 8 (8.7%) | 25 (24.7%) |
Disability Class: Cognitive Difficulty
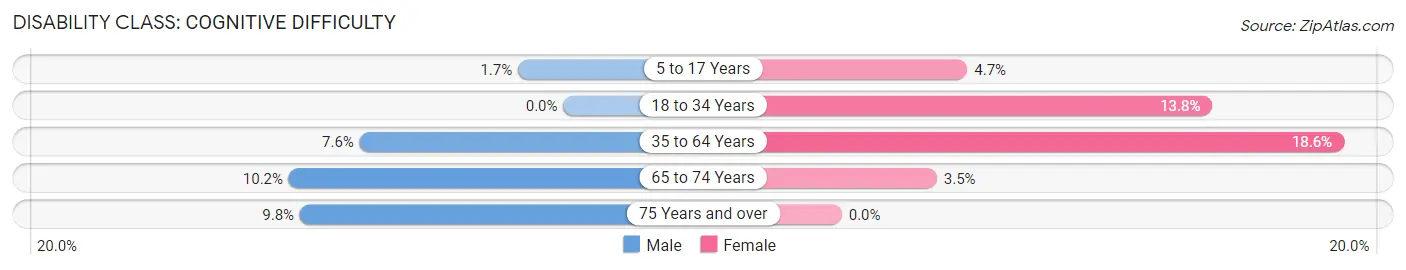
| Age Bracket | Male | Female |
| 5 to 17 Years | 8 (1.7%) | 25 (4.7%) |
| 18 to 34 Years | 0 (0.0%) | 95 (13.8%) |
| 35 to 64 Years | 59 (7.6%) | 151 (18.6%) |
| 65 to 74 Years | 16 (10.2%) | 6 (3.5%) |
| 75 Years and over | 9 (9.8%) | 0 (0.0%) |
Disability Class: Ambulatory Difficulty
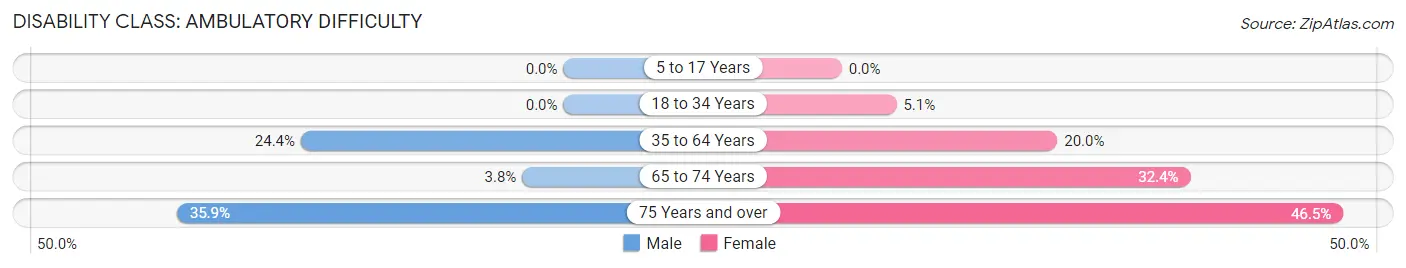
| Age Bracket | Male | Female |
| 5 to 17 Years | 0 (0.0%) | 0 (0.0%) |
| 18 to 34 Years | 0 (0.0%) | 35 (5.1%) |
| 35 to 64 Years | 190 (24.4%) | 162 (20.0%) |
| 65 to 74 Years | 6 (3.8%) | 55 (32.4%) |
| 75 Years and over | 33 (35.9%) | 47 (46.5%) |
Disability Class: Self-Care Difficulty
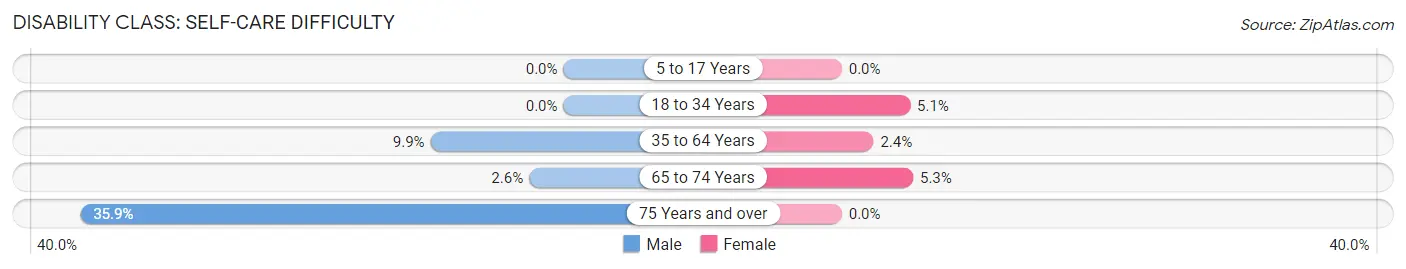
| Age Bracket | Male | Female |
| 5 to 17 Years | 0 (0.0%) | 0 (0.0%) |
| 18 to 34 Years | 0 (0.0%) | 35 (5.1%) |
| 35 to 64 Years | 77 (9.9%) | 19 (2.4%) |
| 65 to 74 Years | 4 (2.5%) | 9 (5.3%) |
| 75 Years and over | 33 (35.9%) | 0 (0.0%) |
Technology Access in Liberty
Computing Device Access in Liberty
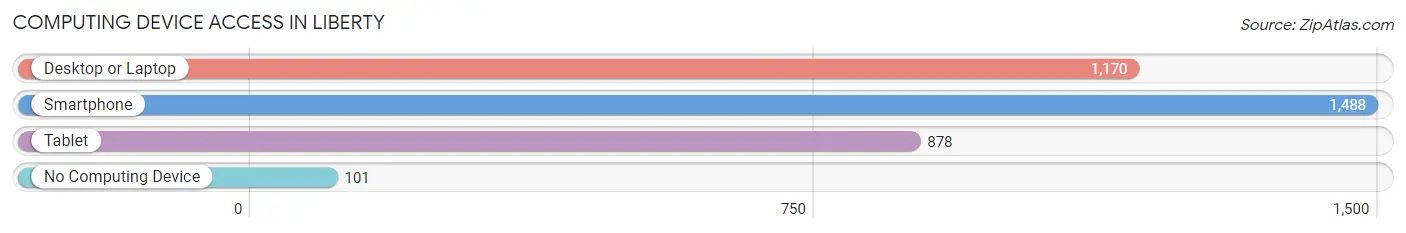
| Device Type | # Households | % Households |
| Desktop or Laptop | 1,170 | 68.5% |
| Smartphone | 1,488 | 87.2% |
| Tablet | 878 | 51.4% |
| No Computing Device | 101 | 5.9% |
| Total | 1,707 | 100.0% |
Internet Access in Liberty
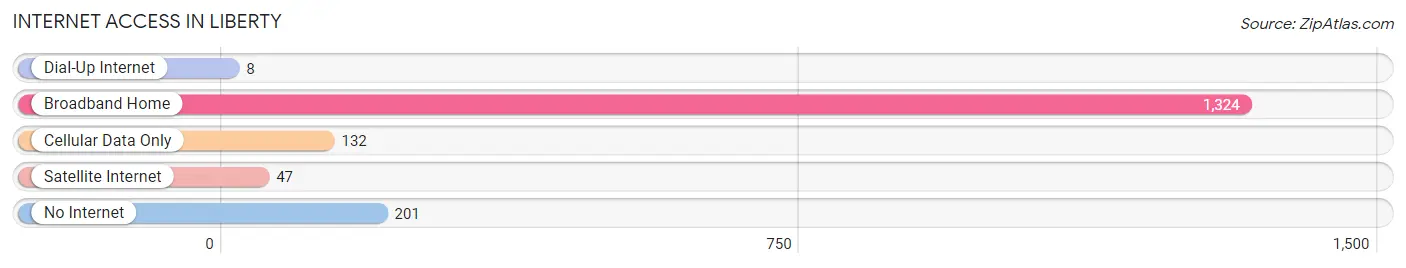
| Internet Type | # Households | % Households |
| Dial-Up Internet | 8 | 0.5% |
| Broadband Home | 1,324 | 77.6% |
| Cellular Data Only | 132 | 7.7% |
| Satellite Internet | 47 | 2.8% |
| No Internet | 201 | 11.8% |
| Total | 1,707 | 100.0% |
Liberty Summary
Liberty is a town located in Sullivan County, New York, United States. The population was 4,912 at the 2010 census. The town is in the western part of the county, northwest of Monticello.
Geography
Liberty is located in the western part of Sullivan County, northwest of Monticello. The town is bordered by the towns of Bethel to the north, Lumberland to the east, Fallsburg to the south, and Neversink to the west.
According to the United States Census Bureau, the town has a total area of 44.2sqmi, of which 43.9sqmi is land and 0.3sqmi, or 0.68%, is water.
History
The town of Liberty was formed in 1807 from the town of Lumberland. The town was named after the Revolutionary War hero, General Peter Muhlenberg, who was known as the "Liberty General".
The first settlers in the area were German Palatines who arrived in 1723. The first school in the town was established in 1790.
The town was the site of the first iron mine in the United States, which opened in 1765. The mine was located near the hamlet of Ferndale.
The town was also the site of the first sawmill in the United States which opened in 1767
Economy
The economy of Liberty is largely based on tourism. The town is home to several ski resorts, including Belleayre Mountain Ski Center, which is owned by the state of New York.
The town is also home to several wineries, including the Liberty Vineyards and Winery, which produces a variety of wines.
Demographics
As of the census of 2000, there were 4,845 people, 1,845 households, and 1,323 families residing in the town. The population density was 110.2 people per square mile (42.5/km^2). There were 2,541 housing units at an average density of 57.9 per square mile (22.4/km^2). The racial makeup of the town was 92.45% White, 4.45% African American, 0.25% Native American, 0.62% Asian, 0.02% Pacific Islander, 0.83% from other races, and 1.38% from two or more races. Hispanic or Latino of any race were 3.17% of the population.
There were 1,845 households, out of which 28.7% had children under the age of 18 living with them, 54.2% were married couples living together, 11.2% had a female householder with no husband present, and 30.2% were non-families. 25.2% of all households were made up of individuals, and 11.2% had someone living alone who was 65 years of age or older. The average household size was 2.51 and the average family size was 3.01.
In the town, the population was spread out, with 22.7% under the age of 18, 6.7% from 18 to 24, 28.2% from 25 to 44, 25.2% from 45 to 64, and 17.2% who were 65 years of age or older. The median age was 40 years. For every 100 females, there were 97.2 males. For every 100 females age 18 and over, there were 94.2 males.
The median income for a household in the town was $37,917, and the median income for a family was $45,000. Males had a median income of $31,964 versus $25,000 for females. The per capita income for the town was $18,945. About 8.2% of families and 11.2% of the population were below the poverty line, including 14.2% of those under age 18 and 8.2% of those age 65 or over.
Common Questions
What is the Total Population of Liberty?
Total Population of Liberty is 5,030.
What is the Total Male Population of Liberty?
Total Male Population of Liberty is 2,429.
What is the Total Female Population of Liberty?
Total Female Population of Liberty is 2,601.
What is the Ratio of Males per 100 Females in Liberty?
There are 93.39 Males per 100 Females in Liberty.
What is the Ratio of Females per 100 Males in Liberty?
There are 107.08 Females per 100 Males in Liberty.
What is the Median Population Age in Liberty?
Median Population Age in Liberty is 32.2 Years.
What is the Average Family Size in Liberty
Average Family Size in Liberty is 3.9 People.
What is the Average Household Size in Liberty
Average Household Size in Liberty is 2.8 People.
What is Per Capita Income in Liberty?
Per Capita income in Liberty is $21,472.
What is the Median Family Income in Liberty?
Median Family Income in Liberty is $52,712.
What is the Median Household income in Liberty?
Median Household Income in Liberty is $43,594.
What is Income or Wage Gap in Liberty?
Income or Wage Gap in Liberty is 2.8%.
Women in Liberty earn 97.2 cents for every dollar earned by a man.
What is Inequality or Gini Index in Liberty?
Inequality or Gini Index in Liberty is 0.44.
How Large is the Labor Force in Liberty?
There are 2,105 People in the Labor Forcein in Liberty.
What is the Percentage of People in the Labor Force in Liberty?
57.4% of People are in the Labor Force in Liberty.
What is the Unemployment Rate in Liberty?
Unemployment Rate in Liberty is 7.6%.