Cities with the Most Immigrants from Honduras in Indiana
RELATED REPORTS & OPTIONS
Honduras
Indiana
Compare Cities
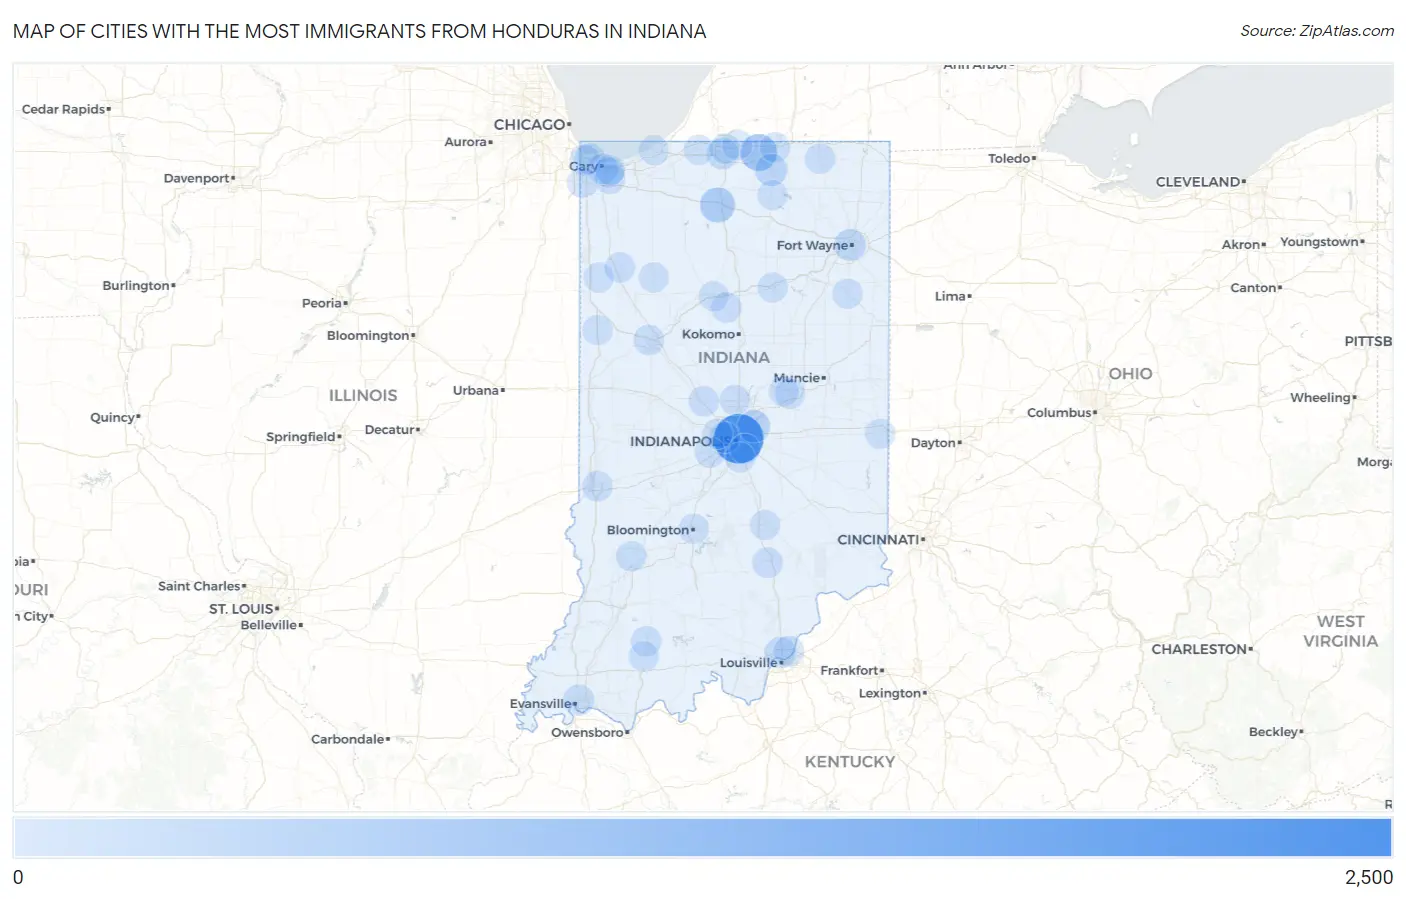
Map of Cities with the Most Immigrants from Honduras in Indiana
0
2,500
Cities with the Most Immigrants from Honduras in Indiana
| City | Honduras | vs State | vs National | |
| 1. | Indianapolis | 2,268 | 5,892(38.49%)#1 | 727,303(0.31%)#33 |
| 2. | Elkhart | 749 | 5,892(12.71%)#2 | 727,303(0.10%)#140 |
| 3. | Plymouth | 526 | 5,892(8.93%)#3 | 727,303(0.07%)#203 |
| 4. | Lawrence | 277 | 5,892(4.70%)#4 | 727,303(0.04%)#387 |
| 5. | Goshen | 223 | 5,892(3.78%)#5 | 727,303(0.03%)#455 |
| 6. | Fort Wayne | 183 | 5,892(3.11%)#6 | 727,303(0.03%)#546 |
| 7. | South Bend | 145 | 5,892(2.46%)#7 | 727,303(0.02%)#663 |
| 8. | Clarksville | 128 | 5,892(2.17%)#8 | 727,303(0.02%)#726 |
| 9. | East Chicago | 96 | 5,892(1.63%)#9 | 727,303(0.01%)#909 |
| 10. | Evansville | 83 | 5,892(1.41%)#10 | 727,303(0.01%)#1,002 |
| 11. | Speedway | 81 | 5,892(1.37%)#11 | 727,303(0.01%)#1,019 |
| 12. | Hammond | 75 | 5,892(1.27%)#12 | 727,303(0.01%)#1,065 |
| 13. | Seymour | 53 | 5,892(0.90%)#13 | 727,303(0.01%)#1,331 |
| 14. | Jeffersonville | 49 | 5,892(0.83%)#14 | 727,303(0.01%)#1,376 |
| 15. | West Lafayette | 43 | 5,892(0.73%)#15 | 727,303(0.01%)#1,470 |
| 16. | Westfield | 38 | 5,892(0.64%)#16 | 727,303(0.01%)#1,570 |
| 17. | Walton | 37 | 5,892(0.63%)#17 | 727,303(0.01%)#1,610 |
| 18. | Terre Haute | 33 | 5,892(0.56%)#18 | 727,303(0.00%)#1,682 |
| 19. | Lebanon | 31 | 5,892(0.53%)#19 | 727,303(0.00%)#1,733 |
| 20. | Gary | 30 | 5,892(0.51%)#20 | 727,303(0.00%)#1,744 |
| 21. | Hobart | 29 | 5,892(0.49%)#21 | 727,303(0.00%)#1,776 |
| 22. | Jasper | 27 | 5,892(0.46%)#22 | 727,303(0.00%)#1,841 |
| 23. | Lagrange | 25 | 5,892(0.42%)#23 | 727,303(0.00%)#1,901 |
| 24. | Lyons | 25 | 5,892(0.42%)#24 | 727,303(0.00%)#1,906 |
| 25. | Plainfield | 24 | 5,892(0.41%)#25 | 727,303(0.00%)#1,917 |
| 26. | New Chicago | 23 | 5,892(0.39%)#26 | 727,303(0.00%)#1,975 |
| 27. | Clermont | 22 | 5,892(0.37%)#27 | 727,303(0.00%)#2,007 |
| 28. | Dyer | 20 | 5,892(0.34%)#28 | 727,303(0.00%)#2,073 |
| 29. | Rensselaer | 19 | 5,892(0.32%)#29 | 727,303(0.00%)#2,123 |
| 30. | Milford | 17 | 5,892(0.29%)#30 | 727,303(0.00%)#2,192 |
| 31. | Bluffton | 16 | 5,892(0.27%)#31 | 727,303(0.00%)#2,230 |
| 32. | Anderson | 15 | 5,892(0.25%)#32 | 727,303(0.00%)#2,256 |
| 33. | Lake Station | 14 | 5,892(0.24%)#33 | 727,303(0.00%)#2,315 |
| 34. | Richmond | 12 | 5,892(0.20%)#34 | 727,303(0.00%)#2,405 |
| 35. | Granger | 12 | 5,892(0.20%)#35 | 727,303(0.00%)#2,408 |
| 36. | Huntingburg | 11 | 5,892(0.19%)#36 | 727,303(0.00%)#2,481 |
| 37. | Bristol | 11 | 5,892(0.19%)#37 | 727,303(0.00%)#2,496 |
| 38. | Beech Grove | 10 | 5,892(0.17%)#38 | 727,303(0.00%)#2,534 |
| 39. | Monon | 10 | 5,892(0.17%)#39 | 727,303(0.00%)#2,567 |
| 40. | Bloomington | 9 | 5,892(0.15%)#40 | 727,303(0.00%)#2,587 |
| 41. | Wabash | 9 | 5,892(0.15%)#41 | 727,303(0.00%)#2,616 |
| 42. | Boswell | 9 | 5,892(0.15%)#42 | 727,303(0.00%)#2,647 |
| 43. | Michigan City | 7 | 5,892(0.12%)#43 | 727,303(0.00%)#2,710 |
| 44. | Logansport | 6 | 5,892(0.10%)#44 | 727,303(0.00%)#2,787 |
| 45. | Roseland | 6 | 5,892(0.10%)#45 | 727,303(0.00%)#2,832 |
| 46. | Edgewood | 5 | 5,892(0.08%)#46 | 727,303(0.00%)#2,880 |
| 47. | New Carlisle | 4 | 5,892(0.07%)#47 | 727,303(0.00%)#2,941 |
| 48. | Columbus | 2 | 5,892(0.03%)#48 | 727,303(0.00%)#3,050 |
| 49. | Southport | 2 | 5,892(0.03%)#49 | 727,303(0.00%)#3,073 |
| 50. | Brook | 2 | 5,892(0.03%)#50 | 727,303(0.00%)#3,086 |
Common Questions
What are the Top 10 Cities with the Most Immigrants from Honduras in Indiana?
Top 10 Cities with the Most Immigrants from Honduras in Indiana are:
#1
2,268
#2
749
#3
526
#4
277
#5
223
#6
183
#7
145
#8
128
#9
96
#10
83
What city has the Most Immigrants from Honduras in Indiana?
Indianapolis has the Most Immigrants from Honduras in Indiana with 2,268.
What is the Total Immigrants from Honduras in the State of Indiana?
Total Immigrants from Honduras in Indiana is 5,892.
What is the Total Immigrants from Honduras in the United States?
Total Immigrants from Honduras in the United States is 727,303.