South Fallsburg, NY
South Fallsburg Map
South Fallsburg Overview
1,938
TOTAL POPULATION
948
MALE POPULATION
990
FEMALE POPULATION
95.76
MALES / 100 FEMALES
104.43
FEMALES / 100 MALES
35.0
MEDIAN AGE
3.6
AVG FAMILY SIZE
2.7
AVG HOUSEHOLD SIZE
$27,484
PER CAPITA INCOME
$74,286
AVG FAMILY INCOME
0.55
INEQUALITY / GINI INDEX
775
LABOR FORCE [ PEOPLE ]
58.6%
PERCENT IN LABOR FORCE
South Fallsburg Zip Codes
South Fallsburg Area Codes
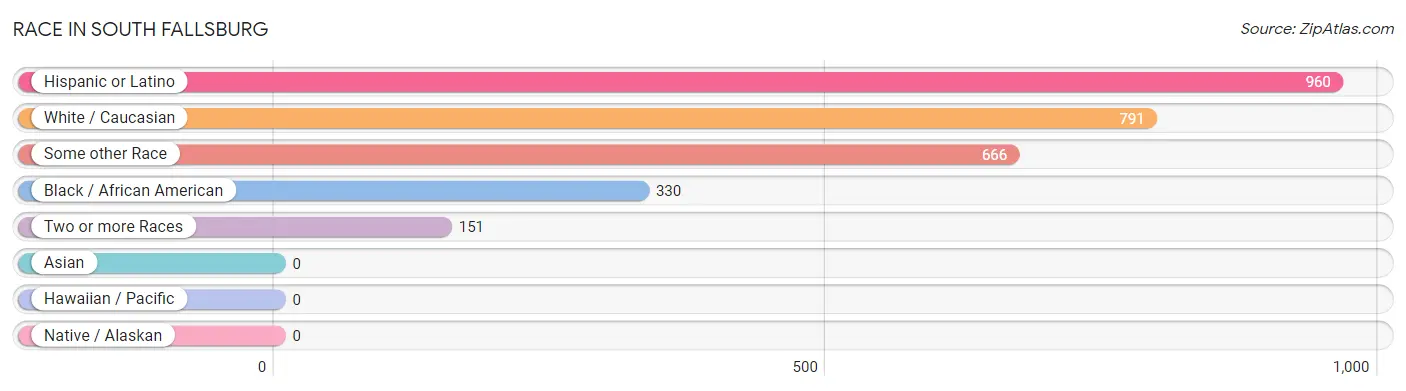
Race in South Fallsburg
The most populous races in South Fallsburg are Hispanic or Latino (960 | 49.5%), White / Caucasian (791 | 40.8%), and Some other Race (666 | 34.4%).
| Race | # Population | % Population |
| Asian | 0 | 0.0% |
| Black / African American | 330 | 17.0% |
| Hawaiian / Pacific | 0 | 0.0% |
| Hispanic or Latino | 960 | 49.5% |
| Native / Alaskan | 0 | 0.0% |
| White / Caucasian | 791 | 40.8% |
| Two or more Races | 151 | 7.8% |
| Some other Race | 666 | 34.4% |
| Total | 1,938 | 100.0% |
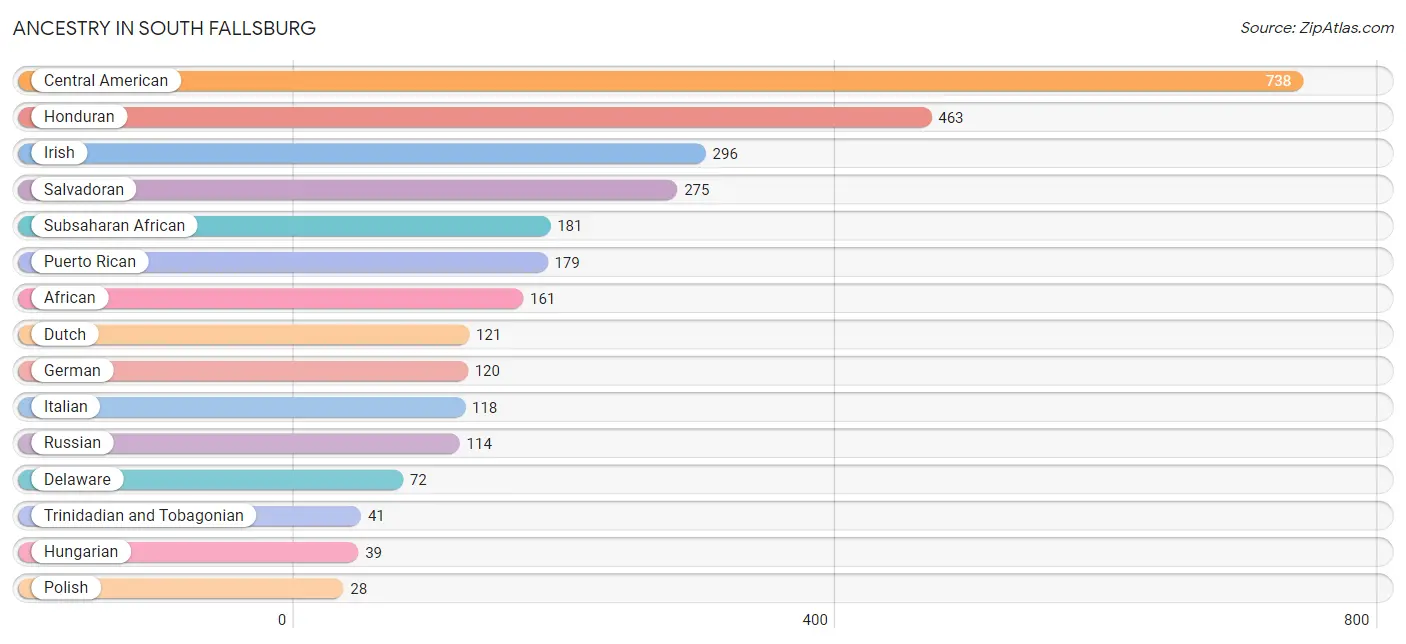
Ancestry in South Fallsburg
The most populous ancestries reported in South Fallsburg are Central American (738 | 38.1%), Honduran (463 | 23.9%), Irish (296 | 15.3%), Salvadoran (275 | 14.2%), and Subsaharan African (181 | 9.3%), together accounting for 100.8% of all South Fallsburg residents.
| Ancestry | # Population | % Population |
| African | 161 | 8.3% |
| Armenian | 22 | 1.1% |
| Central American | 738 | 38.1% |
| Cherokee | 5 | 0.3% |
| Delaware | 72 | 3.7% |
| Dominican | 16 | 0.8% |
| Dutch | 121 | 6.2% |
| German | 120 | 6.2% |
| Honduran | 463 | 23.9% |
| Hungarian | 39 | 2.0% |
| Irish | 296 | 15.3% |
| Iroquois | 5 | 0.3% |
| Italian | 118 | 6.1% |
| Polish | 28 | 1.4% |
| Puerto Rican | 179 | 9.2% |
| Russian | 114 | 5.9% |
| Salvadoran | 275 | 14.2% |
| Spanish | 23 | 1.2% |
| Subsaharan African | 181 | 9.3% |
| Trinidadian and Tobagonian | 41 | 2.1% | View All 20 Rows |
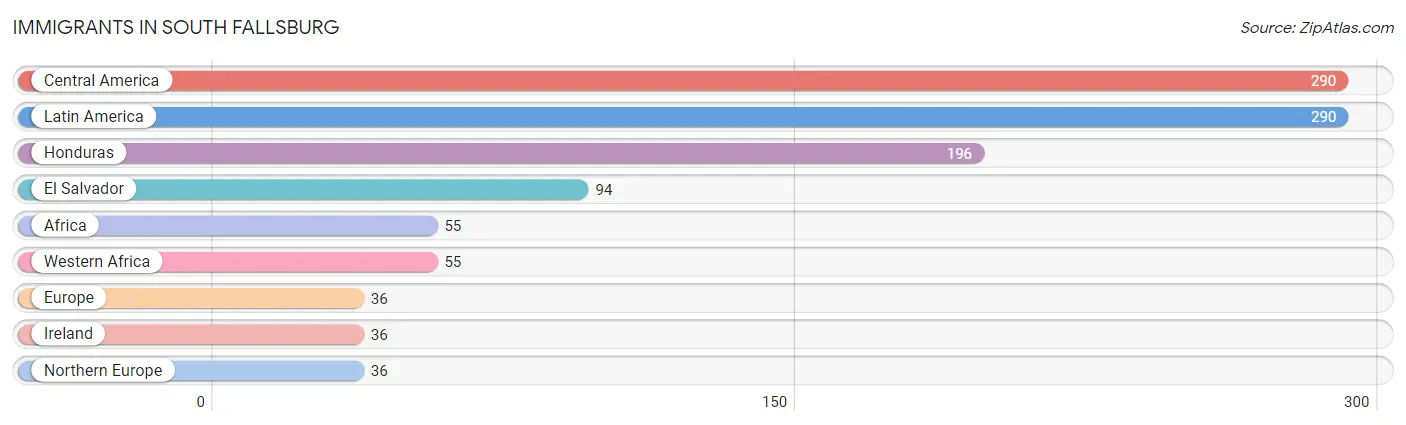
Immigrants in South Fallsburg
The most numerous immigrant groups reported in South Fallsburg came from Central America (290 | 15.0%), Latin America (290 | 15.0%), Honduras (196 | 10.1%), El Salvador (94 | 4.9%), and Africa (55 | 2.8%), together accounting for 47.7% of all South Fallsburg residents.
| Immigration Origin | # Population | % Population |
| Africa | 55 | 2.8% |
| Central America | 290 | 15.0% |
| El Salvador | 94 | 4.9% |
| Europe | 36 | 1.9% |
| Honduras | 196 | 10.1% |
| Ireland | 36 | 1.9% |
| Latin America | 290 | 15.0% |
| Northern Europe | 36 | 1.9% |
| Western Africa | 55 | 2.8% | View All 9 Rows |
Sex and Age in South Fallsburg
Sex and Age in South Fallsburg
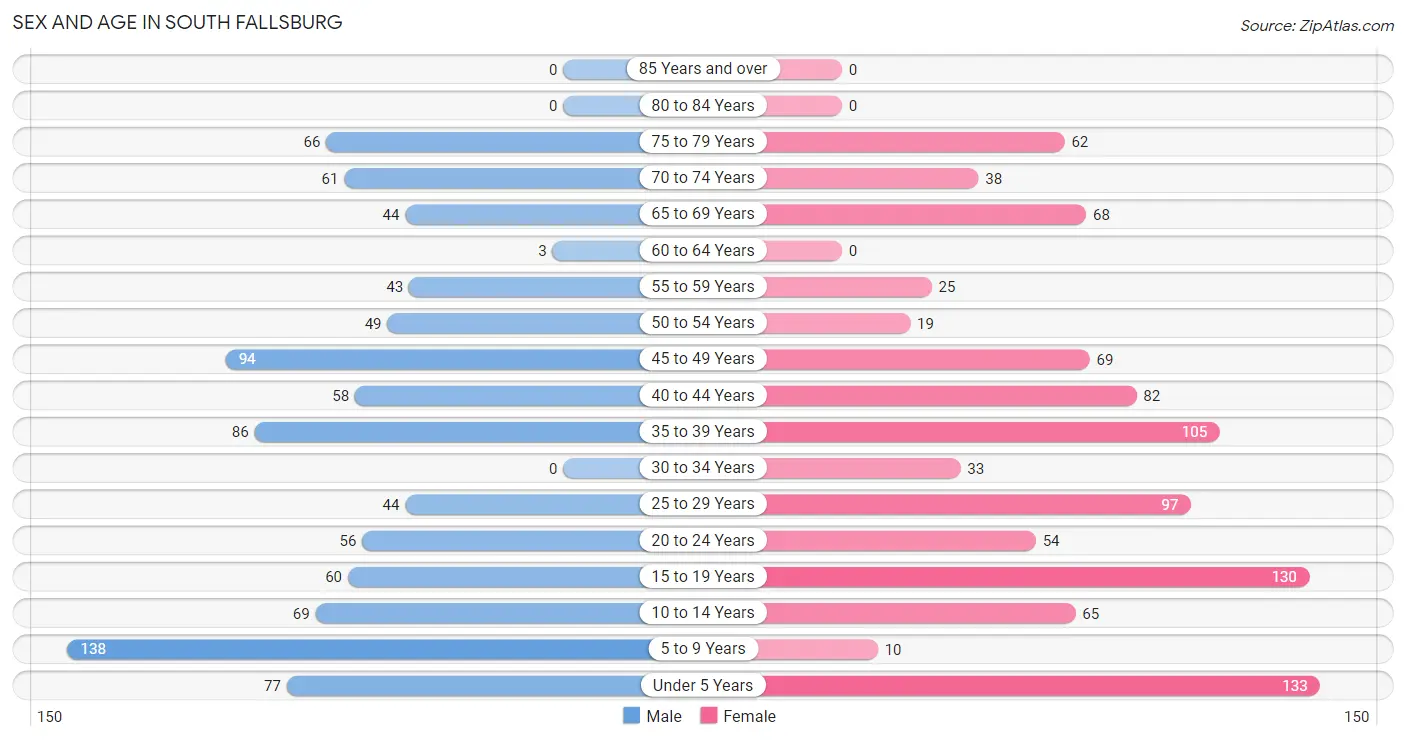
The most populous age groups in South Fallsburg are 5 to 9 Years (138 | 14.6%) for men and Under 5 Years (133 | 13.4%) for women.
| Age Bracket | Male | Female |
| Under 5 Years | 77 (8.1%) | 133 (13.4%) |
| 5 to 9 Years | 138 (14.6%) | 10 (1.0%) |
| 10 to 14 Years | 69 (7.3%) | 65 (6.6%) |
| 15 to 19 Years | 60 (6.3%) | 130 (13.1%) |
| 20 to 24 Years | 56 (5.9%) | 54 (5.4%) |
| 25 to 29 Years | 44 (4.6%) | 97 (9.8%) |
| 30 to 34 Years | 0 (0.0%) | 33 (3.3%) |
| 35 to 39 Years | 86 (9.1%) | 105 (10.6%) |
| 40 to 44 Years | 58 (6.1%) | 82 (8.3%) |
| 45 to 49 Years | 94 (9.9%) | 69 (7.0%) |
| 50 to 54 Years | 49 (5.2%) | 19 (1.9%) |
| 55 to 59 Years | 43 (4.5%) | 25 (2.5%) |
| 60 to 64 Years | 3 (0.3%) | 0 (0.0%) |
| 65 to 69 Years | 44 (4.6%) | 68 (6.9%) |
| 70 to 74 Years | 61 (6.4%) | 38 (3.8%) |
| 75 to 79 Years | 66 (7.0%) | 62 (6.3%) |
| 80 to 84 Years | 0 (0.0%) | 0 (0.0%) |
| 85 Years and over | 0 (0.0%) | 0 (0.0%) |
| Total | 948 (100.0%) | 990 (100.0%) |
Families and Households in South Fallsburg
Median Family Size in South Fallsburg
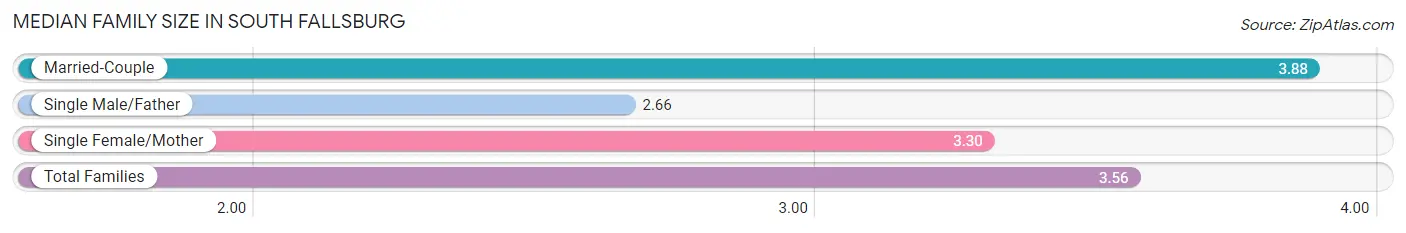
The median family size in South Fallsburg is 3.56 persons per family, with married-couple families (310 | 67.1%) accounting for the largest median family size of 3.88 persons per family. On the other hand, single male/father families (96 | 20.8%) represent the smallest median family size with 2.66 persons per family.
| Family Type | # Families | Family Size |
| Married-Couple | 310 (67.1%) | 3.88 |
| Single Male/Father | 96 (20.8%) | 2.66 |
| Single Female/Mother | 56 (12.1%) | 3.30 |
| Total Families | 462 (100.0%) | 3.56 |
Median Household Size in South Fallsburg
| Household Type | # Households | Household Size |
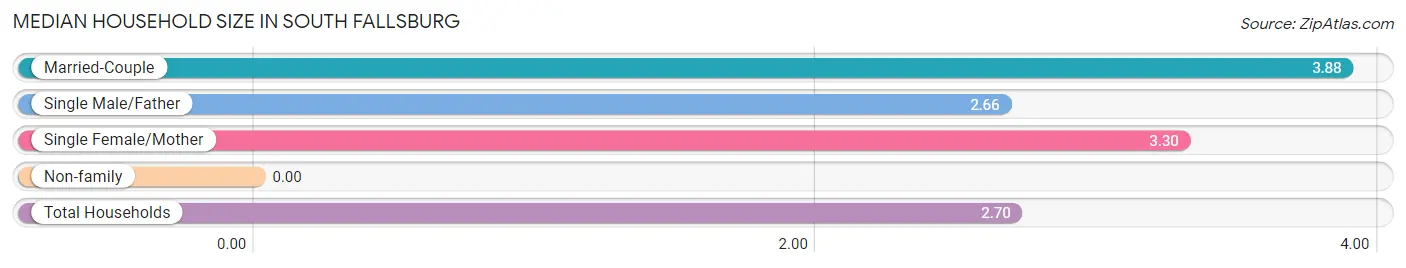
| Married-Couple | 310 (44.6%) | 3.88 |
| Single Male/Father | 96 (13.8%) | 2.66 |
| Single Female/Mother | 56 (8.1%) | 3.30 |
| Non-family | 233 (33.5%) | - |
| Total Households | 695 (100.0%) | 2.70 |
Household Size by Marriage Status in South Fallsburg
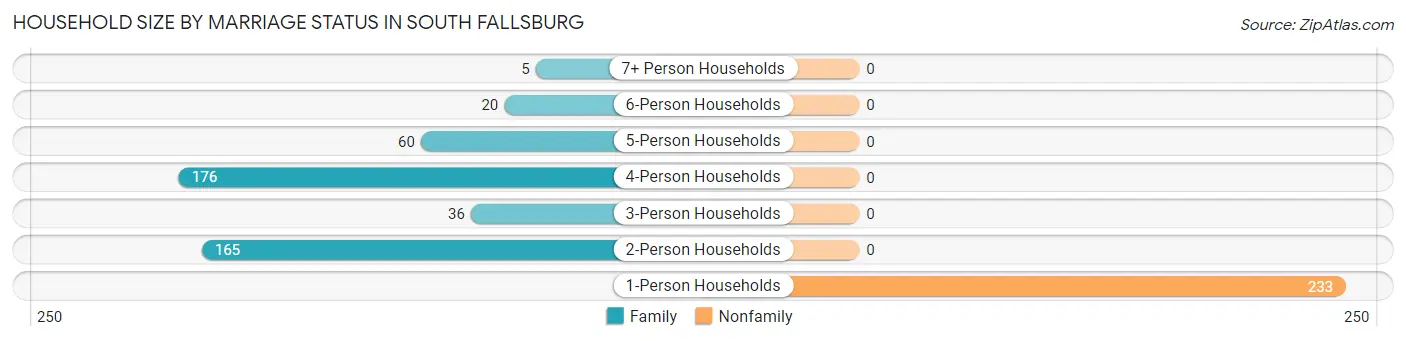
Out of a total of 695 households in South Fallsburg, 462 (66.5%) are family households, while 233 (33.5%) are nonfamily households. The most numerous type of family households are 4-person households, comprising 176, and the most common type of nonfamily households are 1-person households, comprising 233.
| Household Size | Family Households | Nonfamily Households |
| 1-Person Households | - | 233 (33.5%) |
| 2-Person Households | 165 (23.7%) | 0 (0.0%) |
| 3-Person Households | 36 (5.2%) | 0 (0.0%) |
| 4-Person Households | 176 (25.3%) | 0 (0.0%) |
| 5-Person Households | 60 (8.6%) | 0 (0.0%) |
| 6-Person Households | 20 (2.9%) | 0 (0.0%) |
| 7+ Person Households | 5 (0.7%) | 0 (0.0%) |
| Total | 462 (66.5%) | 233 (33.5%) |
Female Fertility in South Fallsburg
Fertility by Age in South Fallsburg
Average fertility rate in South Fallsburg is 195.0 births per 1,000 women. Women in the age bracket of 20 to 34 years have the highest fertility rate with 293.0 births per 1,000 women. Women in the age bracket of 35 to 50 years acount for 51.3% of all women with births.
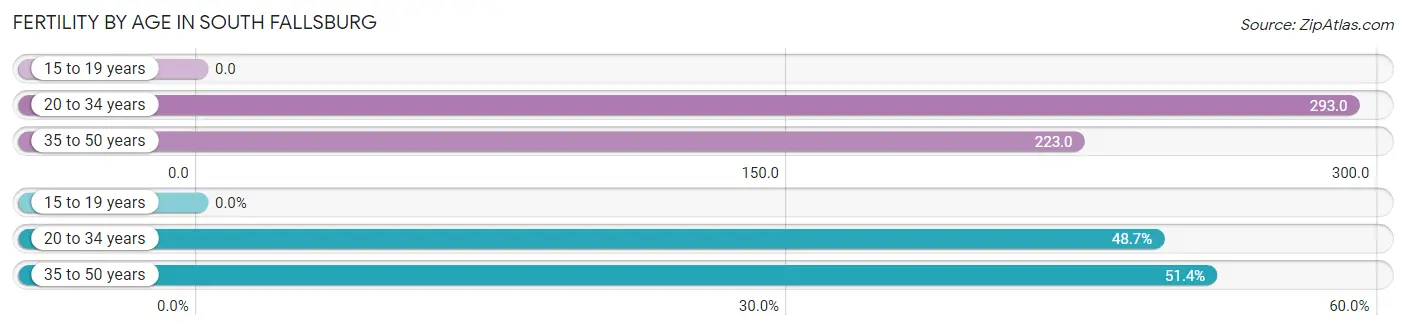
| Age Bracket | Women with Births | Births / 1,000 Women |
| 15 to 19 years | 0 (0.0%) | 0.0 |
| 20 to 34 years | 54 (48.6%) | 293.0 |
| 35 to 50 years | 57 (51.3%) | 223.0 |
| Total | 111 (100.0%) | 195.0 |
Fertility by Age by Marriage Status in South Fallsburg
51.4% of women with births (111) in South Fallsburg are married. The highest percentage of unmarried women with births falls into 20 to 34 years age bracket with 100.0% of them unmarried at the time of birth, while the lowest percentage of unmarried women with births belong to 35 to 50 years age bracket with 0.0% of them unmarried.
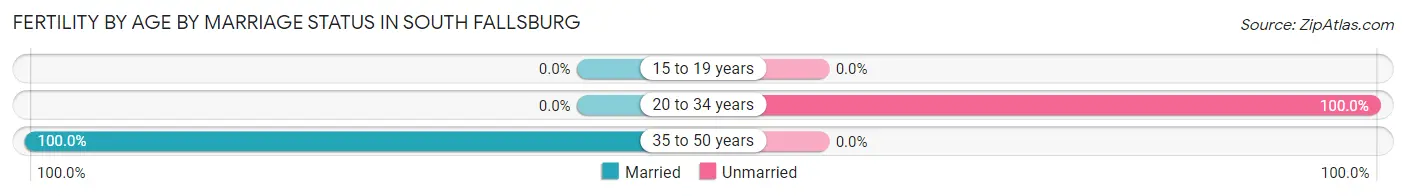
| Age Bracket | Married | Unmarried |
| 15 to 19 years | 0 (0.0%) | 0 (0.0%) |
| 20 to 34 years | 0 (0.0%) | 54 (100.0%) |
| 35 to 50 years | 57 (100.0%) | 0 (0.0%) |
| Total | 57 (51.3%) | 54 (48.6%) |
Fertility by Education in South Fallsburg
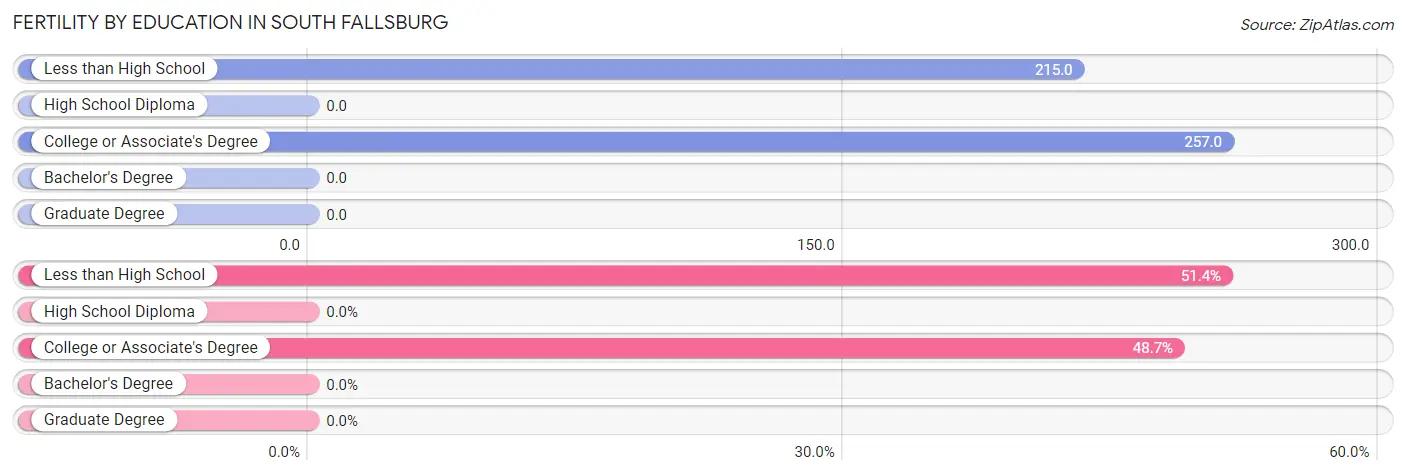
| Educational Attainment | Women with Births | Births / 1,000 Women |
| Less than High School | 57 (51.3%) | 215.0 |
| High School Diploma | 0 (0.0%) | 0.0 |
| College or Associate's Degree | 54 (48.6%) | 257.0 |
| Bachelor's Degree | 0 (0.0%) | 0.0 |
| Graduate Degree | 0 (0.0%) | 0.0 |
| Total | 111 (100.0%) | 195.0 |
Fertility by Education by Marriage Status in South Fallsburg
48.6% of women with births in South Fallsburg are unmarried. Women with the educational attainment of less than high school are most likely to be married with 100.0% of them married at childbirth, while women with the educational attainment of college or associate's degree are least likely to be married with 100.0% of them unmarried at childbirth.
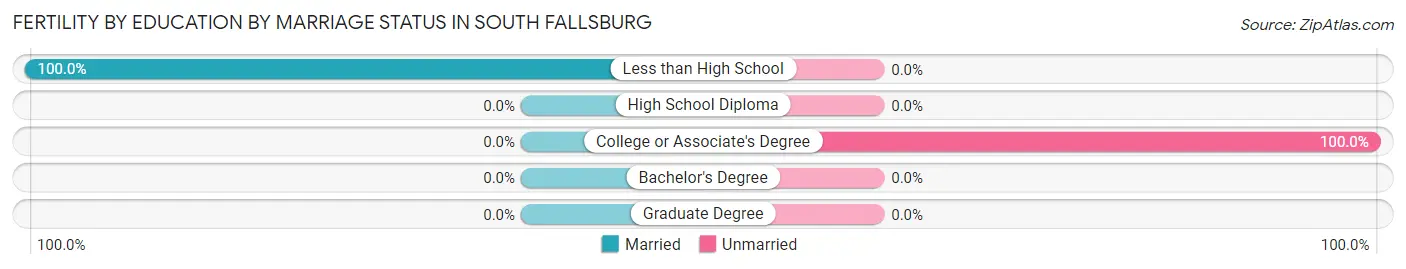
| Educational Attainment | Married | Unmarried |
| Less than High School | 57 (100.0%) | 0 (0.0%) |
| High School Diploma | 0 (0.0%) | 0 (0.0%) |
| College or Associate's Degree | 0 (0.0%) | 54 (100.0%) |
| Bachelor's Degree | 0 (0.0%) | 0 (0.0%) |
| Graduate Degree | 0 (0.0%) | 0 (0.0%) |
| Total | 57 (51.3%) | 54 (48.6%) |
Income in South Fallsburg
Income Overview in South Fallsburg
| Characteristic | Number | Measure |
| Per Capita Income | 1,938 | $27,484 |
| Median Family Income | 462 | $74,286 |
| Mean Family Income | 462 | $100,678 |
| Median Household Income | 695 | $0 |
| Mean Household Income | 695 | $71,063 |
| Income Deficit | 462 | $0 |
| Wage / Income Gap (%) | 1,938 | 0.00% |
| Wage / Income Gap ($) | 1,938 | 100.00¢ per $1 |
| Gini / Inequality Index | 1,938 | 0.55 |
Earnings by Sex in South Fallsburg
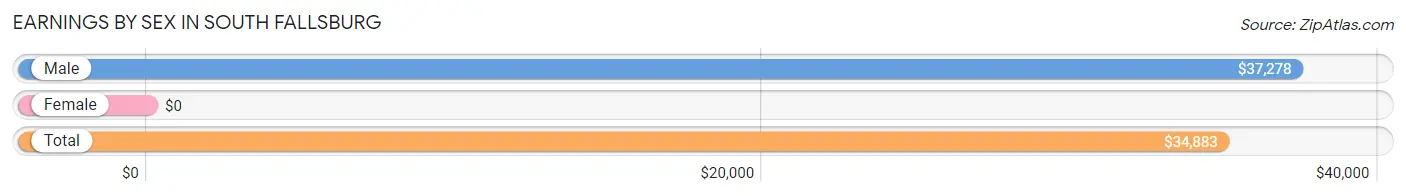
| Sex | Number | Average Earnings |
| Male | 500 (56.6%) | $37,278 |
| Female | 383 (43.4%) | $0 |
| Total | 883 (100.0%) | $34,883 |
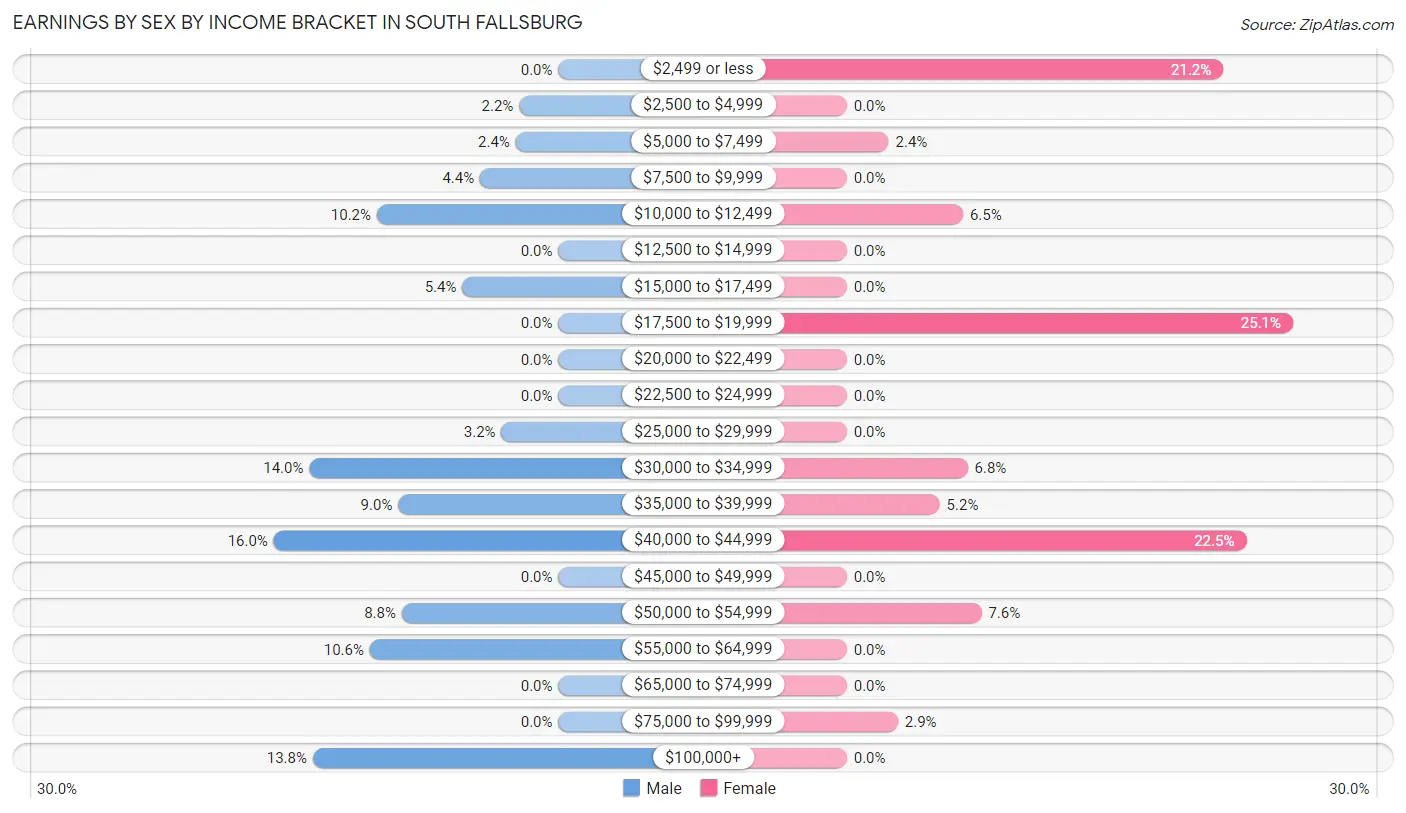
Earnings by Sex by Income Bracket in South Fallsburg
The most common earnings brackets in South Fallsburg are $40,000 to $44,999 for men (80 | 16.0%) and $17,500 to $19,999 for women (96 | 25.1%).
| Income | Male | Female |
| $2,499 or less | 0 (0.0%) | 81 (21.1%) |
| $2,500 to $4,999 | 11 (2.2%) | 0 (0.0%) |
| $5,000 to $7,499 | 12 (2.4%) | 9 (2.4%) |
| $7,500 to $9,999 | 22 (4.4%) | 0 (0.0%) |
| $10,000 to $12,499 | 51 (10.2%) | 25 (6.5%) |
| $12,500 to $14,999 | 0 (0.0%) | 0 (0.0%) |
| $15,000 to $17,499 | 27 (5.4%) | 0 (0.0%) |
| $17,500 to $19,999 | 0 (0.0%) | 96 (25.1%) |
| $20,000 to $22,499 | 0 (0.0%) | 0 (0.0%) |
| $22,500 to $24,999 | 0 (0.0%) | 0 (0.0%) |
| $25,000 to $29,999 | 16 (3.2%) | 0 (0.0%) |
| $30,000 to $34,999 | 70 (14.0%) | 26 (6.8%) |
| $35,000 to $39,999 | 45 (9.0%) | 20 (5.2%) |
| $40,000 to $44,999 | 80 (16.0%) | 86 (22.5%) |
| $45,000 to $49,999 | 0 (0.0%) | 0 (0.0%) |
| $50,000 to $54,999 | 44 (8.8%) | 29 (7.6%) |
| $55,000 to $64,999 | 53 (10.6%) | 0 (0.0%) |
| $65,000 to $74,999 | 0 (0.0%) | 0 (0.0%) |
| $75,000 to $99,999 | 0 (0.0%) | 11 (2.9%) |
| $100,000+ | 69 (13.8%) | 0 (0.0%) |
| Total | 500 (100.0%) | 383 (100.0%) |
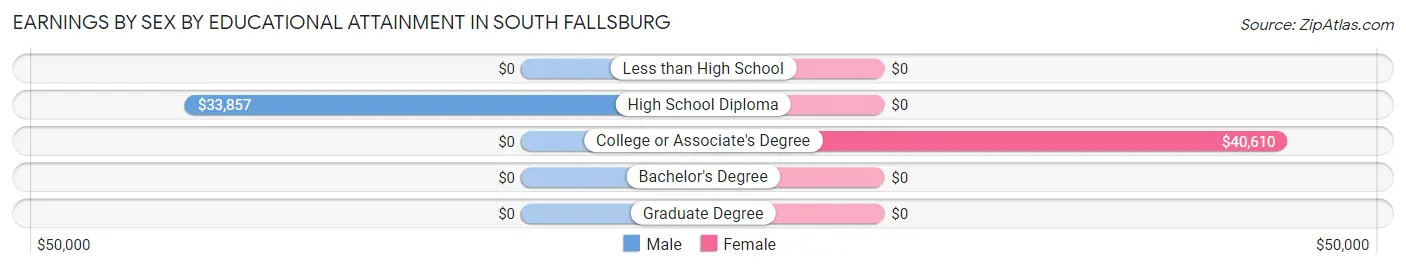
Earnings by Sex by Educational Attainment in South Fallsburg
Average earnings in South Fallsburg are $36,694 for men and $38,063 for women, a difference of 3.6%. Men with an educational attainment of high school diploma enjoy the highest average annual earnings of $33,857, while those with high school diploma education earn the least with $33,857. Women with an educational attainment of college or associate's degree earn the most with the average annual earnings of $40,610, while those with college or associate's degree education have the smallest earnings of $40,610.
| Educational Attainment | Male Income | Female Income |
| Less than High School | - | - |
| High School Diploma | $33,857 | $0 |
| College or Associate's Degree | - | - |
| Bachelor's Degree | - | - |
| Graduate Degree | - | - |
| Total | $36,694 | $38,063 |
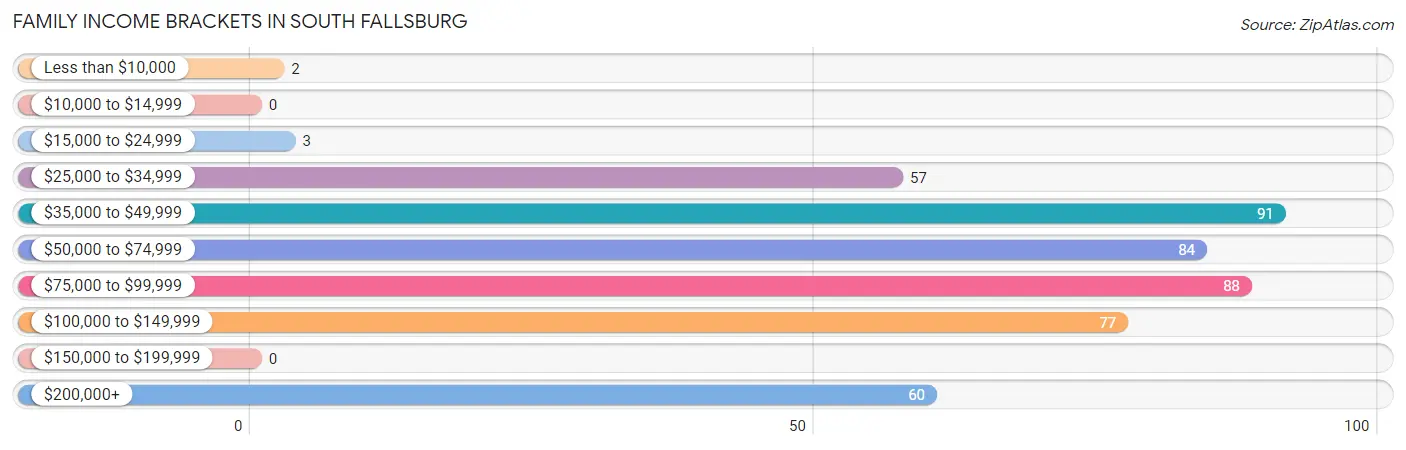
Family Income in South Fallsburg
Family Income Brackets in South Fallsburg
According to the South Fallsburg family income data, there are 91 families falling into the $35,000 to $49,999 income range, which is the most common income bracket and makes up 19.7% of all families.
| Income Bracket | # Families | % Families |
| Less than $10,000 | 2 | 0.4% |
| $10,000 to $14,999 | 0 | 0.0% |
| $15,000 to $24,999 | 3 | 0.6% |
| $25,000 to $34,999 | 57 | 12.3% |
| $35,000 to $49,999 | 91 | 19.7% |
| $50,000 to $74,999 | 84 | 18.2% |
| $75,000 to $99,999 | 88 | 19.0% |
| $100,000 to $149,999 | 77 | 16.7% |
| $150,000 to $199,999 | 0 | 0.0% |
| $200,000+ | 60 | 13.0% |
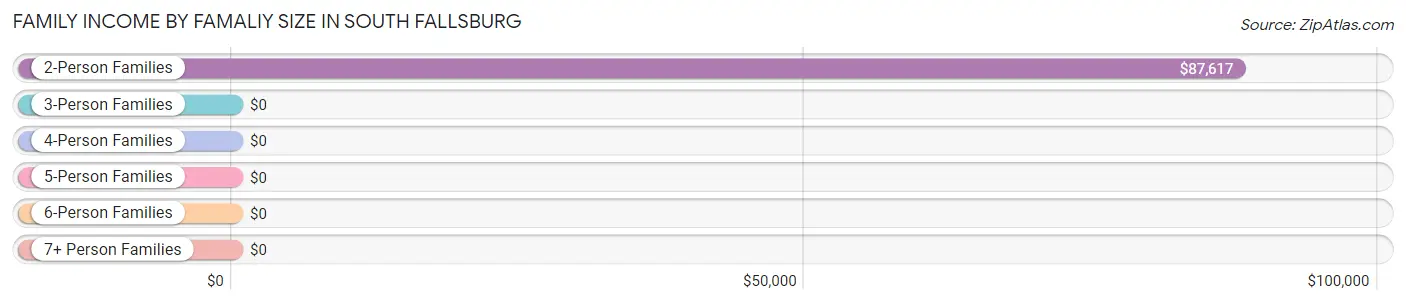
Family Income by Famaliy Size in South Fallsburg
2-person families (165 | 35.7%) account for the highest median family income in South Fallsburg with $87,617 per family, while 2-person families (165 | 35.7%) have the highest median income of $43,808 per family member.
| Income Bracket | # Families | Median Income |
| 2-Person Families | 165 (35.7%) | $87,617 |
| 3-Person Families | 36 (7.8%) | $0 |
| 4-Person Families | 176 (38.1%) | $0 |
| 5-Person Families | 60 (13.0%) | $0 |
| 6-Person Families | 20 (4.3%) | $0 |
| 7+ Person Families | 5 (1.1%) | $0 |
| Total | 462 (100.0%) | $74,286 |
Family Income by Number of Earners in South Fallsburg
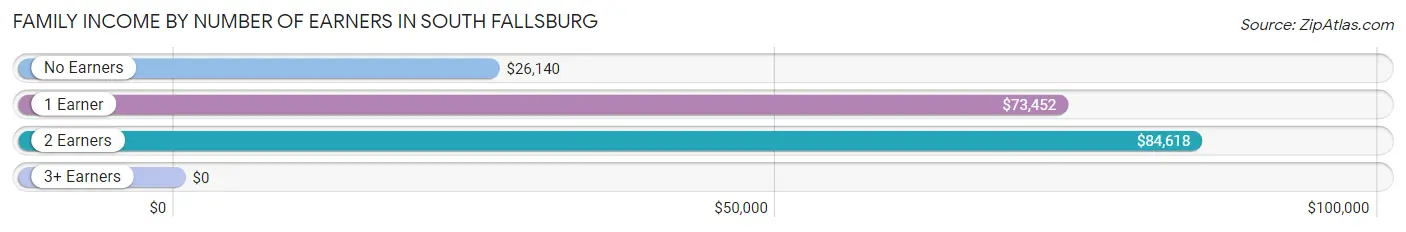
| Number of Earners | # Families | Median Income |
| No Earners | 62 (13.4%) | $26,140 |
| 1 Earner | 90 (19.5%) | $73,452 |
| 2 Earners | 285 (61.7%) | $84,618 |
| 3+ Earners | 25 (5.4%) | $0 |
| Total | 462 (100.0%) | $74,286 |
Household Income in South Fallsburg
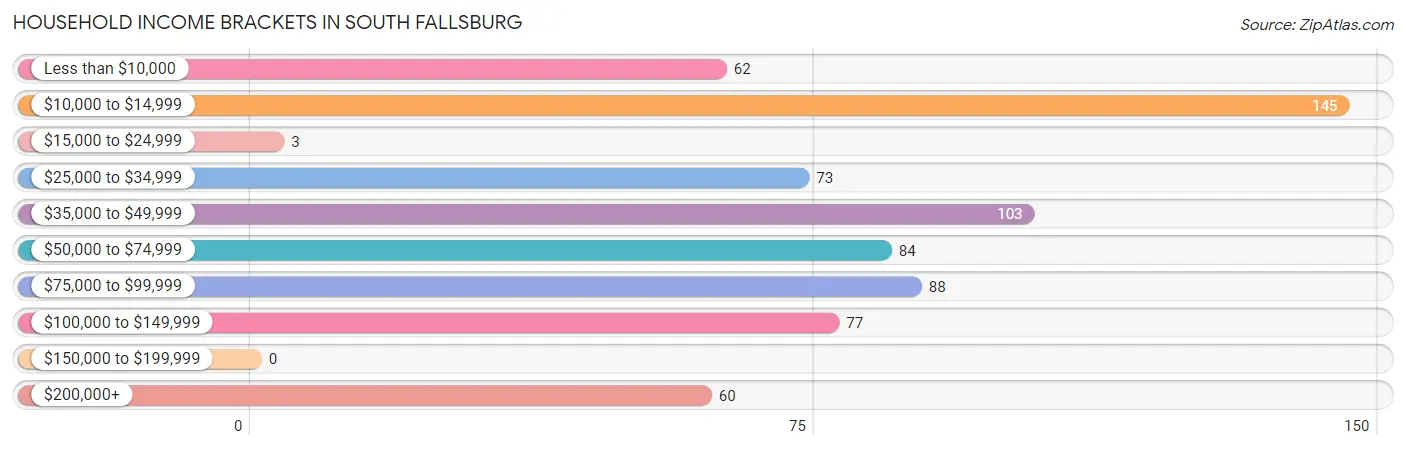
Household Income Brackets in South Fallsburg
With 145 households falling in the category, the $10,000 to $14,999 income range is the most frequent in South Fallsburg, accounting for 20.9% of all households.
| Income Bracket | # Households | % Households |
| Less than $10,000 | 62 | 8.9% |
| $10,000 to $14,999 | 145 | 20.9% |
| $15,000 to $24,999 | 3 | 0.4% |
| $25,000 to $34,999 | 73 | 10.5% |
| $35,000 to $49,999 | 103 | 14.8% |
| $50,000 to $74,999 | 84 | 12.1% |
| $75,000 to $99,999 | 88 | 12.7% |
| $100,000 to $149,999 | 77 | 11.1% |
| $150,000 to $199,999 | 0 | 0.0% |
| $200,000+ | 60 | 8.6% |
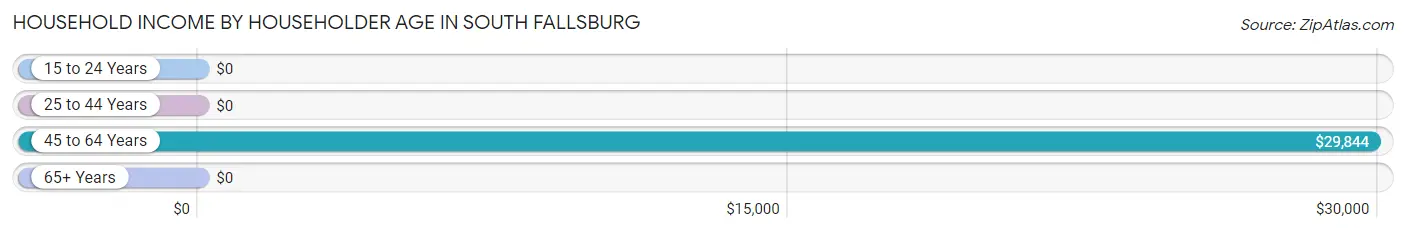
Household Income by Householder Age in South Fallsburg
The median household income in South Fallsburg is $0, with the highest median household income of $29,844 found in the 45 to 64 years age bracket for the primary householder. A total of 126 households (18.1%) fall into this category. Meanwhile, the 15 to 24 years age bracket for the primary householder has the lowest median household income of $0, with 54 households (7.8%) in this group.
| Income Bracket | # Households | Median Income |
| 15 to 24 Years | 54 (7.8%) | $0 |
| 25 to 44 Years | 323 (46.5%) | $0 |
| 45 to 64 Years | 126 (18.1%) | $29,844 |
| 65+ Years | 192 (27.6%) | $0 |
| Total | 695 (100.0%) | $0 |
Poverty in South Fallsburg
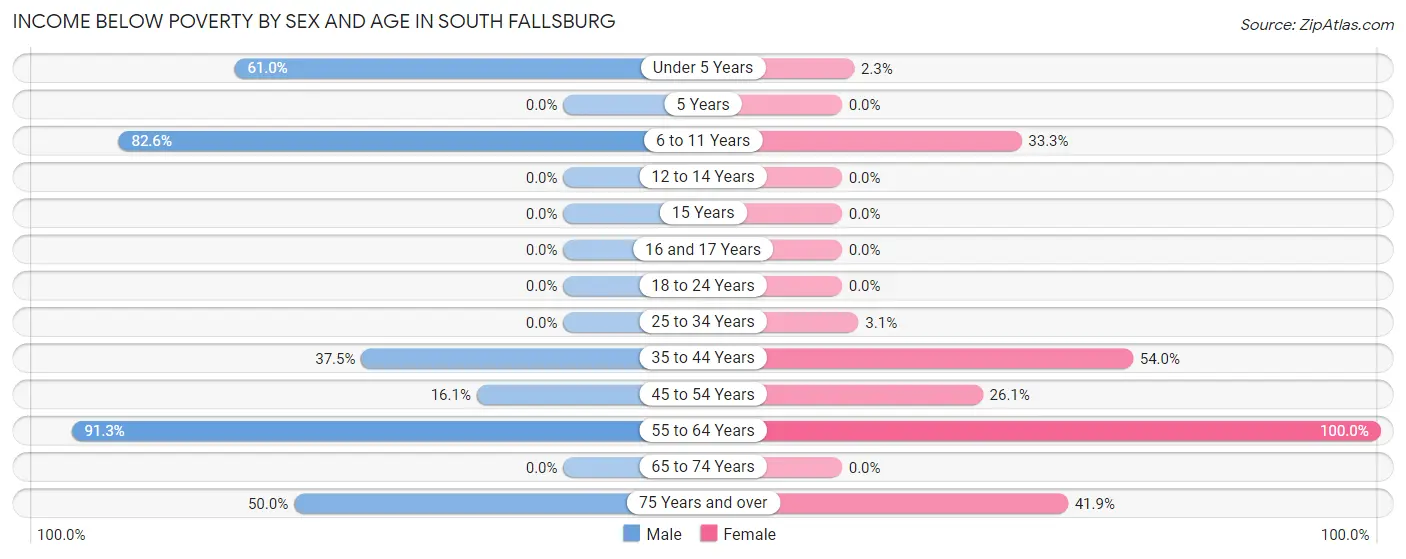
Income Below Poverty by Sex and Age in South Fallsburg
With 36.0% poverty level for males and 18.9% for females among the residents of South Fallsburg, 55 to 64 year old males and 55 to 64 year old females are the most vulnerable to poverty, with 42 males (91.3%) and 25 females (100.0%) in their respective age groups living below the poverty level.
| Age Bracket | Male | Female |
| Under 5 Years | 47 (61.0%) | 3 (2.3%) |
| 5 Years | 0 (0.0%) | 0 (0.0%) |
| 6 to 11 Years | 142 (82.6%) | 5 (33.3%) |
| 12 to 14 Years | 0 (0.0%) | 0 (0.0%) |
| 15 Years | 0 (0.0%) | 0 (0.0%) |
| 16 and 17 Years | 0 (0.0%) | 0 (0.0%) |
| 18 to 24 Years | 0 (0.0%) | 0 (0.0%) |
| 25 to 34 Years | 0 (0.0%) | 4 (3.1%) |
| 35 to 44 Years | 54 (37.5%) | 101 (54.0%) |
| 45 to 54 Years | 23 (16.1%) | 23 (26.1%) |
| 55 to 64 Years | 42 (91.3%) | 25 (100.0%) |
| 65 to 74 Years | 0 (0.0%) | 0 (0.0%) |
| 75 Years and over | 33 (50.0%) | 26 (41.9%) |
| Total | 341 (36.0%) | 187 (18.9%) |
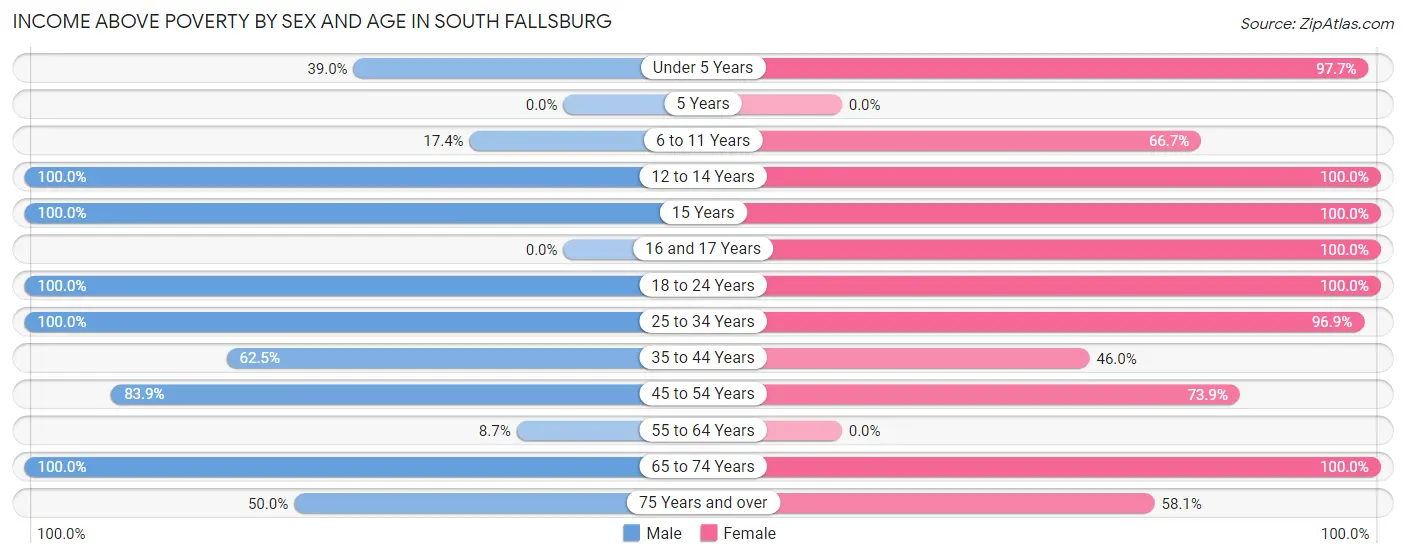
Income Above Poverty by Sex and Age in South Fallsburg
According to the poverty statistics in South Fallsburg, males aged 12 to 14 years and females aged 12 to 14 years are the age groups that are most secure financially, with 100.0% of males and 100.0% of females in these age groups living above the poverty line.
| Age Bracket | Male | Female |
| Under 5 Years | 30 (39.0%) | 130 (97.7%) |
| 5 Years | 0 (0.0%) | 0 (0.0%) |
| 6 to 11 Years | 30 (17.4%) | 10 (66.7%) |
| 12 to 14 Years | 35 (100.0%) | 60 (100.0%) |
| 15 Years | 49 (100.0%) | 75 (100.0%) |
| 16 and 17 Years | 0 (0.0%) | 55 (100.0%) |
| 18 to 24 Years | 67 (100.0%) | 54 (100.0%) |
| 25 to 34 Years | 44 (100.0%) | 126 (96.9%) |
| 35 to 44 Years | 90 (62.5%) | 86 (46.0%) |
| 45 to 54 Years | 120 (83.9%) | 65 (73.9%) |
| 55 to 64 Years | 4 (8.7%) | 0 (0.0%) |
| 65 to 74 Years | 105 (100.0%) | 106 (100.0%) |
| 75 Years and over | 33 (50.0%) | 36 (58.1%) |
| Total | 607 (64.0%) | 803 (81.1%) |
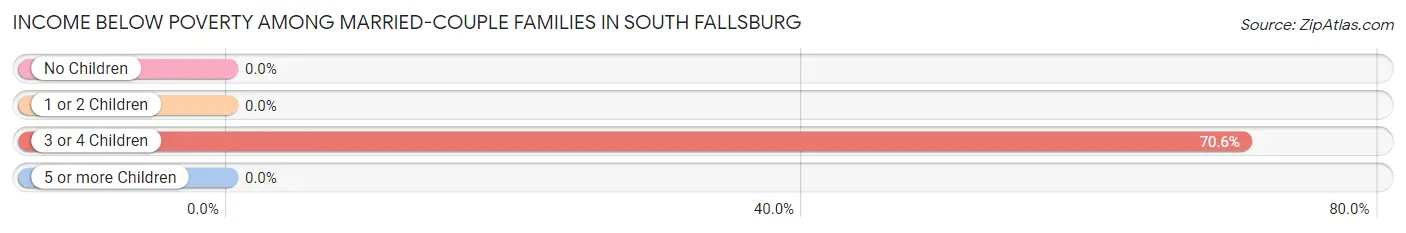
Income Below Poverty Among Married-Couple Families in South Fallsburg
The poverty statistics for married-couple families in South Fallsburg show that 19.4% or 60 of the total 310 families live below the poverty line. Families with 3 or 4 children have the highest poverty rate of 70.6%, comprising of 60 families. On the other hand, families with no children have the lowest poverty rate of 0.0%, which includes 0 families.
| Children | Above Poverty | Below Poverty |
| No Children | 104 (100.0%) | 0 (0.0%) |
| 1 or 2 Children | 121 (100.0%) | 0 (0.0%) |
| 3 or 4 Children | 25 (29.4%) | 60 (70.6%) |
| 5 or more Children | 0 (0.0%) | 0 (0.0%) |
| Total | 250 (80.6%) | 60 (19.4%) |
Income Below Poverty Among Single-Parent Households in South Fallsburg
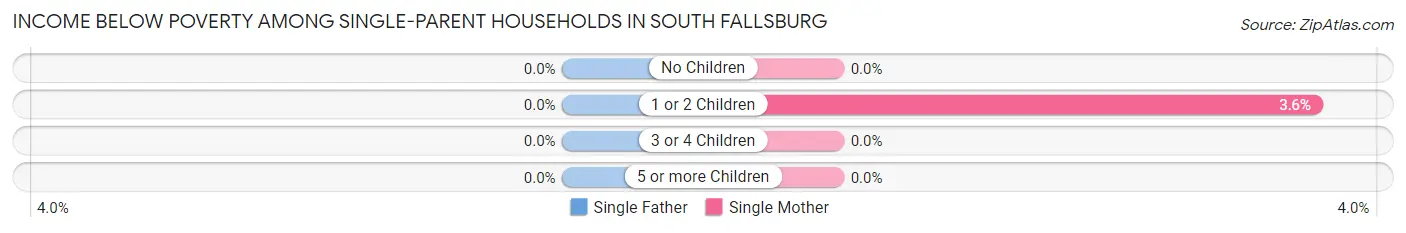
| Children | Single Father | Single Mother |
| No Children | 0 (0.0%) | 0 (0.0%) |
| 1 or 2 Children | 0 (0.0%) | 2 (3.6%) |
| 3 or 4 Children | 0 (0.0%) | 0 (0.0%) |
| 5 or more Children | 0 (0.0%) | 0 (0.0%) |
| Total | 0 (0.0%) | 2 (3.6%) |
Income Below Poverty Among Married-Couple vs Single-Parent Households in South Fallsburg
The poverty data for South Fallsburg shows that 60 of the married-couple family households (19.4%) and 2 of the single-parent households (1.3%) are living below the poverty level. Within the married-couple family households, those with 3 or 4 children have the highest poverty rate, with 60 households (70.6%) falling below the poverty line. Among the single-parent households, those with 1 or 2 children have the highest poverty rate, with 2 household (3.6%) living below poverty.
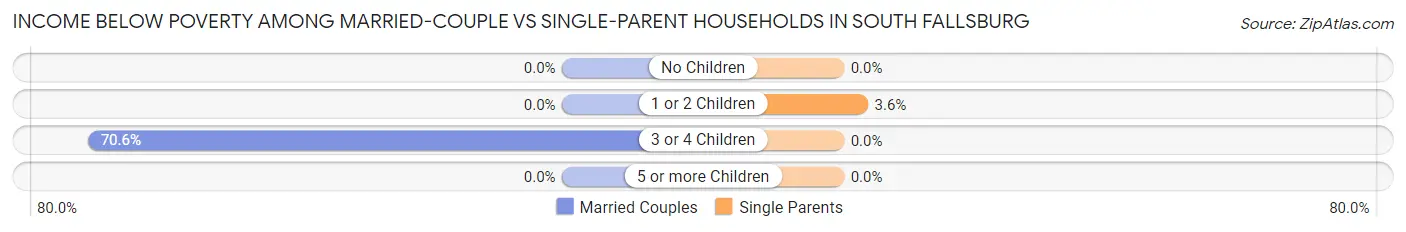
| Children | Married-Couple Families | Single-Parent Households |
| No Children | 0 (0.0%) | 0 (0.0%) |
| 1 or 2 Children | 0 (0.0%) | 2 (3.6%) |
| 3 or 4 Children | 60 (70.6%) | 0 (0.0%) |
| 5 or more Children | 0 (0.0%) | 0 (0.0%) |
| Total | 60 (19.4%) | 2 (1.3%) |
Employment Characteristics in South Fallsburg
Employment by Class of Employer in South Fallsburg
Among the 775 employed individuals in South Fallsburg, private company employees (472 | 60.9%), self-employed (not incorporated) (115 | 14.8%), and federal government employees (107 | 13.8%) make up the most common classes of employment.
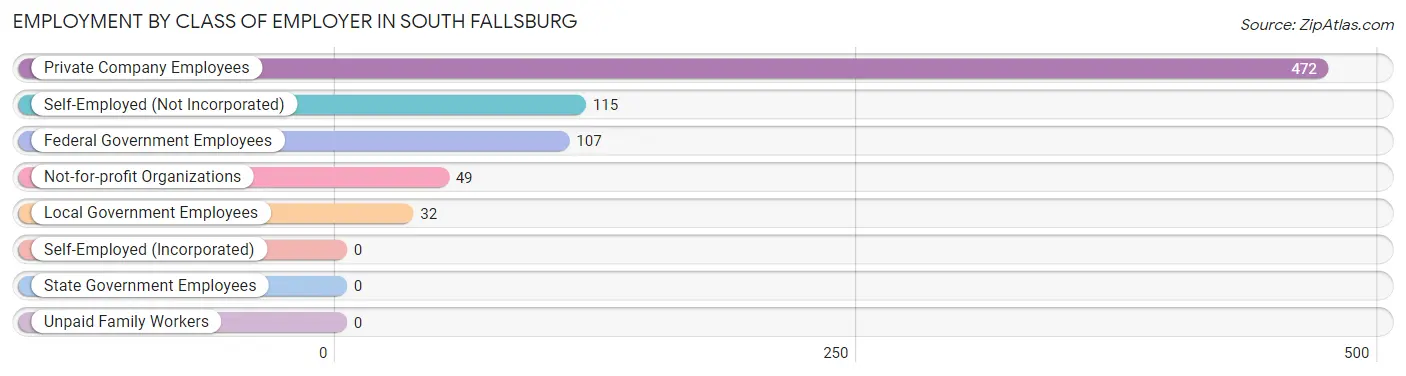
| Employer Class | # Employees | % Employees |
| Private Company Employees | 472 | 60.9% |
| Self-Employed (Incorporated) | 0 | 0.0% |
| Self-Employed (Not Incorporated) | 115 | 14.8% |
| Not-for-profit Organizations | 49 | 6.3% |
| Local Government Employees | 32 | 4.1% |
| State Government Employees | 0 | 0.0% |
| Federal Government Employees | 107 | 13.8% |
| Unpaid Family Workers | 0 | 0.0% |
| Total | 775 | 100.0% |
Employment Status by Age in South Fallsburg
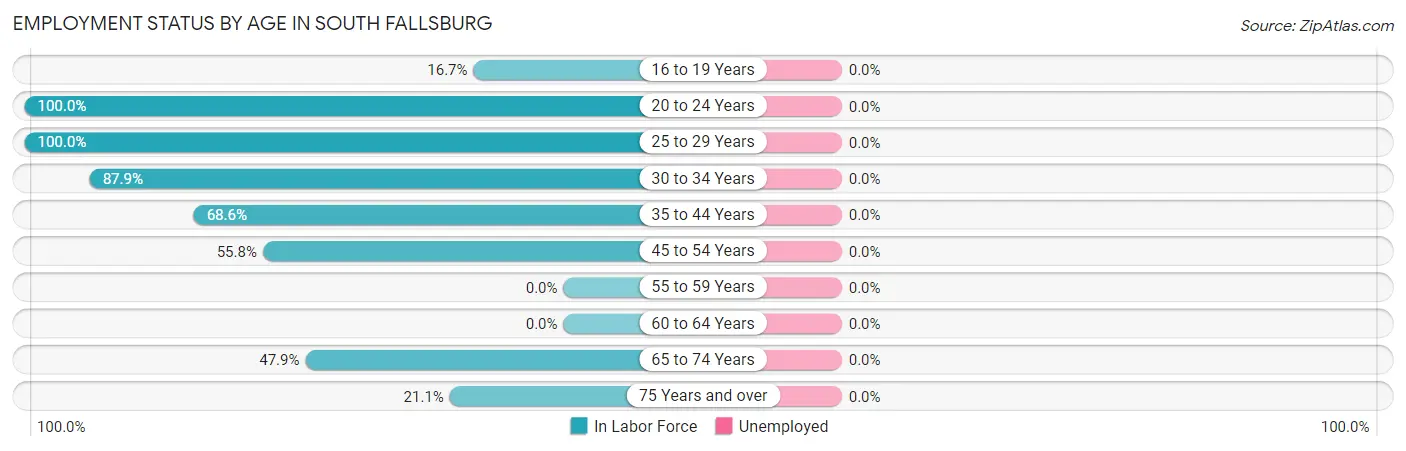
| Age Bracket | In Labor Force | Unemployed |
| 16 to 19 Years | 11 (16.7%) | 0 (0.0%) |
| 20 to 24 Years | 110 (100.0%) | 0 (0.0%) |
| 25 to 29 Years | 141 (100.0%) | 0 (0.0%) |
| 30 to 34 Years | 29 (87.9%) | 0 (0.0%) |
| 35 to 44 Years | 227 (68.6%) | 0 (0.0%) |
| 45 to 54 Years | 129 (55.8%) | 0 (0.0%) |
| 55 to 59 Years | 0 (0.0%) | 0 (0.0%) |
| 60 to 64 Years | 0 (0.0%) | 0 (0.0%) |
| 65 to 74 Years | 101 (47.9%) | 0 (0.0%) |
| 75 Years and over | 27 (21.1%) | 0 (0.0%) |
| Total | 775 (58.6%) | 0 (0.0%) |
Employment Status by Educational Attainment in South Fallsburg
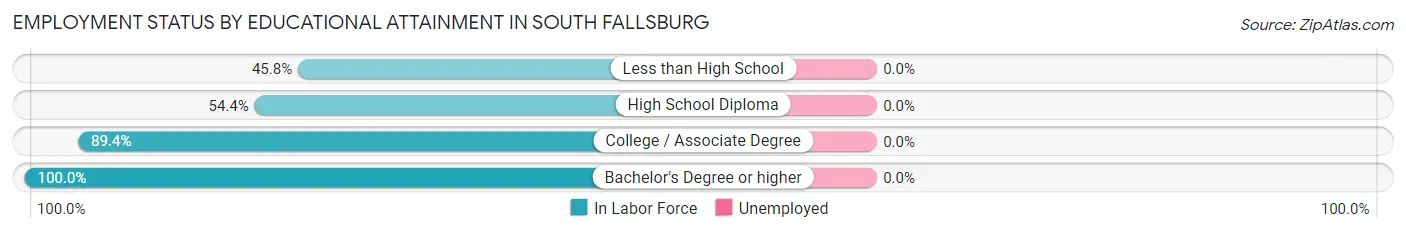
| Educational Attainment | In Labor Force | Unemployed |
| Less than High School | 138 (45.8%) | 0 (0.0%) |
| High School Diploma | 105 (54.4%) | 0 (0.0%) |
| College / Associate Degree | 254 (89.4%) | 0 (0.0%) |
| Bachelor's Degree or higher | 29 (100.0%) | 0 (0.0%) |
| Total | 526 (65.2%) | 0 (0.0%) |
Employment Occupations by Sex in South Fallsburg
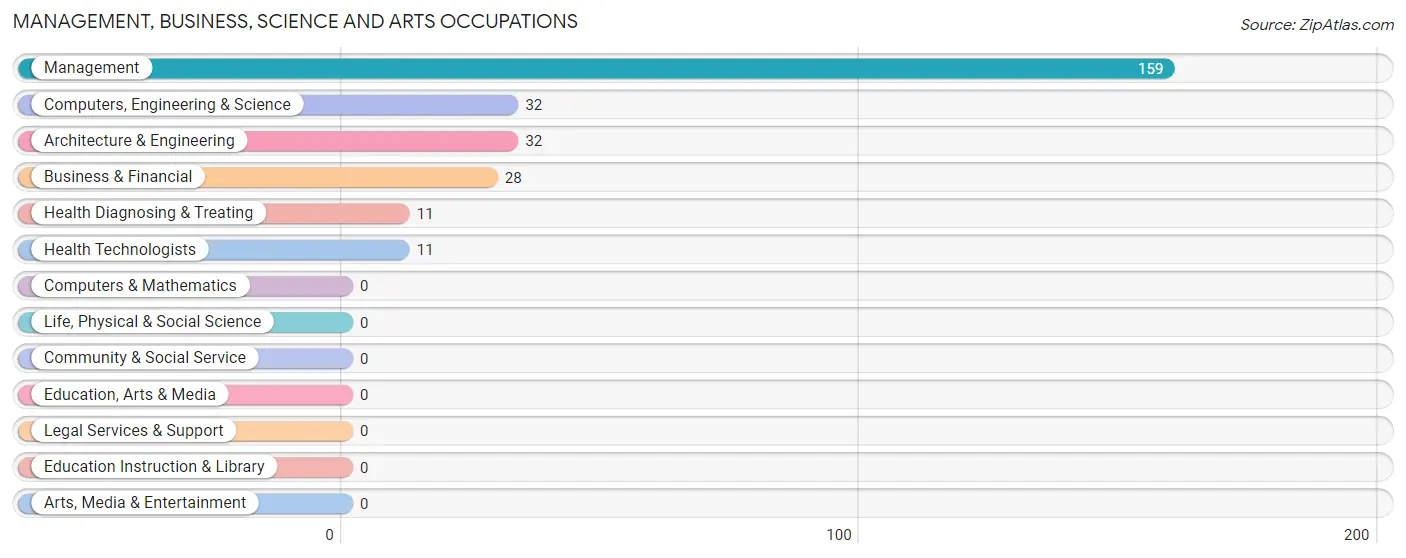
Management, Business, Science and Arts Occupations
The most common Management, Business, Science and Arts occupations in South Fallsburg are Management (159 | 20.5%), Computers, Engineering & Science (32 | 4.1%), Architecture & Engineering (32 | 4.1%), Business & Financial (28 | 3.6%), and Health Diagnosing & Treating (11 | 1.4%).
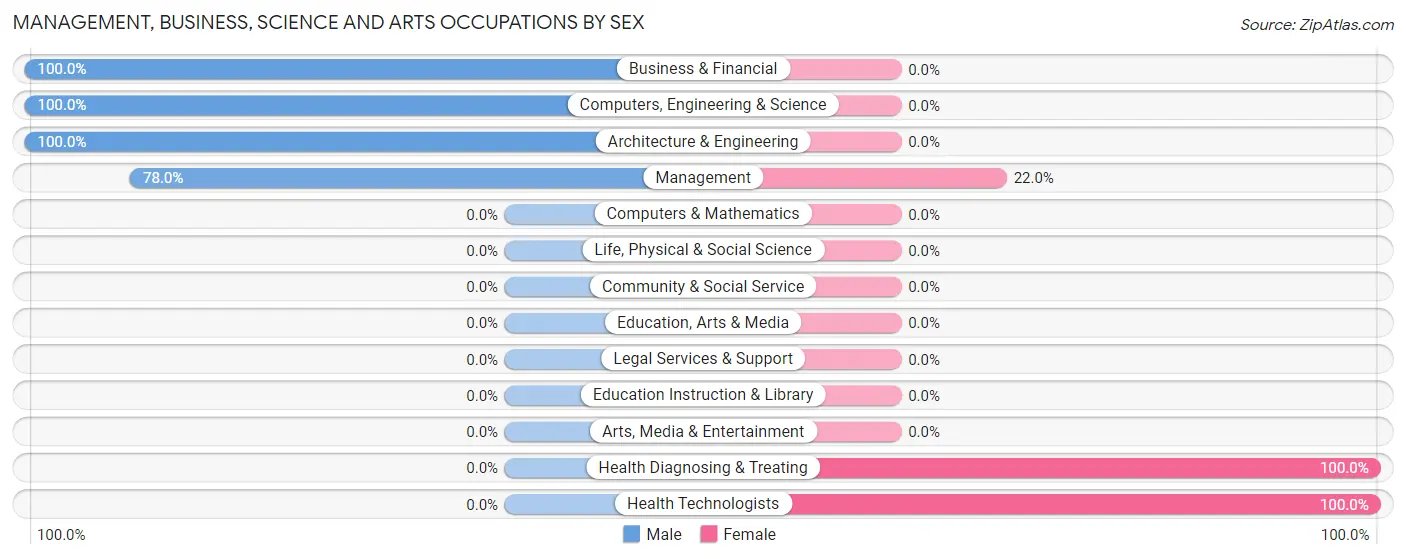
Management, Business, Science and Arts Occupations by Sex
Within the Management, Business, Science and Arts occupations in South Fallsburg, the most male-oriented occupations are Business & Financial (100.0%), Computers, Engineering & Science (100.0%), and Architecture & Engineering (100.0%), while the most female-oriented occupations are Health Diagnosing & Treating (100.0%), Health Technologists (100.0%), and Management (22.0%).
| Occupation | Male | Female |
| Management | 124 (78.0%) | 35 (22.0%) |
| Business & Financial | 28 (100.0%) | 0 (0.0%) |
| Computers, Engineering & Science | 32 (100.0%) | 0 (0.0%) |
| Computers & Mathematics | 0 (0.0%) | 0 (0.0%) |
| Architecture & Engineering | 32 (100.0%) | 0 (0.0%) |
| Life, Physical & Social Science | 0 (0.0%) | 0 (0.0%) |
| Community & Social Service | 0 (0.0%) | 0 (0.0%) |
| Education, Arts & Media | 0 (0.0%) | 0 (0.0%) |
| Legal Services & Support | 0 (0.0%) | 0 (0.0%) |
| Education Instruction & Library | 0 (0.0%) | 0 (0.0%) |
| Arts, Media & Entertainment | 0 (0.0%) | 0 (0.0%) |
| Health Diagnosing & Treating | 0 (0.0%) | 11 (100.0%) |
| Health Technologists | 0 (0.0%) | 11 (100.0%) |
| Total (Category) | 184 (80.0%) | 46 (20.0%) |
| Total (Overall) | 463 (59.7%) | 312 (40.3%) |
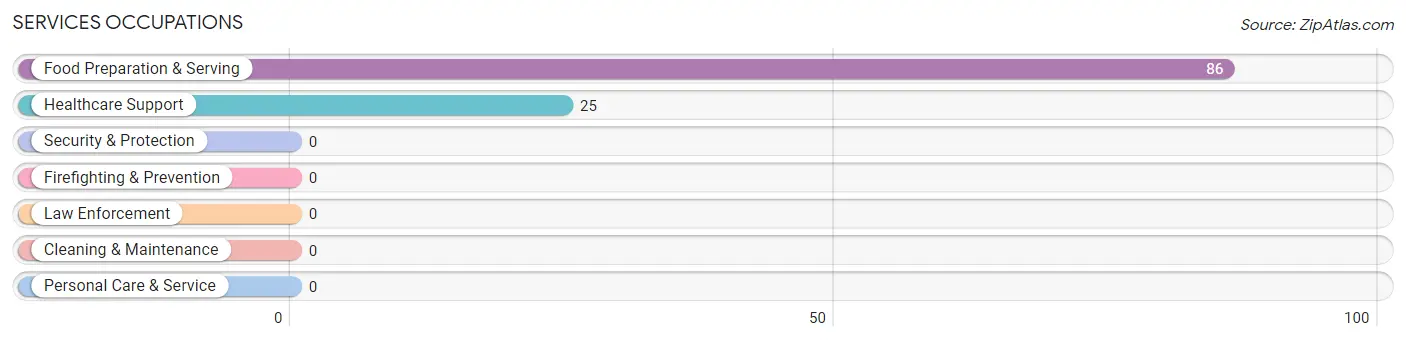
Services Occupations
The most common Services occupations in South Fallsburg are Food Preparation & Serving (86 | 11.1%), and Healthcare Support (25 | 3.2%).
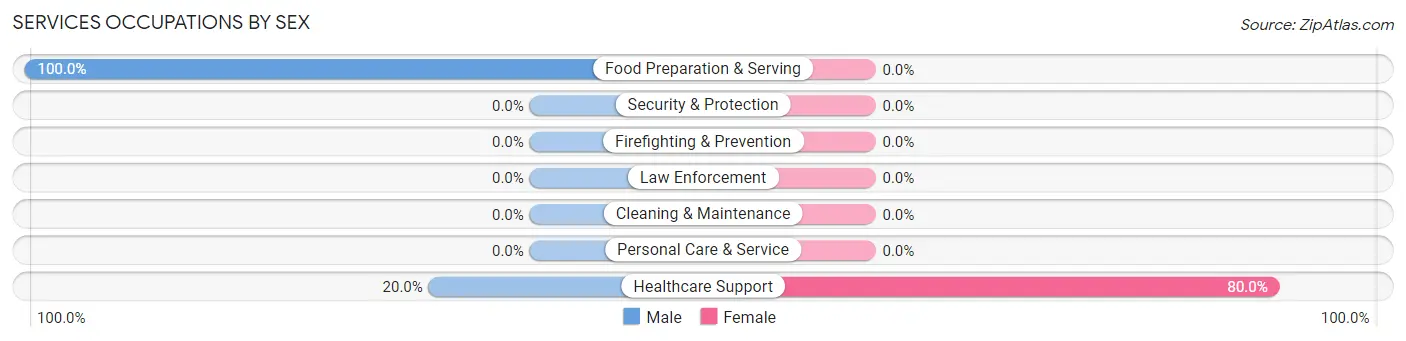
Services Occupations by Sex
| Occupation | Male | Female |
| Healthcare Support | 5 (20.0%) | 20 (80.0%) |
| Security & Protection | 0 (0.0%) | 0 (0.0%) |
| Firefighting & Prevention | 0 (0.0%) | 0 (0.0%) |
| Law Enforcement | 0 (0.0%) | 0 (0.0%) |
| Food Preparation & Serving | 86 (100.0%) | 0 (0.0%) |
| Cleaning & Maintenance | 0 (0.0%) | 0 (0.0%) |
| Personal Care & Service | 0 (0.0%) | 0 (0.0%) |
| Total (Category) | 91 (82.0%) | 20 (18.0%) |
| Total (Overall) | 463 (59.7%) | 312 (40.3%) |
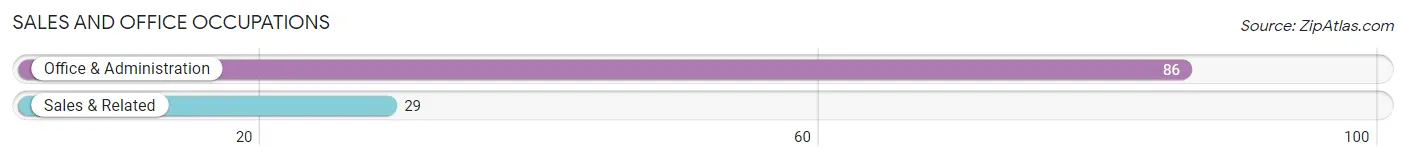
Sales and Office Occupations
The most common Sales and Office occupations in South Fallsburg are Office & Administration (86 | 11.1%), and Sales & Related (29 | 3.7%).
Sales and Office Occupations by Sex
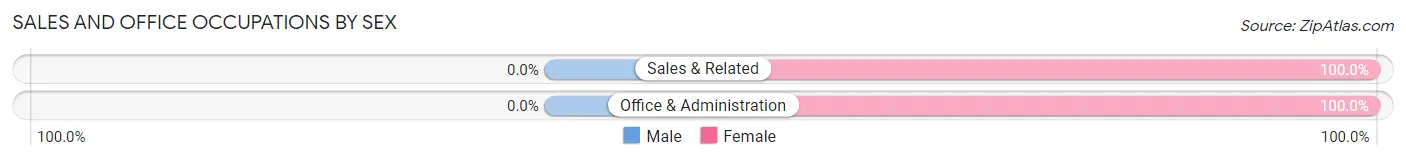
| Occupation | Male | Female |
| Sales & Related | 0 (0.0%) | 29 (100.0%) |
| Office & Administration | 0 (0.0%) | 86 (100.0%) |
| Total (Category) | 0 (0.0%) | 115 (100.0%) |
| Total (Overall) | 463 (59.7%) | 312 (40.3%) |
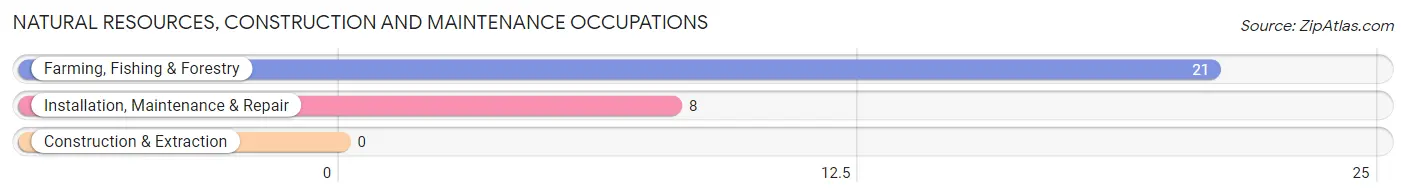
Natural Resources, Construction and Maintenance Occupations
The most common Natural Resources, Construction and Maintenance occupations in South Fallsburg are Farming, Fishing & Forestry (21 | 2.7%), and Installation, Maintenance & Repair (8 | 1.0%).
Natural Resources, Construction and Maintenance Occupations by Sex
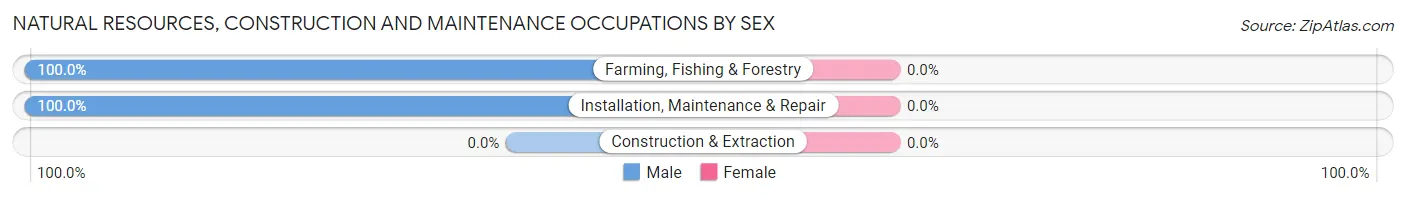
| Occupation | Male | Female |
| Farming, Fishing & Forestry | 21 (100.0%) | 0 (0.0%) |
| Construction & Extraction | 0 (0.0%) | 0 (0.0%) |
| Installation, Maintenance & Repair | 8 (100.0%) | 0 (0.0%) |
| Total (Category) | 29 (100.0%) | 0 (0.0%) |
| Total (Overall) | 463 (59.7%) | 312 (40.3%) |
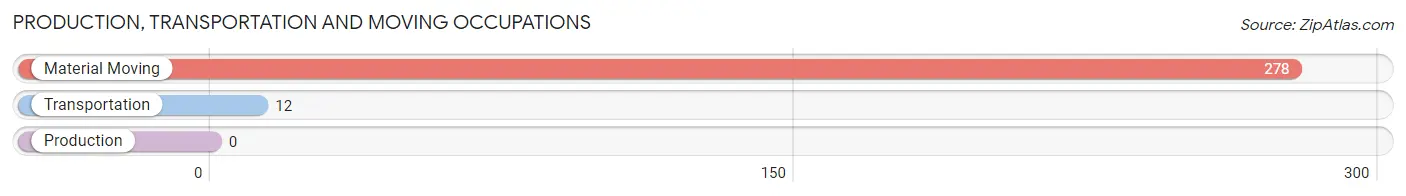
Production, Transportation and Moving Occupations
The most common Production, Transportation and Moving occupations in South Fallsburg are Material Moving (278 | 35.9%), and Transportation (12 | 1.5%).
Production, Transportation and Moving Occupations by Sex
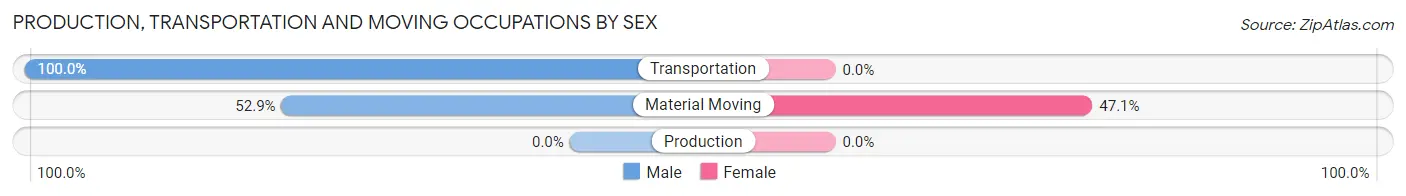
| Occupation | Male | Female |
| Production | 0 (0.0%) | 0 (0.0%) |
| Transportation | 12 (100.0%) | 0 (0.0%) |
| Material Moving | 147 (52.9%) | 131 (47.1%) |
| Total (Category) | 159 (54.8%) | 131 (45.2%) |
| Total (Overall) | 463 (59.7%) | 312 (40.3%) |
Employment Industries by Sex in South Fallsburg
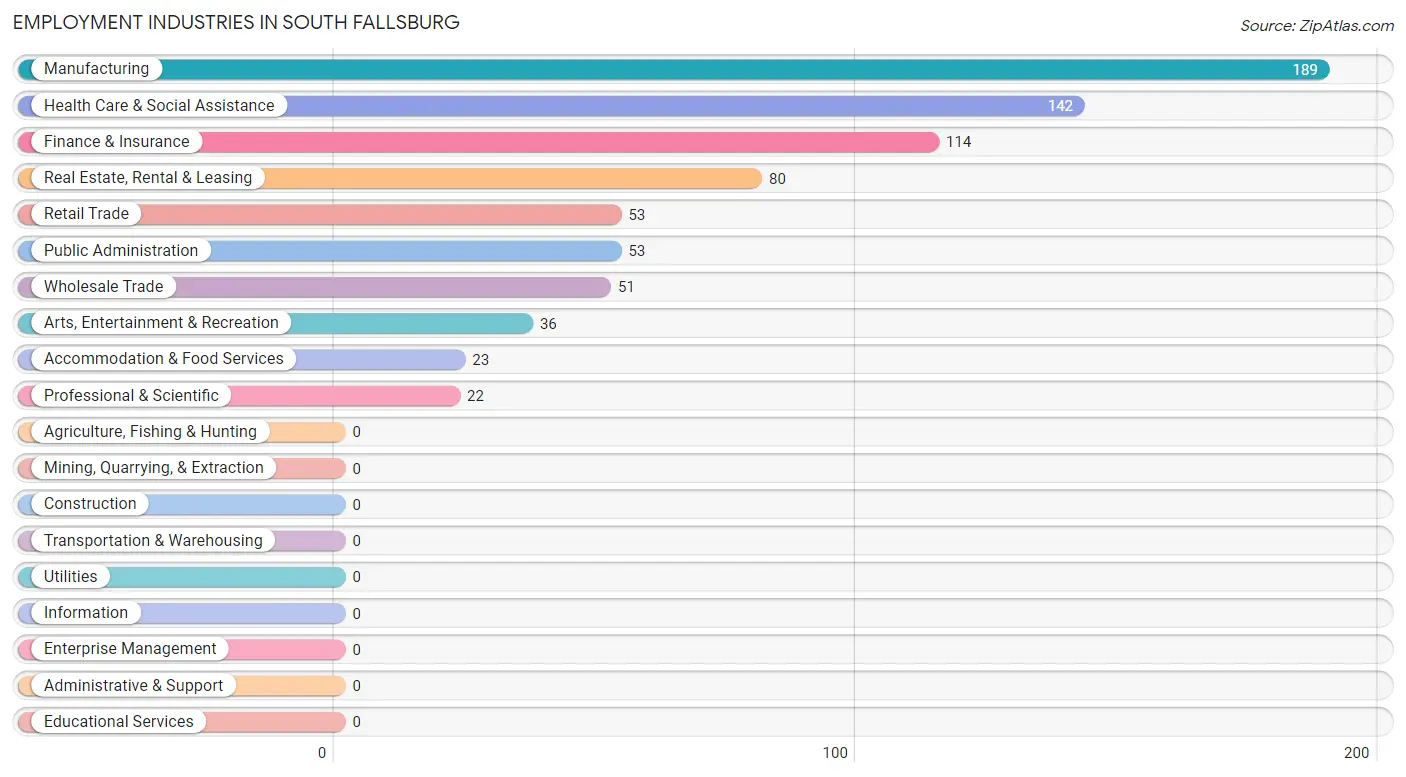
Employment Industries in South Fallsburg
The major employment industries in South Fallsburg include Manufacturing (189 | 24.4%), Health Care & Social Assistance (142 | 18.3%), Finance & Insurance (114 | 14.7%), Real Estate, Rental & Leasing (80 | 10.3%), and Retail Trade (53 | 6.8%).
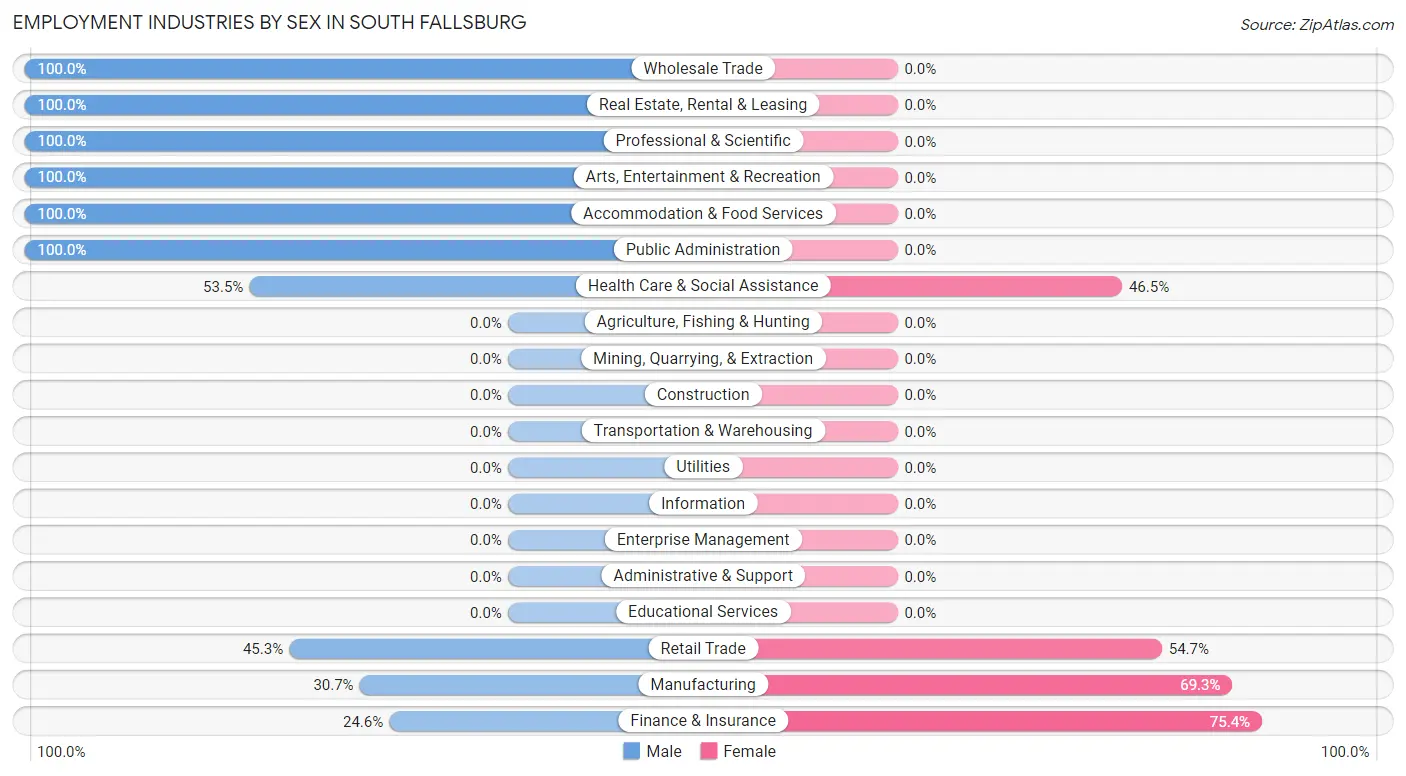
Employment Industries by Sex in South Fallsburg
The South Fallsburg industries that see more men than women are Wholesale Trade (100.0%), Real Estate, Rental & Leasing (100.0%), and Professional & Scientific (100.0%), whereas the industries that tend to have a higher number of women are Finance & Insurance (75.4%), Manufacturing (69.3%), and Retail Trade (54.7%).
| Industry | Male | Female |
| Agriculture, Fishing & Hunting | 0 (0.0%) | 0 (0.0%) |
| Mining, Quarrying, & Extraction | 0 (0.0%) | 0 (0.0%) |
| Construction | 0 (0.0%) | 0 (0.0%) |
| Manufacturing | 58 (30.7%) | 131 (69.3%) |
| Wholesale Trade | 51 (100.0%) | 0 (0.0%) |
| Retail Trade | 24 (45.3%) | 29 (54.7%) |
| Transportation & Warehousing | 0 (0.0%) | 0 (0.0%) |
| Utilities | 0 (0.0%) | 0 (0.0%) |
| Information | 0 (0.0%) | 0 (0.0%) |
| Finance & Insurance | 28 (24.6%) | 86 (75.4%) |
| Real Estate, Rental & Leasing | 80 (100.0%) | 0 (0.0%) |
| Professional & Scientific | 22 (100.0%) | 0 (0.0%) |
| Enterprise Management | 0 (0.0%) | 0 (0.0%) |
| Administrative & Support | 0 (0.0%) | 0 (0.0%) |
| Educational Services | 0 (0.0%) | 0 (0.0%) |
| Health Care & Social Assistance | 76 (53.5%) | 66 (46.5%) |
| Arts, Entertainment & Recreation | 36 (100.0%) | 0 (0.0%) |
| Accommodation & Food Services | 23 (100.0%) | 0 (0.0%) |
| Public Administration | 53 (100.0%) | 0 (0.0%) |
| Total | 463 (59.7%) | 312 (40.3%) |
Education in South Fallsburg
School Enrollment in South Fallsburg
The most common levels of schooling among the 452 students in South Fallsburg are middle school (156 | 34.5%), elementary school (153 | 33.9%), and high school (117 | 25.9%).
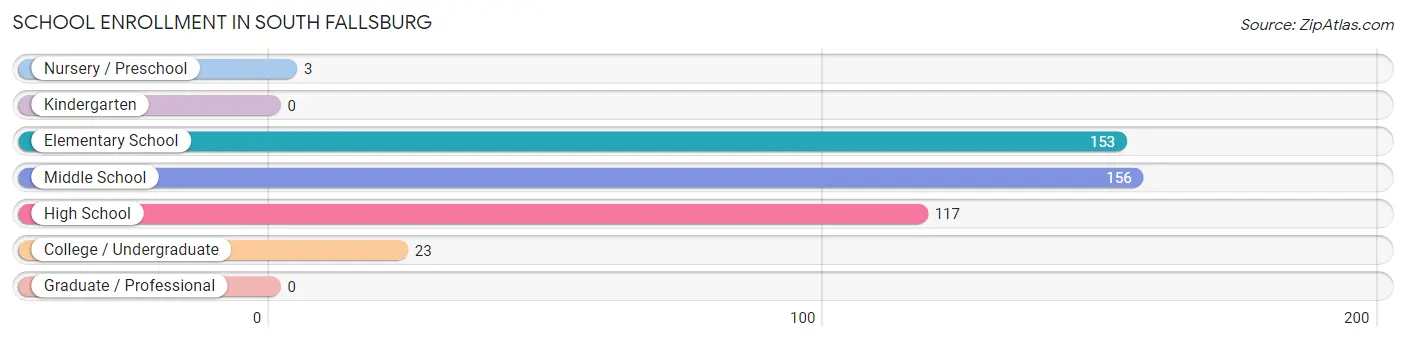
| School Level | # Students | % Students |
| Nursery / Preschool | 3 | 0.7% |
| Kindergarten | 0 | 0.0% |
| Elementary School | 153 | 33.9% |
| Middle School | 156 | 34.5% |
| High School | 117 | 25.9% |
| College / Undergraduate | 23 | 5.1% |
| Graduate / Professional | 0 | 0.0% |
| Total | 452 | 100.0% |
School Enrollment by Age by Funding Source in South Fallsburg
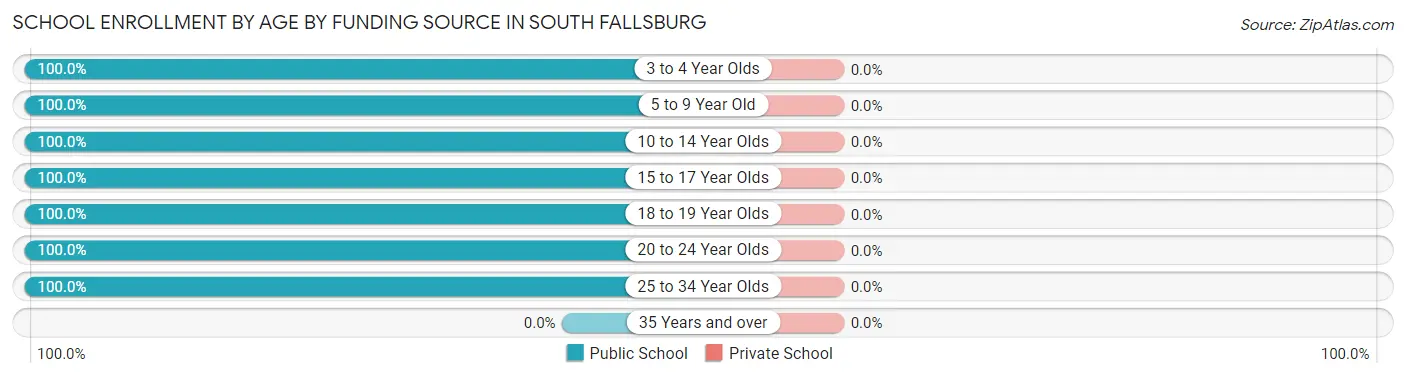
| Age Bracket | Public School | Private School |
| 3 to 4 Year Olds | 3 (100.0%) | 0 (0.0%) |
| 5 to 9 Year Old | 148 (100.0%) | 0 (0.0%) |
| 10 to 14 Year Olds | 134 (100.0%) | 0 (0.0%) |
| 15 to 17 Year Olds | 133 (100.0%) | 0 (0.0%) |
| 18 to 19 Year Olds | 11 (100.0%) | 0 (0.0%) |
| 20 to 24 Year Olds | 12 (100.0%) | 0 (0.0%) |
| 25 to 34 Year Olds | 11 (100.0%) | 0 (0.0%) |
| 35 Years and over | 0 (0.0%) | 0 (0.0%) |
| Total | 452 (100.0%) | 0 (0.0%) |
Educational Attainment by Field of Study in South Fallsburg
Business (53 | 41.4%), visual & performing arts (46 | 35.9%), and physical & health sciences (29 | 22.7%) are the most common fields of study among 128 individuals in South Fallsburg who have obtained a bachelor's degree or higher.
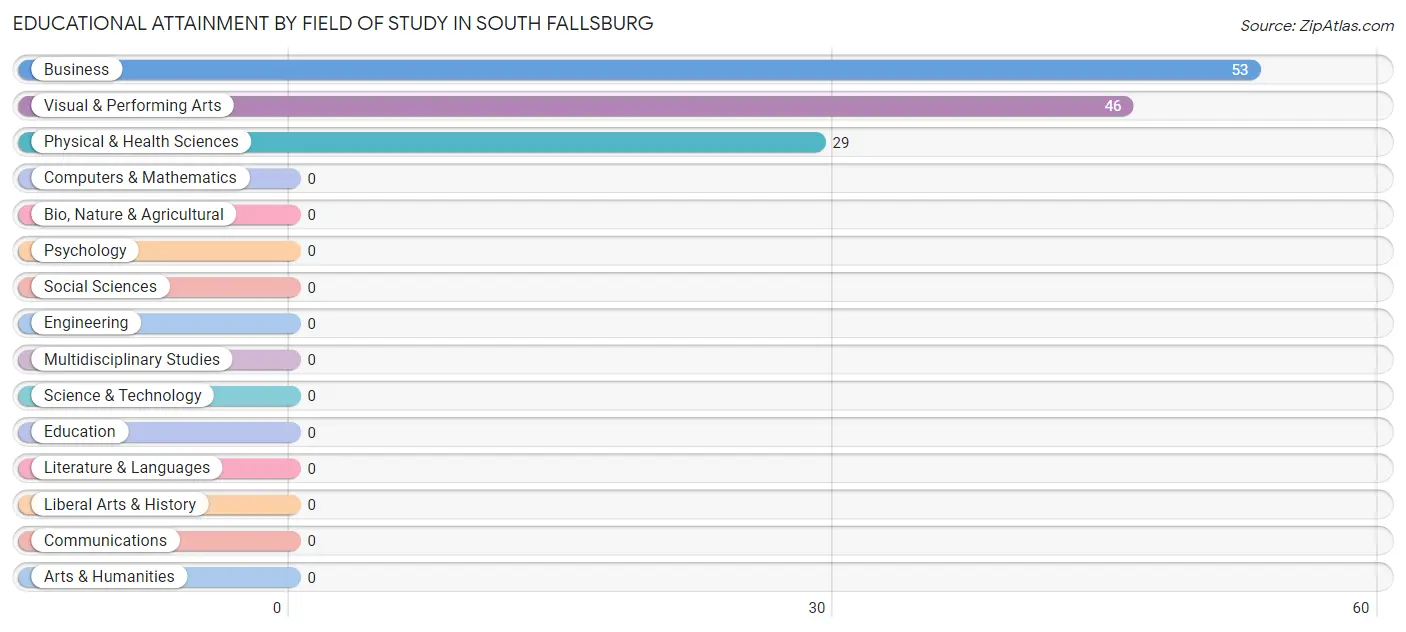
| Field of Study | # Graduates | % Graduates |
| Computers & Mathematics | 0 | 0.0% |
| Bio, Nature & Agricultural | 0 | 0.0% |
| Physical & Health Sciences | 29 | 22.7% |
| Psychology | 0 | 0.0% |
| Social Sciences | 0 | 0.0% |
| Engineering | 0 | 0.0% |
| Multidisciplinary Studies | 0 | 0.0% |
| Science & Technology | 0 | 0.0% |
| Business | 53 | 41.4% |
| Education | 0 | 0.0% |
| Literature & Languages | 0 | 0.0% |
| Liberal Arts & History | 0 | 0.0% |
| Visual & Performing Arts | 46 | 35.9% |
| Communications | 0 | 0.0% |
| Arts & Humanities | 0 | 0.0% |
| Total | 128 | 100.0% |
Transportation & Commute in South Fallsburg
Vehicle Availability by Sex in South Fallsburg
The most prevalent vehicle ownership categories in South Fallsburg are males with 2 vehicles (152, accounting for 32.8%) and females with 2 vehicles (66, making up 48.7%).
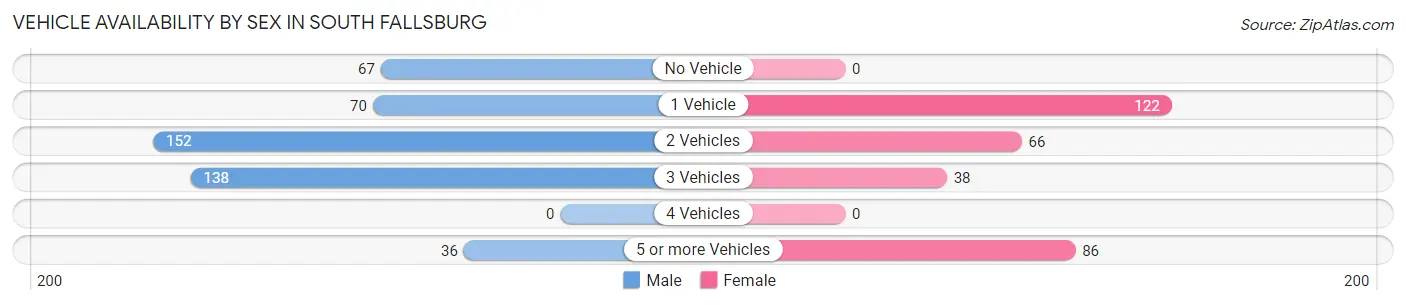
| Vehicles Available | Male | Female |
| No Vehicle | 67 (14.5%) | 0 (0.0%) |
| 1 Vehicle | 70 (15.1%) | 122 (39.1%) |
| 2 Vehicles | 152 (32.8%) | 66 (21.1%) |
| 3 Vehicles | 138 (29.8%) | 38 (12.2%) |
| 4 Vehicles | 0 (0.0%) | 0 (0.0%) |
| 5 or more Vehicles | 36 (7.8%) | 86 (27.6%) |
| Total | 463 (100.0%) | 312 (100.0%) |
Commute Time in South Fallsburg
The most frequently occuring commute durations in South Fallsburg are 10 to 14 minutes (246 commuters, 33.7%), 15 to 19 minutes (178 commuters, 24.3%), and 30 to 34 minutes (133 commuters, 18.2%).
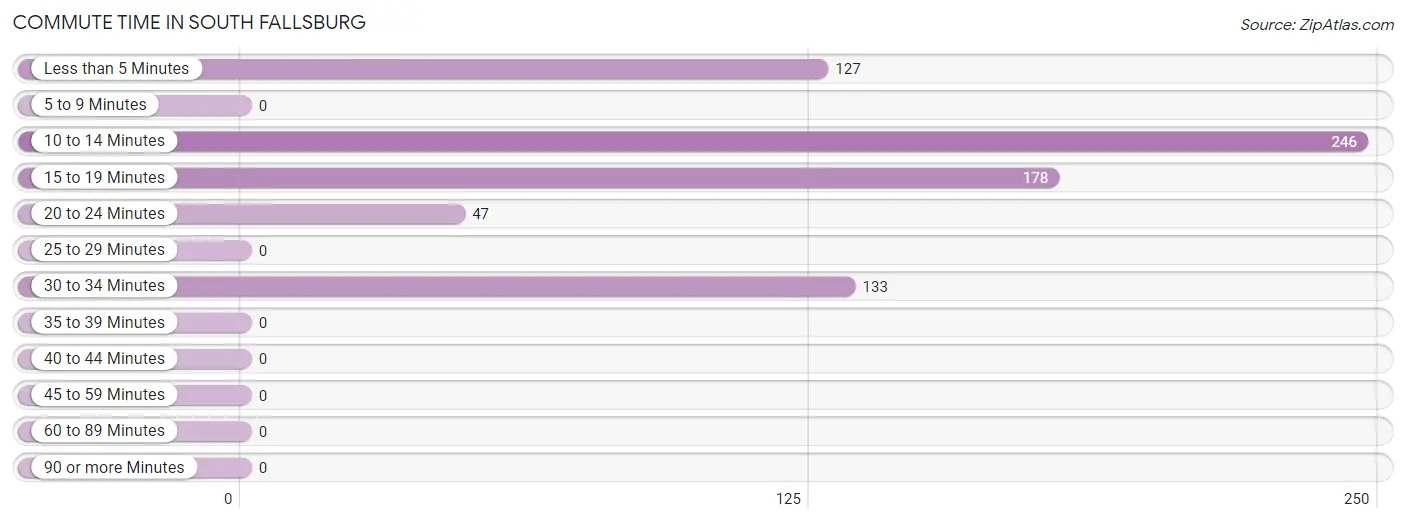
| Commute Time | # Commuters | % Commuters |
| Less than 5 Minutes | 127 | 17.4% |
| 5 to 9 Minutes | 0 | 0.0% |
| 10 to 14 Minutes | 246 | 33.7% |
| 15 to 19 Minutes | 178 | 24.3% |
| 20 to 24 Minutes | 47 | 6.4% |
| 25 to 29 Minutes | 0 | 0.0% |
| 30 to 34 Minutes | 133 | 18.2% |
| 35 to 39 Minutes | 0 | 0.0% |
| 40 to 44 Minutes | 0 | 0.0% |
| 45 to 59 Minutes | 0 | 0.0% |
| 60 to 89 Minutes | 0 | 0.0% |
| 90 or more Minutes | 0 | 0.0% |
Commute Time by Sex in South Fallsburg
The most common commute times in South Fallsburg are 10 to 14 minutes (220 commuters, 52.5%) for males and 15 to 19 minutes (126 commuters, 40.4%) for females.
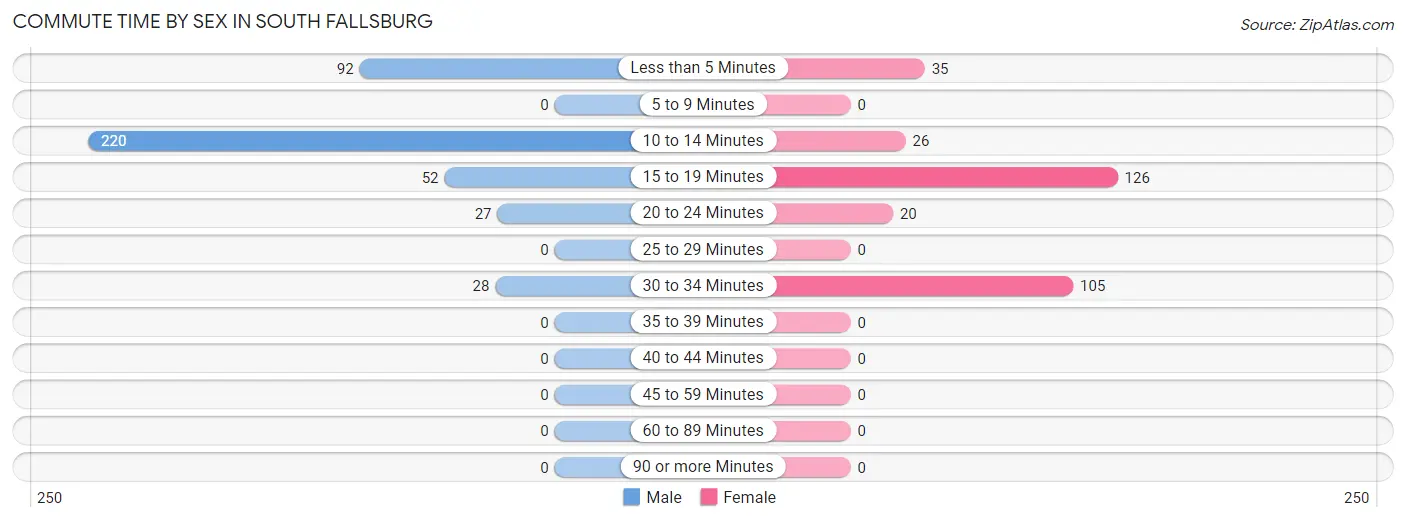
| Commute Time | Male | Female |
| Less than 5 Minutes | 92 (22.0%) | 35 (11.2%) |
| 5 to 9 Minutes | 0 (0.0%) | 0 (0.0%) |
| 10 to 14 Minutes | 220 (52.5%) | 26 (8.3%) |
| 15 to 19 Minutes | 52 (12.4%) | 126 (40.4%) |
| 20 to 24 Minutes | 27 (6.4%) | 20 (6.4%) |
| 25 to 29 Minutes | 0 (0.0%) | 0 (0.0%) |
| 30 to 34 Minutes | 28 (6.7%) | 105 (33.7%) |
| 35 to 39 Minutes | 0 (0.0%) | 0 (0.0%) |
| 40 to 44 Minutes | 0 (0.0%) | 0 (0.0%) |
| 45 to 59 Minutes | 0 (0.0%) | 0 (0.0%) |
| 60 to 89 Minutes | 0 (0.0%) | 0 (0.0%) |
| 90 or more Minutes | 0 (0.0%) | 0 (0.0%) |
Time of Departure to Work by Sex in South Fallsburg
The most frequent times of departure to work in South Fallsburg are 8:30 AM to 8:59 AM (84, 20.1%) for males and 5:30 AM to 5:59 AM (122, 39.1%) for females.
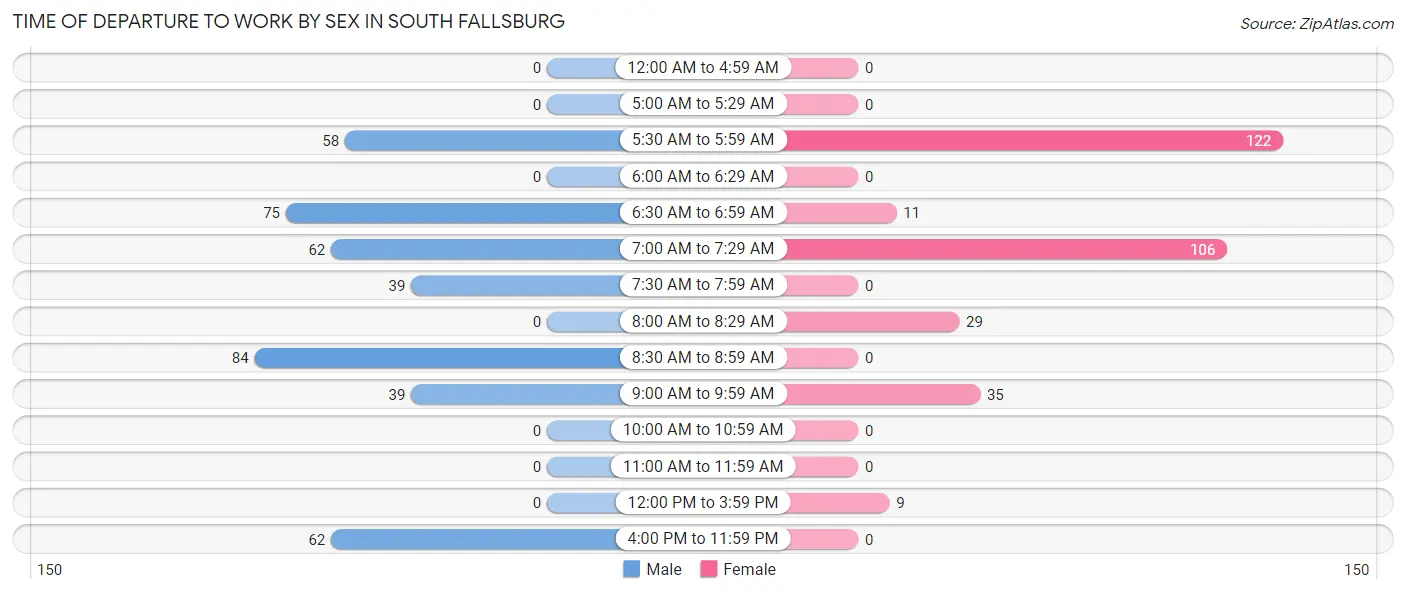
| Time of Departure | Male | Female |
| 12:00 AM to 4:59 AM | 0 (0.0%) | 0 (0.0%) |
| 5:00 AM to 5:29 AM | 0 (0.0%) | 0 (0.0%) |
| 5:30 AM to 5:59 AM | 58 (13.8%) | 122 (39.1%) |
| 6:00 AM to 6:29 AM | 0 (0.0%) | 0 (0.0%) |
| 6:30 AM to 6:59 AM | 75 (17.9%) | 11 (3.5%) |
| 7:00 AM to 7:29 AM | 62 (14.8%) | 106 (34.0%) |
| 7:30 AM to 7:59 AM | 39 (9.3%) | 0 (0.0%) |
| 8:00 AM to 8:29 AM | 0 (0.0%) | 29 (9.3%) |
| 8:30 AM to 8:59 AM | 84 (20.1%) | 0 (0.0%) |
| 9:00 AM to 9:59 AM | 39 (9.3%) | 35 (11.2%) |
| 10:00 AM to 10:59 AM | 0 (0.0%) | 0 (0.0%) |
| 11:00 AM to 11:59 AM | 0 (0.0%) | 0 (0.0%) |
| 12:00 PM to 3:59 PM | 0 (0.0%) | 9 (2.9%) |
| 4:00 PM to 11:59 PM | 62 (14.8%) | 0 (0.0%) |
| Total | 419 (100.0%) | 312 (100.0%) |
Housing Occupancy in South Fallsburg
Occupancy by Ownership in South Fallsburg
Of the total 695 dwellings in South Fallsburg, owner-occupied units account for 304 (43.7%), while renter-occupied units make up 391 (56.3%).
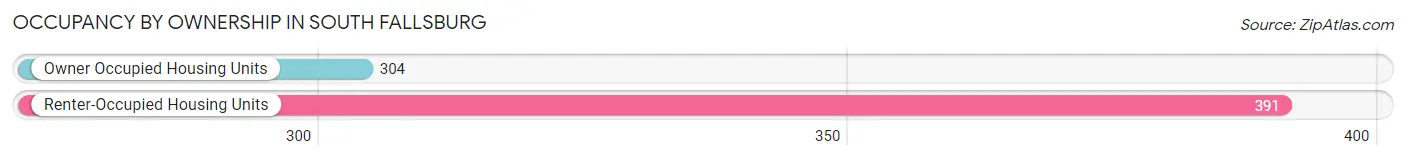
| Occupancy | # Housing Units | % Housing Units |
| Owner Occupied Housing Units | 304 | 43.7% |
| Renter-Occupied Housing Units | 391 | 56.3% |
| Total Occupied Housing Units | 695 | 100.0% |
Occupancy by Household Size in South Fallsburg
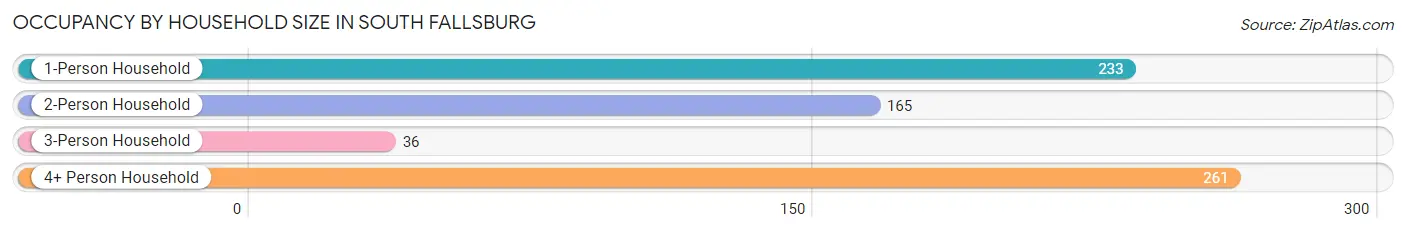
| Household Size | # Housing Units | % Housing Units |
| 1-Person Household | 233 | 33.5% |
| 2-Person Household | 165 | 23.7% |
| 3-Person Household | 36 | 5.2% |
| 4+ Person Household | 261 | 37.6% |
| Total Housing Units | 695 | 100.0% |
Occupancy by Ownership by Household Size in South Fallsburg
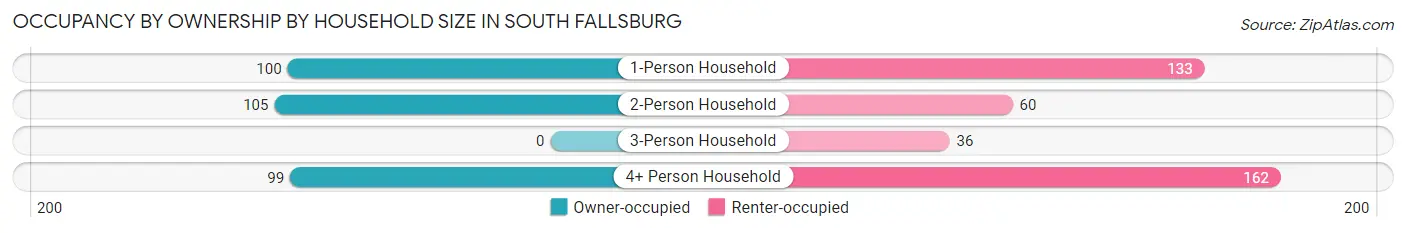
| Household Size | Owner-occupied | Renter-occupied |
| 1-Person Household | 100 (42.9%) | 133 (57.1%) |
| 2-Person Household | 105 (63.6%) | 60 (36.4%) |
| 3-Person Household | 0 (0.0%) | 36 (100.0%) |
| 4+ Person Household | 99 (37.9%) | 162 (62.1%) |
| Total Housing Units | 304 (43.7%) | 391 (56.3%) |
Occupancy by Educational Attainment in South Fallsburg
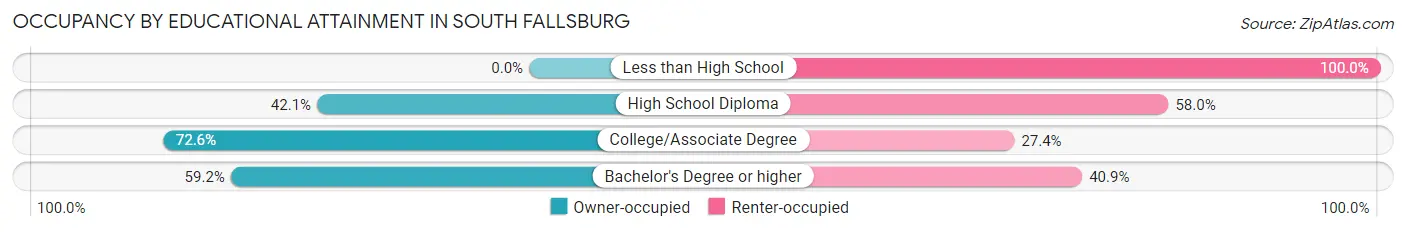
| Household Size | Owner-occupied | Renter-occupied |
| Less than High School | 0 (0.0%) | 181 (100.0%) |
| High School Diploma | 82 (42.0%) | 113 (58.0%) |
| College/Associate Degree | 180 (72.6%) | 68 (27.4%) |
| Bachelor's Degree or higher | 42 (59.2%) | 29 (40.8%) |
Occupancy by Age of Householder in South Fallsburg
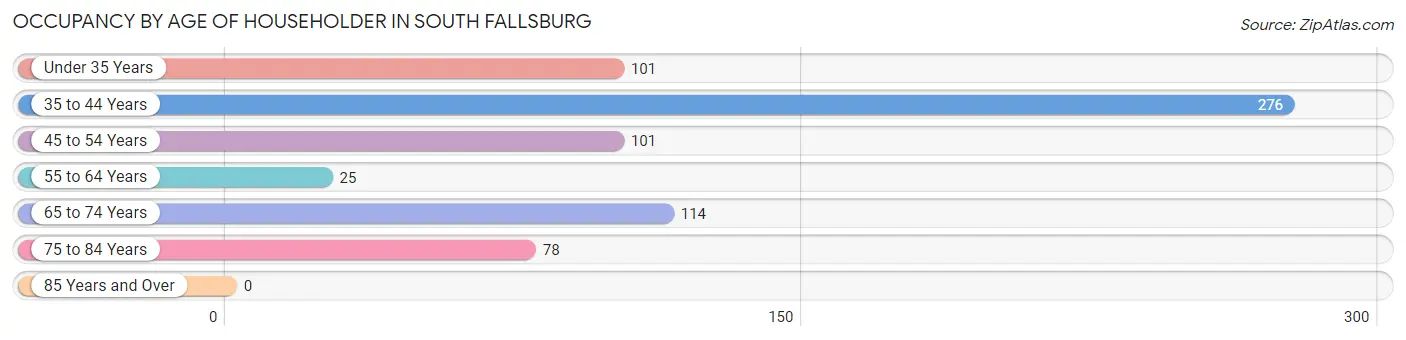
| Age Bracket | # Households | % Households |
| Under 35 Years | 101 | 14.5% |
| 35 to 44 Years | 276 | 39.7% |
| 45 to 54 Years | 101 | 14.5% |
| 55 to 64 Years | 25 | 3.6% |
| 65 to 74 Years | 114 | 16.4% |
| 75 to 84 Years | 78 | 11.2% |
| 85 Years and Over | 0 | 0.0% |
| Total | 695 | 100.0% |
Housing Finances in South Fallsburg
Median Income by Occupancy in South Fallsburg
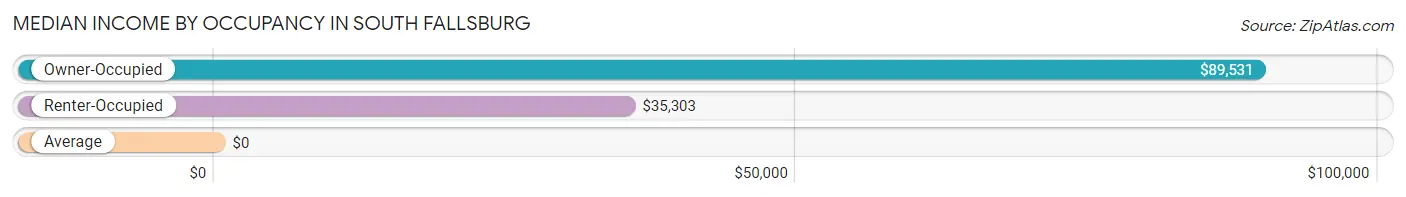
| Occupancy Type | # Households | Median Income |
| Owner-Occupied | 304 (43.7%) | $89,531 |
| Renter-Occupied | 391 (56.3%) | $35,303 |
| Average | 695 (100.0%) | $0 |
Occupancy by Householder Income Bracket in South Fallsburg
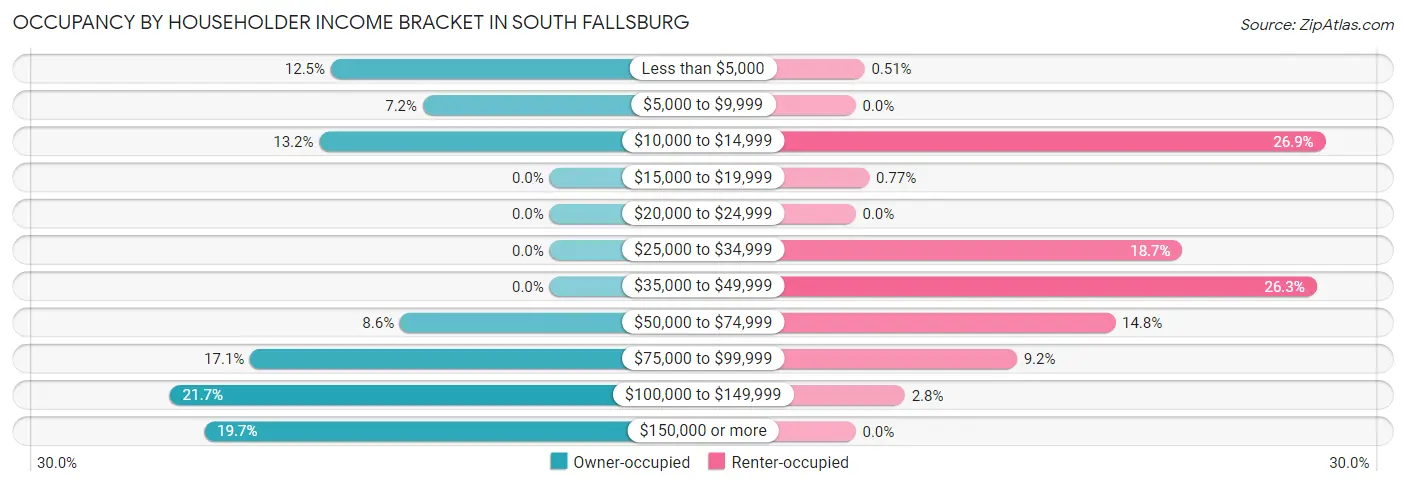
| Income Bracket | Owner-occupied | Renter-occupied |
| Less than $5,000 | 38 (12.5%) | 2 (0.5%) |
| $5,000 to $9,999 | 22 (7.2%) | 0 (0.0%) |
| $10,000 to $14,999 | 40 (13.2%) | 105 (26.9%) |
| $15,000 to $19,999 | 0 (0.0%) | 3 (0.8%) |
| $20,000 to $24,999 | 0 (0.0%) | 0 (0.0%) |
| $25,000 to $34,999 | 0 (0.0%) | 73 (18.7%) |
| $35,000 to $49,999 | 0 (0.0%) | 103 (26.3%) |
| $50,000 to $74,999 | 26 (8.6%) | 58 (14.8%) |
| $75,000 to $99,999 | 52 (17.1%) | 36 (9.2%) |
| $100,000 to $149,999 | 66 (21.7%) | 11 (2.8%) |
| $150,000 or more | 60 (19.7%) | 0 (0.0%) |
| Total | 304 (100.0%) | 391 (100.0%) |
Monthly Housing Cost Tiers in South Fallsburg
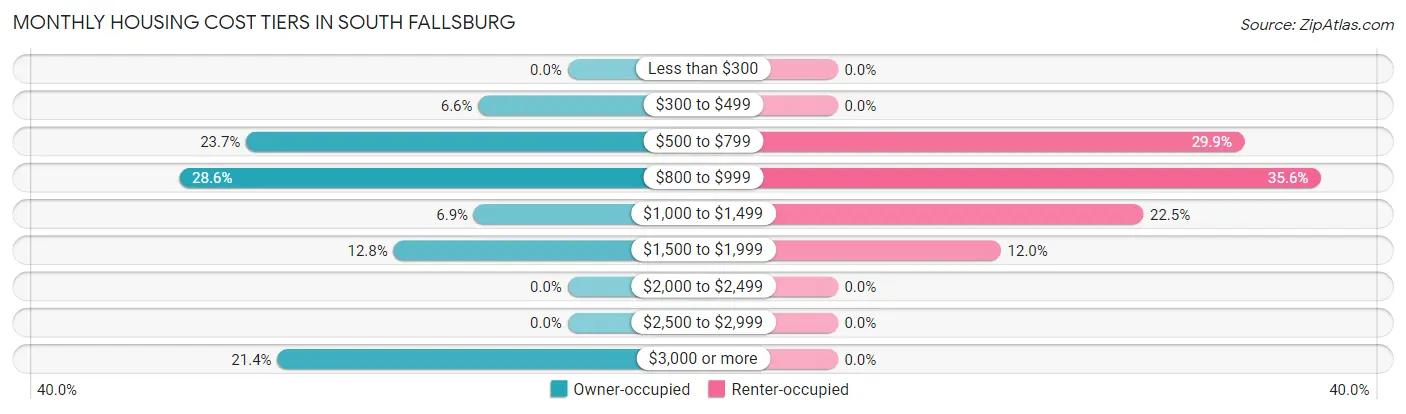
| Monthly Cost | Owner-occupied | Renter-occupied |
| Less than $300 | 0 (0.0%) | 0 (0.0%) |
| $300 to $499 | 20 (6.6%) | 0 (0.0%) |
| $500 to $799 | 72 (23.7%) | 117 (29.9%) |
| $800 to $999 | 87 (28.6%) | 139 (35.5%) |
| $1,000 to $1,499 | 21 (6.9%) | 88 (22.5%) |
| $1,500 to $1,999 | 39 (12.8%) | 47 (12.0%) |
| $2,000 to $2,499 | 0 (0.0%) | 0 (0.0%) |
| $2,500 to $2,999 | 0 (0.0%) | 0 (0.0%) |
| $3,000 or more | 65 (21.4%) | 0 (0.0%) |
| Total | 304 (100.0%) | 391 (100.0%) |
Physical Housing Characteristics in South Fallsburg
Housing Structures in South Fallsburg
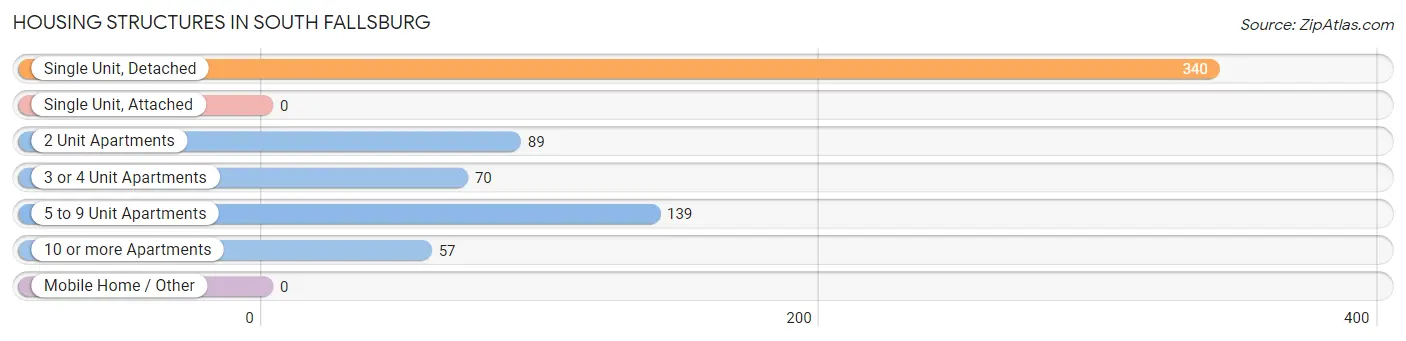
| Structure Type | # Housing Units | % Housing Units |
| Single Unit, Detached | 340 | 48.9% |
| Single Unit, Attached | 0 | 0.0% |
| 2 Unit Apartments | 89 | 12.8% |
| 3 or 4 Unit Apartments | 70 | 10.1% |
| 5 to 9 Unit Apartments | 139 | 20.0% |
| 10 or more Apartments | 57 | 8.2% |
| Mobile Home / Other | 0 | 0.0% |
| Total | 695 | 100.0% |
Housing Structures by Occupancy in South Fallsburg
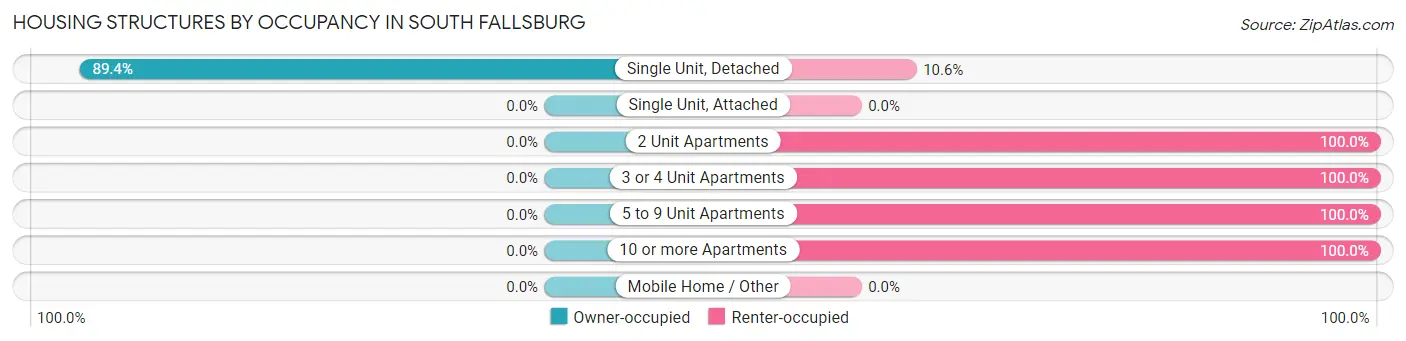
| Structure Type | Owner-occupied | Renter-occupied |
| Single Unit, Detached | 304 (89.4%) | 36 (10.6%) |
| Single Unit, Attached | 0 (0.0%) | 0 (0.0%) |
| 2 Unit Apartments | 0 (0.0%) | 89 (100.0%) |
| 3 or 4 Unit Apartments | 0 (0.0%) | 70 (100.0%) |
| 5 to 9 Unit Apartments | 0 (0.0%) | 139 (100.0%) |
| 10 or more Apartments | 0 (0.0%) | 57 (100.0%) |
| Mobile Home / Other | 0 (0.0%) | 0 (0.0%) |
| Total | 304 (43.7%) | 391 (56.3%) |
Housing Structures by Number of Rooms in South Fallsburg
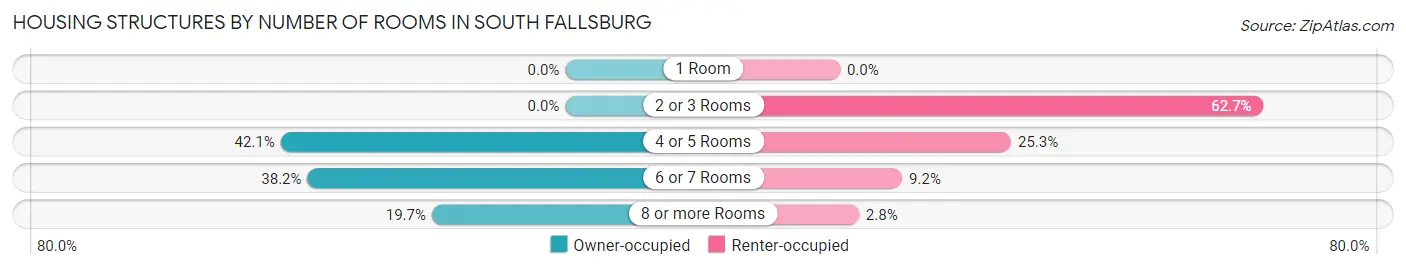
| Number of Rooms | Owner-occupied | Renter-occupied |
| 1 Room | 0 (0.0%) | 0 (0.0%) |
| 2 or 3 Rooms | 0 (0.0%) | 245 (62.7%) |
| 4 or 5 Rooms | 128 (42.1%) | 99 (25.3%) |
| 6 or 7 Rooms | 116 (38.2%) | 36 (9.2%) |
| 8 or more Rooms | 60 (19.7%) | 11 (2.8%) |
| Total | 304 (100.0%) | 391 (100.0%) |
Housing Structure by Heating Type in South Fallsburg
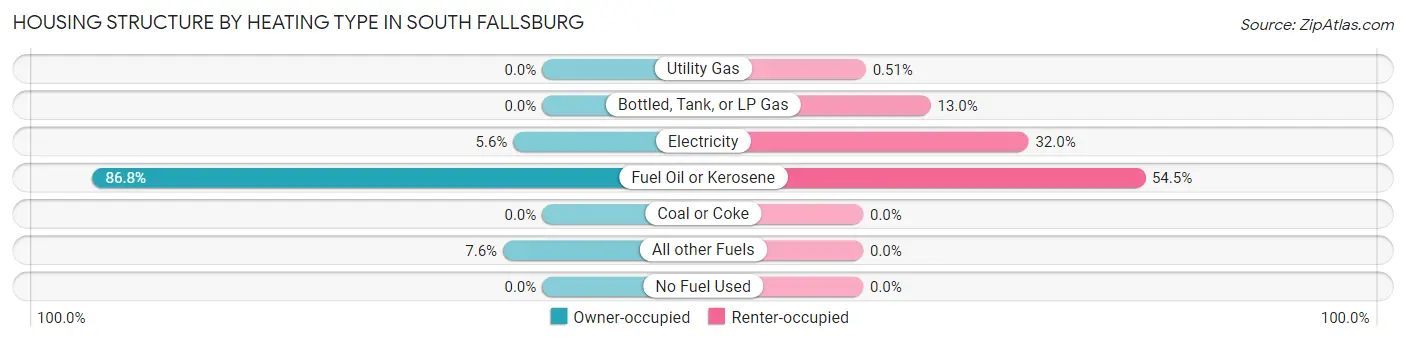
| Heating Type | Owner-occupied | Renter-occupied |
| Utility Gas | 0 (0.0%) | 2 (0.5%) |
| Bottled, Tank, or LP Gas | 0 (0.0%) | 51 (13.0%) |
| Electricity | 17 (5.6%) | 125 (32.0%) |
| Fuel Oil or Kerosene | 264 (86.8%) | 213 (54.5%) |
| Coal or Coke | 0 (0.0%) | 0 (0.0%) |
| All other Fuels | 23 (7.6%) | 0 (0.0%) |
| No Fuel Used | 0 (0.0%) | 0 (0.0%) |
| Total | 304 (100.0%) | 391 (100.0%) |
Household Vehicle Usage in South Fallsburg
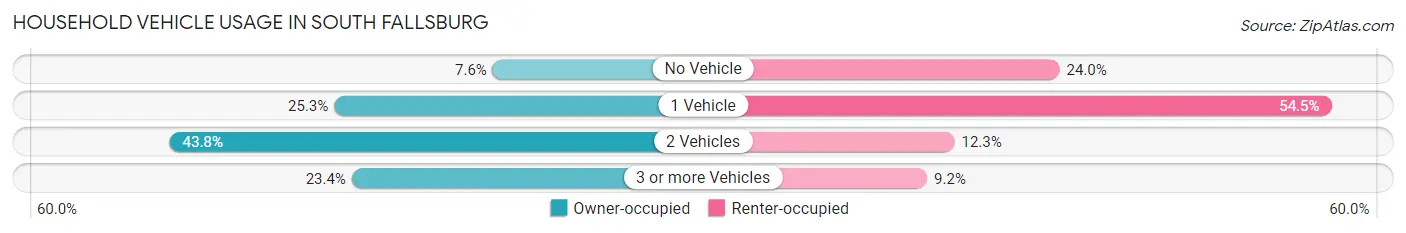
| Vehicles per Household | Owner-occupied | Renter-occupied |
| No Vehicle | 23 (7.6%) | 94 (24.0%) |
| 1 Vehicle | 77 (25.3%) | 213 (54.5%) |
| 2 Vehicles | 133 (43.8%) | 48 (12.3%) |
| 3 or more Vehicles | 71 (23.4%) | 36 (9.2%) |
| Total | 304 (100.0%) | 391 (100.0%) |
Real Estate & Mortgages in South Fallsburg
Real Estate and Mortgage Overview in South Fallsburg
| Characteristic | Without Mortgage | With Mortgage |
| Housing Units | 227 | 77 |
| Median Property Value | $305,400 | $0 |
| Median Household Income | - | - |
| Monthly Housing Costs | $951 | $30 |
| Real Estate Taxes | $6,055 | $0 |
Property Value by Mortgage Status in South Fallsburg
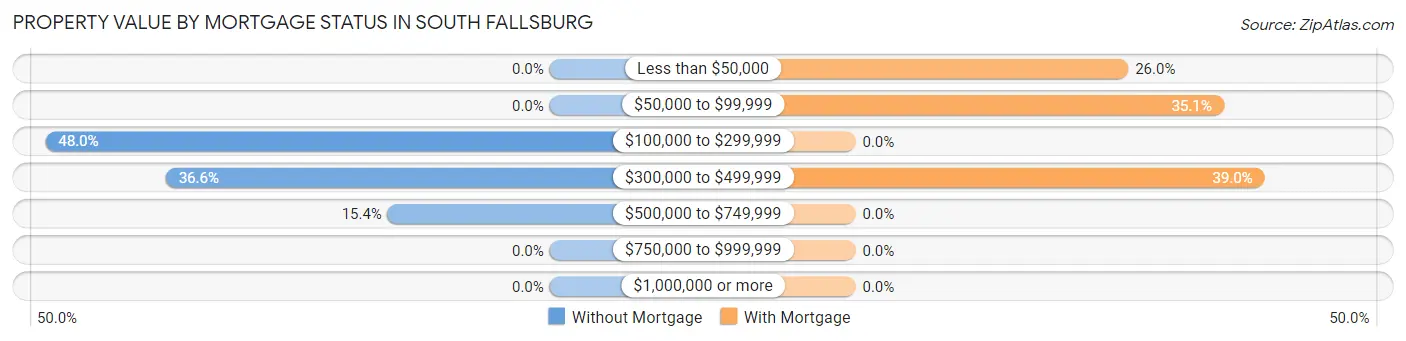
| Property Value | Without Mortgage | With Mortgage |
| Less than $50,000 | 0 (0.0%) | 20 (26.0%) |
| $50,000 to $99,999 | 0 (0.0%) | 27 (35.1%) |
| $100,000 to $299,999 | 109 (48.0%) | 0 (0.0%) |
| $300,000 to $499,999 | 83 (36.6%) | 30 (39.0%) |
| $500,000 to $749,999 | 35 (15.4%) | 0 (0.0%) |
| $750,000 to $999,999 | 0 (0.0%) | 0 (0.0%) |
| $1,000,000 or more | 0 (0.0%) | 0 (0.0%) |
| Total | 227 (100.0%) | 77 (100.0%) |
Household Income by Mortgage Status in South Fallsburg
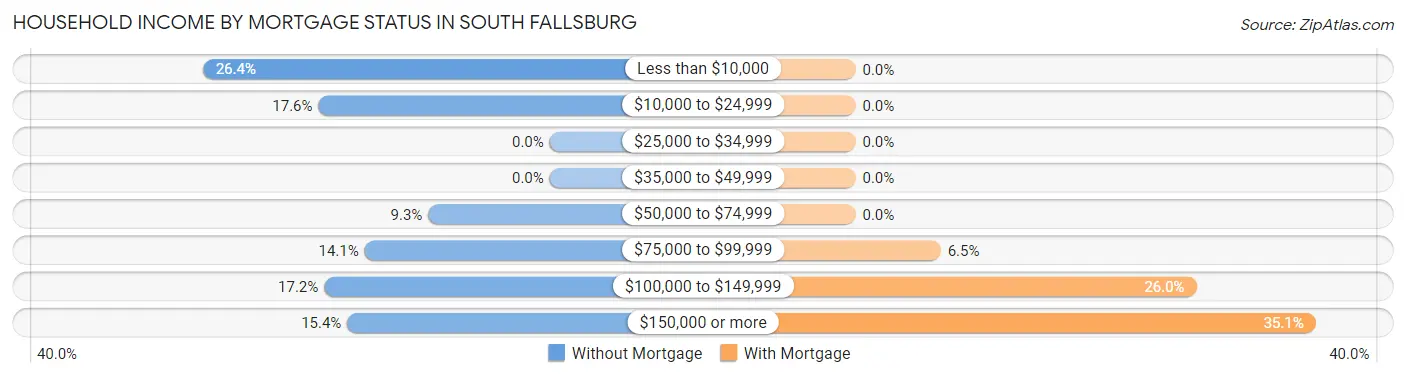
| Household Income | Without Mortgage | With Mortgage |
| Less than $10,000 | 60 (26.4%) | 0 (0.0%) |
| $10,000 to $24,999 | 40 (17.6%) | 0 (0.0%) |
| $25,000 to $34,999 | 0 (0.0%) | 0 (0.0%) |
| $35,000 to $49,999 | 0 (0.0%) | 0 (0.0%) |
| $50,000 to $74,999 | 21 (9.2%) | 0 (0.0%) |
| $75,000 to $99,999 | 32 (14.1%) | 5 (6.5%) |
| $100,000 to $149,999 | 39 (17.2%) | 20 (26.0%) |
| $150,000 or more | 35 (15.4%) | 27 (35.1%) |
| Total | 227 (100.0%) | 77 (100.0%) |
Property Value to Household Income Ratio in South Fallsburg
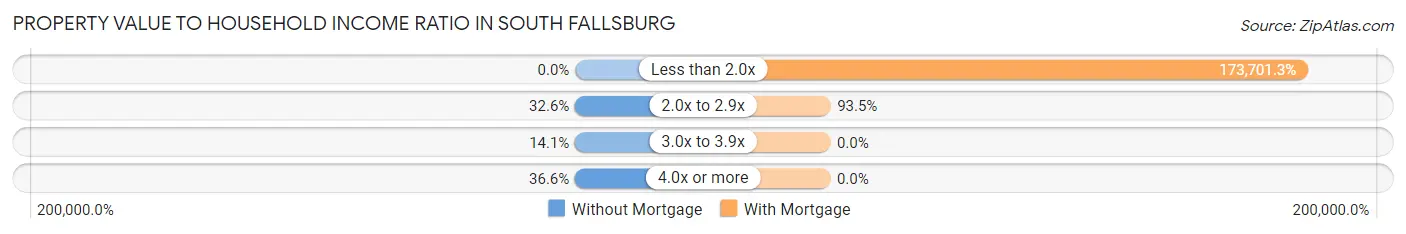
| Value-to-Income Ratio | Without Mortgage | With Mortgage |
| Less than 2.0x | 0 (0.0%) | 133,750 (173,701.3%) |
| 2.0x to 2.9x | 74 (32.6%) | 72 (93.5%) |
| 3.0x to 3.9x | 32 (14.1%) | 0 (0.0%) |
| 4.0x or more | 83 (36.6%) | 0 (0.0%) |
| Total | 227 (100.0%) | 77 (100.0%) |
Real Estate Taxes by Mortgage Status in South Fallsburg
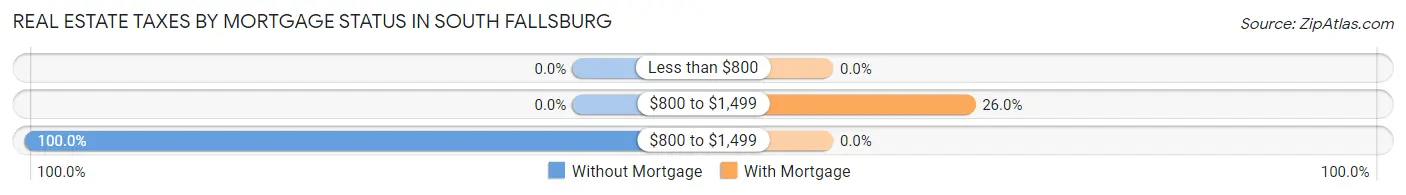
| Property Taxes | Without Mortgage | With Mortgage |
| Less than $800 | 0 (0.0%) | 0 (0.0%) |
| $800 to $1,499 | 0 (0.0%) | 20 (26.0%) |
| $800 to $1,499 | 227 (100.0%) | 0 (0.0%) |
| Total | 227 (100.0%) | 77 (100.0%) |
Health & Disability in South Fallsburg
Health Insurance Coverage by Age in South Fallsburg
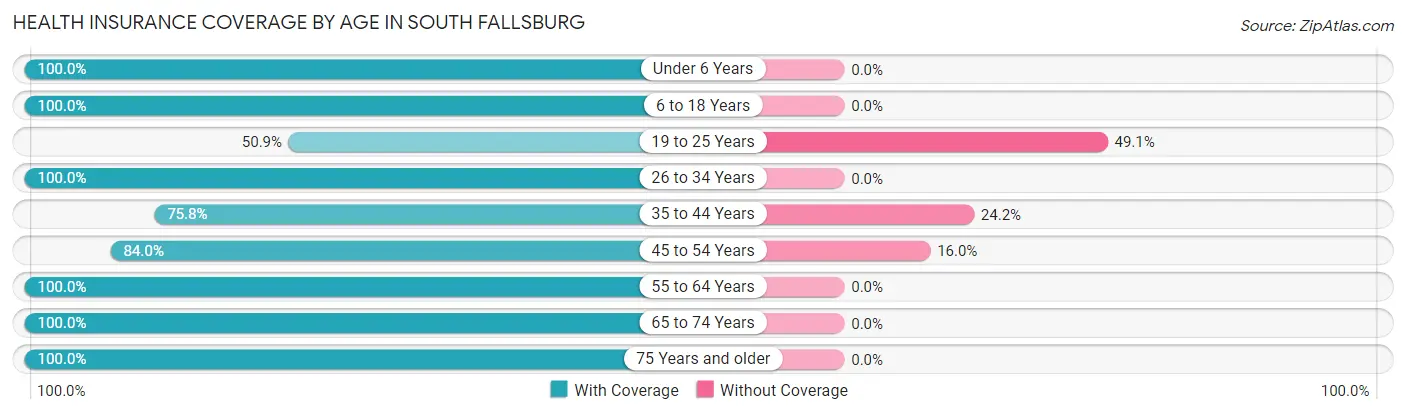
| Age Bracket | With Coverage | Without Coverage |
| Under 6 Years | 210 (100.0%) | 0 (0.0%) |
| 6 to 18 Years | 472 (100.0%) | 0 (0.0%) |
| 19 to 25 Years | 56 (50.9%) | 54 (49.1%) |
| 26 to 34 Years | 174 (100.0%) | 0 (0.0%) |
| 35 to 44 Years | 251 (75.8%) | 80 (24.2%) |
| 45 to 54 Years | 194 (84.0%) | 37 (16.0%) |
| 55 to 64 Years | 71 (100.0%) | 0 (0.0%) |
| 65 to 74 Years | 211 (100.0%) | 0 (0.0%) |
| 75 Years and older | 128 (100.0%) | 0 (0.0%) |
| Total | 1,767 (91.2%) | 171 (8.8%) |
Health Insurance Coverage by Citizenship Status in South Fallsburg
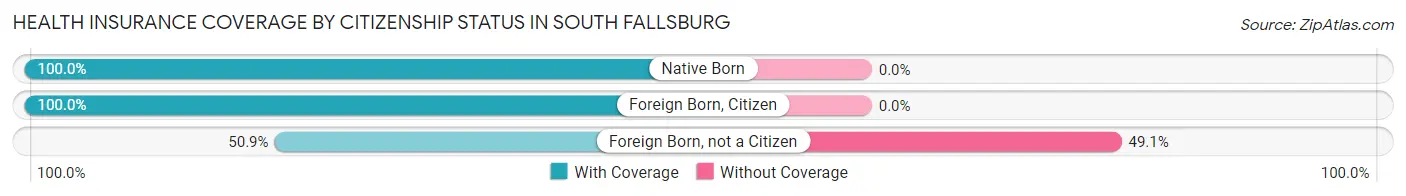
| Citizenship Status | With Coverage | Without Coverage |
| Native Born | 210 (100.0%) | 0 (0.0%) |
| Foreign Born, Citizen | 472 (100.0%) | 0 (0.0%) |
| Foreign Born, not a Citizen | 56 (50.9%) | 54 (49.1%) |
Health Insurance Coverage by Household Income in South Fallsburg
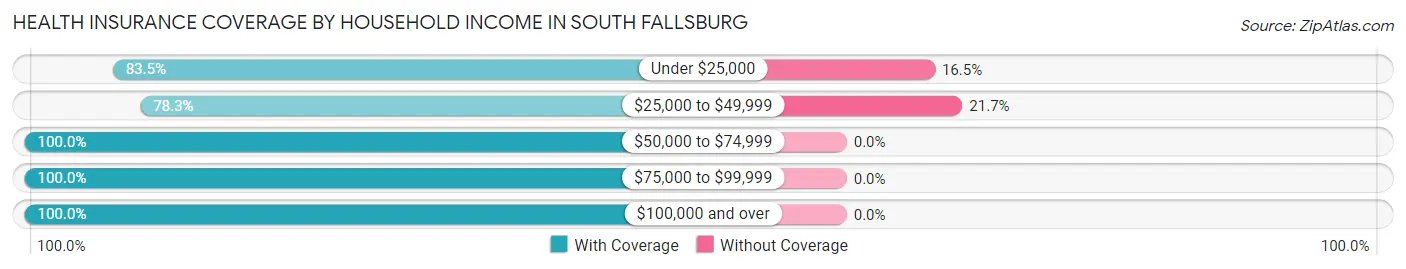
| Household Income | With Coverage | Without Coverage |
| Under $25,000 | 192 (83.5%) | 38 (16.5%) |
| $25,000 to $49,999 | 481 (78.3%) | 133 (21.7%) |
| $50,000 to $74,999 | 191 (100.0%) | 0 (0.0%) |
| $75,000 to $99,999 | 401 (100.0%) | 0 (0.0%) |
| $100,000 and over | 441 (100.0%) | 0 (0.0%) |
Public vs Private Health Insurance Coverage by Age in South Fallsburg
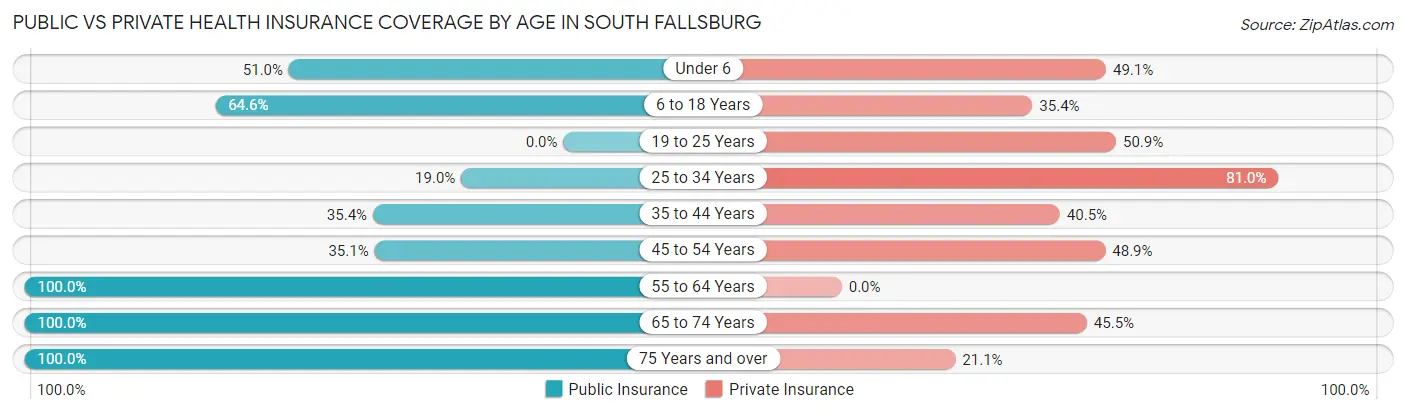
| Age Bracket | Public Insurance | Private Insurance |
| Under 6 | 107 (50.9%) | 103 (49.0%) |
| 6 to 18 Years | 305 (64.6%) | 167 (35.4%) |
| 19 to 25 Years | 0 (0.0%) | 56 (50.9%) |
| 25 to 34 Years | 33 (19.0%) | 141 (81.0%) |
| 35 to 44 Years | 117 (35.3%) | 134 (40.5%) |
| 45 to 54 Years | 81 (35.1%) | 113 (48.9%) |
| 55 to 64 Years | 71 (100.0%) | 0 (0.0%) |
| 65 to 74 Years | 211 (100.0%) | 96 (45.5%) |
| 75 Years and over | 128 (100.0%) | 27 (21.1%) |
| Total | 1,053 (54.3%) | 837 (43.2%) |
Disability Status by Sex by Age in South Fallsburg
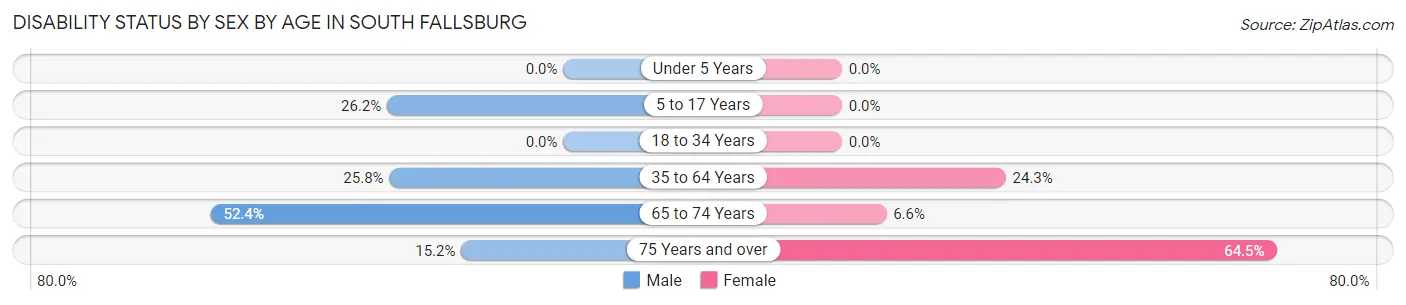
| Age Bracket | Male | Female |
| Under 5 Years | 0 (0.0%) | 0 (0.0%) |
| 5 to 17 Years | 67 (26.2%) | 0 (0.0%) |
| 18 to 34 Years | 0 (0.0%) | 0 (0.0%) |
| 35 to 64 Years | 86 (25.8%) | 73 (24.3%) |
| 65 to 74 Years | 55 (52.4%) | 7 (6.6%) |
| 75 Years and over | 10 (15.1%) | 40 (64.5%) |
Disability Class by Sex by Age in South Fallsburg
Disability Class: Hearing Difficulty
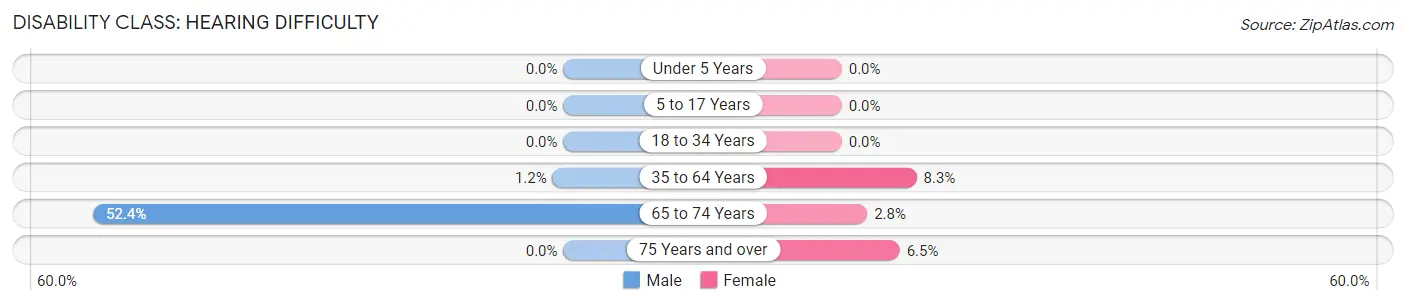
| Age Bracket | Male | Female |
| Under 5 Years | 0 (0.0%) | 0 (0.0%) |
| 5 to 17 Years | 0 (0.0%) | 0 (0.0%) |
| 18 to 34 Years | 0 (0.0%) | 0 (0.0%) |
| 35 to 64 Years | 4 (1.2%) | 25 (8.3%) |
| 65 to 74 Years | 55 (52.4%) | 3 (2.8%) |
| 75 Years and over | 0 (0.0%) | 4 (6.5%) |
Disability Class: Vision Difficulty
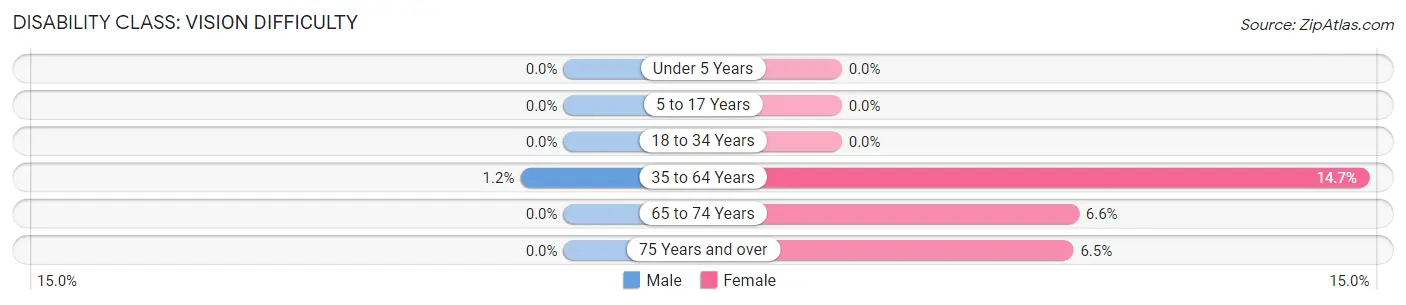
| Age Bracket | Male | Female |
| Under 5 Years | 0 (0.0%) | 0 (0.0%) |
| 5 to 17 Years | 0 (0.0%) | 0 (0.0%) |
| 18 to 34 Years | 0 (0.0%) | 0 (0.0%) |
| 35 to 64 Years | 4 (1.2%) | 44 (14.7%) |
| 65 to 74 Years | 0 (0.0%) | 7 (6.6%) |
| 75 Years and over | 0 (0.0%) | 4 (6.5%) |
Disability Class: Cognitive Difficulty
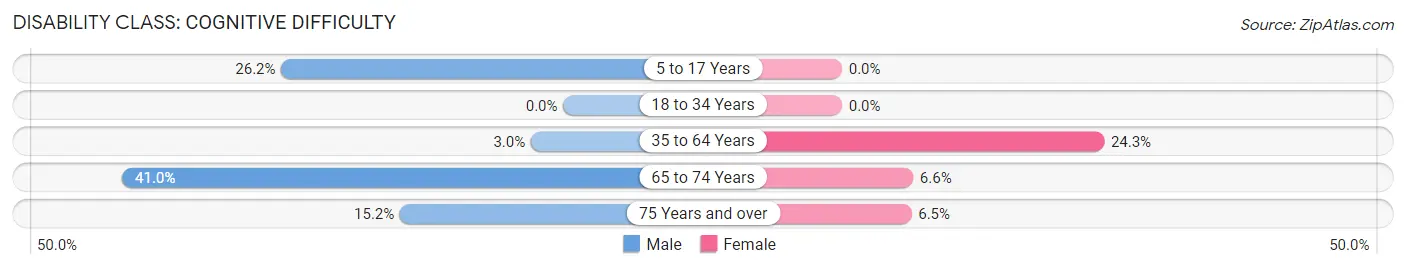
| Age Bracket | Male | Female |
| 5 to 17 Years | 67 (26.2%) | 0 (0.0%) |
| 18 to 34 Years | 0 (0.0%) | 0 (0.0%) |
| 35 to 64 Years | 10 (3.0%) | 73 (24.3%) |
| 65 to 74 Years | 43 (40.9%) | 7 (6.6%) |
| 75 Years and over | 10 (15.1%) | 4 (6.5%) |
Disability Class: Ambulatory Difficulty
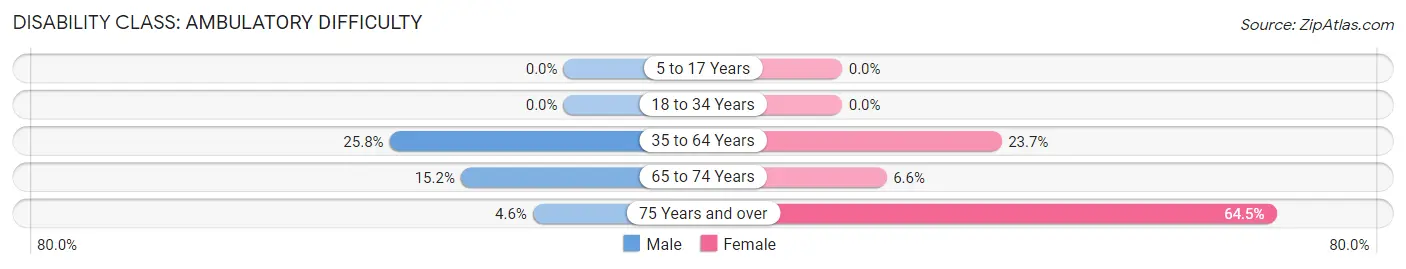
| Age Bracket | Male | Female |
| 5 to 17 Years | 0 (0.0%) | 0 (0.0%) |
| 18 to 34 Years | 0 (0.0%) | 0 (0.0%) |
| 35 to 64 Years | 86 (25.8%) | 71 (23.7%) |
| 65 to 74 Years | 16 (15.2%) | 7 (6.6%) |
| 75 Years and over | 3 (4.5%) | 40 (64.5%) |
Disability Class: Self-Care Difficulty
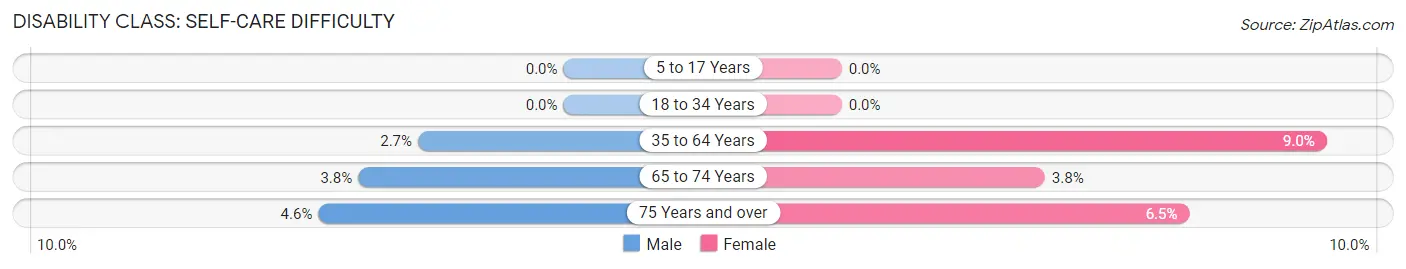
| Age Bracket | Male | Female |
| 5 to 17 Years | 0 (0.0%) | 0 (0.0%) |
| 18 to 34 Years | 0 (0.0%) | 0 (0.0%) |
| 35 to 64 Years | 9 (2.7%) | 27 (9.0%) |
| 65 to 74 Years | 4 (3.8%) | 4 (3.8%) |
| 75 Years and over | 3 (4.5%) | 4 (6.5%) |
Technology Access in South Fallsburg
Computing Device Access in South Fallsburg
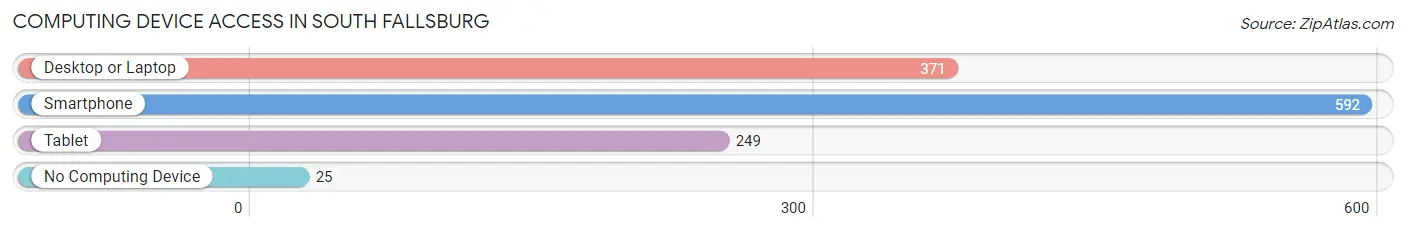
| Device Type | # Households | % Households |
| Desktop or Laptop | 371 | 53.4% |
| Smartphone | 592 | 85.2% |
| Tablet | 249 | 35.8% |
| No Computing Device | 25 | 3.6% |
| Total | 695 | 100.0% |
Internet Access in South Fallsburg
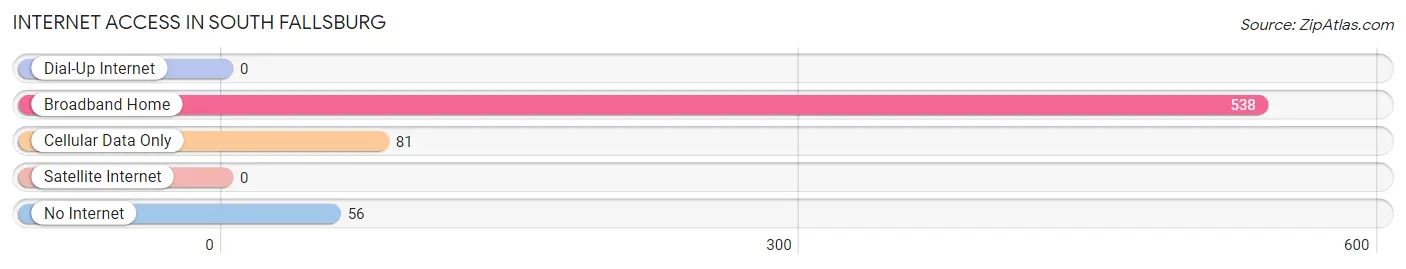
| Internet Type | # Households | % Households |
| Dial-Up Internet | 0 | 0.0% |
| Broadband Home | 538 | 77.4% |
| Cellular Data Only | 81 | 11.7% |
| Satellite Internet | 0 | 0.0% |
| No Internet | 56 | 8.1% |
| Total | 695 | 100.0% |
South Fallsburg Summary
Fallsburg is a town located in Sullivan County, New York, United States. The town is in the southeast part of the county and is part of the Catskill Mountains region. The population was 8,169 at the 2010 census. The town contains a village also named Fallsburg.
History
The town of Fallsburg was first settled in 1788 by a group of settlers from Connecticut. The town was originally part of the town of Mamakating, but was later separated and incorporated in 1826. The town was named after the falls on the Neversink River.
The town was an important center of the lumber industry in the 19th century. The lumber was used to build homes and other structures in the area. The town also had a thriving dairy industry, with many farms located in the area.
The town was also home to a number of resorts in the late 19th and early 20th centuries. These resorts attracted many visitors from New York City and other parts of the country. The resorts included the Fallsburg House, the Neversink House, and the Mountain View House.
Geography
Fallsburg is located in the southeast part of Sullivan County, New York. The town is bordered by the towns of Mamakating to the north, Liberty to the east, Lumberland to the south, and Neversink to the west.
The town is located in the Catskill Mountains region of New York. The Neversink River runs through the town, and there are several small lakes and ponds in the area. The highest point in the town is 2,890 feet (880 m) above sea level.
Economy
The economy of Fallsburg is largely based on tourism. The town is home to several resorts, including the Fallsburg House, the Neversink House, and the Mountain View House. These resorts attract visitors from all over the country.
The town is also home to several small businesses, including restaurants, shops, and other services. The town is also home to a number of farms, which produce dairy products, fruits, and vegetables.
Demographics
As of the 2010 census, there were 8,169 people, 3,093 households, and 2,092 families living in the town. The population density was 97.3 people per square mile (37.6/km2). There were 3,845 housing units at an average density of 45.2 per square mile (17.5/km2).
The racial makeup of the town was 87.2% White, 8.2% African American, 0.3% Native American, 0.7% Asian, 0.1% Pacific Islander, 1.3% from other races, and 2.4% from two or more races. Hispanic or Latino of any race were 5.3% of the population.
There were 3,093 households, out of which 28.2% had children under the age of 18 living with them, 48.2% were married couples living together, 13.2% had a female householder with no husband present, and 32.7% were non-families. 27.2% of all households were made up of individuals, and 11.7% had someone living alone who was 65 years of age or older. The average household size was 2.54 and the average family size was 3.09.
In the town, the population was spread out, with 24.2% under the age of 18, 8.2% from 18 to 24, 25.2% from 25 to 44, 27.2% from 45 to 64, and 15.2% who were 65 years of age or older. The median age was 39 years. For every 100 females, there were 95.2 males. For every 100 females age 18 and over, there were 92.2 males.
The median income for a household in the town was $37,917, and the median income for a family was $45,938. Males had a median income of $35,938 versus $25,917 for females. The per capita income for the town was $17,917. About 10.2% of families and 13.2% of the population were below the poverty line, including 17.2% of those under age 18 and 8.2% of those age 65 or over.
Common Questions
What is the Total Population of South Fallsburg?
Total Population of South Fallsburg is 1,938.
What is the Total Male Population of South Fallsburg?
Total Male Population of South Fallsburg is 948.
What is the Total Female Population of South Fallsburg?
Total Female Population of South Fallsburg is 990.
What is the Ratio of Males per 100 Females in South Fallsburg?
There are 95.76 Males per 100 Females in South Fallsburg.
What is the Ratio of Females per 100 Males in South Fallsburg?
There are 104.43 Females per 100 Males in South Fallsburg.
What is the Median Population Age in South Fallsburg?
Median Population Age in South Fallsburg is 35.0 Years.
What is the Average Family Size in South Fallsburg
Average Family Size in South Fallsburg is 3.6 People.
What is the Average Household Size in South Fallsburg
Average Household Size in South Fallsburg is 2.7 People.
What is Per Capita Income in South Fallsburg?
Per Capita income in South Fallsburg is $27,484.
What is the Median Family Income in South Fallsburg?
Median Family Income in South Fallsburg is $74,286.
What is Inequality or Gini Index in South Fallsburg?
Inequality or Gini Index in South Fallsburg is 0.55.
How Large is the Labor Force in South Fallsburg?
There are 775 People in the Labor Forcein in South Fallsburg.
What is the Percentage of People in the Labor Force in South Fallsburg?
58.6% of People are in the Labor Force in South Fallsburg.