Massapequa, NY
Massapequa Map
Massapequa Overview
21,845
TOTAL POPULATION
10,606
MALE POPULATION
11,239
FEMALE POPULATION
94.37
MALES / 100 FEMALES
105.97
FEMALES / 100 MALES
44.7
MEDIAN AGE
3.3
AVG FAMILY SIZE
3.0
AVG HOUSEHOLD SIZE
$68,572
PER CAPITA INCOME
$183,040
AVG FAMILY INCOME
$170,151
AVG HOUSEHOLD INCOME
37.4%
WAGE / INCOME GAP [ % ]
62.6¢/ $1
WAGE / INCOME GAP [ $ ]
$10,656
FAMILY INCOME DEFICIT
0.40
INEQUALITY / GINI INDEX
11,991
LABOR FORCE [ PEOPLE ]
66.2%
PERCENT IN LABOR FORCE
4.5%
UNEMPLOYMENT RATE
Massapequa Zip Codes
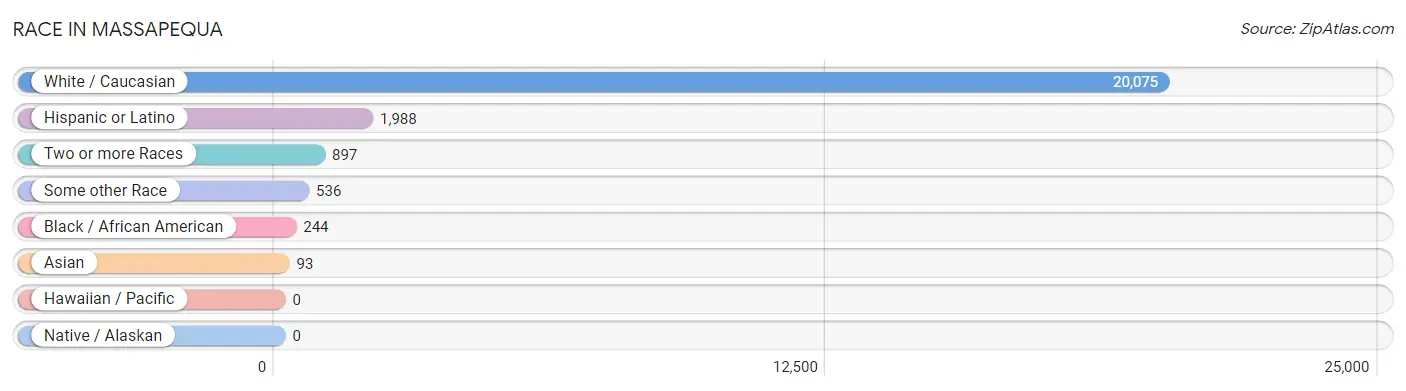
Race in Massapequa
The most populous races in Massapequa are White / Caucasian (20,075 | 91.9%), Hispanic or Latino (1,988 | 9.1%), and Two or more Races (897 | 4.1%).
| Race | # Population | % Population |
| Asian | 93 | 0.4% |
| Black / African American | 244 | 1.1% |
| Hawaiian / Pacific | 0 | 0.0% |
| Hispanic or Latino | 1,988 | 9.1% |
| Native / Alaskan | 0 | 0.0% |
| White / Caucasian | 20,075 | 91.9% |
| Two or more Races | 897 | 4.1% |
| Some other Race | 536 | 2.5% |
| Total | 21,845 | 100.0% |
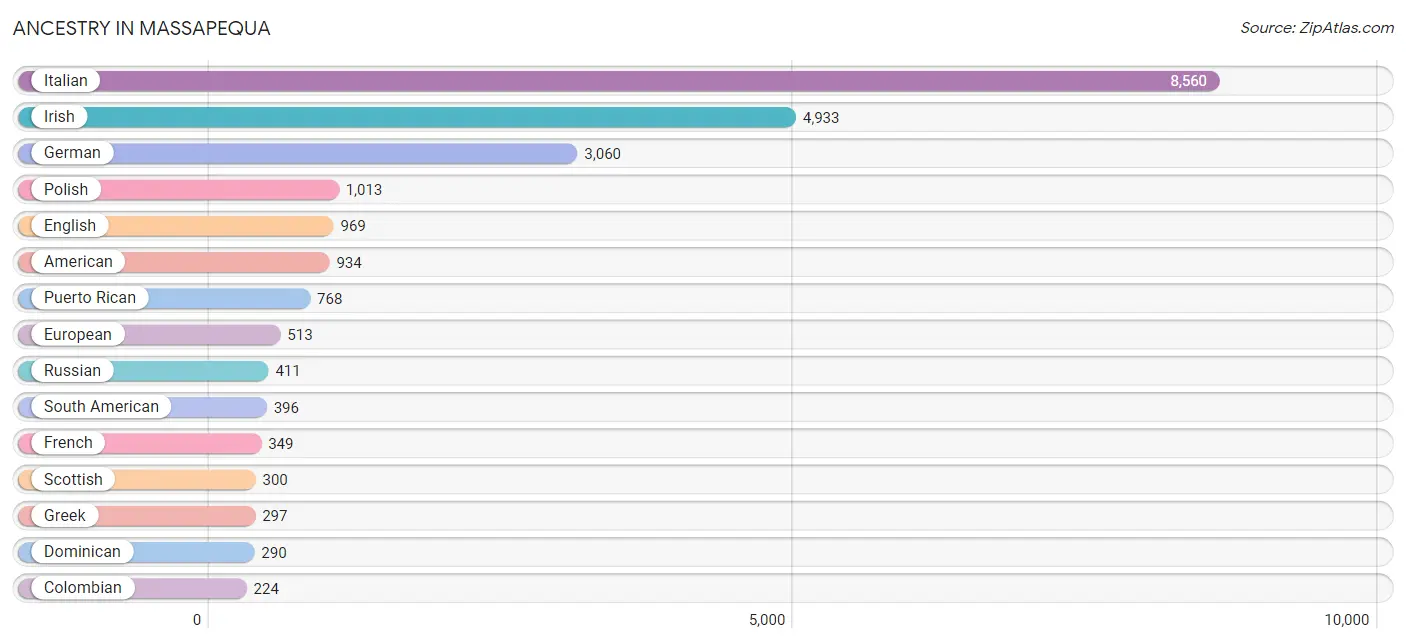
Ancestry in Massapequa
The most populous ancestries reported in Massapequa are Italian (8,560 | 39.2%), Irish (4,933 | 22.6%), German (3,060 | 14.0%), Polish (1,013 | 4.6%), and English (969 | 4.4%), together accounting for 84.9% of all Massapequa residents.
| Ancestry | # Population | % Population |
| Afghan | 6 | 0.0% |
| American | 934 | 4.3% |
| Arab | 129 | 0.6% |
| Argentinean | 38 | 0.2% |
| Armenian | 185 | 0.9% |
| Assyrian / Chaldean / Syriac | 23 | 0.1% |
| Australian | 8 | 0.0% |
| Austrian | 206 | 0.9% |
| Basque | 11 | 0.1% |
| Belgian | 5 | 0.0% |
| Belizean | 48 | 0.2% |
| Bhutanese | 16 | 0.1% |
| Brazilian | 11 | 0.1% |
| British | 17 | 0.1% |
| Burmese | 16 | 0.1% |
| Canadian | 39 | 0.2% |
| Central American | 99 | 0.4% |
| Cherokee | 73 | 0.3% |
| Chilean | 9 | 0.0% |
| Colombian | 224 | 1.0% |
| Croatian | 111 | 0.5% |
| Cuban | 138 | 0.6% |
| Czech | 57 | 0.3% |
| Czechoslovakian | 104 | 0.5% |
| Danish | 13 | 0.1% |
| Dominican | 290 | 1.3% |
| Dutch | 108 | 0.5% |
| Eastern European | 73 | 0.3% |
| Ecuadorian | 42 | 0.2% |
| English | 969 | 4.4% |
| European | 513 | 2.4% |
| Finnish | 24 | 0.1% |
| French | 349 | 1.6% |
| French Canadian | 82 | 0.4% |
| German | 3,060 | 14.0% |
| Greek | 297 | 1.4% |
| Guatemalan | 21 | 0.1% |
| Hungarian | 196 | 0.9% |
| Indian (Asian) | 35 | 0.2% |
| Iranian | 18 | 0.1% |
| Irish | 4,933 | 22.6% |
| Israeli | 87 | 0.4% |
| Italian | 8,560 | 39.2% |
| Jamaican | 34 | 0.2% |
| Jordanian | 30 | 0.1% |
| Korean | 23 | 0.1% |
| Latvian | 37 | 0.2% |
| Lebanese | 79 | 0.4% |
| Lithuanian | 13 | 0.1% |
| Mexican | 66 | 0.3% |
| Mexican American Indian | 16 | 0.1% |
| Nigerian | 1 | 0.0% |
| Norwegian | 104 | 0.5% |
| Palestinian | 30 | 0.1% |
| Peruvian | 83 | 0.4% |
| Polish | 1,013 | 4.6% |
| Portuguese | 55 | 0.3% |
| Puerto Rican | 768 | 3.5% |
| Russian | 411 | 1.9% |
| Salvadoran | 78 | 0.4% |
| Scandinavian | 8 | 0.0% |
| Scotch-Irish | 19 | 0.1% |
| Scottish | 300 | 1.4% |
| Slovak | 4 | 0.0% |
| South American | 396 | 1.8% |
| Spaniard | 74 | 0.3% |
| Spanish | 18 | 0.1% |
| Sri Lankan | 1 | 0.0% |
| Subsaharan African | 1 | 0.0% |
| Swedish | 117 | 0.5% |
| Swiss | 13 | 0.1% |
| Thai | 26 | 0.1% |
| Trinidadian and Tobagonian | 10 | 0.1% |
| Turkish | 15 | 0.1% |
| Ukrainian | 99 | 0.4% |
| Welsh | 5 | 0.0% |
| West Indian | 130 | 0.6% | View All 77 Rows |
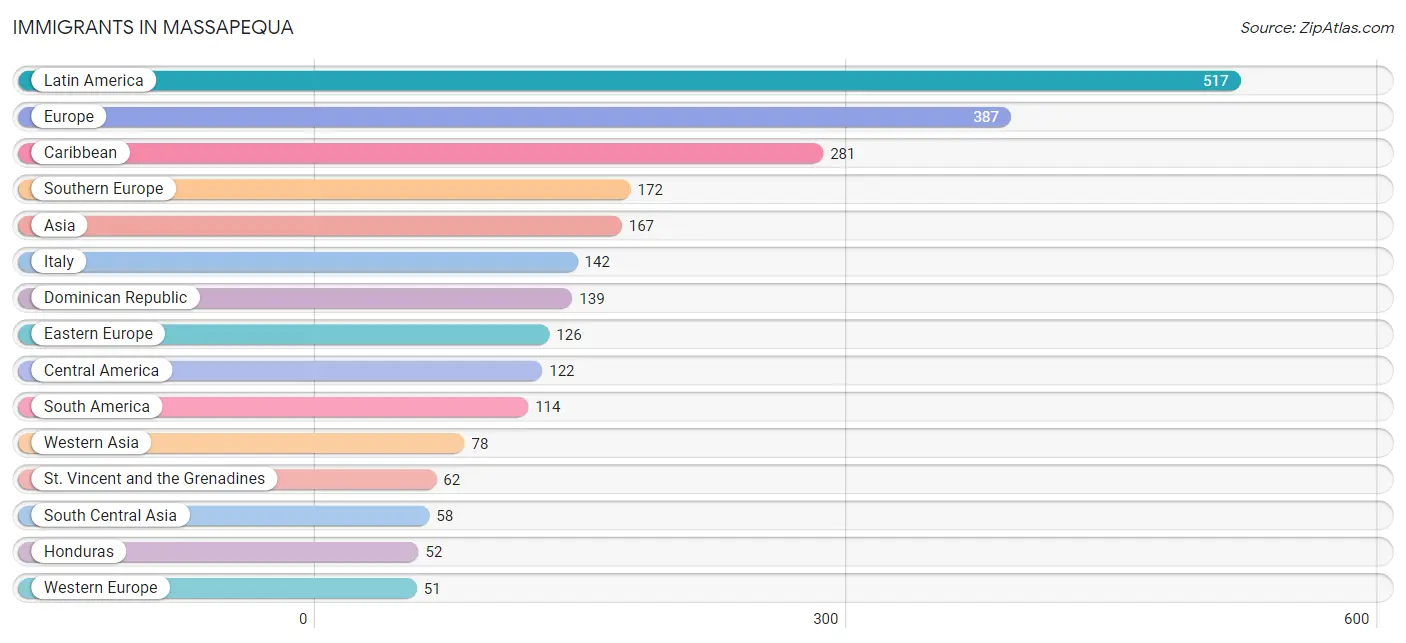
Immigrants in Massapequa
The most numerous immigrant groups reported in Massapequa came from Latin America (517 | 2.4%), Europe (387 | 1.8%), Caribbean (281 | 1.3%), Southern Europe (172 | 0.8%), and Asia (167 | 0.8%), together accounting for 7.0% of all Massapequa residents.
| Immigration Origin | # Population | % Population |
| Afghanistan | 6 | 0.0% |
| Africa | 26 | 0.1% |
| Armenia | 12 | 0.1% |
| Asia | 167 | 0.8% |
| Belize | 48 | 0.2% |
| Brazil | 11 | 0.1% |
| Canada | 38 | 0.2% |
| Caribbean | 281 | 1.3% |
| Central America | 122 | 0.6% |
| Chile | 16 | 0.1% |
| China | 12 | 0.1% |
| Colombia | 30 | 0.1% |
| Croatia | 20 | 0.1% |
| Cuba | 43 | 0.2% |
| Czechoslovakia | 15 | 0.1% |
| Dominican Republic | 139 | 0.6% |
| Eastern Asia | 12 | 0.1% |
| Eastern Europe | 126 | 0.6% |
| Ecuador | 16 | 0.1% |
| England | 15 | 0.1% |
| Europe | 387 | 1.8% |
| France | 11 | 0.1% |
| Germany | 19 | 0.1% |
| Greece | 30 | 0.1% |
| Guatemala | 14 | 0.1% |
| Guyana | 3 | 0.0% |
| Honduras | 52 | 0.2% |
| Hong Kong | 6 | 0.0% |
| India | 39 | 0.2% |
| Iraq | 8 | 0.0% |
| Ireland | 8 | 0.0% |
| Italy | 142 | 0.6% |
| Jamaica | 10 | 0.1% |
| Kuwait | 9 | 0.0% |
| Latin America | 517 | 2.4% |
| Lebanon | 49 | 0.2% |
| Mexico | 8 | 0.0% |
| Middle Africa | 26 | 0.1% |
| Netherlands | 21 | 0.1% |
| Northern Europe | 38 | 0.2% |
| Peru | 38 | 0.2% |
| Philippines | 13 | 0.1% |
| Poland | 30 | 0.1% |
| Russia | 17 | 0.1% |
| Scotland | 15 | 0.1% |
| South America | 114 | 0.5% |
| South Central Asia | 58 | 0.3% |
| South Eastern Asia | 19 | 0.1% |
| Southern Europe | 172 | 0.8% |
| St. Vincent and the Grenadines | 62 | 0.3% |
| Trinidad and Tobago | 27 | 0.1% |
| Ukraine | 37 | 0.2% |
| Uzbekistan | 13 | 0.1% |
| Vietnam | 1 | 0.0% |
| Western Asia | 78 | 0.4% |
| Western Europe | 51 | 0.2% | View All 56 Rows |
Sex and Age in Massapequa
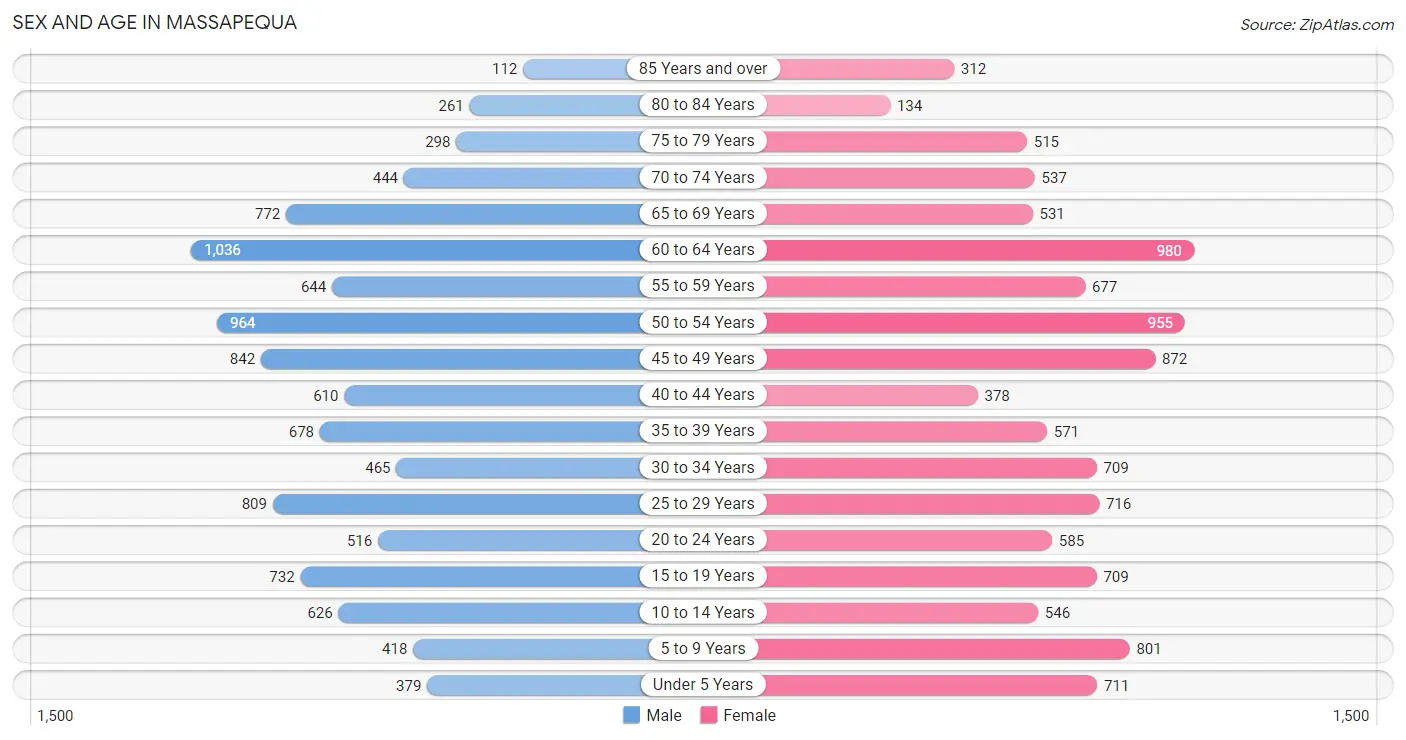
Sex and Age in Massapequa
The most populous age groups in Massapequa are 60 to 64 Years (1,036 | 9.8%) for men and 60 to 64 Years (980 | 8.7%) for women.
| Age Bracket | Male | Female |
| Under 5 Years | 379 (3.6%) | 711 (6.3%) |
| 5 to 9 Years | 418 (3.9%) | 801 (7.1%) |
| 10 to 14 Years | 626 (5.9%) | 546 (4.9%) |
| 15 to 19 Years | 732 (6.9%) | 709 (6.3%) |
| 20 to 24 Years | 516 (4.9%) | 585 (5.2%) |
| 25 to 29 Years | 809 (7.6%) | 716 (6.4%) |
| 30 to 34 Years | 465 (4.4%) | 709 (6.3%) |
| 35 to 39 Years | 678 (6.4%) | 571 (5.1%) |
| 40 to 44 Years | 610 (5.8%) | 378 (3.4%) |
| 45 to 49 Years | 842 (7.9%) | 872 (7.8%) |
| 50 to 54 Years | 964 (9.1%) | 955 (8.5%) |
| 55 to 59 Years | 644 (6.1%) | 677 (6.0%) |
| 60 to 64 Years | 1,036 (9.8%) | 980 (8.7%) |
| 65 to 69 Years | 772 (7.3%) | 531 (4.7%) |
| 70 to 74 Years | 444 (4.2%) | 537 (4.8%) |
| 75 to 79 Years | 298 (2.8%) | 515 (4.6%) |
| 80 to 84 Years | 261 (2.5%) | 134 (1.2%) |
| 85 Years and over | 112 (1.1%) | 312 (2.8%) |
| Total | 10,606 (100.0%) | 11,239 (100.0%) |
Families and Households in Massapequa
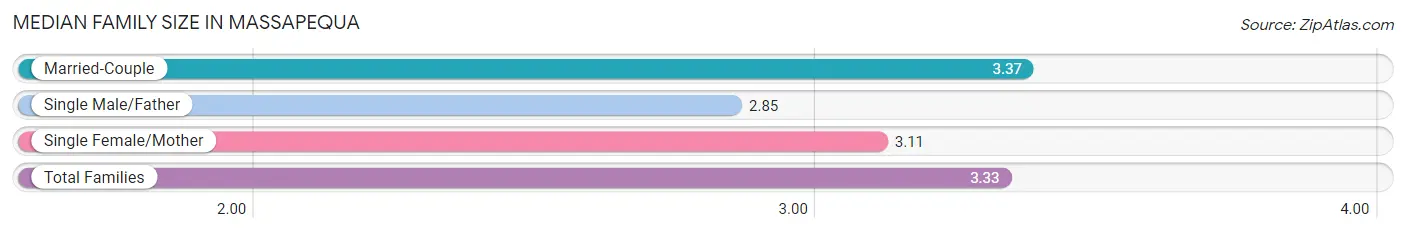
Median Family Size in Massapequa
The median family size in Massapequa is 3.33 persons per family, with married-couple families (5,122 | 87.3%) accounting for the largest median family size of 3.37 persons per family. On the other hand, single male/father families (150 | 2.6%) represent the smallest median family size with 2.85 persons per family.
| Family Type | # Families | Family Size |
| Married-Couple | 5,122 (87.3%) | 3.37 |
| Single Male/Father | 150 (2.6%) | 2.85 |
| Single Female/Mother | 593 (10.1%) | 3.11 |
| Total Families | 5,865 (100.0%) | 3.33 |
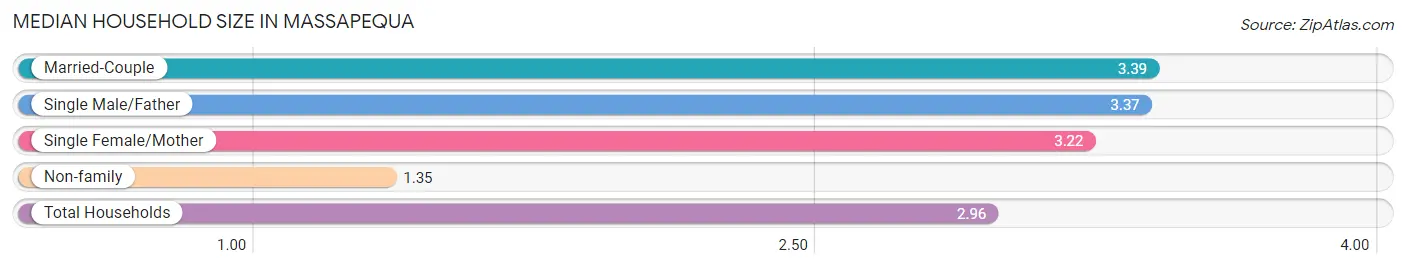
Median Household Size in Massapequa
The median household size in Massapequa is 2.96 persons per household, with married-couple households (5,122 | 69.6%) accounting for the largest median household size of 3.39 persons per household. non-family households (1,493 | 20.3%) represent the smallest median household size with 1.35 persons per household.
| Household Type | # Households | Household Size |
| Married-Couple | 5,122 (69.6%) | 3.39 |
| Single Male/Father | 150 (2.0%) | 3.37 |
| Single Female/Mother | 593 (8.1%) | 3.22 |
| Non-family | 1,493 (20.3%) | 1.35 |
| Total Households | 7,358 (100.0%) | 2.96 |
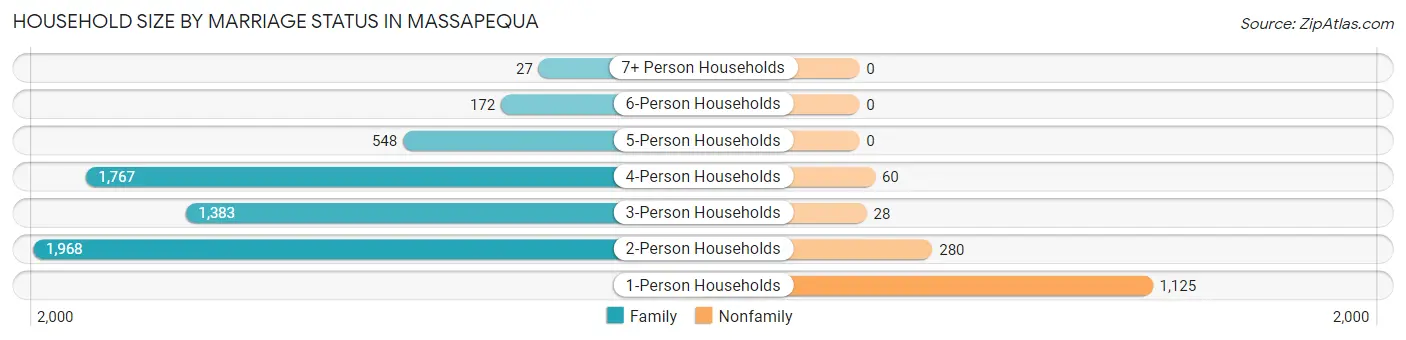
Household Size by Marriage Status in Massapequa
Out of a total of 7,358 households in Massapequa, 5,865 (79.7%) are family households, while 1,493 (20.3%) are nonfamily households. The most numerous type of family households are 2-person households, comprising 1,968, and the most common type of nonfamily households are 1-person households, comprising 1,125.
| Household Size | Family Households | Nonfamily Households |
| 1-Person Households | - | 1,125 (15.3%) |
| 2-Person Households | 1,968 (26.8%) | 280 (3.8%) |
| 3-Person Households | 1,383 (18.8%) | 28 (0.4%) |
| 4-Person Households | 1,767 (24.0%) | 60 (0.8%) |
| 5-Person Households | 548 (7.4%) | 0 (0.0%) |
| 6-Person Households | 172 (2.3%) | 0 (0.0%) |
| 7+ Person Households | 27 (0.4%) | 0 (0.0%) |
| Total | 5,865 (79.7%) | 1,493 (20.3%) |
Female Fertility in Massapequa
Fertility by Age in Massapequa
Average fertility rate in Massapequa is 47.0 births per 1,000 women. Women in the age bracket of 20 to 34 years have the highest fertility rate with 72.0 births per 1,000 women. Women in the age bracket of 20 to 34 years acount for 64.6% of all women with births.
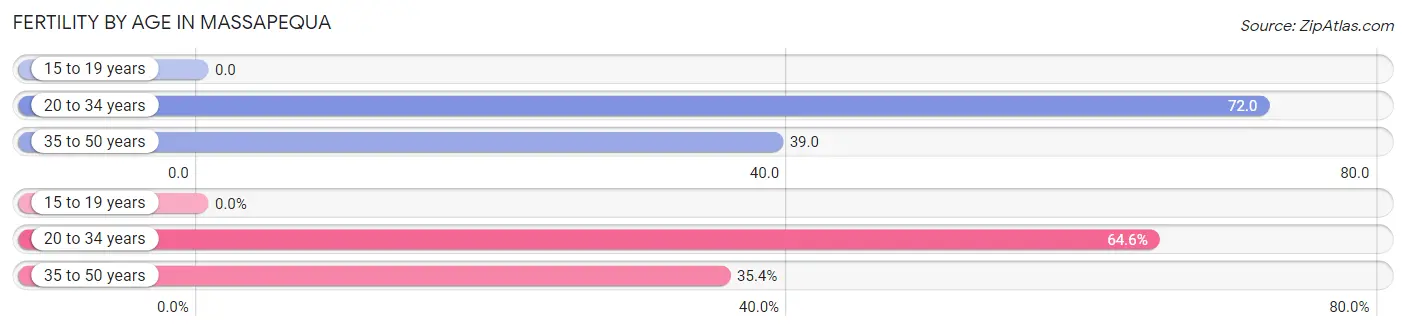
| Age Bracket | Women with Births | Births / 1,000 Women |
| 15 to 19 years | 0 (0.0%) | 0.0 |
| 20 to 34 years | 144 (64.6%) | 72.0 |
| 35 to 50 years | 79 (35.4%) | 39.0 |
| Total | 223 (100.0%) | 47.0 |
Fertility by Age by Marriage Status in Massapequa
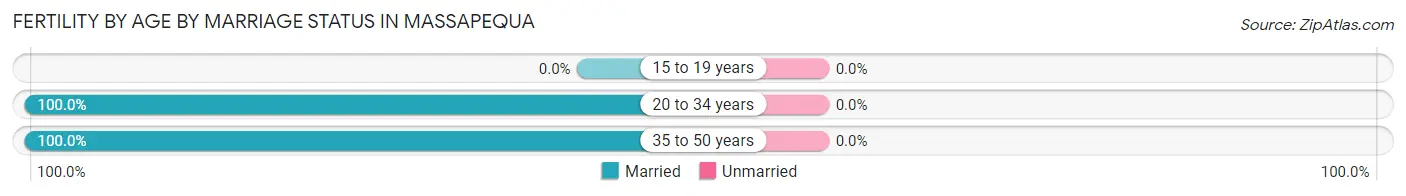
| Age Bracket | Married | Unmarried |
| 15 to 19 years | 0 (0.0%) | 0 (0.0%) |
| 20 to 34 years | 144 (100.0%) | 0 (0.0%) |
| 35 to 50 years | 79 (100.0%) | 0 (0.0%) |
| Total | 223 (100.0%) | 0 (0.0%) |
Fertility by Education in Massapequa
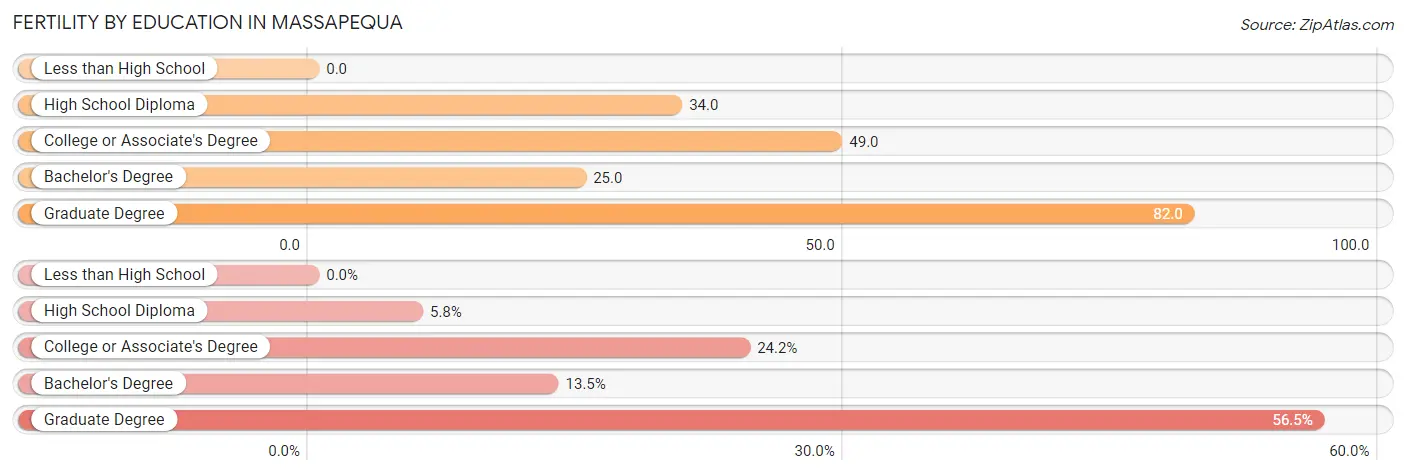
| Educational Attainment | Women with Births | Births / 1,000 Women |
| Less than High School | 0 (0.0%) | 0.0 |
| High School Diploma | 13 (5.8%) | 34.0 |
| College or Associate's Degree | 54 (24.2%) | 49.0 |
| Bachelor's Degree | 30 (13.5%) | 25.0 |
| Graduate Degree | 126 (56.5%) | 82.0 |
| Total | 223 (100.0%) | 47.0 |
Fertility by Education by Marriage Status in Massapequa
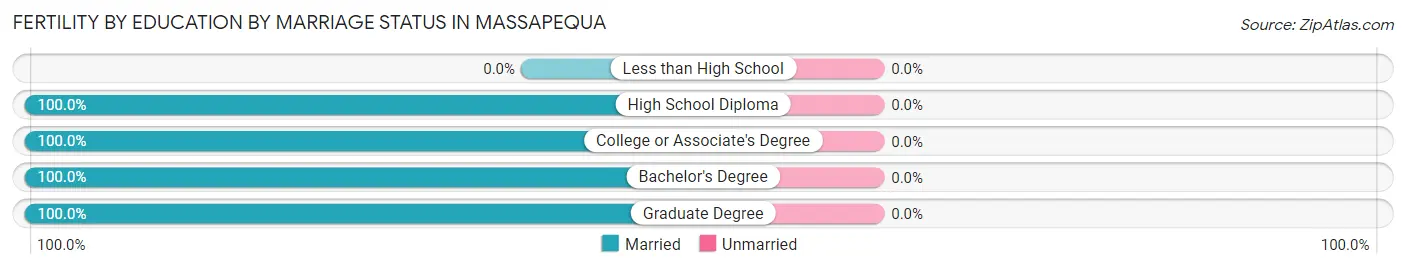
| Educational Attainment | Married | Unmarried |
| Less than High School | 0 (0.0%) | 0 (0.0%) |
| High School Diploma | 13 (100.0%) | 0 (0.0%) |
| College or Associate's Degree | 54 (100.0%) | 0 (0.0%) |
| Bachelor's Degree | 30 (100.0%) | 0 (0.0%) |
| Graduate Degree | 126 (100.0%) | 0 (0.0%) |
| Total | 223 (100.0%) | 0 (0.0%) |
Income in Massapequa
Income Overview in Massapequa
Per Capita Income in Massapequa is $68,572, while median incomes of families and households are $183,040 and $170,151 respectively.
| Characteristic | Number | Measure |
| Per Capita Income | 21,845 | $68,572 |
| Median Family Income | 5,865 | $183,040 |
| Mean Family Income | 5,865 | $223,190 |
| Median Household Income | 7,358 | $170,151 |
| Mean Household Income | 7,358 | $198,349 |
| Income Deficit | 5,865 | $10,656 |
| Wage / Income Gap (%) | 21,845 | 37.41% |
| Wage / Income Gap ($) | 21,845 | 62.59¢ per $1 |
| Gini / Inequality Index | 21,845 | 0.40 |
Earnings by Sex in Massapequa
Average Earnings in Massapequa are $78,206, $95,464 for men and $59,755 for women, a difference of 37.4%.
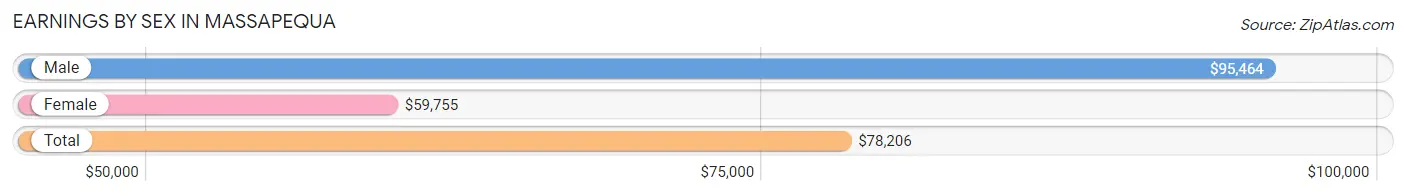
| Sex | Number | Average Earnings |
| Male | 6,541 (53.4%) | $95,464 |
| Female | 5,711 (46.6%) | $59,755 |
| Total | 12,252 (100.0%) | $78,206 |
Earnings by Sex by Income Bracket in Massapequa
The most common earnings brackets in Massapequa are $100,000+ for men (3,136 | 47.9%) and $100,000+ for women (1,293 | 22.6%).
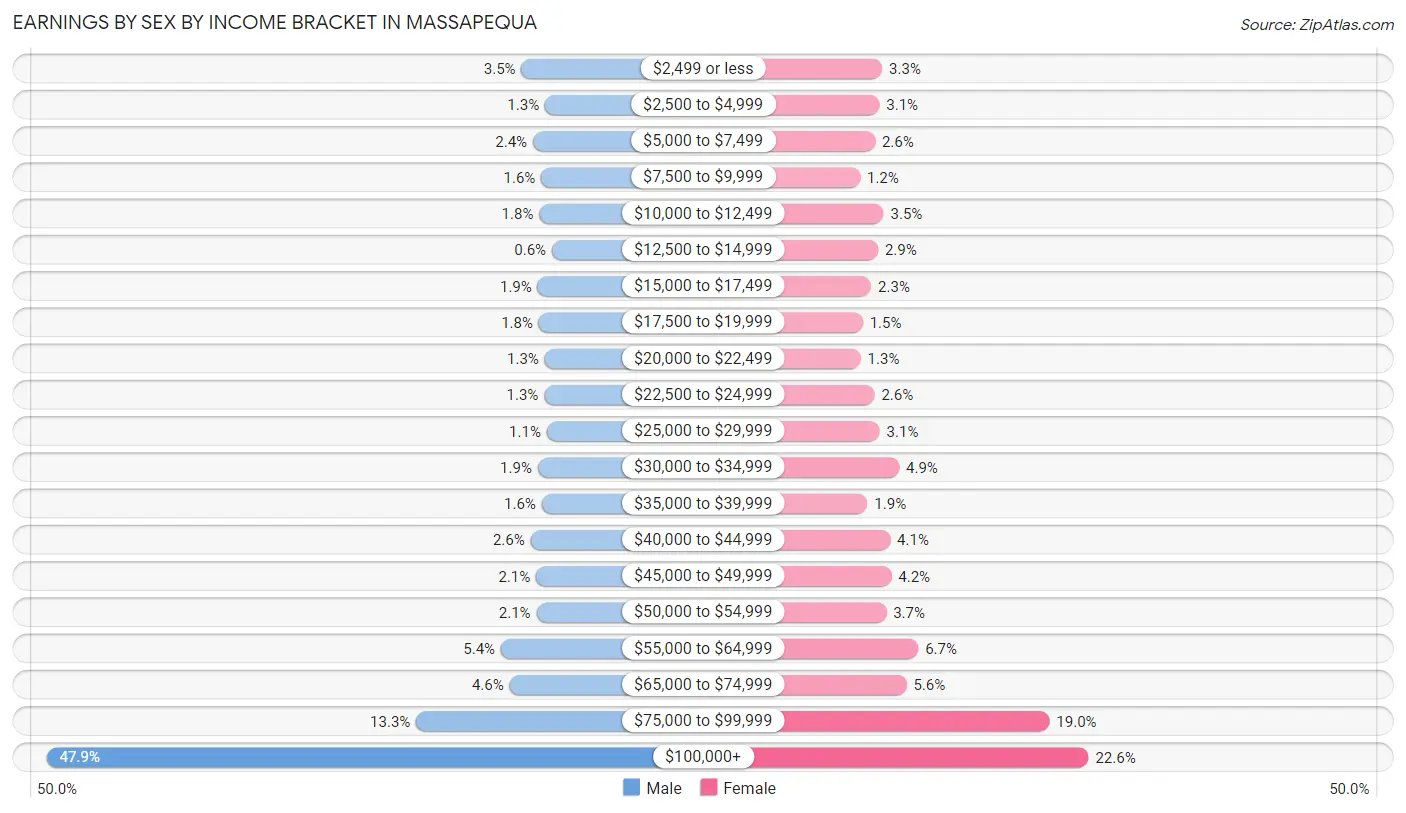
| Income | Male | Female |
| $2,499 or less | 226 (3.5%) | 189 (3.3%) |
| $2,500 to $4,999 | 82 (1.3%) | 174 (3.0%) |
| $5,000 to $7,499 | 156 (2.4%) | 151 (2.6%) |
| $7,500 to $9,999 | 105 (1.6%) | 71 (1.2%) |
| $10,000 to $12,499 | 117 (1.8%) | 197 (3.5%) |
| $12,500 to $14,999 | 39 (0.6%) | 167 (2.9%) |
| $15,000 to $17,499 | 127 (1.9%) | 130 (2.3%) |
| $17,500 to $19,999 | 120 (1.8%) | 85 (1.5%) |
| $20,000 to $22,499 | 84 (1.3%) | 74 (1.3%) |
| $22,500 to $24,999 | 87 (1.3%) | 148 (2.6%) |
| $25,000 to $29,999 | 71 (1.1%) | 176 (3.1%) |
| $30,000 to $34,999 | 126 (1.9%) | 280 (4.9%) |
| $35,000 to $39,999 | 102 (1.6%) | 110 (1.9%) |
| $40,000 to $44,999 | 170 (2.6%) | 232 (4.1%) |
| $45,000 to $49,999 | 137 (2.1%) | 238 (4.2%) |
| $50,000 to $54,999 | 134 (2.1%) | 211 (3.7%) |
| $55,000 to $64,999 | 352 (5.4%) | 382 (6.7%) |
| $65,000 to $74,999 | 299 (4.6%) | 319 (5.6%) |
| $75,000 to $99,999 | 871 (13.3%) | 1,084 (19.0%) |
| $100,000+ | 3,136 (47.9%) | 1,293 (22.6%) |
| Total | 6,541 (100.0%) | 5,711 (100.0%) |
Earnings by Sex by Educational Attainment in Massapequa
Average earnings in Massapequa are $107,010 for men and $72,281 for women, a difference of 32.5%. Men with an educational attainment of graduate degree enjoy the highest average annual earnings of $129,526, while those with high school diploma education earn the least with $88,056. Women with an educational attainment of graduate degree earn the most with the average annual earnings of $90,919, while those with less than high school education have the smallest earnings of $33,150.
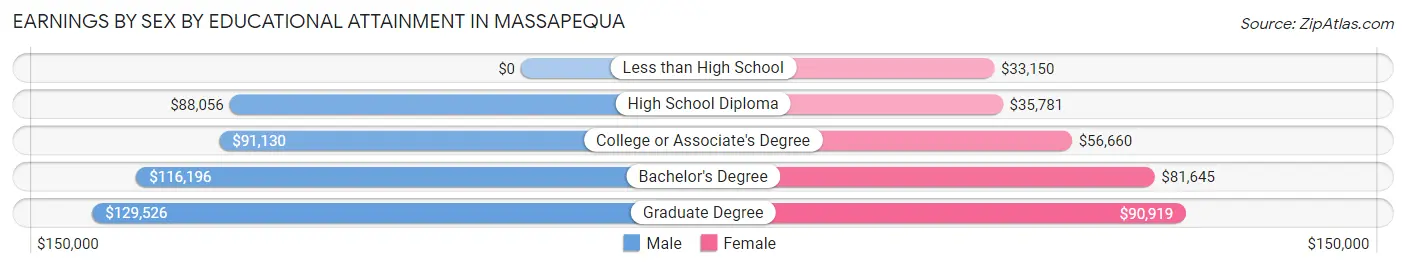
| Educational Attainment | Male Income | Female Income |
| Less than High School | - | - |
| High School Diploma | $88,056 | $35,781 |
| College or Associate's Degree | $91,130 | $56,660 |
| Bachelor's Degree | $116,196 | $81,645 |
| Graduate Degree | $129,526 | $90,919 |
| Total | $107,010 | $72,281 |
Family Income in Massapequa
Family Income Brackets in Massapequa
According to the Massapequa family income data, there are 2,669 families falling into the $200,000+ income range, which is the most common income bracket and makes up 45.5% of all families. Conversely, the less than $10,000 income bracket is the least frequent group with only 29 families (0.5%) belonging to this category.
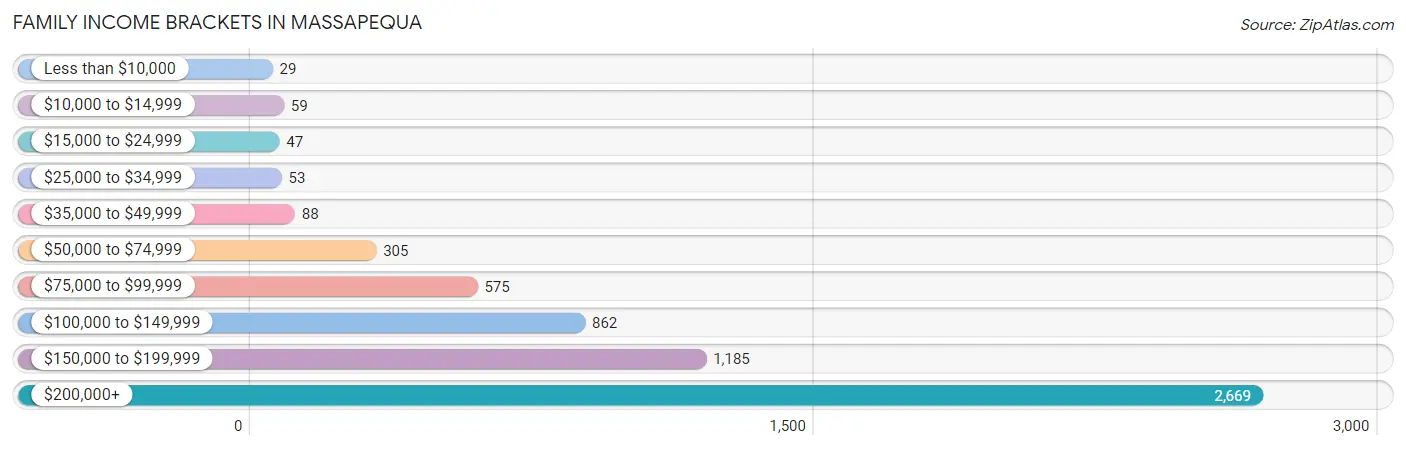
| Income Bracket | # Families | % Families |
| Less than $10,000 | 29 | 0.5% |
| $10,000 to $14,999 | 59 | 1.0% |
| $15,000 to $24,999 | 47 | 0.8% |
| $25,000 to $34,999 | 53 | 0.9% |
| $35,000 to $49,999 | 88 | 1.5% |
| $50,000 to $74,999 | 305 | 5.2% |
| $75,000 to $99,999 | 575 | 9.8% |
| $100,000 to $149,999 | 862 | 14.7% |
| $150,000 to $199,999 | 1,185 | 20.2% |
| $200,000+ | 2,669 | 45.5% |
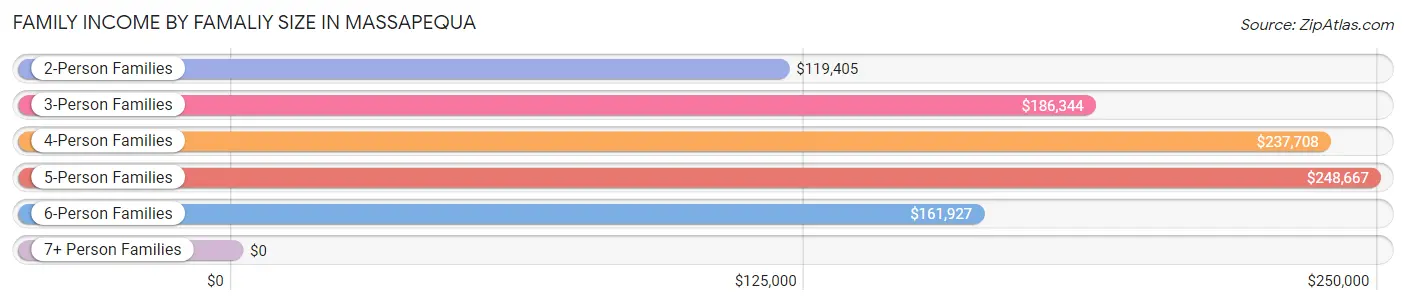
Family Income by Famaliy Size in Massapequa
5-person families (478 | 8.2%) account for the highest median family income in Massapequa with $248,667 per family, while 3-person families (1,401 | 23.9%) have the highest median income of $62,115 per family member.
| Income Bracket | # Families | Median Income |
| 2-Person Families | 2,022 (34.5%) | $119,405 |
| 3-Person Families | 1,401 (23.9%) | $186,344 |
| 4-Person Families | 1,784 (30.4%) | $237,708 |
| 5-Person Families | 478 (8.2%) | $248,667 |
| 6-Person Families | 159 (2.7%) | $161,927 |
| 7+ Person Families | 21 (0.4%) | $0 |
| Total | 5,865 (100.0%) | $183,040 |
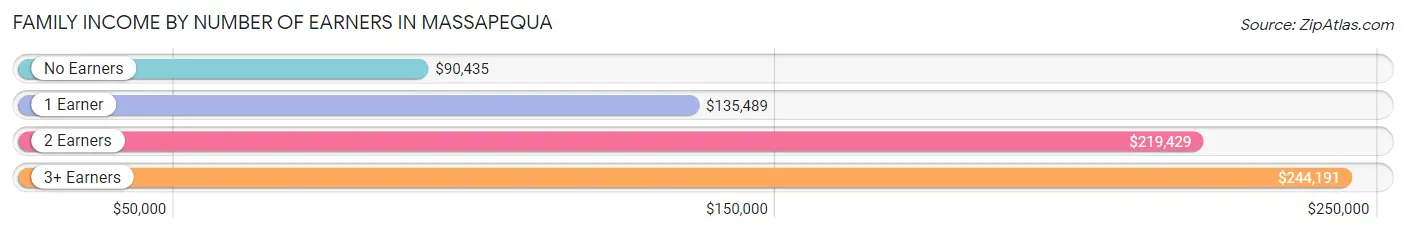
Family Income by Number of Earners in Massapequa
The median family income in Massapequa is $183,040, with families comprising 3+ earners (1,274) having the highest median family income of $244,191, while families with no earners (780) have the lowest median family income of $90,435, accounting for 21.7% and 13.3% of families, respectively.
| Number of Earners | # Families | Median Income |
| No Earners | 780 (13.3%) | $90,435 |
| 1 Earner | 1,358 (23.2%) | $135,489 |
| 2 Earners | 2,453 (41.8%) | $219,429 |
| 3+ Earners | 1,274 (21.7%) | $244,191 |
| Total | 5,865 (100.0%) | $183,040 |
Household Income in Massapequa
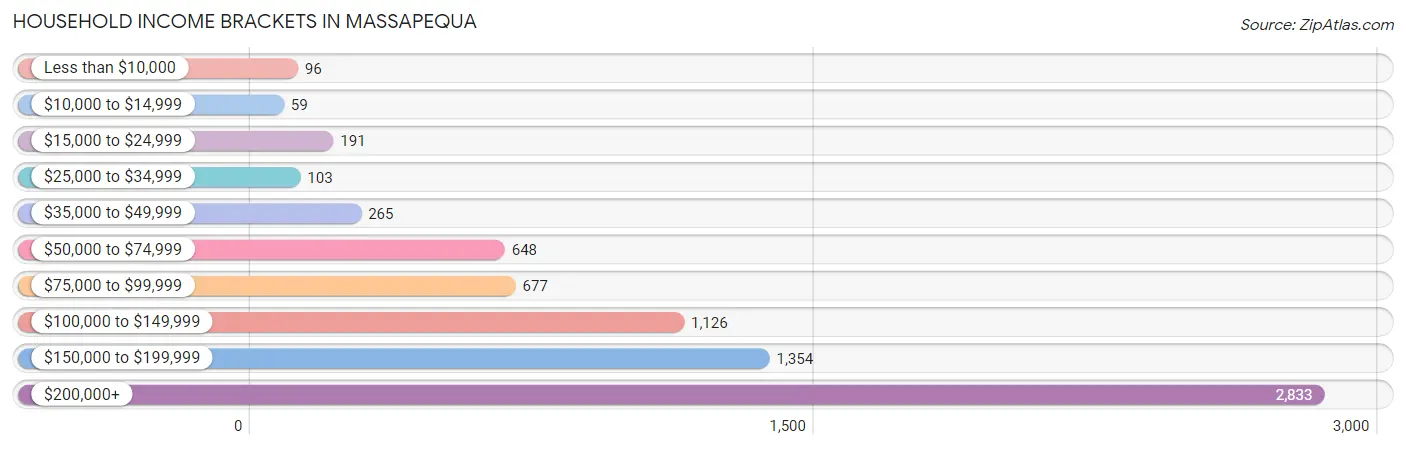
Household Income Brackets in Massapequa
With 2,833 households falling in the category, the $200,000+ income range is the most frequent in Massapequa, accounting for 38.5% of all households. In contrast, only 59 households (0.8%) fall into the $10,000 to $14,999 income bracket, making it the least populous group.
| Income Bracket | # Households | % Households |
| Less than $10,000 | 96 | 1.3% |
| $10,000 to $14,999 | 59 | 0.8% |
| $15,000 to $24,999 | 191 | 2.6% |
| $25,000 to $34,999 | 103 | 1.4% |
| $35,000 to $49,999 | 265 | 3.6% |
| $50,000 to $74,999 | 648 | 8.8% |
| $75,000 to $99,999 | 677 | 9.2% |
| $100,000 to $149,999 | 1,126 | 15.3% |
| $150,000 to $199,999 | 1,354 | 18.4% |
| $200,000+ | 2,833 | 38.5% |
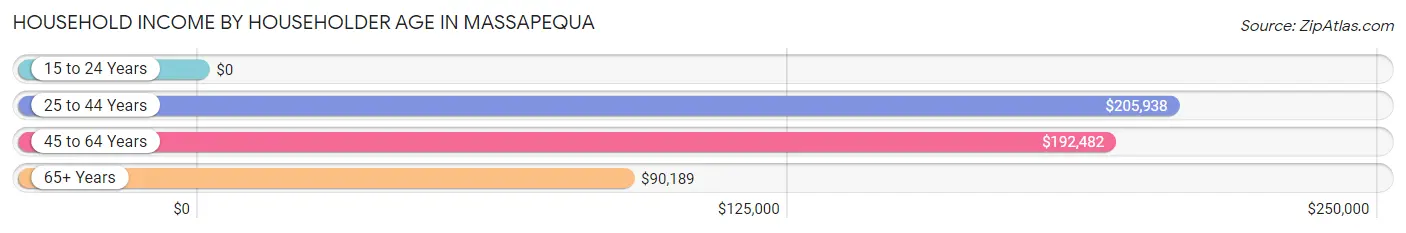
Household Income by Householder Age in Massapequa
The median household income in Massapequa is $170,151, with the highest median household income of $205,938 found in the 25 to 44 years age bracket for the primary householder. A total of 1,598 households (21.7%) fall into this category. Meanwhile, the 15 to 24 years age bracket for the primary householder has the lowest median household income of $0, with 16 households (0.2%) in this group.
| Income Bracket | # Households | Median Income |
| 15 to 24 Years | 16 (0.2%) | $0 |
| 25 to 44 Years | 1,598 (21.7%) | $205,938 |
| 45 to 64 Years | 3,387 (46.0%) | $192,482 |
| 65+ Years | 2,357 (32.0%) | $90,189 |
| Total | 7,358 (100.0%) | $170,151 |
Poverty in Massapequa
Income Below Poverty by Sex and Age in Massapequa
With 3.2% poverty level for males and 3.1% for females among the residents of Massapequa, 65 to 74 year old males and 16 and 17 year old females are the most vulnerable to poverty, with 84 males (6.9%) and 35 females (9.4%) in their respective age groups living below the poverty level.
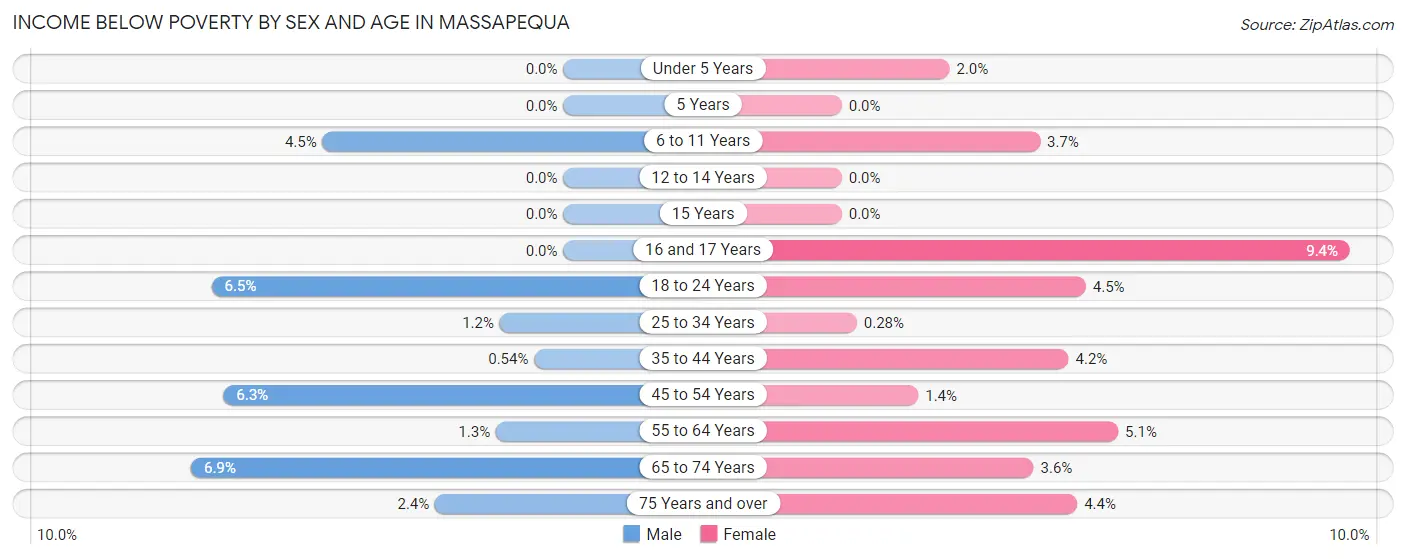
| Age Bracket | Male | Female |
| Under 5 Years | 0 (0.0%) | 13 (2.0%) |
| 5 Years | 0 (0.0%) | 0 (0.0%) |
| 6 to 11 Years | 29 (4.5%) | 29 (3.7%) |
| 12 to 14 Years | 0 (0.0%) | 0 (0.0%) |
| 15 Years | 0 (0.0%) | 0 (0.0%) |
| 16 and 17 Years | 0 (0.0%) | 35 (9.4%) |
| 18 to 24 Years | 48 (6.5%) | 37 (4.5%) |
| 25 to 34 Years | 15 (1.2%) | 4 (0.3%) |
| 35 to 44 Years | 7 (0.5%) | 40 (4.2%) |
| 45 to 54 Years | 114 (6.3%) | 26 (1.4%) |
| 55 to 64 Years | 21 (1.3%) | 85 (5.1%) |
| 65 to 74 Years | 84 (6.9%) | 38 (3.6%) |
| 75 Years and over | 16 (2.4%) | 42 (4.4%) |
| Total | 334 (3.2%) | 349 (3.1%) |
Income Above Poverty by Sex and Age in Massapequa
According to the poverty statistics in Massapequa, males aged under 5 years and females aged 5 years are the age groups that are most secure financially, with 100.0% of males and 100.0% of females in these age groups living above the poverty line.
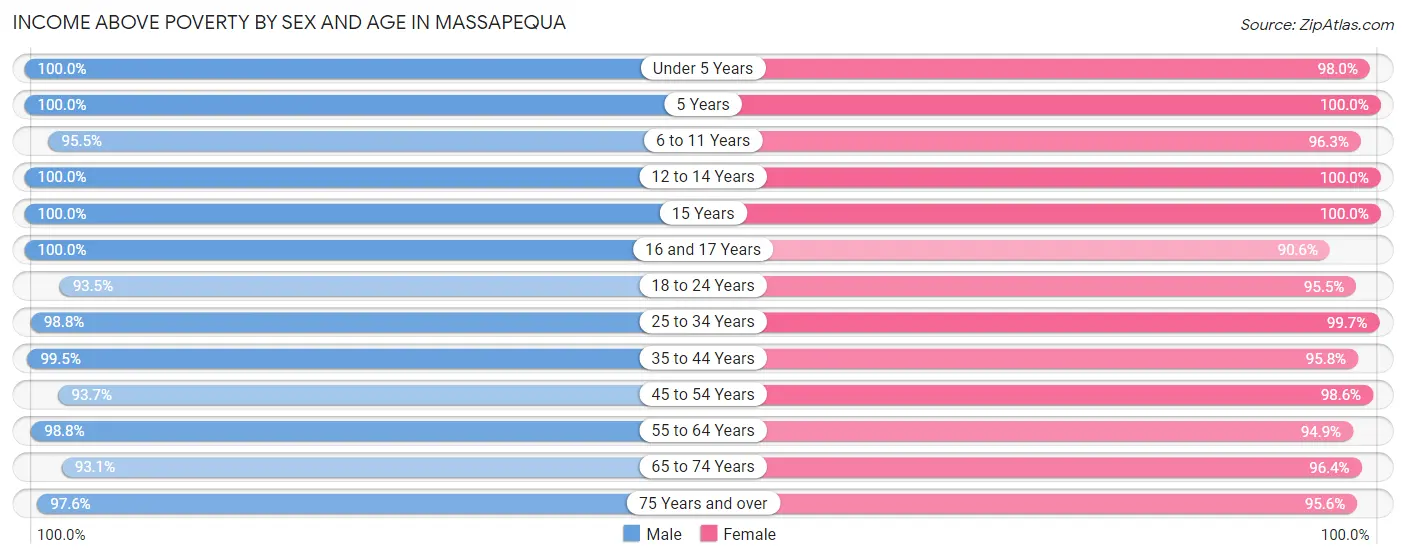
| Age Bracket | Male | Female |
| Under 5 Years | 378 (100.0%) | 638 (98.0%) |
| 5 Years | 58 (100.0%) | 149 (100.0%) |
| 6 to 11 Years | 620 (95.5%) | 758 (96.3%) |
| 12 to 14 Years | 288 (100.0%) | 343 (100.0%) |
| 15 Years | 145 (100.0%) | 106 (100.0%) |
| 16 and 17 Years | 368 (100.0%) | 336 (90.6%) |
| 18 to 24 Years | 687 (93.5%) | 780 (95.5%) |
| 25 to 34 Years | 1,259 (98.8%) | 1,421 (99.7%) |
| 35 to 44 Years | 1,281 (99.5%) | 909 (95.8%) |
| 45 to 54 Years | 1,692 (93.7%) | 1,801 (98.6%) |
| 55 to 64 Years | 1,659 (98.8%) | 1,572 (94.9%) |
| 65 to 74 Years | 1,132 (93.1%) | 1,030 (96.4%) |
| 75 Years and over | 655 (97.6%) | 919 (95.6%) |
| Total | 10,222 (96.8%) | 10,762 (96.9%) |
Income Below Poverty Among Married-Couple Families in Massapequa
The poverty statistics for married-couple families in Massapequa show that 1.2% or 61 of the total 5,122 families live below the poverty line. Families with 1 or 2 children have the highest poverty rate of 1.4%, comprising of 26 families. On the other hand, families with 3 or 4 children have the lowest poverty rate of 0.0%, which includes 0 families.
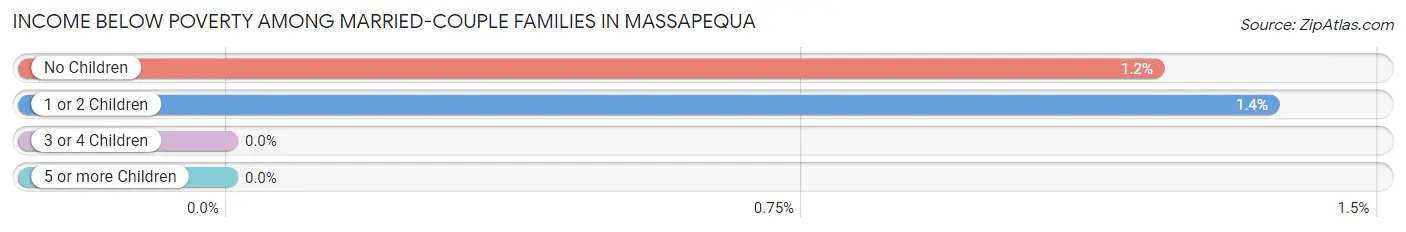
| Children | Above Poverty | Below Poverty |
| No Children | 2,861 (98.8%) | 35 (1.2%) |
| 1 or 2 Children | 1,890 (98.6%) | 26 (1.4%) |
| 3 or 4 Children | 310 (100.0%) | 0 (0.0%) |
| 5 or more Children | 0 (0.0%) | 0 (0.0%) |
| Total | 5,061 (98.8%) | 61 (1.2%) |
Income Below Poverty Among Single-Parent Households in Massapequa
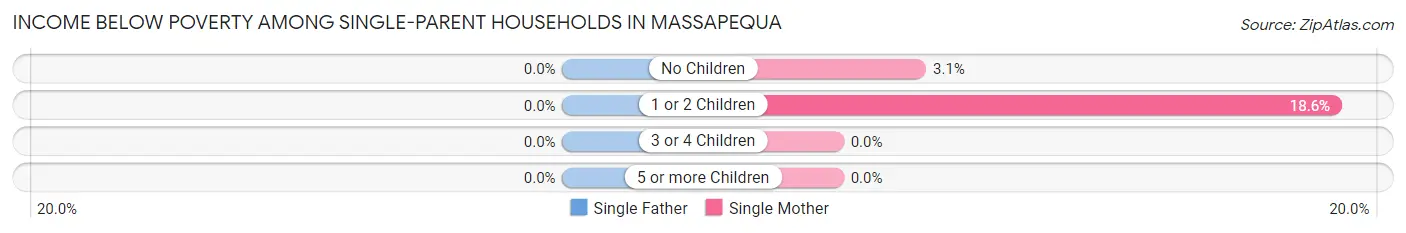
| Children | Single Father | Single Mother |
| No Children | 0 (0.0%) | 12 (3.1%) |
| 1 or 2 Children | 0 (0.0%) | 36 (18.6%) |
| 3 or 4 Children | 0 (0.0%) | 0 (0.0%) |
| 5 or more Children | 0 (0.0%) | 0 (0.0%) |
| Total | 0 (0.0%) | 48 (8.1%) |
Income Below Poverty Among Married-Couple vs Single-Parent Households in Massapequa
The poverty data for Massapequa shows that 61 of the married-couple family households (1.2%) and 48 of the single-parent households (6.5%) are living below the poverty level. Within the married-couple family households, those with 1 or 2 children have the highest poverty rate, with 26 households (1.4%) falling below the poverty line. Among the single-parent households, those with 1 or 2 children have the highest poverty rate, with 36 household (17.7%) living below poverty.
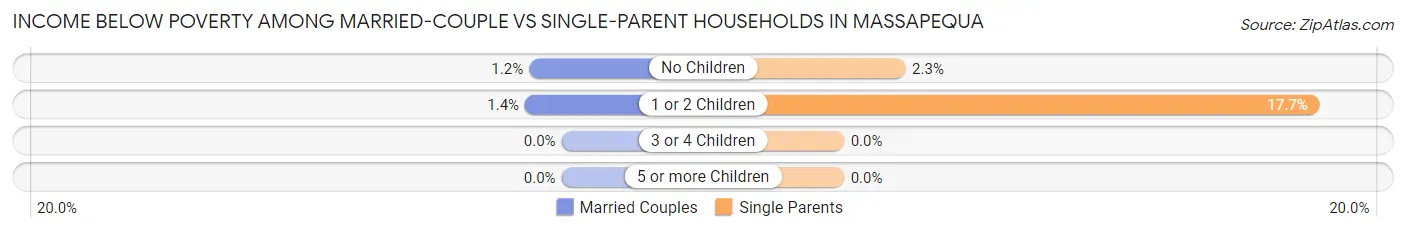
| Children | Married-Couple Families | Single-Parent Households |
| No Children | 35 (1.2%) | 12 (2.3%) |
| 1 or 2 Children | 26 (1.4%) | 36 (17.7%) |
| 3 or 4 Children | 0 (0.0%) | 0 (0.0%) |
| 5 or more Children | 0 (0.0%) | 0 (0.0%) |
| Total | 61 (1.2%) | 48 (6.5%) |
Employment Characteristics in Massapequa
Employment by Class of Employer in Massapequa
Among the 11,295 employed individuals in Massapequa, private company employees (7,108 | 62.9%), local government employees (1,875 | 16.6%), and not-for-profit organizations (818 | 7.2%) make up the most common classes of employment.
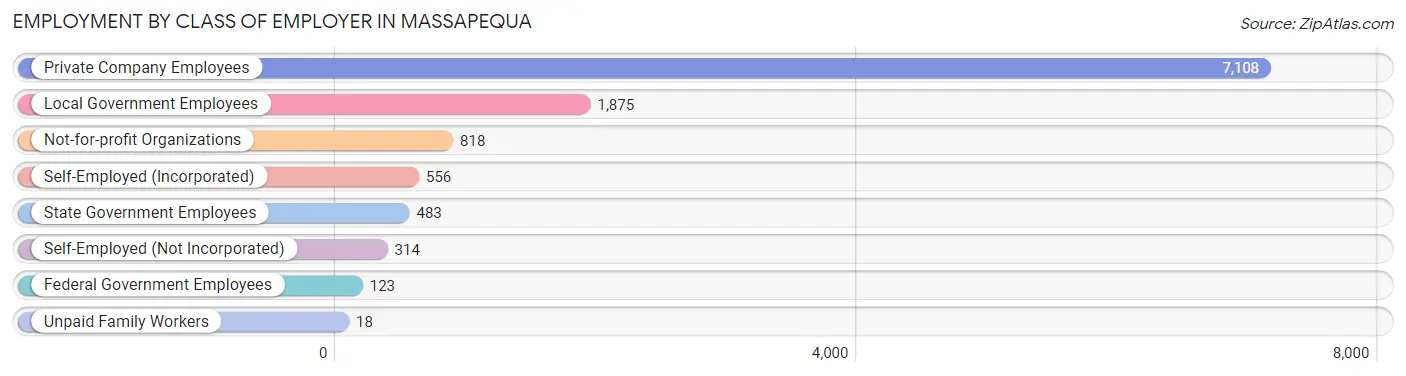
| Employer Class | # Employees | % Employees |
| Private Company Employees | 7,108 | 62.9% |
| Self-Employed (Incorporated) | 556 | 4.9% |
| Self-Employed (Not Incorporated) | 314 | 2.8% |
| Not-for-profit Organizations | 818 | 7.2% |
| Local Government Employees | 1,875 | 16.6% |
| State Government Employees | 483 | 4.3% |
| Federal Government Employees | 123 | 1.1% |
| Unpaid Family Workers | 18 | 0.2% |
| Total | 11,295 | 100.0% |
Employment Status by Age in Massapequa
According to the labor force statistics for Massapequa, out of the total population over 16 years of age (18,113), 66.2% or 11,991 individuals are in the labor force, with 4.5% or 540 of them unemployed. The age group with the highest labor force participation rate is 30 to 34 years, with 94.6% or 1,111 individuals in the labor force. Within the labor force, the 16 to 19 years age range has the highest percentage of unemployed individuals, with 37.1% or 145 of them being unemployed.
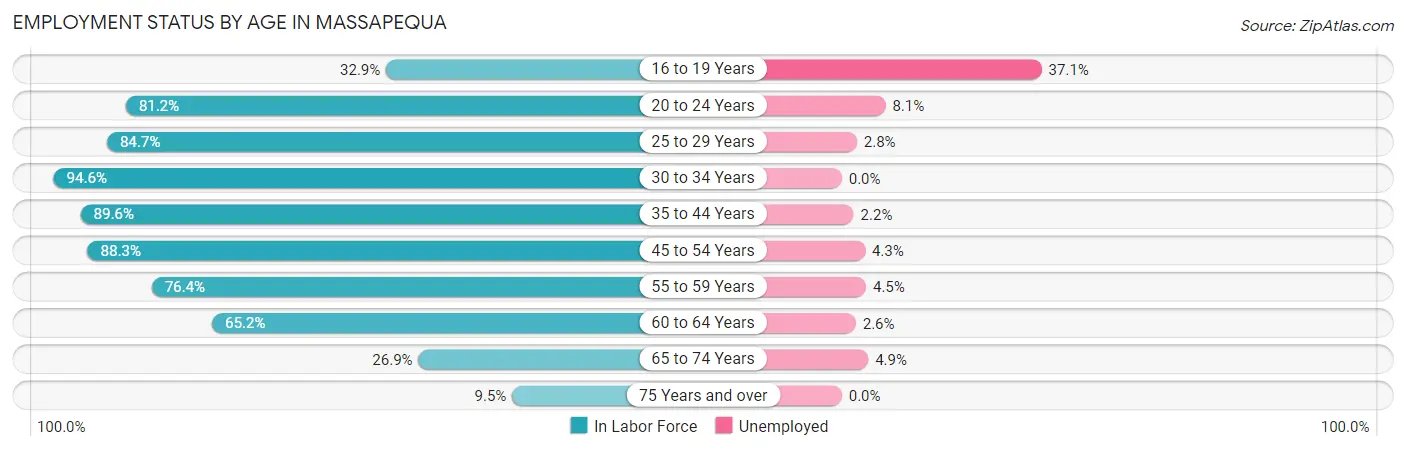
| Age Bracket | In Labor Force | Unemployed |
| 16 to 19 Years | 392 (32.9%) | 145 (37.1%) |
| 20 to 24 Years | 894 (81.2%) | 72 (8.1%) |
| 25 to 29 Years | 1,292 (84.7%) | 36 (2.8%) |
| 30 to 34 Years | 1,111 (94.6%) | 0 (0.0%) |
| 35 to 44 Years | 2,004 (89.6%) | 44 (2.2%) |
| 45 to 54 Years | 3,208 (88.3%) | 138 (4.3%) |
| 55 to 59 Years | 1,009 (76.4%) | 45 (4.5%) |
| 60 to 64 Years | 1,314 (65.2%) | 34 (2.6%) |
| 65 to 74 Years | 614 (26.9%) | 30 (4.9%) |
| 75 Years and over | 155 (9.5%) | 0 (0.0%) |
| Total | 11,991 (66.2%) | 540 (4.5%) |
Employment Status by Educational Attainment in Massapequa
According to labor force statistics for Massapequa, 83.5% of individuals (9,942) out of the total population between 25 and 64 years of age (11,906) are in the labor force, with 3.0% or 298 of them being unemployed. The group with the highest labor force participation rate are those with the educational attainment of bachelor's degree or higher, with 86.9% or 5,972 individuals in the labor force. Within the labor force, individuals with high school diploma education have the highest percentage of unemployment, with 8.2% or 105 of them being unemployed.
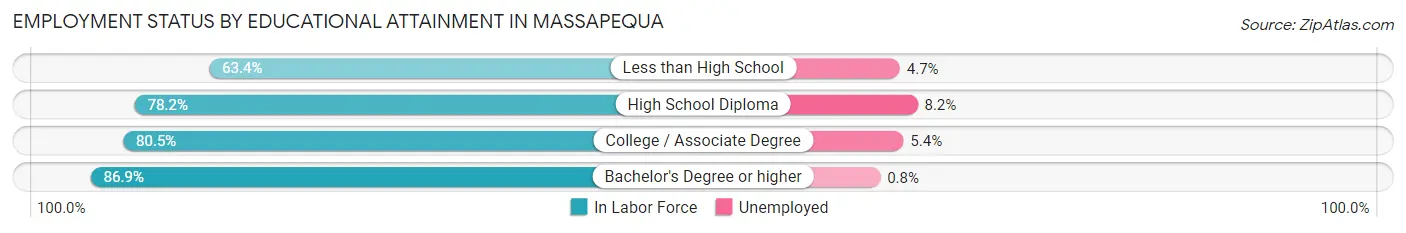
| Educational Attainment | In Labor Force | Unemployed |
| Less than High School | 170 (63.4%) | 13 (4.7%) |
| High School Diploma | 1,275 (78.2%) | 134 (8.2%) |
| College / Associate Degree | 2,524 (80.5%) | 169 (5.4%) |
| Bachelor's Degree or higher | 5,972 (86.9%) | 55 (0.8%) |
| Total | 9,942 (83.5%) | 357 (3.0%) |
Employment Occupations by Sex in Massapequa
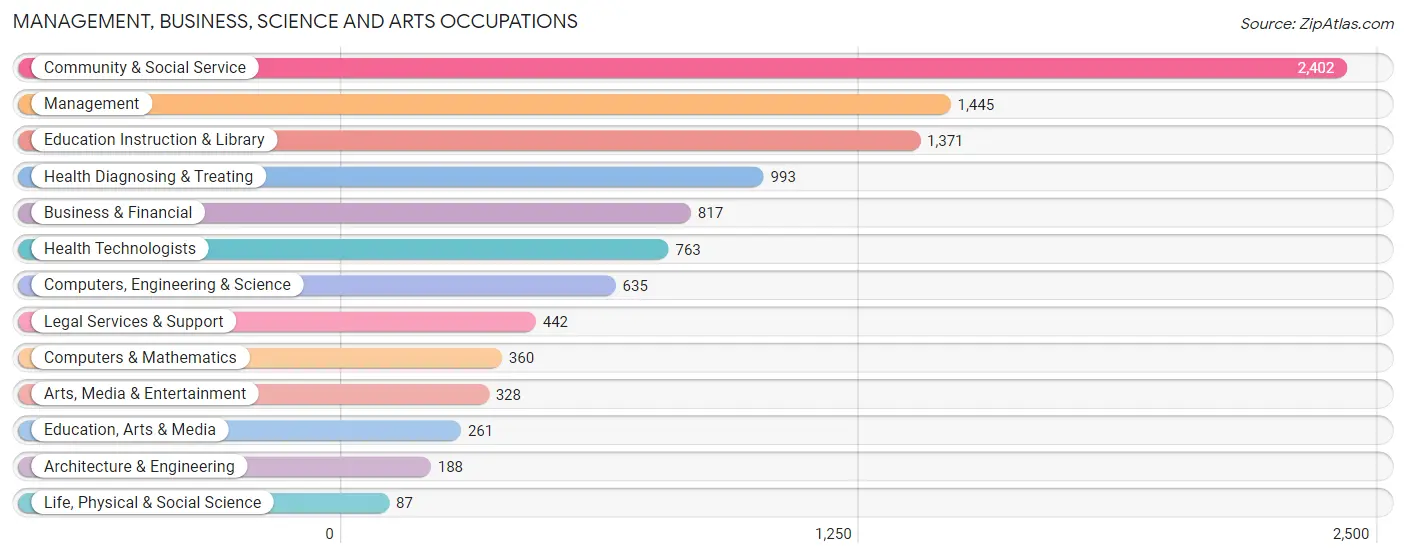
Management, Business, Science and Arts Occupations
The most common Management, Business, Science and Arts occupations in Massapequa are Community & Social Service (2,402 | 21.0%), Management (1,445 | 12.6%), Education Instruction & Library (1,371 | 12.0%), Health Diagnosing & Treating (993 | 8.7%), and Business & Financial (817 | 7.1%).
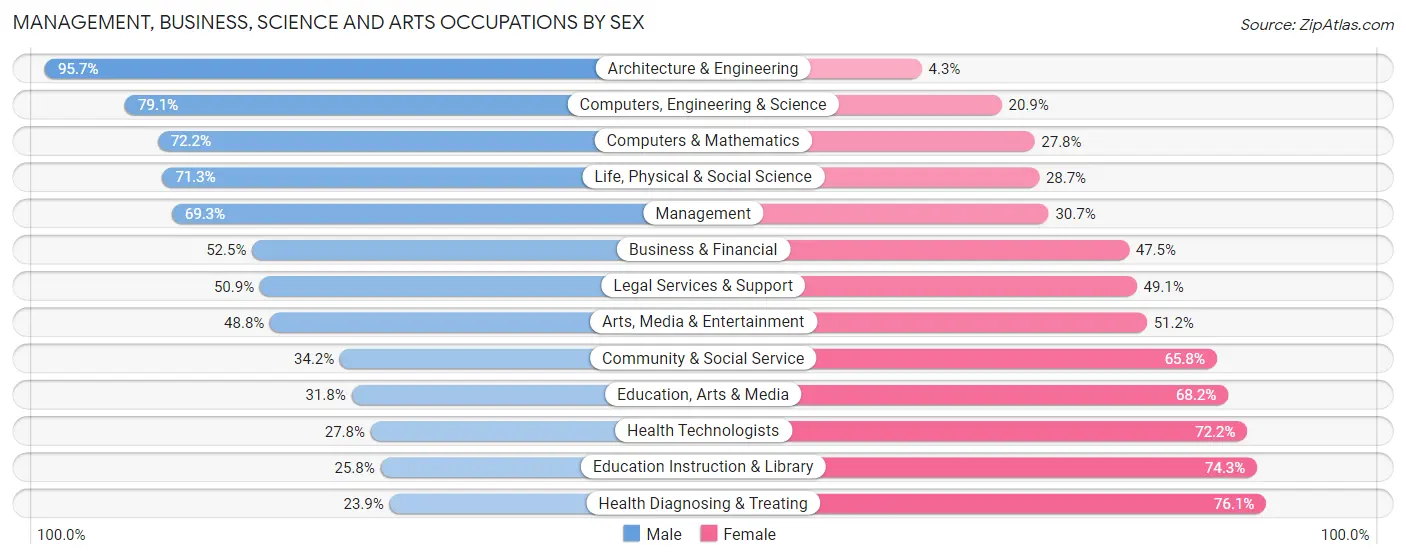
Management, Business, Science and Arts Occupations by Sex
Within the Management, Business, Science and Arts occupations in Massapequa, the most male-oriented occupations are Architecture & Engineering (95.7%), Computers, Engineering & Science (79.1%), and Computers & Mathematics (72.2%), while the most female-oriented occupations are Health Diagnosing & Treating (76.1%), Education Instruction & Library (74.3%), and Health Technologists (72.2%).
| Occupation | Male | Female |
| Management | 1,001 (69.3%) | 444 (30.7%) |
| Business & Financial | 429 (52.5%) | 388 (47.5%) |
| Computers, Engineering & Science | 502 (79.1%) | 133 (20.9%) |
| Computers & Mathematics | 260 (72.2%) | 100 (27.8%) |
| Architecture & Engineering | 180 (95.7%) | 8 (4.3%) |
| Life, Physical & Social Science | 62 (71.3%) | 25 (28.7%) |
| Community & Social Service | 821 (34.2%) | 1,581 (65.8%) |
| Education, Arts & Media | 83 (31.8%) | 178 (68.2%) |
| Legal Services & Support | 225 (50.9%) | 217 (49.1%) |
| Education Instruction & Library | 353 (25.8%) | 1,018 (74.3%) |
| Arts, Media & Entertainment | 160 (48.8%) | 168 (51.2%) |
| Health Diagnosing & Treating | 237 (23.9%) | 756 (76.1%) |
| Health Technologists | 212 (27.8%) | 551 (72.2%) |
| Total (Category) | 2,990 (47.5%) | 3,302 (52.5%) |
| Total (Overall) | 6,203 (54.2%) | 5,246 (45.8%) |
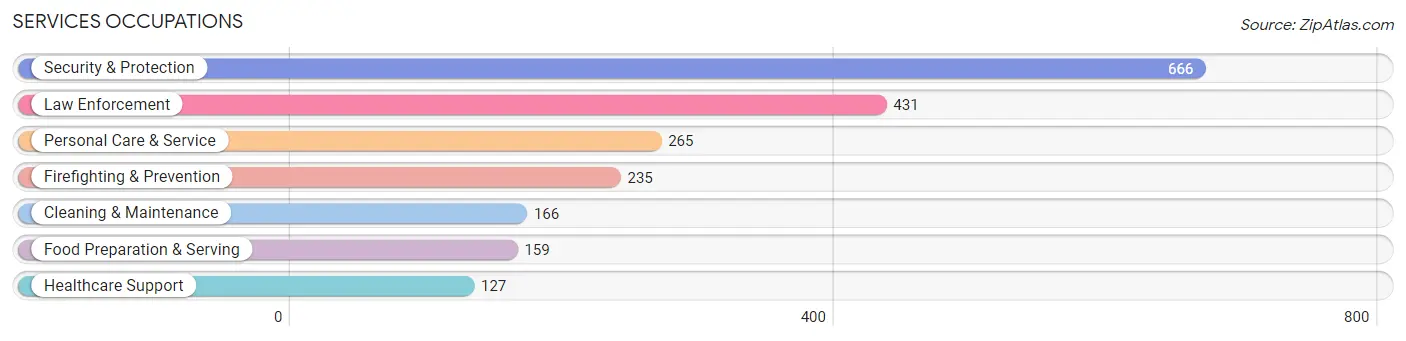
Services Occupations
The most common Services occupations in Massapequa are Security & Protection (666 | 5.8%), Law Enforcement (431 | 3.8%), Personal Care & Service (265 | 2.3%), Firefighting & Prevention (235 | 2.1%), and Cleaning & Maintenance (166 | 1.5%).
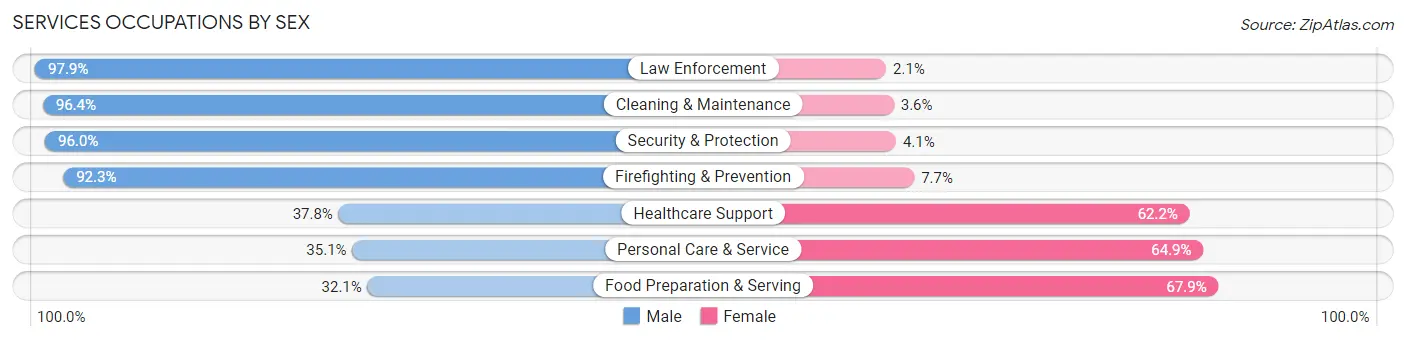
Services Occupations by Sex
Within the Services occupations in Massapequa, the most male-oriented occupations are Law Enforcement (97.9%), Cleaning & Maintenance (96.4%), and Security & Protection (96.0%), while the most female-oriented occupations are Food Preparation & Serving (67.9%), Personal Care & Service (64.9%), and Healthcare Support (62.2%).
| Occupation | Male | Female |
| Healthcare Support | 48 (37.8%) | 79 (62.2%) |
| Security & Protection | 639 (96.0%) | 27 (4.1%) |
| Firefighting & Prevention | 217 (92.3%) | 18 (7.7%) |
| Law Enforcement | 422 (97.9%) | 9 (2.1%) |
| Food Preparation & Serving | 51 (32.1%) | 108 (67.9%) |
| Cleaning & Maintenance | 160 (96.4%) | 6 (3.6%) |
| Personal Care & Service | 93 (35.1%) | 172 (64.9%) |
| Total (Category) | 991 (71.7%) | 392 (28.3%) |
| Total (Overall) | 6,203 (54.2%) | 5,246 (45.8%) |
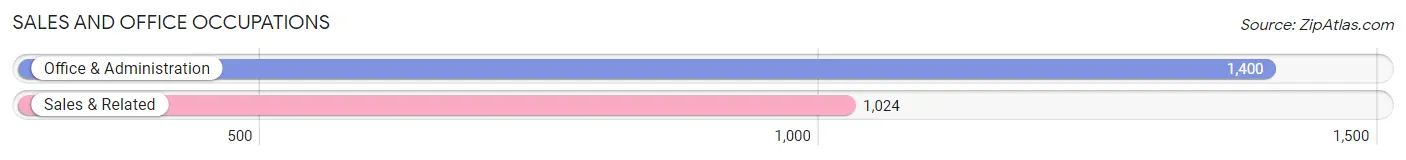
Sales and Office Occupations
The most common Sales and Office occupations in Massapequa are Office & Administration (1,400 | 12.2%), and Sales & Related (1,024 | 8.9%).
Sales and Office Occupations by Sex
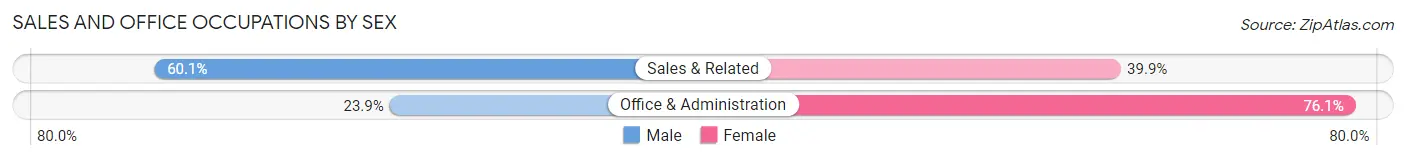
| Occupation | Male | Female |
| Sales & Related | 615 (60.1%) | 409 (39.9%) |
| Office & Administration | 334 (23.9%) | 1,066 (76.1%) |
| Total (Category) | 949 (39.2%) | 1,475 (60.9%) |
| Total (Overall) | 6,203 (54.2%) | 5,246 (45.8%) |
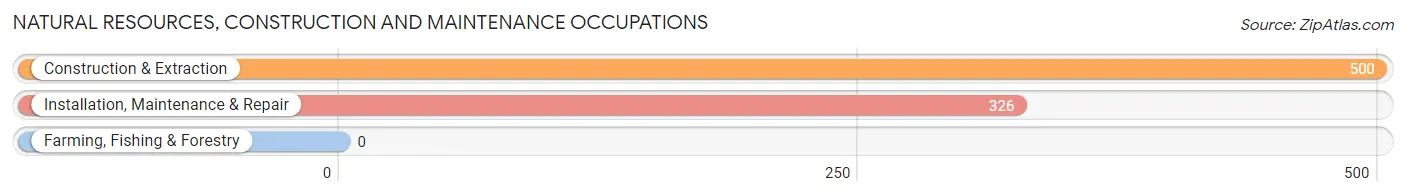
Natural Resources, Construction and Maintenance Occupations
The most common Natural Resources, Construction and Maintenance occupations in Massapequa are Construction & Extraction (500 | 4.4%), and Installation, Maintenance & Repair (326 | 2.9%).
Natural Resources, Construction and Maintenance Occupations by Sex
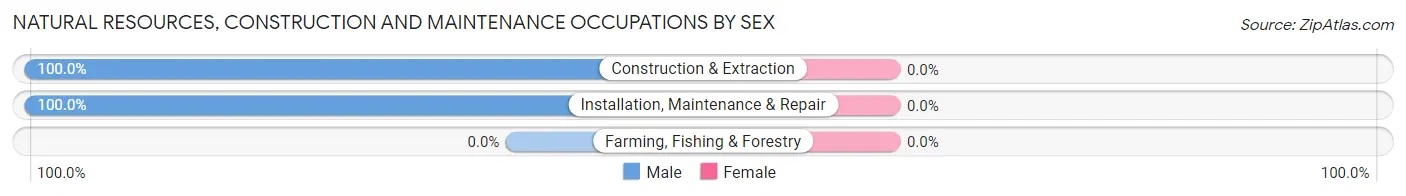
| Occupation | Male | Female |
| Farming, Fishing & Forestry | 0 (0.0%) | 0 (0.0%) |
| Construction & Extraction | 500 (100.0%) | 0 (0.0%) |
| Installation, Maintenance & Repair | 326 (100.0%) | 0 (0.0%) |
| Total (Category) | 826 (100.0%) | 0 (0.0%) |
| Total (Overall) | 6,203 (54.2%) | 5,246 (45.8%) |
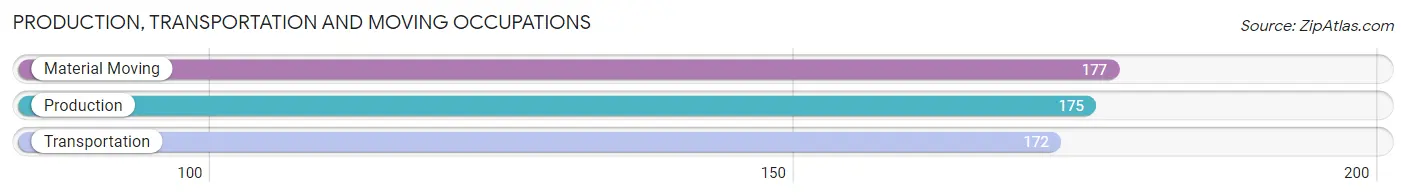
Production, Transportation and Moving Occupations
The most common Production, Transportation and Moving occupations in Massapequa are Material Moving (177 | 1.5%), Production (175 | 1.5%), and Transportation (172 | 1.5%).
Production, Transportation and Moving Occupations by Sex
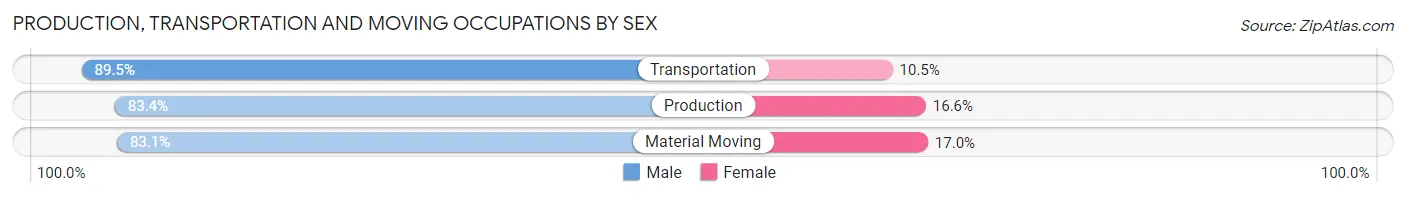
| Occupation | Male | Female |
| Production | 146 (83.4%) | 29 (16.6%) |
| Transportation | 154 (89.5%) | 18 (10.5%) |
| Material Moving | 147 (83.1%) | 30 (17.0%) |
| Total (Category) | 447 (85.3%) | 77 (14.7%) |
| Total (Overall) | 6,203 (54.2%) | 5,246 (45.8%) |
Employment Industries by Sex in Massapequa
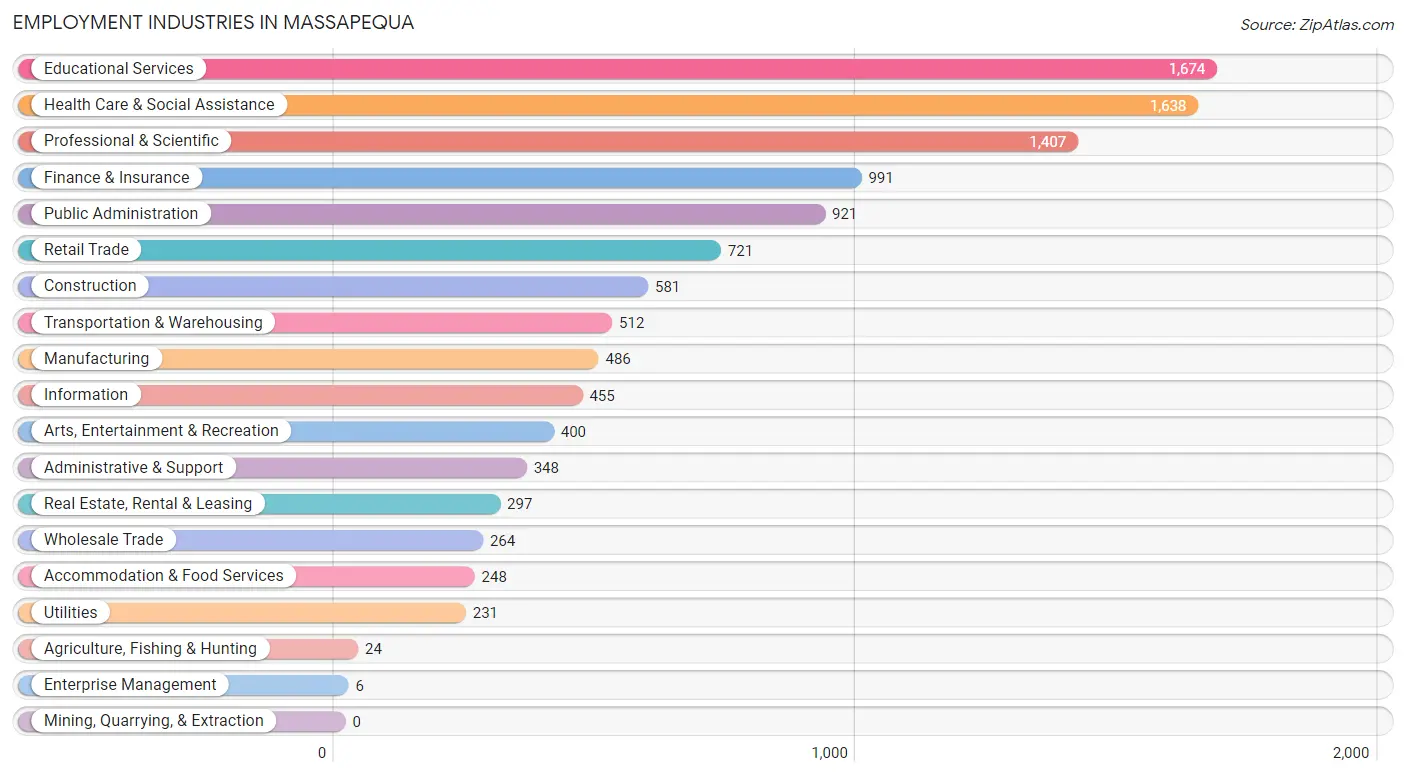
Employment Industries in Massapequa
The major employment industries in Massapequa include Educational Services (1,674 | 14.6%), Health Care & Social Assistance (1,638 | 14.3%), Professional & Scientific (1,407 | 12.3%), Finance & Insurance (991 | 8.7%), and Public Administration (921 | 8.0%).
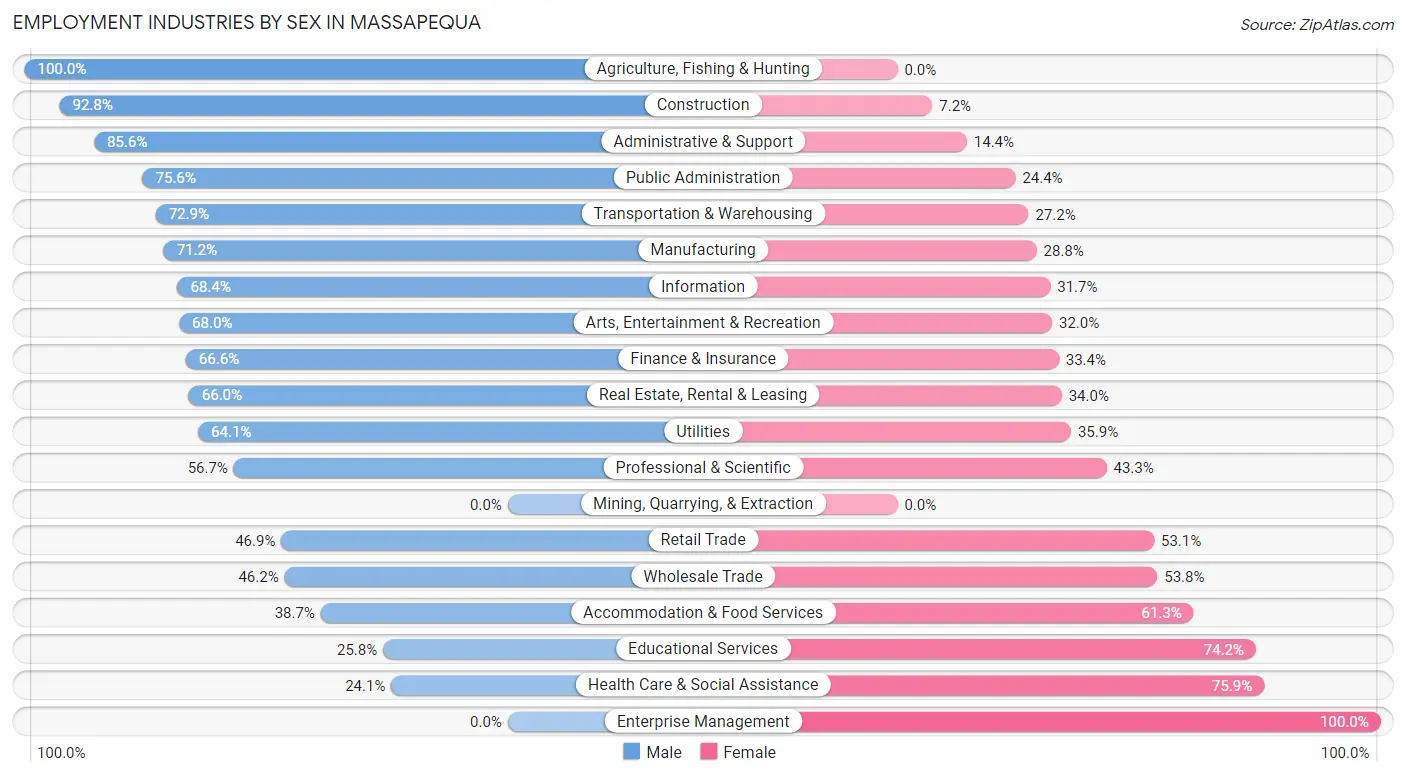
Employment Industries by Sex in Massapequa
The Massapequa industries that see more men than women are Agriculture, Fishing & Hunting (100.0%), Construction (92.8%), and Administrative & Support (85.6%), whereas the industries that tend to have a higher number of women are Enterprise Management (100.0%), Health Care & Social Assistance (75.9%), and Educational Services (74.2%).
| Industry | Male | Female |
| Agriculture, Fishing & Hunting | 24 (100.0%) | 0 (0.0%) |
| Mining, Quarrying, & Extraction | 0 (0.0%) | 0 (0.0%) |
| Construction | 539 (92.8%) | 42 (7.2%) |
| Manufacturing | 346 (71.2%) | 140 (28.8%) |
| Wholesale Trade | 122 (46.2%) | 142 (53.8%) |
| Retail Trade | 338 (46.9%) | 383 (53.1%) |
| Transportation & Warehousing | 373 (72.9%) | 139 (27.2%) |
| Utilities | 148 (64.1%) | 83 (35.9%) |
| Information | 311 (68.3%) | 144 (31.7%) |
| Finance & Insurance | 660 (66.6%) | 331 (33.4%) |
| Real Estate, Rental & Leasing | 196 (66.0%) | 101 (34.0%) |
| Professional & Scientific | 798 (56.7%) | 609 (43.3%) |
| Enterprise Management | 0 (0.0%) | 6 (100.0%) |
| Administrative & Support | 298 (85.6%) | 50 (14.4%) |
| Educational Services | 432 (25.8%) | 1,242 (74.2%) |
| Health Care & Social Assistance | 395 (24.1%) | 1,243 (75.9%) |
| Arts, Entertainment & Recreation | 272 (68.0%) | 128 (32.0%) |
| Accommodation & Food Services | 96 (38.7%) | 152 (61.3%) |
| Public Administration | 696 (75.6%) | 225 (24.4%) |
| Total | 6,203 (54.2%) | 5,246 (45.8%) |
Education in Massapequa
School Enrollment in Massapequa
The most common levels of schooling among the 5,161 students in Massapequa are high school (1,292 | 25.0%), college / undergraduate (1,081 | 20.9%), and elementary school (1,006 | 19.5%).
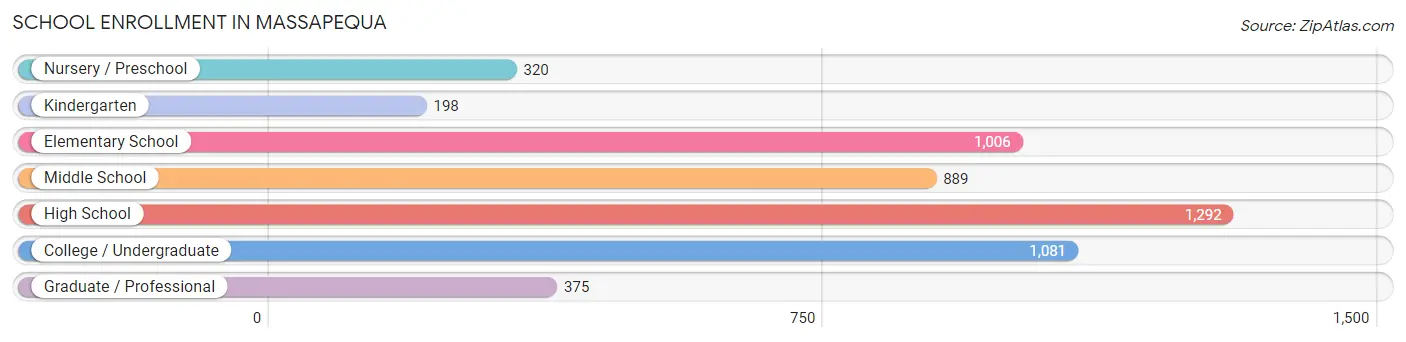
| School Level | # Students | % Students |
| Nursery / Preschool | 320 | 6.2% |
| Kindergarten | 198 | 3.8% |
| Elementary School | 1,006 | 19.5% |
| Middle School | 889 | 17.2% |
| High School | 1,292 | 25.0% |
| College / Undergraduate | 1,081 | 20.9% |
| Graduate / Professional | 375 | 7.3% |
| Total | 5,161 | 100.0% |
School Enrollment by Age by Funding Source in Massapequa
Out of a total of 5,161 students who are enrolled in schools in Massapequa, 1,584 (30.7%) attend a private institution, while the remaining 3,577 (69.3%) are enrolled in public schools. The age group of 25 to 34 year olds has the highest likelihood of being enrolled in private schools, with 374 (80.9% in the age bracket) enrolled. Conversely, the age group of 5 to 9 year old has the lowest likelihood of being enrolled in a private school, with 1,042 (88.2% in the age bracket) attending a public institution.
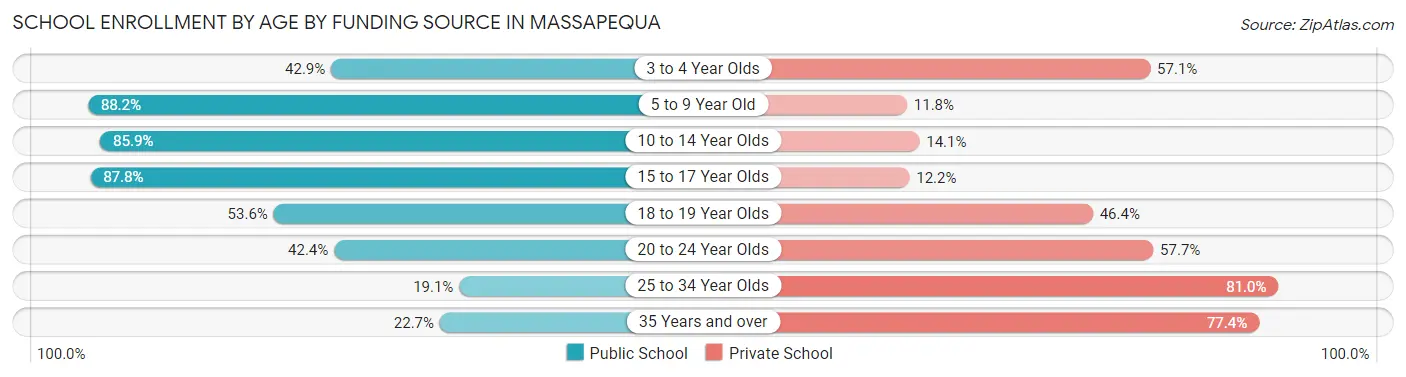
| Age Bracket | Public School | Private School |
| 3 to 4 Year Olds | 112 (42.9%) | 149 (57.1%) |
| 5 to 9 Year Old | 1,042 (88.2%) | 139 (11.8%) |
| 10 to 14 Year Olds | 976 (85.9%) | 160 (14.1%) |
| 15 to 17 Year Olds | 869 (87.8%) | 121 (12.2%) |
| 18 to 19 Year Olds | 208 (53.6%) | 180 (46.4%) |
| 20 to 24 Year Olds | 238 (42.3%) | 324 (57.7%) |
| 25 to 34 Year Olds | 88 (19.1%) | 374 (80.9%) |
| 35 Years and over | 41 (22.7%) | 140 (77.3%) |
| Total | 3,577 (69.3%) | 1,584 (30.7%) |
Educational Attainment by Field of Study in Massapequa
Business (1,828 | 21.3%), education (1,110 | 13.0%), science & technology (923 | 10.8%), social sciences (729 | 8.5%), and psychology (622 | 7.3%) are the most common fields of study among 8,561 individuals in Massapequa who have obtained a bachelor's degree or higher.
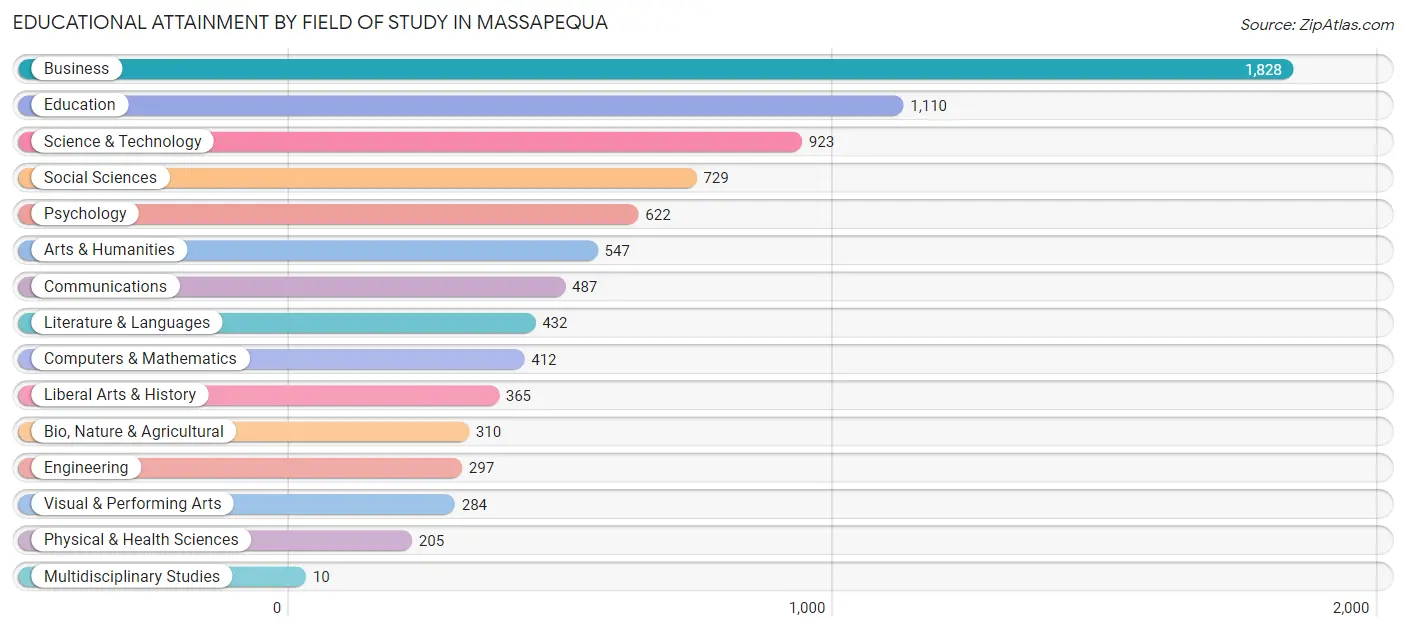
| Field of Study | # Graduates | % Graduates |
| Computers & Mathematics | 412 | 4.8% |
| Bio, Nature & Agricultural | 310 | 3.6% |
| Physical & Health Sciences | 205 | 2.4% |
| Psychology | 622 | 7.3% |
| Social Sciences | 729 | 8.5% |
| Engineering | 297 | 3.5% |
| Multidisciplinary Studies | 10 | 0.1% |
| Science & Technology | 923 | 10.8% |
| Business | 1,828 | 21.3% |
| Education | 1,110 | 13.0% |
| Literature & Languages | 432 | 5.1% |
| Liberal Arts & History | 365 | 4.3% |
| Visual & Performing Arts | 284 | 3.3% |
| Communications | 487 | 5.7% |
| Arts & Humanities | 547 | 6.4% |
| Total | 8,561 | 100.0% |
Transportation & Commute in Massapequa
Vehicle Availability by Sex in Massapequa
The most prevalent vehicle ownership categories in Massapequa are males with 2 vehicles (2,554, accounting for 41.5%) and females with 2 vehicles (1,991, making up 49.8%).
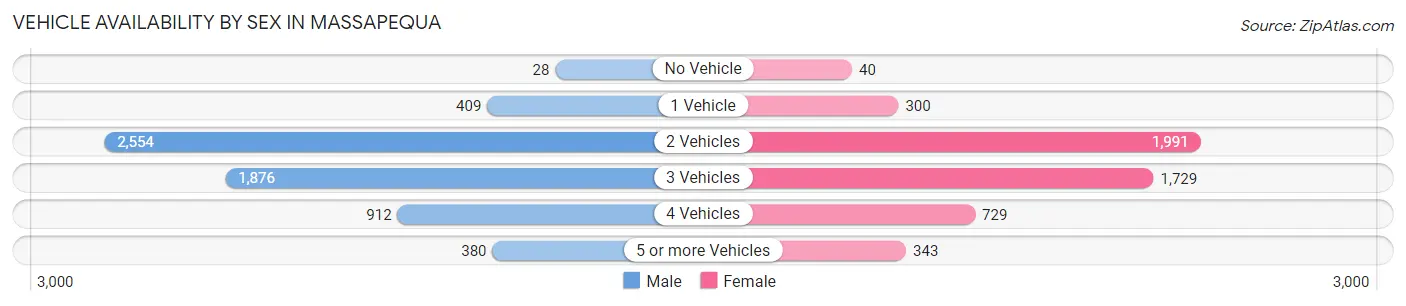
| Vehicles Available | Male | Female |
| No Vehicle | 28 (0.4%) | 40 (0.8%) |
| 1 Vehicle | 409 (6.6%) | 300 (5.9%) |
| 2 Vehicles | 2,554 (41.5%) | 1,991 (38.8%) |
| 3 Vehicles | 1,876 (30.5%) | 1,729 (33.7%) |
| 4 Vehicles | 912 (14.8%) | 729 (14.2%) |
| 5 or more Vehicles | 380 (6.2%) | 343 (6.7%) |
| Total | 6,159 (100.0%) | 5,132 (100.0%) |
Commute Time in Massapequa
The most frequently occuring commute durations in Massapequa are 30 to 34 minutes (1,484 commuters, 15.0%), 60 to 89 minutes (1,474 commuters, 14.9%), and 15 to 19 minutes (1,194 commuters, 12.1%).
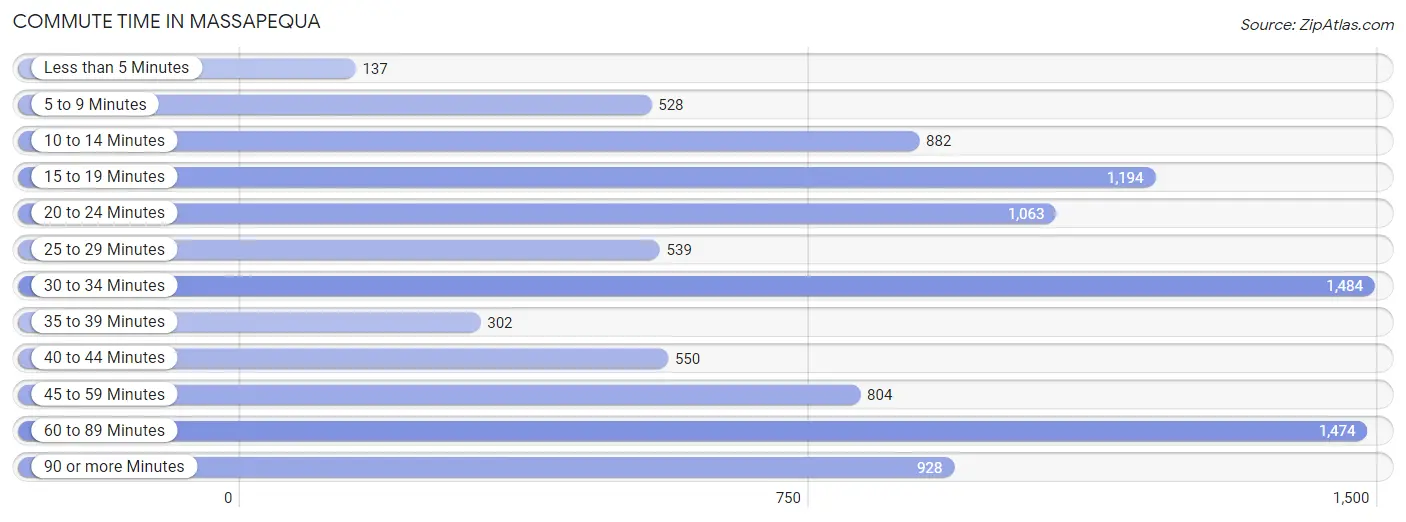
| Commute Time | # Commuters | % Commuters |
| Less than 5 Minutes | 137 | 1.4% |
| 5 to 9 Minutes | 528 | 5.3% |
| 10 to 14 Minutes | 882 | 8.9% |
| 15 to 19 Minutes | 1,194 | 12.1% |
| 20 to 24 Minutes | 1,063 | 10.7% |
| 25 to 29 Minutes | 539 | 5.4% |
| 30 to 34 Minutes | 1,484 | 15.0% |
| 35 to 39 Minutes | 302 | 3.1% |
| 40 to 44 Minutes | 550 | 5.6% |
| 45 to 59 Minutes | 804 | 8.1% |
| 60 to 89 Minutes | 1,474 | 14.9% |
| 90 or more Minutes | 928 | 9.4% |
Commute Time by Sex in Massapequa
The most common commute times in Massapequa are 60 to 89 minutes (1,191 commuters, 22.5%) for males and 30 to 34 minutes (741 commuters, 16.2%) for females.
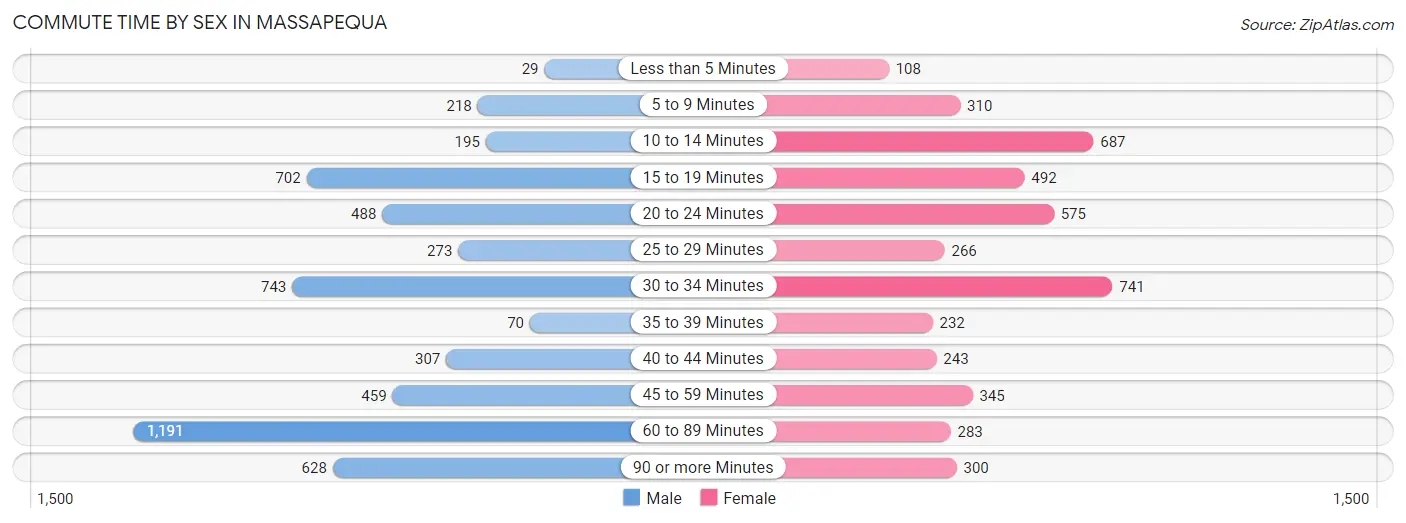
| Commute Time | Male | Female |
| Less than 5 Minutes | 29 (0.5%) | 108 (2.4%) |
| 5 to 9 Minutes | 218 (4.1%) | 310 (6.8%) |
| 10 to 14 Minutes | 195 (3.7%) | 687 (15.0%) |
| 15 to 19 Minutes | 702 (13.2%) | 492 (10.7%) |
| 20 to 24 Minutes | 488 (9.2%) | 575 (12.6%) |
| 25 to 29 Minutes | 273 (5.1%) | 266 (5.8%) |
| 30 to 34 Minutes | 743 (14.0%) | 741 (16.2%) |
| 35 to 39 Minutes | 70 (1.3%) | 232 (5.1%) |
| 40 to 44 Minutes | 307 (5.8%) | 243 (5.3%) |
| 45 to 59 Minutes | 459 (8.7%) | 345 (7.5%) |
| 60 to 89 Minutes | 1,191 (22.5%) | 283 (6.2%) |
| 90 or more Minutes | 628 (11.8%) | 300 (6.6%) |
Time of Departure to Work by Sex in Massapequa
The most frequent times of departure to work in Massapequa are 8:00 AM to 8:29 AM (779, 14.7%) for males and 8:00 AM to 8:29 AM (884, 19.3%) for females.
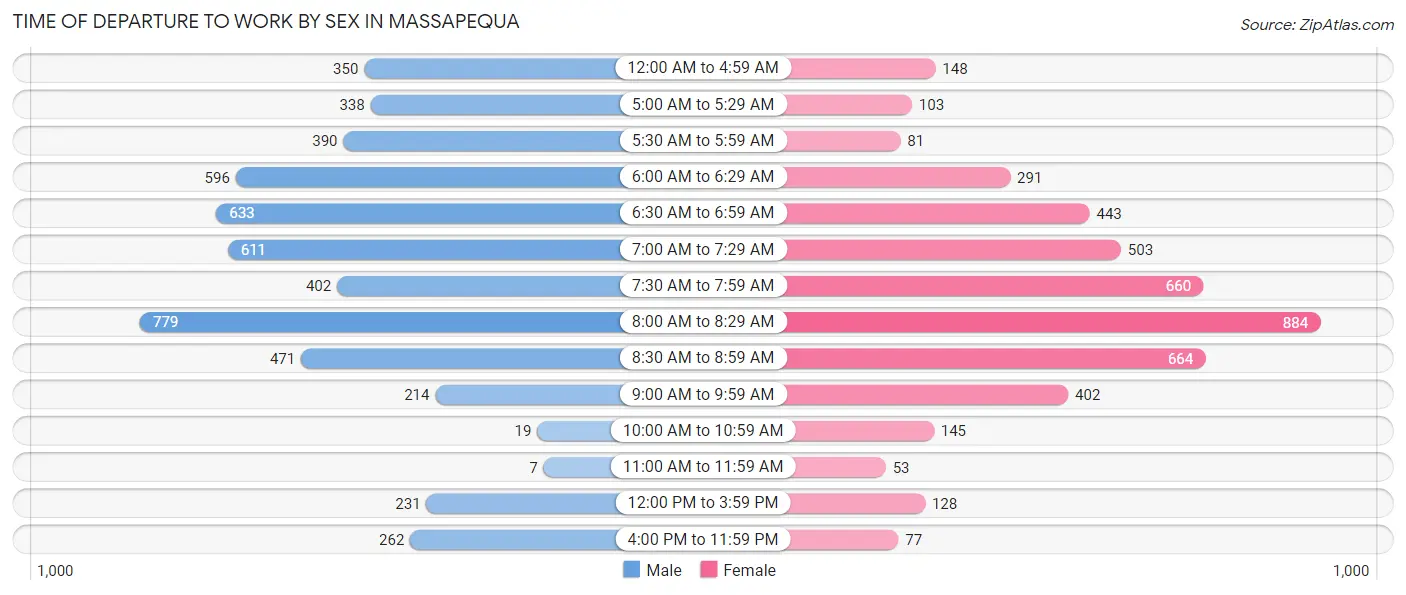
| Time of Departure | Male | Female |
| 12:00 AM to 4:59 AM | 350 (6.6%) | 148 (3.2%) |
| 5:00 AM to 5:29 AM | 338 (6.4%) | 103 (2.2%) |
| 5:30 AM to 5:59 AM | 390 (7.3%) | 81 (1.8%) |
| 6:00 AM to 6:29 AM | 596 (11.2%) | 291 (6.4%) |
| 6:30 AM to 6:59 AM | 633 (11.9%) | 443 (9.7%) |
| 7:00 AM to 7:29 AM | 611 (11.5%) | 503 (11.0%) |
| 7:30 AM to 7:59 AM | 402 (7.6%) | 660 (14.4%) |
| 8:00 AM to 8:29 AM | 779 (14.7%) | 884 (19.3%) |
| 8:30 AM to 8:59 AM | 471 (8.9%) | 664 (14.5%) |
| 9:00 AM to 9:59 AM | 214 (4.0%) | 402 (8.8%) |
| 10:00 AM to 10:59 AM | 19 (0.4%) | 145 (3.2%) |
| 11:00 AM to 11:59 AM | 7 (0.1%) | 53 (1.2%) |
| 12:00 PM to 3:59 PM | 231 (4.4%) | 128 (2.8%) |
| 4:00 PM to 11:59 PM | 262 (4.9%) | 77 (1.7%) |
| Total | 5,303 (100.0%) | 4,582 (100.0%) |
Housing Occupancy in Massapequa
Occupancy by Ownership in Massapequa
Of the total 7,358 dwellings in Massapequa, owner-occupied units account for 7,083 (96.3%), while renter-occupied units make up 275 (3.7%).
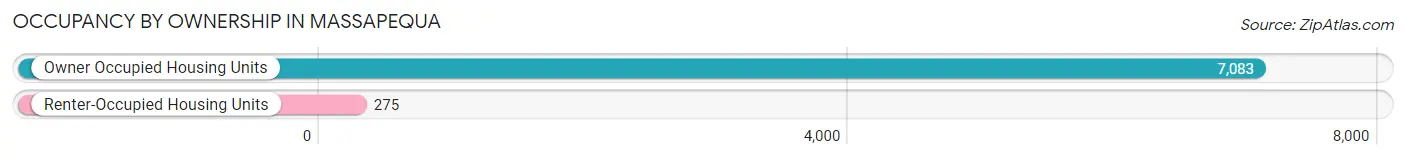
| Occupancy | # Housing Units | % Housing Units |
| Owner Occupied Housing Units | 7,083 | 96.3% |
| Renter-Occupied Housing Units | 275 | 3.7% |
| Total Occupied Housing Units | 7,358 | 100.0% |
Occupancy by Household Size in Massapequa
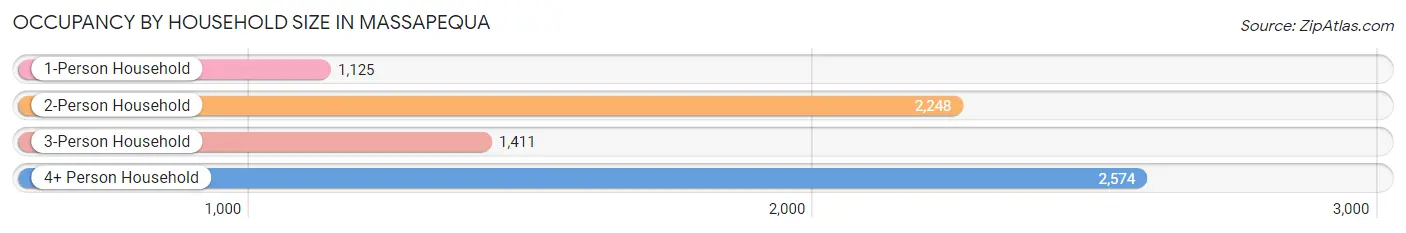
| Household Size | # Housing Units | % Housing Units |
| 1-Person Household | 1,125 | 15.3% |
| 2-Person Household | 2,248 | 30.5% |
| 3-Person Household | 1,411 | 19.2% |
| 4+ Person Household | 2,574 | 35.0% |
| Total Housing Units | 7,358 | 100.0% |
Occupancy by Ownership by Household Size in Massapequa
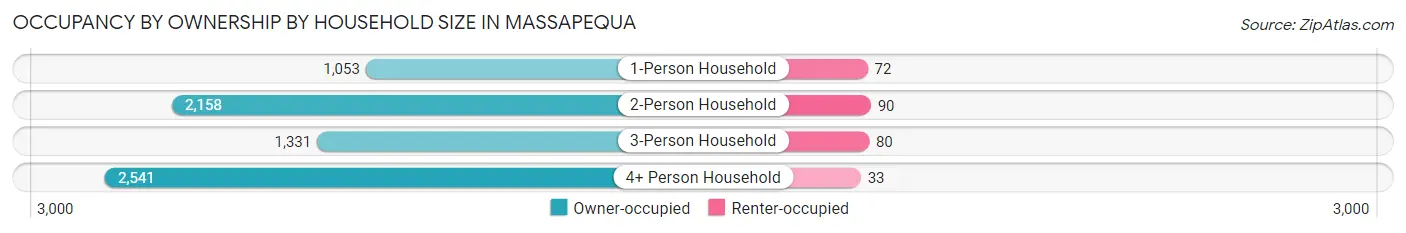
| Household Size | Owner-occupied | Renter-occupied |
| 1-Person Household | 1,053 (93.6%) | 72 (6.4%) |
| 2-Person Household | 2,158 (96.0%) | 90 (4.0%) |
| 3-Person Household | 1,331 (94.3%) | 80 (5.7%) |
| 4+ Person Household | 2,541 (98.7%) | 33 (1.3%) |
| Total Housing Units | 7,083 (96.3%) | 275 (3.7%) |
Occupancy by Educational Attainment in Massapequa
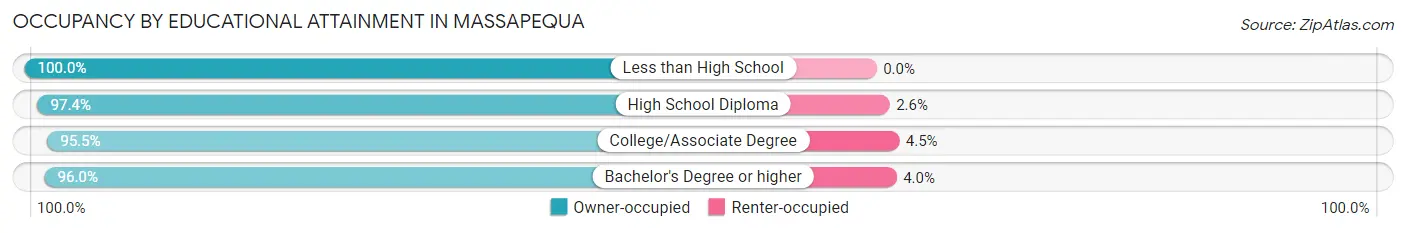
| Household Size | Owner-occupied | Renter-occupied |
| Less than High School | 189 (100.0%) | 0 (0.0%) |
| High School Diploma | 1,429 (97.4%) | 38 (2.6%) |
| College/Associate Degree | 1,869 (95.5%) | 88 (4.5%) |
| Bachelor's Degree or higher | 3,596 (96.0%) | 149 (4.0%) |
Occupancy by Age of Householder in Massapequa
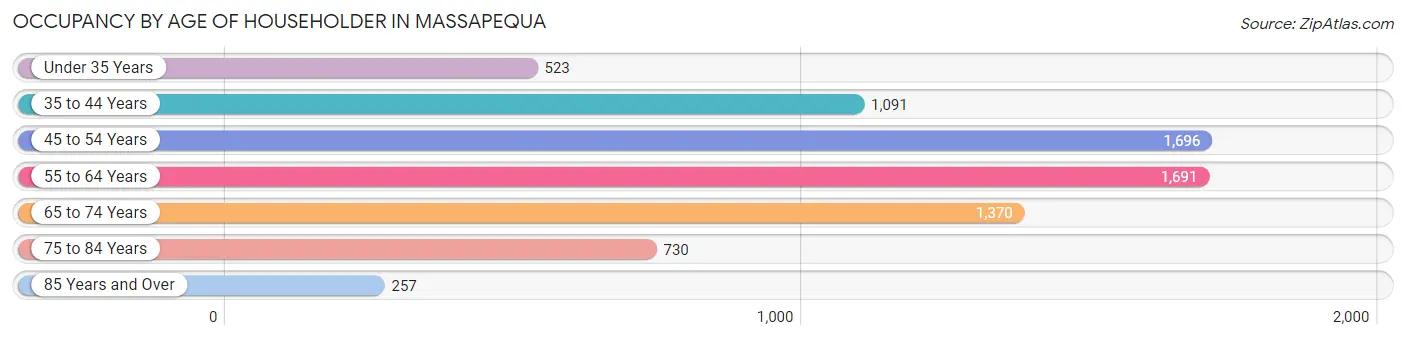
| Age Bracket | # Households | % Households |
| Under 35 Years | 523 | 7.1% |
| 35 to 44 Years | 1,091 | 14.8% |
| 45 to 54 Years | 1,696 | 23.1% |
| 55 to 64 Years | 1,691 | 23.0% |
| 65 to 74 Years | 1,370 | 18.6% |
| 75 to 84 Years | 730 | 9.9% |
| 85 Years and Over | 257 | 3.5% |
| Total | 7,358 | 100.0% |
Housing Finances in Massapequa
Median Income by Occupancy in Massapequa
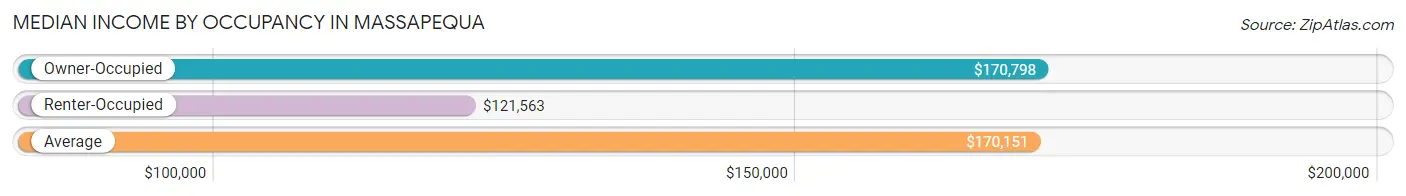
| Occupancy Type | # Households | Median Income |
| Owner-Occupied | 7,083 (96.3%) | $170,798 |
| Renter-Occupied | 275 (3.7%) | $121,563 |
| Average | 7,358 (100.0%) | $170,151 |
Occupancy by Householder Income Bracket in Massapequa
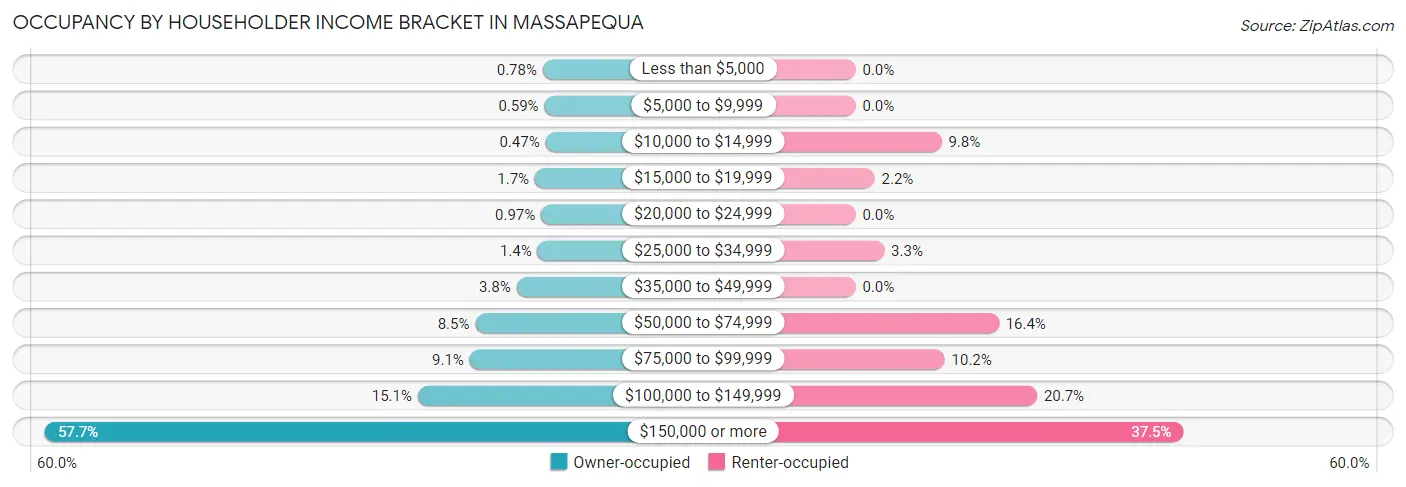
| Income Bracket | Owner-occupied | Renter-occupied |
| Less than $5,000 | 55 (0.8%) | 0 (0.0%) |
| $5,000 to $9,999 | 42 (0.6%) | 0 (0.0%) |
| $10,000 to $14,999 | 33 (0.5%) | 27 (9.8%) |
| $15,000 to $19,999 | 119 (1.7%) | 6 (2.2%) |
| $20,000 to $24,999 | 69 (1.0%) | 0 (0.0%) |
| $25,000 to $34,999 | 97 (1.4%) | 9 (3.3%) |
| $35,000 to $49,999 | 268 (3.8%) | 0 (0.0%) |
| $50,000 to $74,999 | 601 (8.5%) | 45 (16.4%) |
| $75,000 to $99,999 | 647 (9.1%) | 28 (10.2%) |
| $100,000 to $149,999 | 1,067 (15.1%) | 57 (20.7%) |
| $150,000 or more | 4,085 (57.7%) | 103 (37.4%) |
| Total | 7,083 (100.0%) | 275 (100.0%) |
Monthly Housing Cost Tiers in Massapequa
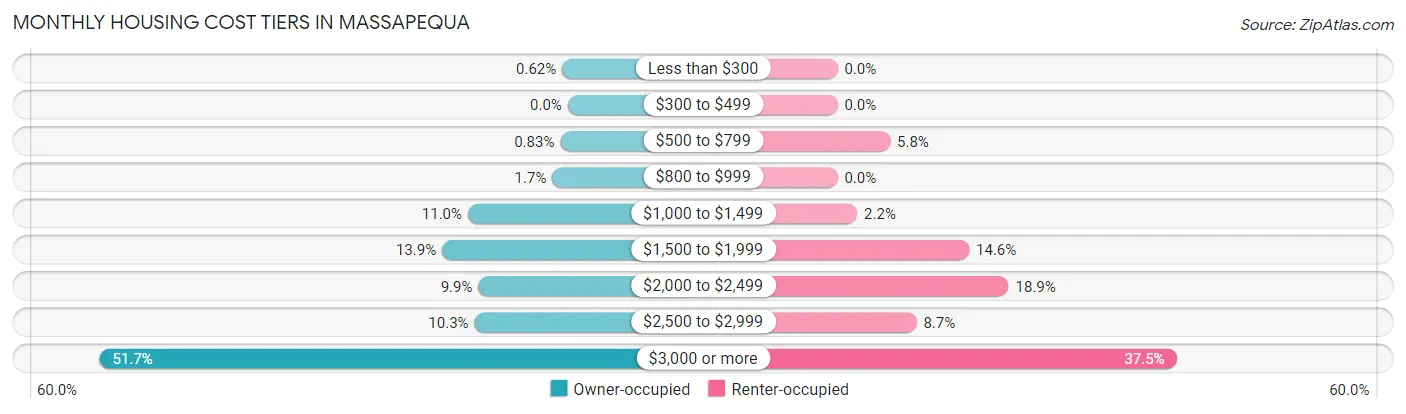
| Monthly Cost | Owner-occupied | Renter-occupied |
| Less than $300 | 44 (0.6%) | 0 (0.0%) |
| $300 to $499 | 0 (0.0%) | 0 (0.0%) |
| $500 to $799 | 59 (0.8%) | 16 (5.8%) |
| $800 to $999 | 121 (1.7%) | 0 (0.0%) |
| $1,000 to $1,499 | 781 (11.0%) | 6 (2.2%) |
| $1,500 to $1,999 | 984 (13.9%) | 40 (14.5%) |
| $2,000 to $2,499 | 700 (9.9%) | 52 (18.9%) |
| $2,500 to $2,999 | 730 (10.3%) | 24 (8.7%) |
| $3,000 or more | 3,664 (51.7%) | 103 (37.4%) |
| Total | 7,083 (100.0%) | 275 (100.0%) |
Physical Housing Characteristics in Massapequa
Housing Structures in Massapequa
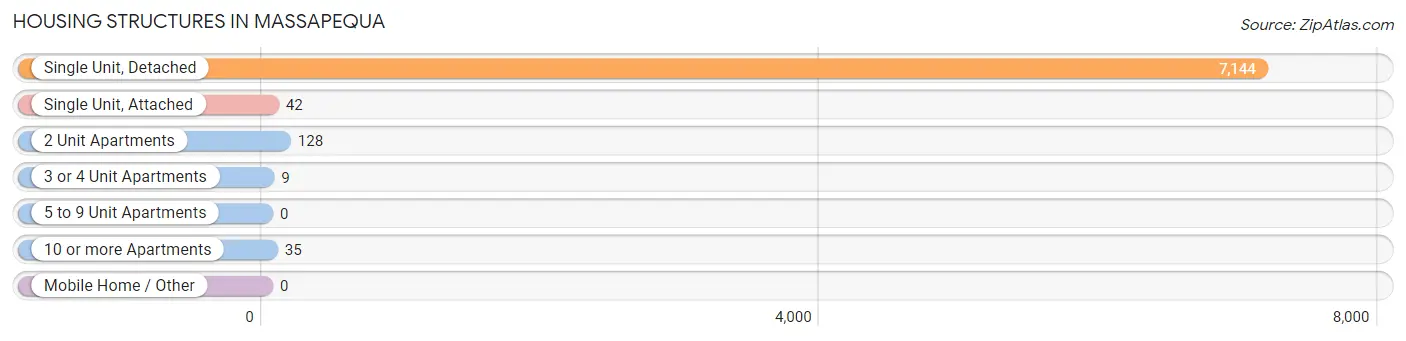
| Structure Type | # Housing Units | % Housing Units |
| Single Unit, Detached | 7,144 | 97.1% |
| Single Unit, Attached | 42 | 0.6% |
| 2 Unit Apartments | 128 | 1.7% |
| 3 or 4 Unit Apartments | 9 | 0.1% |
| 5 to 9 Unit Apartments | 0 | 0.0% |
| 10 or more Apartments | 35 | 0.5% |
| Mobile Home / Other | 0 | 0.0% |
| Total | 7,358 | 100.0% |
Housing Structures by Occupancy in Massapequa
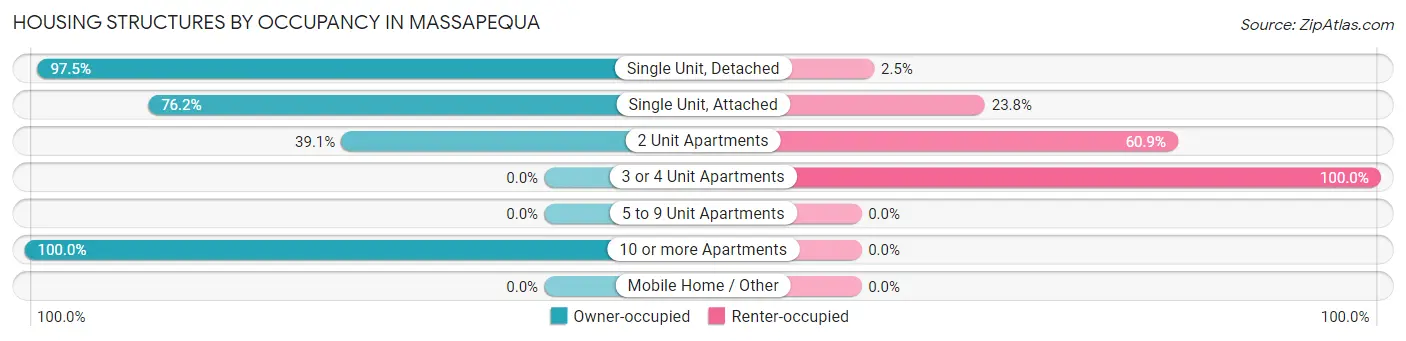
| Structure Type | Owner-occupied | Renter-occupied |
| Single Unit, Detached | 6,966 (97.5%) | 178 (2.5%) |
| Single Unit, Attached | 32 (76.2%) | 10 (23.8%) |
| 2 Unit Apartments | 50 (39.1%) | 78 (60.9%) |
| 3 or 4 Unit Apartments | 0 (0.0%) | 9 (100.0%) |
| 5 to 9 Unit Apartments | 0 (0.0%) | 0 (0.0%) |
| 10 or more Apartments | 35 (100.0%) | 0 (0.0%) |
| Mobile Home / Other | 0 (0.0%) | 0 (0.0%) |
| Total | 7,083 (96.3%) | 275 (3.7%) |
Housing Structures by Number of Rooms in Massapequa
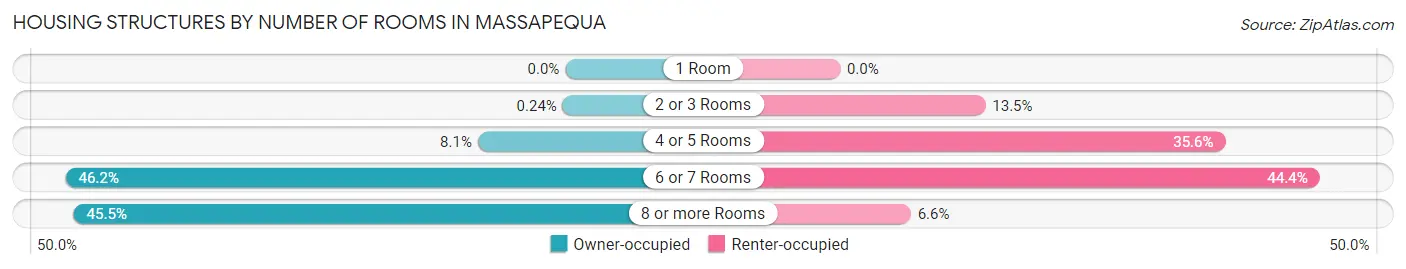
| Number of Rooms | Owner-occupied | Renter-occupied |
| 1 Room | 0 (0.0%) | 0 (0.0%) |
| 2 or 3 Rooms | 17 (0.2%) | 37 (13.5%) |
| 4 or 5 Rooms | 573 (8.1%) | 98 (35.6%) |
| 6 or 7 Rooms | 3,273 (46.2%) | 122 (44.4%) |
| 8 or more Rooms | 3,220 (45.5%) | 18 (6.6%) |
| Total | 7,083 (100.0%) | 275 (100.0%) |
Housing Structure by Heating Type in Massapequa
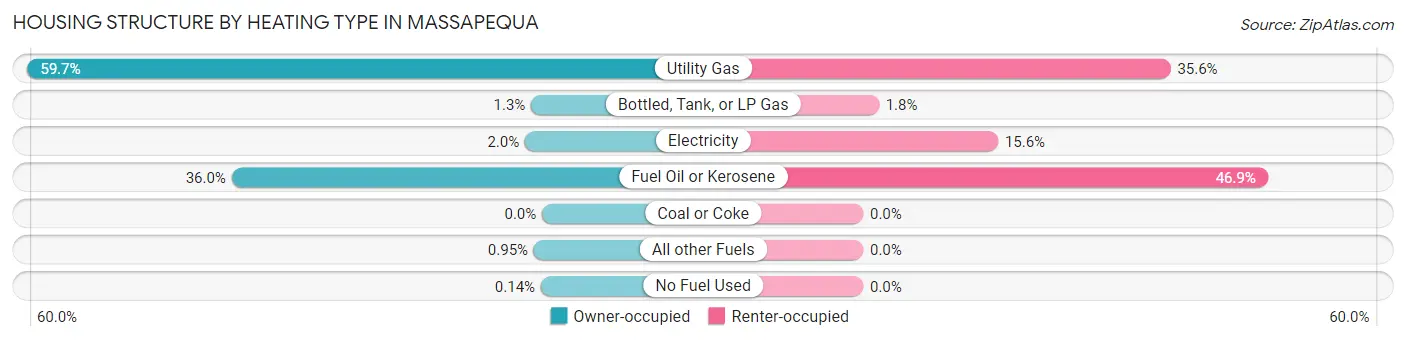
| Heating Type | Owner-occupied | Renter-occupied |
| Utility Gas | 4,227 (59.7%) | 98 (35.6%) |
| Bottled, Tank, or LP Gas | 90 (1.3%) | 5 (1.8%) |
| Electricity | 140 (2.0%) | 43 (15.6%) |
| Fuel Oil or Kerosene | 2,549 (36.0%) | 129 (46.9%) |
| Coal or Coke | 0 (0.0%) | 0 (0.0%) |
| All other Fuels | 67 (0.9%) | 0 (0.0%) |
| No Fuel Used | 10 (0.1%) | 0 (0.0%) |
| Total | 7,083 (100.0%) | 275 (100.0%) |
Household Vehicle Usage in Massapequa
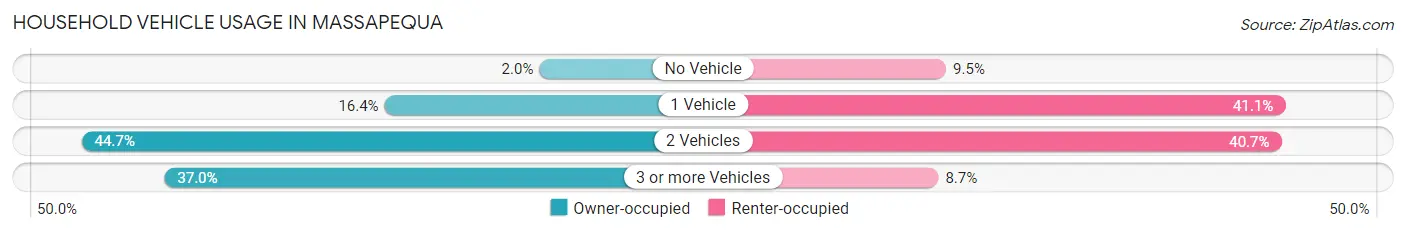
| Vehicles per Household | Owner-occupied | Renter-occupied |
| No Vehicle | 139 (2.0%) | 26 (9.5%) |
| 1 Vehicle | 1,162 (16.4%) | 113 (41.1%) |
| 2 Vehicles | 3,165 (44.7%) | 112 (40.7%) |
| 3 or more Vehicles | 2,617 (36.9%) | 24 (8.7%) |
| Total | 7,083 (100.0%) | 275 (100.0%) |
Real Estate & Mortgages in Massapequa
Real Estate and Mortgage Overview in Massapequa
| Characteristic | Without Mortgage | With Mortgage |
| Housing Units | 2,285 | 4,798 |
| Median Property Value | $596,600 | $663,500 |
| Median Household Income | $118,085 | $3,171 |
| Monthly Housing Costs | $1,501 | $3,627 |
| Real Estate Taxes | $10,001 | $0 |
Property Value by Mortgage Status in Massapequa
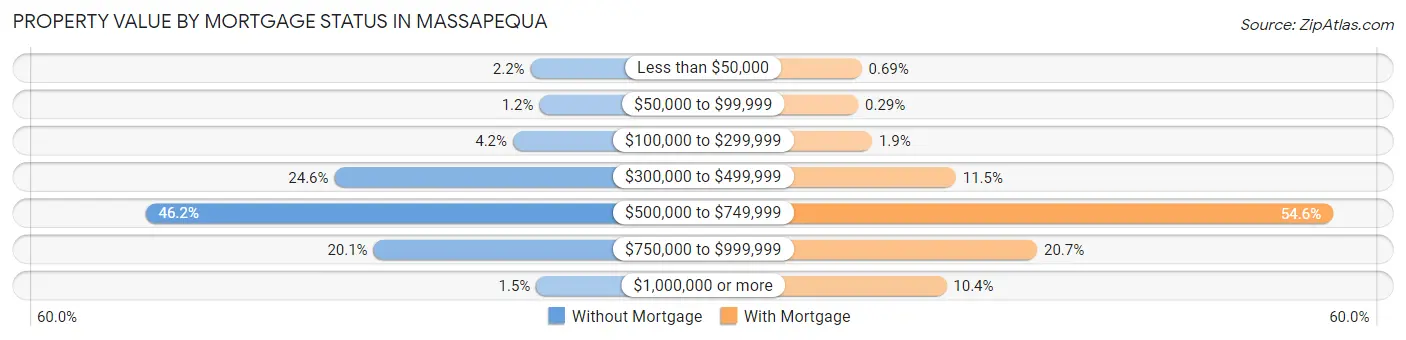
| Property Value | Without Mortgage | With Mortgage |
| Less than $50,000 | 50 (2.2%) | 33 (0.7%) |
| $50,000 to $99,999 | 27 (1.2%) | 14 (0.3%) |
| $100,000 to $299,999 | 96 (4.2%) | 90 (1.9%) |
| $300,000 to $499,999 | 562 (24.6%) | 550 (11.5%) |
| $500,000 to $749,999 | 1,055 (46.2%) | 2,618 (54.6%) |
| $750,000 to $999,999 | 460 (20.1%) | 995 (20.7%) |
| $1,000,000 or more | 35 (1.5%) | 498 (10.4%) |
| Total | 2,285 (100.0%) | 4,798 (100.0%) |
Household Income by Mortgage Status in Massapequa
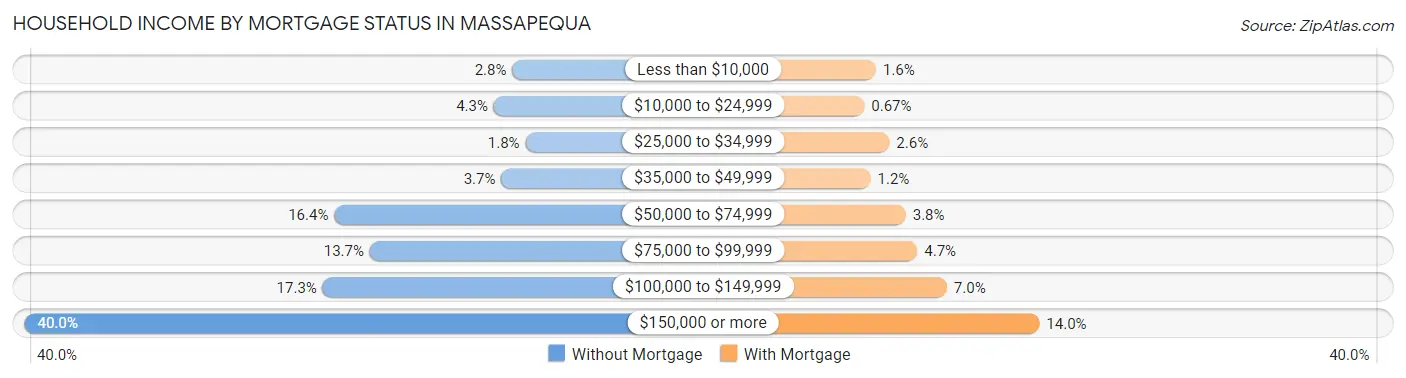
| Household Income | Without Mortgage | With Mortgage |
| Less than $10,000 | 65 (2.8%) | 75 (1.6%) |
| $10,000 to $24,999 | 97 (4.3%) | 32 (0.7%) |
| $25,000 to $34,999 | 42 (1.8%) | 124 (2.6%) |
| $35,000 to $49,999 | 84 (3.7%) | 55 (1.1%) |
| $50,000 to $74,999 | 375 (16.4%) | 184 (3.8%) |
| $75,000 to $99,999 | 313 (13.7%) | 226 (4.7%) |
| $100,000 to $149,999 | 395 (17.3%) | 334 (7.0%) |
| $150,000 or more | 914 (40.0%) | 672 (14.0%) |
| Total | 2,285 (100.0%) | 4,798 (100.0%) |
Property Value to Household Income Ratio in Massapequa
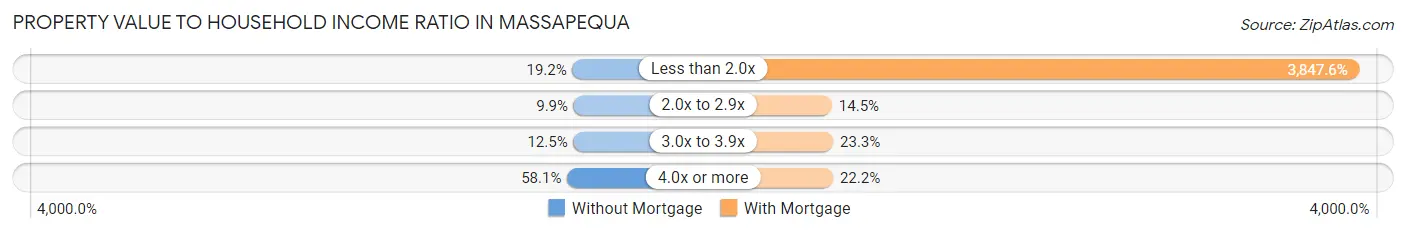
| Value-to-Income Ratio | Without Mortgage | With Mortgage |
| Less than 2.0x | 438 (19.2%) | 184,607 (3,847.6%) |
| 2.0x to 2.9x | 226 (9.9%) | 695 (14.5%) |
| 3.0x to 3.9x | 286 (12.5%) | 1,116 (23.3%) |
| 4.0x or more | 1,327 (58.1%) | 1,067 (22.2%) |
| Total | 2,285 (100.0%) | 4,798 (100.0%) |
Real Estate Taxes by Mortgage Status in Massapequa
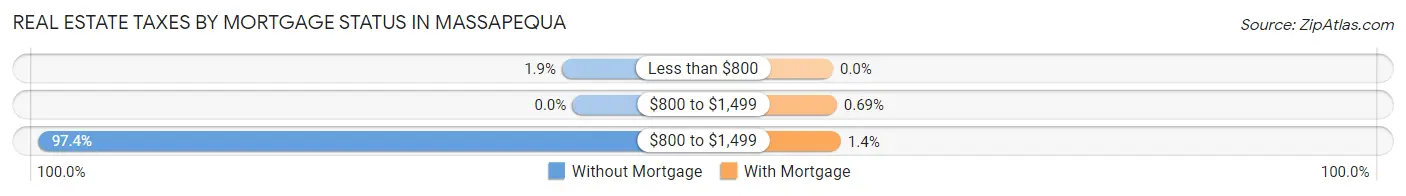
| Property Taxes | Without Mortgage | With Mortgage |
| Less than $800 | 43 (1.9%) | 0 (0.0%) |
| $800 to $1,499 | 0 (0.0%) | 33 (0.7%) |
| $800 to $1,499 | 2,226 (97.4%) | 69 (1.4%) |
| Total | 2,285 (100.0%) | 4,798 (100.0%) |
Health & Disability in Massapequa
Health Insurance Coverage by Age in Massapequa
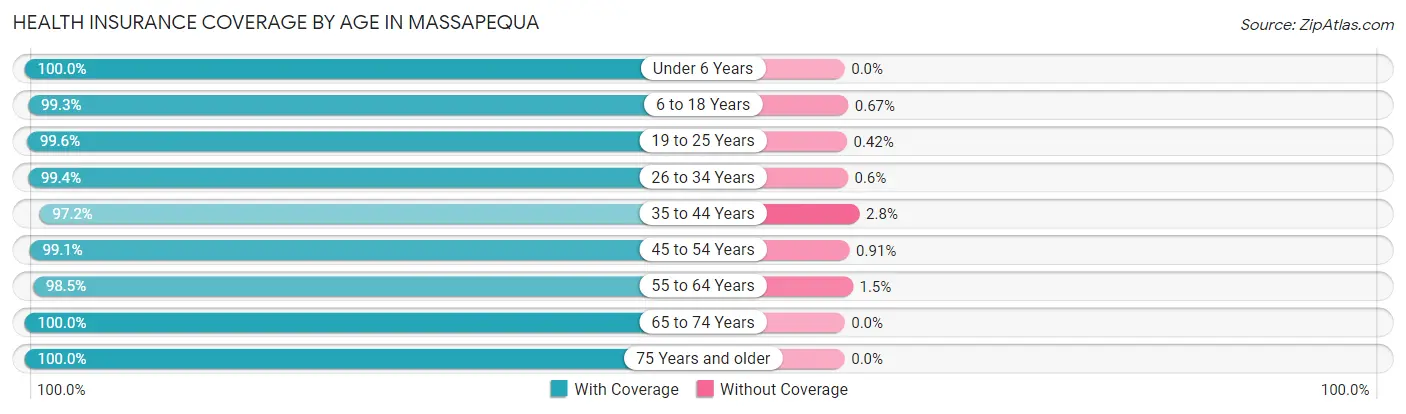
| Age Bracket | With Coverage | Without Coverage |
| Under 6 Years | 1,297 (100.0%) | 0 (0.0%) |
| 6 to 18 Years | 3,427 (99.3%) | 23 (0.7%) |
| 19 to 25 Years | 1,641 (99.6%) | 7 (0.4%) |
| 26 to 34 Years | 2,313 (99.4%) | 14 (0.6%) |
| 35 to 44 Years | 2,175 (97.2%) | 62 (2.8%) |
| 45 to 54 Years | 3,600 (99.1%) | 33 (0.9%) |
| 55 to 64 Years | 3,286 (98.5%) | 51 (1.5%) |
| 65 to 74 Years | 2,284 (100.0%) | 0 (0.0%) |
| 75 Years and older | 1,632 (100.0%) | 0 (0.0%) |
| Total | 21,655 (99.1%) | 190 (0.9%) |
Health Insurance Coverage by Citizenship Status in Massapequa
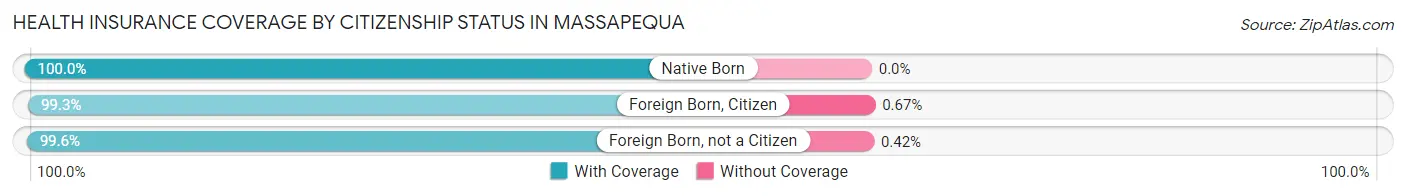
| Citizenship Status | With Coverage | Without Coverage |
| Native Born | 1,297 (100.0%) | 0 (0.0%) |
| Foreign Born, Citizen | 3,427 (99.3%) | 23 (0.7%) |
| Foreign Born, not a Citizen | 1,641 (99.6%) | 7 (0.4%) |
Health Insurance Coverage by Household Income in Massapequa
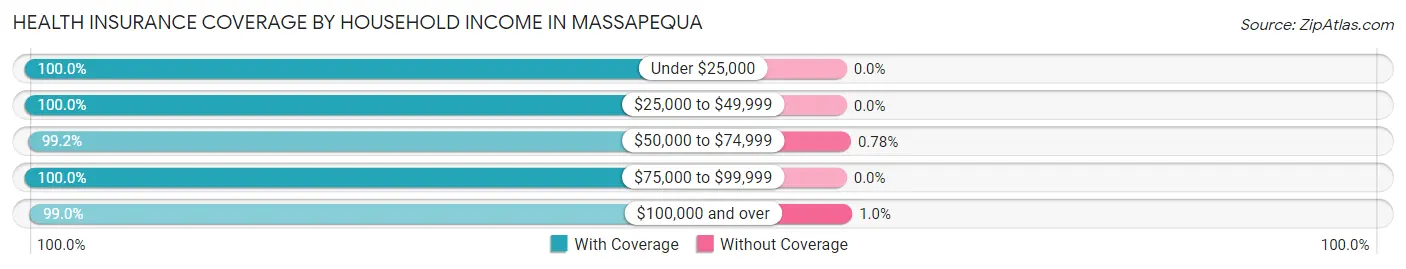
| Household Income | With Coverage | Without Coverage |
| Under $25,000 | 629 (100.0%) | 0 (0.0%) |
| $25,000 to $49,999 | 565 (100.0%) | 0 (0.0%) |
| $50,000 to $74,999 | 1,394 (99.2%) | 11 (0.8%) |
| $75,000 to $99,999 | 1,487 (100.0%) | 0 (0.0%) |
| $100,000 and over | 17,530 (99.0%) | 179 (1.0%) |
Public vs Private Health Insurance Coverage by Age in Massapequa
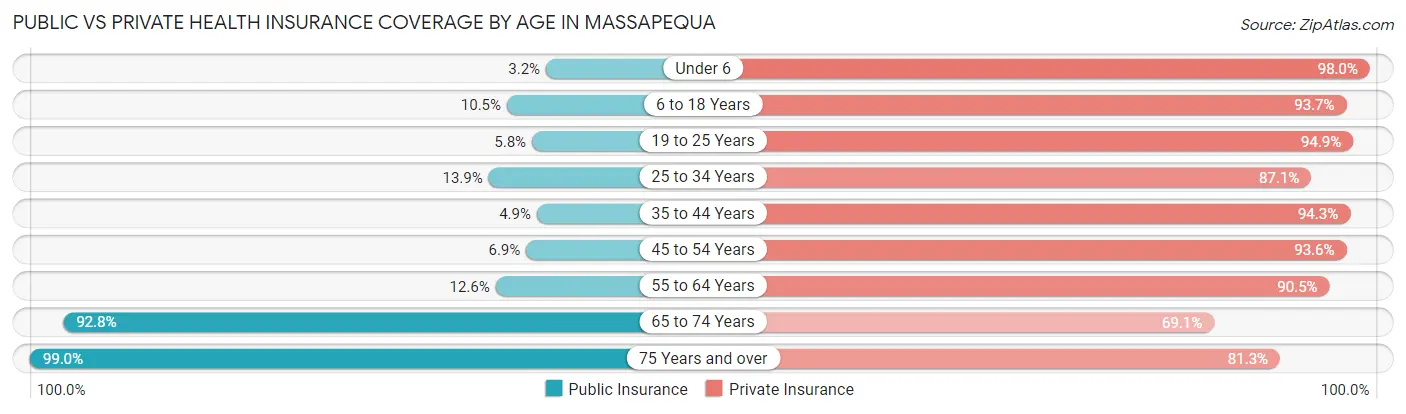
| Age Bracket | Public Insurance | Private Insurance |
| Under 6 | 42 (3.2%) | 1,271 (98.0%) |
| 6 to 18 Years | 362 (10.5%) | 3,231 (93.6%) |
| 19 to 25 Years | 96 (5.8%) | 1,564 (94.9%) |
| 25 to 34 Years | 323 (13.9%) | 2,027 (87.1%) |
| 35 to 44 Years | 110 (4.9%) | 2,110 (94.3%) |
| 45 to 54 Years | 251 (6.9%) | 3,402 (93.6%) |
| 55 to 64 Years | 420 (12.6%) | 3,020 (90.5%) |
| 65 to 74 Years | 2,120 (92.8%) | 1,578 (69.1%) |
| 75 Years and over | 1,616 (99.0%) | 1,327 (81.3%) |
| Total | 5,340 (24.4%) | 19,530 (89.4%) |
Disability Status by Sex by Age in Massapequa
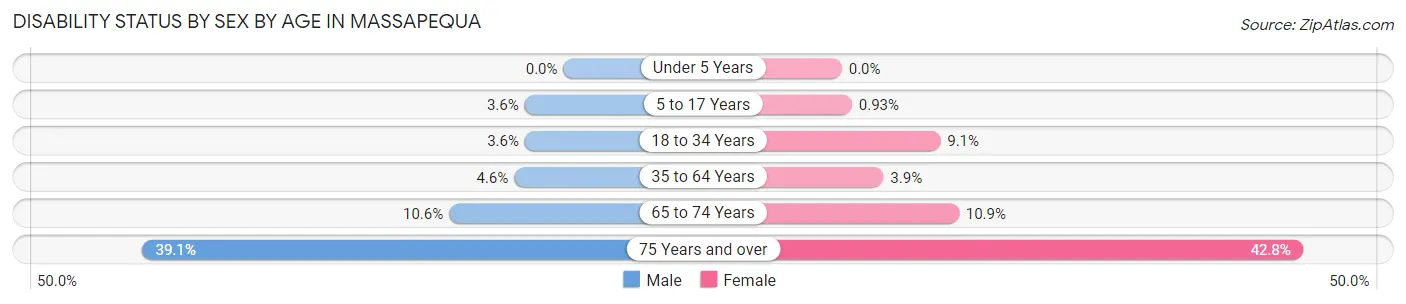
| Age Bracket | Male | Female |
| Under 5 Years | 0 (0.0%) | 0 (0.0%) |
| 5 to 17 Years | 56 (3.6%) | 17 (0.9%) |
| 18 to 34 Years | 72 (3.6%) | 205 (9.1%) |
| 35 to 64 Years | 218 (4.6%) | 171 (3.9%) |
| 65 to 74 Years | 129 (10.6%) | 116 (10.9%) |
| 75 Years and over | 262 (39.1%) | 411 (42.8%) |
Disability Class by Sex by Age in Massapequa
Disability Class: Hearing Difficulty
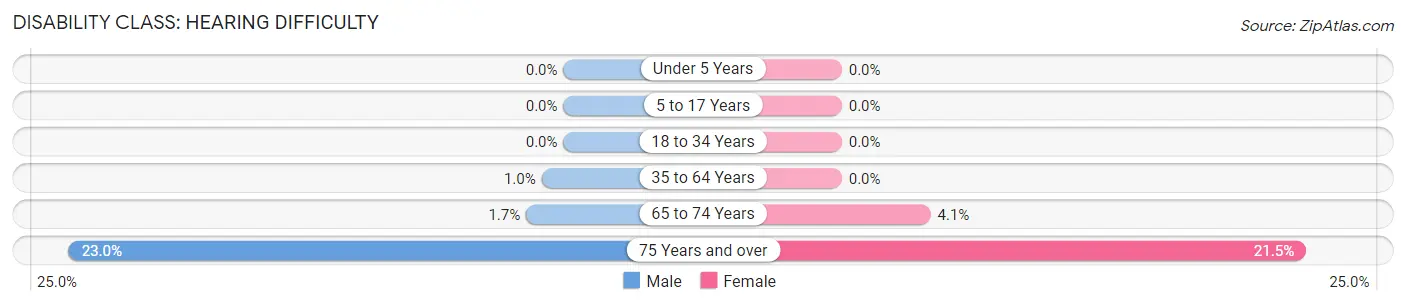
| Age Bracket | Male | Female |
| Under 5 Years | 0 (0.0%) | 0 (0.0%) |
| 5 to 17 Years | 0 (0.0%) | 0 (0.0%) |
| 18 to 34 Years | 0 (0.0%) | 0 (0.0%) |
| 35 to 64 Years | 48 (1.0%) | 0 (0.0%) |
| 65 to 74 Years | 21 (1.7%) | 44 (4.1%) |
| 75 Years and over | 154 (23.0%) | 207 (21.5%) |
Disability Class: Vision Difficulty
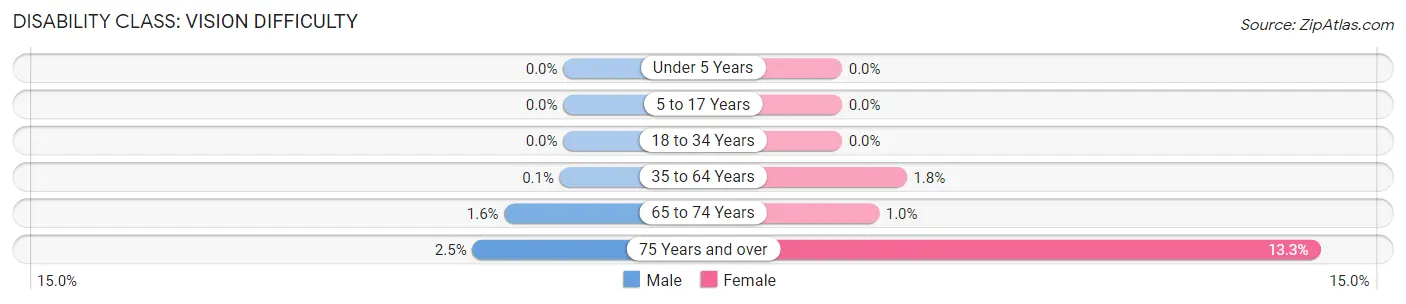
| Age Bracket | Male | Female |
| Under 5 Years | 0 (0.0%) | 0 (0.0%) |
| 5 to 17 Years | 0 (0.0%) | 0 (0.0%) |
| 18 to 34 Years | 0 (0.0%) | 0 (0.0%) |
| 35 to 64 Years | 5 (0.1%) | 80 (1.8%) |
| 65 to 74 Years | 20 (1.6%) | 11 (1.0%) |
| 75 Years and over | 17 (2.5%) | 128 (13.3%) |
Disability Class: Cognitive Difficulty
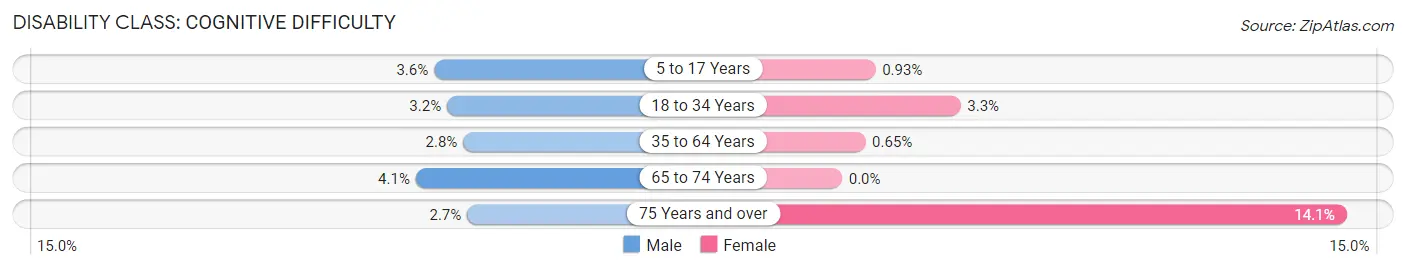
| Age Bracket | Male | Female |
| 5 to 17 Years | 56 (3.6%) | 17 (0.9%) |
| 18 to 34 Years | 65 (3.2%) | 74 (3.3%) |
| 35 to 64 Years | 133 (2.8%) | 29 (0.6%) |
| 65 to 74 Years | 50 (4.1%) | 0 (0.0%) |
| 75 Years and over | 18 (2.7%) | 135 (14.1%) |
Disability Class: Ambulatory Difficulty
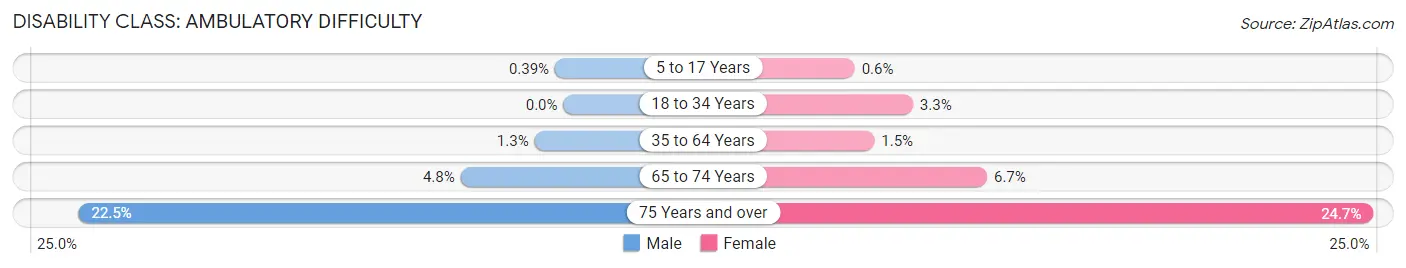
| Age Bracket | Male | Female |
| 5 to 17 Years | 6 (0.4%) | 11 (0.6%) |
| 18 to 34 Years | 0 (0.0%) | 74 (3.3%) |
| 35 to 64 Years | 64 (1.3%) | 67 (1.5%) |
| 65 to 74 Years | 58 (4.8%) | 72 (6.7%) |
| 75 Years and over | 151 (22.5%) | 237 (24.7%) |
Disability Class: Self-Care Difficulty
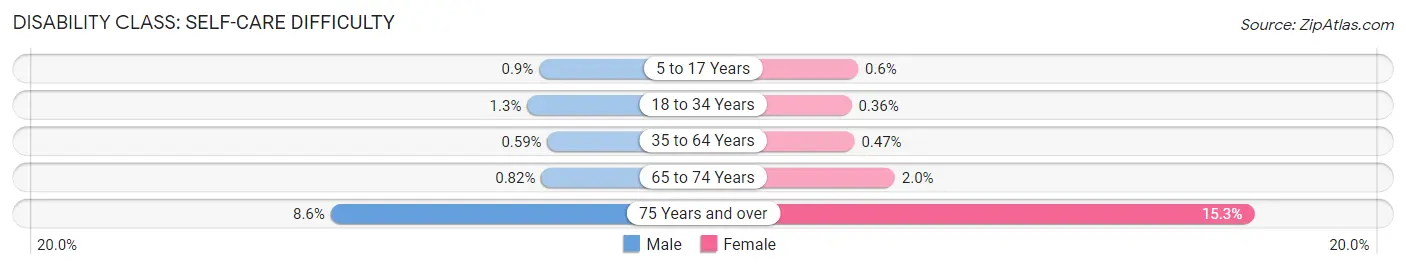
| Age Bracket | Male | Female |
| 5 to 17 Years | 14 (0.9%) | 11 (0.6%) |
| 18 to 34 Years | 27 (1.3%) | 8 (0.4%) |
| 35 to 64 Years | 28 (0.6%) | 21 (0.5%) |
| 65 to 74 Years | 10 (0.8%) | 21 (2.0%) |
| 75 Years and over | 58 (8.6%) | 147 (15.3%) |
Technology Access in Massapequa
Computing Device Access in Massapequa
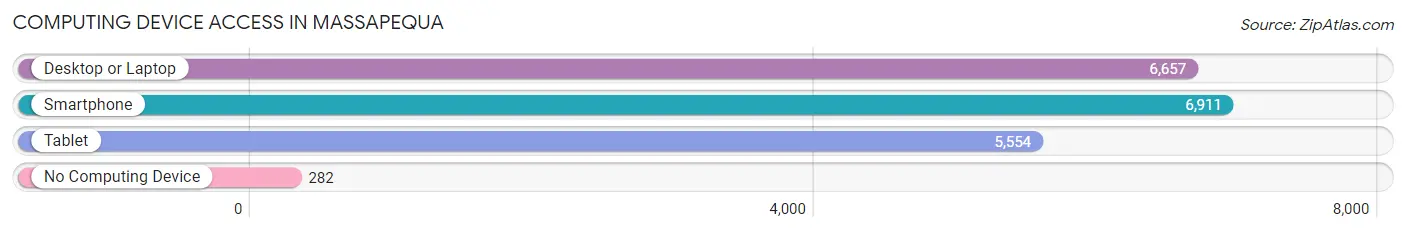
| Device Type | # Households | % Households |
| Desktop or Laptop | 6,657 | 90.5% |
| Smartphone | 6,911 | 93.9% |
| Tablet | 5,554 | 75.5% |
| No Computing Device | 282 | 3.8% |
| Total | 7,358 | 100.0% |
Internet Access in Massapequa
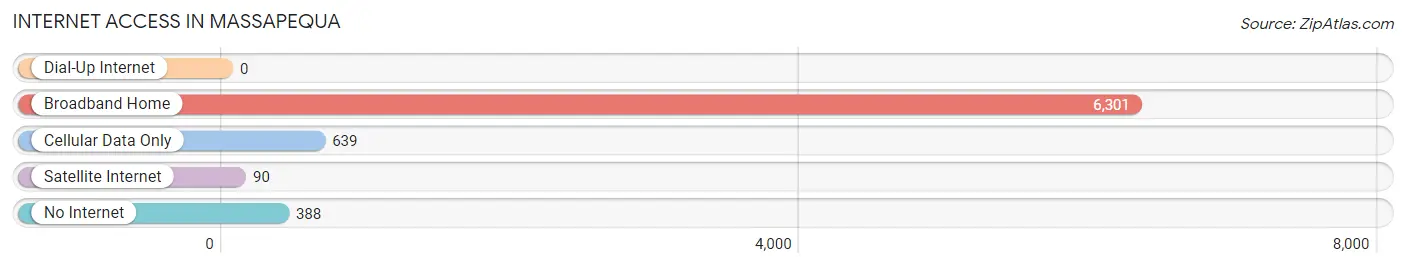
| Internet Type | # Households | % Households |
| Dial-Up Internet | 0 | 0.0% |
| Broadband Home | 6,301 | 85.6% |
| Cellular Data Only | 639 | 8.7% |
| Satellite Internet | 90 | 1.2% |
| No Internet | 388 | 5.3% |
| Total | 7,358 | 100.0% |
Massapequa Summary
History
The area now known as Massapequa, New York was originally inhabited by the Massapequa Indians, a sub-tribe of the Algonquin Nation. The Massapequa Indians were a peaceful people who lived off the land, fishing, hunting, and gathering. They were also known for their skill in making wampum, a type of shell bead used as currency. The Massapequa Indians were eventually driven out of the area by European settlers in the late 1600s.
The first European settlers in the area were Dutch and English farmers who arrived in the early 1700s. They established small farms and settlements, and the area became known as “Massapequa”, which is derived from the Algonquin word for “great water”.
In the late 1800s, the area began to experience rapid growth as more and more people moved to the area. This growth was spurred by the construction of the Long Island Rail Road, which connected Massapequa to New York City. The area also became a popular summer destination for wealthy New Yorkers, who built large estates and mansions in the area.
By the early 1900s, Massapequa had become a thriving community with a population of over 5,000 people. The area was home to a variety of businesses, including a hotel, a movie theater, and a number of stores.
Geography
Massapequa is located in Nassau County, New York, on the south shore of Long Island. It is bordered by the towns of Amityville to the west, Seaford to the east, and Wantagh to the north. The town is situated on the Massapequa Creek, which flows into the Great South Bay.
The town has a total area of 8.3 square miles, of which 7.9 square miles is land and 0.4 square miles is water. The terrain is mostly flat, with some rolling hills in the northern part of the town.
Economy
Massapequa’s economy is largely based on retail and services. The town is home to a variety of stores, restaurants, and other businesses. The town also has a number of industrial parks, which are home to a variety of manufacturing and technology companies.
The town is also home to a number of corporate headquarters, including the headquarters of the National Hockey League’s New York Islanders.
Demographics
As of the 2010 census, Massapequa had a population of 21,685 people. The racial makeup of the town was 87.3% White, 4.2% African American, 0.3% Native American, 3.2% Asian, and 4.9% from other races. Hispanic or Latino of any race were 8.7% of the population.
The median household income in Massapequa was $97,845, and the median family income was $112,917. The per capita income was $41,945. About 3.2% of families and 4.7% of the population were below the poverty line.
Common Questions
What is the Total Population of Massapequa?
Total Population of Massapequa is 21,845.
What is the Total Male Population of Massapequa?
Total Male Population of Massapequa is 10,606.
What is the Total Female Population of Massapequa?
Total Female Population of Massapequa is 11,239.
What is the Ratio of Males per 100 Females in Massapequa?
There are 94.37 Males per 100 Females in Massapequa.
What is the Ratio of Females per 100 Males in Massapequa?
There are 105.97 Females per 100 Males in Massapequa.
What is the Median Population Age in Massapequa?
Median Population Age in Massapequa is 44.7 Years.
What is the Average Family Size in Massapequa
Average Family Size in Massapequa is 3.3 People.
What is the Average Household Size in Massapequa
Average Household Size in Massapequa is 3.0 People.
What is Per Capita Income in Massapequa?
Per Capita income in Massapequa is $68,572.
What is the Median Family Income in Massapequa?
Median Family Income in Massapequa is $183,040.
What is the Median Household income in Massapequa?
Median Household Income in Massapequa is $170,151.
What is Income or Wage Gap in Massapequa?
Income or Wage Gap in Massapequa is 37.4%.
Women in Massapequa earn 62.6 cents for every dollar earned by a man.
What is Family Income Deficit in Massapequa?
Family Income Deficit in Massapequa is $10,656.
Families that are below poverty line in Massapequa earn $10,656 less on average than the poverty threshold level.
What is Inequality or Gini Index in Massapequa?
Inequality or Gini Index in Massapequa is 0.40.
How Large is the Labor Force in Massapequa?
There are 11,991 People in the Labor Forcein in Massapequa.
What is the Percentage of People in the Labor Force in Massapequa?
66.2% of People are in the Labor Force in Massapequa.
What is the Unemployment Rate in Massapequa?
Unemployment Rate in Massapequa is 4.5%.