Rockville Centre, NY
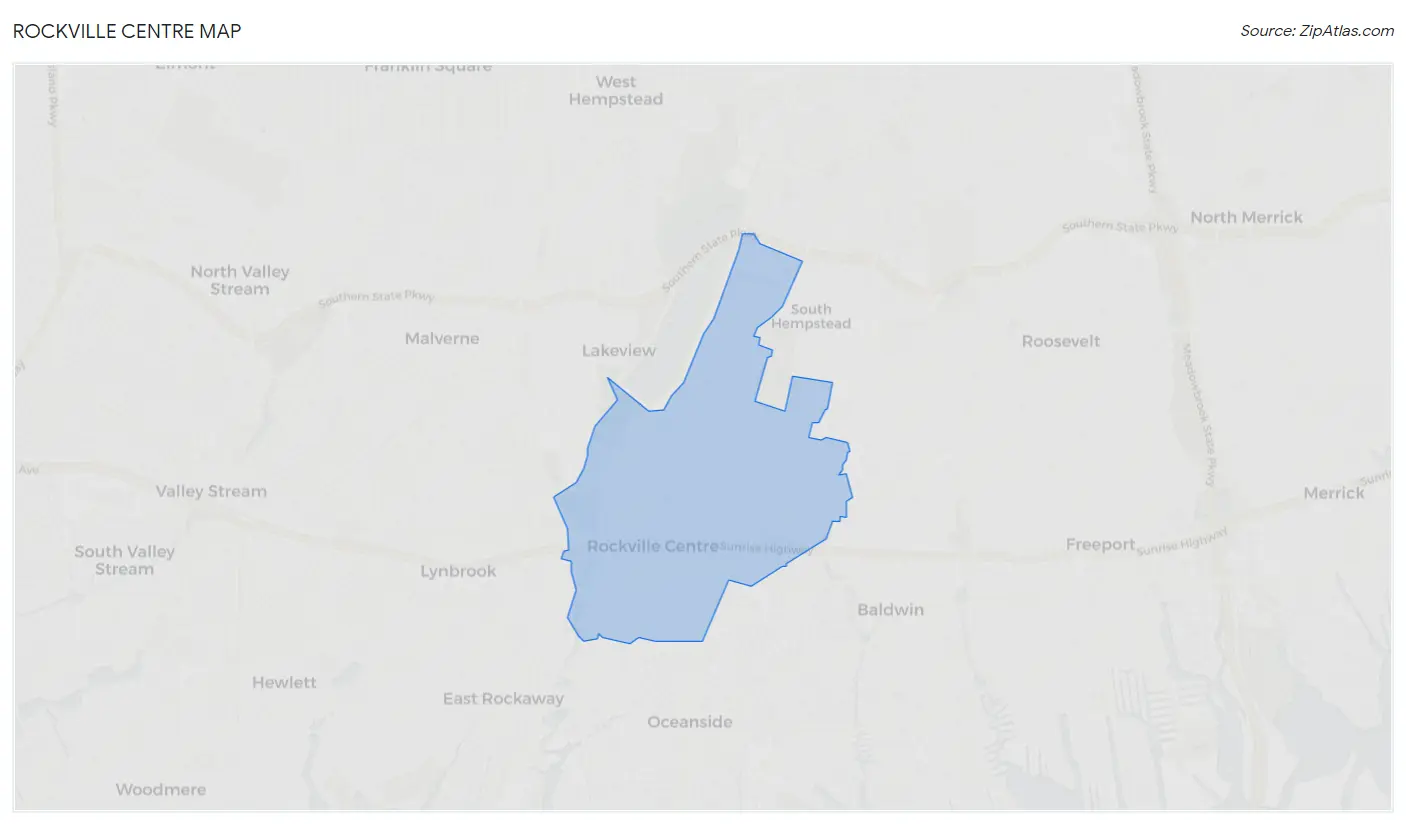
Rockville Centre Map
Rockville Centre Overview
25,784
TOTAL POPULATION
12,244
MALE POPULATION
13,540
FEMALE POPULATION
90.43
MALES / 100 FEMALES
110.58
FEMALES / 100 MALES
43.6
MEDIAN AGE
3.2
AVG FAMILY SIZE
2.5
AVG HOUSEHOLD SIZE
$77,776
PER CAPITA INCOME
$201,830
AVG FAMILY INCOME
$147,361
AVG HOUSEHOLD INCOME
41.3%
WAGE / INCOME GAP [ % ]
58.7¢/ $1
WAGE / INCOME GAP [ $ ]
$10,402
FAMILY INCOME DEFICIT
0.48
INEQUALITY / GINI INDEX
13,508
LABOR FORCE [ PEOPLE ]
65.6%
PERCENT IN LABOR FORCE
5.1%
UNEMPLOYMENT RATE
Rockville Centre Zip Codes
Rockville Centre Area Codes
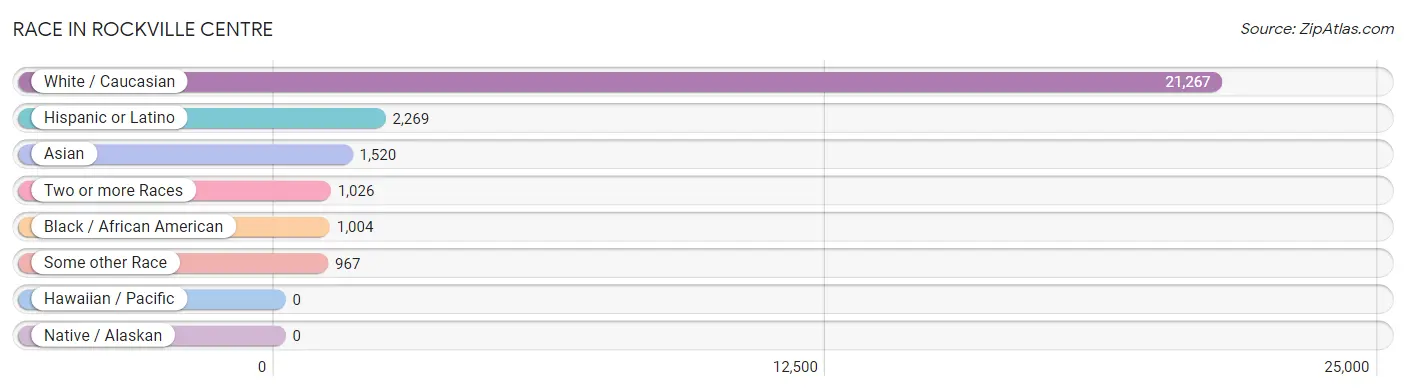
Race in Rockville Centre
The most populous races in Rockville Centre are White / Caucasian (21,267 | 82.5%), Hispanic or Latino (2,269 | 8.8%), and Asian (1,520 | 5.9%).
| Race | # Population | % Population |
| Asian | 1,520 | 5.9% |
| Black / African American | 1,004 | 3.9% |
| Hawaiian / Pacific | 0 | 0.0% |
| Hispanic or Latino | 2,269 | 8.8% |
| Native / Alaskan | 0 | 0.0% |
| White / Caucasian | 21,267 | 82.5% |
| Two or more Races | 1,026 | 4.0% |
| Some other Race | 967 | 3.7% |
| Total | 25,784 | 100.0% |
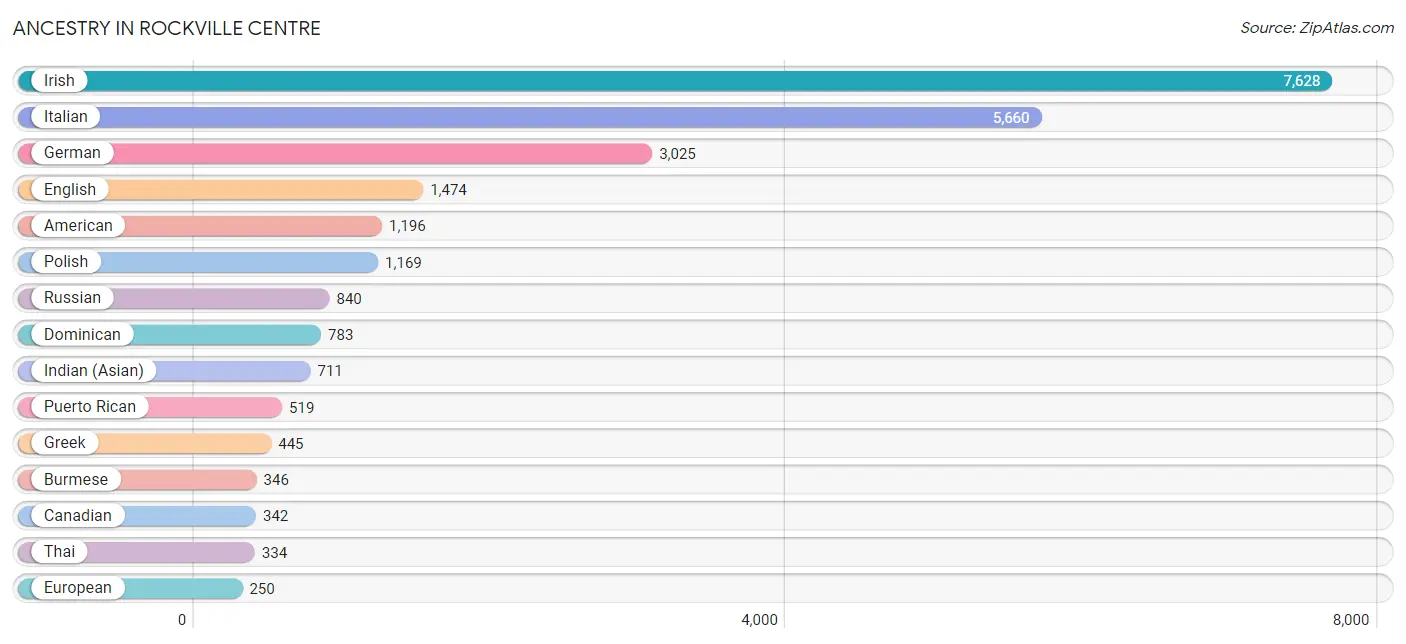
Ancestry in Rockville Centre
The most populous ancestries reported in Rockville Centre are Irish (7,628 | 29.6%), Italian (5,660 | 22.0%), German (3,025 | 11.7%), English (1,474 | 5.7%), and American (1,196 | 4.6%), together accounting for 73.6% of all Rockville Centre residents.
| Ancestry | # Population | % Population |
| African | 64 | 0.3% |
| American | 1,196 | 4.6% |
| Arab | 189 | 0.7% |
| Armenian | 19 | 0.1% |
| Austrian | 178 | 0.7% |
| Barbadian | 14 | 0.1% |
| Belgian | 13 | 0.1% |
| Bhutanese | 28 | 0.1% |
| British | 30 | 0.1% |
| British West Indian | 14 | 0.1% |
| Burmese | 346 | 1.3% |
| Canadian | 342 | 1.3% |
| Central American | 139 | 0.5% |
| Colombian | 119 | 0.5% |
| Costa Rican | 53 | 0.2% |
| Croatian | 57 | 0.2% |
| Cuban | 159 | 0.6% |
| Czech | 47 | 0.2% |
| Czechoslovakian | 23 | 0.1% |
| Danish | 36 | 0.1% |
| Dominican | 783 | 3.0% |
| Dutch | 54 | 0.2% |
| Eastern European | 203 | 0.8% |
| Ecuadorian | 50 | 0.2% |
| Egyptian | 40 | 0.2% |
| English | 1,474 | 5.7% |
| European | 250 | 1.0% |
| Filipino | 14 | 0.1% |
| French | 158 | 0.6% |
| French Canadian | 32 | 0.1% |
| German | 3,025 | 11.7% |
| Greek | 445 | 1.7% |
| Guatemalan | 11 | 0.0% |
| Guyanese | 72 | 0.3% |
| Haitian | 181 | 0.7% |
| Honduran | 40 | 0.2% |
| Hungarian | 170 | 0.7% |
| Indian (Asian) | 711 | 2.8% |
| Irish | 7,628 | 29.6% |
| Israeli | 74 | 0.3% |
| Italian | 5,660 | 22.0% |
| Jamaican | 138 | 0.5% |
| Korean | 154 | 0.6% |
| Laotian | 11 | 0.0% |
| Latvian | 28 | 0.1% |
| Lebanese | 100 | 0.4% |
| Lithuanian | 46 | 0.2% |
| Mexican | 150 | 0.6% |
| Norwegian | 177 | 0.7% |
| Pakistani | 58 | 0.2% |
| Peruvian | 19 | 0.1% |
| Polish | 1,169 | 4.5% |
| Portuguese | 38 | 0.2% |
| Puerto Rican | 519 | 2.0% |
| Romanian | 45 | 0.2% |
| Russian | 840 | 3.3% |
| Salvadoran | 35 | 0.1% |
| Scotch-Irish | 27 | 0.1% |
| Scottish | 198 | 0.8% |
| Serbian | 23 | 0.1% |
| Sioux | 23 | 0.1% |
| Slovak | 9 | 0.0% |
| South African | 21 | 0.1% |
| South American | 242 | 0.9% |
| Spaniard | 37 | 0.1% |
| Spanish | 101 | 0.4% |
| Subsaharan African | 85 | 0.3% |
| Swedish | 236 | 0.9% |
| Swiss | 10 | 0.0% |
| Syrian | 11 | 0.0% |
| Thai | 334 | 1.3% |
| Turkish | 53 | 0.2% |
| Ukrainian | 102 | 0.4% |
| Venezuelan | 54 | 0.2% |
| Welsh | 147 | 0.6% |
| West Indian | 69 | 0.3% | View All 76 Rows |
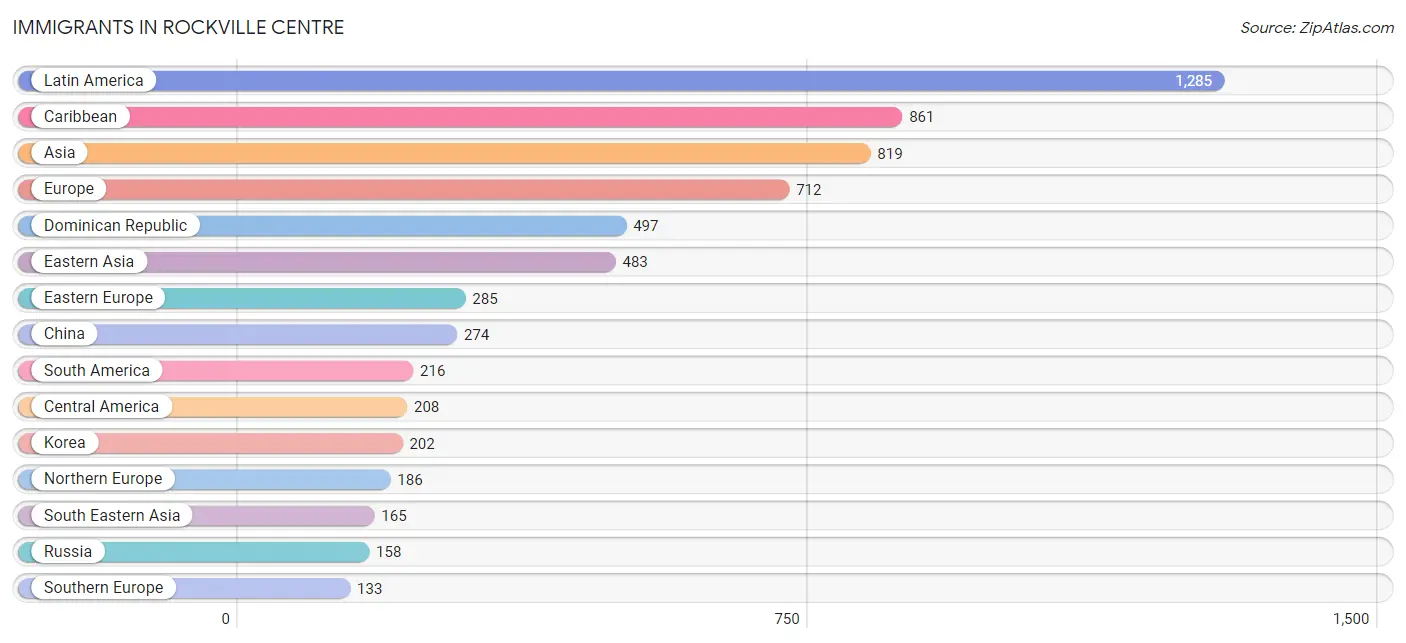
Immigrants in Rockville Centre
The most numerous immigrant groups reported in Rockville Centre came from Latin America (1,285 | 5.0%), Caribbean (861 | 3.3%), Asia (819 | 3.2%), Europe (712 | 2.8%), and Dominican Republic (497 | 1.9%), together accounting for 16.2% of all Rockville Centre residents.
| Immigration Origin | # Population | % Population |
| Africa | 58 | 0.2% |
| Asia | 819 | 3.2% |
| Australia | 8 | 0.0% |
| Barbados | 8 | 0.0% |
| Belgium | 38 | 0.2% |
| Brazil | 9 | 0.0% |
| Canada | 26 | 0.1% |
| Caribbean | 861 | 3.3% |
| Central America | 208 | 0.8% |
| China | 274 | 1.1% |
| Colombia | 43 | 0.2% |
| Costa Rica | 25 | 0.1% |
| Cuba | 23 | 0.1% |
| Dominica | 46 | 0.2% |
| Dominican Republic | 497 | 1.9% |
| Eastern Asia | 483 | 1.9% |
| Eastern Europe | 285 | 1.1% |
| Ecuador | 20 | 0.1% |
| Egypt | 37 | 0.1% |
| El Salvador | 35 | 0.1% |
| England | 87 | 0.3% |
| Europe | 712 | 2.8% |
| Germany | 63 | 0.2% |
| Greece | 65 | 0.3% |
| Guatemala | 11 | 0.0% |
| Guyana | 103 | 0.4% |
| Haiti | 100 | 0.4% |
| Honduras | 48 | 0.2% |
| Hong Kong | 44 | 0.2% |
| India | 63 | 0.2% |
| Ireland | 67 | 0.3% |
| Israel | 72 | 0.3% |
| Italy | 57 | 0.2% |
| Jamaica | 79 | 0.3% |
| Japan | 7 | 0.0% |
| Korea | 202 | 0.8% |
| Latin America | 1,285 | 5.0% |
| Lebanon | 9 | 0.0% |
| Mexico | 70 | 0.3% |
| Northern Africa | 37 | 0.1% |
| Northern Europe | 186 | 0.7% |
| Oceania | 8 | 0.0% |
| Pakistan | 27 | 0.1% |
| Panama | 19 | 0.1% |
| Peru | 31 | 0.1% |
| Philippines | 107 | 0.4% |
| Poland | 43 | 0.2% |
| Portugal | 11 | 0.0% |
| Romania | 53 | 0.2% |
| Russia | 158 | 0.6% |
| Scotland | 11 | 0.0% |
| South Africa | 21 | 0.1% |
| South America | 216 | 0.8% |
| South Central Asia | 90 | 0.4% |
| South Eastern Asia | 165 | 0.6% |
| Southern Europe | 133 | 0.5% |
| Taiwan | 14 | 0.1% |
| Thailand | 58 | 0.2% |
| Trinidad and Tobago | 16 | 0.1% |
| Venezuela | 10 | 0.0% |
| West Indies | 92 | 0.4% |
| Western Asia | 81 | 0.3% |
| Western Europe | 101 | 0.4% | View All 63 Rows |
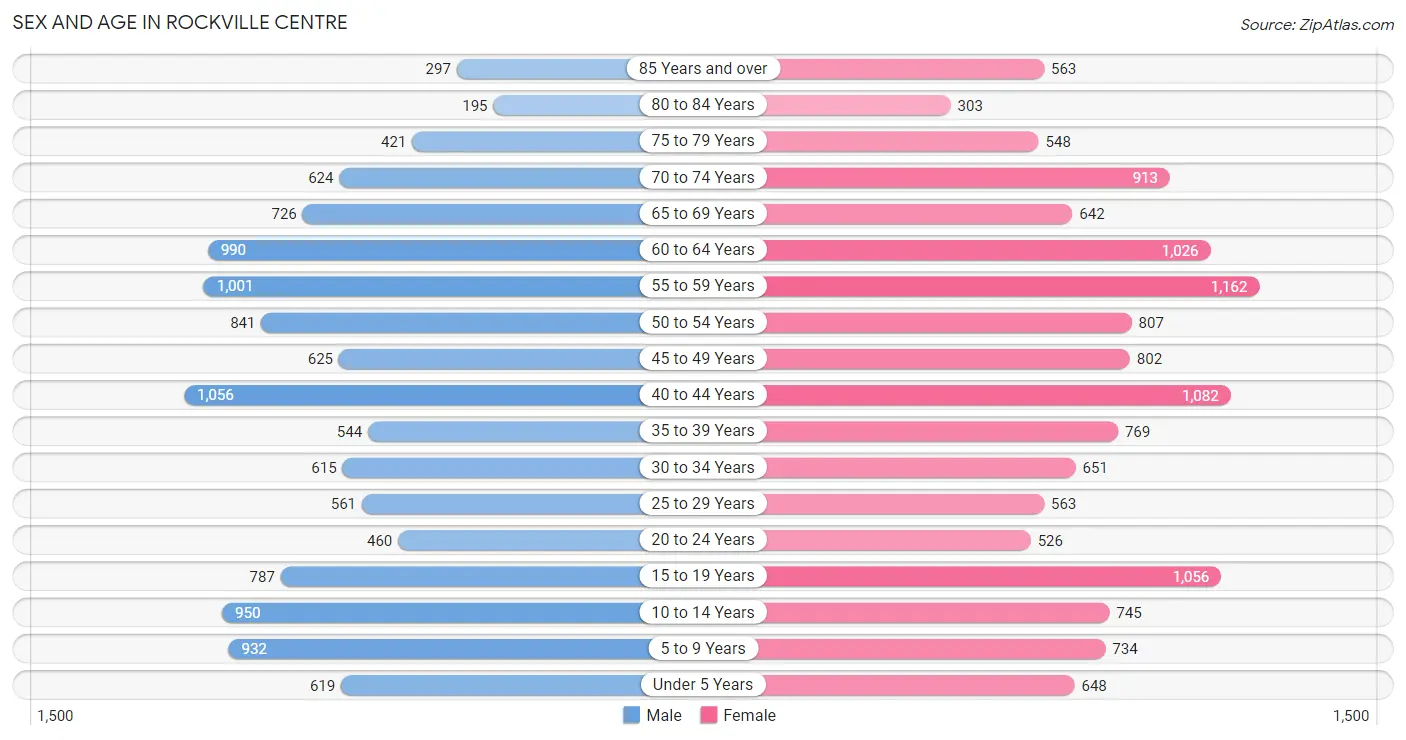
Sex and Age in Rockville Centre
Sex and Age in Rockville Centre
The most populous age groups in Rockville Centre are 40 to 44 Years (1,056 | 8.6%) for men and 55 to 59 Years (1,162 | 8.6%) for women.
| Age Bracket | Male | Female |
| Under 5 Years | 619 (5.1%) | 648 (4.8%) |
| 5 to 9 Years | 932 (7.6%) | 734 (5.4%) |
| 10 to 14 Years | 950 (7.8%) | 745 (5.5%) |
| 15 to 19 Years | 787 (6.4%) | 1,056 (7.8%) |
| 20 to 24 Years | 460 (3.8%) | 526 (3.9%) |
| 25 to 29 Years | 561 (4.6%) | 563 (4.2%) |
| 30 to 34 Years | 615 (5.0%) | 651 (4.8%) |
| 35 to 39 Years | 544 (4.4%) | 769 (5.7%) |
| 40 to 44 Years | 1,056 (8.6%) | 1,082 (8.0%) |
| 45 to 49 Years | 625 (5.1%) | 802 (5.9%) |
| 50 to 54 Years | 841 (6.9%) | 807 (6.0%) |
| 55 to 59 Years | 1,001 (8.2%) | 1,162 (8.6%) |
| 60 to 64 Years | 990 (8.1%) | 1,026 (7.6%) |
| 65 to 69 Years | 726 (5.9%) | 642 (4.7%) |
| 70 to 74 Years | 624 (5.1%) | 913 (6.7%) |
| 75 to 79 Years | 421 (3.4%) | 548 (4.1%) |
| 80 to 84 Years | 195 (1.6%) | 303 (2.2%) |
| 85 Years and over | 297 (2.4%) | 563 (4.2%) |
| Total | 12,244 (100.0%) | 13,540 (100.0%) |
Families and Households in Rockville Centre
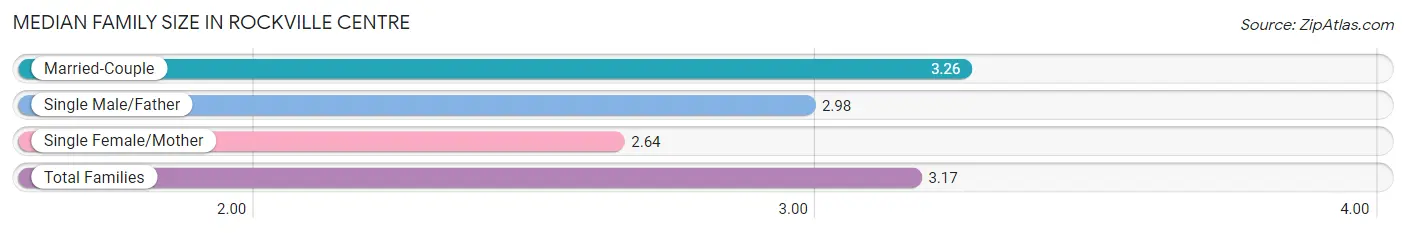
Median Family Size in Rockville Centre
The median family size in Rockville Centre is 3.17 persons per family, with married-couple families (5,544 | 82.3%) accounting for the largest median family size of 3.26 persons per family. On the other hand, single female/mother families (777 | 11.5%) represent the smallest median family size with 2.64 persons per family.
| Family Type | # Families | Family Size |
| Married-Couple | 5,544 (82.3%) | 3.26 |
| Single Male/Father | 412 (6.1%) | 2.98 |
| Single Female/Mother | 777 (11.5%) | 2.64 |
| Total Families | 6,733 (100.0%) | 3.17 |
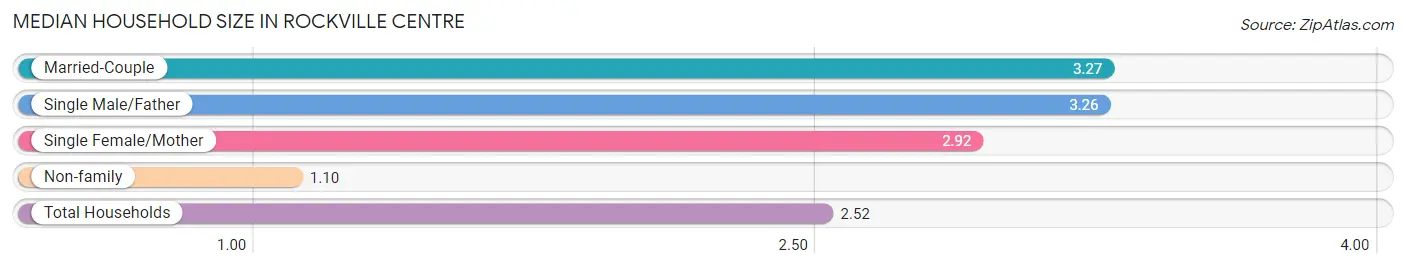
Median Household Size in Rockville Centre
The median household size in Rockville Centre is 2.52 persons per household, with married-couple households (5,544 | 55.0%) accounting for the largest median household size of 3.27 persons per household. non-family households (3,354 | 33.3%) represent the smallest median household size with 1.10 persons per household.
| Household Type | # Households | Household Size |
| Married-Couple | 5,544 (55.0%) | 3.27 |
| Single Male/Father | 412 (4.1%) | 3.26 |
| Single Female/Mother | 777 (7.7%) | 2.92 |
| Non-family | 3,354 (33.3%) | 1.10 |
| Total Households | 10,087 (100.0%) | 2.52 |
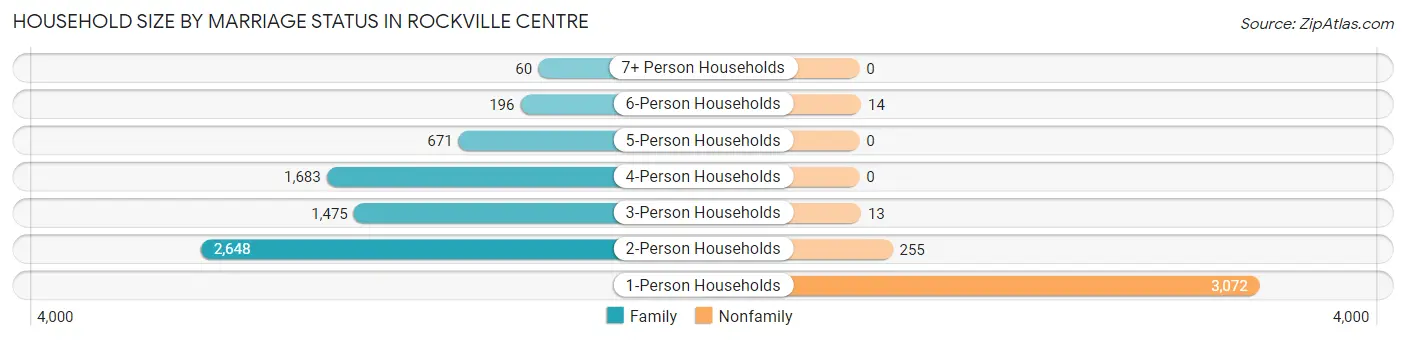
Household Size by Marriage Status in Rockville Centre
Out of a total of 10,087 households in Rockville Centre, 6,733 (66.7%) are family households, while 3,354 (33.3%) are nonfamily households. The most numerous type of family households are 2-person households, comprising 2,648, and the most common type of nonfamily households are 1-person households, comprising 3,072.
| Household Size | Family Households | Nonfamily Households |
| 1-Person Households | - | 3,072 (30.5%) |
| 2-Person Households | 2,648 (26.3%) | 255 (2.5%) |
| 3-Person Households | 1,475 (14.6%) | 13 (0.1%) |
| 4-Person Households | 1,683 (16.7%) | 0 (0.0%) |
| 5-Person Households | 671 (6.7%) | 0 (0.0%) |
| 6-Person Households | 196 (1.9%) | 14 (0.1%) |
| 7+ Person Households | 60 (0.6%) | 0 (0.0%) |
| Total | 6,733 (66.7%) | 3,354 (33.3%) |
Female Fertility in Rockville Centre
Fertility by Age in Rockville Centre
Average fertility rate in Rockville Centre is 37.0 births per 1,000 women. Women in the age bracket of 20 to 34 years have the highest fertility rate with 76.0 births per 1,000 women. Women in the age bracket of 20 to 34 years acount for 63.6% of all women with births.
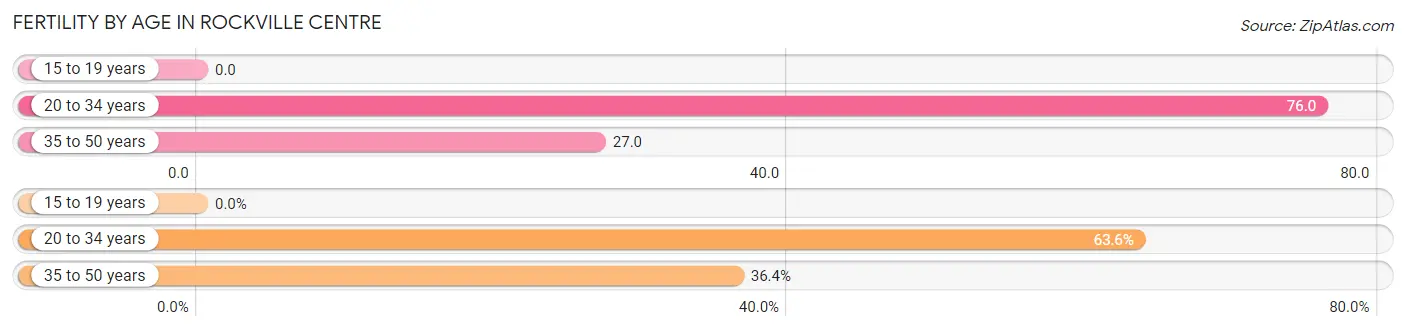
| Age Bracket | Women with Births | Births / 1,000 Women |
| 15 to 19 years | 0 (0.0%) | 0.0 |
| 20 to 34 years | 133 (63.6%) | 76.0 |
| 35 to 50 years | 76 (36.4%) | 27.0 |
| Total | 209 (100.0%) | 37.0 |
Fertility by Age by Marriage Status in Rockville Centre
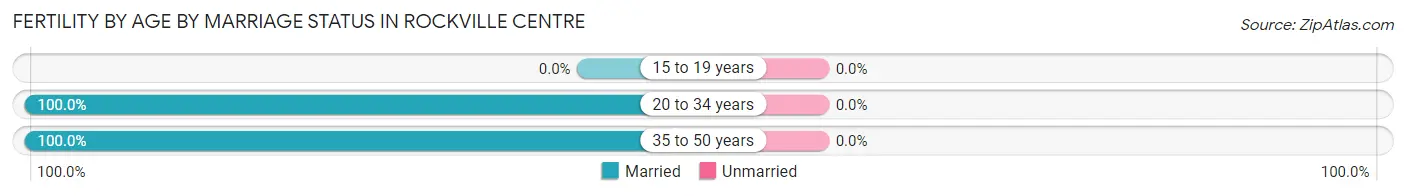
| Age Bracket | Married | Unmarried |
| 15 to 19 years | 0 (0.0%) | 0 (0.0%) |
| 20 to 34 years | 133 (100.0%) | 0 (0.0%) |
| 35 to 50 years | 76 (100.0%) | 0 (0.0%) |
| Total | 209 (100.0%) | 0 (0.0%) |
Fertility by Education in Rockville Centre
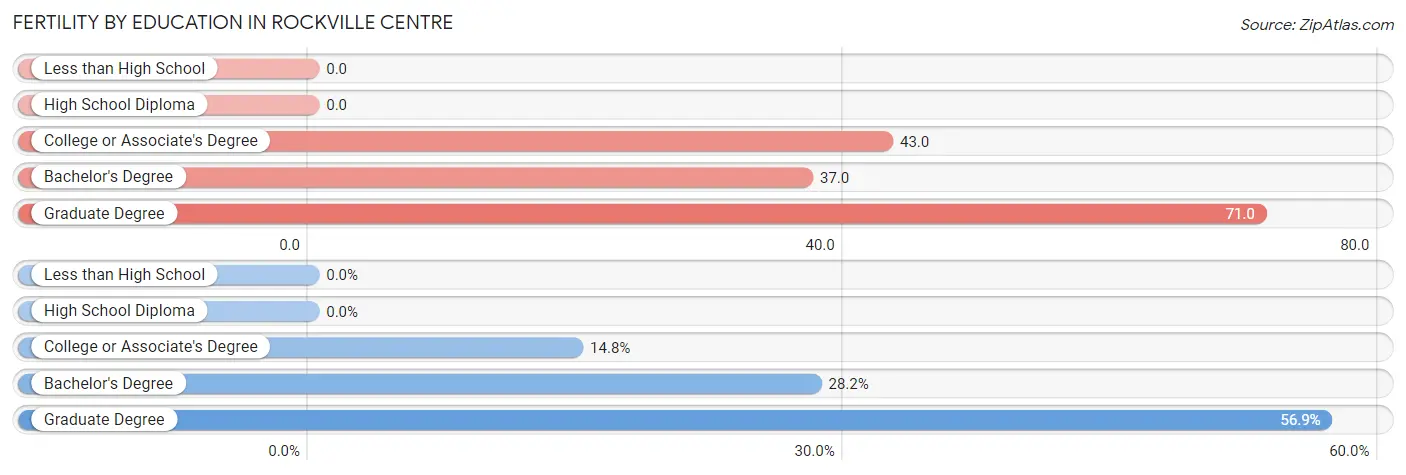
| Educational Attainment | Women with Births | Births / 1,000 Women |
| Less than High School | 0 (0.0%) | 0.0 |
| High School Diploma | 0 (0.0%) | 0.0 |
| College or Associate's Degree | 31 (14.8%) | 43.0 |
| Bachelor's Degree | 59 (28.2%) | 37.0 |
| Graduate Degree | 119 (56.9%) | 71.0 |
| Total | 209 (100.0%) | 37.0 |
Fertility by Education by Marriage Status in Rockville Centre
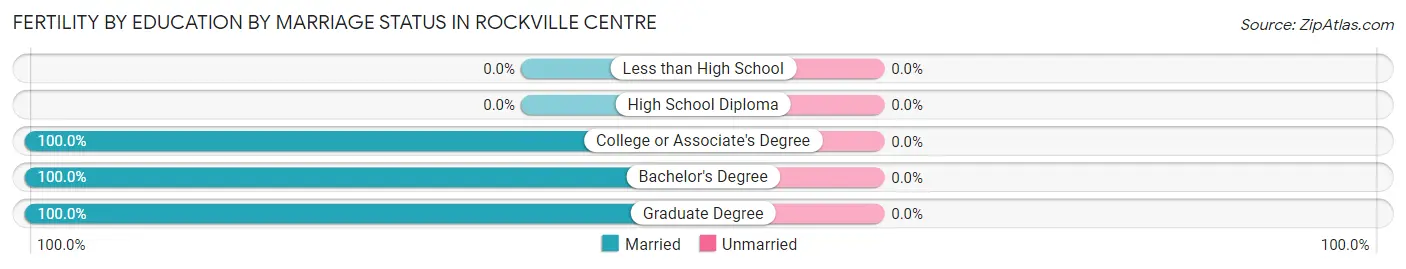
| Educational Attainment | Married | Unmarried |
| Less than High School | 0 (0.0%) | 0 (0.0%) |
| High School Diploma | 0 (0.0%) | 0 (0.0%) |
| College or Associate's Degree | 31 (100.0%) | 0 (0.0%) |
| Bachelor's Degree | 59 (100.0%) | 0 (0.0%) |
| Graduate Degree | 119 (100.0%) | 0 (0.0%) |
| Total | 209 (100.0%) | 0 (0.0%) |
Income in Rockville Centre
Income Overview in Rockville Centre
Per Capita Income in Rockville Centre is $77,776, while median incomes of families and households are $201,830 and $147,361 respectively.
| Characteristic | Number | Measure |
| Per Capita Income | 25,784 | $77,776 |
| Median Family Income | 6,733 | $201,830 |
| Mean Family Income | 6,733 | $255,166 |
| Median Household Income | 10,087 | $147,361 |
| Mean Household Income | 10,087 | $196,682 |
| Income Deficit | 6,733 | $10,402 |
| Wage / Income Gap (%) | 25,784 | 41.30% |
| Wage / Income Gap ($) | 25,784 | 58.70¢ per $1 |
| Gini / Inequality Index | 25,784 | 0.48 |
Earnings by Sex in Rockville Centre
Average Earnings in Rockville Centre are $84,693, $106,292 for men and $62,396 for women, a difference of 41.3%.
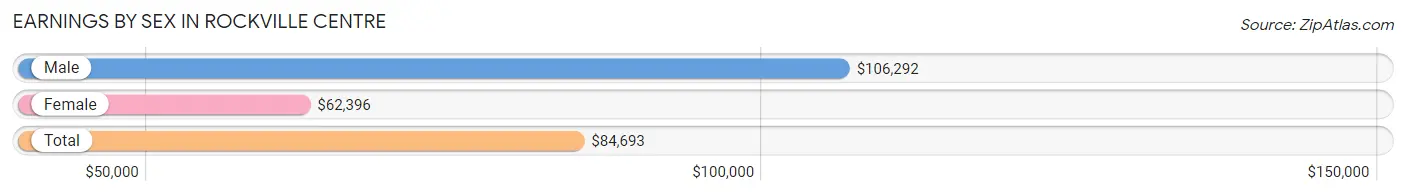
| Sex | Number | Average Earnings |
| Male | 7,041 (50.2%) | $106,292 |
| Female | 6,974 (49.8%) | $62,396 |
| Total | 14,015 (100.0%) | $84,693 |
Earnings by Sex by Income Bracket in Rockville Centre
The most common earnings brackets in Rockville Centre are $100,000+ for men (3,645 | 51.8%) and $100,000+ for women (2,450 | 35.1%).
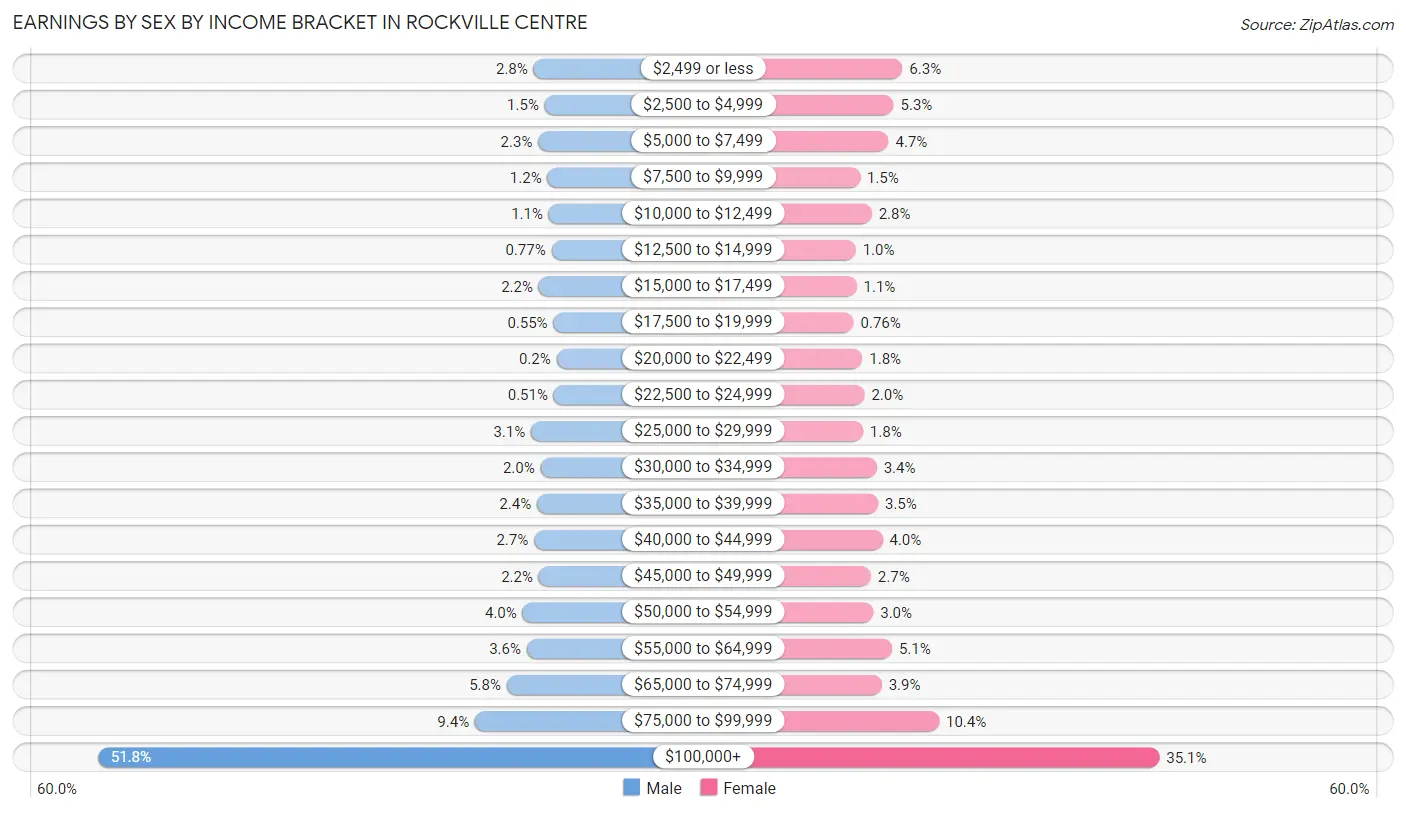
| Income | Male | Female |
| $2,499 or less | 196 (2.8%) | 436 (6.2%) |
| $2,500 to $4,999 | 108 (1.5%) | 367 (5.3%) |
| $5,000 to $7,499 | 159 (2.3%) | 328 (4.7%) |
| $7,500 to $9,999 | 86 (1.2%) | 104 (1.5%) |
| $10,000 to $12,499 | 75 (1.1%) | 195 (2.8%) |
| $12,500 to $14,999 | 54 (0.8%) | 70 (1.0%) |
| $15,000 to $17,499 | 155 (2.2%) | 77 (1.1%) |
| $17,500 to $19,999 | 39 (0.5%) | 53 (0.8%) |
| $20,000 to $22,499 | 14 (0.2%) | 122 (1.8%) |
| $22,500 to $24,999 | 36 (0.5%) | 139 (2.0%) |
| $25,000 to $29,999 | 216 (3.1%) | 126 (1.8%) |
| $30,000 to $34,999 | 141 (2.0%) | 234 (3.4%) |
| $35,000 to $39,999 | 169 (2.4%) | 245 (3.5%) |
| $40,000 to $44,999 | 192 (2.7%) | 280 (4.0%) |
| $45,000 to $49,999 | 155 (2.2%) | 189 (2.7%) |
| $50,000 to $54,999 | 283 (4.0%) | 208 (3.0%) |
| $55,000 to $64,999 | 250 (3.5%) | 354 (5.1%) |
| $65,000 to $74,999 | 408 (5.8%) | 274 (3.9%) |
| $75,000 to $99,999 | 660 (9.4%) | 723 (10.4%) |
| $100,000+ | 3,645 (51.8%) | 2,450 (35.1%) |
| Total | 7,041 (100.0%) | 6,974 (100.0%) |
Earnings by Sex by Educational Attainment in Rockville Centre
Average earnings in Rockville Centre are $115,513 for men and $76,696 for women, a difference of 33.6%. Men with an educational attainment of graduate degree enjoy the highest average annual earnings of $153,526, while those with less than high school education earn the least with $47,385. Women with an educational attainment of graduate degree earn the most with the average annual earnings of $108,315, while those with less than high school education have the smallest earnings of $23,933.
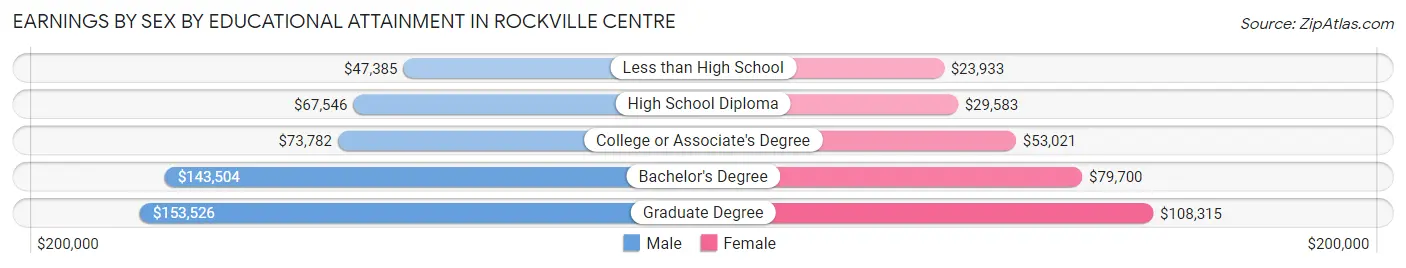
| Educational Attainment | Male Income | Female Income |
| Less than High School | $47,385 | $23,933 |
| High School Diploma | $67,546 | $29,583 |
| College or Associate's Degree | $73,782 | $53,021 |
| Bachelor's Degree | $143,504 | $79,700 |
| Graduate Degree | $153,526 | $108,315 |
| Total | $115,513 | $76,696 |
Family Income in Rockville Centre
Family Income Brackets in Rockville Centre
According to the Rockville Centre family income data, there are 3,387 families falling into the $200,000+ income range, which is the most common income bracket and makes up 50.3% of all families. Conversely, the $10,000 to $14,999 income bracket is the least frequent group with only 7 families (0.1%) belonging to this category.
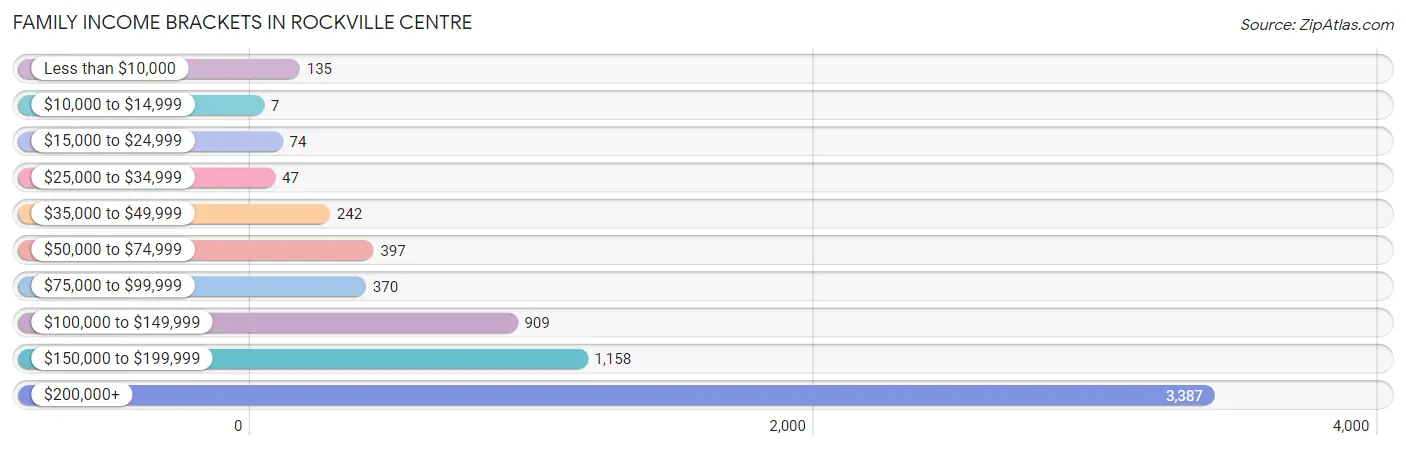
| Income Bracket | # Families | % Families |
| Less than $10,000 | 135 | 2.0% |
| $10,000 to $14,999 | 7 | 0.1% |
| $15,000 to $24,999 | 74 | 1.1% |
| $25,000 to $34,999 | 47 | 0.7% |
| $35,000 to $49,999 | 242 | 3.6% |
| $50,000 to $74,999 | 397 | 5.9% |
| $75,000 to $99,999 | 370 | 5.5% |
| $100,000 to $149,999 | 909 | 13.5% |
| $150,000 to $199,999 | 1,158 | 17.2% |
| $200,000+ | 3,387 | 50.3% |
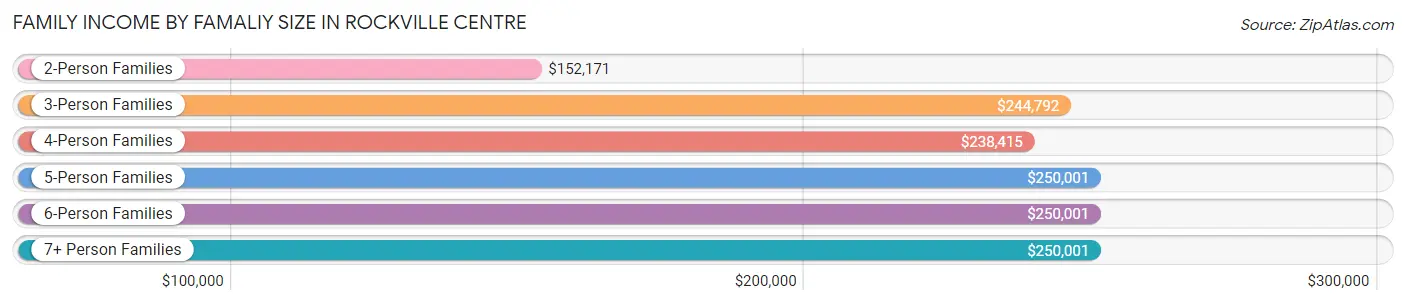
Family Income by Famaliy Size in Rockville Centre
5-person families (662 | 9.8%) account for the highest median family income in Rockville Centre with $250,001 per family, while 3-person families (1,400 | 20.8%) have the highest median income of $81,597 per family member.
| Income Bracket | # Families | Median Income |
| 2-Person Families | 2,807 (41.7%) | $152,171 |
| 3-Person Families | 1,400 (20.8%) | $244,792 |
| 4-Person Families | 1,660 (24.6%) | $238,415 |
| 5-Person Families | 662 (9.8%) | $250,001 |
| 6-Person Families | 161 (2.4%) | $250,001 |
| 7+ Person Families | 43 (0.6%) | $250,001 |
| Total | 6,733 (100.0%) | $201,830 |
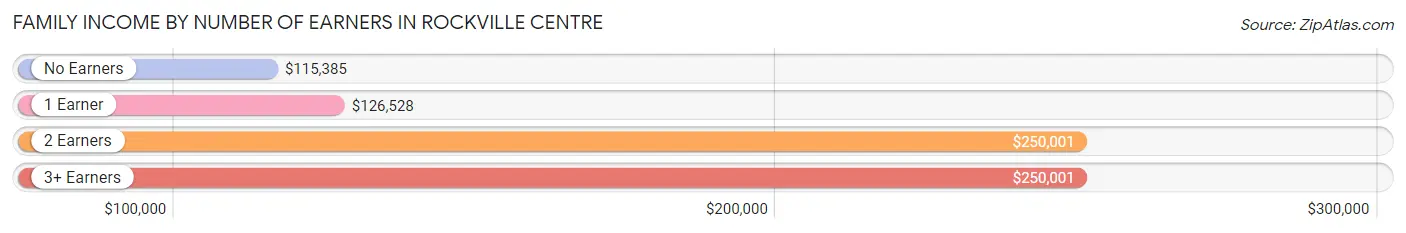
Family Income by Number of Earners in Rockville Centre
The median family income in Rockville Centre is $201,830, with families comprising 2 earners (3,346) having the highest median family income of $250,001, while families with no earners (668) have the lowest median family income of $115,385, accounting for 49.7% and 9.9% of families, respectively.
| Number of Earners | # Families | Median Income |
| No Earners | 668 (9.9%) | $115,385 |
| 1 Earner | 1,747 (26.0%) | $126,528 |
| 2 Earners | 3,346 (49.7%) | $250,001 |
| 3+ Earners | 972 (14.4%) | $250,001 |
| Total | 6,733 (100.0%) | $201,830 |
Household Income in Rockville Centre
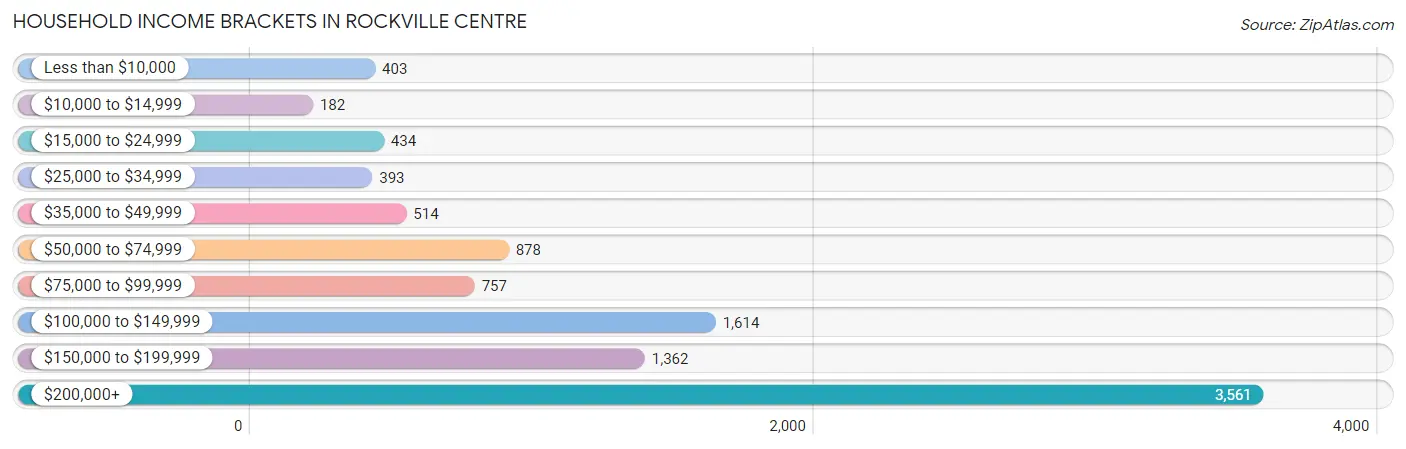
Household Income Brackets in Rockville Centre
With 3,561 households falling in the category, the $200,000+ income range is the most frequent in Rockville Centre, accounting for 35.3% of all households. In contrast, only 182 households (1.8%) fall into the $10,000 to $14,999 income bracket, making it the least populous group.
| Income Bracket | # Households | % Households |
| Less than $10,000 | 403 | 4.0% |
| $10,000 to $14,999 | 182 | 1.8% |
| $15,000 to $24,999 | 434 | 4.3% |
| $25,000 to $34,999 | 393 | 3.9% |
| $35,000 to $49,999 | 514 | 5.1% |
| $50,000 to $74,999 | 878 | 8.7% |
| $75,000 to $99,999 | 757 | 7.5% |
| $100,000 to $149,999 | 1,614 | 16.0% |
| $150,000 to $199,999 | 1,362 | 13.5% |
| $200,000+ | 3,561 | 35.3% |
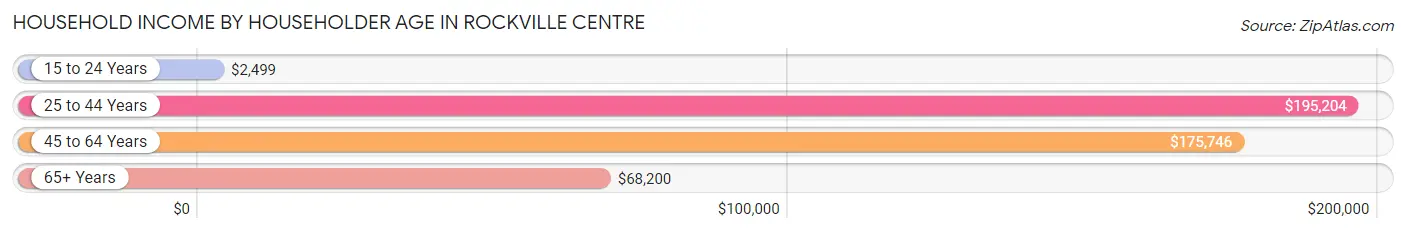
Household Income by Householder Age in Rockville Centre
The median household income in Rockville Centre is $147,361, with the highest median household income of $195,204 found in the 25 to 44 years age bracket for the primary householder. A total of 2,394 households (23.7%) fall into this category. Meanwhile, the 15 to 24 years age bracket for the primary householder has the lowest median household income of $2,499, with 64 households (0.6%) in this group.
| Income Bracket | # Households | Median Income |
| 15 to 24 Years | 64 (0.6%) | $2,499 |
| 25 to 44 Years | 2,394 (23.7%) | $195,204 |
| 45 to 64 Years | 4,235 (42.0%) | $175,746 |
| 65+ Years | 3,394 (33.7%) | $68,200 |
| Total | 10,087 (100.0%) | $147,361 |
Poverty in Rockville Centre
Income Below Poverty by Sex and Age in Rockville Centre
With 3.7% poverty level for males and 4.4% for females among the residents of Rockville Centre, 65 to 74 year old males and 75 year old and over females are the most vulnerable to poverty, with 171 males (12.7%) and 134 females (10.1%) in their respective age groups living below the poverty level.
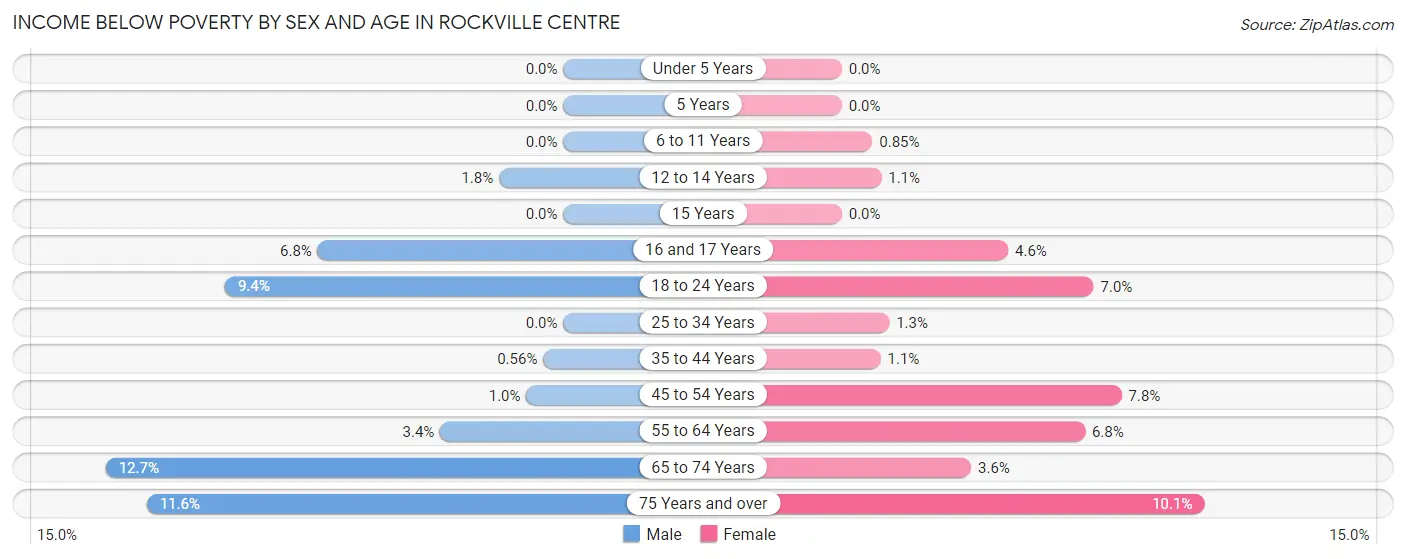
| Age Bracket | Male | Female |
| Under 5 Years | 0 (0.0%) | 0 (0.0%) |
| 5 Years | 0 (0.0%) | 0 (0.0%) |
| 6 to 11 Years | 0 (0.0%) | 7 (0.9%) |
| 12 to 14 Years | 8 (1.8%) | 6 (1.1%) |
| 15 Years | 0 (0.0%) | 0 (0.0%) |
| 16 and 17 Years | 16 (6.8%) | 17 (4.6%) |
| 18 to 24 Years | 67 (9.4%) | 64 (7.0%) |
| 25 to 34 Years | 0 (0.0%) | 16 (1.3%) |
| 35 to 44 Years | 9 (0.6%) | 20 (1.1%) |
| 45 to 54 Years | 15 (1.0%) | 125 (7.8%) |
| 55 to 64 Years | 68 (3.4%) | 148 (6.8%) |
| 65 to 74 Years | 171 (12.7%) | 55 (3.6%) |
| 75 Years and over | 100 (11.6%) | 134 (10.1%) |
| Total | 454 (3.7%) | 592 (4.4%) |
Income Above Poverty by Sex and Age in Rockville Centre
According to the poverty statistics in Rockville Centre, males aged under 5 years and females aged under 5 years are the age groups that are most secure financially, with 100.0% of males and 100.0% of females in these age groups living above the poverty line.
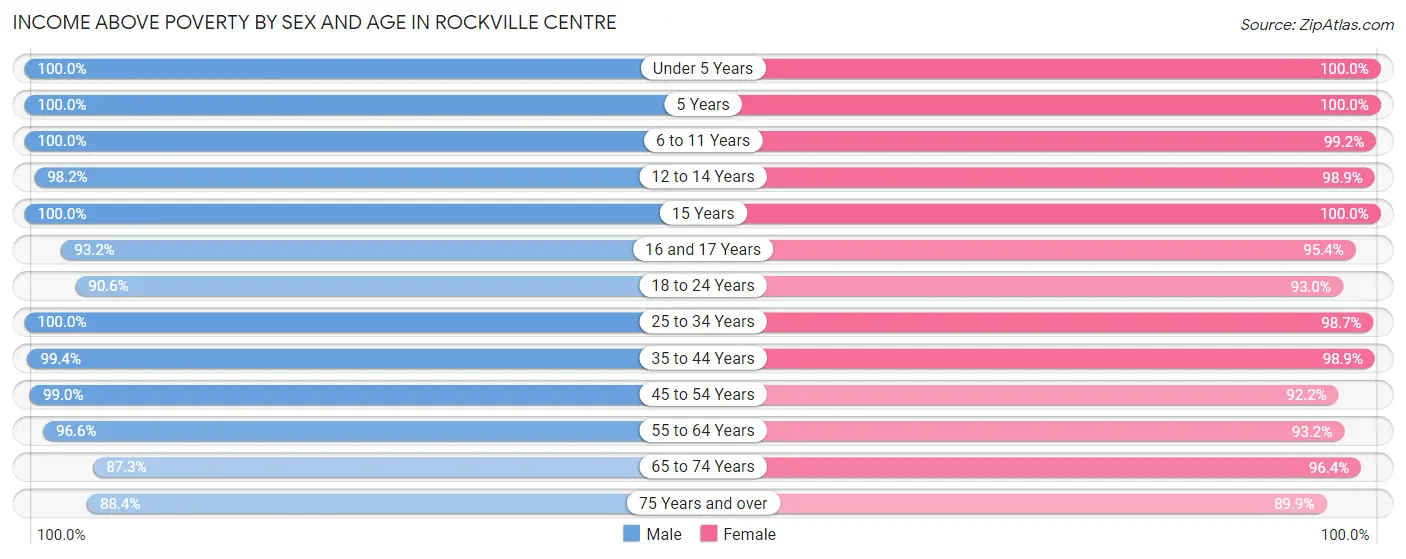
| Age Bracket | Male | Female |
| Under 5 Years | 619 (100.0%) | 648 (100.0%) |
| 5 Years | 143 (100.0%) | 93 (100.0%) |
| 6 to 11 Years | 1,291 (100.0%) | 820 (99.2%) |
| 12 to 14 Years | 439 (98.2%) | 539 (98.9%) |
| 15 Years | 278 (100.0%) | 287 (100.0%) |
| 16 and 17 Years | 218 (93.2%) | 350 (95.4%) |
| 18 to 24 Years | 644 (90.6%) | 849 (93.0%) |
| 25 to 34 Years | 1,176 (100.0%) | 1,198 (98.7%) |
| 35 to 44 Years | 1,591 (99.4%) | 1,831 (98.9%) |
| 45 to 54 Years | 1,439 (99.0%) | 1,479 (92.2%) |
| 55 to 64 Years | 1,915 (96.6%) | 2,038 (93.2%) |
| 65 to 74 Years | 1,171 (87.3%) | 1,473 (96.4%) |
| 75 Years and over | 762 (88.4%) | 1,194 (89.9%) |
| Total | 11,686 (96.3%) | 12,799 (95.6%) |
Income Below Poverty Among Married-Couple Families in Rockville Centre
The poverty statistics for married-couple families in Rockville Centre show that 2.5% or 139 of the total 5,544 families live below the poverty line. Families with no children have the highest poverty rate of 4.0%, comprising of 117 families. On the other hand, families with 3 or 4 children have the lowest poverty rate of 0.0%, which includes 0 families.
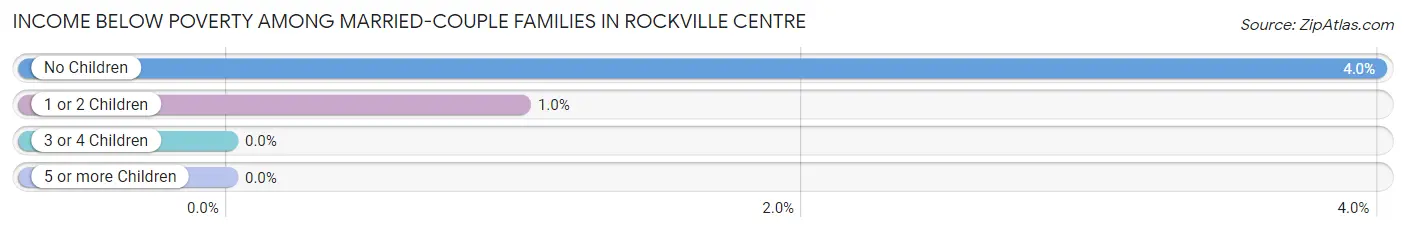
| Children | Above Poverty | Below Poverty |
| No Children | 2,808 (96.0%) | 117 (4.0%) |
| 1 or 2 Children | 2,137 (99.0%) | 22 (1.0%) |
| 3 or 4 Children | 451 (100.0%) | 0 (0.0%) |
| 5 or more Children | 9 (100.0%) | 0 (0.0%) |
| Total | 5,405 (97.5%) | 139 (2.5%) |
Income Below Poverty Among Single-Parent Households in Rockville Centre
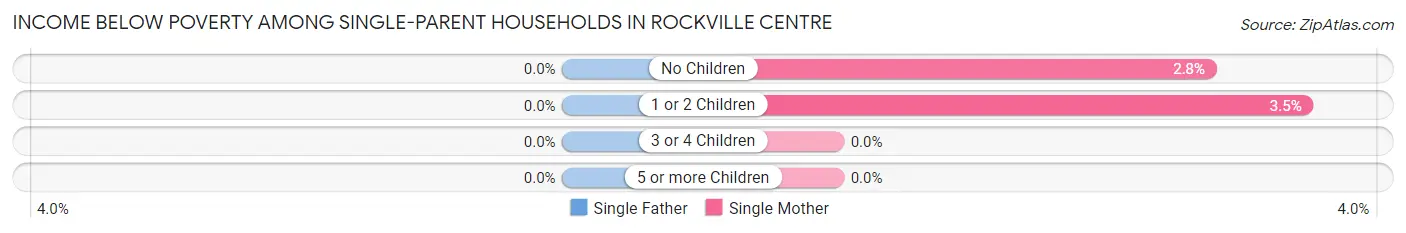
| Children | Single Father | Single Mother |
| No Children | 0 (0.0%) | 10 (2.8%) |
| 1 or 2 Children | 0 (0.0%) | 14 (3.5%) |
| 3 or 4 Children | 0 (0.0%) | 0 (0.0%) |
| 5 or more Children | 0 (0.0%) | 0 (0.0%) |
| Total | 0 (0.0%) | 24 (3.1%) |
Income Below Poverty Among Married-Couple vs Single-Parent Households in Rockville Centre
The poverty data for Rockville Centre shows that 139 of the married-couple family households (2.5%) and 24 of the single-parent households (2.0%) are living below the poverty level. Within the married-couple family households, those with no children have the highest poverty rate, with 117 households (4.0%) falling below the poverty line. Among the single-parent households, those with 1 or 2 children have the highest poverty rate, with 14 household (2.4%) living below poverty.
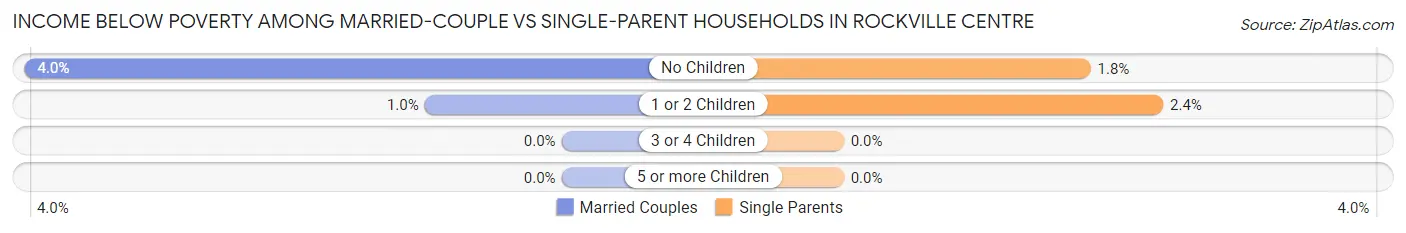
| Children | Married-Couple Families | Single-Parent Households |
| No Children | 117 (4.0%) | 10 (1.8%) |
| 1 or 2 Children | 22 (1.0%) | 14 (2.4%) |
| 3 or 4 Children | 0 (0.0%) | 0 (0.0%) |
| 5 or more Children | 0 (0.0%) | 0 (0.0%) |
| Total | 139 (2.5%) | 24 (2.0%) |
Employment Characteristics in Rockville Centre
Employment by Class of Employer in Rockville Centre
Among the 12,570 employed individuals in Rockville Centre, private company employees (7,672 | 61.0%), local government employees (1,841 | 14.6%), and not-for-profit organizations (980 | 7.8%) make up the most common classes of employment.
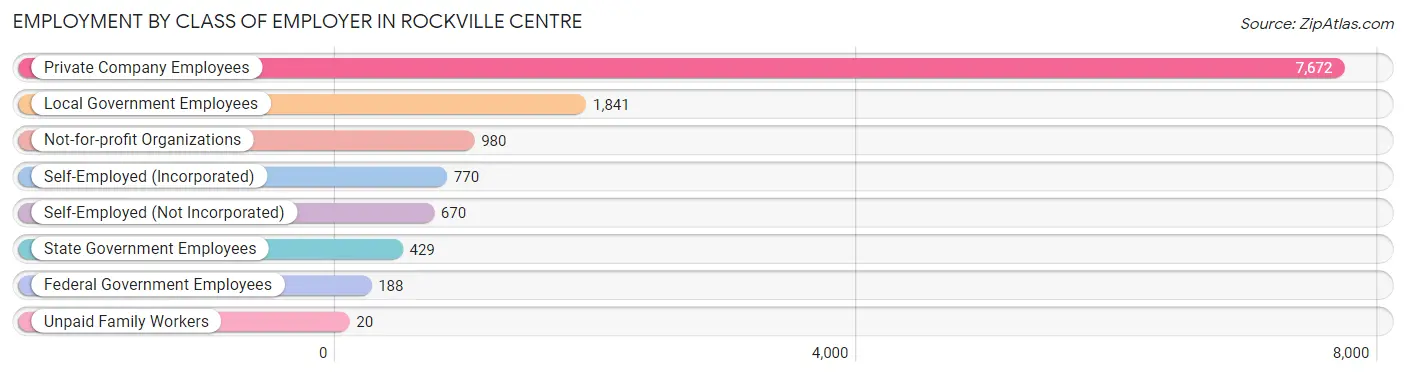
| Employer Class | # Employees | % Employees |
| Private Company Employees | 7,672 | 61.0% |
| Self-Employed (Incorporated) | 770 | 6.1% |
| Self-Employed (Not Incorporated) | 670 | 5.3% |
| Not-for-profit Organizations | 980 | 7.8% |
| Local Government Employees | 1,841 | 14.6% |
| State Government Employees | 429 | 3.4% |
| Federal Government Employees | 188 | 1.5% |
| Unpaid Family Workers | 20 | 0.2% |
| Total | 12,570 | 100.0% |
Employment Status by Age in Rockville Centre
According to the labor force statistics for Rockville Centre, out of the total population over 16 years of age (20,591), 65.6% or 13,508 individuals are in the labor force, with 5.1% or 689 of them unemployed. The age group with the highest labor force participation rate is 30 to 34 years, with 96.3% or 1,219 individuals in the labor force. Within the labor force, the 75 years and over age range has the highest percentage of unemployed individuals, with 26.0% or 59 of them being unemployed.
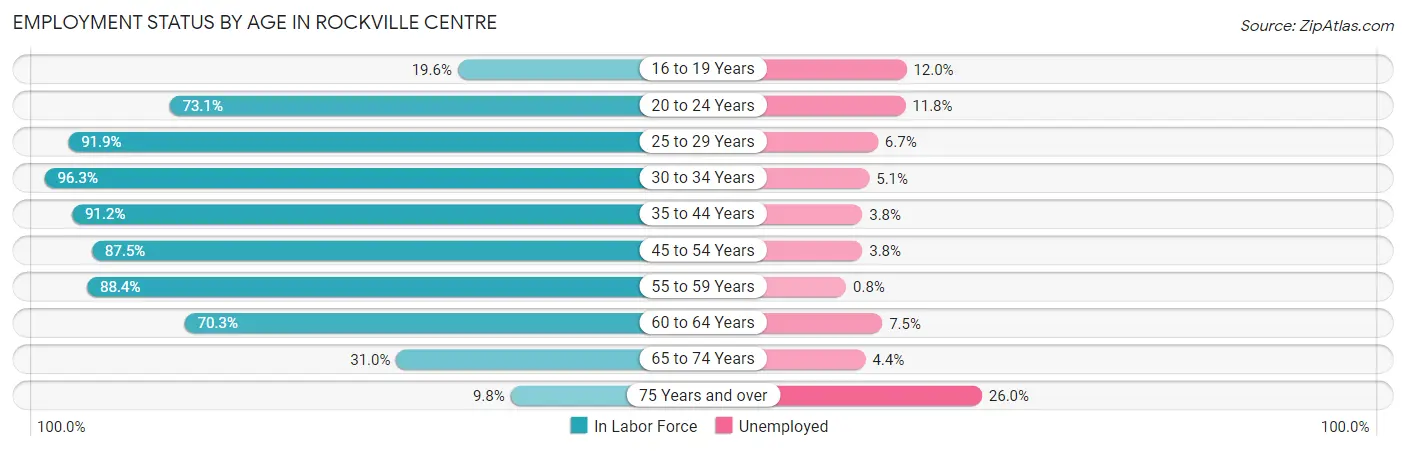
| Age Bracket | In Labor Force | Unemployed |
| 16 to 19 Years | 250 (19.6%) | 30 (12.0%) |
| 20 to 24 Years | 721 (73.1%) | 85 (11.8%) |
| 25 to 29 Years | 1,033 (91.9%) | 69 (6.7%) |
| 30 to 34 Years | 1,219 (96.3%) | 62 (5.1%) |
| 35 to 44 Years | 3,147 (91.2%) | 120 (3.8%) |
| 45 to 54 Years | 2,691 (87.5%) | 102 (3.8%) |
| 55 to 59 Years | 1,912 (88.4%) | 15 (0.8%) |
| 60 to 64 Years | 1,417 (70.3%) | 106 (7.5%) |
| 65 to 74 Years | 901 (31.0%) | 40 (4.4%) |
| 75 Years and over | 228 (9.8%) | 59 (26.0%) |
| Total | 13,508 (65.6%) | 689 (5.1%) |
Employment Status by Educational Attainment in Rockville Centre
According to labor force statistics for Rockville Centre, 87.2% of individuals (11,419) out of the total population between 25 and 64 years of age (13,095) are in the labor force, with 4.2% or 480 of them being unemployed. The group with the highest labor force participation rate are those with the educational attainment of bachelor's degree or higher, with 89.0% or 7,857 individuals in the labor force. Within the labor force, individuals with college / associate degree education have the highest percentage of unemployment, with 11.8% or 257 of them being unemployed.
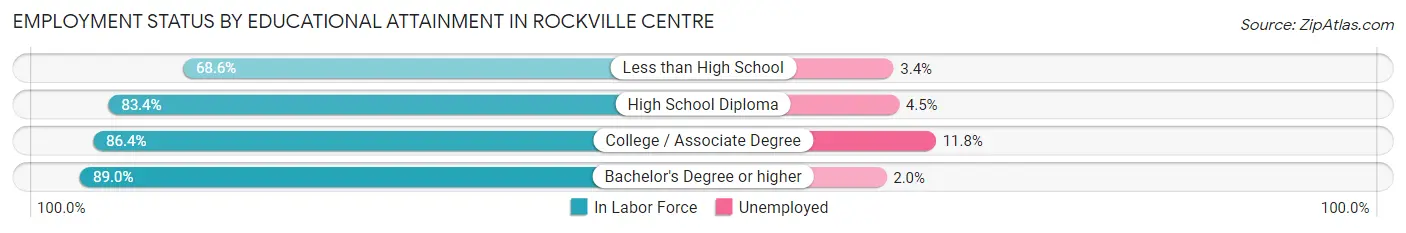
| Educational Attainment | In Labor Force | Unemployed |
| Less than High School | 324 (68.6%) | 16 (3.4%) |
| High School Diploma | 1,063 (83.4%) | 57 (4.5%) |
| College / Associate Degree | 2,177 (86.4%) | 297 (11.8%) |
| Bachelor's Degree or higher | 7,857 (89.0%) | 177 (2.0%) |
| Total | 11,419 (87.2%) | 550 (4.2%) |
Employment Occupations by Sex in Rockville Centre
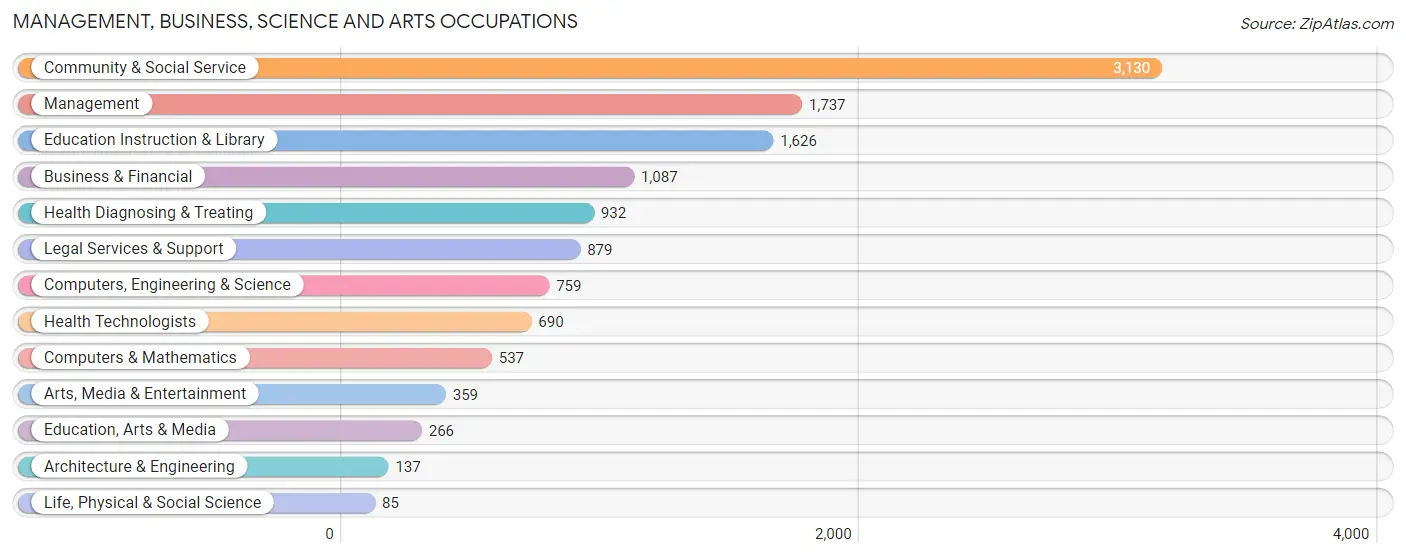
Management, Business, Science and Arts Occupations
The most common Management, Business, Science and Arts occupations in Rockville Centre are Community & Social Service (3,130 | 24.4%), Management (1,737 | 13.5%), Education Instruction & Library (1,626 | 12.7%), Business & Financial (1,087 | 8.5%), and Health Diagnosing & Treating (932 | 7.3%).
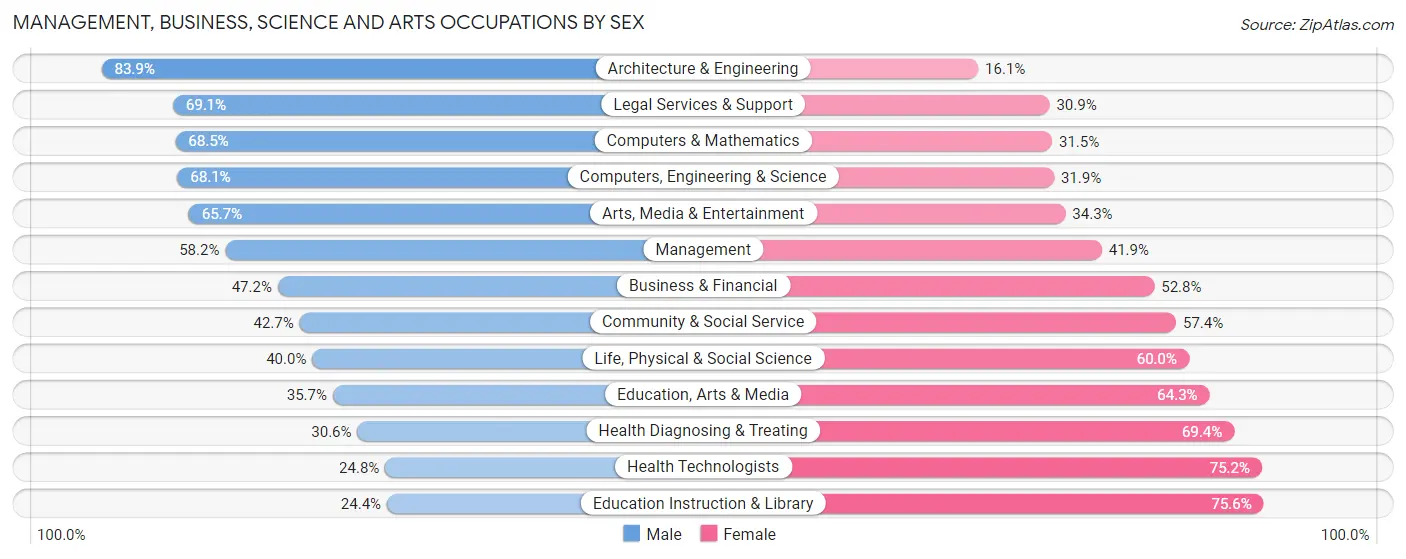
Management, Business, Science and Arts Occupations by Sex
Within the Management, Business, Science and Arts occupations in Rockville Centre, the most male-oriented occupations are Architecture & Engineering (83.9%), Legal Services & Support (69.1%), and Computers & Mathematics (68.5%), while the most female-oriented occupations are Education Instruction & Library (75.6%), Health Technologists (75.2%), and Health Diagnosing & Treating (69.4%).
| Occupation | Male | Female |
| Management | 1,010 (58.2%) | 727 (41.8%) |
| Business & Financial | 513 (47.2%) | 574 (52.8%) |
| Computers, Engineering & Science | 517 (68.1%) | 242 (31.9%) |
| Computers & Mathematics | 368 (68.5%) | 169 (31.5%) |
| Architecture & Engineering | 115 (83.9%) | 22 (16.1%) |
| Life, Physical & Social Science | 34 (40.0%) | 51 (60.0%) |
| Community & Social Service | 1,335 (42.6%) | 1,795 (57.4%) |
| Education, Arts & Media | 95 (35.7%) | 171 (64.3%) |
| Legal Services & Support | 607 (69.1%) | 272 (30.9%) |
| Education Instruction & Library | 397 (24.4%) | 1,229 (75.6%) |
| Arts, Media & Entertainment | 236 (65.7%) | 123 (34.3%) |
| Health Diagnosing & Treating | 285 (30.6%) | 647 (69.4%) |
| Health Technologists | 171 (24.8%) | 519 (75.2%) |
| Total (Category) | 3,660 (47.9%) | 3,985 (52.1%) |
| Total (Overall) | 6,434 (50.2%) | 6,394 (49.8%) |
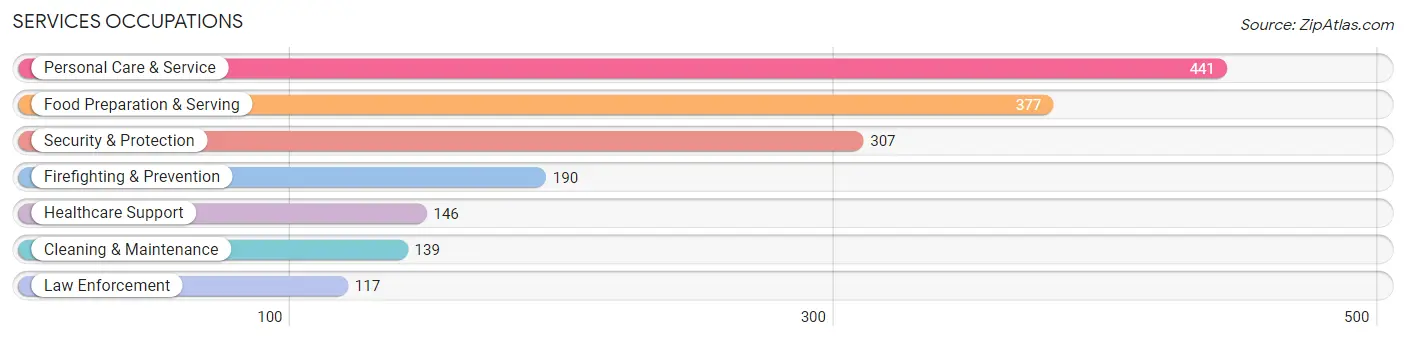
Services Occupations
The most common Services occupations in Rockville Centre are Personal Care & Service (441 | 3.4%), Food Preparation & Serving (377 | 2.9%), Security & Protection (307 | 2.4%), Firefighting & Prevention (190 | 1.5%), and Healthcare Support (146 | 1.1%).
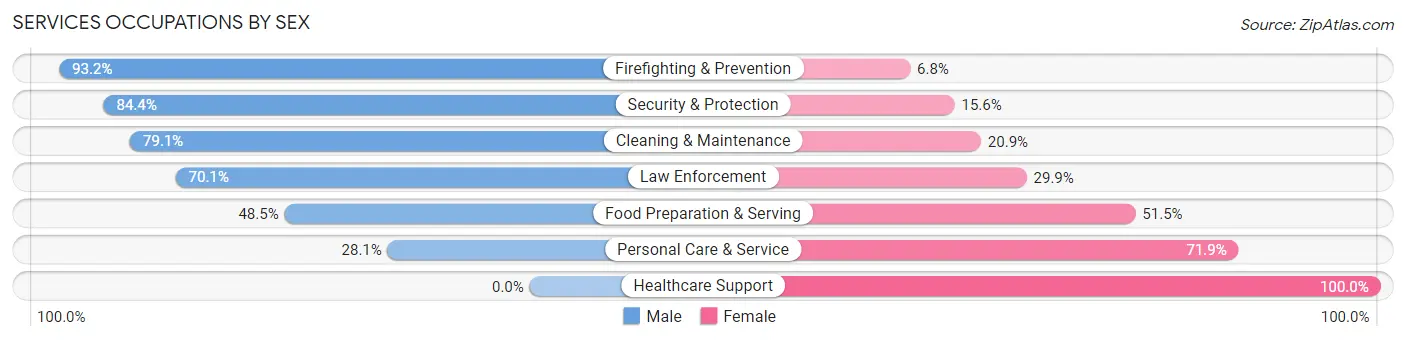
Services Occupations by Sex
Within the Services occupations in Rockville Centre, the most male-oriented occupations are Firefighting & Prevention (93.2%), Security & Protection (84.4%), and Cleaning & Maintenance (79.1%), while the most female-oriented occupations are Healthcare Support (100.0%), Personal Care & Service (71.9%), and Food Preparation & Serving (51.5%).
| Occupation | Male | Female |
| Healthcare Support | 0 (0.0%) | 146 (100.0%) |
| Security & Protection | 259 (84.4%) | 48 (15.6%) |
| Firefighting & Prevention | 177 (93.2%) | 13 (6.8%) |
| Law Enforcement | 82 (70.1%) | 35 (29.9%) |
| Food Preparation & Serving | 183 (48.5%) | 194 (51.5%) |
| Cleaning & Maintenance | 110 (79.1%) | 29 (20.9%) |
| Personal Care & Service | 124 (28.1%) | 317 (71.9%) |
| Total (Category) | 676 (47.9%) | 734 (52.1%) |
| Total (Overall) | 6,434 (50.2%) | 6,394 (49.8%) |
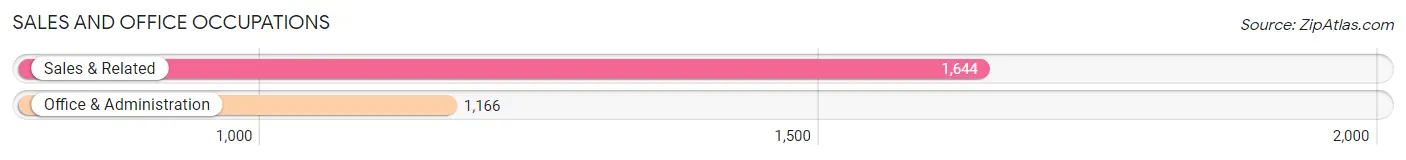
Sales and Office Occupations
The most common Sales and Office occupations in Rockville Centre are Sales & Related (1,644 | 12.8%), and Office & Administration (1,166 | 9.1%).
Sales and Office Occupations by Sex
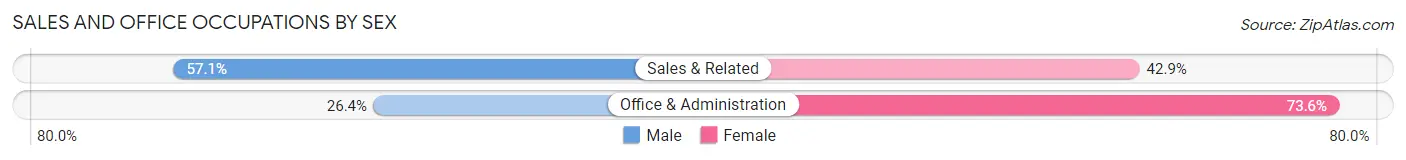
| Occupation | Male | Female |
| Sales & Related | 938 (57.1%) | 706 (42.9%) |
| Office & Administration | 308 (26.4%) | 858 (73.6%) |
| Total (Category) | 1,246 (44.3%) | 1,564 (55.7%) |
| Total (Overall) | 6,434 (50.2%) | 6,394 (49.8%) |
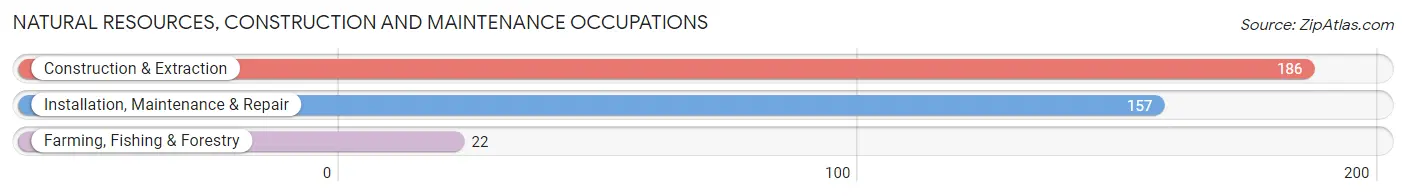
Natural Resources, Construction and Maintenance Occupations
The most common Natural Resources, Construction and Maintenance occupations in Rockville Centre are Construction & Extraction (186 | 1.5%), Installation, Maintenance & Repair (157 | 1.2%), and Farming, Fishing & Forestry (22 | 0.2%).
Natural Resources, Construction and Maintenance Occupations by Sex
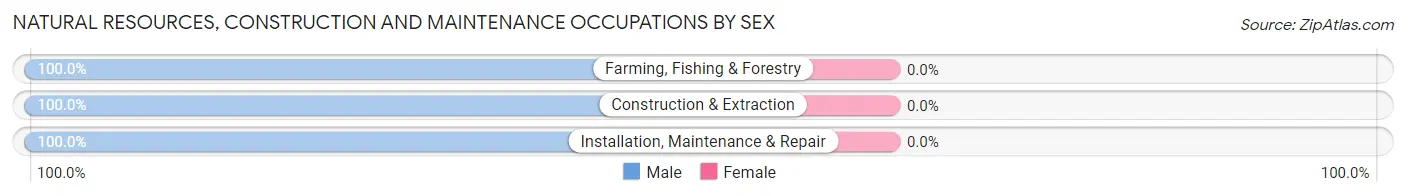
| Occupation | Male | Female |
| Farming, Fishing & Forestry | 22 (100.0%) | 0 (0.0%) |
| Construction & Extraction | 186 (100.0%) | 0 (0.0%) |
| Installation, Maintenance & Repair | 157 (100.0%) | 0 (0.0%) |
| Total (Category) | 365 (100.0%) | 0 (0.0%) |
| Total (Overall) | 6,434 (50.2%) | 6,394 (49.8%) |
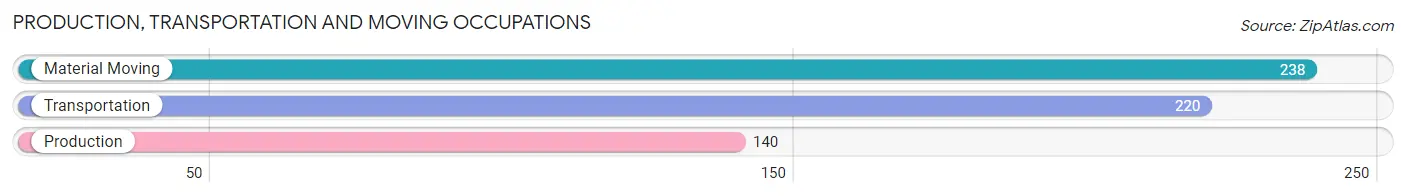
Production, Transportation and Moving Occupations
The most common Production, Transportation and Moving occupations in Rockville Centre are Material Moving (238 | 1.9%), Transportation (220 | 1.7%), and Production (140 | 1.1%).
Production, Transportation and Moving Occupations by Sex
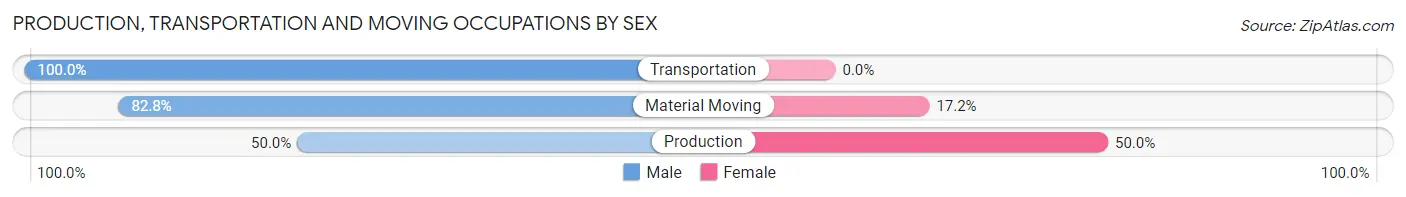
| Occupation | Male | Female |
| Production | 70 (50.0%) | 70 (50.0%) |
| Transportation | 220 (100.0%) | 0 (0.0%) |
| Material Moving | 197 (82.8%) | 41 (17.2%) |
| Total (Category) | 487 (81.4%) | 111 (18.6%) |
| Total (Overall) | 6,434 (50.2%) | 6,394 (49.8%) |
Employment Industries by Sex in Rockville Centre
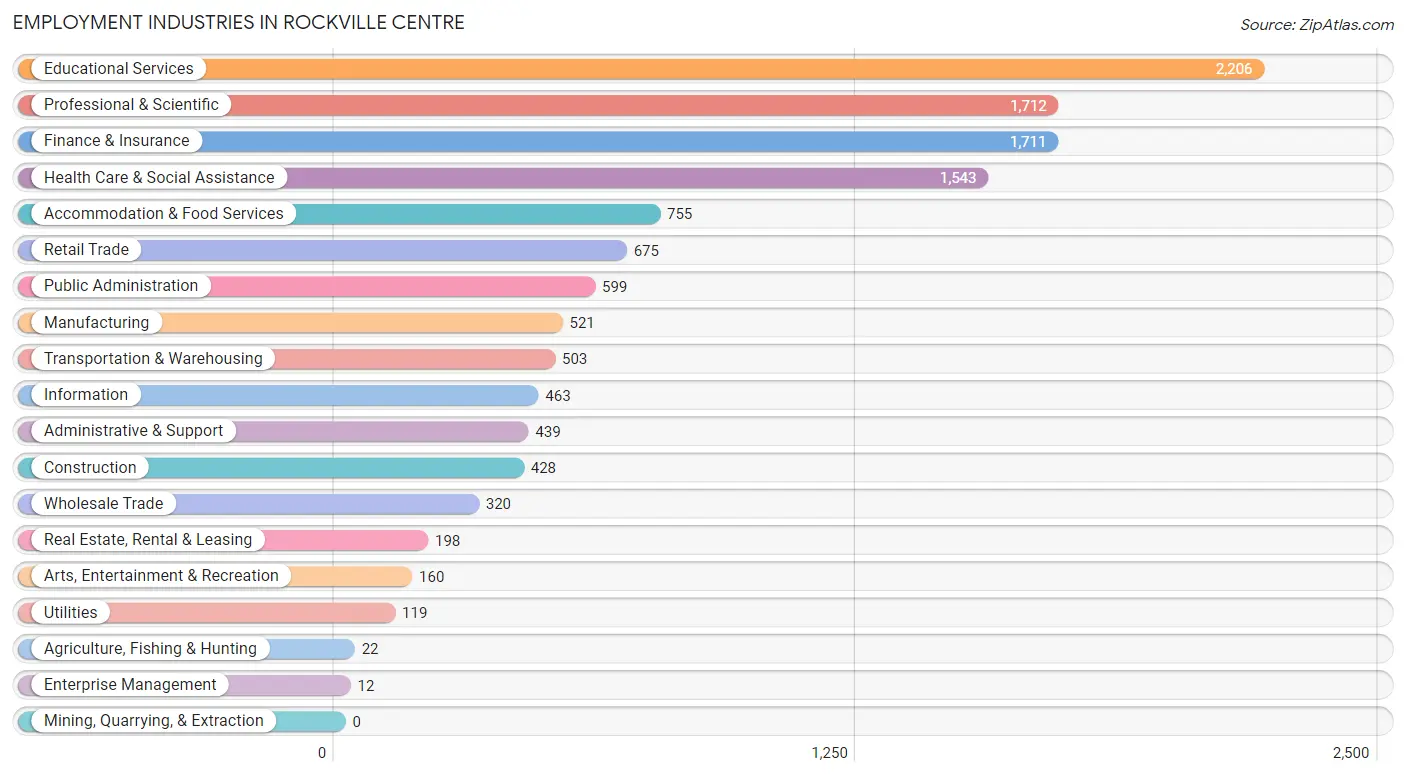
Employment Industries in Rockville Centre
The major employment industries in Rockville Centre include Educational Services (2,206 | 17.2%), Professional & Scientific (1,712 | 13.4%), Finance & Insurance (1,711 | 13.3%), Health Care & Social Assistance (1,543 | 12.0%), and Accommodation & Food Services (755 | 5.9%).
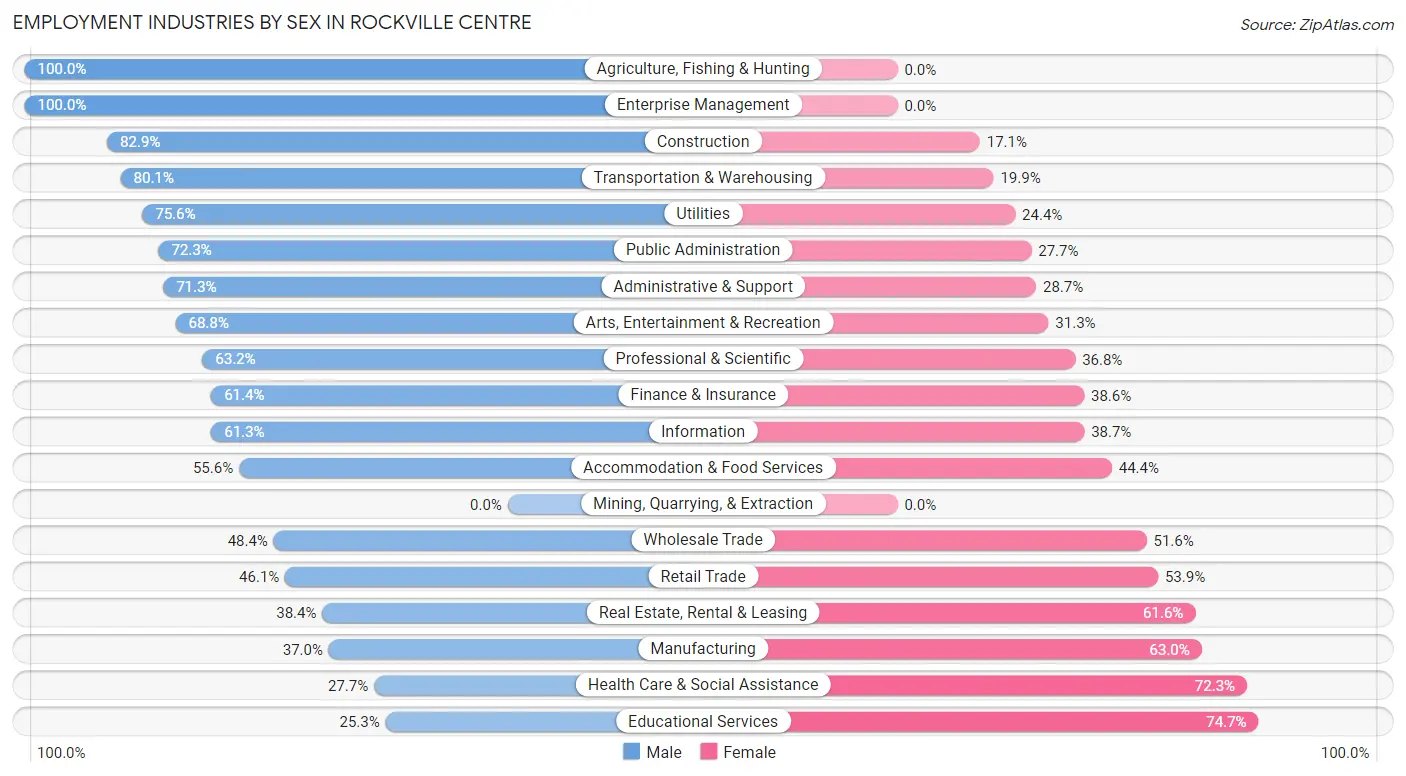
Employment Industries by Sex in Rockville Centre
The Rockville Centre industries that see more men than women are Agriculture, Fishing & Hunting (100.0%), Enterprise Management (100.0%), and Construction (82.9%), whereas the industries that tend to have a higher number of women are Educational Services (74.7%), Health Care & Social Assistance (72.3%), and Manufacturing (63.0%).
| Industry | Male | Female |
| Agriculture, Fishing & Hunting | 22 (100.0%) | 0 (0.0%) |
| Mining, Quarrying, & Extraction | 0 (0.0%) | 0 (0.0%) |
| Construction | 355 (82.9%) | 73 (17.1%) |
| Manufacturing | 193 (37.0%) | 328 (63.0%) |
| Wholesale Trade | 155 (48.4%) | 165 (51.6%) |
| Retail Trade | 311 (46.1%) | 364 (53.9%) |
| Transportation & Warehousing | 403 (80.1%) | 100 (19.9%) |
| Utilities | 90 (75.6%) | 29 (24.4%) |
| Information | 284 (61.3%) | 179 (38.7%) |
| Finance & Insurance | 1,050 (61.4%) | 661 (38.6%) |
| Real Estate, Rental & Leasing | 76 (38.4%) | 122 (61.6%) |
| Professional & Scientific | 1,082 (63.2%) | 630 (36.8%) |
| Enterprise Management | 12 (100.0%) | 0 (0.0%) |
| Administrative & Support | 313 (71.3%) | 126 (28.7%) |
| Educational Services | 558 (25.3%) | 1,648 (74.7%) |
| Health Care & Social Assistance | 427 (27.7%) | 1,116 (72.3%) |
| Arts, Entertainment & Recreation | 110 (68.8%) | 50 (31.2%) |
| Accommodation & Food Services | 420 (55.6%) | 335 (44.4%) |
| Public Administration | 433 (72.3%) | 166 (27.7%) |
| Total | 6,434 (50.2%) | 6,394 (49.8%) |
Education in Rockville Centre
School Enrollment in Rockville Centre
The most common levels of schooling among the 6,720 students in Rockville Centre are high school (1,643 | 24.4%), elementary school (1,457 | 21.7%), and middle school (1,388 | 20.6%).
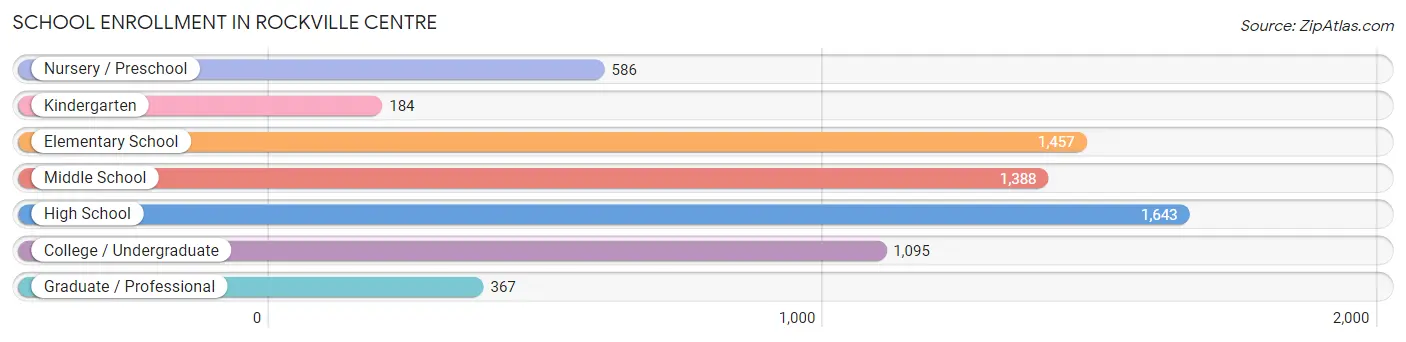
| School Level | # Students | % Students |
| Nursery / Preschool | 586 | 8.7% |
| Kindergarten | 184 | 2.7% |
| Elementary School | 1,457 | 21.7% |
| Middle School | 1,388 | 20.6% |
| High School | 1,643 | 24.4% |
| College / Undergraduate | 1,095 | 16.3% |
| Graduate / Professional | 367 | 5.5% |
| Total | 6,720 | 100.0% |
School Enrollment by Age by Funding Source in Rockville Centre
Out of a total of 6,720 students who are enrolled in schools in Rockville Centre, 1,794 (26.7%) attend a private institution, while the remaining 4,926 (73.3%) are enrolled in public schools. The age group of 3 to 4 year olds has the highest likelihood of being enrolled in private schools, with 337 (66.3% in the age bracket) enrolled. Conversely, the age group of 10 to 14 year olds has the lowest likelihood of being enrolled in a private school, with 1,458 (86.6% in the age bracket) attending a public institution.
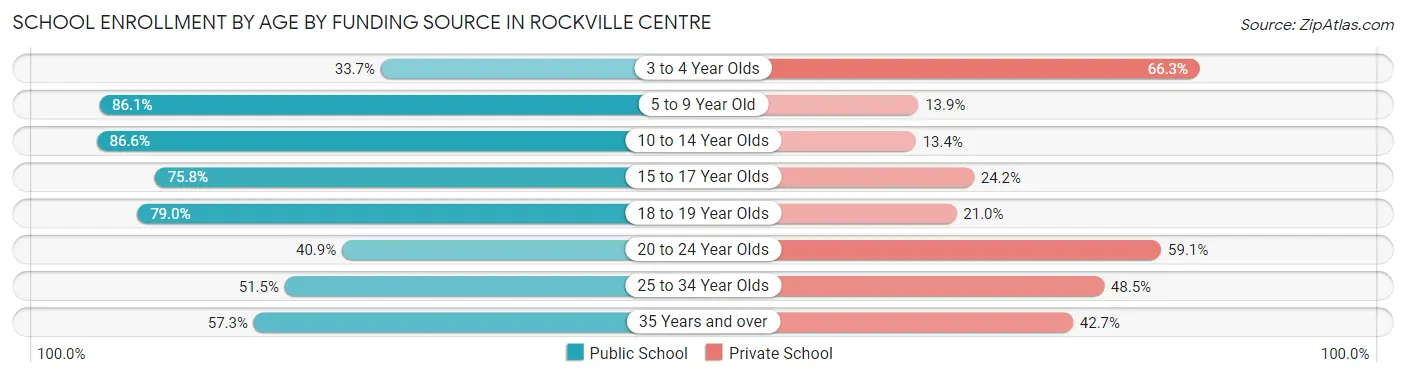
| Age Bracket | Public School | Private School |
| 3 to 4 Year Olds | 171 (33.7%) | 337 (66.3%) |
| 5 to 9 Year Old | 1,413 (86.1%) | 228 (13.9%) |
| 10 to 14 Year Olds | 1,458 (86.6%) | 226 (13.4%) |
| 15 to 17 Year Olds | 875 (75.8%) | 280 (24.2%) |
| 18 to 19 Year Olds | 463 (79.0%) | 123 (21.0%) |
| 20 to 24 Year Olds | 235 (40.9%) | 340 (59.1%) |
| 25 to 34 Year Olds | 118 (51.5%) | 111 (48.5%) |
| 35 Years and over | 196 (57.3%) | 146 (42.7%) |
| Total | 4,926 (73.3%) | 1,794 (26.7%) |
Educational Attainment by Field of Study in Rockville Centre
Business (2,873 | 23.4%), education (1,552 | 12.6%), science & technology (1,220 | 9.9%), social sciences (1,125 | 9.1%), and communications (804 | 6.5%) are the most common fields of study among 12,306 individuals in Rockville Centre who have obtained a bachelor's degree or higher.
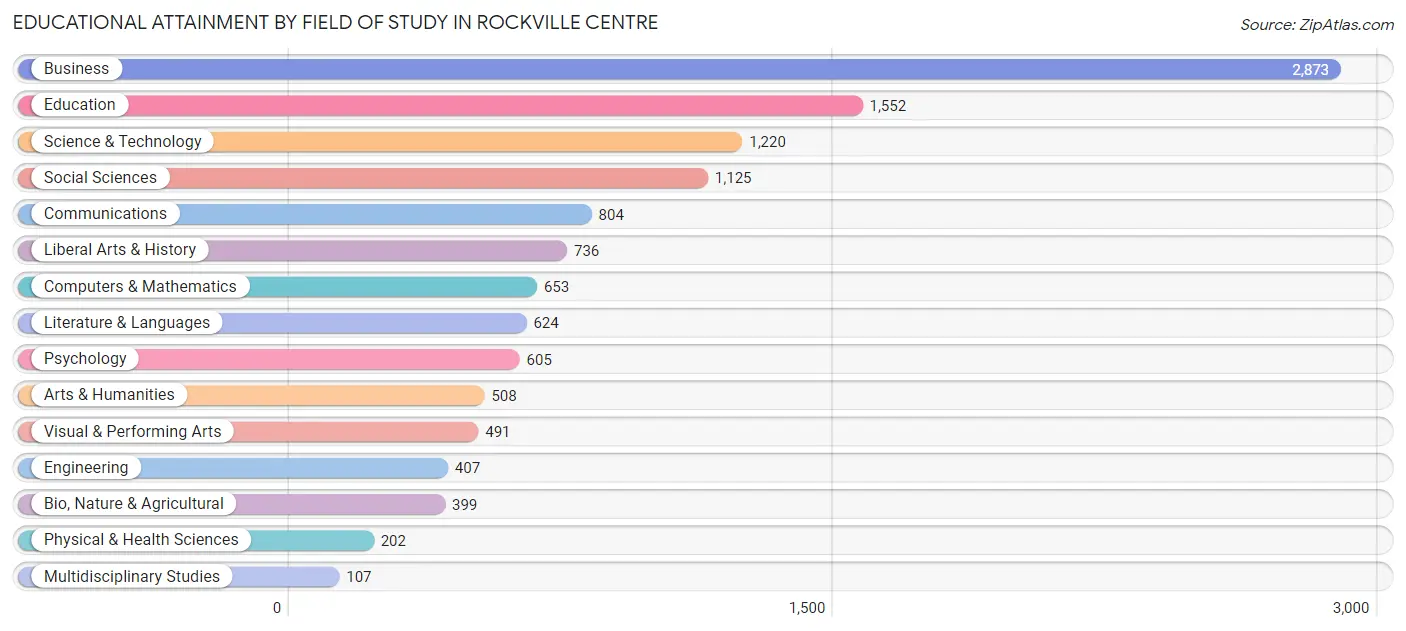
| Field of Study | # Graduates | % Graduates |
| Computers & Mathematics | 653 | 5.3% |
| Bio, Nature & Agricultural | 399 | 3.2% |
| Physical & Health Sciences | 202 | 1.6% |
| Psychology | 605 | 4.9% |
| Social Sciences | 1,125 | 9.1% |
| Engineering | 407 | 3.3% |
| Multidisciplinary Studies | 107 | 0.9% |
| Science & Technology | 1,220 | 9.9% |
| Business | 2,873 | 23.4% |
| Education | 1,552 | 12.6% |
| Literature & Languages | 624 | 5.1% |
| Liberal Arts & History | 736 | 6.0% |
| Visual & Performing Arts | 491 | 4.0% |
| Communications | 804 | 6.5% |
| Arts & Humanities | 508 | 4.1% |
| Total | 12,306 | 100.0% |
Transportation & Commute in Rockville Centre
Vehicle Availability by Sex in Rockville Centre
The most prevalent vehicle ownership categories in Rockville Centre are males with 2 vehicles (3,259, accounting for 51.6%) and females with 2 vehicles (3,045, making up 52.7%).
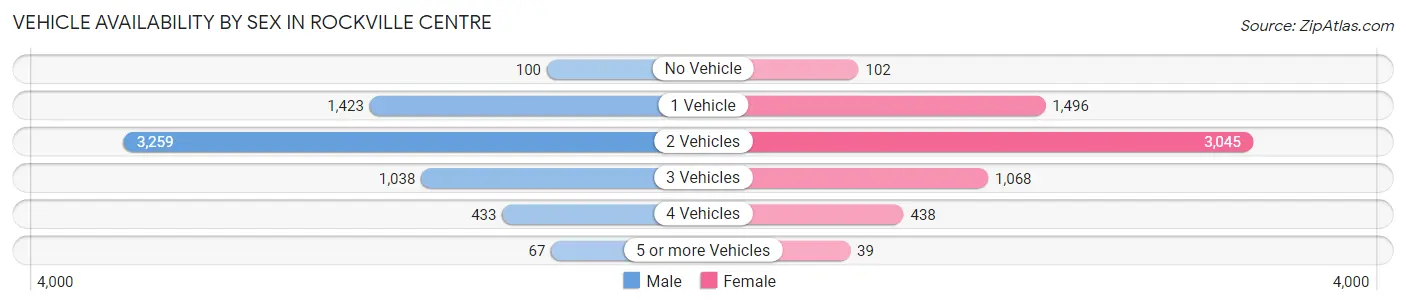
| Vehicles Available | Male | Female |
| No Vehicle | 100 (1.6%) | 102 (1.7%) |
| 1 Vehicle | 1,423 (22.5%) | 1,496 (24.2%) |
| 2 Vehicles | 3,259 (51.6%) | 3,045 (49.2%) |
| 3 Vehicles | 1,038 (16.4%) | 1,068 (17.3%) |
| 4 Vehicles | 433 (6.9%) | 438 (7.1%) |
| 5 or more Vehicles | 67 (1.1%) | 39 (0.6%) |
| Total | 6,320 (100.0%) | 6,188 (100.0%) |
Commute Time in Rockville Centre
The most frequently occuring commute durations in Rockville Centre are 60 to 89 minutes (2,215 commuters, 22.5%), 20 to 24 minutes (1,135 commuters, 11.6%), and 45 to 59 minutes (1,058 commuters, 10.8%).
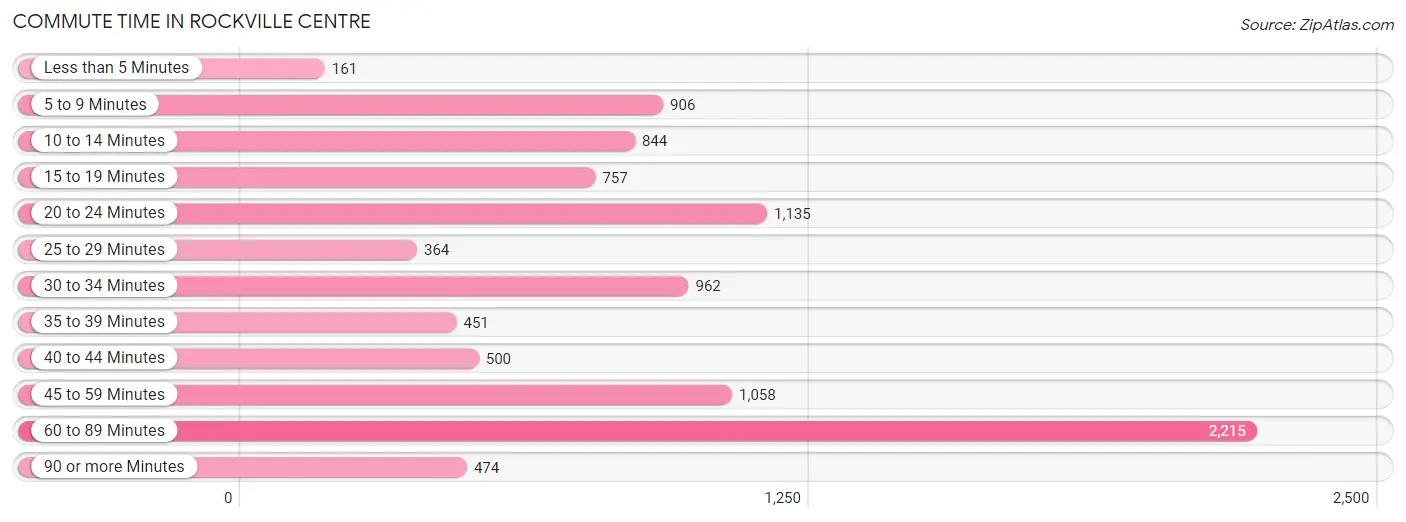
| Commute Time | # Commuters | % Commuters |
| Less than 5 Minutes | 161 | 1.6% |
| 5 to 9 Minutes | 906 | 9.2% |
| 10 to 14 Minutes | 844 | 8.6% |
| 15 to 19 Minutes | 757 | 7.7% |
| 20 to 24 Minutes | 1,135 | 11.6% |
| 25 to 29 Minutes | 364 | 3.7% |
| 30 to 34 Minutes | 962 | 9.8% |
| 35 to 39 Minutes | 451 | 4.6% |
| 40 to 44 Minutes | 500 | 5.1% |
| 45 to 59 Minutes | 1,058 | 10.8% |
| 60 to 89 Minutes | 2,215 | 22.5% |
| 90 or more Minutes | 474 | 4.8% |
Commute Time by Sex in Rockville Centre
The most common commute times in Rockville Centre are 60 to 89 minutes (1,421 commuters, 28.8%) for males and 60 to 89 minutes (794 commuters, 16.2%) for females.
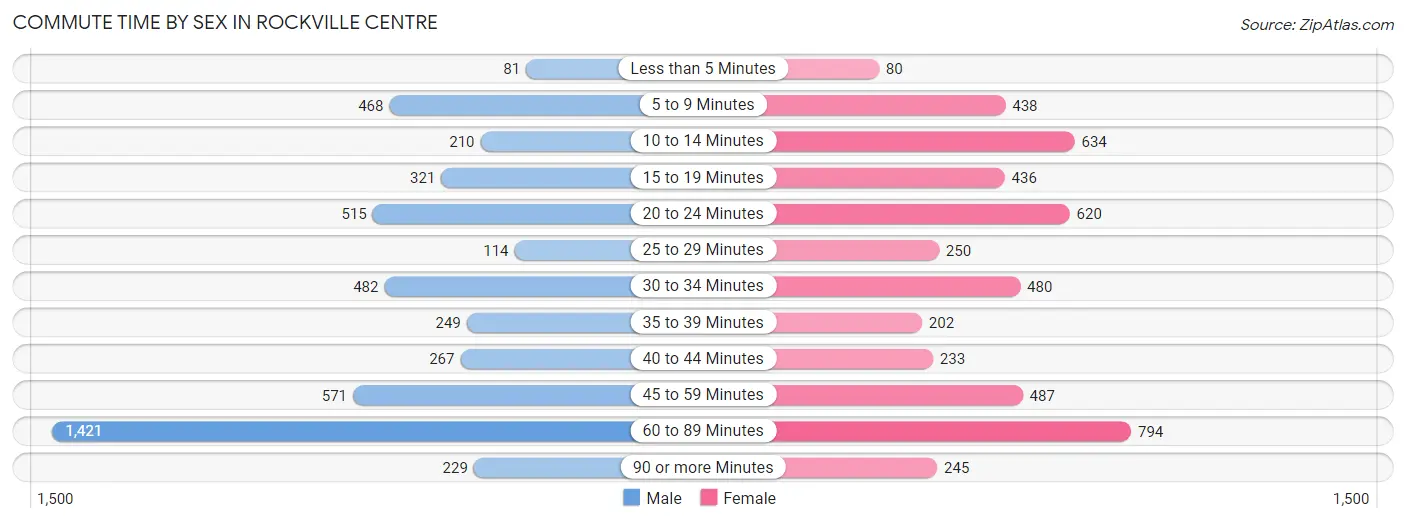
| Commute Time | Male | Female |
| Less than 5 Minutes | 81 (1.6%) | 80 (1.6%) |
| 5 to 9 Minutes | 468 (9.5%) | 438 (8.9%) |
| 10 to 14 Minutes | 210 (4.3%) | 634 (12.9%) |
| 15 to 19 Minutes | 321 (6.5%) | 436 (8.9%) |
| 20 to 24 Minutes | 515 (10.4%) | 620 (12.7%) |
| 25 to 29 Minutes | 114 (2.3%) | 250 (5.1%) |
| 30 to 34 Minutes | 482 (9.8%) | 480 (9.8%) |
| 35 to 39 Minutes | 249 (5.1%) | 202 (4.1%) |
| 40 to 44 Minutes | 267 (5.4%) | 233 (4.8%) |
| 45 to 59 Minutes | 571 (11.6%) | 487 (9.9%) |
| 60 to 89 Minutes | 1,421 (28.8%) | 794 (16.2%) |
| 90 or more Minutes | 229 (4.6%) | 245 (5.0%) |
Time of Departure to Work by Sex in Rockville Centre
The most frequent times of departure to work in Rockville Centre are 8:00 AM to 8:29 AM (821, 16.7%) for males and 7:00 AM to 7:29 AM (862, 17.6%) for females.
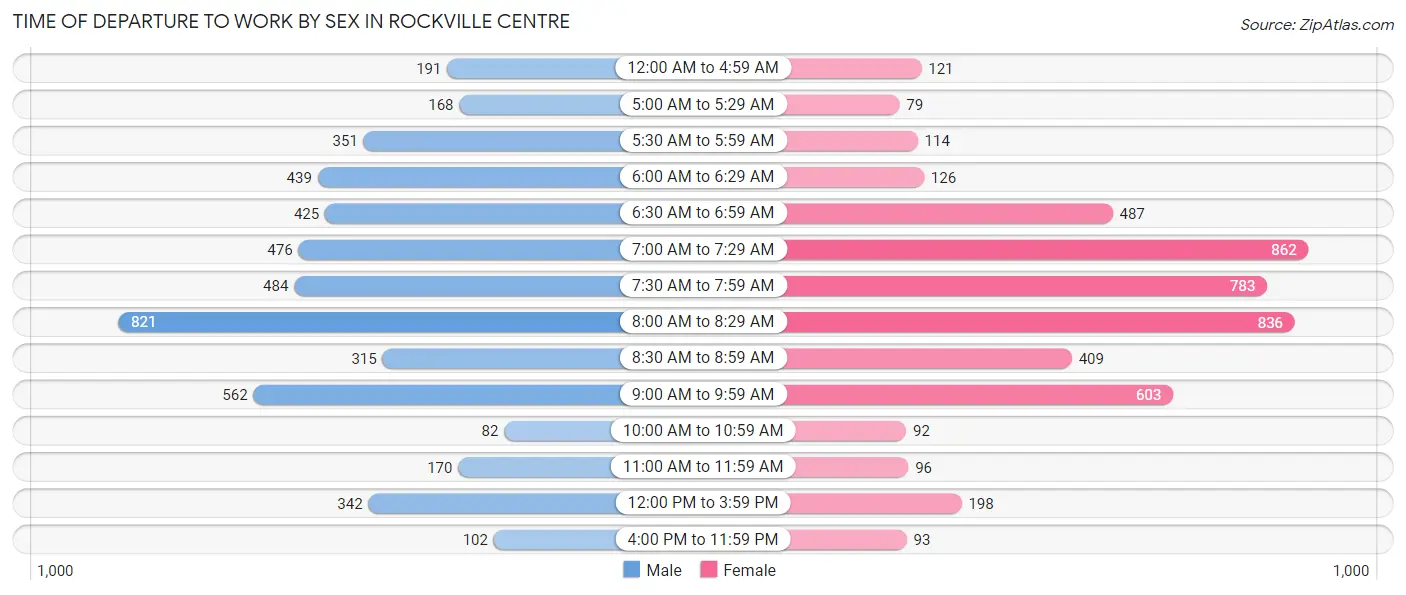
| Time of Departure | Male | Female |
| 12:00 AM to 4:59 AM | 191 (3.9%) | 121 (2.5%) |
| 5:00 AM to 5:29 AM | 168 (3.4%) | 79 (1.6%) |
| 5:30 AM to 5:59 AM | 351 (7.1%) | 114 (2.3%) |
| 6:00 AM to 6:29 AM | 439 (8.9%) | 126 (2.6%) |
| 6:30 AM to 6:59 AM | 425 (8.6%) | 487 (9.9%) |
| 7:00 AM to 7:29 AM | 476 (9.7%) | 862 (17.6%) |
| 7:30 AM to 7:59 AM | 484 (9.8%) | 783 (16.0%) |
| 8:00 AM to 8:29 AM | 821 (16.7%) | 836 (17.1%) |
| 8:30 AM to 8:59 AM | 315 (6.4%) | 409 (8.4%) |
| 9:00 AM to 9:59 AM | 562 (11.4%) | 603 (12.3%) |
| 10:00 AM to 10:59 AM | 82 (1.7%) | 92 (1.9%) |
| 11:00 AM to 11:59 AM | 170 (3.5%) | 96 (2.0%) |
| 12:00 PM to 3:59 PM | 342 (6.9%) | 198 (4.0%) |
| 4:00 PM to 11:59 PM | 102 (2.1%) | 93 (1.9%) |
| Total | 4,928 (100.0%) | 4,899 (100.0%) |
Housing Occupancy in Rockville Centre
Occupancy by Ownership in Rockville Centre
Of the total 10,087 dwellings in Rockville Centre, owner-occupied units account for 7,621 (75.5%), while renter-occupied units make up 2,466 (24.4%).
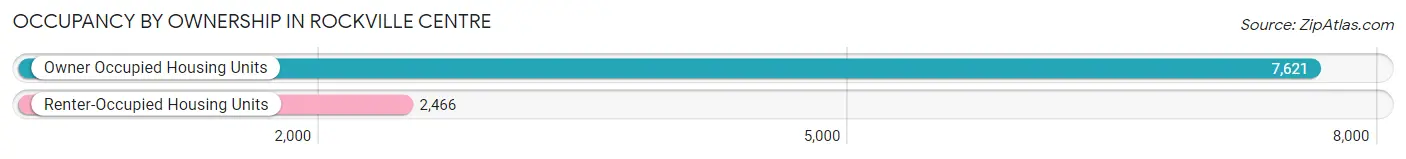
| Occupancy | # Housing Units | % Housing Units |
| Owner Occupied Housing Units | 7,621 | 75.5% |
| Renter-Occupied Housing Units | 2,466 | 24.4% |
| Total Occupied Housing Units | 10,087 | 100.0% |
Occupancy by Household Size in Rockville Centre
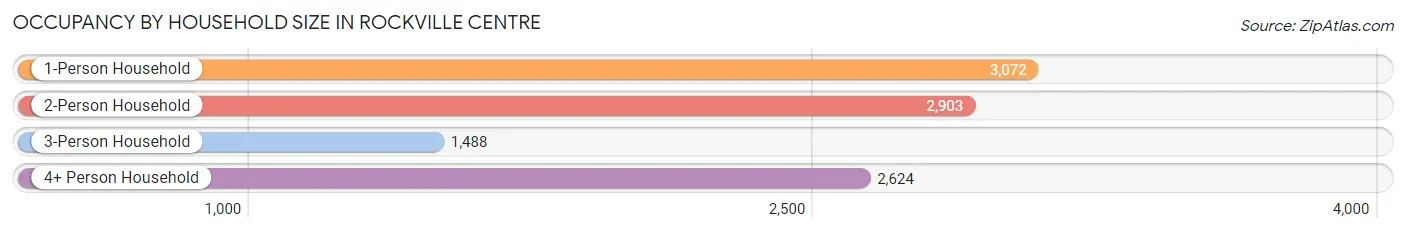
| Household Size | # Housing Units | % Housing Units |
| 1-Person Household | 3,072 | 30.5% |
| 2-Person Household | 2,903 | 28.8% |
| 3-Person Household | 1,488 | 14.7% |
| 4+ Person Household | 2,624 | 26.0% |
| Total Housing Units | 10,087 | 100.0% |
Occupancy by Ownership by Household Size in Rockville Centre
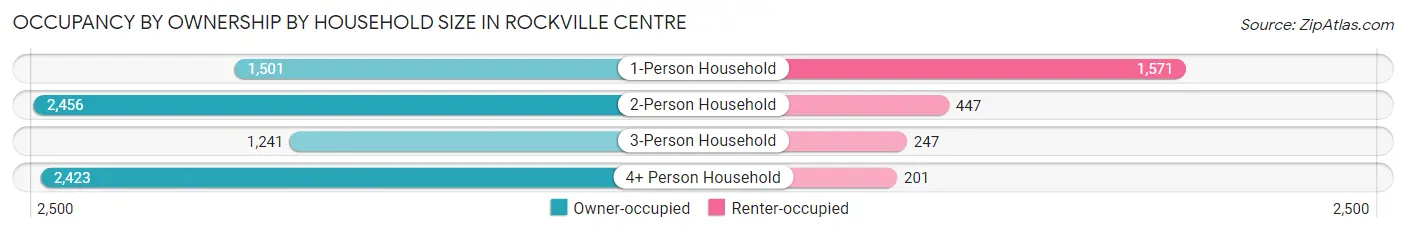
| Household Size | Owner-occupied | Renter-occupied |
| 1-Person Household | 1,501 (48.9%) | 1,571 (51.1%) |
| 2-Person Household | 2,456 (84.6%) | 447 (15.4%) |
| 3-Person Household | 1,241 (83.4%) | 247 (16.6%) |
| 4+ Person Household | 2,423 (92.3%) | 201 (7.7%) |
| Total Housing Units | 7,621 (75.5%) | 2,466 (24.4%) |
Occupancy by Educational Attainment in Rockville Centre
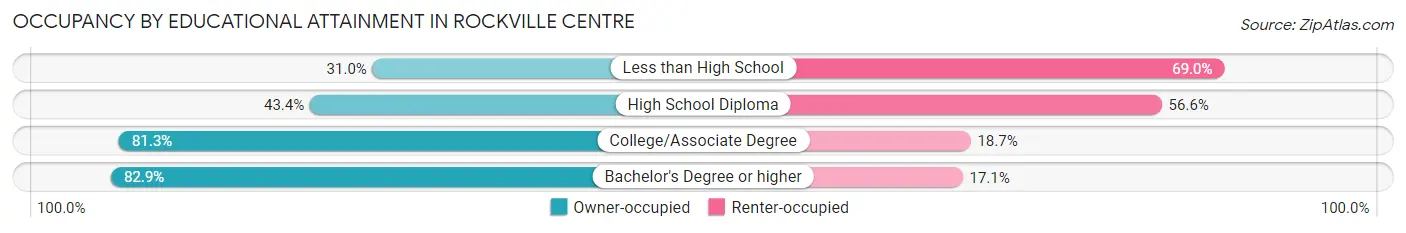
| Household Size | Owner-occupied | Renter-occupied |
| Less than High School | 110 (31.0%) | 245 (69.0%) |
| High School Diploma | 572 (43.4%) | 746 (56.6%) |
| College/Associate Degree | 1,752 (81.3%) | 403 (18.7%) |
| Bachelor's Degree or higher | 5,187 (82.9%) | 1,072 (17.1%) |
Occupancy by Age of Householder in Rockville Centre
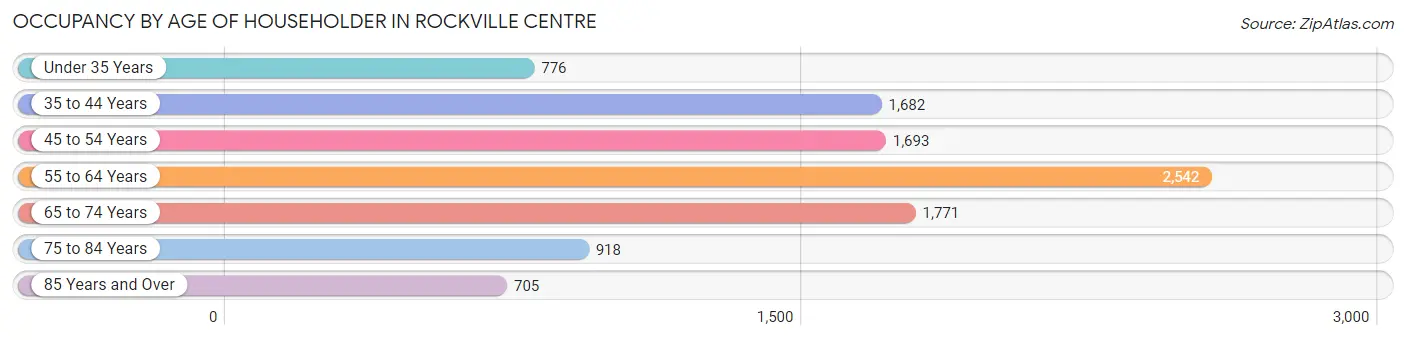
| Age Bracket | # Households | % Households |
| Under 35 Years | 776 | 7.7% |
| 35 to 44 Years | 1,682 | 16.7% |
| 45 to 54 Years | 1,693 | 16.8% |
| 55 to 64 Years | 2,542 | 25.2% |
| 65 to 74 Years | 1,771 | 17.6% |
| 75 to 84 Years | 918 | 9.1% |
| 85 Years and Over | 705 | 7.0% |
| Total | 10,087 | 100.0% |
Housing Finances in Rockville Centre
Median Income by Occupancy in Rockville Centre
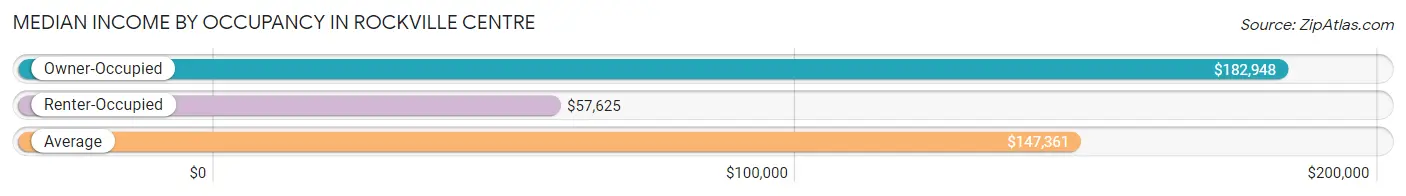
| Occupancy Type | # Households | Median Income |
| Owner-Occupied | 7,621 (75.5%) | $182,948 |
| Renter-Occupied | 2,466 (24.4%) | $57,625 |
| Average | 10,087 (100.0%) | $147,361 |
Occupancy by Householder Income Bracket in Rockville Centre
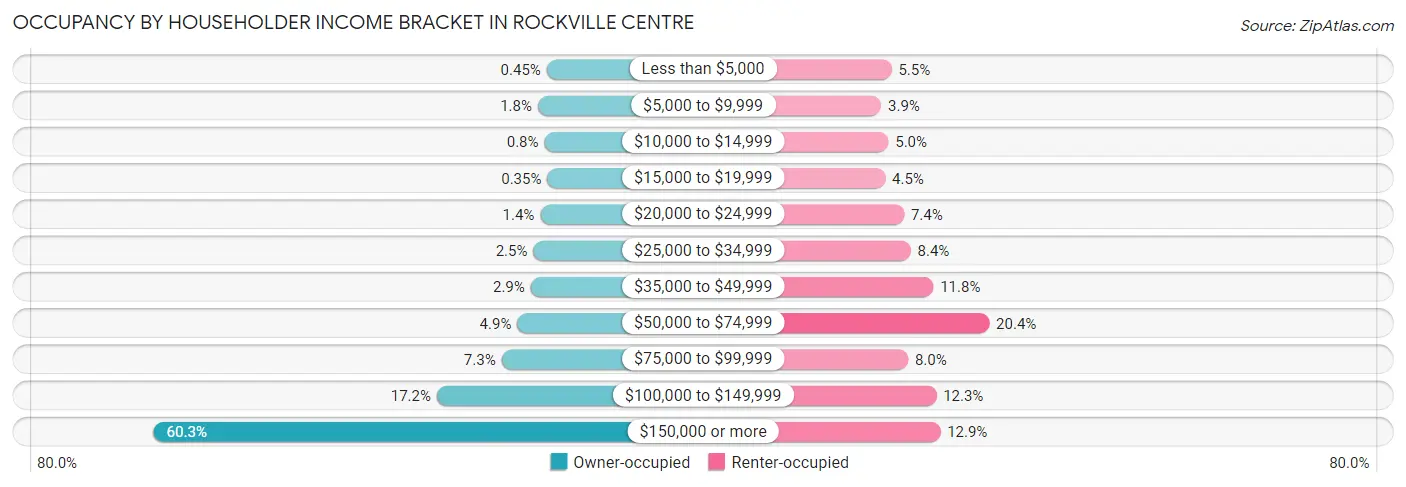
| Income Bracket | Owner-occupied | Renter-occupied |
| Less than $5,000 | 34 (0.4%) | 135 (5.5%) |
| $5,000 to $9,999 | 137 (1.8%) | 96 (3.9%) |
| $10,000 to $14,999 | 61 (0.8%) | 123 (5.0%) |
| $15,000 to $19,999 | 27 (0.4%) | 111 (4.5%) |
| $20,000 to $24,999 | 109 (1.4%) | 182 (7.4%) |
| $25,000 to $34,999 | 190 (2.5%) | 207 (8.4%) |
| $35,000 to $49,999 | 220 (2.9%) | 292 (11.8%) |
| $50,000 to $74,999 | 376 (4.9%) | 502 (20.4%) |
| $75,000 to $99,999 | 559 (7.3%) | 197 (8.0%) |
| $100,000 to $149,999 | 1,310 (17.2%) | 303 (12.3%) |
| $150,000 or more | 4,598 (60.3%) | 318 (12.9%) |
| Total | 7,621 (100.0%) | 2,466 (100.0%) |
Monthly Housing Cost Tiers in Rockville Centre
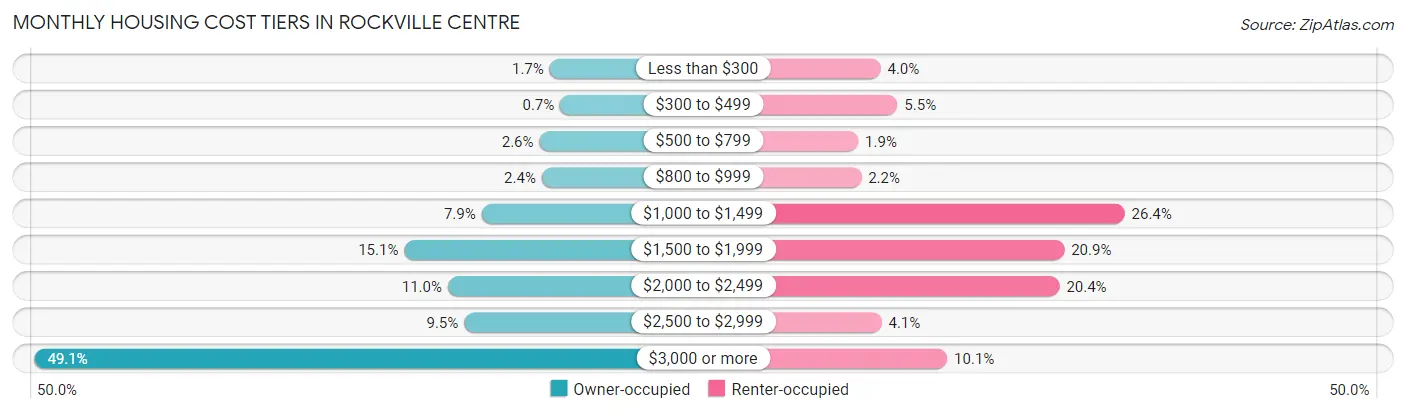
| Monthly Cost | Owner-occupied | Renter-occupied |
| Less than $300 | 127 (1.7%) | 98 (4.0%) |
| $300 to $499 | 53 (0.7%) | 136 (5.5%) |
| $500 to $799 | 199 (2.6%) | 47 (1.9%) |
| $800 to $999 | 182 (2.4%) | 54 (2.2%) |
| $1,000 to $1,499 | 604 (7.9%) | 652 (26.4%) |
| $1,500 to $1,999 | 1,147 (15.0%) | 515 (20.9%) |
| $2,000 to $2,499 | 841 (11.0%) | 504 (20.4%) |
| $2,500 to $2,999 | 727 (9.5%) | 100 (4.1%) |
| $3,000 or more | 3,741 (49.1%) | 249 (10.1%) |
| Total | 7,621 (100.0%) | 2,466 (100.0%) |
Physical Housing Characteristics in Rockville Centre
Housing Structures in Rockville Centre
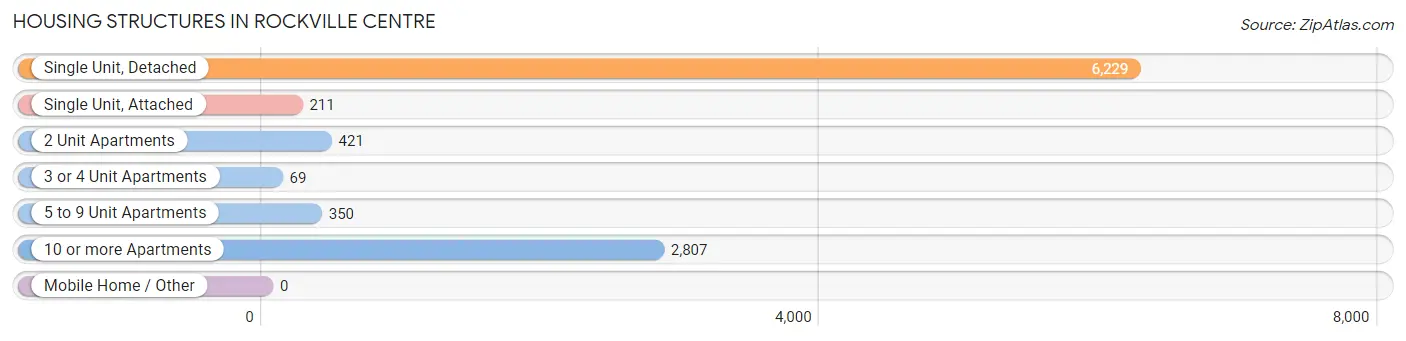
| Structure Type | # Housing Units | % Housing Units |
| Single Unit, Detached | 6,229 | 61.8% |
| Single Unit, Attached | 211 | 2.1% |
| 2 Unit Apartments | 421 | 4.2% |
| 3 or 4 Unit Apartments | 69 | 0.7% |
| 5 to 9 Unit Apartments | 350 | 3.5% |
| 10 or more Apartments | 2,807 | 27.8% |
| Mobile Home / Other | 0 | 0.0% |
| Total | 10,087 | 100.0% |
Housing Structures by Occupancy in Rockville Centre
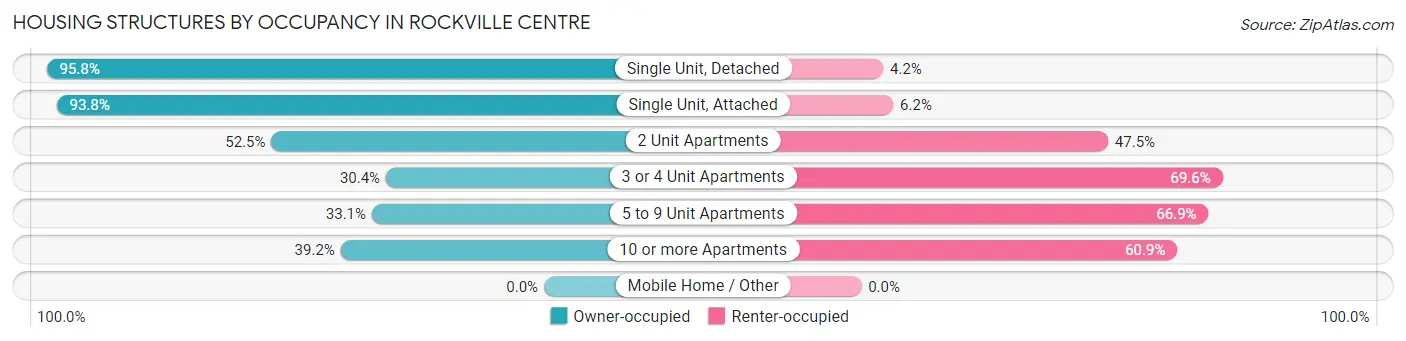
| Structure Type | Owner-occupied | Renter-occupied |
| Single Unit, Detached | 5,966 (95.8%) | 263 (4.2%) |
| Single Unit, Attached | 198 (93.8%) | 13 (6.2%) |
| 2 Unit Apartments | 221 (52.5%) | 200 (47.5%) |
| 3 or 4 Unit Apartments | 21 (30.4%) | 48 (69.6%) |
| 5 to 9 Unit Apartments | 116 (33.1%) | 234 (66.9%) |
| 10 or more Apartments | 1,099 (39.2%) | 1,708 (60.9%) |
| Mobile Home / Other | 0 (0.0%) | 0 (0.0%) |
| Total | 7,621 (75.5%) | 2,466 (24.4%) |
Housing Structures by Number of Rooms in Rockville Centre
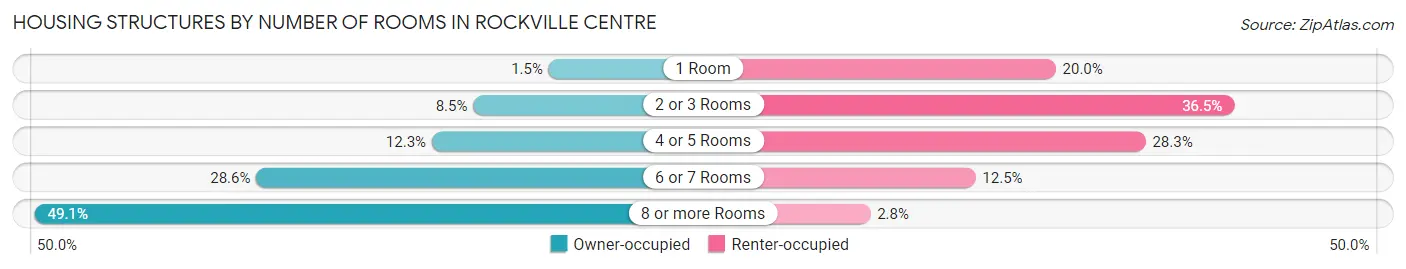
| Number of Rooms | Owner-occupied | Renter-occupied |
| 1 Room | 116 (1.5%) | 492 (20.0%) |
| 2 or 3 Rooms | 648 (8.5%) | 899 (36.5%) |
| 4 or 5 Rooms | 940 (12.3%) | 697 (28.3%) |
| 6 or 7 Rooms | 2,177 (28.6%) | 309 (12.5%) |
| 8 or more Rooms | 3,740 (49.1%) | 69 (2.8%) |
| Total | 7,621 (100.0%) | 2,466 (100.0%) |
Housing Structure by Heating Type in Rockville Centre
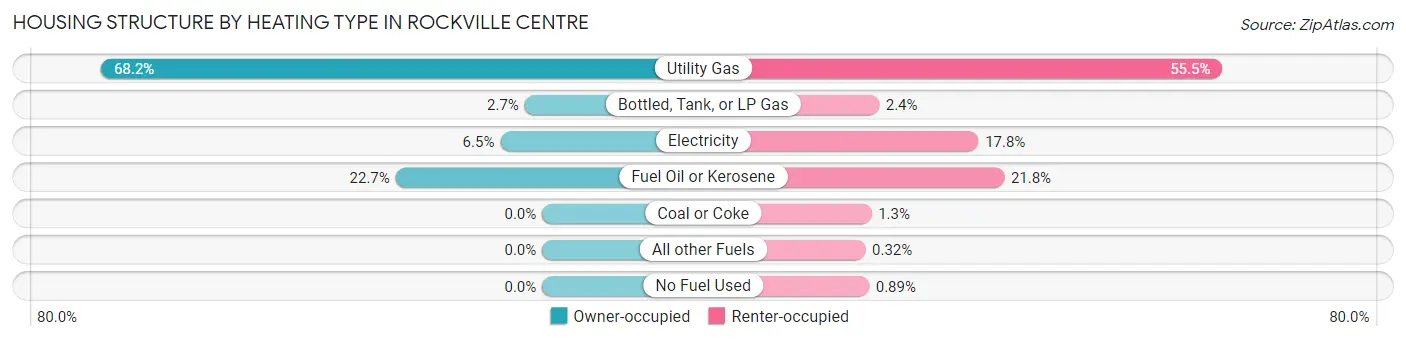
| Heating Type | Owner-occupied | Renter-occupied |
| Utility Gas | 5,197 (68.2%) | 1,369 (55.5%) |
| Bottled, Tank, or LP Gas | 205 (2.7%) | 60 (2.4%) |
| Electricity | 493 (6.5%) | 439 (17.8%) |
| Fuel Oil or Kerosene | 1,726 (22.7%) | 537 (21.8%) |
| Coal or Coke | 0 (0.0%) | 31 (1.3%) |
| All other Fuels | 0 (0.0%) | 8 (0.3%) |
| No Fuel Used | 0 (0.0%) | 22 (0.9%) |
| Total | 7,621 (100.0%) | 2,466 (100.0%) |
Household Vehicle Usage in Rockville Centre
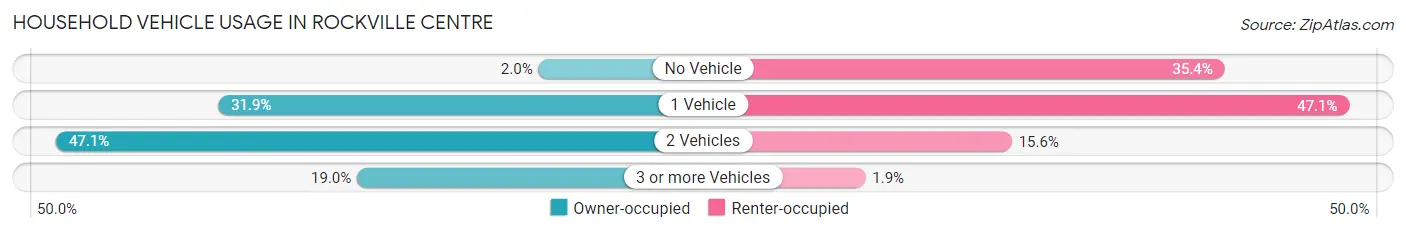
| Vehicles per Household | Owner-occupied | Renter-occupied |
| No Vehicle | 155 (2.0%) | 874 (35.4%) |
| 1 Vehicle | 2,434 (31.9%) | 1,161 (47.1%) |
| 2 Vehicles | 3,587 (47.1%) | 384 (15.6%) |
| 3 or more Vehicles | 1,445 (19.0%) | 47 (1.9%) |
| Total | 7,621 (100.0%) | 2,466 (100.0%) |
Real Estate & Mortgages in Rockville Centre
Real Estate and Mortgage Overview in Rockville Centre
| Characteristic | Without Mortgage | With Mortgage |
| Housing Units | 2,956 | 4,665 |
| Median Property Value | $674,800 | $810,100 |
| Median Household Income | $136,138 | $3,297 |
| Monthly Housing Costs | $1,501 | $3,491 |
| Real Estate Taxes | $10,001 | $184 |
Property Value by Mortgage Status in Rockville Centre
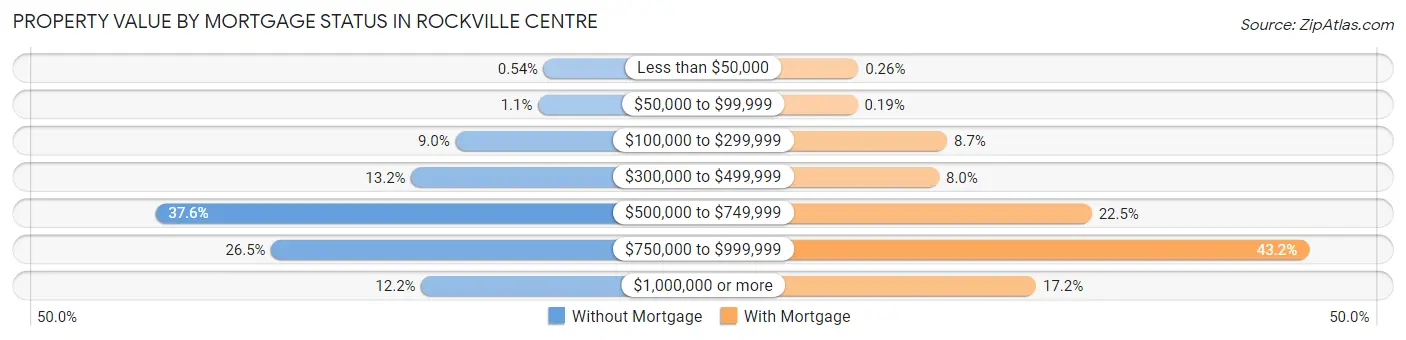
| Property Value | Without Mortgage | With Mortgage |
| Less than $50,000 | 16 (0.5%) | 12 (0.3%) |
| $50,000 to $99,999 | 32 (1.1%) | 9 (0.2%) |
| $100,000 to $299,999 | 265 (9.0%) | 407 (8.7%) |
| $300,000 to $499,999 | 389 (13.2%) | 371 (8.0%) |
| $500,000 to $749,999 | 1,110 (37.6%) | 1,049 (22.5%) |
| $750,000 to $999,999 | 783 (26.5%) | 2,015 (43.2%) |
| $1,000,000 or more | 361 (12.2%) | 802 (17.2%) |
| Total | 2,956 (100.0%) | 4,665 (100.0%) |
Household Income by Mortgage Status in Rockville Centre
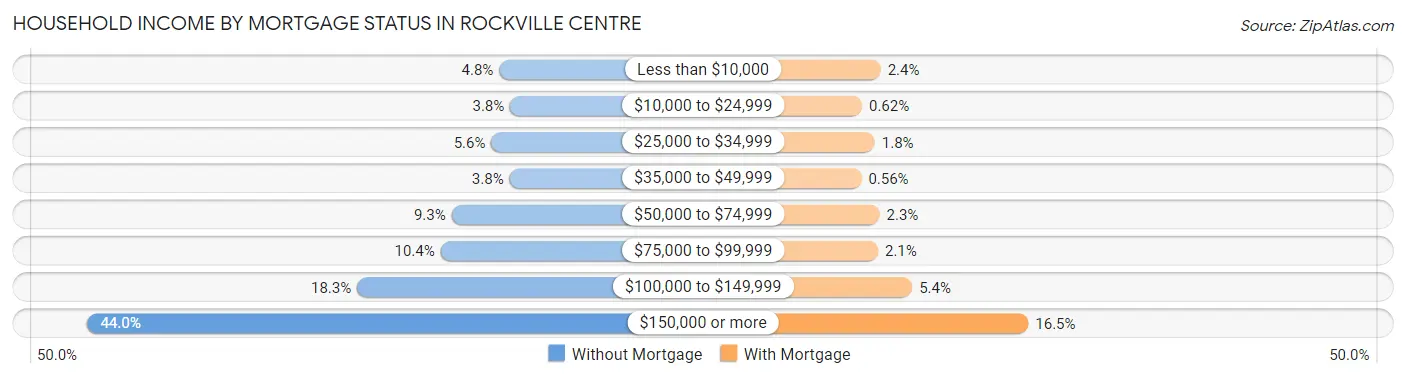
| Household Income | Without Mortgage | With Mortgage |
| Less than $10,000 | 142 (4.8%) | 112 (2.4%) |
| $10,000 to $24,999 | 111 (3.8%) | 29 (0.6%) |
| $25,000 to $34,999 | 164 (5.6%) | 86 (1.8%) |
| $35,000 to $49,999 | 113 (3.8%) | 26 (0.6%) |
| $50,000 to $74,999 | 276 (9.3%) | 107 (2.3%) |
| $75,000 to $99,999 | 307 (10.4%) | 100 (2.1%) |
| $100,000 to $149,999 | 542 (18.3%) | 252 (5.4%) |
| $150,000 or more | 1,301 (44.0%) | 768 (16.5%) |
| Total | 2,956 (100.0%) | 4,665 (100.0%) |
Property Value to Household Income Ratio in Rockville Centre
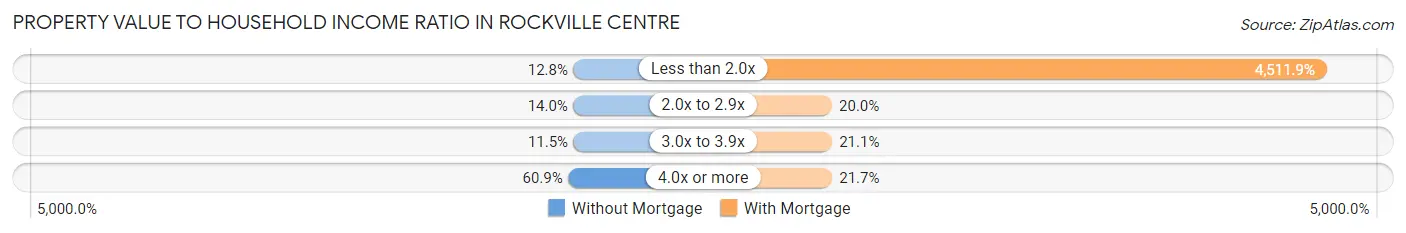
| Value-to-Income Ratio | Without Mortgage | With Mortgage |
| Less than 2.0x | 377 (12.8%) | 210,478 (4,511.8%) |
| 2.0x to 2.9x | 414 (14.0%) | 931 (20.0%) |
| 3.0x to 3.9x | 341 (11.5%) | 984 (21.1%) |
| 4.0x or more | 1,799 (60.9%) | 1,014 (21.7%) |
| Total | 2,956 (100.0%) | 4,665 (100.0%) |
Real Estate Taxes by Mortgage Status in Rockville Centre
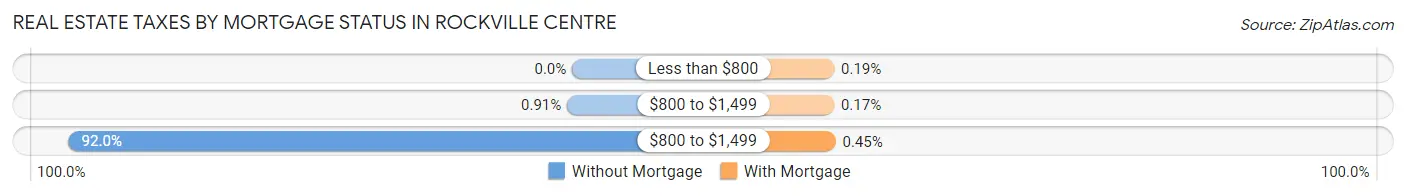
| Property Taxes | Without Mortgage | With Mortgage |
| Less than $800 | 0 (0.0%) | 9 (0.2%) |
| $800 to $1,499 | 27 (0.9%) | 8 (0.2%) |
| $800 to $1,499 | 2,718 (91.9%) | 21 (0.4%) |
| Total | 2,956 (100.0%) | 4,665 (100.0%) |
Health & Disability in Rockville Centre
Health Insurance Coverage by Age in Rockville Centre
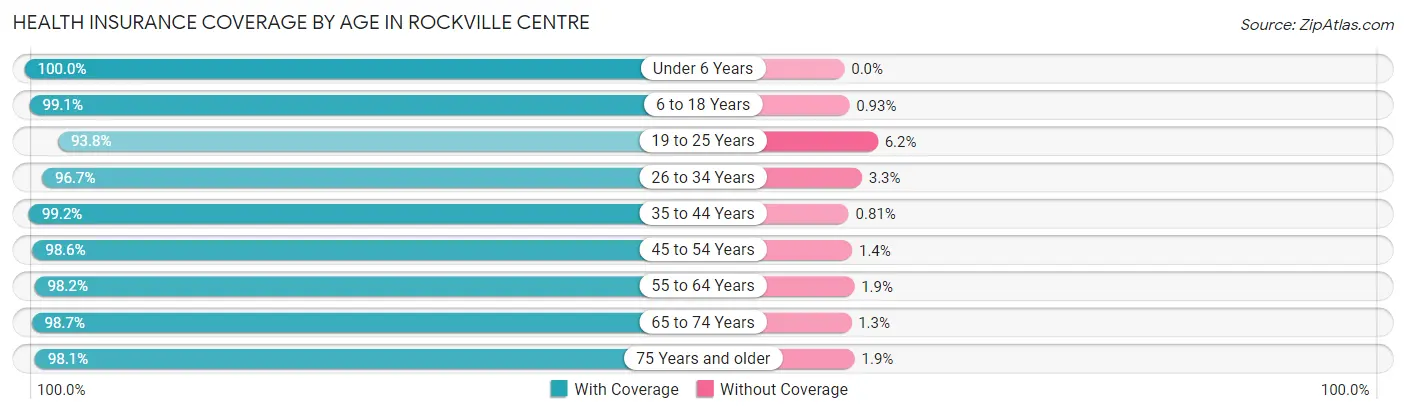
| Age Bracket | With Coverage | Without Coverage |
| Under 6 Years | 1,503 (100.0%) | 0 (0.0%) |
| 6 to 18 Years | 4,680 (99.1%) | 44 (0.9%) |
| 19 to 25 Years | 1,355 (93.8%) | 90 (6.2%) |
| 26 to 34 Years | 2,104 (96.7%) | 71 (3.3%) |
| 35 to 44 Years | 3,423 (99.2%) | 28 (0.8%) |
| 45 to 54 Years | 3,014 (98.6%) | 44 (1.4%) |
| 55 to 64 Years | 4,092 (98.2%) | 77 (1.8%) |
| 65 to 74 Years | 2,833 (98.7%) | 37 (1.3%) |
| 75 Years and older | 2,148 (98.1%) | 42 (1.9%) |
| Total | 25,152 (98.3%) | 433 (1.7%) |
Health Insurance Coverage by Citizenship Status in Rockville Centre
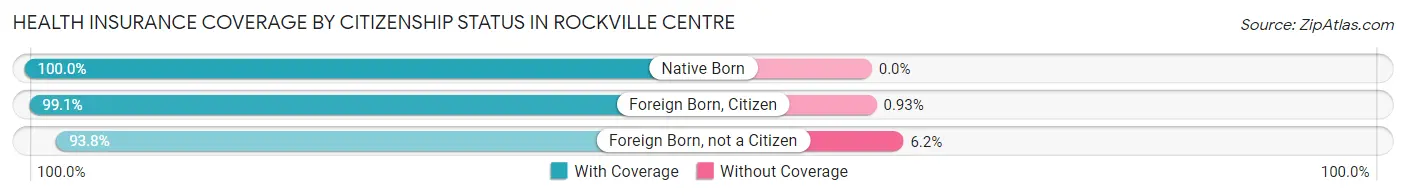
| Citizenship Status | With Coverage | Without Coverage |
| Native Born | 1,503 (100.0%) | 0 (0.0%) |
| Foreign Born, Citizen | 4,680 (99.1%) | 44 (0.9%) |
| Foreign Born, not a Citizen | 1,355 (93.8%) | 90 (6.2%) |
Health Insurance Coverage by Household Income in Rockville Centre
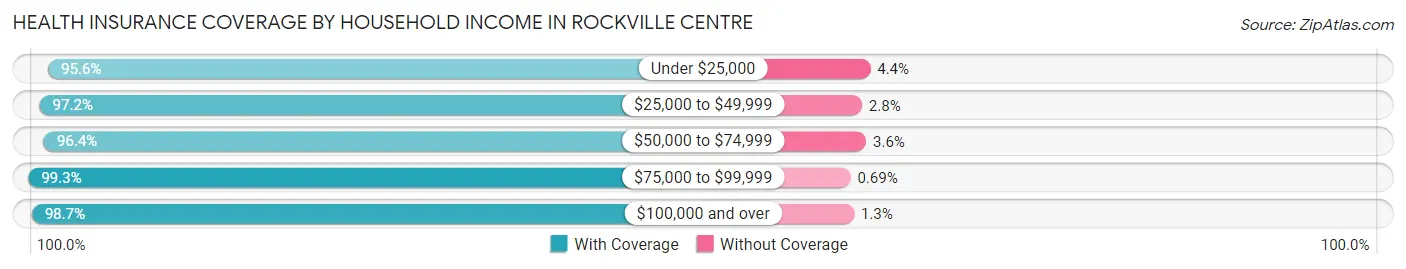
| Household Income | With Coverage | Without Coverage |
| Under $25,000 | 1,303 (95.6%) | 60 (4.4%) |
| $25,000 to $49,999 | 1,305 (97.2%) | 38 (2.8%) |
| $50,000 to $74,999 | 1,650 (96.4%) | 62 (3.6%) |
| $75,000 to $99,999 | 1,289 (99.3%) | 9 (0.7%) |
| $100,000 and over | 19,479 (98.7%) | 264 (1.3%) |
Public vs Private Health Insurance Coverage by Age in Rockville Centre
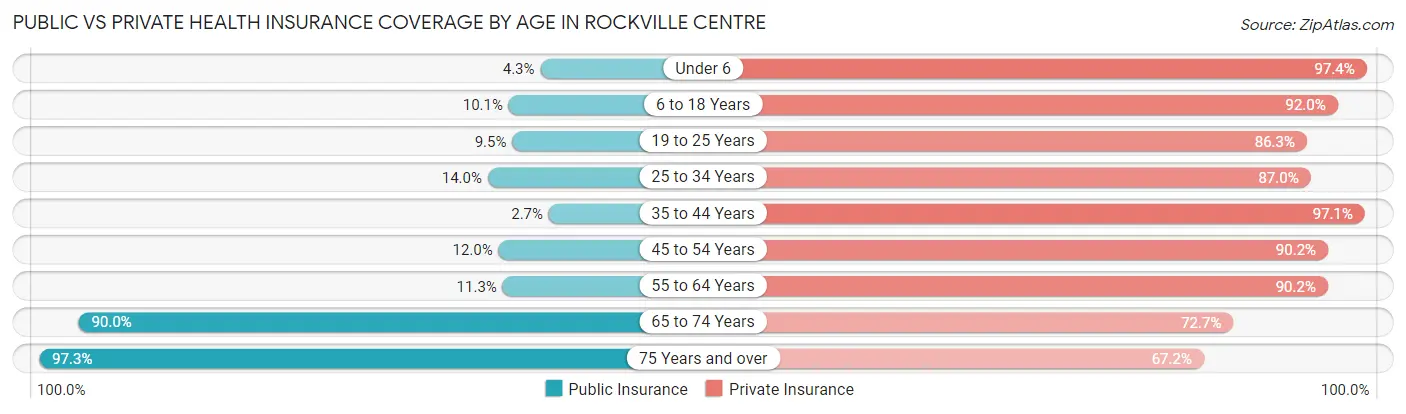
| Age Bracket | Public Insurance | Private Insurance |
| Under 6 | 64 (4.3%) | 1,464 (97.4%) |
| 6 to 18 Years | 478 (10.1%) | 4,347 (92.0%) |
| 19 to 25 Years | 137 (9.5%) | 1,247 (86.3%) |
| 25 to 34 Years | 305 (14.0%) | 1,892 (87.0%) |
| 35 to 44 Years | 93 (2.7%) | 3,350 (97.1%) |
| 45 to 54 Years | 368 (12.0%) | 2,759 (90.2%) |
| 55 to 64 Years | 470 (11.3%) | 3,760 (90.2%) |
| 65 to 74 Years | 2,583 (90.0%) | 2,085 (72.7%) |
| 75 Years and over | 2,131 (97.3%) | 1,471 (67.2%) |
| Total | 6,629 (25.9%) | 22,375 (87.5%) |
Disability Status by Sex by Age in Rockville Centre
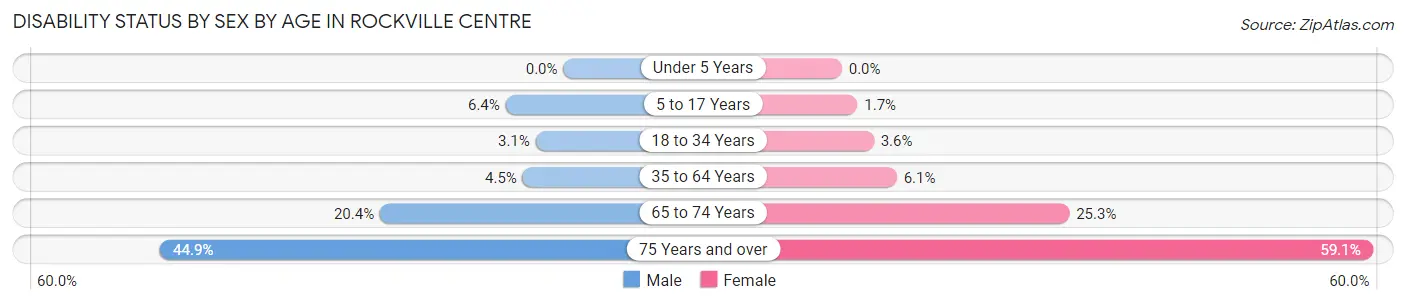
| Age Bracket | Male | Female |
| Under 5 Years | 0 (0.0%) | 0 (0.0%) |
| 5 to 17 Years | 154 (6.4%) | 37 (1.7%) |
| 18 to 34 Years | 59 (3.1%) | 76 (3.5%) |
| 35 to 64 Years | 228 (4.5%) | 345 (6.1%) |
| 65 to 74 Years | 274 (20.4%) | 387 (25.3%) |
| 75 Years and over | 387 (44.9%) | 785 (59.1%) |
Disability Class by Sex by Age in Rockville Centre
Disability Class: Hearing Difficulty
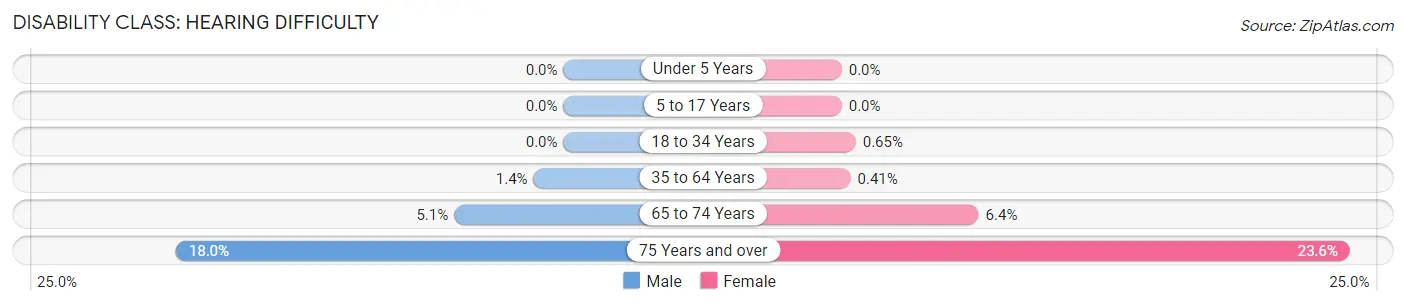
| Age Bracket | Male | Female |
| Under 5 Years | 0 (0.0%) | 0 (0.0%) |
| 5 to 17 Years | 0 (0.0%) | 0 (0.0%) |
| 18 to 34 Years | 0 (0.0%) | 14 (0.6%) |
| 35 to 64 Years | 70 (1.4%) | 23 (0.4%) |
| 65 to 74 Years | 68 (5.1%) | 97 (6.4%) |
| 75 Years and over | 155 (18.0%) | 313 (23.6%) |
Disability Class: Vision Difficulty
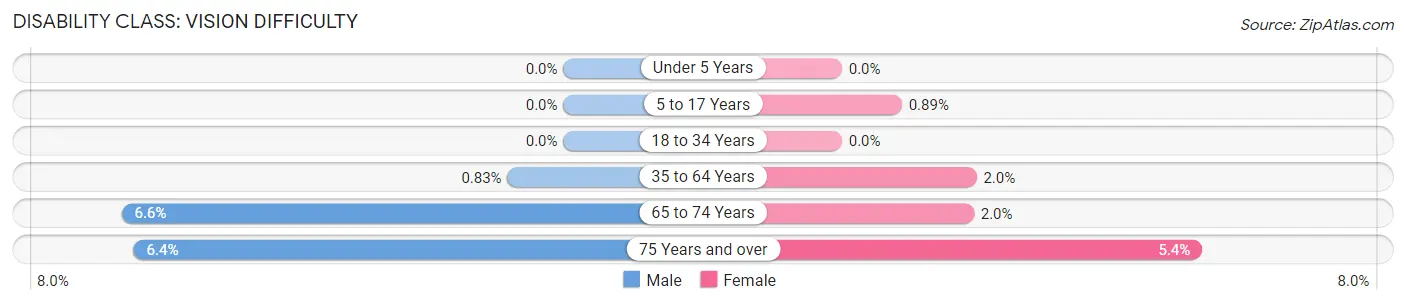
| Age Bracket | Male | Female |
| Under 5 Years | 0 (0.0%) | 0 (0.0%) |
| 5 to 17 Years | 0 (0.0%) | 19 (0.9%) |
| 18 to 34 Years | 0 (0.0%) | 0 (0.0%) |
| 35 to 64 Years | 42 (0.8%) | 113 (2.0%) |
| 65 to 74 Years | 88 (6.6%) | 30 (2.0%) |
| 75 Years and over | 55 (6.4%) | 71 (5.3%) |
Disability Class: Cognitive Difficulty
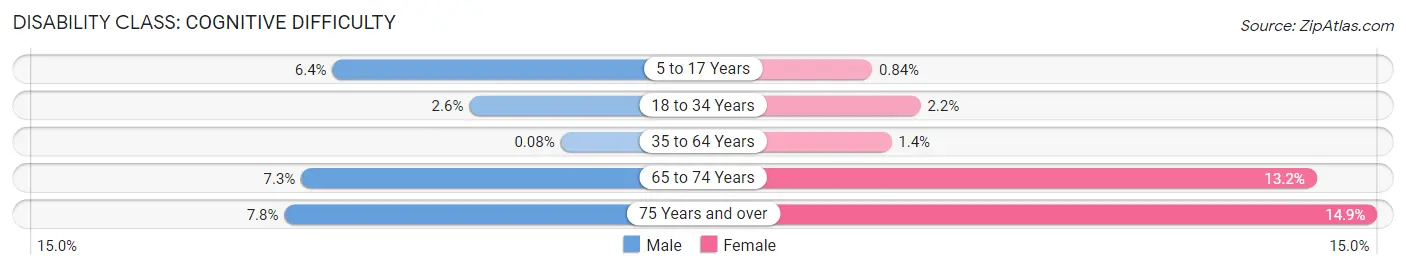
| Age Bracket | Male | Female |
| 5 to 17 Years | 154 (6.4%) | 18 (0.8%) |
| 18 to 34 Years | 50 (2.6%) | 47 (2.2%) |
| 35 to 64 Years | 4 (0.1%) | 78 (1.4%) |
| 65 to 74 Years | 98 (7.3%) | 202 (13.2%) |
| 75 Years and over | 67 (7.8%) | 198 (14.9%) |
Disability Class: Ambulatory Difficulty
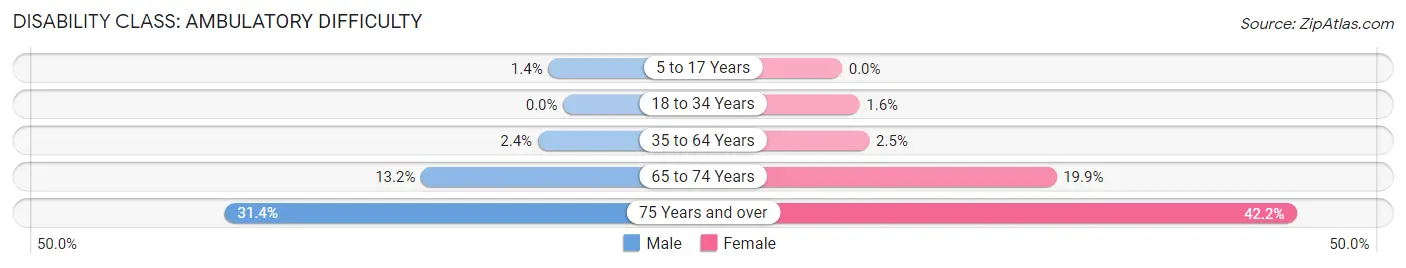
| Age Bracket | Male | Female |
| 5 to 17 Years | 33 (1.4%) | 0 (0.0%) |
| 18 to 34 Years | 0 (0.0%) | 35 (1.6%) |
| 35 to 64 Years | 119 (2.4%) | 143 (2.5%) |
| 65 to 74 Years | 177 (13.2%) | 304 (19.9%) |
| 75 Years and over | 271 (31.4%) | 560 (42.2%) |
Disability Class: Self-Care Difficulty
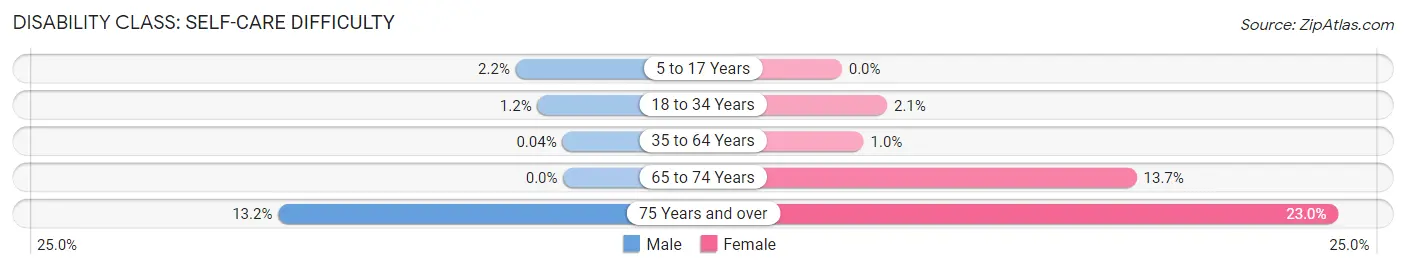
| Age Bracket | Male | Female |
| 5 to 17 Years | 53 (2.2%) | 0 (0.0%) |
| 18 to 34 Years | 23 (1.2%) | 45 (2.1%) |
| 35 to 64 Years | 2 (0.0%) | 57 (1.0%) |
| 65 to 74 Years | 0 (0.0%) | 209 (13.7%) |
| 75 Years and over | 114 (13.2%) | 306 (23.0%) |
Technology Access in Rockville Centre
Computing Device Access in Rockville Centre
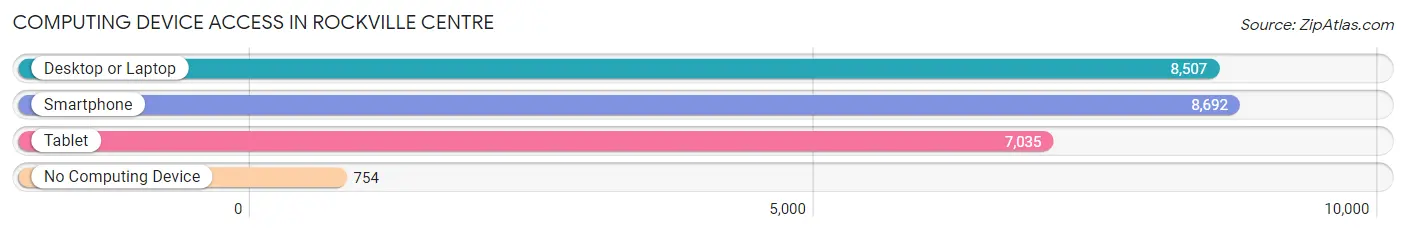
| Device Type | # Households | % Households |
| Desktop or Laptop | 8,507 | 84.3% |
| Smartphone | 8,692 | 86.2% |
| Tablet | 7,035 | 69.7% |
| No Computing Device | 754 | 7.5% |
| Total | 10,087 | 100.0% |
Internet Access in Rockville Centre
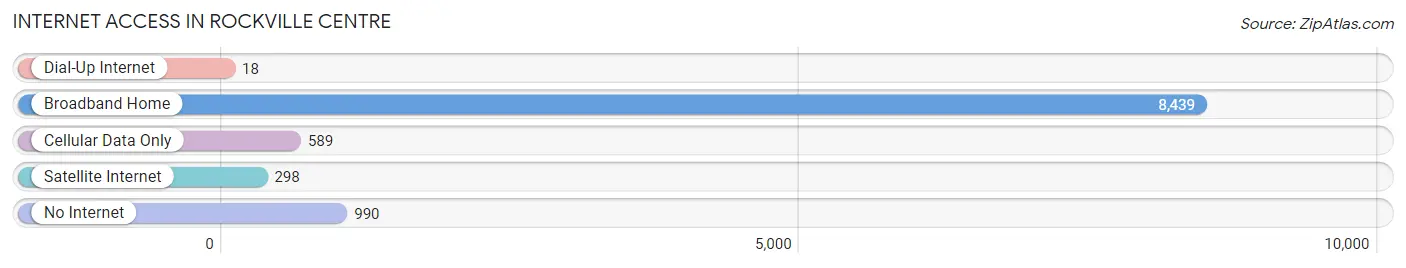
| Internet Type | # Households | % Households |
| Dial-Up Internet | 18 | 0.2% |
| Broadband Home | 8,439 | 83.7% |
| Cellular Data Only | 589 | 5.8% |
| Satellite Internet | 298 | 2.9% |
| No Internet | 990 | 9.8% |
| Total | 10,087 | 100.0% |
Rockville Centre Summary
Introduction
Rockville Centre is a village located in Nassau County, New York, United States. It is located on the South Shore of Long Island, about 22 miles east of Manhattan. The village is part of the Greater New York City metropolitan area and is located within the Town of Hempstead. As of the 2010 census, the village had a population of 24,023.
History
The area that is now Rockville Centre was originally inhabited by the Rockaway Indians, a sub-tribe of the Lenape. The first European settlers arrived in the area in 1643, when Thomas Powell and his family purchased land from the Rockaway Indians. The area was known as "Rockaway Neck" and "Powell's Neck" until 1849, when it was renamed "Rockville Centre".
The village was incorporated in 1893 and was named after the Rockaway River, which runs through the village. The village was originally a farming community, but it quickly developed into a popular summer resort destination. In the late 19th century, the village was home to several large hotels, including the Rockville Centre Hotel and the Rockaway House.
Geography
Rockville Centre is located at 40°39'25" North, 73°37'17" West (40.656944, -73.621389). The village is located on the South Shore of Long Island, about 22 miles east of Manhattan. It is bordered by the villages of Freeport to the west, Baldwin to the north, and Oceanside to the east. The village is located within the Town of Hempstead.
The village has a total area of 2.2 square miles, all of which is land. The village is located on the Rockaway River, which runs through the village. The village is also home to several parks, including Mill Pond Park, South Side Park, and the Rockville Centre Nature Preserve.
Economy
Rockville Centre is a primarily residential community, but it is also home to several businesses and industries. The village is home to several large employers, including South Nassau Communities Hospital, Molloy College, and the Rockville Centre School District. The village is also home to several retail stores, restaurants, and other businesses.
Demographics
As of the 2010 census, the village had a population of 24,023. The population density was 10,845.7 people per square mile. The racial makeup of the village was 87.2% White, 4.3% African American, 0.2% Native American, 4.3% Asian, 0.1% Pacific Islander, 1.7% from other races, and 2.2% from two or more races. Hispanic or Latino of any race were 6.7% of the population.
The median income for a household in the village was $90,945, and the median income for a family was $106,945. The per capita income for the village was $41,945. About 3.2% of families and 4.7% of the population were below the poverty line, including 5.2% of those under age 18 and 4.2% of those age 65 or over.
Conclusion
Rockville Centre is a village located in Nassau County, New York, United States. It is located on the South Shore of Long Island, about 22 miles east of Manhattan. The village is part of the Greater New York City metropolitan area and is located within the Town of Hempstead. As of the 2010 census, the village had a population of 24,023. The village was originally a farming community, but it quickly developed into a popular summer resort destination. Today, the village is a primarily residential community, but it is also home to several businesses and industries. The population of the village is predominantly white, with a small percentage of African American, Asian, and Hispanic or Latino residents. The median income for a household in the village was $90,945, and the median income for a family was $106,945.
Common Questions
What is the Total Population of Rockville Centre?
Total Population of Rockville Centre is 25,784.
What is the Total Male Population of Rockville Centre?
Total Male Population of Rockville Centre is 12,244.
What is the Total Female Population of Rockville Centre?
Total Female Population of Rockville Centre is 13,540.
What is the Ratio of Males per 100 Females in Rockville Centre?
There are 90.43 Males per 100 Females in Rockville Centre.
What is the Ratio of Females per 100 Males in Rockville Centre?
There are 110.58 Females per 100 Males in Rockville Centre.
What is the Median Population Age in Rockville Centre?
Median Population Age in Rockville Centre is 43.6 Years.
What is the Average Family Size in Rockville Centre
Average Family Size in Rockville Centre is 3.2 People.
What is the Average Household Size in Rockville Centre
Average Household Size in Rockville Centre is 2.5 People.
What is Per Capita Income in Rockville Centre?
Per Capita income in Rockville Centre is $77,776.
What is the Median Family Income in Rockville Centre?
Median Family Income in Rockville Centre is $201,830.
What is the Median Household income in Rockville Centre?
Median Household Income in Rockville Centre is $147,361.
What is Income or Wage Gap in Rockville Centre?
Income or Wage Gap in Rockville Centre is 41.3%.
Women in Rockville Centre earn 58.7 cents for every dollar earned by a man.
What is Family Income Deficit in Rockville Centre?
Family Income Deficit in Rockville Centre is $10,402.
Families that are below poverty line in Rockville Centre earn $10,402 less on average than the poverty threshold level.
What is Inequality or Gini Index in Rockville Centre?
Inequality or Gini Index in Rockville Centre is 0.48.
How Large is the Labor Force in Rockville Centre?
There are 13,508 People in the Labor Forcein in Rockville Centre.
What is the Percentage of People in the Labor Force in Rockville Centre?
65.6% of People are in the Labor Force in Rockville Centre.
What is the Unemployment Rate in Rockville Centre?
Unemployment Rate in Rockville Centre is 5.1%.