Endicott, NY
Endicott Map
Endicott Overview
13,540
TOTAL POPULATION
6,521
MALE POPULATION
7,019
FEMALE POPULATION
92.90
MALES / 100 FEMALES
107.64
FEMALES / 100 MALES
36.1
MEDIAN AGE
2.8
AVG FAMILY SIZE
2.1
AVG HOUSEHOLD SIZE
$25,067
PER CAPITA INCOME
$51,985
AVG FAMILY INCOME
$43,509
AVG HOUSEHOLD INCOME
23.7%
WAGE / INCOME GAP [ % ]
76.3¢/ $1
WAGE / INCOME GAP [ $ ]
$8,489
FAMILY INCOME DEFICIT
0.43
INEQUALITY / GINI INDEX
6,232
LABOR FORCE [ PEOPLE ]
56.4%
PERCENT IN LABOR FORCE
7.5%
UNEMPLOYMENT RATE
Endicott Zip Codes
Endicott Area Codes
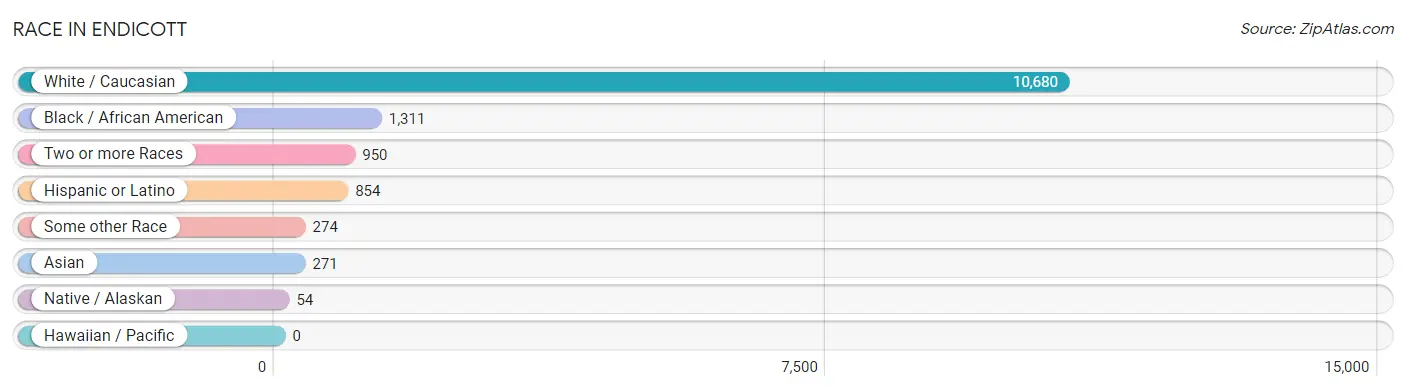
Race in Endicott
The most populous races in Endicott are White / Caucasian (10,680 | 78.9%), Black / African American (1,311 | 9.7%), and Two or more Races (950 | 7.0%).
| Race | # Population | % Population |
| Asian | 271 | 2.0% |
| Black / African American | 1,311 | 9.7% |
| Hawaiian / Pacific | 0 | 0.0% |
| Hispanic or Latino | 854 | 6.3% |
| Native / Alaskan | 54 | 0.4% |
| White / Caucasian | 10,680 | 78.9% |
| Two or more Races | 950 | 7.0% |
| Some other Race | 274 | 2.0% |
| Total | 13,540 | 100.0% |
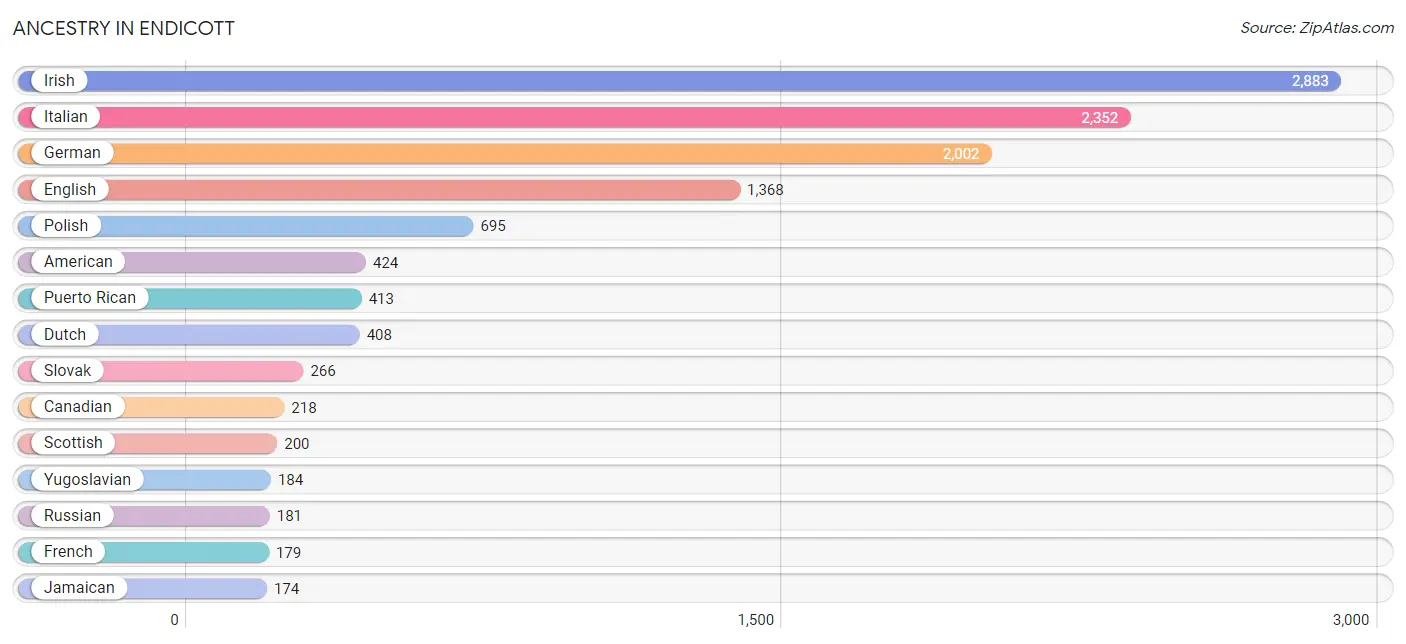
Ancestry in Endicott
The most populous ancestries reported in Endicott are Irish (2,883 | 21.3%), Italian (2,352 | 17.4%), German (2,002 | 14.8%), English (1,368 | 10.1%), and Polish (695 | 5.1%), together accounting for 68.7% of all Endicott residents.
| Ancestry | # Population | % Population |
| African | 110 | 0.8% |
| American | 424 | 3.1% |
| Arab | 34 | 0.3% |
| Austrian | 43 | 0.3% |
| Bhutanese | 5 | 0.0% |
| British | 49 | 0.4% |
| Canadian | 218 | 1.6% |
| Carpatho Rusyn | 8 | 0.1% |
| Central American | 61 | 0.4% |
| Cherokee | 3 | 0.0% |
| Croatian | 20 | 0.2% |
| Cuban | 14 | 0.1% |
| Cypriot | 31 | 0.2% |
| Czech | 123 | 0.9% |
| Czechoslovakian | 58 | 0.4% |
| Danish | 5 | 0.0% |
| Delaware | 5 | 0.0% |
| Dominican | 27 | 0.2% |
| Dutch | 408 | 3.0% |
| Eastern European | 37 | 0.3% |
| Ecuadorian | 115 | 0.9% |
| English | 1,368 | 10.1% |
| European | 137 | 1.0% |
| Finnish | 91 | 0.7% |
| French | 179 | 1.3% |
| French Canadian | 112 | 0.8% |
| German | 2,002 | 14.8% |
| Greek | 17 | 0.1% |
| Guatemalan | 7 | 0.1% |
| Honduran | 54 | 0.4% |
| Hungarian | 97 | 0.7% |
| Indian (Asian) | 111 | 0.8% |
| Iranian | 17 | 0.1% |
| Irish | 2,883 | 21.3% |
| Israeli | 25 | 0.2% |
| Italian | 2,352 | 17.4% |
| Jamaican | 174 | 1.3% |
| Jordanian | 32 | 0.2% |
| Kenyan | 1 | 0.0% |
| Korean | 38 | 0.3% |
| Lebanese | 2 | 0.0% |
| Lithuanian | 19 | 0.1% |
| Malaysian | 58 | 0.4% |
| Mexican | 53 | 0.4% |
| Mexican American Indian | 54 | 0.4% |
| Nigerian | 62 | 0.5% |
| Norwegian | 65 | 0.5% |
| Pennsylvania German | 63 | 0.5% |
| Polish | 695 | 5.1% |
| Puerto Rican | 413 | 3.0% |
| Romanian | 11 | 0.1% |
| Russian | 181 | 1.3% |
| Scandinavian | 36 | 0.3% |
| Scotch-Irish | 9 | 0.1% |
| Scottish | 200 | 1.5% |
| Slavic | 59 | 0.4% |
| Slovak | 266 | 2.0% |
| Slovene | 8 | 0.1% |
| South American | 115 | 0.9% |
| Sri Lankan | 28 | 0.2% |
| Subsaharan African | 173 | 1.3% |
| Swedish | 40 | 0.3% |
| Swiss | 9 | 0.1% |
| Thai | 31 | 0.2% |
| Trinidadian and Tobagonian | 19 | 0.1% |
| Ukrainian | 46 | 0.3% |
| Welsh | 118 | 0.9% |
| West Indian | 6 | 0.0% |
| Yugoslavian | 184 | 1.4% | View All 69 Rows |
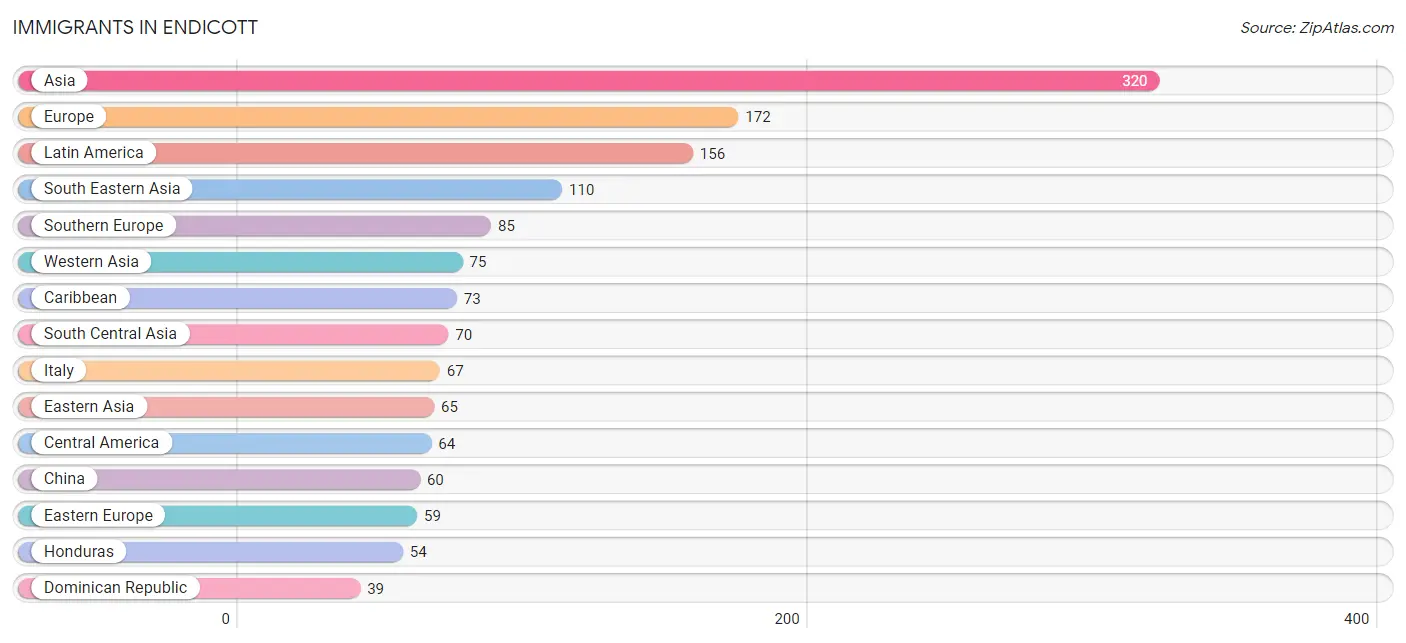
Immigrants in Endicott
The most numerous immigrant groups reported in Endicott came from Asia (320 | 2.4%), Europe (172 | 1.3%), Latin America (156 | 1.1%), South Eastern Asia (110 | 0.8%), and Southern Europe (85 | 0.6%), together accounting for 6.2% of all Endicott residents.
| Immigration Origin | # Population | % Population |
| Africa | 21 | 0.2% |
| Asia | 320 | 2.4% |
| Bangladesh | 6 | 0.0% |
| Belarus | 5 | 0.0% |
| Bosnia and Herzegovina | 30 | 0.2% |
| Canada | 11 | 0.1% |
| Caribbean | 73 | 0.5% |
| Central America | 64 | 0.5% |
| China | 60 | 0.4% |
| Dominican Republic | 39 | 0.3% |
| Eastern Africa | 8 | 0.1% |
| Eastern Asia | 65 | 0.5% |
| Eastern Europe | 59 | 0.4% |
| Ecuador | 19 | 0.1% |
| Europe | 172 | 1.3% |
| France | 2 | 0.0% |
| Germany | 8 | 0.1% |
| Greece | 18 | 0.1% |
| Guatemala | 7 | 0.1% |
| Honduras | 54 | 0.4% |
| India | 25 | 0.2% |
| Iran | 39 | 0.3% |
| Iraq | 21 | 0.2% |
| Ireland | 12 | 0.1% |
| Israel | 20 | 0.2% |
| Italy | 67 | 0.5% |
| Jamaica | 15 | 0.1% |
| Japan | 5 | 0.0% |
| Jordan | 34 | 0.3% |
| Kenya | 1 | 0.0% |
| Laos | 29 | 0.2% |
| Latin America | 156 | 1.1% |
| Mexico | 3 | 0.0% |
| Netherlands | 6 | 0.0% |
| Nigeria | 13 | 0.1% |
| Northern Europe | 12 | 0.1% |
| Philippines | 23 | 0.2% |
| Russia | 24 | 0.2% |
| South America | 19 | 0.1% |
| South Central Asia | 70 | 0.5% |
| South Eastern Asia | 110 | 0.8% |
| Southern Europe | 85 | 0.6% |
| Thailand | 8 | 0.1% |
| Trinidad and Tobago | 19 | 0.1% |
| Vietnam | 28 | 0.2% |
| Western Africa | 13 | 0.1% |
| Western Asia | 75 | 0.5% |
| Western Europe | 16 | 0.1% | View All 48 Rows |
Sex and Age in Endicott
Sex and Age in Endicott
The most populous age groups in Endicott are 30 to 34 Years (605 | 9.3%) for men and 20 to 24 Years (981 | 14.0%) for women.
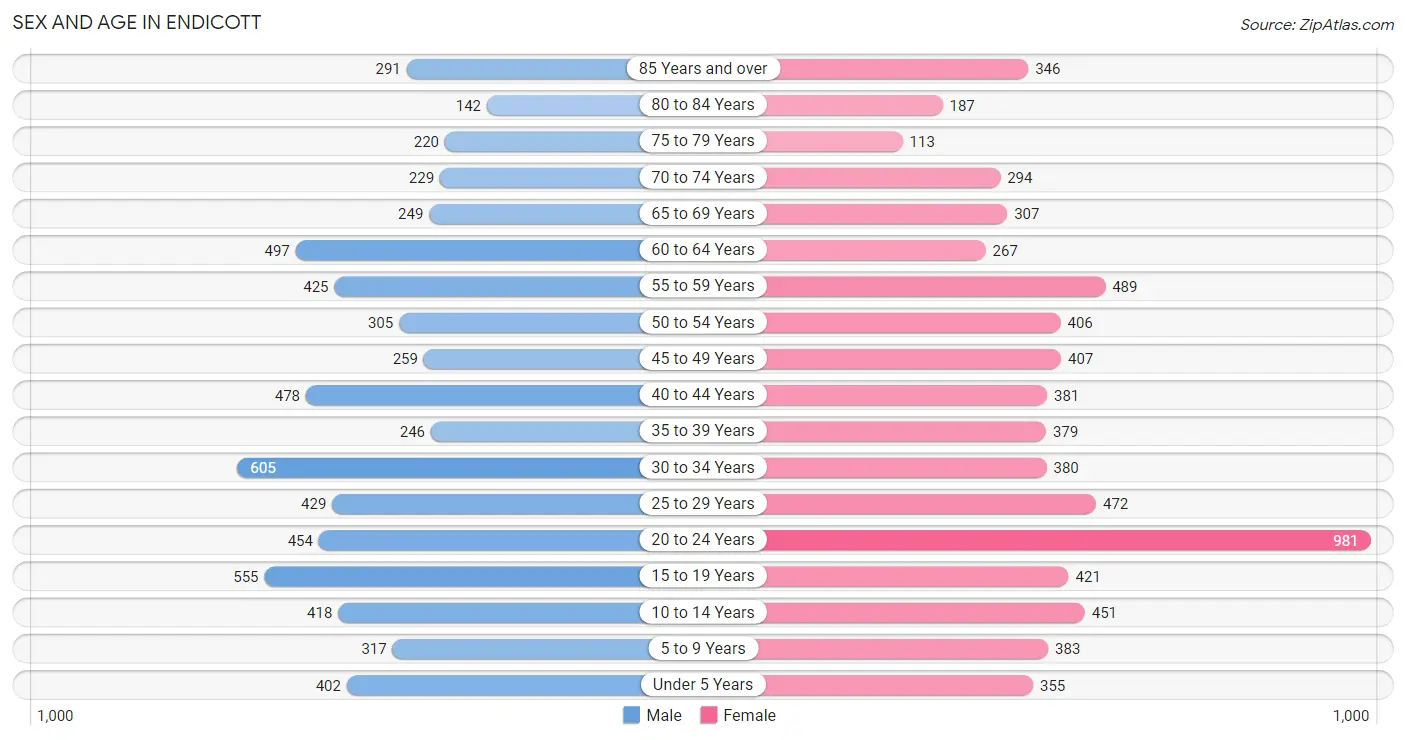
| Age Bracket | Male | Female |
| Under 5 Years | 402 (6.2%) | 355 (5.1%) |
| 5 to 9 Years | 317 (4.9%) | 383 (5.5%) |
| 10 to 14 Years | 418 (6.4%) | 451 (6.4%) |
| 15 to 19 Years | 555 (8.5%) | 421 (6.0%) |
| 20 to 24 Years | 454 (7.0%) | 981 (14.0%) |
| 25 to 29 Years | 429 (6.6%) | 472 (6.7%) |
| 30 to 34 Years | 605 (9.3%) | 380 (5.4%) |
| 35 to 39 Years | 246 (3.8%) | 379 (5.4%) |
| 40 to 44 Years | 478 (7.3%) | 381 (5.4%) |
| 45 to 49 Years | 259 (4.0%) | 407 (5.8%) |
| 50 to 54 Years | 305 (4.7%) | 406 (5.8%) |
| 55 to 59 Years | 425 (6.5%) | 489 (7.0%) |
| 60 to 64 Years | 497 (7.6%) | 267 (3.8%) |
| 65 to 69 Years | 249 (3.8%) | 307 (4.4%) |
| 70 to 74 Years | 229 (3.5%) | 294 (4.2%) |
| 75 to 79 Years | 220 (3.4%) | 113 (1.6%) |
| 80 to 84 Years | 142 (2.2%) | 187 (2.7%) |
| 85 Years and over | 291 (4.5%) | 346 (4.9%) |
| Total | 6,521 (100.0%) | 7,019 (100.0%) |
Families and Households in Endicott
Median Family Size in Endicott
The median family size in Endicott is 2.79 persons per family, with married-couple families (1,542 | 50.1%) accounting for the largest median family size of 3.08 persons per family. On the other hand, single male/father families (197 | 6.4%) represent the smallest median family size with 2.44 persons per family.
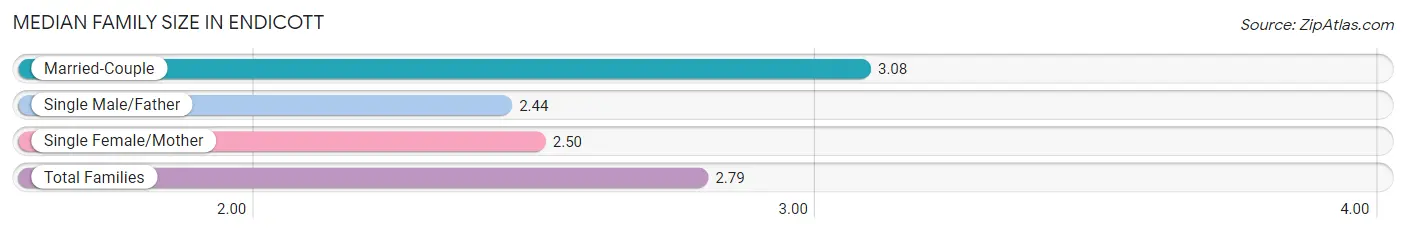
| Family Type | # Families | Family Size |
| Married-Couple | 1,542 (50.1%) | 3.08 |
| Single Male/Father | 197 (6.4%) | 2.44 |
| Single Female/Mother | 1,340 (43.5%) | 2.50 |
| Total Families | 3,079 (100.0%) | 2.79 |
Median Household Size in Endicott
The median household size in Endicott is 2.06 persons per household, with married-couple households (1,542 | 24.5%) accounting for the largest median household size of 3.16 persons per household. non-family households (3,219 | 51.1%) represent the smallest median household size with 1.22 persons per household.
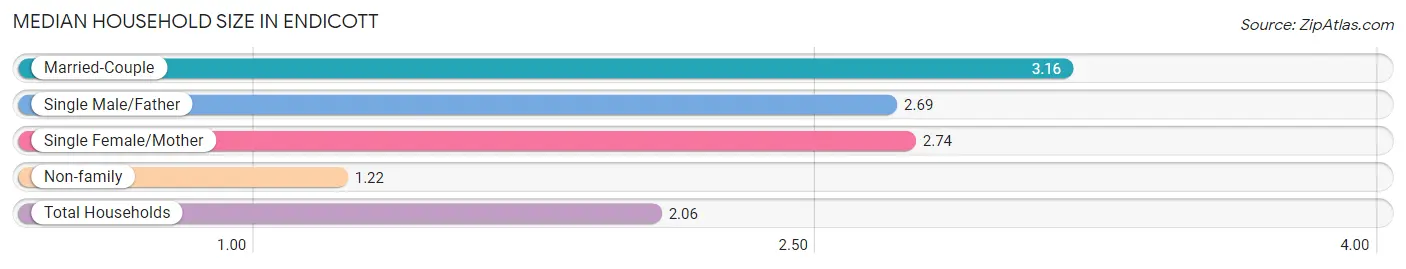
| Household Type | # Households | Household Size |
| Married-Couple | 1,542 (24.5%) | 3.16 |
| Single Male/Father | 197 (3.1%) | 2.69 |
| Single Female/Mother | 1,340 (21.3%) | 2.74 |
| Non-family | 3,219 (51.1%) | 1.22 |
| Total Households | 6,298 (100.0%) | 2.06 |
Household Size by Marriage Status in Endicott
Out of a total of 6,298 households in Endicott, 3,079 (48.9%) are family households, while 3,219 (51.1%) are nonfamily households. The most numerous type of family households are 2-person households, comprising 1,336, and the most common type of nonfamily households are 1-person households, comprising 2,675.
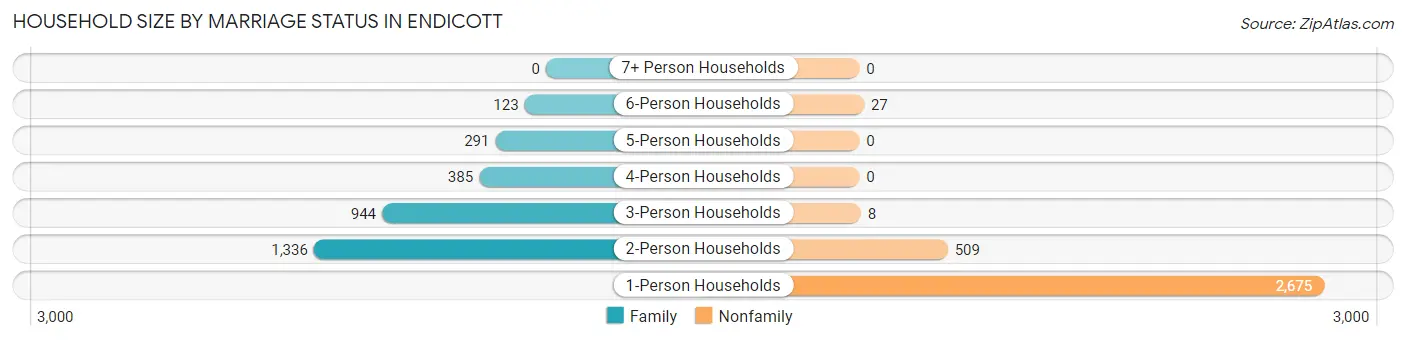
| Household Size | Family Households | Nonfamily Households |
| 1-Person Households | - | 2,675 (42.5%) |
| 2-Person Households | 1,336 (21.2%) | 509 (8.1%) |
| 3-Person Households | 944 (15.0%) | 8 (0.1%) |
| 4-Person Households | 385 (6.1%) | 0 (0.0%) |
| 5-Person Households | 291 (4.6%) | 0 (0.0%) |
| 6-Person Households | 123 (1.9%) | 27 (0.4%) |
| 7+ Person Households | 0 (0.0%) | 0 (0.0%) |
| Total | 3,079 (48.9%) | 3,219 (51.1%) |
Female Fertility in Endicott
Fertility by Age in Endicott
Average fertility rate in Endicott is 35.0 births per 1,000 women. Women in the age bracket of 20 to 34 years have the highest fertility rate with 65.0 births per 1,000 women. Women in the age bracket of 20 to 34 years acount for 96.0% of all women with births.
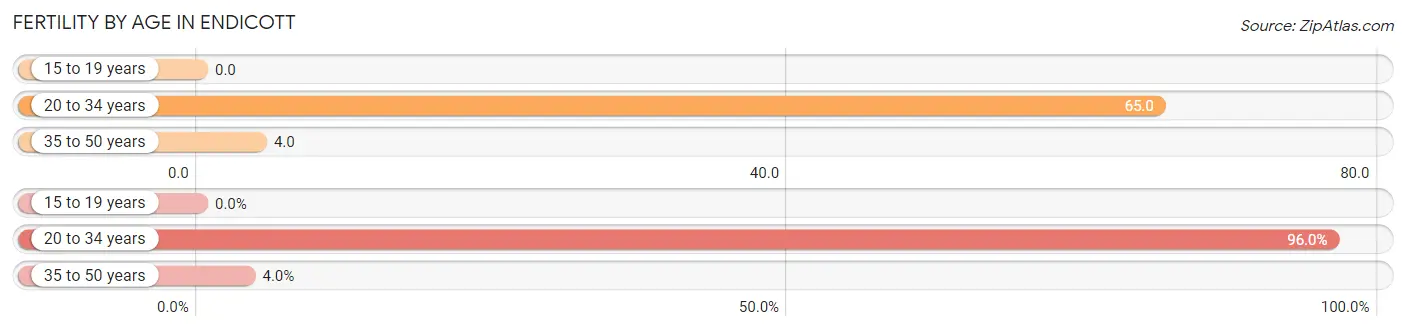
| Age Bracket | Women with Births | Births / 1,000 Women |
| 15 to 19 years | 0 (0.0%) | 0.0 |
| 20 to 34 years | 119 (96.0%) | 65.0 |
| 35 to 50 years | 5 (4.0%) | 4.0 |
| Total | 124 (100.0%) | 35.0 |
Fertility by Age by Marriage Status in Endicott
74.2% of women with births (124) in Endicott are married. The highest percentage of unmarried women with births falls into 20 to 34 years age bracket with 26.9% of them unmarried at the time of birth, while the lowest percentage of unmarried women with births belong to 35 to 50 years age bracket with 0.0% of them unmarried.
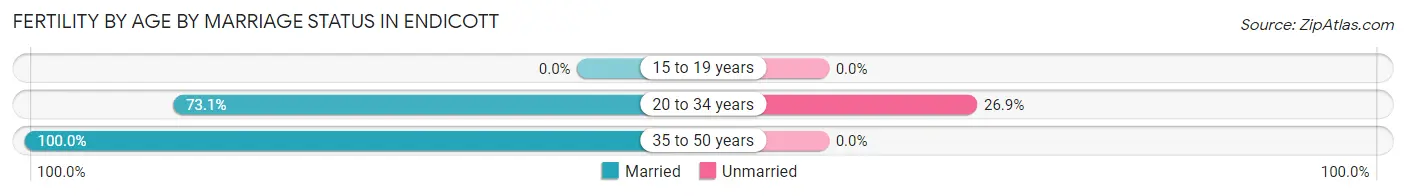
| Age Bracket | Married | Unmarried |
| 15 to 19 years | 0 (0.0%) | 0 (0.0%) |
| 20 to 34 years | 87 (73.1%) | 32 (26.9%) |
| 35 to 50 years | 5 (100.0%) | 0 (0.0%) |
| Total | 92 (74.2%) | 32 (25.8%) |
Fertility by Education in Endicott
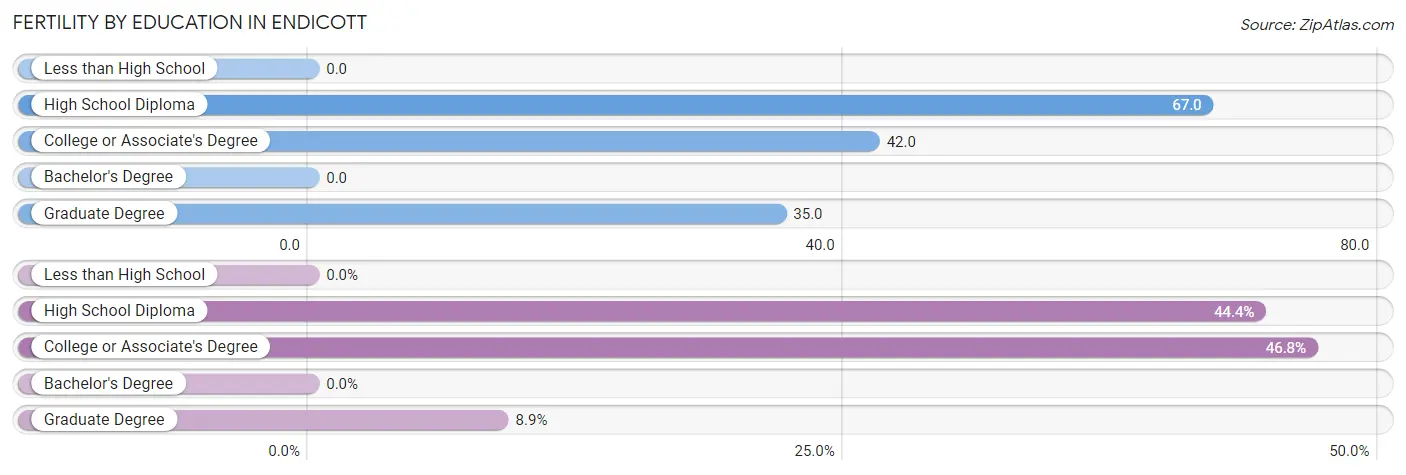
| Educational Attainment | Women with Births | Births / 1,000 Women |
| Less than High School | 0 (0.0%) | 0.0 |
| High School Diploma | 55 (44.4%) | 67.0 |
| College or Associate's Degree | 58 (46.8%) | 42.0 |
| Bachelor's Degree | 0 (0.0%) | 0.0 |
| Graduate Degree | 11 (8.9%) | 35.0 |
| Total | 124 (100.0%) | 35.0 |
Fertility by Education by Marriage Status in Endicott
25.8% of women with births in Endicott are unmarried. Women with the educational attainment of high school diploma are most likely to be married with 100.0% of them married at childbirth, while women with the educational attainment of college or associate's degree are least likely to be married with 55.2% of them unmarried at childbirth.
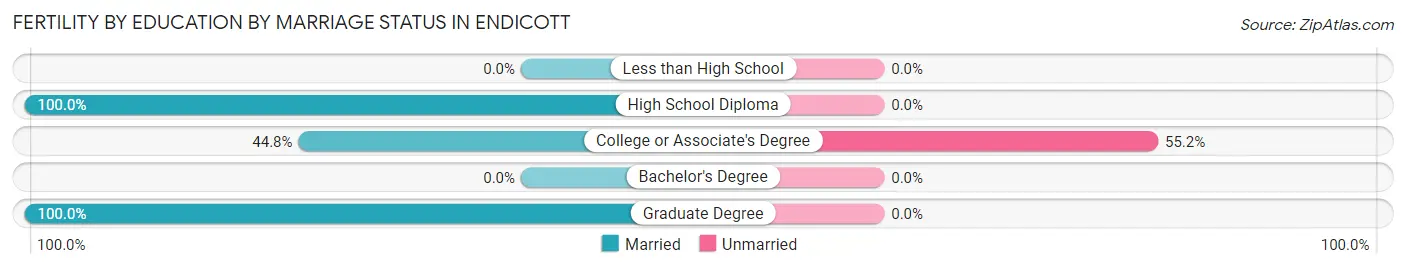
| Educational Attainment | Married | Unmarried |
| Less than High School | 0 (0.0%) | 0 (0.0%) |
| High School Diploma | 55 (100.0%) | 0 (0.0%) |
| College or Associate's Degree | 26 (44.8%) | 32 (55.2%) |
| Bachelor's Degree | 0 (0.0%) | 0 (0.0%) |
| Graduate Degree | 11 (100.0%) | 0 (0.0%) |
| Total | 92 (74.2%) | 32 (25.8%) |
Income in Endicott
Income Overview in Endicott
Per Capita Income in Endicott is $25,067, while median incomes of families and households are $51,985 and $43,509 respectively.
| Characteristic | Number | Measure |
| Per Capita Income | 13,540 | $25,067 |
| Median Family Income | 3,079 | $51,985 |
| Mean Family Income | 3,079 | $60,882 |
| Median Household Income | 6,298 | $43,509 |
| Mean Household Income | 6,298 | $53,422 |
| Income Deficit | 3,079 | $8,489 |
| Wage / Income Gap (%) | 13,540 | 23.74% |
| Wage / Income Gap ($) | 13,540 | 76.26¢ per $1 |
| Gini / Inequality Index | 13,540 | 0.43 |
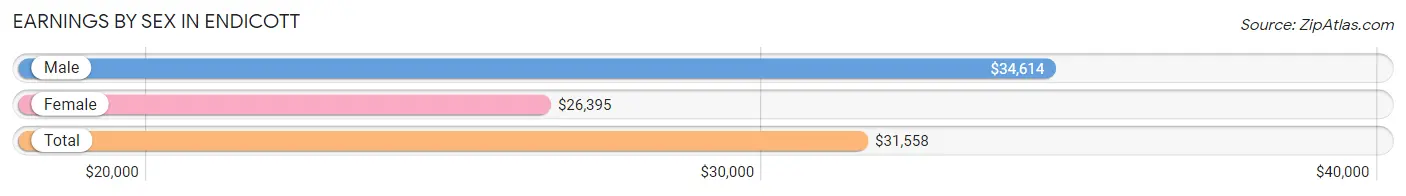
Earnings by Sex in Endicott
Average Earnings in Endicott are $31,558, $34,614 for men and $26,395 for women, a difference of 23.7%.
| Sex | Number | Average Earnings |
| Male | 3,036 (46.2%) | $34,614 |
| Female | 3,535 (53.8%) | $26,395 |
| Total | 6,571 (100.0%) | $31,558 |
Earnings by Sex by Income Bracket in Endicott
The most common earnings brackets in Endicott are $30,000 to $34,999 for men (316 | 10.4%) and $12,500 to $14,999 for women (317 | 9.0%).
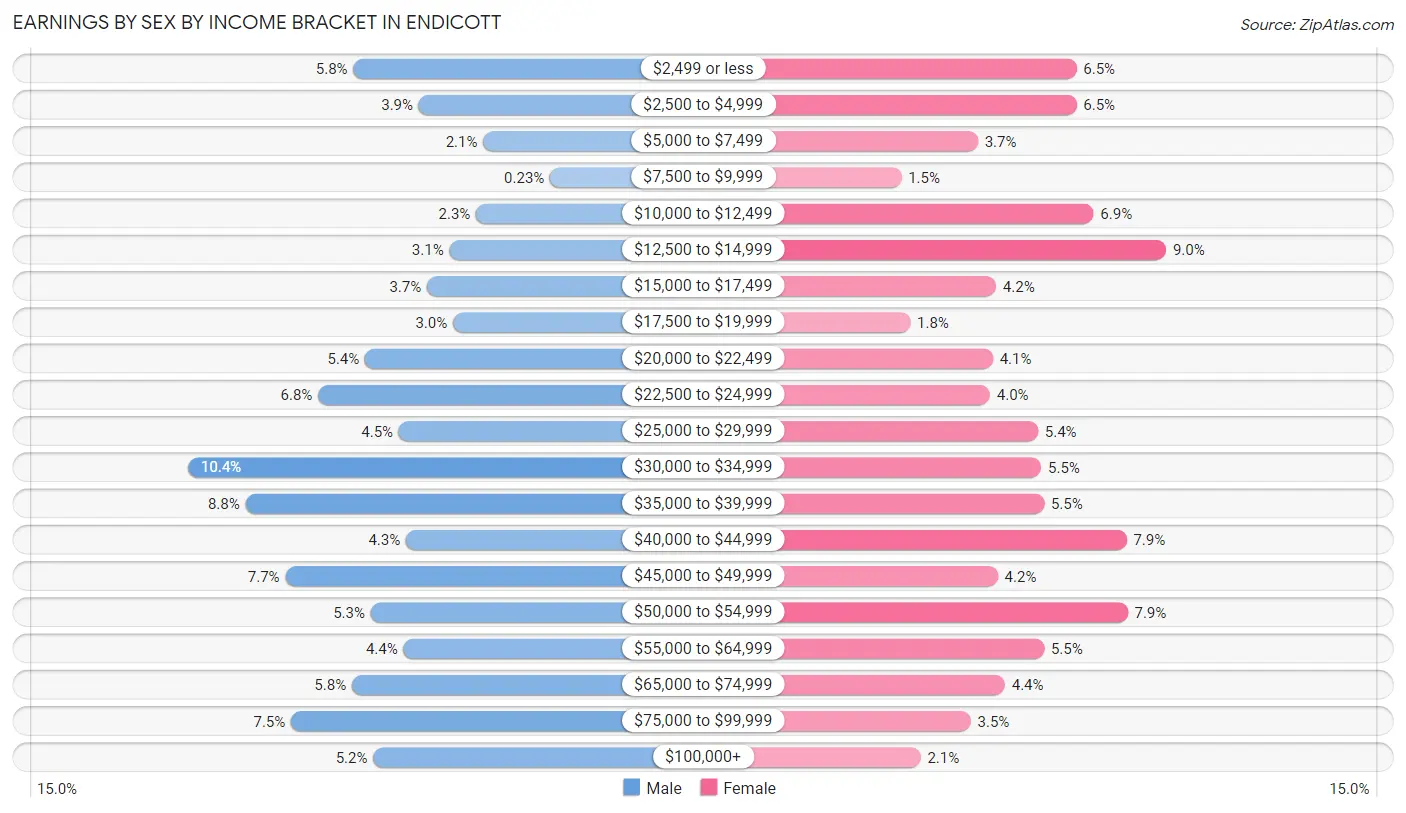
| Income | Male | Female |
| $2,499 or less | 175 (5.8%) | 228 (6.5%) |
| $2,500 to $4,999 | 119 (3.9%) | 228 (6.5%) |
| $5,000 to $7,499 | 64 (2.1%) | 130 (3.7%) |
| $7,500 to $9,999 | 7 (0.2%) | 54 (1.5%) |
| $10,000 to $12,499 | 70 (2.3%) | 245 (6.9%) |
| $12,500 to $14,999 | 93 (3.1%) | 317 (9.0%) |
| $15,000 to $17,499 | 112 (3.7%) | 148 (4.2%) |
| $17,500 to $19,999 | 90 (3.0%) | 63 (1.8%) |
| $20,000 to $22,499 | 165 (5.4%) | 145 (4.1%) |
| $22,500 to $24,999 | 205 (6.8%) | 142 (4.0%) |
| $25,000 to $29,999 | 136 (4.5%) | 190 (5.4%) |
| $30,000 to $34,999 | 316 (10.4%) | 193 (5.5%) |
| $35,000 to $39,999 | 267 (8.8%) | 196 (5.5%) |
| $40,000 to $44,999 | 130 (4.3%) | 278 (7.9%) |
| $45,000 to $49,999 | 233 (7.7%) | 150 (4.2%) |
| $50,000 to $54,999 | 160 (5.3%) | 279 (7.9%) |
| $55,000 to $64,999 | 132 (4.3%) | 196 (5.5%) |
| $65,000 to $74,999 | 176 (5.8%) | 157 (4.4%) |
| $75,000 to $99,999 | 228 (7.5%) | 123 (3.5%) |
| $100,000+ | 158 (5.2%) | 73 (2.1%) |
| Total | 3,036 (100.0%) | 3,535 (100.0%) |
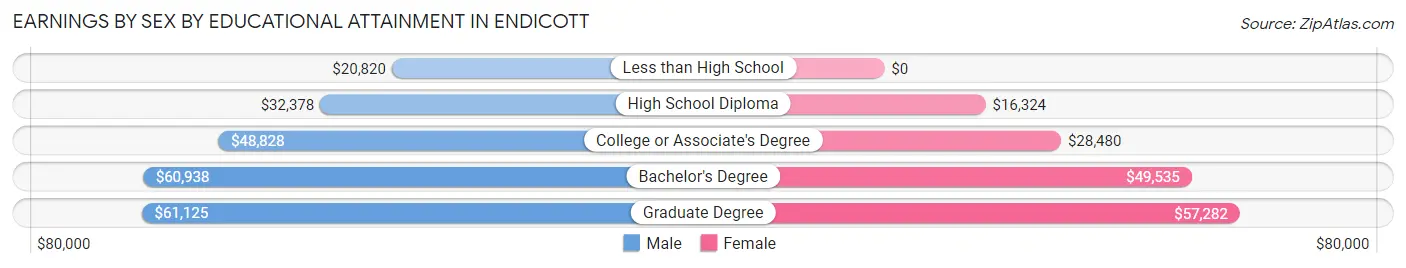
Earnings by Sex by Educational Attainment in Endicott
Average earnings in Endicott are $37,770 for men and $31,331 for women, a difference of 17.1%. Men with an educational attainment of graduate degree enjoy the highest average annual earnings of $61,125, while those with less than high school education earn the least with $20,820. Women with an educational attainment of graduate degree earn the most with the average annual earnings of $57,282, while those with high school diploma education have the smallest earnings of $16,324.
| Educational Attainment | Male Income | Female Income |
| Less than High School | $20,820 | $0 |
| High School Diploma | $32,378 | $16,324 |
| College or Associate's Degree | $48,828 | $28,480 |
| Bachelor's Degree | $60,938 | $49,535 |
| Graduate Degree | $61,125 | $57,282 |
| Total | $37,770 | $31,331 |
Family Income in Endicott
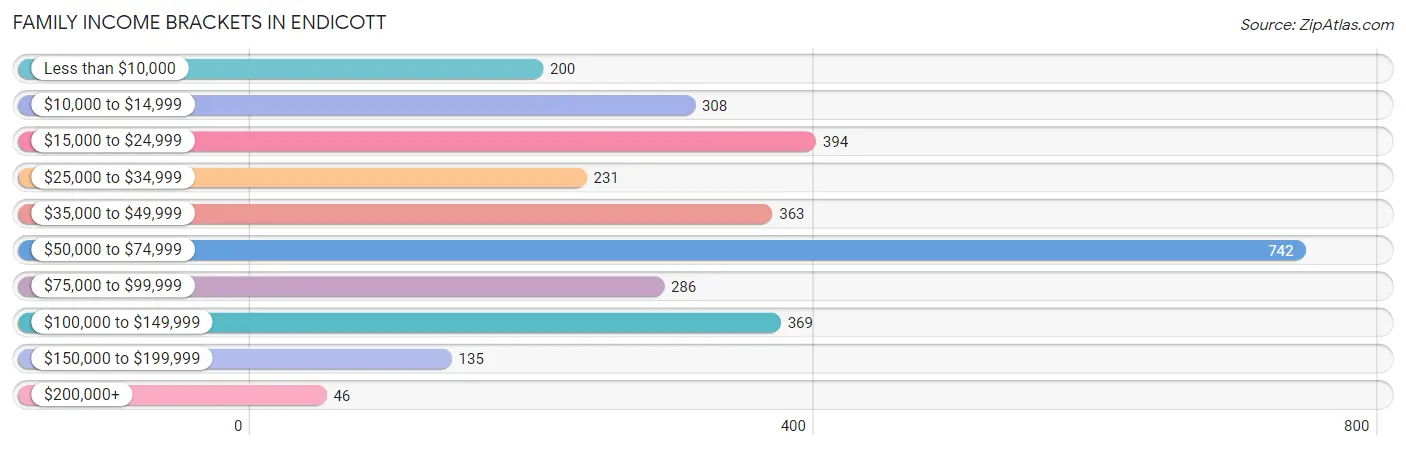
Family Income Brackets in Endicott
According to the Endicott family income data, there are 742 families falling into the $50,000 to $74,999 income range, which is the most common income bracket and makes up 24.1% of all families. Conversely, the $200,000+ income bracket is the least frequent group with only 46 families (1.5%) belonging to this category.
| Income Bracket | # Families | % Families |
| Less than $10,000 | 200 | 6.5% |
| $10,000 to $14,999 | 308 | 10.0% |
| $15,000 to $24,999 | 394 | 12.8% |
| $25,000 to $34,999 | 231 | 7.5% |
| $35,000 to $49,999 | 363 | 11.8% |
| $50,000 to $74,999 | 742 | 24.1% |
| $75,000 to $99,999 | 286 | 9.3% |
| $100,000 to $149,999 | 369 | 12.0% |
| $150,000 to $199,999 | 135 | 4.4% |
| $200,000+ | 46 | 1.5% |
Family Income by Famaliy Size in Endicott
5-person families (225 | 7.3%) account for the highest median family income in Endicott with $89,250 per family, while 2-person families (1,545 | 50.2%) have the highest median income of $25,919 per family member.
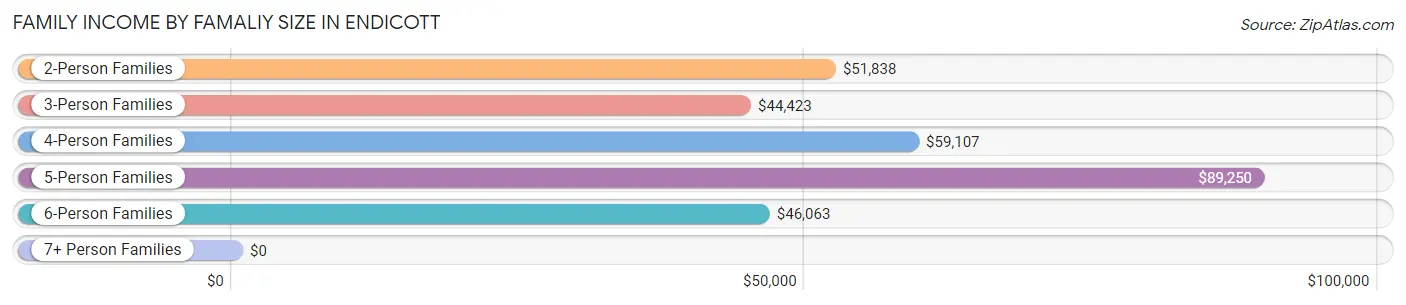
| Income Bracket | # Families | Median Income |
| 2-Person Families | 1,545 (50.2%) | $51,838 |
| 3-Person Families | 802 (26.1%) | $44,423 |
| 4-Person Families | 431 (14.0%) | $59,107 |
| 5-Person Families | 225 (7.3%) | $89,250 |
| 6-Person Families | 76 (2.5%) | $46,063 |
| 7+ Person Families | 0 (0.0%) | $0 |
| Total | 3,079 (100.0%) | $51,985 |
Family Income by Number of Earners in Endicott
The median family income in Endicott is $51,985, with families comprising 3+ earners (255) having the highest median family income of $108,271, while families with 1 earner (1,543) have the lowest median family income of $35,527, accounting for 8.3% and 50.1% of families, respectively.
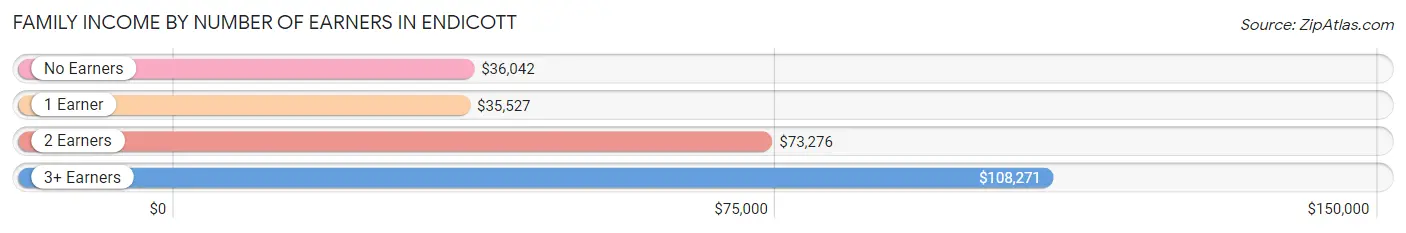
| Number of Earners | # Families | Median Income |
| No Earners | 485 (15.8%) | $36,042 |
| 1 Earner | 1,543 (50.1%) | $35,527 |
| 2 Earners | 796 (25.9%) | $73,276 |
| 3+ Earners | 255 (8.3%) | $108,271 |
| Total | 3,079 (100.0%) | $51,985 |
Household Income in Endicott
Household Income Brackets in Endicott
With 1,341 households falling in the category, the $50,000 to $74,999 income range is the most frequent in Endicott, accounting for 21.3% of all households. In contrast, only 63 households (1.0%) fall into the $200,000+ income bracket, making it the least populous group.
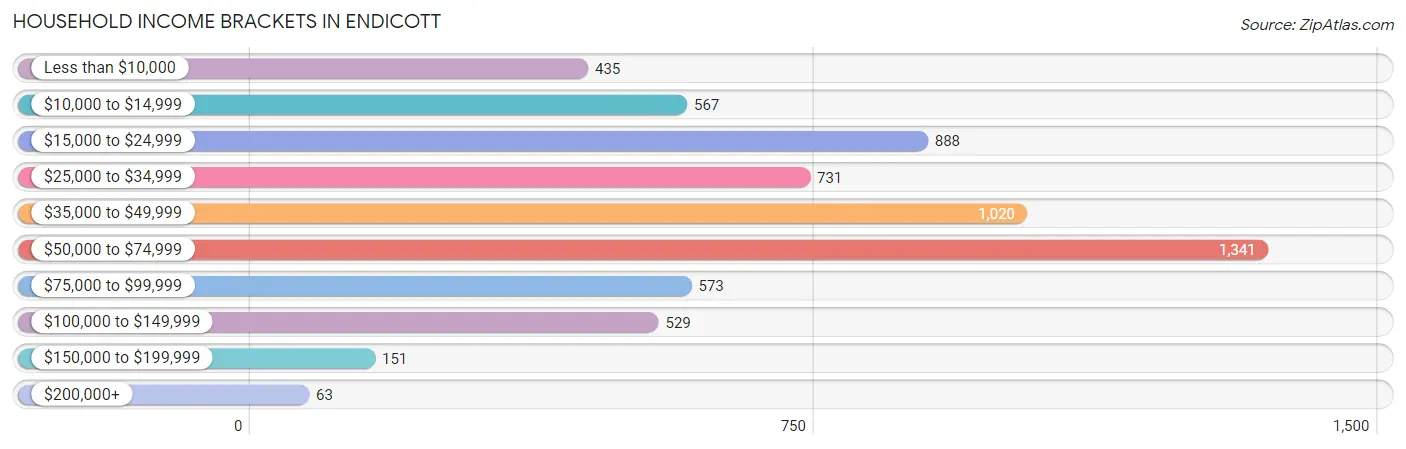
| Income Bracket | # Households | % Households |
| Less than $10,000 | 435 | 6.9% |
| $10,000 to $14,999 | 567 | 9.0% |
| $15,000 to $24,999 | 888 | 14.1% |
| $25,000 to $34,999 | 731 | 11.6% |
| $35,000 to $49,999 | 1,020 | 16.2% |
| $50,000 to $74,999 | 1,341 | 21.3% |
| $75,000 to $99,999 | 573 | 9.1% |
| $100,000 to $149,999 | 529 | 8.4% |
| $150,000 to $199,999 | 151 | 2.4% |
| $200,000+ | 63 | 1.0% |
Household Income by Householder Age in Endicott
The median household income in Endicott is $43,509, with the highest median household income of $53,095 found in the 45 to 64 years age bracket for the primary householder. A total of 1,914 households (30.4%) fall into this category. Meanwhile, the 15 to 24 years age bracket for the primary householder has the lowest median household income of $26,483, with 756 households (12.0%) in this group.
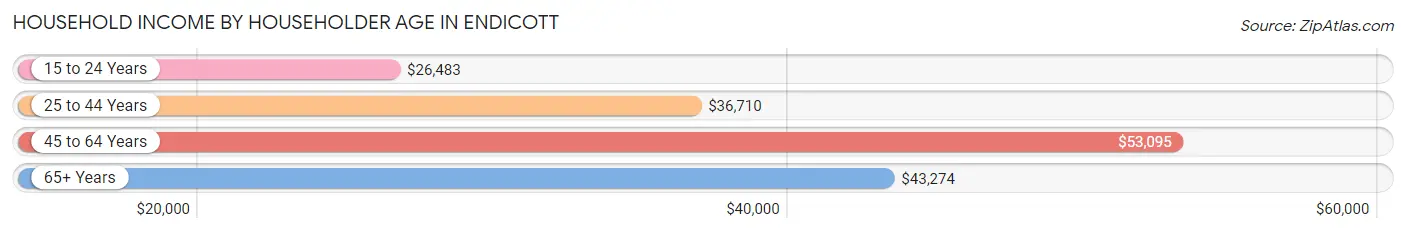
| Income Bracket | # Households | Median Income |
| 15 to 24 Years | 756 (12.0%) | $26,483 |
| 25 to 44 Years | 1,971 (31.3%) | $36,710 |
| 45 to 64 Years | 1,914 (30.4%) | $53,095 |
| 65+ Years | 1,657 (26.3%) | $43,274 |
| Total | 6,298 (100.0%) | $43,509 |
Poverty in Endicott
Income Below Poverty by Sex and Age in Endicott
With 28.7% poverty level for males and 30.2% for females among the residents of Endicott, 16 and 17 year old males and 16 and 17 year old females are the most vulnerable to poverty, with 92 males (52.3%) and 156 females (54.9%) in their respective age groups living below the poverty level.
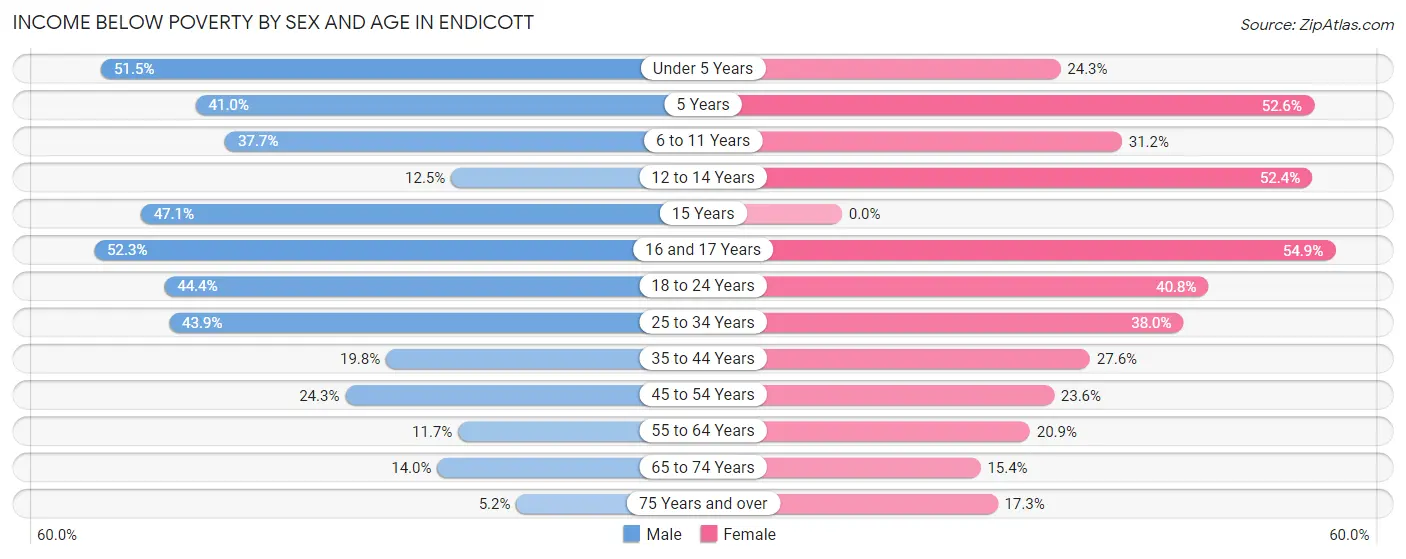
| Age Bracket | Male | Female |
| Under 5 Years | 207 (51.5%) | 74 (24.3%) |
| 5 Years | 43 (40.9%) | 41 (52.6%) |
| 6 to 11 Years | 159 (37.7%) | 140 (31.2%) |
| 12 to 14 Years | 26 (12.5%) | 155 (52.4%) |
| 15 Years | 40 (47.1%) | 0 (0.0%) |
| 16 and 17 Years | 92 (52.3%) | 156 (54.9%) |
| 18 to 24 Years | 328 (44.4%) | 424 (40.8%) |
| 25 to 34 Years | 454 (43.9%) | 324 (38.0%) |
| 35 to 44 Years | 143 (19.8%) | 210 (27.6%) |
| 45 to 54 Years | 137 (24.3%) | 192 (23.6%) |
| 55 to 64 Years | 105 (11.7%) | 156 (20.9%) |
| 65 to 74 Years | 65 (14.0%) | 90 (15.4%) |
| 75 Years and over | 29 (5.2%) | 90 (17.3%) |
| Total | 1,828 (28.7%) | 2,052 (30.2%) |
Income Above Poverty by Sex and Age in Endicott
According to the poverty statistics in Endicott, males aged 75 years and over and females aged 15 years are the age groups that are most secure financially, with 94.8% of males and 100.0% of females in these age groups living above the poverty line.
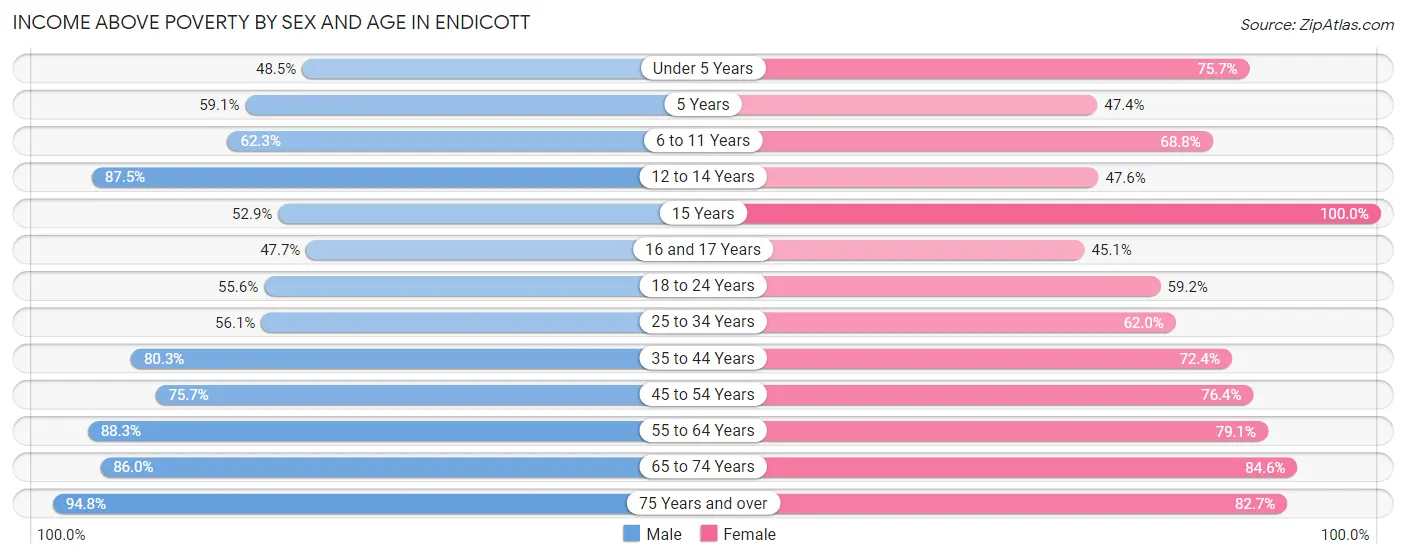
| Age Bracket | Male | Female |
| Under 5 Years | 195 (48.5%) | 230 (75.7%) |
| 5 Years | 62 (59.1%) | 37 (47.4%) |
| 6 to 11 Years | 263 (62.3%) | 309 (68.8%) |
| 12 to 14 Years | 182 (87.5%) | 141 (47.6%) |
| 15 Years | 45 (52.9%) | 79 (100.0%) |
| 16 and 17 Years | 84 (47.7%) | 128 (45.1%) |
| 18 to 24 Years | 410 (55.6%) | 615 (59.2%) |
| 25 to 34 Years | 580 (56.1%) | 528 (62.0%) |
| 35 to 44 Years | 581 (80.2%) | 550 (72.4%) |
| 45 to 54 Years | 427 (75.7%) | 621 (76.4%) |
| 55 to 64 Years | 791 (88.3%) | 589 (79.1%) |
| 65 to 74 Years | 398 (86.0%) | 493 (84.6%) |
| 75 Years and over | 524 (94.8%) | 429 (82.7%) |
| Total | 4,542 (71.3%) | 4,749 (69.8%) |
Income Below Poverty Among Married-Couple Families in Endicott
The poverty statistics for married-couple families in Endicott show that 8.9% or 138 of the total 1,542 families live below the poverty line. Families with 3 or 4 children have the highest poverty rate of 35.2%, comprising of 63 families. On the other hand, families with no children have the lowest poverty rate of 3.5%, which includes 33 families.
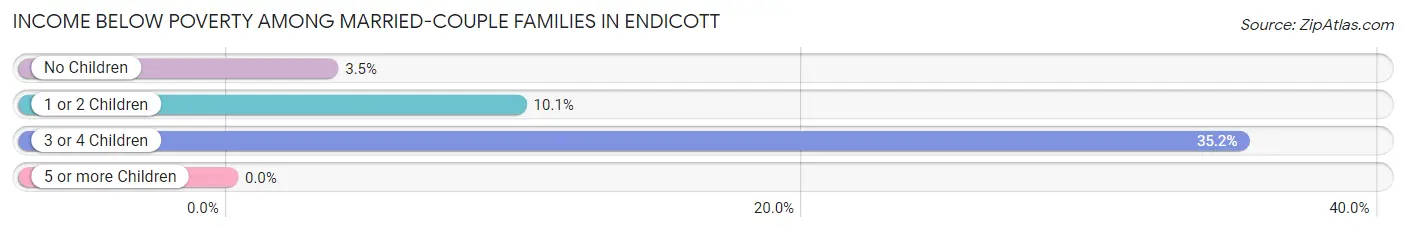
| Children | Above Poverty | Below Poverty |
| No Children | 912 (96.5%) | 33 (3.5%) |
| 1 or 2 Children | 376 (89.9%) | 42 (10.1%) |
| 3 or 4 Children | 116 (64.8%) | 63 (35.2%) |
| 5 or more Children | 0 (0.0%) | 0 (0.0%) |
| Total | 1,404 (91.0%) | 138 (8.9%) |
Income Below Poverty Among Single-Parent Households in Endicott
According to the poverty data in Endicott, 23.4% or 46 single-father households and 48.7% or 653 single-mother households are living below the poverty line. Among single-father households, those with 3 or 4 children have the highest poverty rate, with 19 households (100.0%) experiencing poverty. Likewise, among single-mother households, those with 3 or 4 children have the highest poverty rate, with 43 households (59.7%) falling below the poverty line.
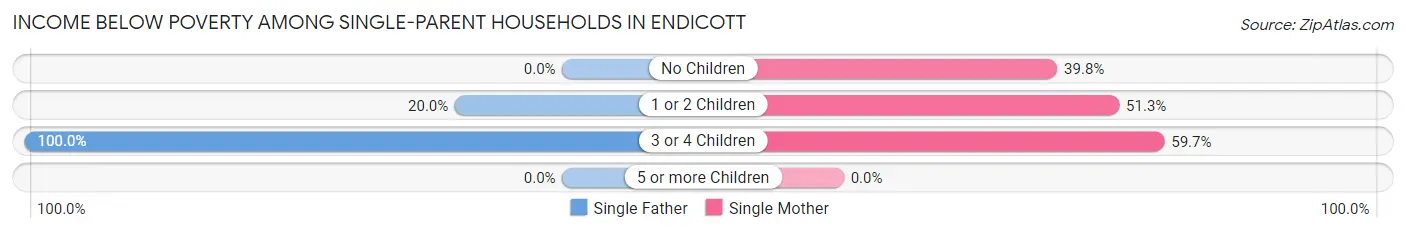
| Children | Single Father | Single Mother |
| No Children | 0 (0.0%) | 140 (39.8%) |
| 1 or 2 Children | 27 (20.0%) | 470 (51.3%) |
| 3 or 4 Children | 19 (100.0%) | 43 (59.7%) |
| 5 or more Children | 0 (0.0%) | 0 (0.0%) |
| Total | 46 (23.4%) | 653 (48.7%) |
Income Below Poverty Among Married-Couple vs Single-Parent Households in Endicott
The poverty data for Endicott shows that 138 of the married-couple family households (8.9%) and 699 of the single-parent households (45.5%) are living below the poverty level. Within the married-couple family households, those with 3 or 4 children have the highest poverty rate, with 63 households (35.2%) falling below the poverty line. Among the single-parent households, those with 3 or 4 children have the highest poverty rate, with 62 household (68.1%) living below poverty.
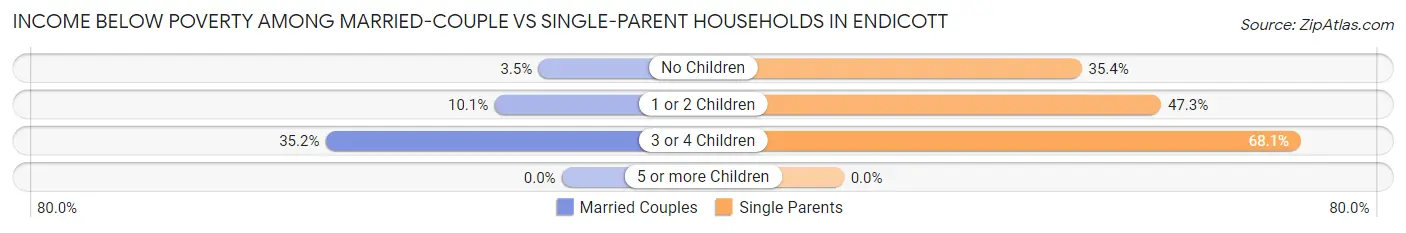
| Children | Married-Couple Families | Single-Parent Households |
| No Children | 33 (3.5%) | 140 (35.4%) |
| 1 or 2 Children | 42 (10.1%) | 497 (47.3%) |
| 3 or 4 Children | 63 (35.2%) | 62 (68.1%) |
| 5 or more Children | 0 (0.0%) | 0 (0.0%) |
| Total | 138 (8.9%) | 699 (45.5%) |
Employment Characteristics in Endicott
Employment by Class of Employer in Endicott
Among the 5,628 employed individuals in Endicott, private company employees (3,550 | 63.1%), not-for-profit organizations (858 | 15.2%), and state government employees (498 | 8.8%) make up the most common classes of employment.
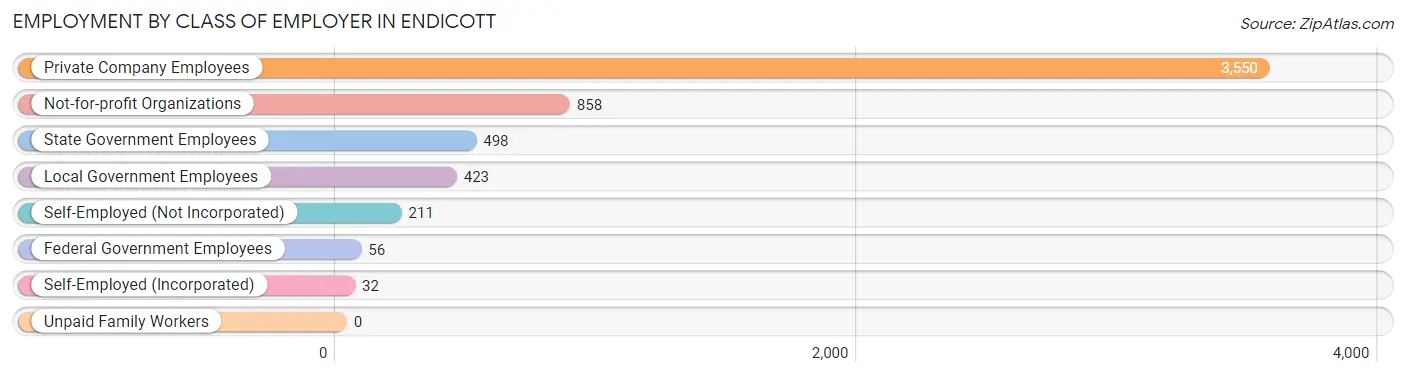
| Employer Class | # Employees | % Employees |
| Private Company Employees | 3,550 | 63.1% |
| Self-Employed (Incorporated) | 32 | 0.6% |
| Self-Employed (Not Incorporated) | 211 | 3.7% |
| Not-for-profit Organizations | 858 | 15.2% |
| Local Government Employees | 423 | 7.5% |
| State Government Employees | 498 | 8.8% |
| Federal Government Employees | 56 | 1.0% |
| Unpaid Family Workers | 0 | 0.0% |
| Total | 5,628 | 100.0% |
Employment Status by Age in Endicott
According to the labor force statistics for Endicott, out of the total population over 16 years of age (11,050), 56.4% or 6,232 individuals are in the labor force, with 7.5% or 467 of them unemployed. The age group with the highest labor force participation rate is 35 to 44 years, with 79.2% or 1,175 individuals in the labor force. Within the labor force, the 30 to 34 years age range has the highest percentage of unemployed individuals, with 15.1% or 110 of them being unemployed.
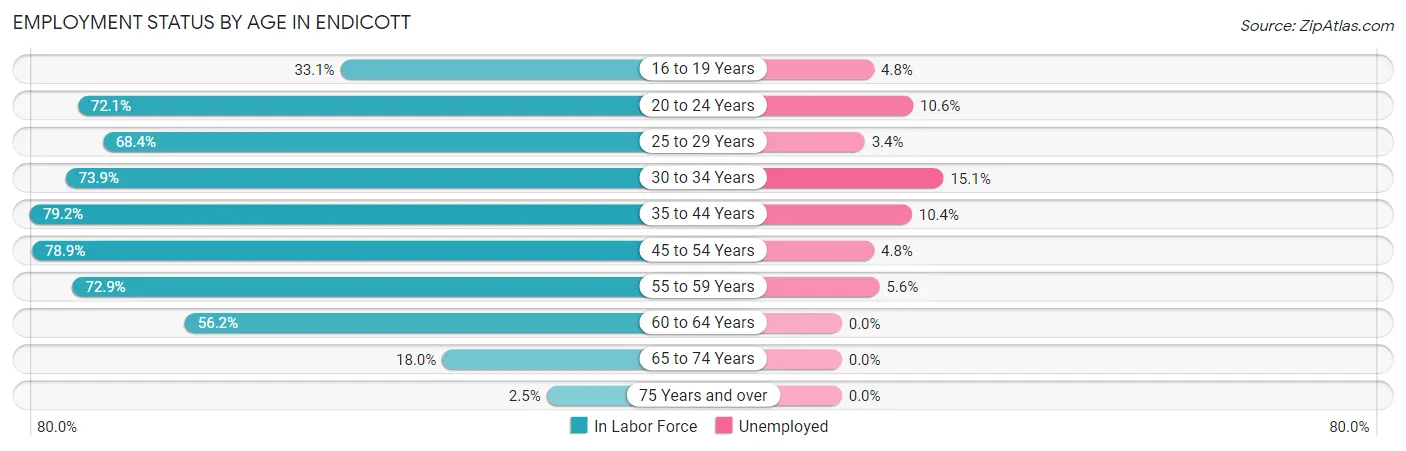
| Age Bracket | In Labor Force | Unemployed |
| 16 to 19 Years | 269 (33.1%) | 13 (4.8%) |
| 20 to 24 Years | 1,035 (72.1%) | 110 (10.6%) |
| 25 to 29 Years | 616 (68.4%) | 21 (3.4%) |
| 30 to 34 Years | 728 (73.9%) | 110 (15.1%) |
| 35 to 44 Years | 1,175 (79.2%) | 122 (10.4%) |
| 45 to 54 Years | 1,086 (78.9%) | 52 (4.8%) |
| 55 to 59 Years | 666 (72.9%) | 37 (5.6%) |
| 60 to 64 Years | 429 (56.2%) | 0 (0.0%) |
| 65 to 74 Years | 194 (18.0%) | 0 (0.0%) |
| 75 Years and over | 32 (2.5%) | 0 (0.0%) |
| Total | 6,232 (56.4%) | 467 (7.5%) |
Employment Status by Educational Attainment in Endicott
According to labor force statistics for Endicott, 73.2% of individuals (4,703) out of the total population between 25 and 64 years of age (6,425) are in the labor force, with 7.3% or 343 of them being unemployed. The group with the highest labor force participation rate are those with the educational attainment of bachelor's degree or higher, with 89.5% or 1,197 individuals in the labor force. Within the labor force, individuals with high school diploma education have the highest percentage of unemployment, with 12.2% or 177 of them being unemployed.
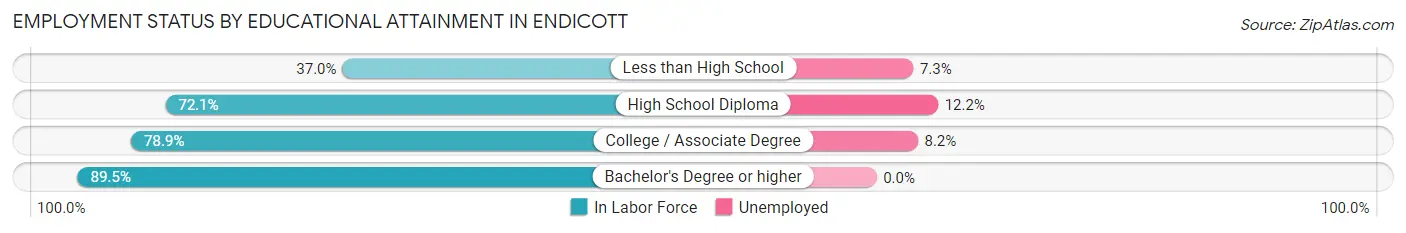
| Educational Attainment | In Labor Force | Unemployed |
| Less than High School | 328 (37.0%) | 65 (7.3%) |
| High School Diploma | 1,449 (72.1%) | 245 (12.2%) |
| College / Associate Degree | 1,729 (78.9%) | 180 (8.2%) |
| Bachelor's Degree or higher | 1,197 (89.5%) | 0 (0.0%) |
| Total | 4,703 (73.2%) | 469 (7.3%) |
Employment Occupations by Sex in Endicott
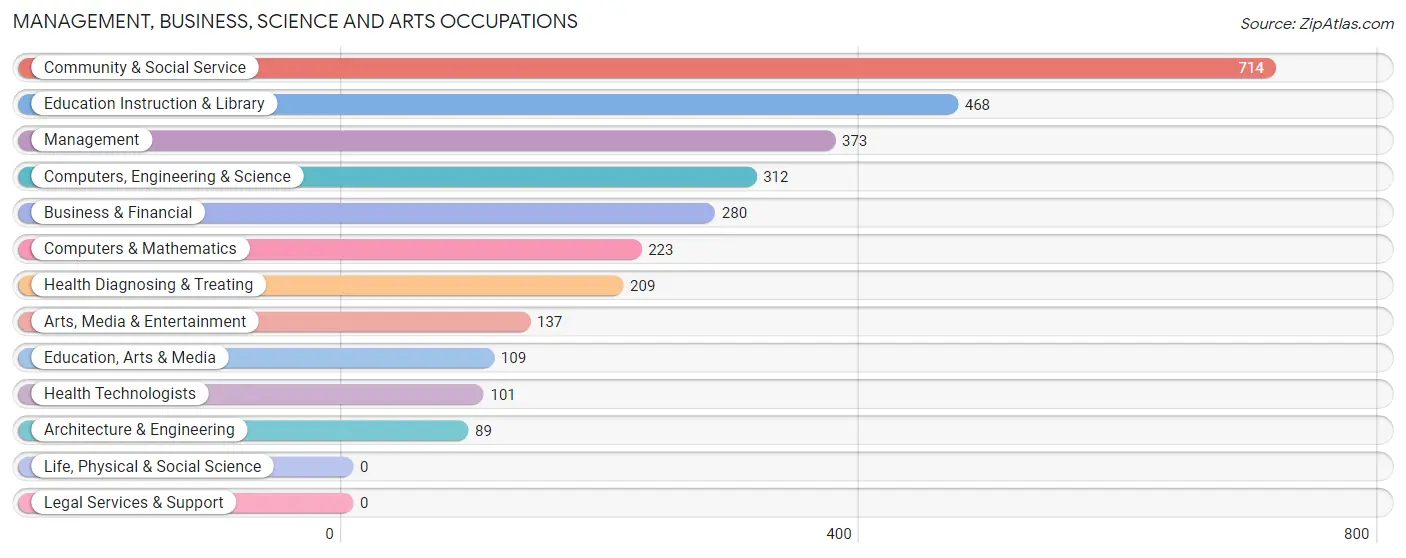
Management, Business, Science and Arts Occupations
The most common Management, Business, Science and Arts occupations in Endicott are Community & Social Service (714 | 12.4%), Education Instruction & Library (468 | 8.1%), Management (373 | 6.5%), Computers, Engineering & Science (312 | 5.4%), and Business & Financial (280 | 4.9%).
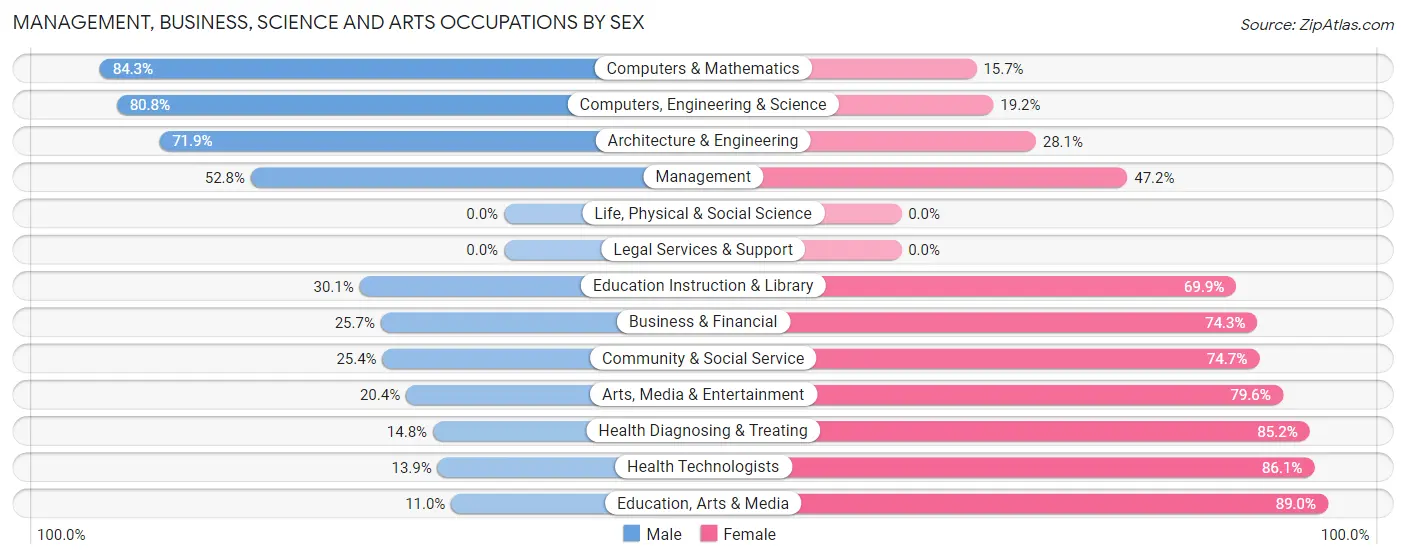
Management, Business, Science and Arts Occupations by Sex
Within the Management, Business, Science and Arts occupations in Endicott, the most male-oriented occupations are Computers & Mathematics (84.3%), Computers, Engineering & Science (80.8%), and Architecture & Engineering (71.9%), while the most female-oriented occupations are Education, Arts & Media (89.0%), Health Technologists (86.1%), and Health Diagnosing & Treating (85.2%).
| Occupation | Male | Female |
| Management | 197 (52.8%) | 176 (47.2%) |
| Business & Financial | 72 (25.7%) | 208 (74.3%) |
| Computers, Engineering & Science | 252 (80.8%) | 60 (19.2%) |
| Computers & Mathematics | 188 (84.3%) | 35 (15.7%) |
| Architecture & Engineering | 64 (71.9%) | 25 (28.1%) |
| Life, Physical & Social Science | 0 (0.0%) | 0 (0.0%) |
| Community & Social Service | 181 (25.4%) | 533 (74.7%) |
| Education, Arts & Media | 12 (11.0%) | 97 (89.0%) |
| Legal Services & Support | 0 (0.0%) | 0 (0.0%) |
| Education Instruction & Library | 141 (30.1%) | 327 (69.9%) |
| Arts, Media & Entertainment | 28 (20.4%) | 109 (79.6%) |
| Health Diagnosing & Treating | 31 (14.8%) | 178 (85.2%) |
| Health Technologists | 14 (13.9%) | 87 (86.1%) |
| Total (Category) | 733 (38.8%) | 1,155 (61.2%) |
| Total (Overall) | 2,659 (46.1%) | 3,107 (53.9%) |
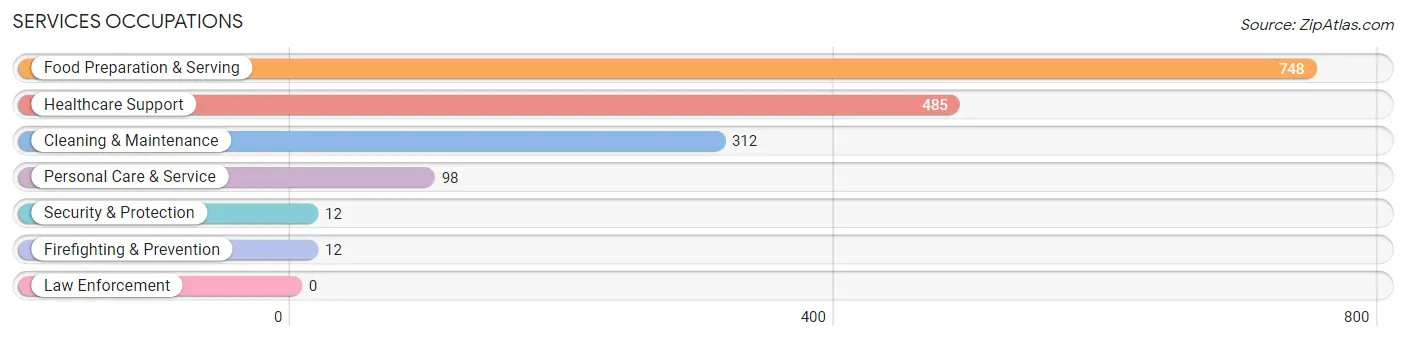
Services Occupations
The most common Services occupations in Endicott are Food Preparation & Serving (748 | 13.0%), Healthcare Support (485 | 8.4%), Cleaning & Maintenance (312 | 5.4%), Personal Care & Service (98 | 1.7%), and Security & Protection (12 | 0.2%).
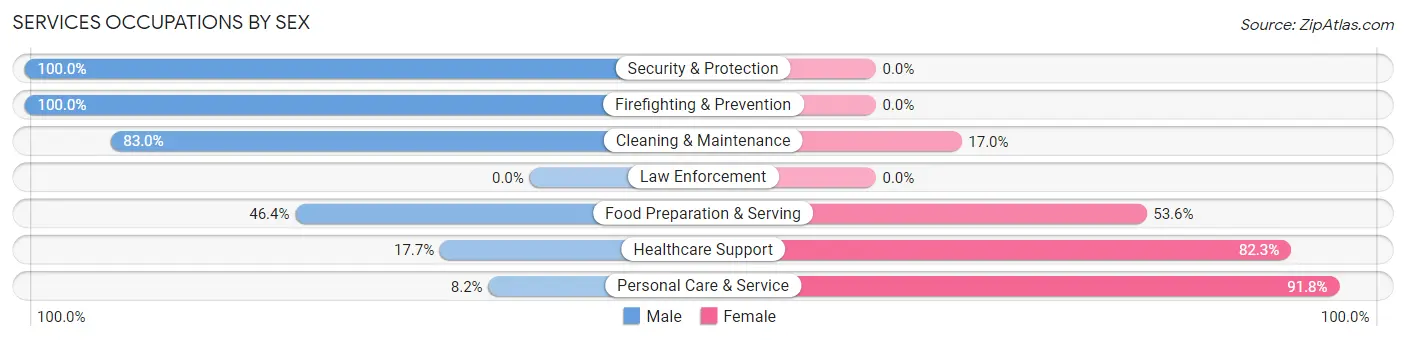
Services Occupations by Sex
Within the Services occupations in Endicott, the most male-oriented occupations are Security & Protection (100.0%), Firefighting & Prevention (100.0%), and Cleaning & Maintenance (83.0%), while the most female-oriented occupations are Personal Care & Service (91.8%), Healthcare Support (82.3%), and Food Preparation & Serving (53.6%).
| Occupation | Male | Female |
| Healthcare Support | 86 (17.7%) | 399 (82.3%) |
| Security & Protection | 12 (100.0%) | 0 (0.0%) |
| Firefighting & Prevention | 12 (100.0%) | 0 (0.0%) |
| Law Enforcement | 0 (0.0%) | 0 (0.0%) |
| Food Preparation & Serving | 347 (46.4%) | 401 (53.6%) |
| Cleaning & Maintenance | 259 (83.0%) | 53 (17.0%) |
| Personal Care & Service | 8 (8.2%) | 90 (91.8%) |
| Total (Category) | 712 (43.0%) | 943 (57.0%) |
| Total (Overall) | 2,659 (46.1%) | 3,107 (53.9%) |
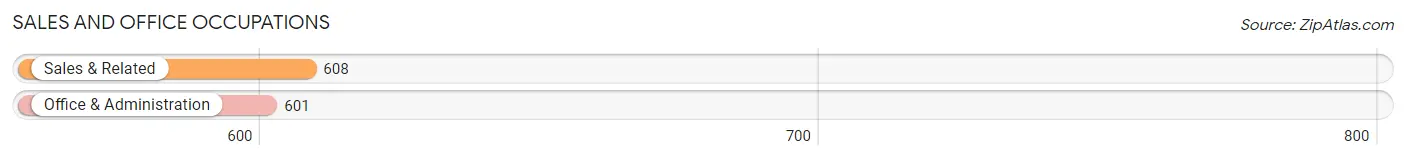
Sales and Office Occupations
The most common Sales and Office occupations in Endicott are Sales & Related (608 | 10.5%), and Office & Administration (601 | 10.4%).
Sales and Office Occupations by Sex
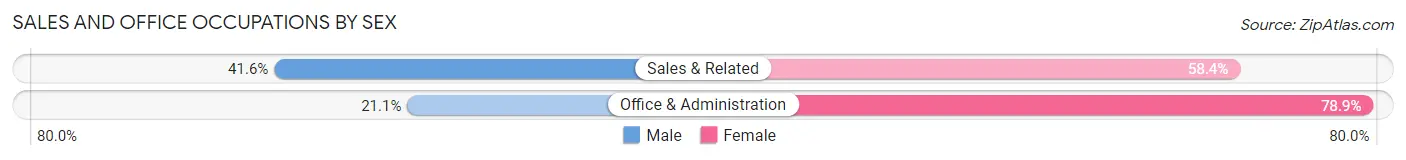
| Occupation | Male | Female |
| Sales & Related | 253 (41.6%) | 355 (58.4%) |
| Office & Administration | 127 (21.1%) | 474 (78.9%) |
| Total (Category) | 380 (31.4%) | 829 (68.6%) |
| Total (Overall) | 2,659 (46.1%) | 3,107 (53.9%) |
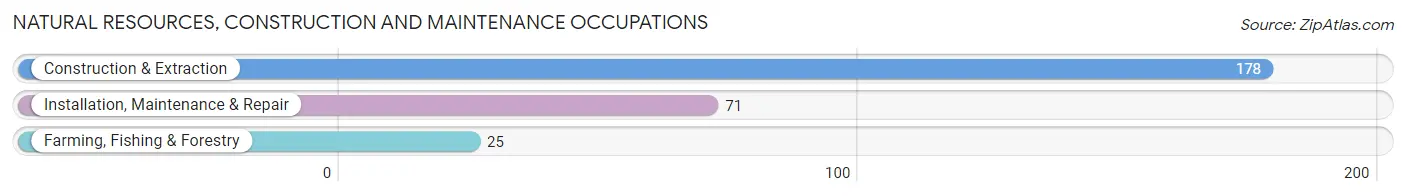
Natural Resources, Construction and Maintenance Occupations
The most common Natural Resources, Construction and Maintenance occupations in Endicott are Construction & Extraction (178 | 3.1%), Installation, Maintenance & Repair (71 | 1.2%), and Farming, Fishing & Forestry (25 | 0.4%).
Natural Resources, Construction and Maintenance Occupations by Sex
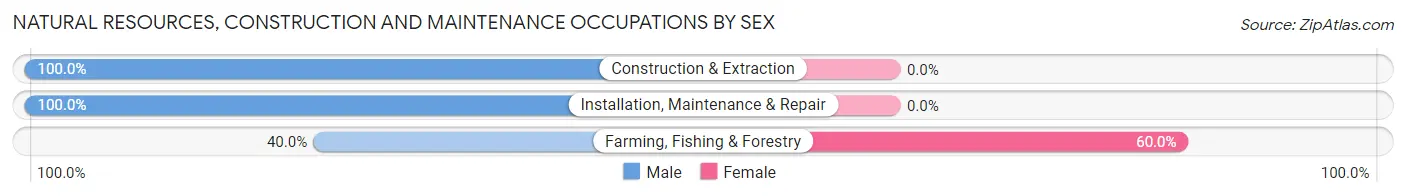
| Occupation | Male | Female |
| Farming, Fishing & Forestry | 10 (40.0%) | 15 (60.0%) |
| Construction & Extraction | 178 (100.0%) | 0 (0.0%) |
| Installation, Maintenance & Repair | 71 (100.0%) | 0 (0.0%) |
| Total (Category) | 259 (94.5%) | 15 (5.5%) |
| Total (Overall) | 2,659 (46.1%) | 3,107 (53.9%) |
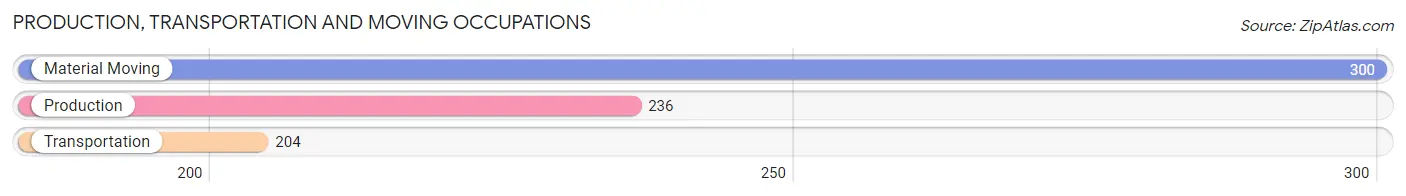
Production, Transportation and Moving Occupations
The most common Production, Transportation and Moving occupations in Endicott are Material Moving (300 | 5.2%), Production (236 | 4.1%), and Transportation (204 | 3.5%).
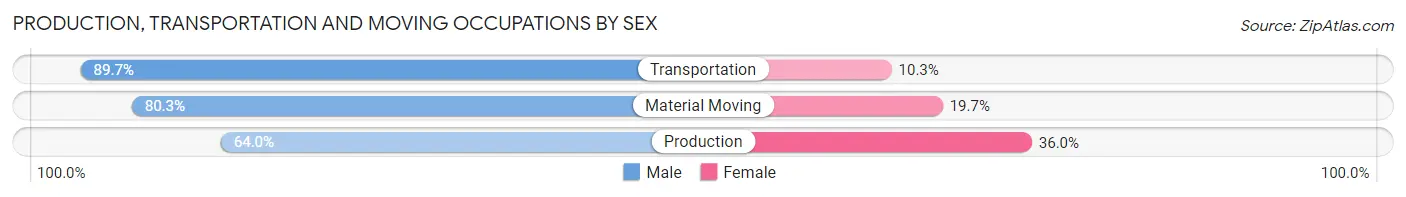
Production, Transportation and Moving Occupations by Sex
| Occupation | Male | Female |
| Production | 151 (64.0%) | 85 (36.0%) |
| Transportation | 183 (89.7%) | 21 (10.3%) |
| Material Moving | 241 (80.3%) | 59 (19.7%) |
| Total (Category) | 575 (77.7%) | 165 (22.3%) |
| Total (Overall) | 2,659 (46.1%) | 3,107 (53.9%) |
Employment Industries by Sex in Endicott
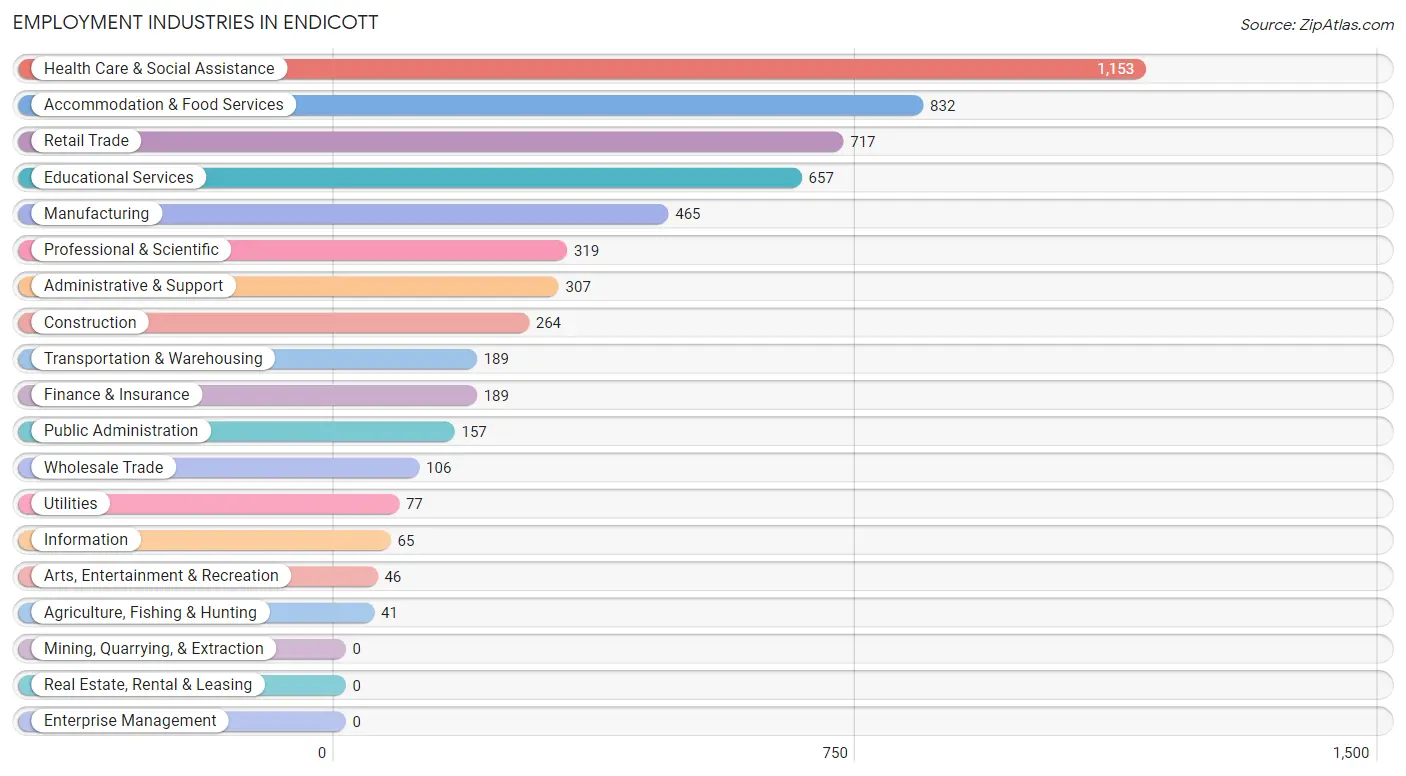
Employment Industries in Endicott
The major employment industries in Endicott include Health Care & Social Assistance (1,153 | 20.0%), Accommodation & Food Services (832 | 14.4%), Retail Trade (717 | 12.4%), Educational Services (657 | 11.4%), and Manufacturing (465 | 8.1%).
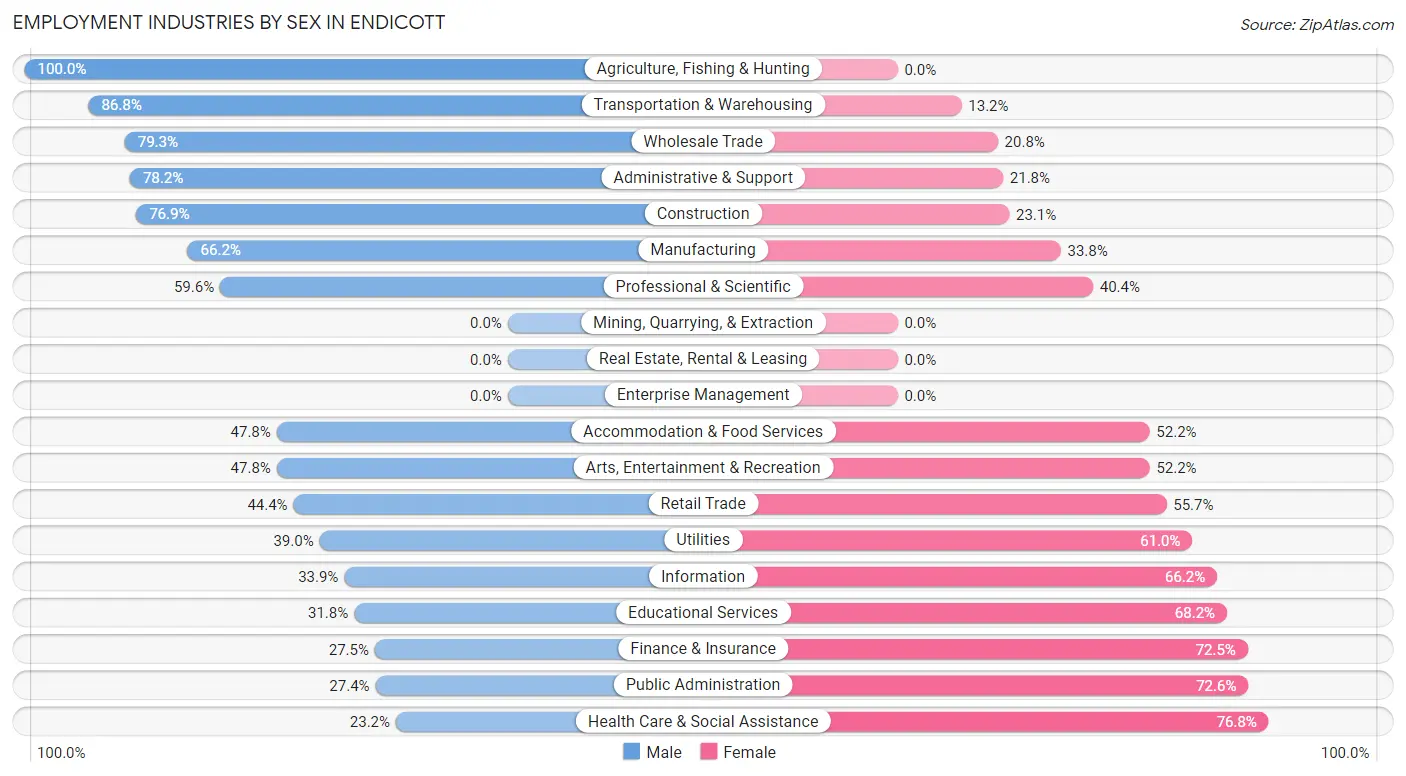
Employment Industries by Sex in Endicott
The Endicott industries that see more men than women are Agriculture, Fishing & Hunting (100.0%), Transportation & Warehousing (86.8%), and Wholesale Trade (79.2%), whereas the industries that tend to have a higher number of women are Health Care & Social Assistance (76.8%), Public Administration (72.6%), and Finance & Insurance (72.5%).
| Industry | Male | Female |
| Agriculture, Fishing & Hunting | 41 (100.0%) | 0 (0.0%) |
| Mining, Quarrying, & Extraction | 0 (0.0%) | 0 (0.0%) |
| Construction | 203 (76.9%) | 61 (23.1%) |
| Manufacturing | 308 (66.2%) | 157 (33.8%) |
| Wholesale Trade | 84 (79.2%) | 22 (20.7%) |
| Retail Trade | 318 (44.4%) | 399 (55.6%) |
| Transportation & Warehousing | 164 (86.8%) | 25 (13.2%) |
| Utilities | 30 (39.0%) | 47 (61.0%) |
| Information | 22 (33.9%) | 43 (66.1%) |
| Finance & Insurance | 52 (27.5%) | 137 (72.5%) |
| Real Estate, Rental & Leasing | 0 (0.0%) | 0 (0.0%) |
| Professional & Scientific | 190 (59.6%) | 129 (40.4%) |
| Enterprise Management | 0 (0.0%) | 0 (0.0%) |
| Administrative & Support | 240 (78.2%) | 67 (21.8%) |
| Educational Services | 209 (31.8%) | 448 (68.2%) |
| Health Care & Social Assistance | 267 (23.2%) | 886 (76.8%) |
| Arts, Entertainment & Recreation | 22 (47.8%) | 24 (52.2%) |
| Accommodation & Food Services | 398 (47.8%) | 434 (52.2%) |
| Public Administration | 43 (27.4%) | 114 (72.6%) |
| Total | 2,659 (46.1%) | 3,107 (53.9%) |
Education in Endicott
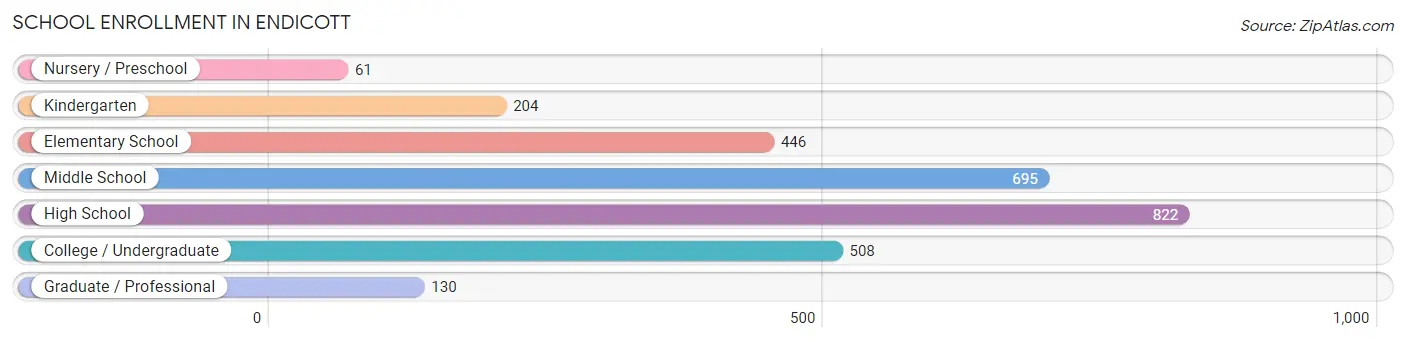
School Enrollment in Endicott
The most common levels of schooling among the 2,866 students in Endicott are high school (822 | 28.7%), middle school (695 | 24.2%), and college / undergraduate (508 | 17.7%).
| School Level | # Students | % Students |
| Nursery / Preschool | 61 | 2.1% |
| Kindergarten | 204 | 7.1% |
| Elementary School | 446 | 15.6% |
| Middle School | 695 | 24.2% |
| High School | 822 | 28.7% |
| College / Undergraduate | 508 | 17.7% |
| Graduate / Professional | 130 | 4.5% |
| Total | 2,866 | 100.0% |
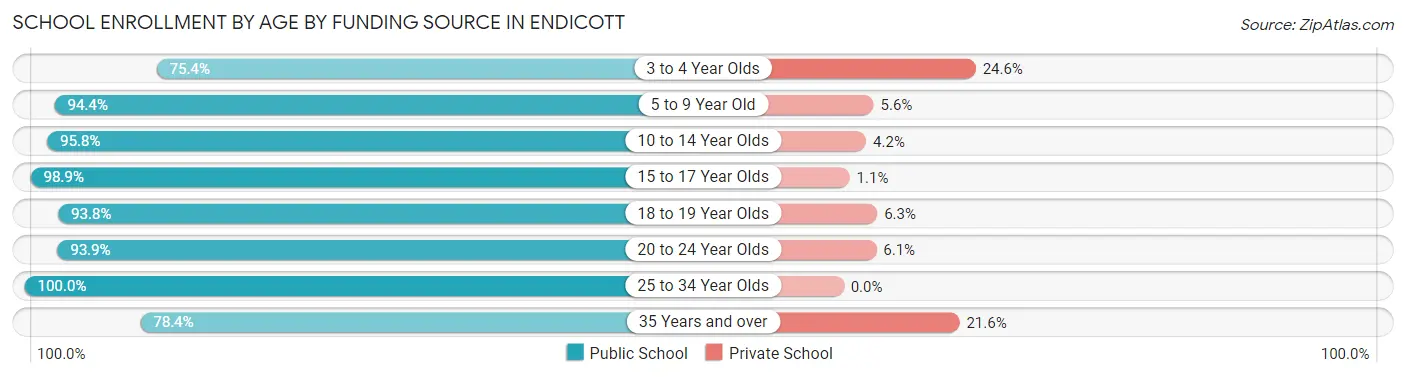
School Enrollment by Age by Funding Source in Endicott
Out of a total of 2,866 students who are enrolled in schools in Endicott, 146 (5.1%) attend a private institution, while the remaining 2,720 (94.9%) are enrolled in public schools. The age group of 3 to 4 year olds has the highest likelihood of being enrolled in private schools, with 15 (24.6% in the age bracket) enrolled. Conversely, the age group of 25 to 34 year olds has the lowest likelihood of being enrolled in a private school, with 108 (100.0% in the age bracket) attending a public institution.
| Age Bracket | Public School | Private School |
| 3 to 4 Year Olds | 46 (75.4%) | 15 (24.6%) |
| 5 to 9 Year Old | 575 (94.4%) | 34 (5.6%) |
| 10 to 14 Year Olds | 823 (95.8%) | 36 (4.2%) |
| 15 to 17 Year Olds | 617 (98.9%) | 7 (1.1%) |
| 18 to 19 Year Olds | 210 (93.8%) | 14 (6.2%) |
| 20 to 24 Year Olds | 262 (93.9%) | 17 (6.1%) |
| 25 to 34 Year Olds | 108 (100.0%) | 0 (0.0%) |
| 35 Years and over | 80 (78.4%) | 22 (21.6%) |
| Total | 2,720 (94.9%) | 146 (5.1%) |
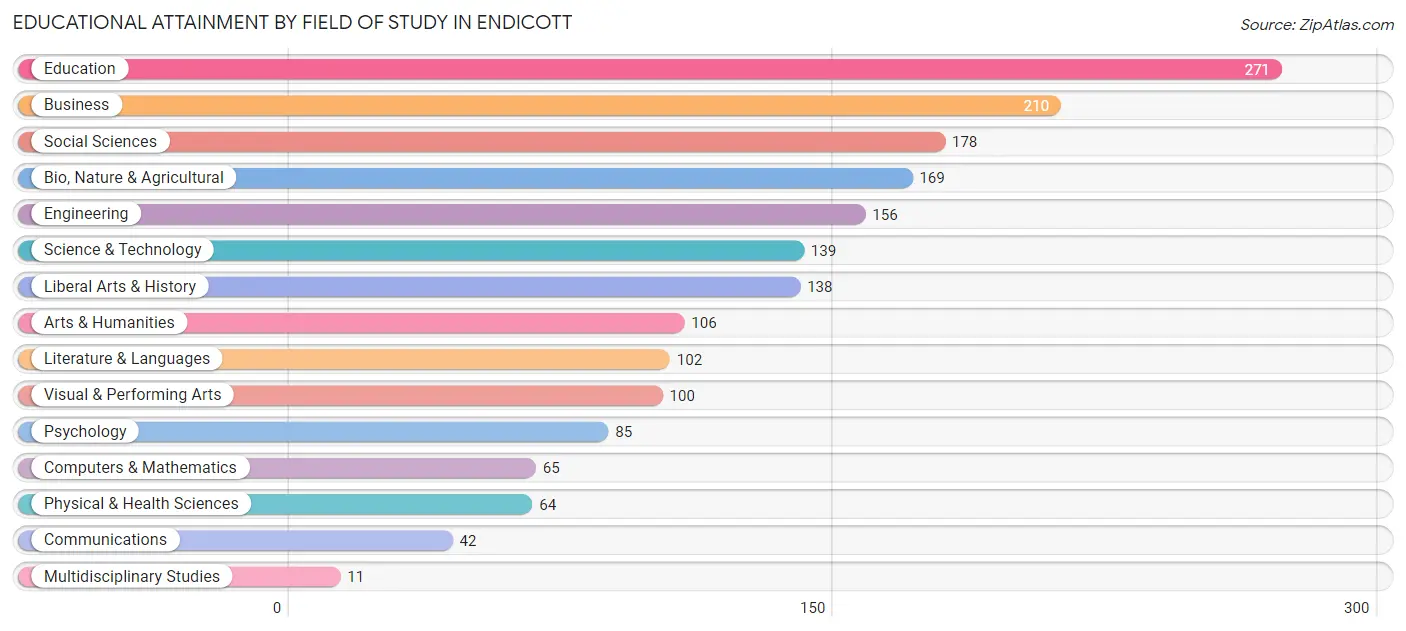
Educational Attainment by Field of Study in Endicott
Education (271 | 14.8%), business (210 | 11.4%), social sciences (178 | 9.7%), bio, nature & agricultural (169 | 9.2%), and engineering (156 | 8.5%) are the most common fields of study among 1,836 individuals in Endicott who have obtained a bachelor's degree or higher.
| Field of Study | # Graduates | % Graduates |
| Computers & Mathematics | 65 | 3.5% |
| Bio, Nature & Agricultural | 169 | 9.2% |
| Physical & Health Sciences | 64 | 3.5% |
| Psychology | 85 | 4.6% |
| Social Sciences | 178 | 9.7% |
| Engineering | 156 | 8.5% |
| Multidisciplinary Studies | 11 | 0.6% |
| Science & Technology | 139 | 7.6% |
| Business | 210 | 11.4% |
| Education | 271 | 14.8% |
| Literature & Languages | 102 | 5.6% |
| Liberal Arts & History | 138 | 7.5% |
| Visual & Performing Arts | 100 | 5.4% |
| Communications | 42 | 2.3% |
| Arts & Humanities | 106 | 5.8% |
| Total | 1,836 | 100.0% |
Transportation & Commute in Endicott
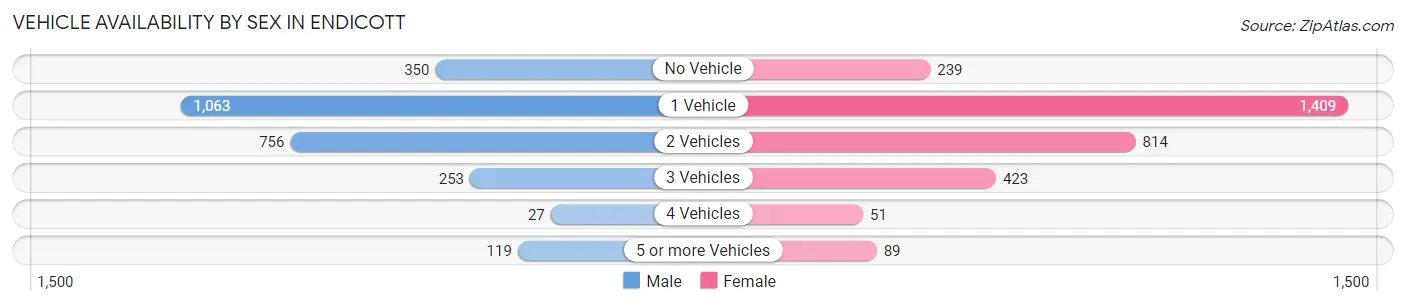
Vehicle Availability by Sex in Endicott
The most prevalent vehicle ownership categories in Endicott are males with 1 vehicle (1,063, accounting for 41.4%) and females with 1 vehicle (1,409, making up 35.1%).
| Vehicles Available | Male | Female |
| No Vehicle | 350 (13.6%) | 239 (7.9%) |
| 1 Vehicle | 1,063 (41.4%) | 1,409 (46.6%) |
| 2 Vehicles | 756 (29.4%) | 814 (26.9%) |
| 3 Vehicles | 253 (9.9%) | 423 (14.0%) |
| 4 Vehicles | 27 (1.1%) | 51 (1.7%) |
| 5 or more Vehicles | 119 (4.6%) | 89 (2.9%) |
| Total | 2,568 (100.0%) | 3,025 (100.0%) |
Commute Time in Endicott
The most frequently occuring commute durations in Endicott are 15 to 19 minutes (1,230 commuters, 23.3%), 20 to 24 minutes (973 commuters, 18.4%), and 10 to 14 minutes (802 commuters, 15.2%).
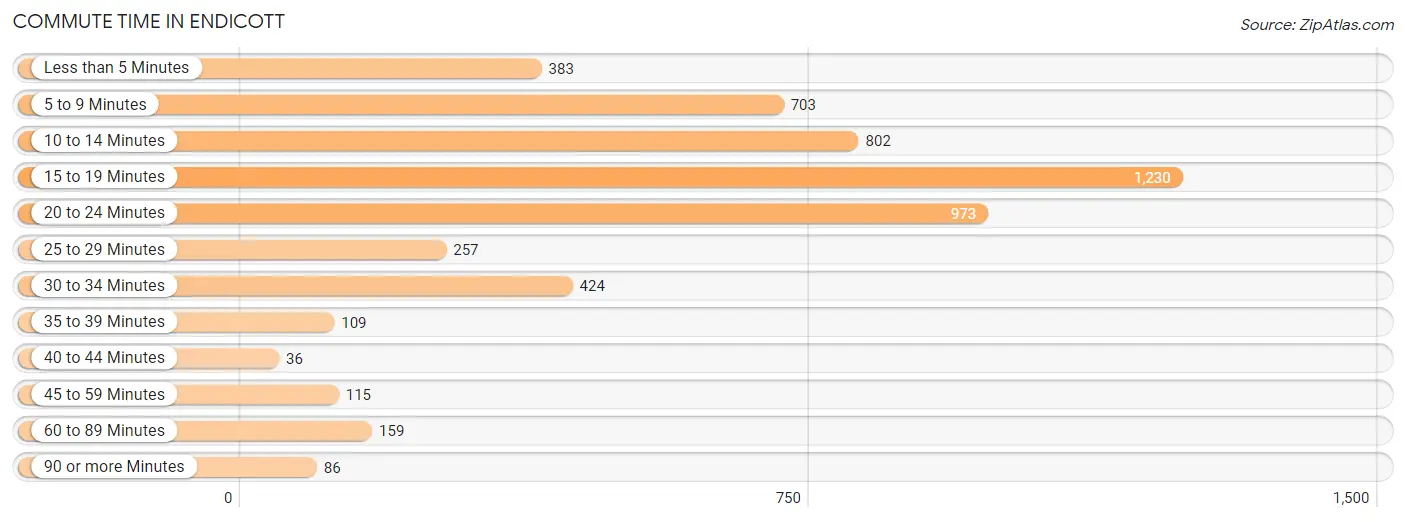
| Commute Time | # Commuters | % Commuters |
| Less than 5 Minutes | 383 | 7.3% |
| 5 to 9 Minutes | 703 | 13.3% |
| 10 to 14 Minutes | 802 | 15.2% |
| 15 to 19 Minutes | 1,230 | 23.3% |
| 20 to 24 Minutes | 973 | 18.4% |
| 25 to 29 Minutes | 257 | 4.9% |
| 30 to 34 Minutes | 424 | 8.0% |
| 35 to 39 Minutes | 109 | 2.1% |
| 40 to 44 Minutes | 36 | 0.7% |
| 45 to 59 Minutes | 115 | 2.2% |
| 60 to 89 Minutes | 159 | 3.0% |
| 90 or more Minutes | 86 | 1.6% |
Commute Time by Sex in Endicott
The most common commute times in Endicott are 10 to 14 minutes (480 commuters, 19.7%) for males and 15 to 19 minutes (798 commuters, 28.1%) for females.
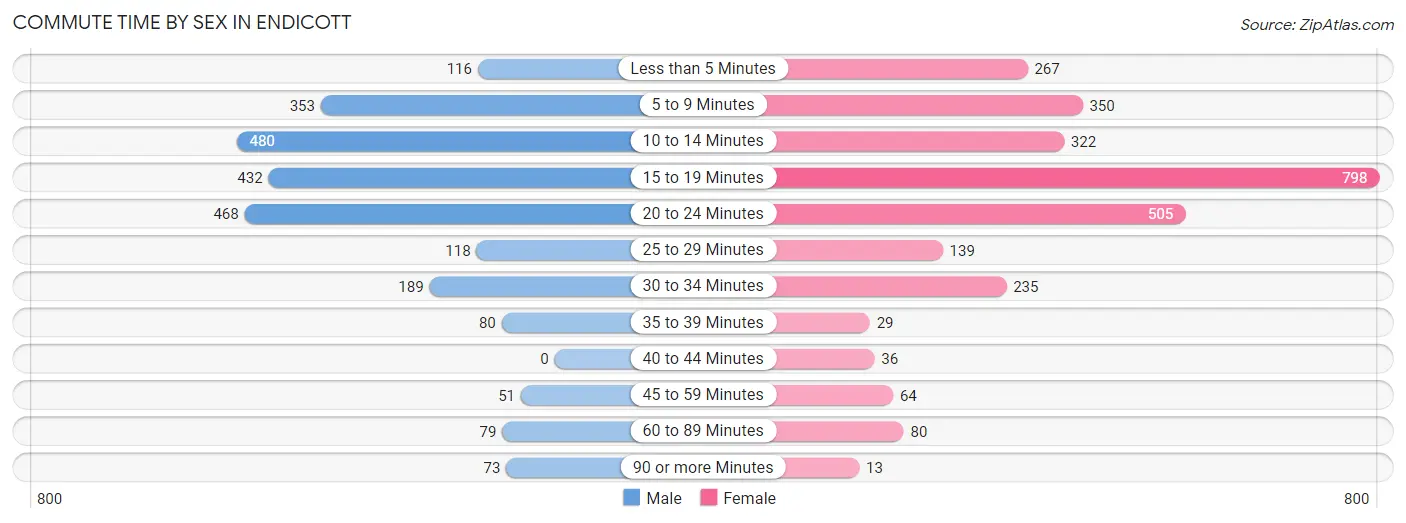
| Commute Time | Male | Female |
| Less than 5 Minutes | 116 (4.8%) | 267 (9.4%) |
| 5 to 9 Minutes | 353 (14.5%) | 350 (12.3%) |
| 10 to 14 Minutes | 480 (19.7%) | 322 (11.4%) |
| 15 to 19 Minutes | 432 (17.7%) | 798 (28.1%) |
| 20 to 24 Minutes | 468 (19.2%) | 505 (17.8%) |
| 25 to 29 Minutes | 118 (4.8%) | 139 (4.9%) |
| 30 to 34 Minutes | 189 (7.7%) | 235 (8.3%) |
| 35 to 39 Minutes | 80 (3.3%) | 29 (1.0%) |
| 40 to 44 Minutes | 0 (0.0%) | 36 (1.3%) |
| 45 to 59 Minutes | 51 (2.1%) | 64 (2.3%) |
| 60 to 89 Minutes | 79 (3.2%) | 80 (2.8%) |
| 90 or more Minutes | 73 (3.0%) | 13 (0.5%) |
Time of Departure to Work by Sex in Endicott
The most frequent times of departure to work in Endicott are 7:00 AM to 7:29 AM (472, 19.4%) for males and 8:00 AM to 8:29 AM (439, 15.5%) for females.
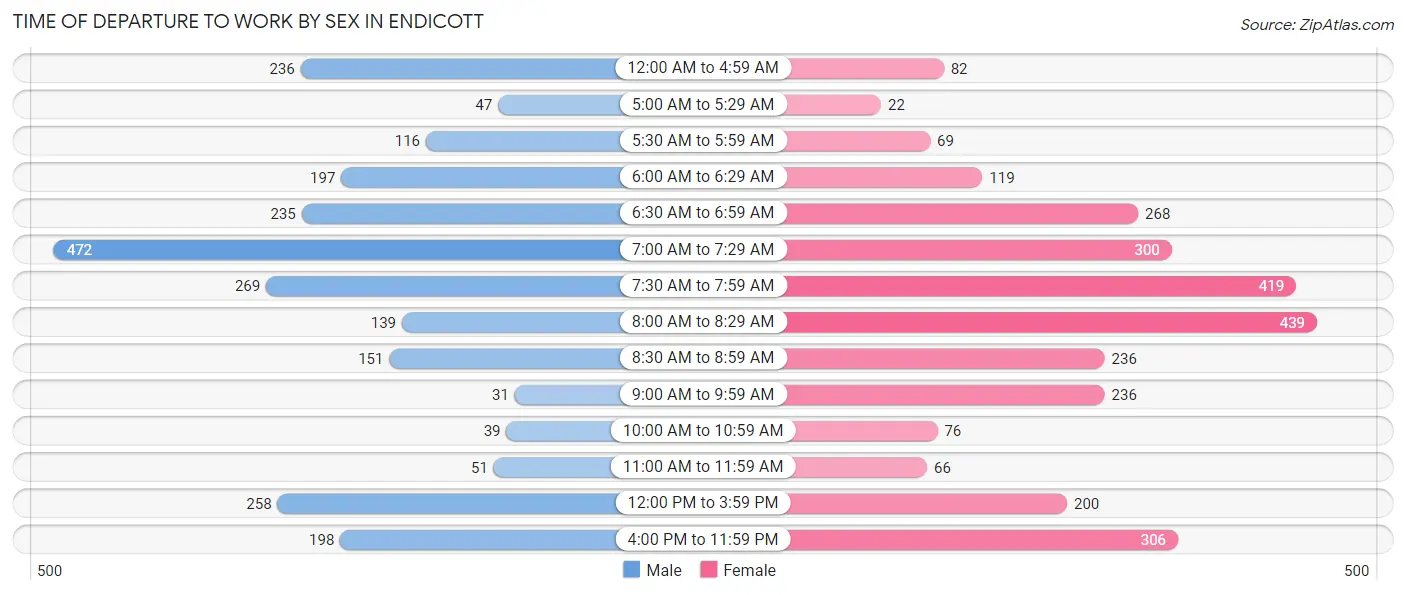
| Time of Departure | Male | Female |
| 12:00 AM to 4:59 AM | 236 (9.7%) | 82 (2.9%) |
| 5:00 AM to 5:29 AM | 47 (1.9%) | 22 (0.8%) |
| 5:30 AM to 5:59 AM | 116 (4.8%) | 69 (2.4%) |
| 6:00 AM to 6:29 AM | 197 (8.1%) | 119 (4.2%) |
| 6:30 AM to 6:59 AM | 235 (9.6%) | 268 (9.4%) |
| 7:00 AM to 7:29 AM | 472 (19.4%) | 300 (10.6%) |
| 7:30 AM to 7:59 AM | 269 (11.0%) | 419 (14.8%) |
| 8:00 AM to 8:29 AM | 139 (5.7%) | 439 (15.5%) |
| 8:30 AM to 8:59 AM | 151 (6.2%) | 236 (8.3%) |
| 9:00 AM to 9:59 AM | 31 (1.3%) | 236 (8.3%) |
| 10:00 AM to 10:59 AM | 39 (1.6%) | 76 (2.7%) |
| 11:00 AM to 11:59 AM | 51 (2.1%) | 66 (2.3%) |
| 12:00 PM to 3:59 PM | 258 (10.6%) | 200 (7.0%) |
| 4:00 PM to 11:59 PM | 198 (8.1%) | 306 (10.8%) |
| Total | 2,439 (100.0%) | 2,838 (100.0%) |
Housing Occupancy in Endicott
Occupancy by Ownership in Endicott
Of the total 6,298 dwellings in Endicott, owner-occupied units account for 2,523 (40.1%), while renter-occupied units make up 3,775 (59.9%).
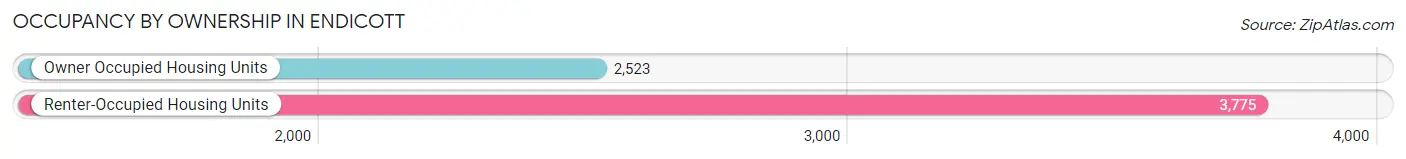
| Occupancy | # Housing Units | % Housing Units |
| Owner Occupied Housing Units | 2,523 | 40.1% |
| Renter-Occupied Housing Units | 3,775 | 59.9% |
| Total Occupied Housing Units | 6,298 | 100.0% |
Occupancy by Household Size in Endicott
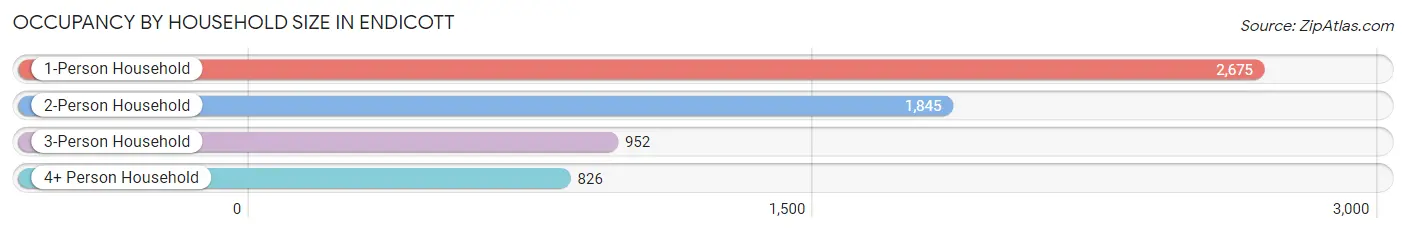
| Household Size | # Housing Units | % Housing Units |
| 1-Person Household | 2,675 | 42.5% |
| 2-Person Household | 1,845 | 29.3% |
| 3-Person Household | 952 | 15.1% |
| 4+ Person Household | 826 | 13.1% |
| Total Housing Units | 6,298 | 100.0% |
Occupancy by Ownership by Household Size in Endicott
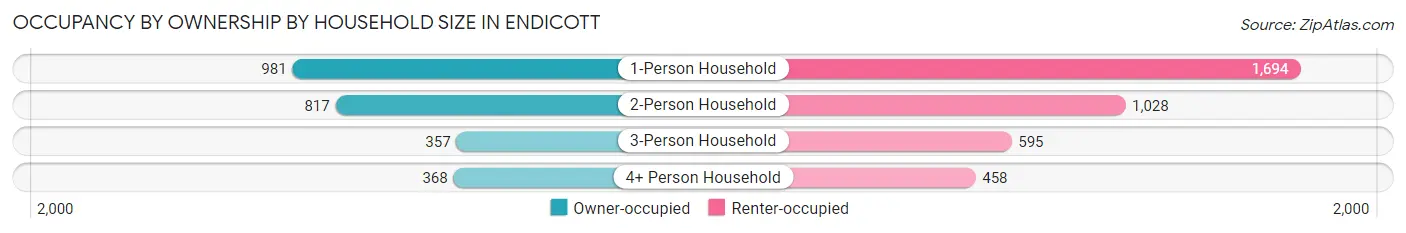
| Household Size | Owner-occupied | Renter-occupied |
| 1-Person Household | 981 (36.7%) | 1,694 (63.3%) |
| 2-Person Household | 817 (44.3%) | 1,028 (55.7%) |
| 3-Person Household | 357 (37.5%) | 595 (62.5%) |
| 4+ Person Household | 368 (44.6%) | 458 (55.4%) |
| Total Housing Units | 2,523 (40.1%) | 3,775 (59.9%) |
Occupancy by Educational Attainment in Endicott
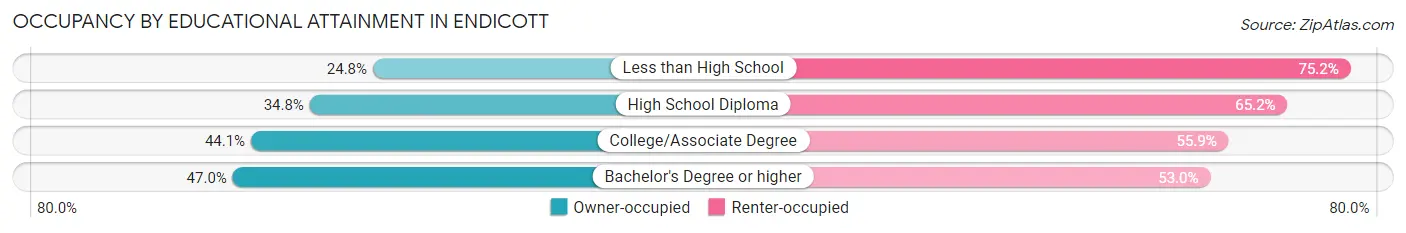
| Household Size | Owner-occupied | Renter-occupied |
| Less than High School | 129 (24.8%) | 392 (75.2%) |
| High School Diploma | 711 (34.8%) | 1,333 (65.2%) |
| College/Associate Degree | 1,087 (44.1%) | 1,378 (55.9%) |
| Bachelor's Degree or higher | 596 (47.0%) | 672 (53.0%) |
Occupancy by Age of Householder in Endicott
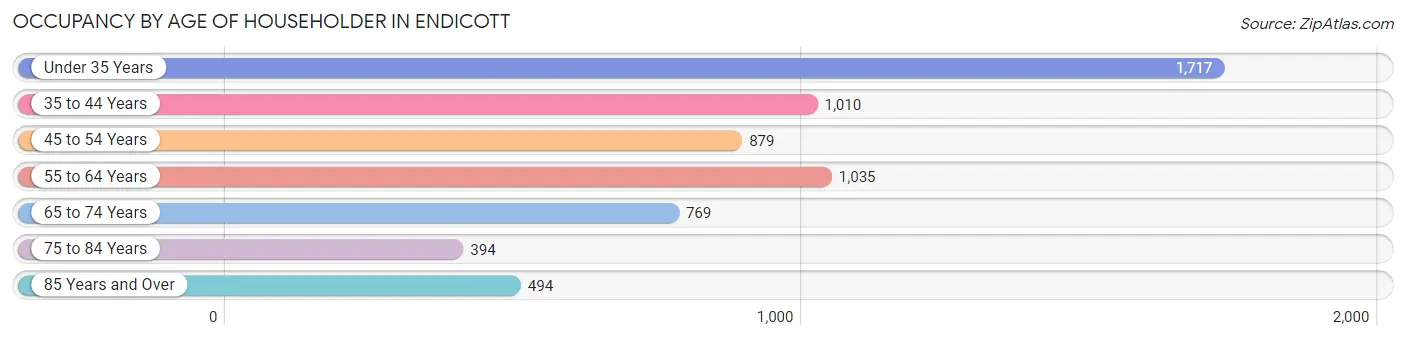
| Age Bracket | # Households | % Households |
| Under 35 Years | 1,717 | 27.3% |
| 35 to 44 Years | 1,010 | 16.0% |
| 45 to 54 Years | 879 | 14.0% |
| 55 to 64 Years | 1,035 | 16.4% |
| 65 to 74 Years | 769 | 12.2% |
| 75 to 84 Years | 394 | 6.3% |
| 85 Years and Over | 494 | 7.8% |
| Total | 6,298 | 100.0% |
Housing Finances in Endicott
Median Income by Occupancy in Endicott
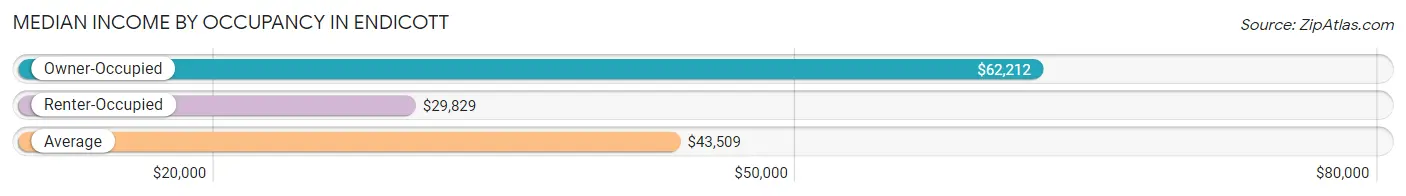
| Occupancy Type | # Households | Median Income |
| Owner-Occupied | 2,523 (40.1%) | $62,212 |
| Renter-Occupied | 3,775 (59.9%) | $29,829 |
| Average | 6,298 (100.0%) | $43,509 |
Occupancy by Householder Income Bracket in Endicott
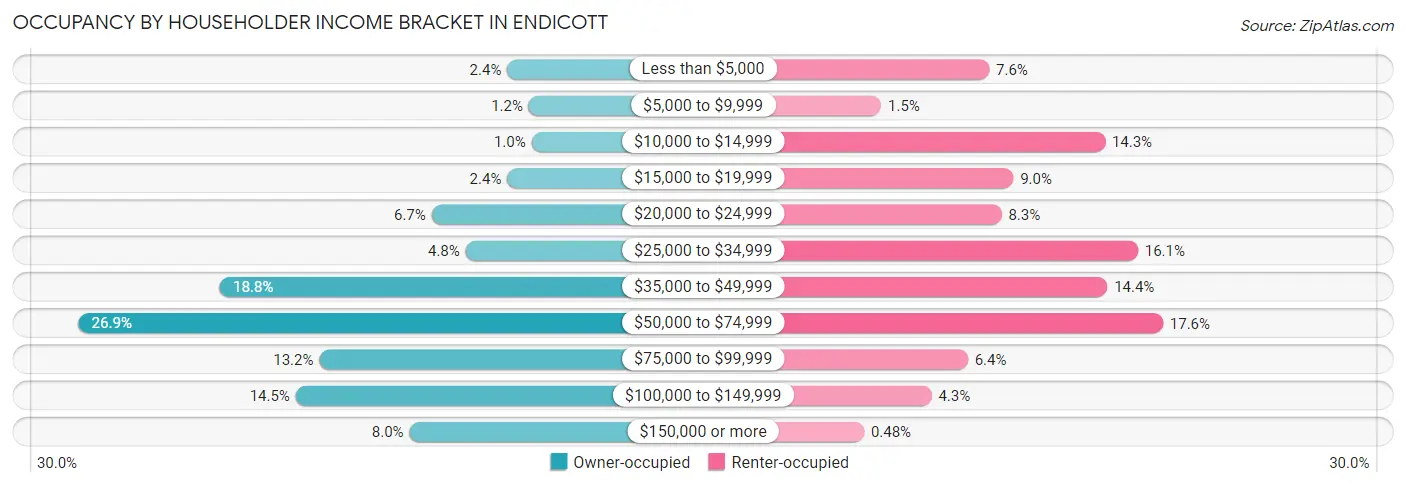
| Income Bracket | Owner-occupied | Renter-occupied |
| Less than $5,000 | 61 (2.4%) | 288 (7.6%) |
| $5,000 to $9,999 | 30 (1.2%) | 55 (1.5%) |
| $10,000 to $14,999 | 26 (1.0%) | 538 (14.2%) |
| $15,000 to $19,999 | 61 (2.4%) | 340 (9.0%) |
| $20,000 to $24,999 | 170 (6.7%) | 315 (8.3%) |
| $25,000 to $34,999 | 121 (4.8%) | 609 (16.1%) |
| $35,000 to $49,999 | 475 (18.8%) | 543 (14.4%) |
| $50,000 to $74,999 | 679 (26.9%) | 663 (17.6%) |
| $75,000 to $99,999 | 332 (13.2%) | 242 (6.4%) |
| $100,000 to $149,999 | 366 (14.5%) | 164 (4.3%) |
| $150,000 or more | 202 (8.0%) | 18 (0.5%) |
| Total | 2,523 (100.0%) | 3,775 (100.0%) |
Monthly Housing Cost Tiers in Endicott
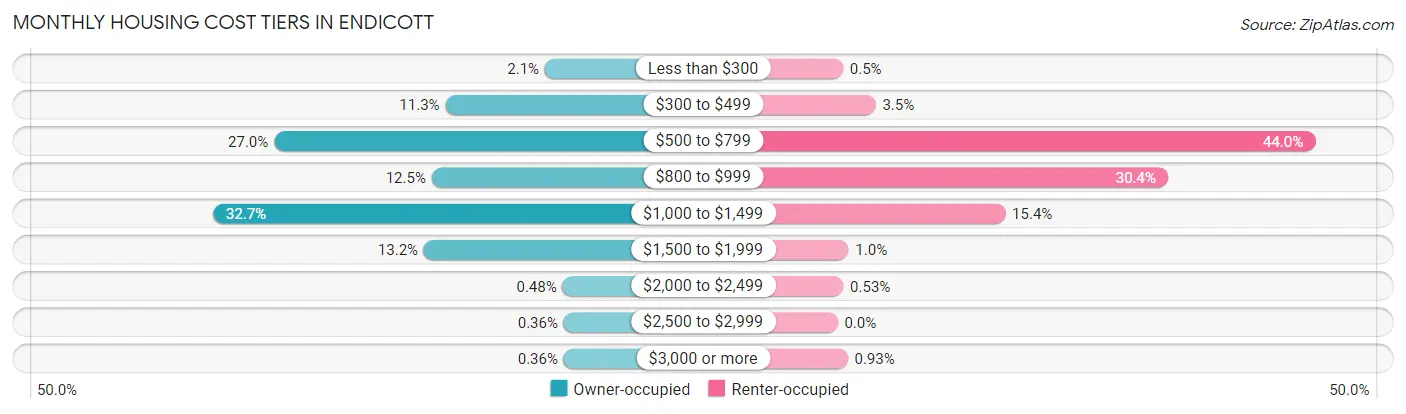
| Monthly Cost | Owner-occupied | Renter-occupied |
| Less than $300 | 53 (2.1%) | 19 (0.5%) |
| $300 to $499 | 284 (11.3%) | 132 (3.5%) |
| $500 to $799 | 682 (27.0%) | 1,660 (44.0%) |
| $800 to $999 | 316 (12.5%) | 1,148 (30.4%) |
| $1,000 to $1,499 | 824 (32.7%) | 583 (15.4%) |
| $1,500 to $1,999 | 334 (13.2%) | 38 (1.0%) |
| $2,000 to $2,499 | 12 (0.5%) | 20 (0.5%) |
| $2,500 to $2,999 | 9 (0.4%) | 0 (0.0%) |
| $3,000 or more | 9 (0.4%) | 35 (0.9%) |
| Total | 2,523 (100.0%) | 3,775 (100.0%) |
Physical Housing Characteristics in Endicott
Housing Structures in Endicott
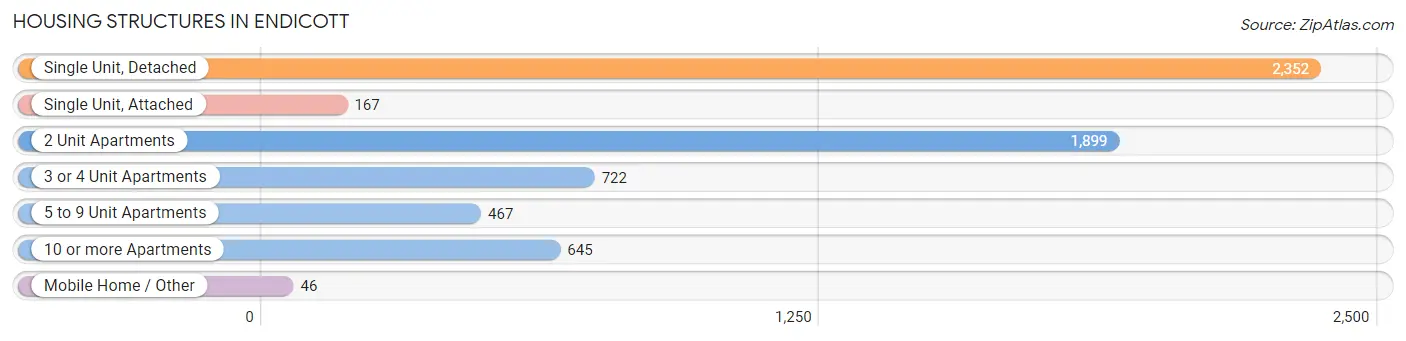
| Structure Type | # Housing Units | % Housing Units |
| Single Unit, Detached | 2,352 | 37.3% |
| Single Unit, Attached | 167 | 2.6% |
| 2 Unit Apartments | 1,899 | 30.1% |
| 3 or 4 Unit Apartments | 722 | 11.5% |
| 5 to 9 Unit Apartments | 467 | 7.4% |
| 10 or more Apartments | 645 | 10.2% |
| Mobile Home / Other | 46 | 0.7% |
| Total | 6,298 | 100.0% |
Housing Structures by Occupancy in Endicott
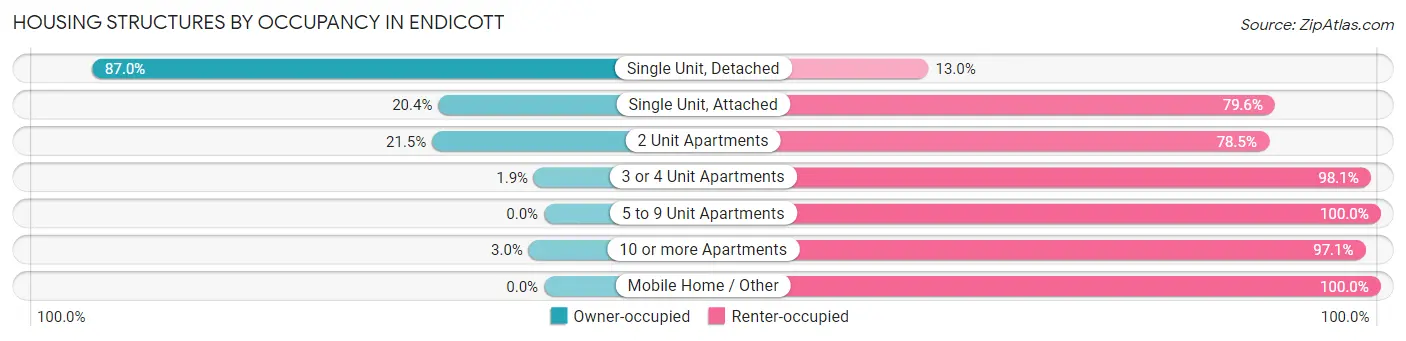
| Structure Type | Owner-occupied | Renter-occupied |
| Single Unit, Detached | 2,047 (87.0%) | 305 (13.0%) |
| Single Unit, Attached | 34 (20.4%) | 133 (79.6%) |
| 2 Unit Apartments | 409 (21.5%) | 1,490 (78.5%) |
| 3 or 4 Unit Apartments | 14 (1.9%) | 708 (98.1%) |
| 5 to 9 Unit Apartments | 0 (0.0%) | 467 (100.0%) |
| 10 or more Apartments | 19 (2.9%) | 626 (97.1%) |
| Mobile Home / Other | 0 (0.0%) | 46 (100.0%) |
| Total | 2,523 (40.1%) | 3,775 (59.9%) |
Housing Structures by Number of Rooms in Endicott
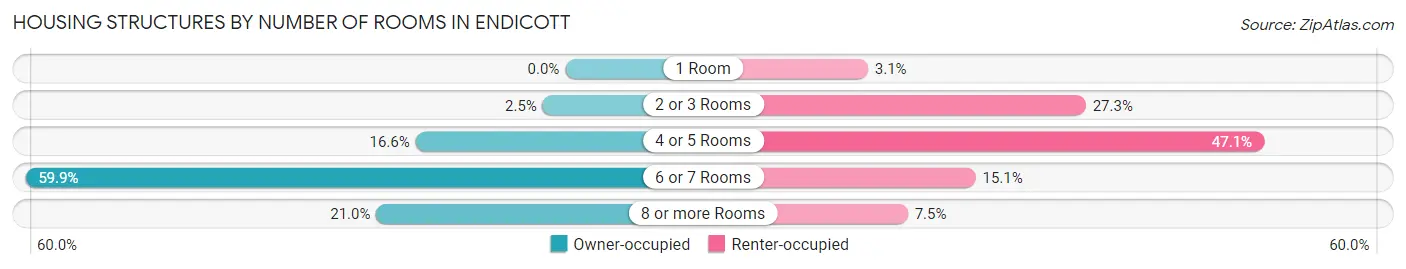
| Number of Rooms | Owner-occupied | Renter-occupied |
| 1 Room | 0 (0.0%) | 117 (3.1%) |
| 2 or 3 Rooms | 63 (2.5%) | 1,030 (27.3%) |
| 4 or 5 Rooms | 419 (16.6%) | 1,776 (47.0%) |
| 6 or 7 Rooms | 1,512 (59.9%) | 568 (15.0%) |
| 8 or more Rooms | 529 (21.0%) | 284 (7.5%) |
| Total | 2,523 (100.0%) | 3,775 (100.0%) |
Housing Structure by Heating Type in Endicott
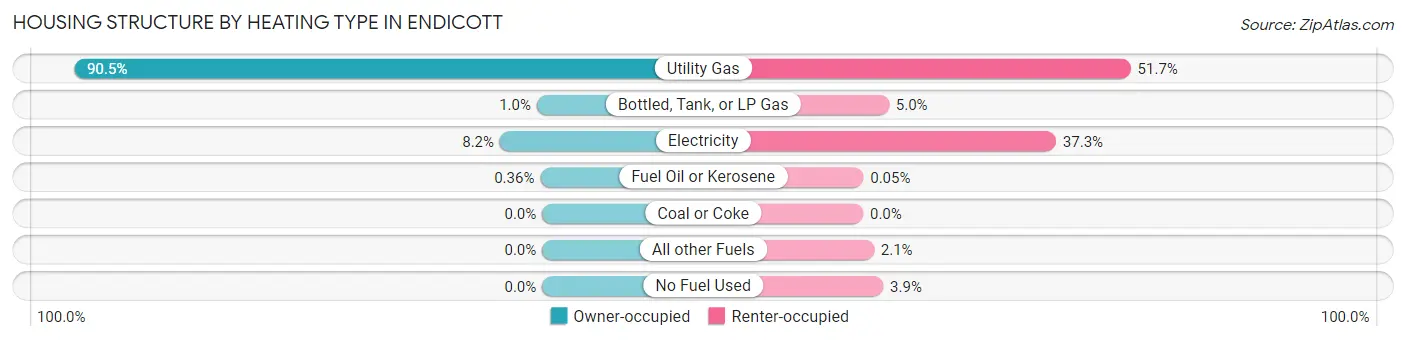
| Heating Type | Owner-occupied | Renter-occupied |
| Utility Gas | 2,282 (90.4%) | 1,952 (51.7%) |
| Bottled, Tank, or LP Gas | 26 (1.0%) | 188 (5.0%) |
| Electricity | 206 (8.2%) | 1,407 (37.3%) |
| Fuel Oil or Kerosene | 9 (0.4%) | 2 (0.1%) |
| Coal or Coke | 0 (0.0%) | 0 (0.0%) |
| All other Fuels | 0 (0.0%) | 79 (2.1%) |
| No Fuel Used | 0 (0.0%) | 147 (3.9%) |
| Total | 2,523 (100.0%) | 3,775 (100.0%) |
Household Vehicle Usage in Endicott
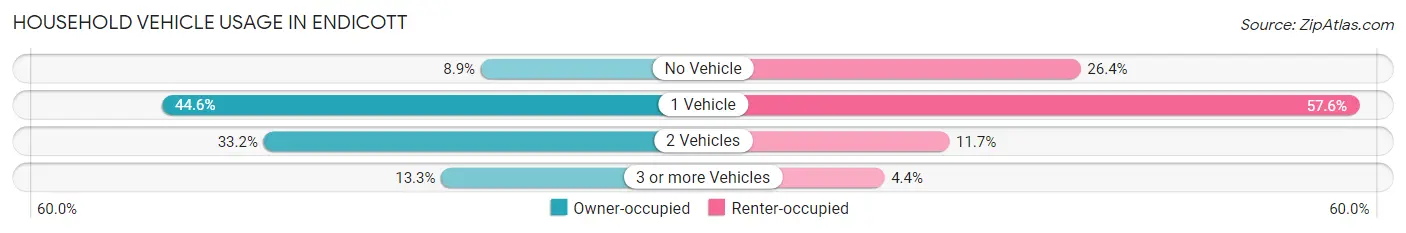
| Vehicles per Household | Owner-occupied | Renter-occupied |
| No Vehicle | 224 (8.9%) | 996 (26.4%) |
| 1 Vehicle | 1,125 (44.6%) | 2,173 (57.6%) |
| 2 Vehicles | 838 (33.2%) | 440 (11.7%) |
| 3 or more Vehicles | 336 (13.3%) | 166 (4.4%) |
| Total | 2,523 (100.0%) | 3,775 (100.0%) |
Real Estate & Mortgages in Endicott
Real Estate and Mortgage Overview in Endicott
| Characteristic | Without Mortgage | With Mortgage |
| Housing Units | 1,186 | 1,337 |
| Median Property Value | $98,300 | $106,500 |
| Median Household Income | $49,514 | $171 |
| Monthly Housing Costs | $635 | $9 |
| Real Estate Taxes | $4,045 | $8 |
Property Value by Mortgage Status in Endicott
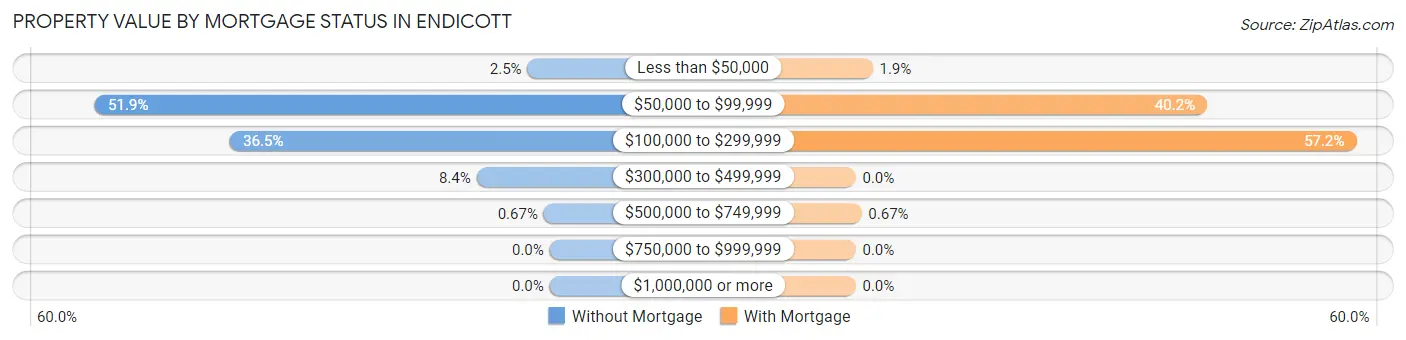
| Property Value | Without Mortgage | With Mortgage |
| Less than $50,000 | 30 (2.5%) | 26 (1.9%) |
| $50,000 to $99,999 | 616 (51.9%) | 537 (40.2%) |
| $100,000 to $299,999 | 433 (36.5%) | 765 (57.2%) |
| $300,000 to $499,999 | 99 (8.4%) | 0 (0.0%) |
| $500,000 to $749,999 | 8 (0.7%) | 9 (0.7%) |
| $750,000 to $999,999 | 0 (0.0%) | 0 (0.0%) |
| $1,000,000 or more | 0 (0.0%) | 0 (0.0%) |
| Total | 1,186 (100.0%) | 1,337 (100.0%) |
Household Income by Mortgage Status in Endicott
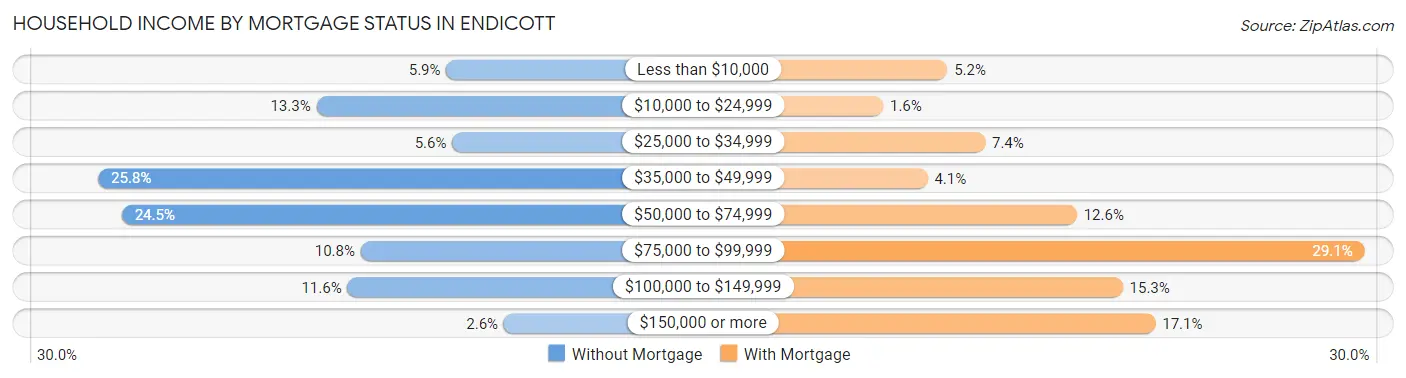
| Household Income | Without Mortgage | With Mortgage |
| Less than $10,000 | 70 (5.9%) | 70 (5.2%) |
| $10,000 to $24,999 | 158 (13.3%) | 21 (1.6%) |
| $25,000 to $34,999 | 66 (5.6%) | 99 (7.4%) |
| $35,000 to $49,999 | 306 (25.8%) | 55 (4.1%) |
| $50,000 to $74,999 | 290 (24.4%) | 169 (12.6%) |
| $75,000 to $99,999 | 128 (10.8%) | 389 (29.1%) |
| $100,000 to $149,999 | 137 (11.6%) | 204 (15.3%) |
| $150,000 or more | 31 (2.6%) | 229 (17.1%) |
| Total | 1,186 (100.0%) | 1,337 (100.0%) |
Property Value to Household Income Ratio in Endicott
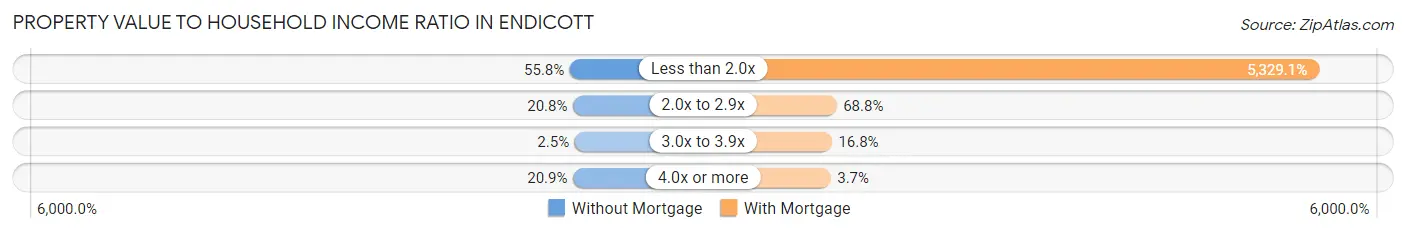
| Value-to-Income Ratio | Without Mortgage | With Mortgage |
| Less than 2.0x | 662 (55.8%) | 71,250 (5,329.1%) |
| 2.0x to 2.9x | 247 (20.8%) | 920 (68.8%) |
| 3.0x to 3.9x | 29 (2.5%) | 224 (16.8%) |
| 4.0x or more | 248 (20.9%) | 50 (3.7%) |
| Total | 1,186 (100.0%) | 1,337 (100.0%) |
Real Estate Taxes by Mortgage Status in Endicott
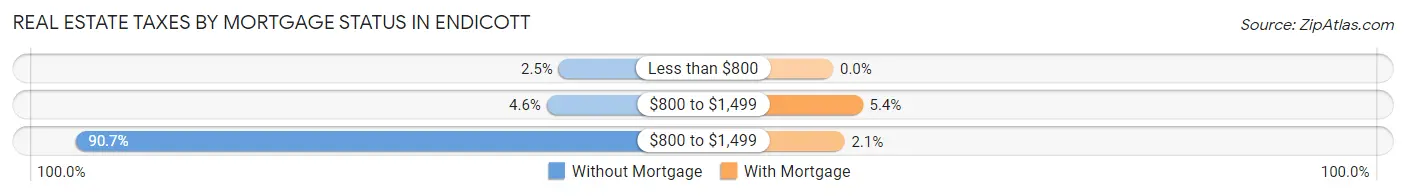
| Property Taxes | Without Mortgage | With Mortgage |
| Less than $800 | 29 (2.5%) | 0 (0.0%) |
| $800 to $1,499 | 55 (4.6%) | 72 (5.4%) |
| $800 to $1,499 | 1,076 (90.7%) | 28 (2.1%) |
| Total | 1,186 (100.0%) | 1,337 (100.0%) |
Health & Disability in Endicott
Health Insurance Coverage by Age in Endicott
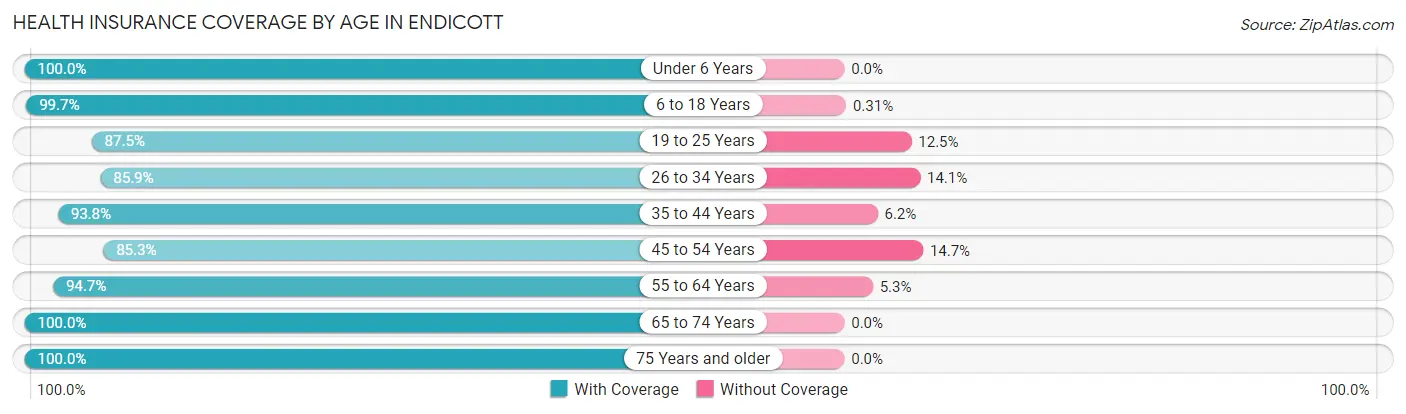
| Age Bracket | With Coverage | Without Coverage |
| Under 6 Years | 940 (100.0%) | 0 (0.0%) |
| 6 to 18 Years | 2,230 (99.7%) | 7 (0.3%) |
| 19 to 25 Years | 1,489 (87.5%) | 213 (12.5%) |
| 26 to 34 Years | 1,489 (85.9%) | 245 (14.1%) |
| 35 to 44 Years | 1,392 (93.8%) | 92 (6.2%) |
| 45 to 54 Years | 1,175 (85.3%) | 202 (14.7%) |
| 55 to 64 Years | 1,554 (94.7%) | 87 (5.3%) |
| 65 to 74 Years | 1,046 (100.0%) | 0 (0.0%) |
| 75 Years and older | 1,072 (100.0%) | 0 (0.0%) |
| Total | 12,387 (93.6%) | 846 (6.4%) |
Health Insurance Coverage by Citizenship Status in Endicott
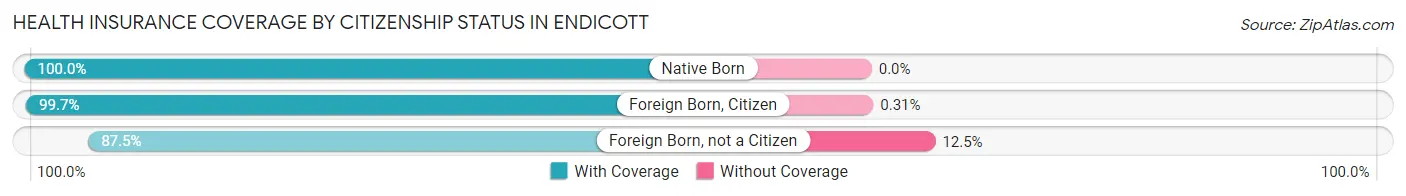
| Citizenship Status | With Coverage | Without Coverage |
| Native Born | 940 (100.0%) | 0 (0.0%) |
| Foreign Born, Citizen | 2,230 (99.7%) | 7 (0.3%) |
| Foreign Born, not a Citizen | 1,489 (87.5%) | 213 (12.5%) |
Health Insurance Coverage by Household Income in Endicott
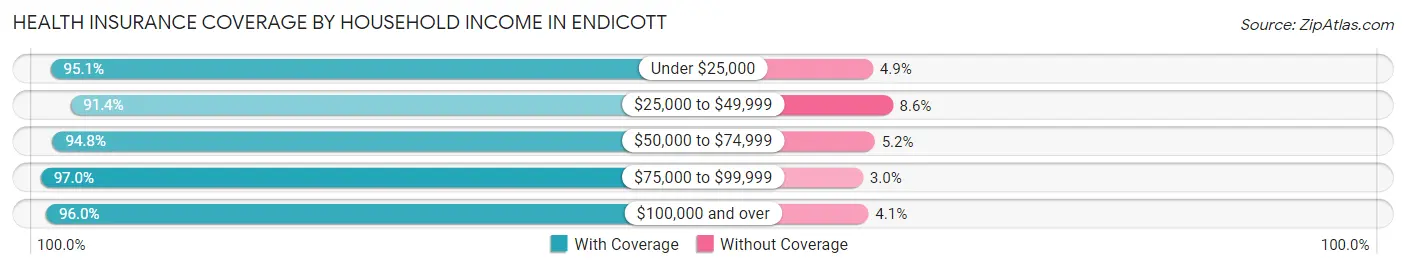
| Household Income | With Coverage | Without Coverage |
| Under $25,000 | 3,193 (95.1%) | 164 (4.9%) |
| $25,000 to $49,999 | 2,994 (91.4%) | 281 (8.6%) |
| $50,000 to $74,999 | 2,388 (94.8%) | 132 (5.2%) |
| $75,000 to $99,999 | 1,508 (97.0%) | 47 (3.0%) |
| $100,000 and over | 2,203 (96.0%) | 93 (4.1%) |
Public vs Private Health Insurance Coverage by Age in Endicott
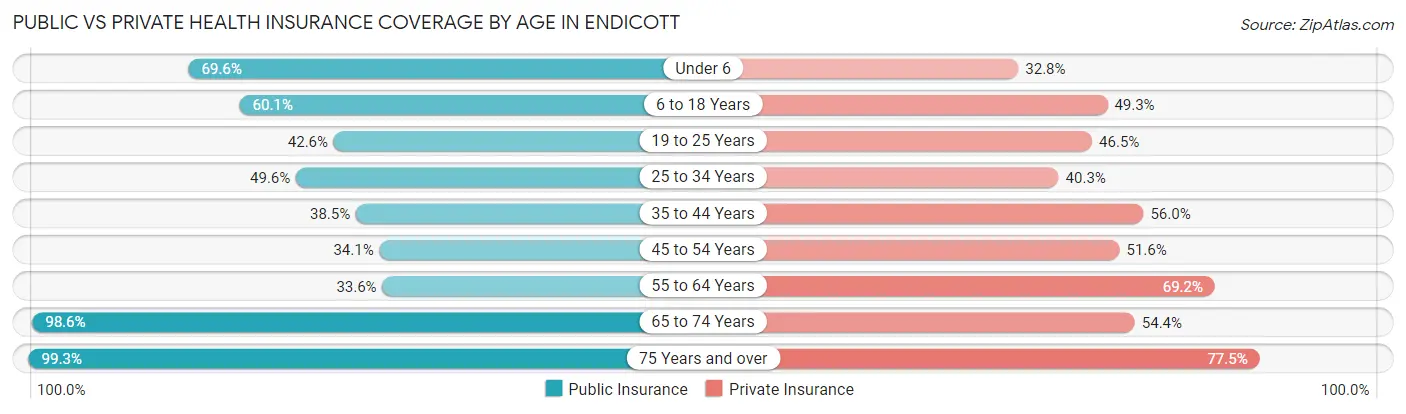
| Age Bracket | Public Insurance | Private Insurance |
| Under 6 | 654 (69.6%) | 308 (32.8%) |
| 6 to 18 Years | 1,344 (60.1%) | 1,103 (49.3%) |
| 19 to 25 Years | 725 (42.6%) | 791 (46.5%) |
| 25 to 34 Years | 860 (49.6%) | 698 (40.3%) |
| 35 to 44 Years | 571 (38.5%) | 831 (56.0%) |
| 45 to 54 Years | 470 (34.1%) | 710 (51.6%) |
| 55 to 64 Years | 551 (33.6%) | 1,136 (69.2%) |
| 65 to 74 Years | 1,031 (98.6%) | 569 (54.4%) |
| 75 Years and over | 1,064 (99.3%) | 831 (77.5%) |
| Total | 7,270 (54.9%) | 6,977 (52.7%) |
Disability Status by Sex by Age in Endicott
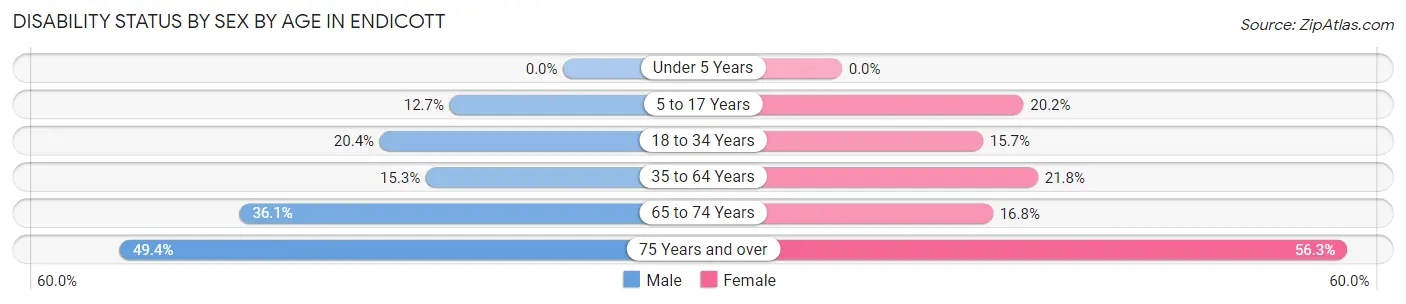
| Age Bracket | Male | Female |
| Under 5 Years | 0 (0.0%) | 0 (0.0%) |
| 5 to 17 Years | 126 (12.7%) | 242 (20.2%) |
| 18 to 34 Years | 362 (20.4%) | 297 (15.7%) |
| 35 to 64 Years | 334 (15.3%) | 506 (21.8%) |
| 65 to 74 Years | 167 (36.1%) | 98 (16.8%) |
| 75 Years and over | 273 (49.4%) | 292 (56.3%) |
Disability Class by Sex by Age in Endicott
Disability Class: Hearing Difficulty
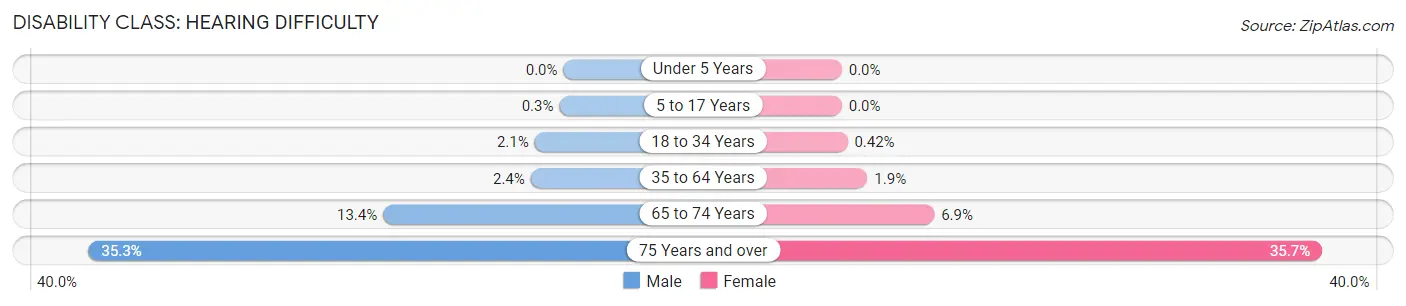
| Age Bracket | Male | Female |
| Under 5 Years | 0 (0.0%) | 0 (0.0%) |
| 5 to 17 Years | 3 (0.3%) | 0 (0.0%) |
| 18 to 34 Years | 38 (2.1%) | 8 (0.4%) |
| 35 to 64 Years | 53 (2.4%) | 44 (1.9%) |
| 65 to 74 Years | 62 (13.4%) | 40 (6.9%) |
| 75 Years and over | 195 (35.3%) | 185 (35.6%) |
Disability Class: Vision Difficulty
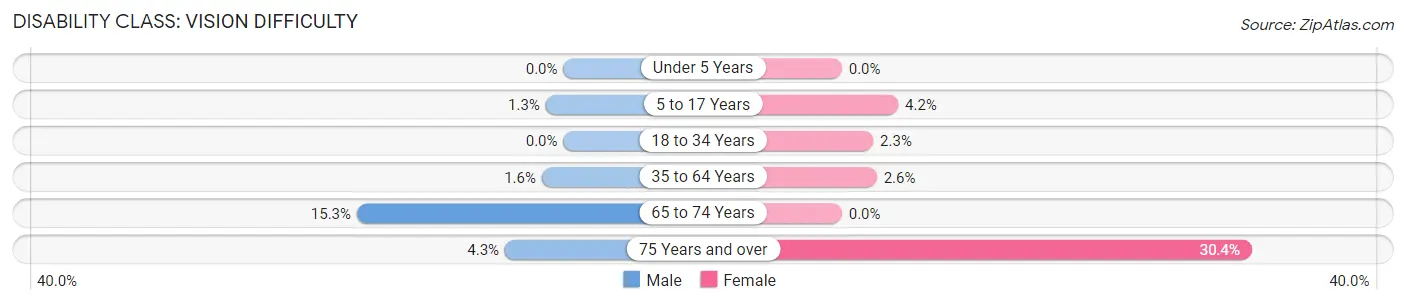
| Age Bracket | Male | Female |
| Under 5 Years | 0 (0.0%) | 0 (0.0%) |
| 5 to 17 Years | 13 (1.3%) | 50 (4.2%) |
| 18 to 34 Years | 0 (0.0%) | 44 (2.3%) |
| 35 to 64 Years | 35 (1.6%) | 60 (2.6%) |
| 65 to 74 Years | 71 (15.3%) | 0 (0.0%) |
| 75 Years and over | 24 (4.3%) | 158 (30.4%) |
Disability Class: Cognitive Difficulty
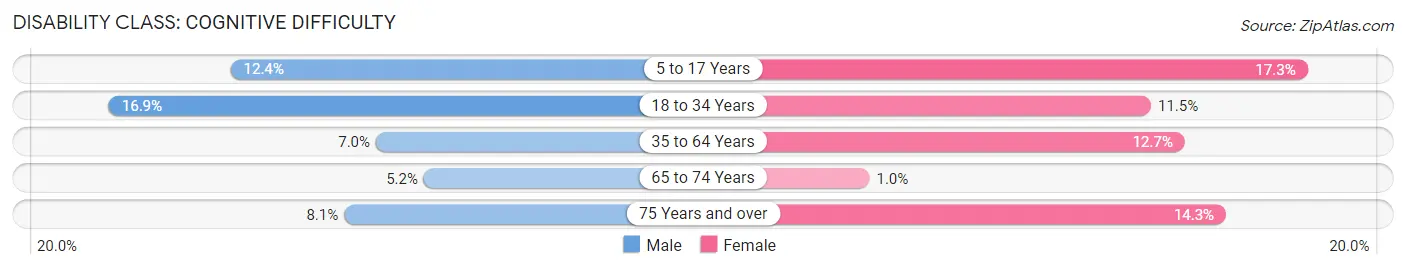
| Age Bracket | Male | Female |
| 5 to 17 Years | 123 (12.3%) | 207 (17.3%) |
| 18 to 34 Years | 299 (16.9%) | 217 (11.5%) |
| 35 to 64 Years | 152 (7.0%) | 295 (12.7%) |
| 65 to 74 Years | 24 (5.2%) | 6 (1.0%) |
| 75 Years and over | 45 (8.1%) | 74 (14.3%) |
Disability Class: Ambulatory Difficulty
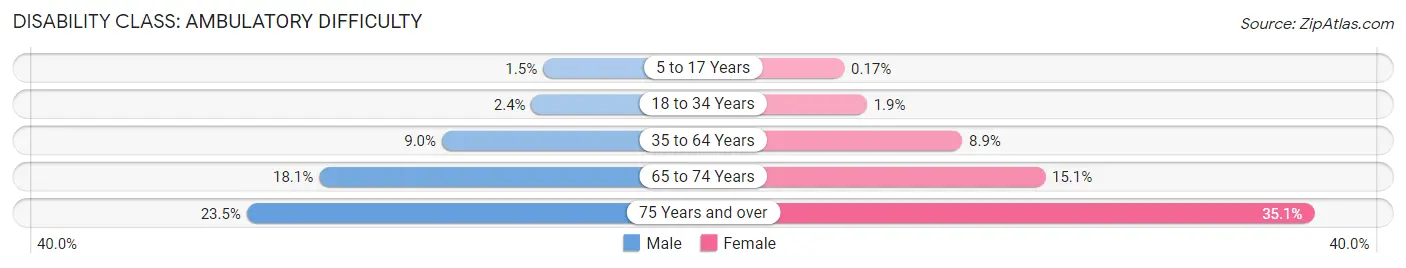
| Age Bracket | Male | Female |
| 5 to 17 Years | 15 (1.5%) | 2 (0.2%) |
| 18 to 34 Years | 42 (2.4%) | 35 (1.8%) |
| 35 to 64 Years | 197 (9.0%) | 207 (8.9%) |
| 65 to 74 Years | 84 (18.1%) | 88 (15.1%) |
| 75 Years and over | 130 (23.5%) | 182 (35.1%) |
Disability Class: Self-Care Difficulty
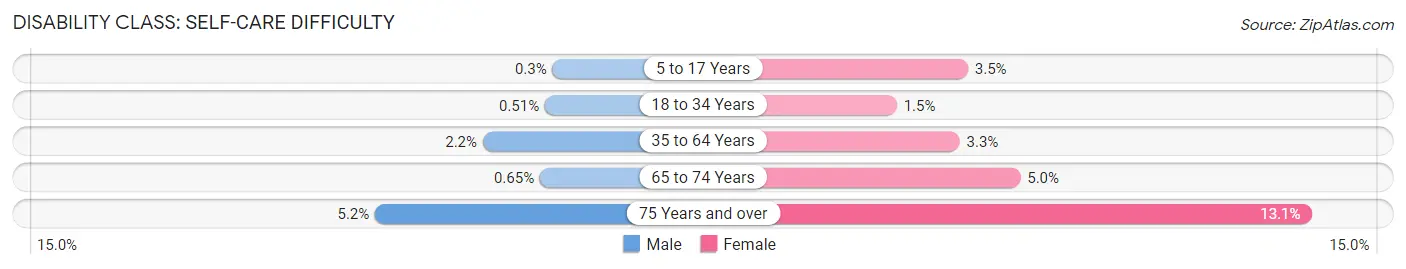
| Age Bracket | Male | Female |
| 5 to 17 Years | 3 (0.3%) | 42 (3.5%) |
| 18 to 34 Years | 9 (0.5%) | 29 (1.5%) |
| 35 to 64 Years | 49 (2.2%) | 76 (3.3%) |
| 65 to 74 Years | 3 (0.6%) | 29 (5.0%) |
| 75 Years and over | 29 (5.2%) | 68 (13.1%) |
Technology Access in Endicott
Computing Device Access in Endicott
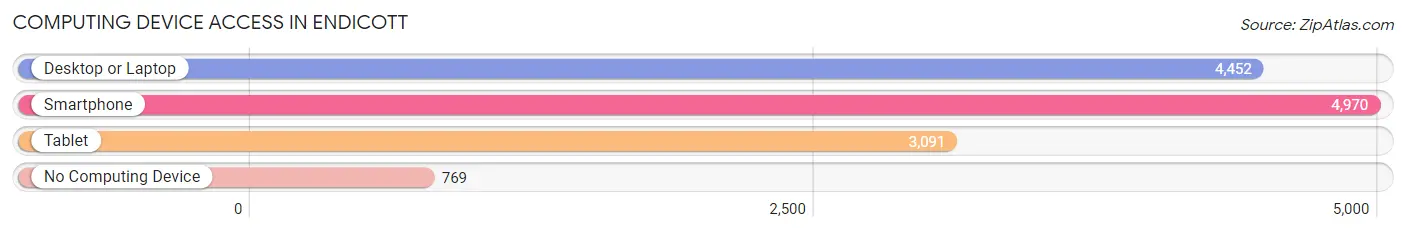
| Device Type | # Households | % Households |
| Desktop or Laptop | 4,452 | 70.7% |
| Smartphone | 4,970 | 78.9% |
| Tablet | 3,091 | 49.1% |
| No Computing Device | 769 | 12.2% |
| Total | 6,298 | 100.0% |
Internet Access in Endicott
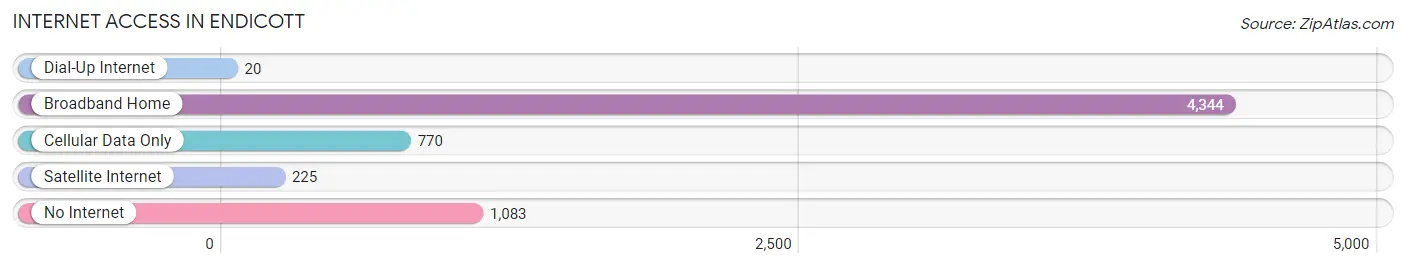
| Internet Type | # Households | % Households |
| Dial-Up Internet | 20 | 0.3% |
| Broadband Home | 4,344 | 69.0% |
| Cellular Data Only | 770 | 12.2% |
| Satellite Internet | 225 | 3.6% |
| No Internet | 1,083 | 17.2% |
| Total | 6,298 | 100.0% |
Endicott Summary
Endicott, NY is a village located in Broome County, New York, United States. It is part of the Binghamton Metropolitan Statistical Area. The population was 13,392 at the 2010 census. Endicott is located on the north side of the Susquehanna River, directly across from the city of Binghamton.
History
Endicott was founded in 1892 by George F. Johnson, who named the village after his father, Henry B. Endicott. Johnson was the founder of the Endicott Johnson Corporation, a major shoe manufacturer. The village was incorporated in 1900.
Endicott was the birthplace of IBM, which was founded in 1911 as the Computing-Tabulating-Recording Company (CTR). The company was renamed International Business Machines (IBM) in 1924. IBM's first large-scale production facility was located in Endicott, and the company remained in the village until the mid-1980s.
Geography
Endicott is located at 42°6'25" North, 76°3'25" West (42.106944, -76.056944). According to the United States Census Bureau, the village has a total area of 4.2 square miles, all of it land.
Economy
Endicott is home to several major employers, including Endicott Interconnect Technologies, a manufacturer of printed circuit boards; Endicott Research Group, a manufacturer of medical devices; and Endicott Clay Products, a manufacturer of ceramic products. The village is also home to several small businesses, including restaurants, retail stores, and professional services.
Demographics
As of the census of 2010, there were 13,392 people, 5,845 households, and 3,541 families residing in the village. The population density was 3,192.9 people per square mile. There were 6,323 housing units at an average density of 1,502.2 per square mile. The racial makeup of the village was 94.2% White, 2.2% African American, 0.3% Native American, 1.2% Asian, 0.1% Pacific Islander, 0.7% from other races, and 1.3% from two or more races. Hispanic or Latino of any race were 3.2% of the population.
There were 5,845 households, out of which 25.2% had children under the age of 18 living with them, 44.2% were married couples living together, 12.3% had a female householder with no husband present, and 39.2% were non-families. 33.2% of all households were made up of individuals, and 15.2% had someone living alone who was 65 years of age or older. The average household size was 2.27 and the average family size was 2.89.
In the village, the population was spread out, with 21.2% under the age of 18, 7.2% from 18 to 24, 27.2% from 25 to 44, 24.2% from 45 to 64, and 20.2% who were 65 years of age or older. The median age was 40 years. For every 100 females, there were 87.2 males. For every 100 females age 18 and over, there were 83.3 males.
The median income for a household in the village was $37,813, and the median income for a family was $48,919. Males had a median income of $36,945 versus $27,813 for females. The per capita income for the village was $20,945. About 8.2% of families and 11.2% of the population were below the poverty line, including 16.2% of those under age 18 and 8.2% of those age 65 or over.
Common Questions
What is the Total Population of Endicott?
Total Population of Endicott is 13,540.
What is the Total Male Population of Endicott?
Total Male Population of Endicott is 6,521.
What is the Total Female Population of Endicott?
Total Female Population of Endicott is 7,019.
What is the Ratio of Males per 100 Females in Endicott?
There are 92.90 Males per 100 Females in Endicott.
What is the Ratio of Females per 100 Males in Endicott?
There are 107.64 Females per 100 Males in Endicott.
What is the Median Population Age in Endicott?
Median Population Age in Endicott is 36.1 Years.
What is the Average Family Size in Endicott
Average Family Size in Endicott is 2.8 People.
What is the Average Household Size in Endicott
Average Household Size in Endicott is 2.1 People.
What is Per Capita Income in Endicott?
Per Capita income in Endicott is $25,067.
What is the Median Family Income in Endicott?
Median Family Income in Endicott is $51,985.
What is the Median Household income in Endicott?
Median Household Income in Endicott is $43,509.
What is Income or Wage Gap in Endicott?
Income or Wage Gap in Endicott is 23.7%.
Women in Endicott earn 76.3 cents for every dollar earned by a man.
What is Family Income Deficit in Endicott?
Family Income Deficit in Endicott is $8,489.
Families that are below poverty line in Endicott earn $8,489 less on average than the poverty threshold level.
What is Inequality or Gini Index in Endicott?
Inequality or Gini Index in Endicott is 0.43.
How Large is the Labor Force in Endicott?
There are 6,232 People in the Labor Forcein in Endicott.
What is the Percentage of People in the Labor Force in Endicott?
56.4% of People are in the Labor Force in Endicott.
What is the Unemployment Rate in Endicott?
Unemployment Rate in Endicott is 7.5%.