Port Jervis, NY
Port Jervis Map
Port Jervis Overview
8,725
TOTAL POPULATION
4,249
MALE POPULATION
4,476
FEMALE POPULATION
94.93
MALES / 100 FEMALES
105.34
FEMALES / 100 MALES
40.8
MEDIAN AGE
3.4
AVG FAMILY SIZE
2.5
AVG HOUSEHOLD SIZE
$24,106
PER CAPITA INCOME
$57,817
AVG FAMILY INCOME
$38,804
AVG HOUSEHOLD INCOME
35.3%
WAGE / INCOME GAP [ % ]
64.7¢/ $1
WAGE / INCOME GAP [ $ ]
0.44
INEQUALITY / GINI INDEX
3,952
LABOR FORCE [ PEOPLE ]
55.0%
PERCENT IN LABOR FORCE
7.9%
UNEMPLOYMENT RATE
Port Jervis Zip Codes
Port Jervis Area Codes
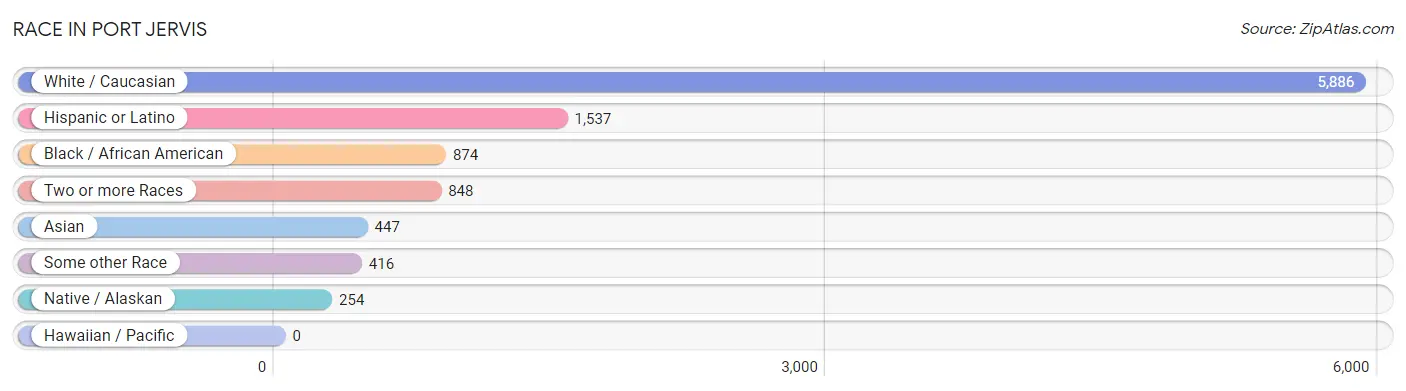
Race in Port Jervis
The most populous races in Port Jervis are White / Caucasian (5,886 | 67.5%), Hispanic or Latino (1,537 | 17.6%), and Black / African American (874 | 10.0%).
| Race | # Population | % Population |
| Asian | 447 | 5.1% |
| Black / African American | 874 | 10.0% |
| Hawaiian / Pacific | 0 | 0.0% |
| Hispanic or Latino | 1,537 | 17.6% |
| Native / Alaskan | 254 | 2.9% |
| White / Caucasian | 5,886 | 67.5% |
| Two or more Races | 848 | 9.7% |
| Some other Race | 416 | 4.8% |
| Total | 8,725 | 100.0% |
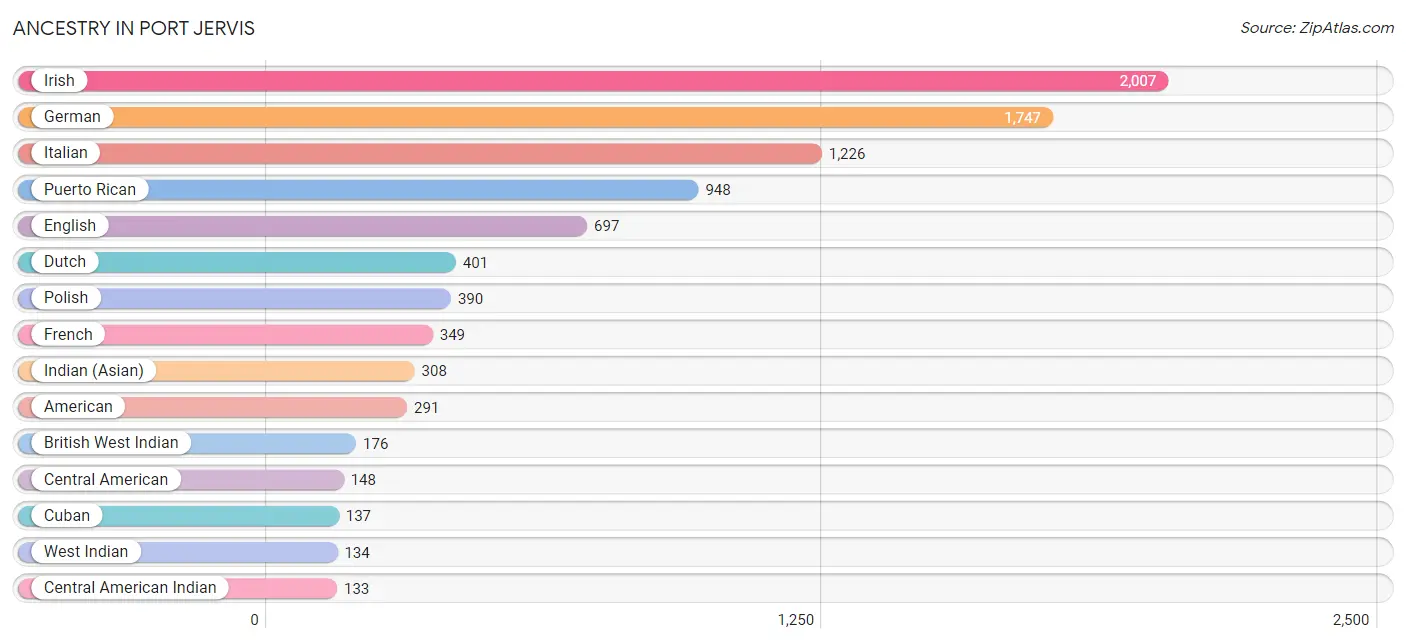
Ancestry in Port Jervis
The most populous ancestries reported in Port Jervis are Irish (2,007 | 23.0%), German (1,747 | 20.0%), Italian (1,226 | 14.1%), Puerto Rican (948 | 10.9%), and English (697 | 8.0%), together accounting for 75.9% of all Port Jervis residents.
| Ancestry | # Population | % Population |
| African | 53 | 0.6% |
| Albanian | 86 | 1.0% |
| American | 291 | 3.3% |
| Arab | 47 | 0.5% |
| Austrian | 25 | 0.3% |
| Belizean | 102 | 1.2% |
| Blackfeet | 85 | 1.0% |
| British | 31 | 0.4% |
| British West Indian | 176 | 2.0% |
| Central American | 148 | 1.7% |
| Central American Indian | 133 | 1.5% |
| Cherokee | 44 | 0.5% |
| Colombian | 75 | 0.9% |
| Croatian | 12 | 0.1% |
| Cuban | 137 | 1.6% |
| Delaware | 51 | 0.6% |
| Dominican | 100 | 1.1% |
| Dutch | 401 | 4.6% |
| Eastern European | 8 | 0.1% |
| Egyptian | 30 | 0.3% |
| English | 697 | 8.0% |
| European | 24 | 0.3% |
| Finnish | 23 | 0.3% |
| French | 349 | 4.0% |
| French Canadian | 53 | 0.6% |
| German | 1,747 | 20.0% |
| Haitian | 46 | 0.5% |
| Honduran | 67 | 0.8% |
| Hungarian | 67 | 0.8% |
| Indian (Asian) | 308 | 3.5% |
| Irish | 2,007 | 23.0% |
| Iroquois | 24 | 0.3% |
| Italian | 1,226 | 14.1% |
| Jamaican | 130 | 1.5% |
| Korean | 20 | 0.2% |
| Lebanese | 7 | 0.1% |
| Liberian | 16 | 0.2% |
| Lithuanian | 14 | 0.2% |
| Mexican | 118 | 1.3% |
| Moroccan | 10 | 0.1% |
| Norwegian | 84 | 1.0% |
| Panamanian | 68 | 0.8% |
| Polish | 390 | 4.5% |
| Portuguese | 6 | 0.1% |
| Puerto Rican | 948 | 10.9% |
| Russian | 52 | 0.6% |
| Salvadoran | 13 | 0.2% |
| Scotch-Irish | 35 | 0.4% |
| Scottish | 52 | 0.6% |
| Seminole | 14 | 0.2% |
| Sioux | 6 | 0.1% |
| Slavic | 3 | 0.0% |
| Slovak | 14 | 0.2% |
| Slovene | 17 | 0.2% |
| South American | 75 | 0.9% |
| Subsaharan African | 129 | 1.5% |
| Swedish | 53 | 0.6% |
| Swiss | 21 | 0.2% |
| Thai | 129 | 1.5% |
| Trinidadian and Tobagonian | 3 | 0.0% |
| Ukrainian | 46 | 0.5% |
| Welsh | 3 | 0.0% |
| West Indian | 134 | 1.5% | View All 63 Rows |
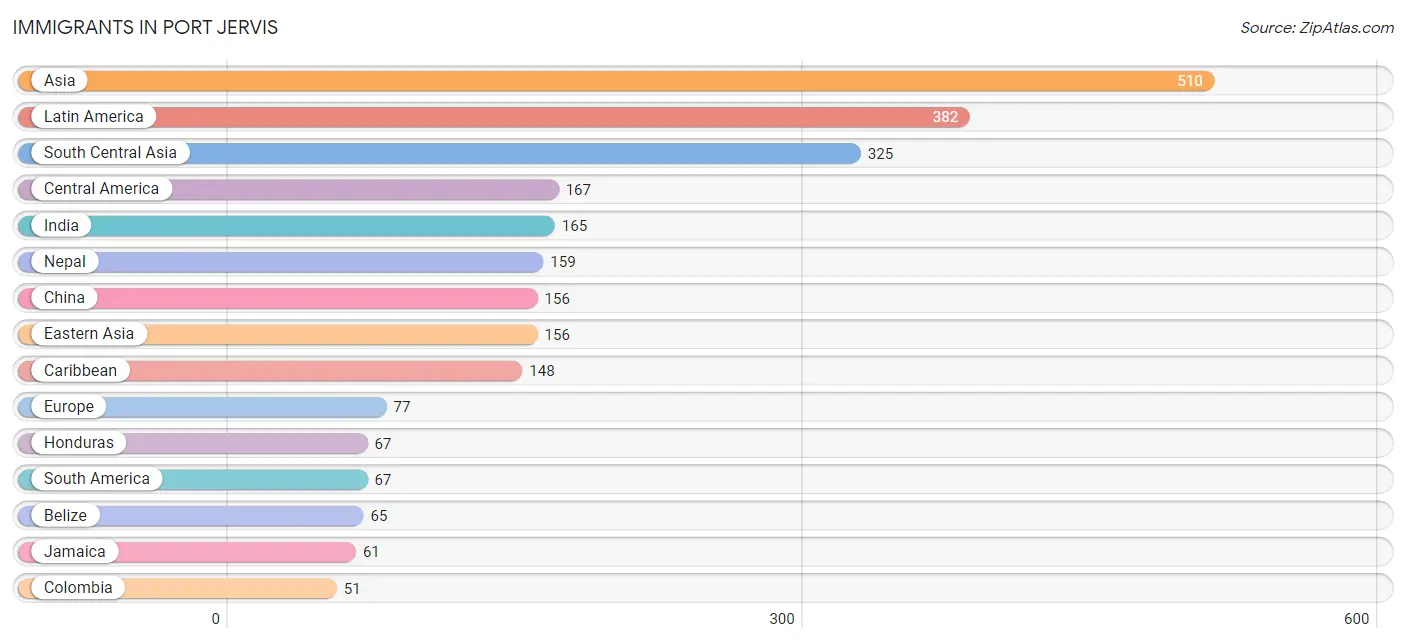
Immigrants in Port Jervis
The most numerous immigrant groups reported in Port Jervis came from Asia (510 | 5.9%), Latin America (382 | 4.4%), South Central Asia (325 | 3.7%), Central America (167 | 1.9%), and India (165 | 1.9%), together accounting for 17.8% of all Port Jervis residents.
| Immigration Origin | # Population | % Population |
| Africa | 30 | 0.3% |
| Albania | 32 | 0.4% |
| Argentina | 3 | 0.0% |
| Asia | 510 | 5.9% |
| Bangladesh | 1 | 0.0% |
| Belize | 65 | 0.7% |
| Caribbean | 148 | 1.7% |
| Central America | 167 | 1.9% |
| China | 156 | 1.8% |
| Colombia | 51 | 0.6% |
| Dominican Republic | 6 | 0.1% |
| Eastern Asia | 156 | 1.8% |
| Eastern Europe | 47 | 0.5% |
| Egypt | 11 | 0.1% |
| El Salvador | 13 | 0.2% |
| Europe | 77 | 0.9% |
| Germany | 30 | 0.3% |
| Guyana | 12 | 0.1% |
| Honduras | 67 | 0.8% |
| India | 165 | 1.9% |
| Jamaica | 61 | 0.7% |
| Latin America | 382 | 4.4% |
| Liberia | 9 | 0.1% |
| Malaysia | 4 | 0.1% |
| Mexico | 22 | 0.3% |
| Morocco | 10 | 0.1% |
| Nepal | 159 | 1.8% |
| Northern Africa | 21 | 0.2% |
| Philippines | 20 | 0.2% |
| Poland | 7 | 0.1% |
| Romania | 8 | 0.1% |
| South America | 67 | 0.8% |
| South Central Asia | 325 | 3.7% |
| South Eastern Asia | 29 | 0.3% |
| St. Vincent and the Grenadines | 21 | 0.2% |
| Trinidad and Tobago | 3 | 0.0% |
| Vietnam | 5 | 0.1% |
| Western Africa | 9 | 0.1% |
| Western Europe | 30 | 0.3% | View All 39 Rows |
Sex and Age in Port Jervis
Sex and Age in Port Jervis
The most populous age groups in Port Jervis are 20 to 24 Years (404 | 9.5%) for men and 15 to 19 Years (484 | 10.8%) for women.
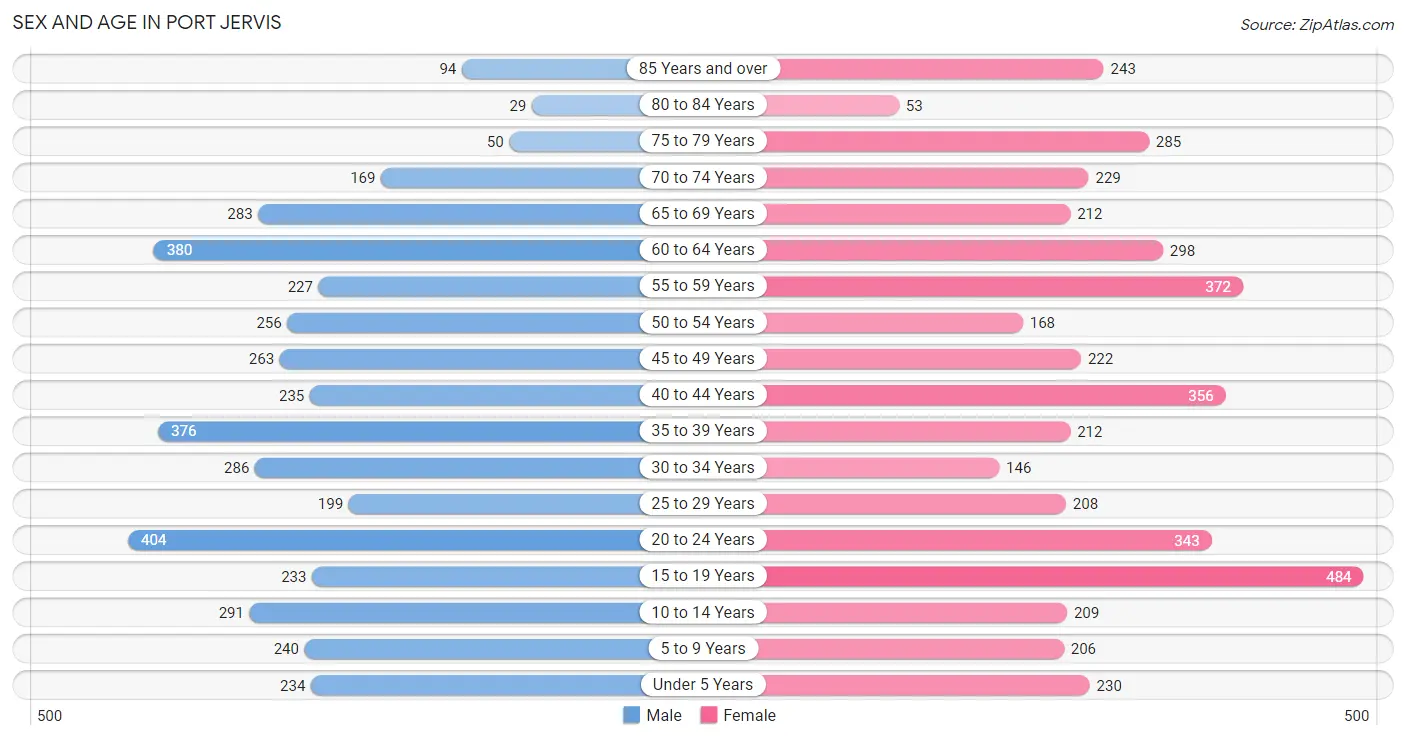
| Age Bracket | Male | Female |
| Under 5 Years | 234 (5.5%) | 230 (5.1%) |
| 5 to 9 Years | 240 (5.7%) | 206 (4.6%) |
| 10 to 14 Years | 291 (6.9%) | 209 (4.7%) |
| 15 to 19 Years | 233 (5.5%) | 484 (10.8%) |
| 20 to 24 Years | 404 (9.5%) | 343 (7.7%) |
| 25 to 29 Years | 199 (4.7%) | 208 (4.6%) |
| 30 to 34 Years | 286 (6.7%) | 146 (3.3%) |
| 35 to 39 Years | 376 (8.8%) | 212 (4.7%) |
| 40 to 44 Years | 235 (5.5%) | 356 (8.0%) |
| 45 to 49 Years | 263 (6.2%) | 222 (5.0%) |
| 50 to 54 Years | 256 (6.0%) | 168 (3.7%) |
| 55 to 59 Years | 227 (5.3%) | 372 (8.3%) |
| 60 to 64 Years | 380 (8.9%) | 298 (6.7%) |
| 65 to 69 Years | 283 (6.7%) | 212 (4.7%) |
| 70 to 74 Years | 169 (4.0%) | 229 (5.1%) |
| 75 to 79 Years | 50 (1.2%) | 285 (6.4%) |
| 80 to 84 Years | 29 (0.7%) | 53 (1.2%) |
| 85 Years and over | 94 (2.2%) | 243 (5.4%) |
| Total | 4,249 (100.0%) | 4,476 (100.0%) |
Families and Households in Port Jervis
Median Family Size in Port Jervis
The median family size in Port Jervis is 3.43 persons per family, with married-couple families (1,183 | 64.0%) accounting for the largest median family size of 3.68 persons per family. On the other hand, single male/father families (237 | 12.8%) represent the smallest median family size with 2.48 persons per family.
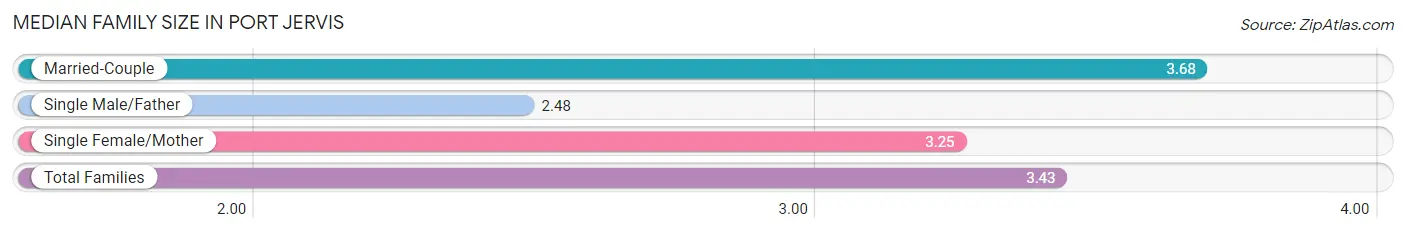
| Family Type | # Families | Family Size |
| Married-Couple | 1,183 (64.0%) | 3.68 |
| Single Male/Father | 237 (12.8%) | 2.48 |
| Single Female/Mother | 427 (23.1%) | 3.25 |
| Total Families | 1,847 (100.0%) | 3.43 |
Median Household Size in Port Jervis
The median household size in Port Jervis is 2.46 persons per household, with married-couple households (1,183 | 33.7%) accounting for the largest median household size of 3.72 persons per household. non-family households (1,668 | 47.4%) represent the smallest median household size with 1.26 persons per household.
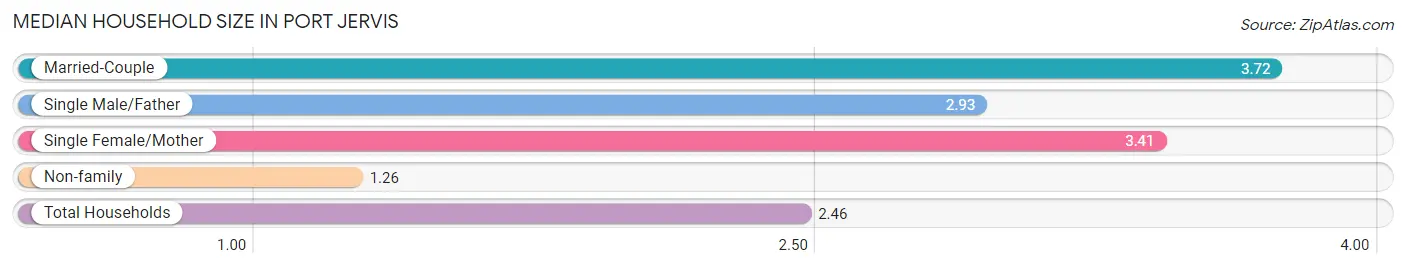
| Household Type | # Households | Household Size |
| Married-Couple | 1,183 (33.7%) | 3.72 |
| Single Male/Father | 237 (6.7%) | 2.93 |
| Single Female/Mother | 427 (12.1%) | 3.41 |
| Non-family | 1,668 (47.4%) | 1.26 |
| Total Households | 3,515 (100.0%) | 2.46 |
Household Size by Marriage Status in Port Jervis
Out of a total of 3,515 households in Port Jervis, 1,847 (52.5%) are family households, while 1,668 (47.4%) are nonfamily households. The most numerous type of family households are 2-person households, comprising 702, and the most common type of nonfamily households are 1-person households, comprising 1,403.
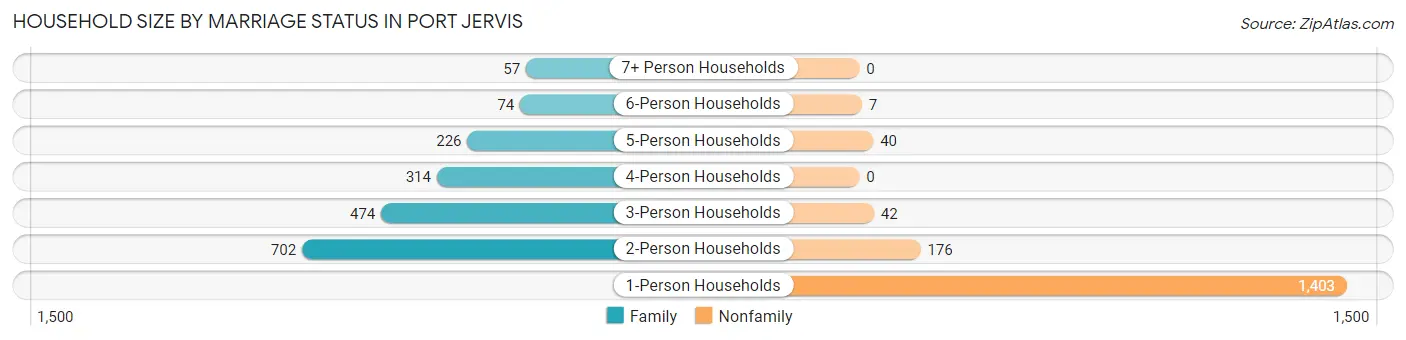
| Household Size | Family Households | Nonfamily Households |
| 1-Person Households | - | 1,403 (39.9%) |
| 2-Person Households | 702 (20.0%) | 176 (5.0%) |
| 3-Person Households | 474 (13.5%) | 42 (1.2%) |
| 4-Person Households | 314 (8.9%) | 0 (0.0%) |
| 5-Person Households | 226 (6.4%) | 40 (1.1%) |
| 6-Person Households | 74 (2.1%) | 7 (0.2%) |
| 7+ Person Households | 57 (1.6%) | 0 (0.0%) |
| Total | 1,847 (52.5%) | 1,668 (47.4%) |
Female Fertility in Port Jervis
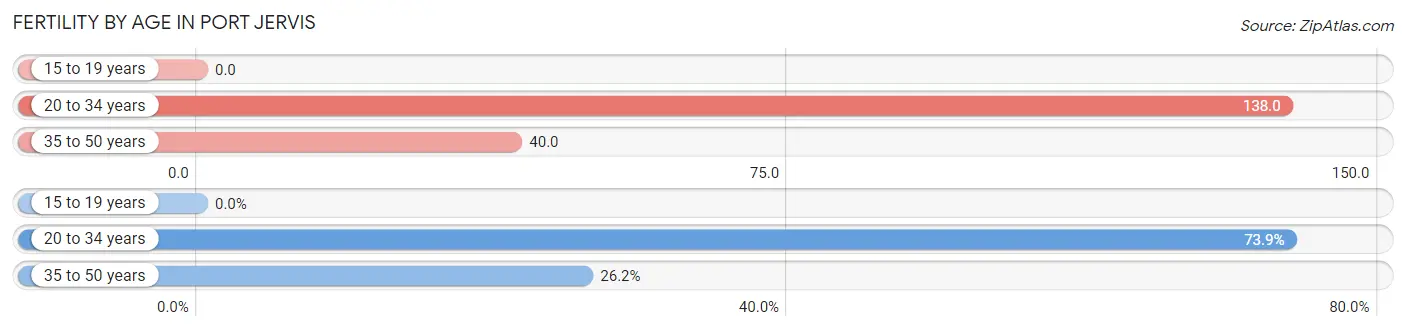
Fertility by Age in Port Jervis
Average fertility rate in Port Jervis is 64.0 births per 1,000 women. Women in the age bracket of 20 to 34 years have the highest fertility rate with 138.0 births per 1,000 women. Women in the age bracket of 20 to 34 years acount for 73.9% of all women with births.
| Age Bracket | Women with Births | Births / 1,000 Women |
| 15 to 19 years | 0 (0.0%) | 0.0 |
| 20 to 34 years | 96 (73.9%) | 138.0 |
| 35 to 50 years | 34 (26.2%) | 40.0 |
| Total | 130 (100.0%) | 64.0 |
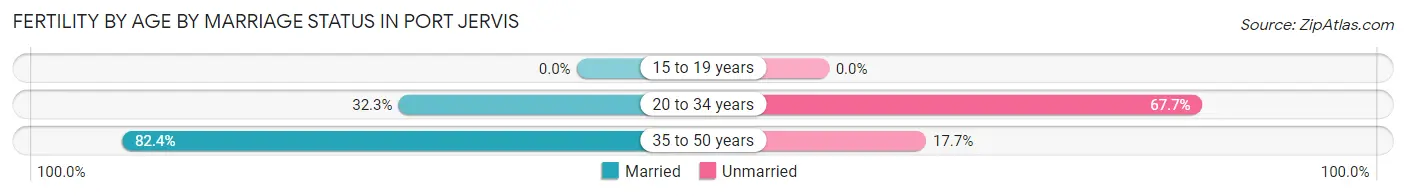
Fertility by Age by Marriage Status in Port Jervis
45.4% of women with births (130) in Port Jervis are married. The highest percentage of unmarried women with births falls into 20 to 34 years age bracket with 67.7% of them unmarried at the time of birth, while the lowest percentage of unmarried women with births belong to 35 to 50 years age bracket with 17.6% of them unmarried.
| Age Bracket | Married | Unmarried |
| 15 to 19 years | 0 (0.0%) | 0 (0.0%) |
| 20 to 34 years | 31 (32.3%) | 65 (67.7%) |
| 35 to 50 years | 28 (82.4%) | 6 (17.6%) |
| Total | 59 (45.4%) | 71 (54.6%) |
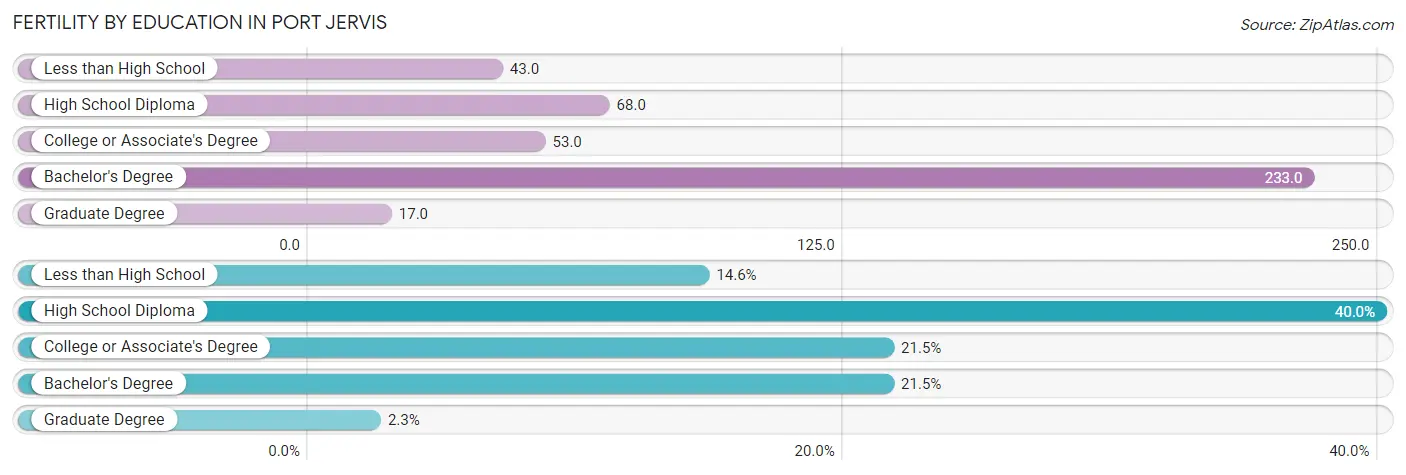
Fertility by Education in Port Jervis
Average fertility rate in Port Jervis is 64.0 births per 1,000 women. Women with the education attainment of bachelor's degree have the highest fertility rate of 233.0 births per 1,000 women, while women with the education attainment of graduate degree have the lowest fertility at 17.0 births per 1,000 women. Women with the education attainment of high school diploma represent 40.0% of all women with births.
| Educational Attainment | Women with Births | Births / 1,000 Women |
| Less than High School | 19 (14.6%) | 43.0 |
| High School Diploma | 52 (40.0%) | 68.0 |
| College or Associate's Degree | 28 (21.5%) | 53.0 |
| Bachelor's Degree | 28 (21.5%) | 233.0 |
| Graduate Degree | 3 (2.3%) | 17.0 |
| Total | 130 (100.0%) | 64.0 |
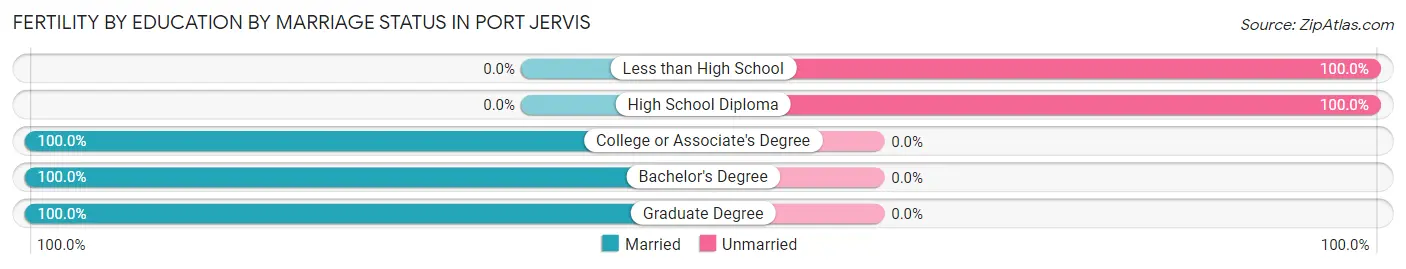
Fertility by Education by Marriage Status in Port Jervis
54.6% of women with births in Port Jervis are unmarried. Women with the educational attainment of college or associate's degree are most likely to be married with 100.0% of them married at childbirth, while women with the educational attainment of less than high school are least likely to be married with 100.0% of them unmarried at childbirth.
| Educational Attainment | Married | Unmarried |
| Less than High School | 0 (0.0%) | 19 (100.0%) |
| High School Diploma | 0 (0.0%) | 52 (100.0%) |
| College or Associate's Degree | 28 (100.0%) | 0 (0.0%) |
| Bachelor's Degree | 28 (100.0%) | 0 (0.0%) |
| Graduate Degree | 3 (100.0%) | 0 (0.0%) |
| Total | 59 (45.4%) | 71 (54.6%) |
Income in Port Jervis
Income Overview in Port Jervis
Per Capita Income in Port Jervis is $24,106, while median incomes of families and households are $57,817 and $38,804 respectively.
| Characteristic | Number | Measure |
| Per Capita Income | 8,725 | $24,106 |
| Median Family Income | 1,847 | $57,817 |
| Mean Family Income | 1,847 | $70,281 |
| Median Household Income | 3,515 | $38,804 |
| Mean Household Income | 3,515 | $57,440 |
| Income Deficit | 1,847 | $0 |
| Wage / Income Gap (%) | 8,725 | 35.27% |
| Wage / Income Gap ($) | 8,725 | 64.73¢ per $1 |
| Gini / Inequality Index | 8,725 | 0.44 |
Earnings by Sex in Port Jervis
Average Earnings in Port Jervis are $28,718, $33,300 for men and $21,554 for women, a difference of 35.3%.
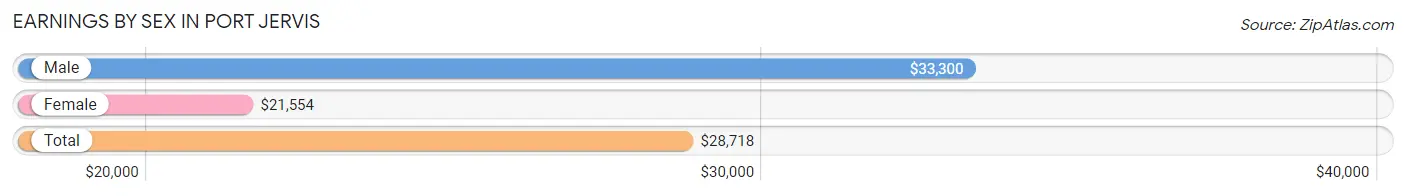
| Sex | Number | Average Earnings |
| Male | 2,270 (55.3%) | $33,300 |
| Female | 1,833 (44.7%) | $21,554 |
| Total | 4,103 (100.0%) | $28,718 |
Earnings by Sex by Income Bracket in Port Jervis
The most common earnings brackets in Port Jervis are $25,000 to $29,999 for men (325 | 14.3%) and $55,000 to $64,999 for women (180 | 9.8%).
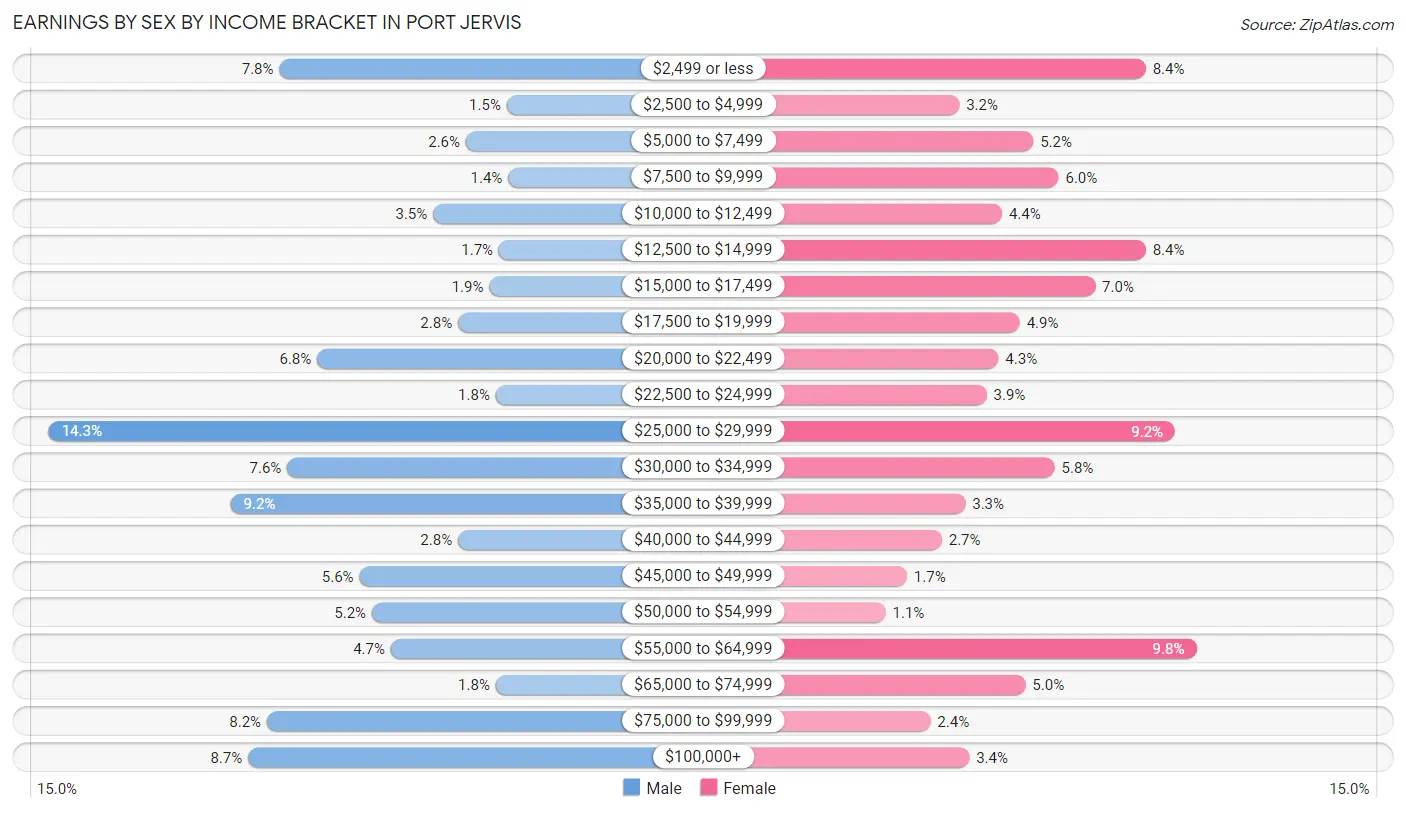
| Income | Male | Female |
| $2,499 or less | 178 (7.8%) | 154 (8.4%) |
| $2,500 to $4,999 | 33 (1.5%) | 58 (3.2%) |
| $5,000 to $7,499 | 59 (2.6%) | 96 (5.2%) |
| $7,500 to $9,999 | 32 (1.4%) | 109 (5.9%) |
| $10,000 to $12,499 | 80 (3.5%) | 80 (4.4%) |
| $12,500 to $14,999 | 38 (1.7%) | 154 (8.4%) |
| $15,000 to $17,499 | 44 (1.9%) | 128 (7.0%) |
| $17,500 to $19,999 | 64 (2.8%) | 89 (4.9%) |
| $20,000 to $22,499 | 154 (6.8%) | 78 (4.3%) |
| $22,500 to $24,999 | 40 (1.8%) | 72 (3.9%) |
| $25,000 to $29,999 | 325 (14.3%) | 169 (9.2%) |
| $30,000 to $34,999 | 173 (7.6%) | 107 (5.8%) |
| $35,000 to $39,999 | 209 (9.2%) | 61 (3.3%) |
| $40,000 to $44,999 | 64 (2.8%) | 49 (2.7%) |
| $45,000 to $49,999 | 127 (5.6%) | 31 (1.7%) |
| $50,000 to $54,999 | 119 (5.2%) | 20 (1.1%) |
| $55,000 to $64,999 | 107 (4.7%) | 180 (9.8%) |
| $65,000 to $74,999 | 40 (1.8%) | 92 (5.0%) |
| $75,000 to $99,999 | 186 (8.2%) | 43 (2.4%) |
| $100,000+ | 198 (8.7%) | 63 (3.4%) |
| Total | 2,270 (100.0%) | 1,833 (100.0%) |
Earnings by Sex by Educational Attainment in Port Jervis
Average earnings in Port Jervis are $38,730 for men and $27,350 for women, a difference of 29.4%. Men with an educational attainment of college or associate's degree enjoy the highest average annual earnings of $46,633, while those with less than high school education earn the least with $24,097. Women with an educational attainment of college or associate's degree earn the most with the average annual earnings of $40,074, while those with graduate degree education have the smallest earnings of $22,649.
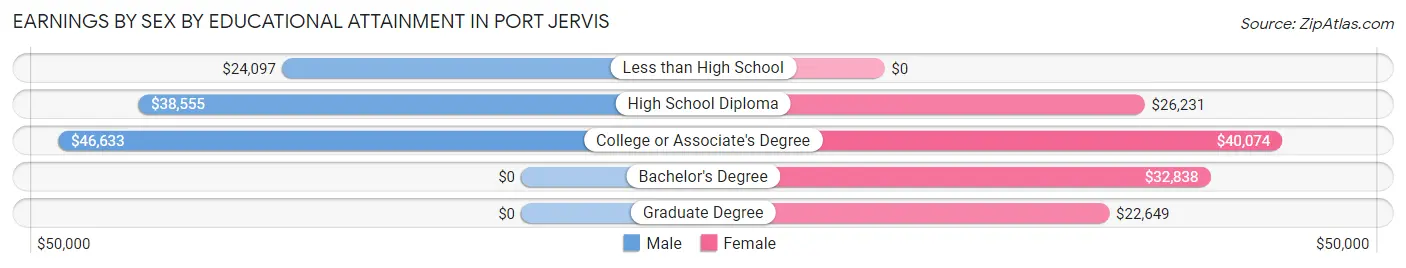
| Educational Attainment | Male Income | Female Income |
| Less than High School | $24,097 | $0 |
| High School Diploma | $38,555 | $26,231 |
| College or Associate's Degree | $46,633 | $40,074 |
| Bachelor's Degree | - | - |
| Graduate Degree | - | - |
| Total | $38,730 | $27,350 |
Family Income in Port Jervis
Family Income Brackets in Port Jervis
According to the Port Jervis family income data, there are 440 families falling into the $100,000 to $149,999 income range, which is the most common income bracket and makes up 23.8% of all families. Conversely, the $200,000+ income bracket is the least frequent group with only 11 families (0.6%) belonging to this category.
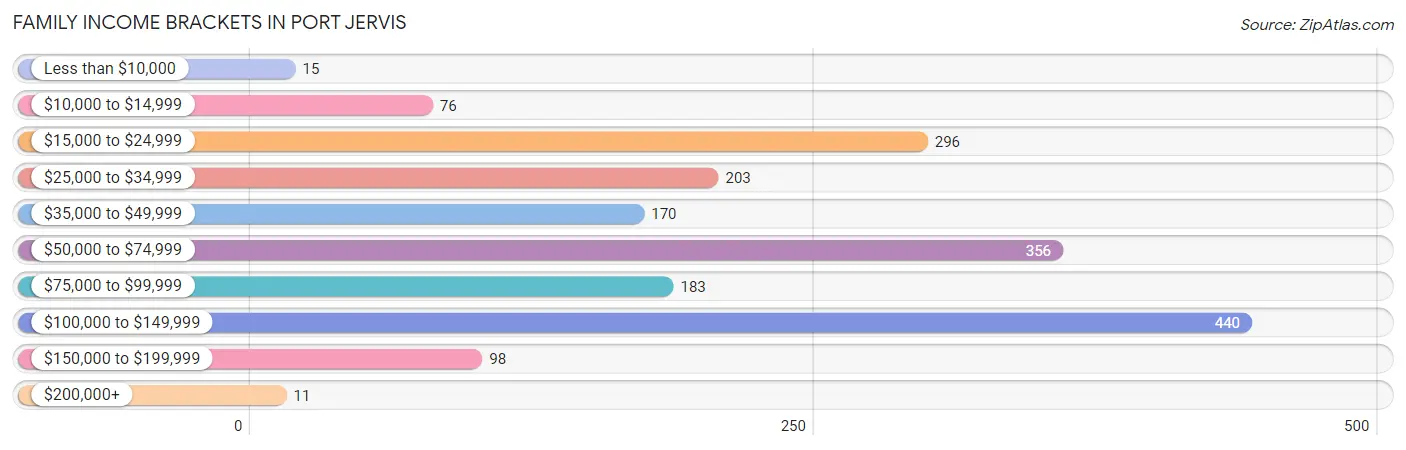
| Income Bracket | # Families | % Families |
| Less than $10,000 | 15 | 0.8% |
| $10,000 to $14,999 | 76 | 4.1% |
| $15,000 to $24,999 | 296 | 16.0% |
| $25,000 to $34,999 | 203 | 11.0% |
| $35,000 to $49,999 | 170 | 9.2% |
| $50,000 to $74,999 | 356 | 19.3% |
| $75,000 to $99,999 | 183 | 9.9% |
| $100,000 to $149,999 | 440 | 23.8% |
| $150,000 to $199,999 | 98 | 5.3% |
| $200,000+ | 11 | 0.6% |
Family Income by Famaliy Size in Port Jervis
5-person families (246 | 13.3%) account for the highest median family income in Port Jervis with $105,509 per family, while 5-person families (246 | 13.3%) have the highest median income of $21,102 per family member.
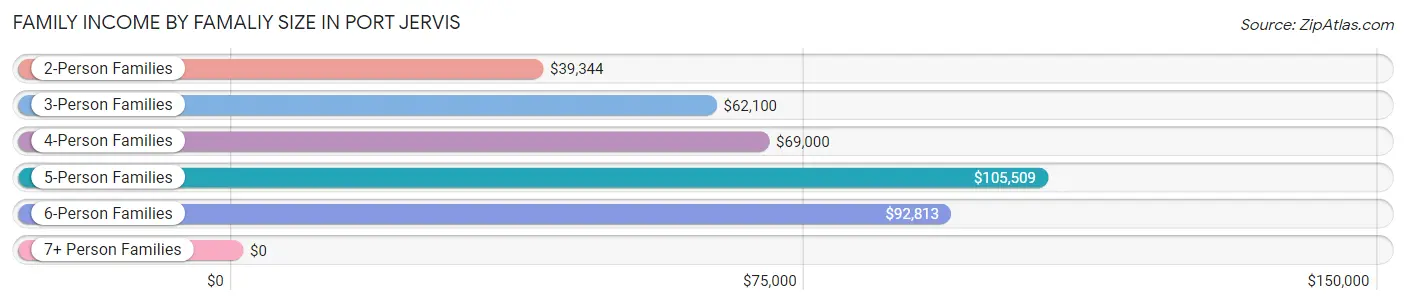
| Income Bracket | # Families | Median Income |
| 2-Person Families | 860 (46.6%) | $39,344 |
| 3-Person Families | 334 (18.1%) | $62,100 |
| 4-Person Families | 296 (16.0%) | $69,000 |
| 5-Person Families | 246 (13.3%) | $105,509 |
| 6-Person Families | 96 (5.2%) | $92,813 |
| 7+ Person Families | 15 (0.8%) | $0 |
| Total | 1,847 (100.0%) | $57,817 |
Family Income by Number of Earners in Port Jervis
The median family income in Port Jervis is $57,817, with families comprising 3+ earners (240) having the highest median family income of $106,481, while families with no earners (227) have the lowest median family income of $22,250, accounting for 13.0% and 12.3% of families, respectively.
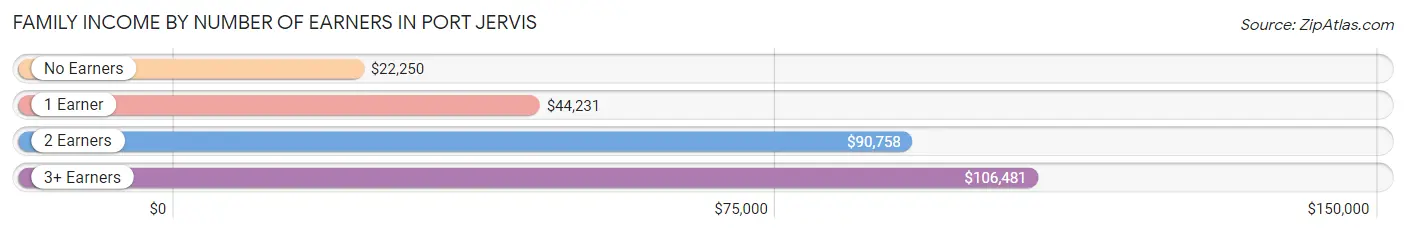
| Number of Earners | # Families | Median Income |
| No Earners | 227 (12.3%) | $22,250 |
| 1 Earner | 808 (43.8%) | $44,231 |
| 2 Earners | 572 (31.0%) | $90,758 |
| 3+ Earners | 240 (13.0%) | $106,481 |
| Total | 1,847 (100.0%) | $57,817 |
Household Income in Port Jervis
Household Income Brackets in Port Jervis
With 608 households falling in the category, the $25,000 to $34,999 income range is the most frequent in Port Jervis, accounting for 17.3% of all households. In contrast, only 11 households (0.3%) fall into the $200,000+ income bracket, making it the least populous group.
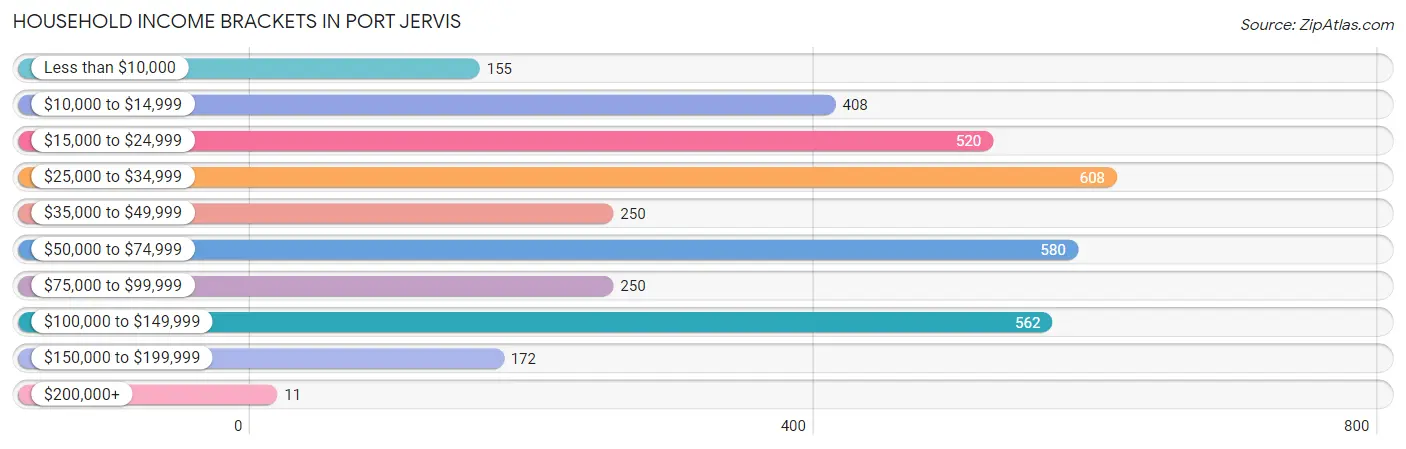
| Income Bracket | # Households | % Households |
| Less than $10,000 | 155 | 4.4% |
| $10,000 to $14,999 | 408 | 11.6% |
| $15,000 to $24,999 | 520 | 14.8% |
| $25,000 to $34,999 | 608 | 17.3% |
| $35,000 to $49,999 | 250 | 7.1% |
| $50,000 to $74,999 | 580 | 16.5% |
| $75,000 to $99,999 | 250 | 7.1% |
| $100,000 to $149,999 | 562 | 16.0% |
| $150,000 to $199,999 | 172 | 4.9% |
| $200,000+ | 11 | 0.3% |
Household Income by Householder Age in Port Jervis
The median household income in Port Jervis is $38,804, with the highest median household income of $62,618 found in the 25 to 44 years age bracket for the primary householder. A total of 773 households (22.0%) fall into this category. Meanwhile, the 15 to 24 years age bracket for the primary householder has the lowest median household income of $24,750, with 137 households (3.9%) in this group.
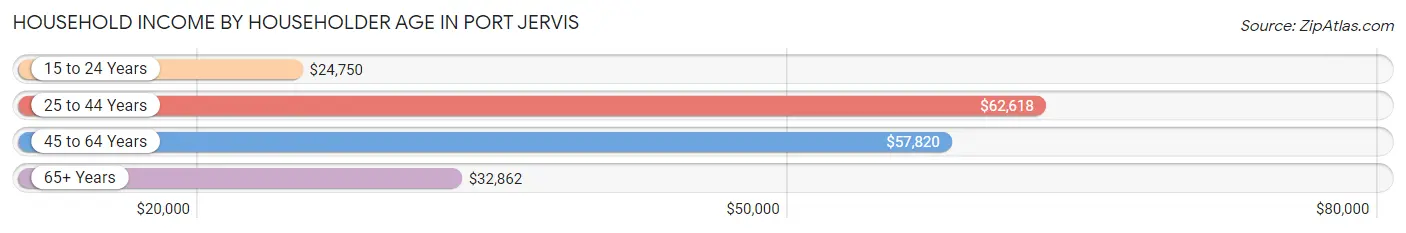
| Income Bracket | # Households | Median Income |
| 15 to 24 Years | 137 (3.9%) | $24,750 |
| 25 to 44 Years | 773 (22.0%) | $62,618 |
| 45 to 64 Years | 1,269 (36.1%) | $57,820 |
| 65+ Years | 1,336 (38.0%) | $32,862 |
| Total | 3,515 (100.0%) | $38,804 |
Poverty in Port Jervis
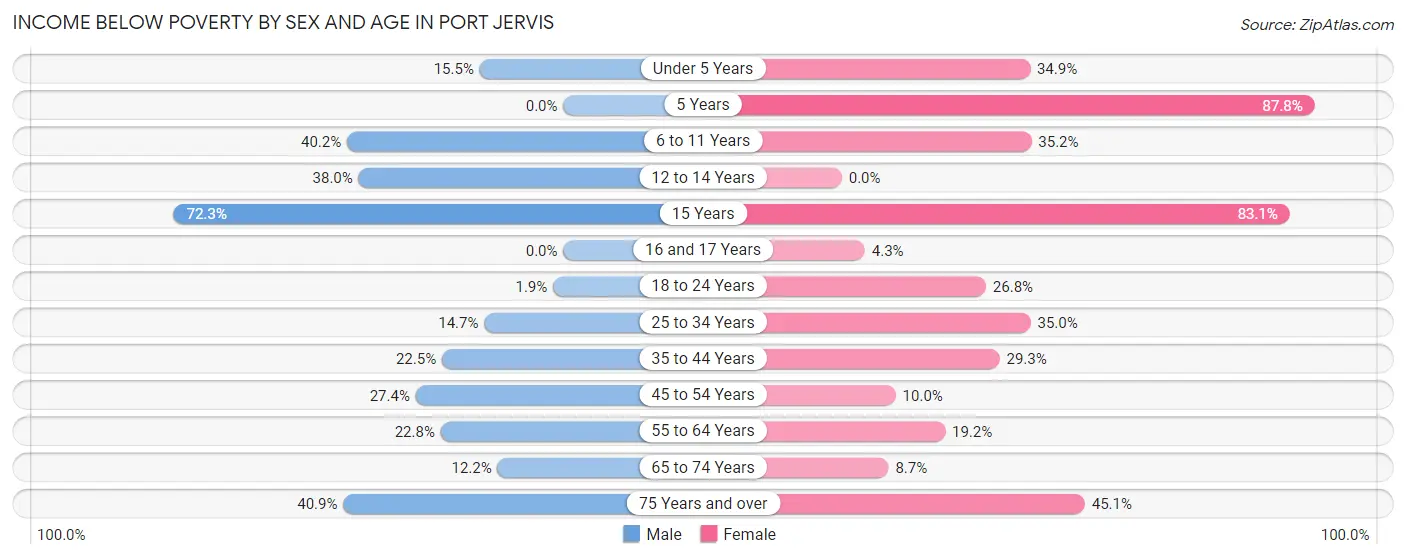
Income Below Poverty by Sex and Age in Port Jervis
With 20.6% poverty level for males and 26.5% for females among the residents of Port Jervis, 15 year old males and 5 year old females are the most vulnerable to poverty, with 34 males (72.3%) and 43 females (87.8%) in their respective age groups living below the poverty level.
| Age Bracket | Male | Female |
| Under 5 Years | 36 (15.5%) | 73 (34.9%) |
| 5 Years | 0 (0.0%) | 43 (87.8%) |
| 6 to 11 Years | 106 (40.2%) | 82 (35.2%) |
| 12 to 14 Years | 76 (38.0%) | 0 (0.0%) |
| 15 Years | 34 (72.3%) | 69 (83.1%) |
| 16 and 17 Years | 0 (0.0%) | 8 (4.3%) |
| 18 to 24 Years | 9 (1.9%) | 149 (26.8%) |
| 25 to 34 Years | 71 (14.7%) | 124 (35.0%) |
| 35 to 44 Years | 137 (22.5%) | 166 (29.3%) |
| 45 to 54 Years | 140 (27.4%) | 39 (10.0%) |
| 55 to 64 Years | 137 (22.8%) | 128 (19.2%) |
| 65 to 74 Years | 55 (12.2%) | 38 (8.7%) |
| 75 Years and over | 67 (40.8%) | 253 (45.1%) |
| Total | 868 (20.6%) | 1,172 (26.5%) |
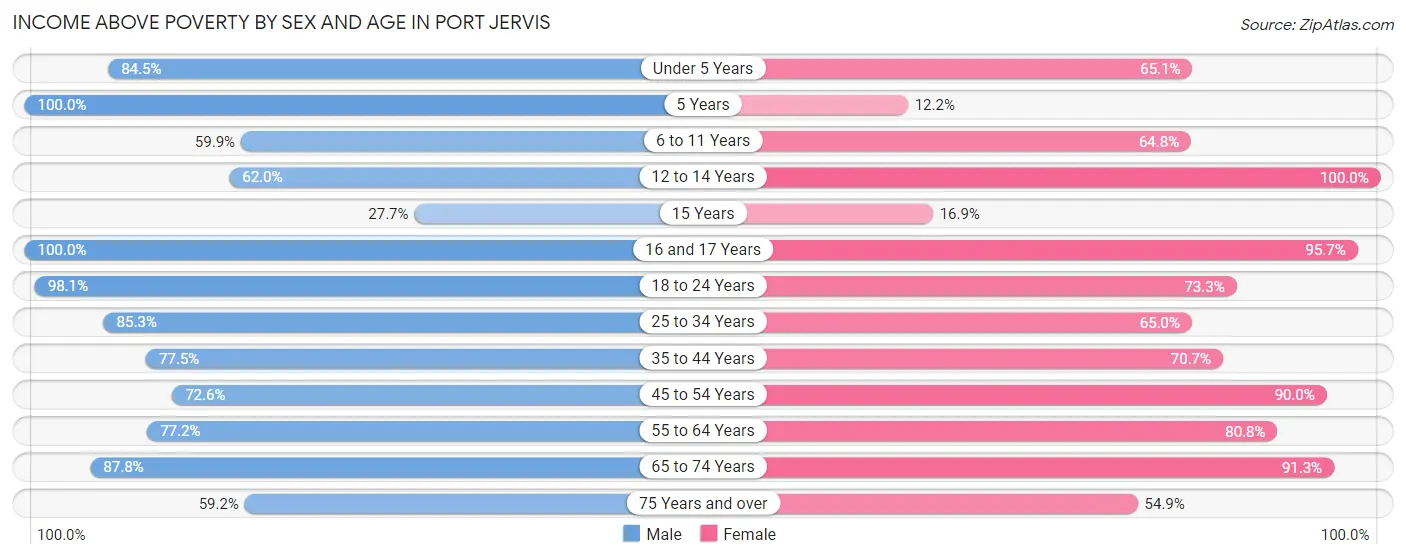
Income Above Poverty by Sex and Age in Port Jervis
According to the poverty statistics in Port Jervis, males aged 5 years and females aged 12 to 14 years are the age groups that are most secure financially, with 100.0% of males and 100.0% of females in these age groups living above the poverty line.
| Age Bracket | Male | Female |
| Under 5 Years | 196 (84.5%) | 136 (65.1%) |
| 5 Years | 66 (100.0%) | 6 (12.2%) |
| 6 to 11 Years | 158 (59.9%) | 151 (64.8%) |
| 12 to 14 Years | 124 (62.0%) | 132 (100.0%) |
| 15 Years | 13 (27.7%) | 14 (16.9%) |
| 16 and 17 Years | 117 (100.0%) | 179 (95.7%) |
| 18 to 24 Years | 464 (98.1%) | 408 (73.3%) |
| 25 to 34 Years | 413 (85.3%) | 230 (65.0%) |
| 35 to 44 Years | 471 (77.5%) | 401 (70.7%) |
| 45 to 54 Years | 371 (72.6%) | 351 (90.0%) |
| 55 to 64 Years | 465 (77.2%) | 540 (80.8%) |
| 65 to 74 Years | 395 (87.8%) | 401 (91.3%) |
| 75 Years and over | 97 (59.2%) | 308 (54.9%) |
| Total | 3,350 (79.4%) | 3,257 (73.5%) |
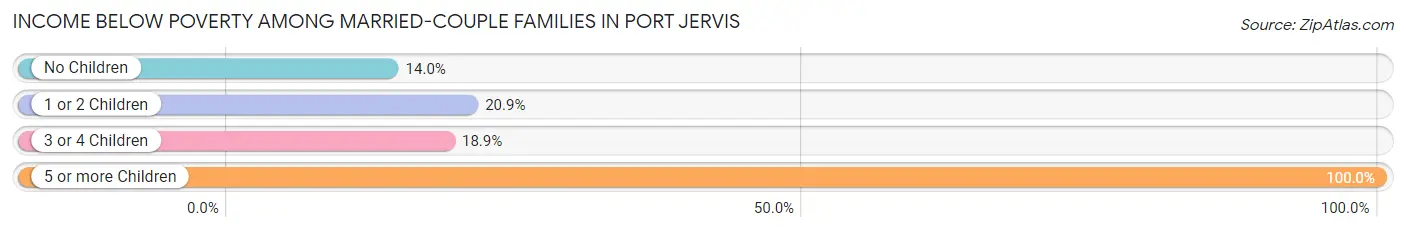
Income Below Poverty Among Married-Couple Families in Port Jervis
The poverty statistics for married-couple families in Port Jervis show that 17.6% or 208 of the total 1,183 families live below the poverty line. Families with 5 or more children have the highest poverty rate of 100.0%, comprising of 9 families. On the other hand, families with no children have the lowest poverty rate of 14.0%, which includes 90 families.
| Children | Above Poverty | Below Poverty |
| No Children | 554 (86.0%) | 90 (14.0%) |
| 1 or 2 Children | 348 (79.1%) | 92 (20.9%) |
| 3 or 4 Children | 73 (81.1%) | 17 (18.9%) |
| 5 or more Children | 0 (0.0%) | 9 (100.0%) |
| Total | 975 (82.4%) | 208 (17.6%) |
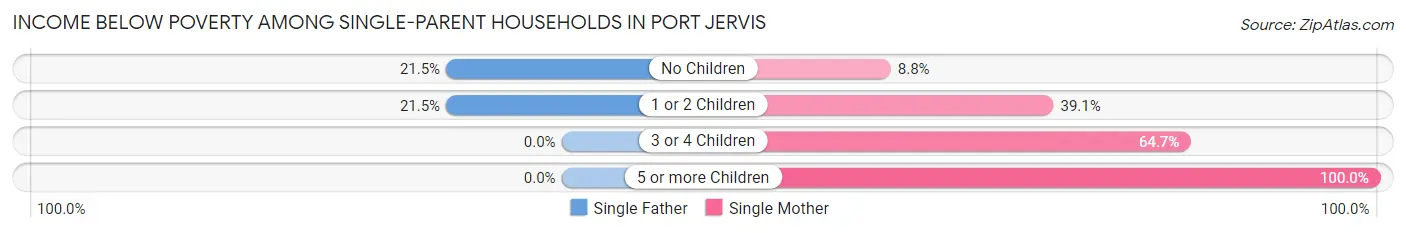
Income Below Poverty Among Single-Parent Households in Port Jervis
According to the poverty data in Port Jervis, 21.5% or 51 single-father households and 34.7% or 148 single-mother households are living below the poverty line. Among single-father households, those with no children have the highest poverty rate, with 17 households (21.5%) experiencing poverty. Likewise, among single-mother households, those with 5 or more children have the highest poverty rate, with 7 households (100.0%) falling below the poverty line.
| Children | Single Father | Single Mother |
| No Children | 17 (21.5%) | 8 (8.8%) |
| 1 or 2 Children | 34 (21.5%) | 122 (39.1%) |
| 3 or 4 Children | 0 (0.0%) | 11 (64.7%) |
| 5 or more Children | 0 (0.0%) | 7 (100.0%) |
| Total | 51 (21.5%) | 148 (34.7%) |
Income Below Poverty Among Married-Couple vs Single-Parent Households in Port Jervis
The poverty data for Port Jervis shows that 208 of the married-couple family households (17.6%) and 199 of the single-parent households (30.0%) are living below the poverty level. Within the married-couple family households, those with 5 or more children have the highest poverty rate, with 9 households (100.0%) falling below the poverty line. Among the single-parent households, those with 5 or more children have the highest poverty rate, with 7 household (100.0%) living below poverty.
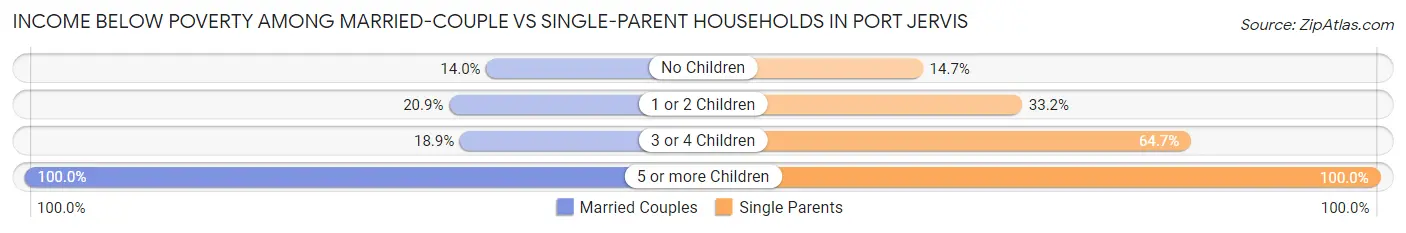
| Children | Married-Couple Families | Single-Parent Households |
| No Children | 90 (14.0%) | 25 (14.7%) |
| 1 or 2 Children | 92 (20.9%) | 156 (33.2%) |
| 3 or 4 Children | 17 (18.9%) | 11 (64.7%) |
| 5 or more Children | 9 (100.0%) | 7 (100.0%) |
| Total | 208 (17.6%) | 199 (30.0%) |
Employment Characteristics in Port Jervis
Employment by Class of Employer in Port Jervis
Among the 3,563 employed individuals in Port Jervis, private company employees (2,421 | 67.9%), not-for-profit organizations (428 | 12.0%), and local government employees (293 | 8.2%) make up the most common classes of employment.
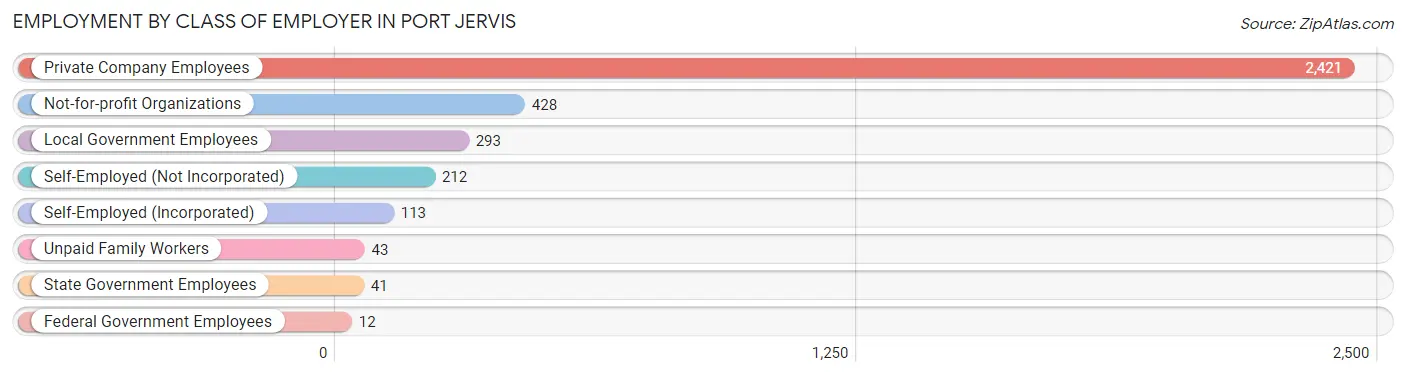
| Employer Class | # Employees | % Employees |
| Private Company Employees | 2,421 | 67.9% |
| Self-Employed (Incorporated) | 113 | 3.2% |
| Self-Employed (Not Incorporated) | 212 | 5.9% |
| Not-for-profit Organizations | 428 | 12.0% |
| Local Government Employees | 293 | 8.2% |
| State Government Employees | 41 | 1.1% |
| Federal Government Employees | 12 | 0.3% |
| Unpaid Family Workers | 43 | 1.2% |
| Total | 3,563 | 100.0% |
Employment Status by Age in Port Jervis
According to the labor force statistics for Port Jervis, out of the total population over 16 years of age (7,185), 55.0% or 3,952 individuals are in the labor force, with 7.9% or 312 of them unemployed. The age group with the highest labor force participation rate is 25 to 29 years, with 89.9% or 366 individuals in the labor force. Within the labor force, the 16 to 19 years age range has the highest percentage of unemployed individuals, with 57.3% or 94 of them being unemployed.
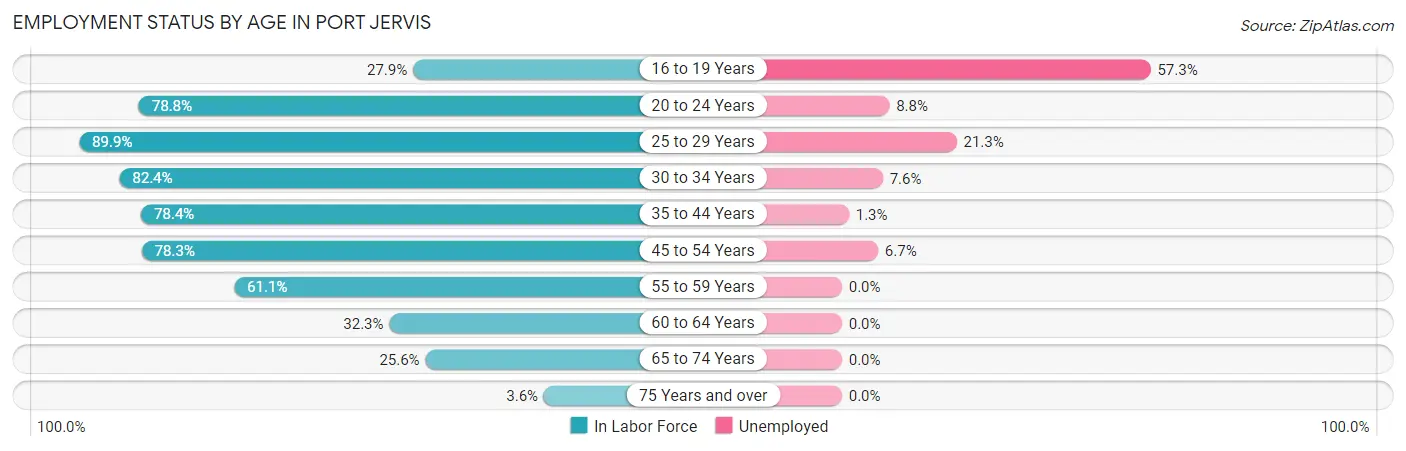
| Age Bracket | In Labor Force | Unemployed |
| 16 to 19 Years | 164 (27.9%) | 94 (57.3%) |
| 20 to 24 Years | 589 (78.8%) | 52 (8.8%) |
| 25 to 29 Years | 366 (89.9%) | 78 (21.3%) |
| 30 to 34 Years | 356 (82.4%) | 27 (7.6%) |
| 35 to 44 Years | 924 (78.4%) | 12 (1.3%) |
| 45 to 54 Years | 712 (78.3%) | 48 (6.7%) |
| 55 to 59 Years | 366 (61.1%) | 0 (0.0%) |
| 60 to 64 Years | 219 (32.3%) | 0 (0.0%) |
| 65 to 74 Years | 229 (25.6%) | 0 (0.0%) |
| 75 Years and over | 27 (3.6%) | 0 (0.0%) |
| Total | 3,952 (55.0%) | 312 (7.9%) |
Employment Status by Educational Attainment in Port Jervis
According to labor force statistics for Port Jervis, 70.0% of individuals (2,943) out of the total population between 25 and 64 years of age (4,204) are in the labor force, with 5.6% or 165 of them being unemployed. The group with the highest labor force participation rate are those with the educational attainment of bachelor's degree or higher, with 83.9% or 596 individuals in the labor force. Within the labor force, individuals with less than high school education have the highest percentage of unemployment, with 24.2% or 47 of them being unemployed.
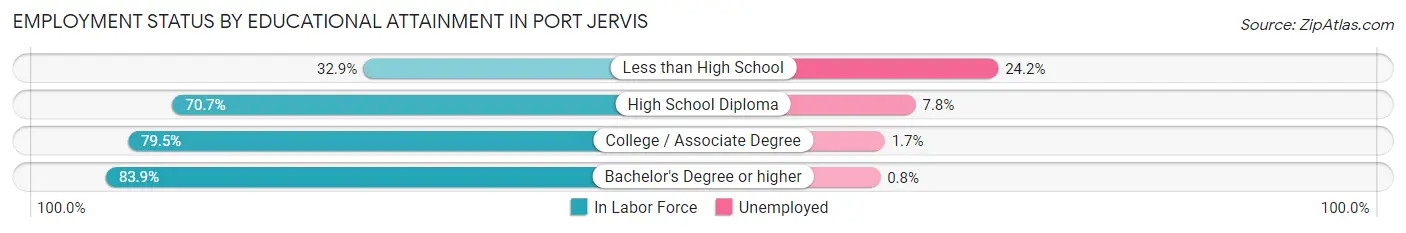
| Educational Attainment | In Labor Force | Unemployed |
| Less than High School | 194 (32.9%) | 143 (24.2%) |
| High School Diploma | 1,254 (70.7%) | 138 (7.8%) |
| College / Associate Degree | 899 (79.5%) | 19 (1.7%) |
| Bachelor's Degree or higher | 596 (83.9%) | 6 (0.8%) |
| Total | 2,943 (70.0%) | 235 (5.6%) |
Employment Occupations by Sex in Port Jervis
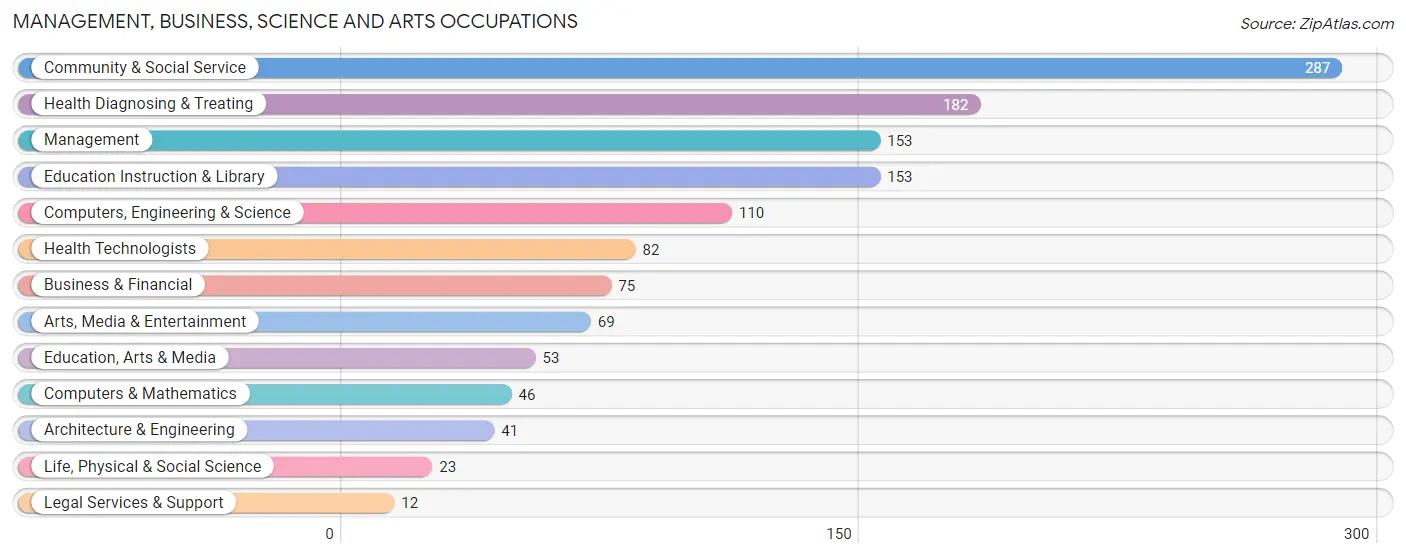
Management, Business, Science and Arts Occupations
The most common Management, Business, Science and Arts occupations in Port Jervis are Community & Social Service (287 | 7.9%), Health Diagnosing & Treating (182 | 5.0%), Management (153 | 4.2%), Education Instruction & Library (153 | 4.2%), and Computers, Engineering & Science (110 | 3.0%).
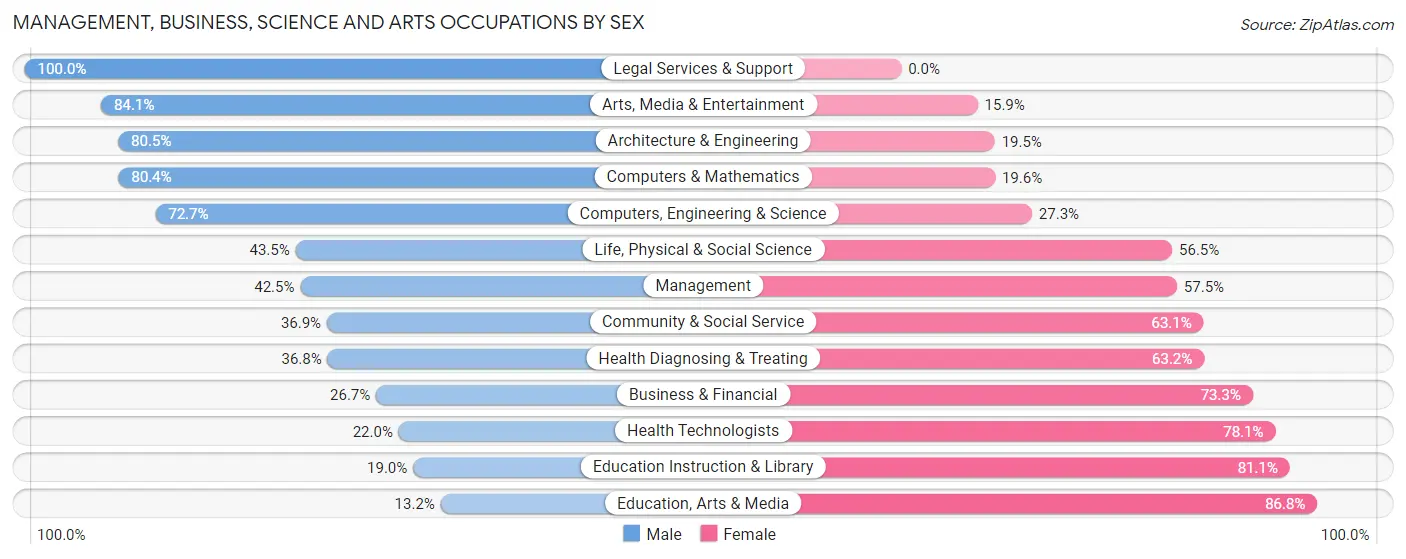
Management, Business, Science and Arts Occupations by Sex
Within the Management, Business, Science and Arts occupations in Port Jervis, the most male-oriented occupations are Legal Services & Support (100.0%), Arts, Media & Entertainment (84.1%), and Architecture & Engineering (80.5%), while the most female-oriented occupations are Education, Arts & Media (86.8%), Education Instruction & Library (81.0%), and Health Technologists (78.0%).
| Occupation | Male | Female |
| Management | 65 (42.5%) | 88 (57.5%) |
| Business & Financial | 20 (26.7%) | 55 (73.3%) |
| Computers, Engineering & Science | 80 (72.7%) | 30 (27.3%) |
| Computers & Mathematics | 37 (80.4%) | 9 (19.6%) |
| Architecture & Engineering | 33 (80.5%) | 8 (19.5%) |
| Life, Physical & Social Science | 10 (43.5%) | 13 (56.5%) |
| Community & Social Service | 106 (36.9%) | 181 (63.1%) |
| Education, Arts & Media | 7 (13.2%) | 46 (86.8%) |
| Legal Services & Support | 12 (100.0%) | 0 (0.0%) |
| Education Instruction & Library | 29 (19.0%) | 124 (81.0%) |
| Arts, Media & Entertainment | 58 (84.1%) | 11 (15.9%) |
| Health Diagnosing & Treating | 67 (36.8%) | 115 (63.2%) |
| Health Technologists | 18 (22.0%) | 64 (78.0%) |
| Total (Category) | 338 (41.9%) | 469 (58.1%) |
| Total (Overall) | 2,008 (55.1%) | 1,633 (44.9%) |
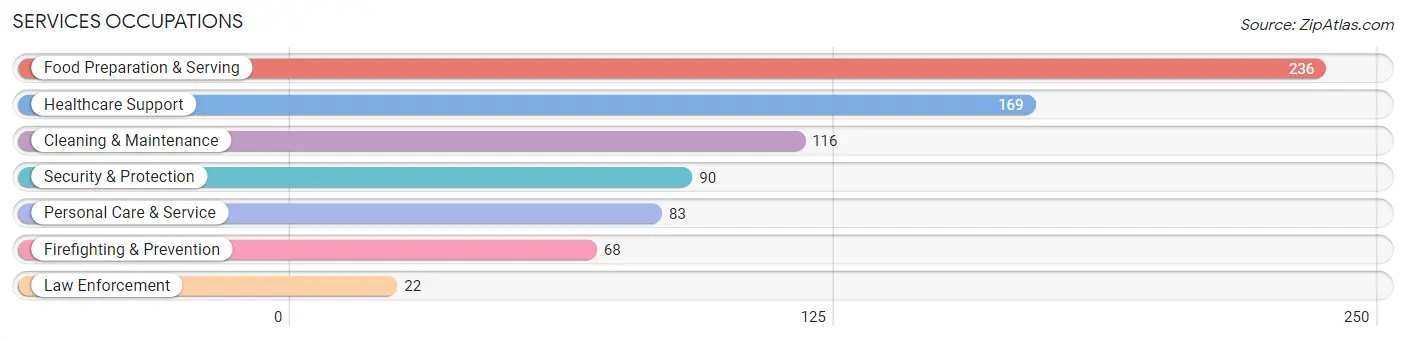
Services Occupations
The most common Services occupations in Port Jervis are Food Preparation & Serving (236 | 6.5%), Healthcare Support (169 | 4.6%), Cleaning & Maintenance (116 | 3.2%), Security & Protection (90 | 2.5%), and Personal Care & Service (83 | 2.3%).
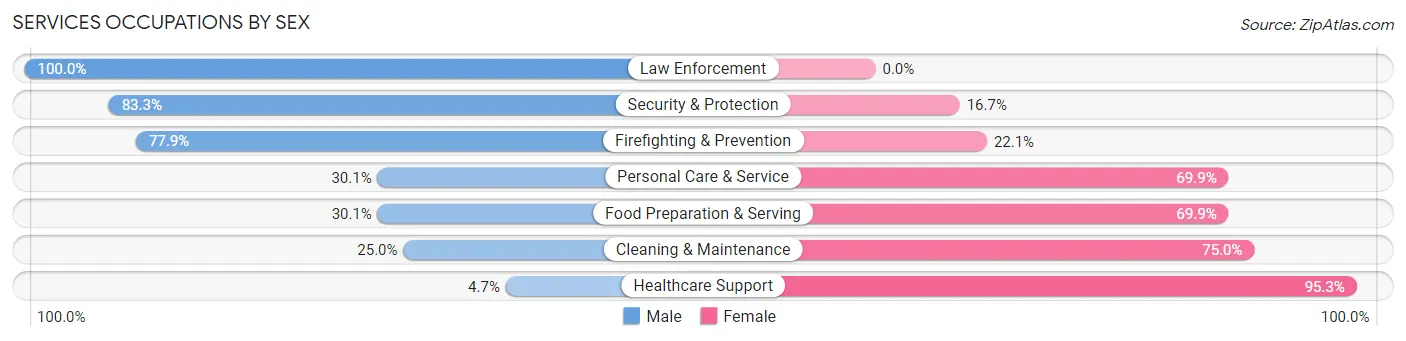
Services Occupations by Sex
Within the Services occupations in Port Jervis, the most male-oriented occupations are Law Enforcement (100.0%), Security & Protection (83.3%), and Firefighting & Prevention (77.9%), while the most female-oriented occupations are Healthcare Support (95.3%), Cleaning & Maintenance (75.0%), and Food Preparation & Serving (69.9%).
| Occupation | Male | Female |
| Healthcare Support | 8 (4.7%) | 161 (95.3%) |
| Security & Protection | 75 (83.3%) | 15 (16.7%) |
| Firefighting & Prevention | 53 (77.9%) | 15 (22.1%) |
| Law Enforcement | 22 (100.0%) | 0 (0.0%) |
| Food Preparation & Serving | 71 (30.1%) | 165 (69.9%) |
| Cleaning & Maintenance | 29 (25.0%) | 87 (75.0%) |
| Personal Care & Service | 25 (30.1%) | 58 (69.9%) |
| Total (Category) | 208 (30.0%) | 486 (70.0%) |
| Total (Overall) | 2,008 (55.1%) | 1,633 (44.9%) |
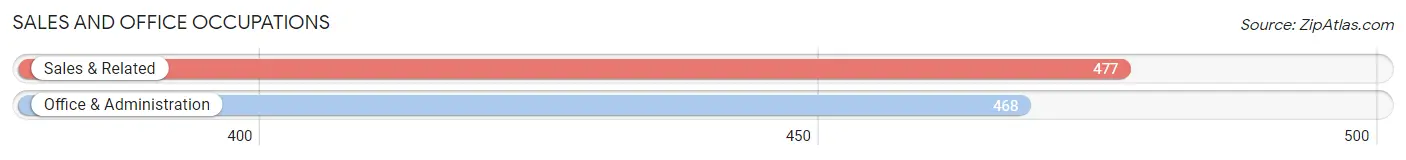
Sales and Office Occupations
The most common Sales and Office occupations in Port Jervis are Sales & Related (477 | 13.1%), and Office & Administration (468 | 12.9%).
Sales and Office Occupations by Sex
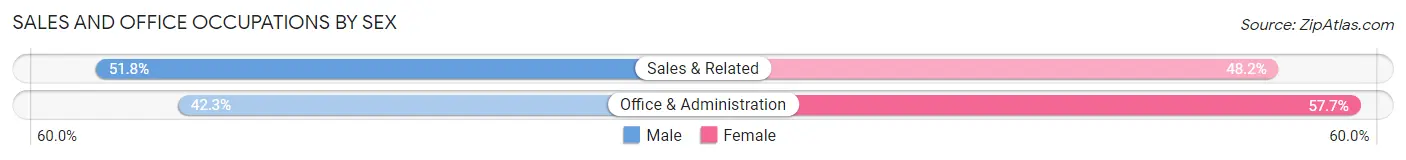
| Occupation | Male | Female |
| Sales & Related | 247 (51.8%) | 230 (48.2%) |
| Office & Administration | 198 (42.3%) | 270 (57.7%) |
| Total (Category) | 445 (47.1%) | 500 (52.9%) |
| Total (Overall) | 2,008 (55.1%) | 1,633 (44.9%) |
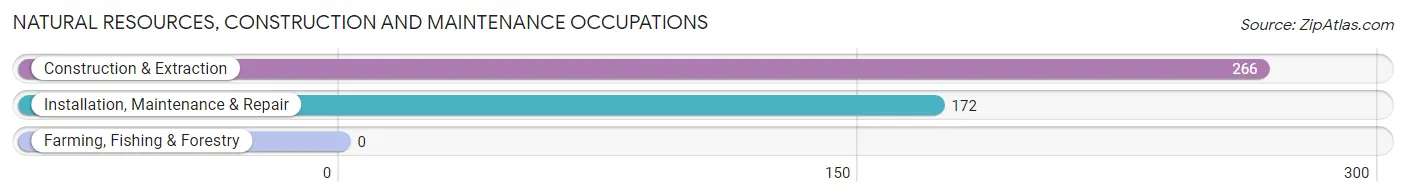
Natural Resources, Construction and Maintenance Occupations
The most common Natural Resources, Construction and Maintenance occupations in Port Jervis are Construction & Extraction (266 | 7.3%), and Installation, Maintenance & Repair (172 | 4.7%).
Natural Resources, Construction and Maintenance Occupations by Sex
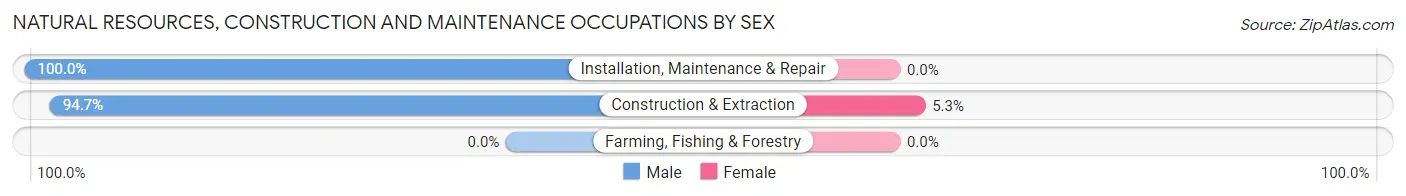
| Occupation | Male | Female |
| Farming, Fishing & Forestry | 0 (0.0%) | 0 (0.0%) |
| Construction & Extraction | 252 (94.7%) | 14 (5.3%) |
| Installation, Maintenance & Repair | 172 (100.0%) | 0 (0.0%) |
| Total (Category) | 424 (96.8%) | 14 (3.2%) |
| Total (Overall) | 2,008 (55.1%) | 1,633 (44.9%) |
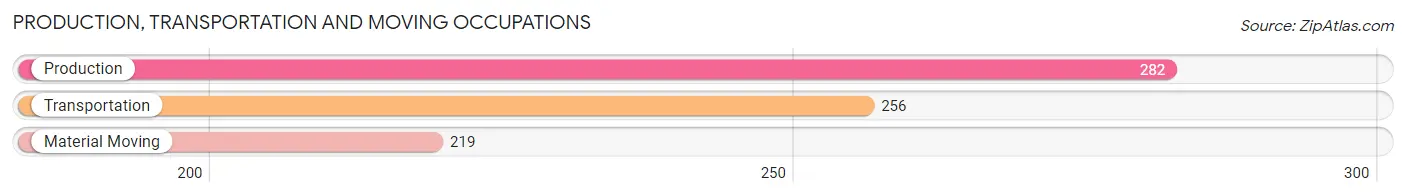
Production, Transportation and Moving Occupations
The most common Production, Transportation and Moving occupations in Port Jervis are Production (282 | 7.7%), Transportation (256 | 7.0%), and Material Moving (219 | 6.0%).
Production, Transportation and Moving Occupations by Sex
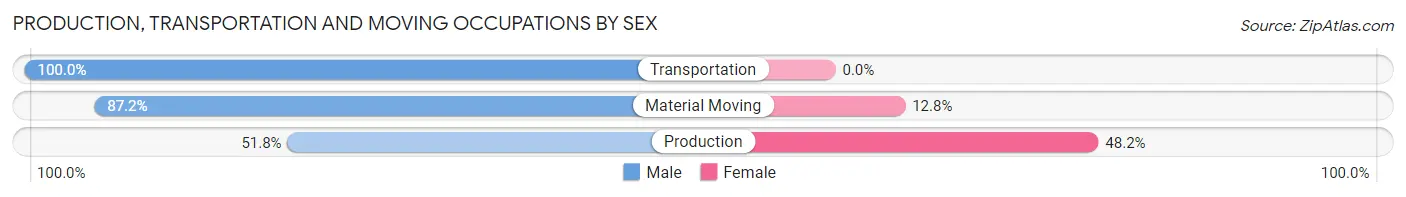
| Occupation | Male | Female |
| Production | 146 (51.8%) | 136 (48.2%) |
| Transportation | 256 (100.0%) | 0 (0.0%) |
| Material Moving | 191 (87.2%) | 28 (12.8%) |
| Total (Category) | 593 (78.3%) | 164 (21.7%) |
| Total (Overall) | 2,008 (55.1%) | 1,633 (44.9%) |
Employment Industries by Sex in Port Jervis
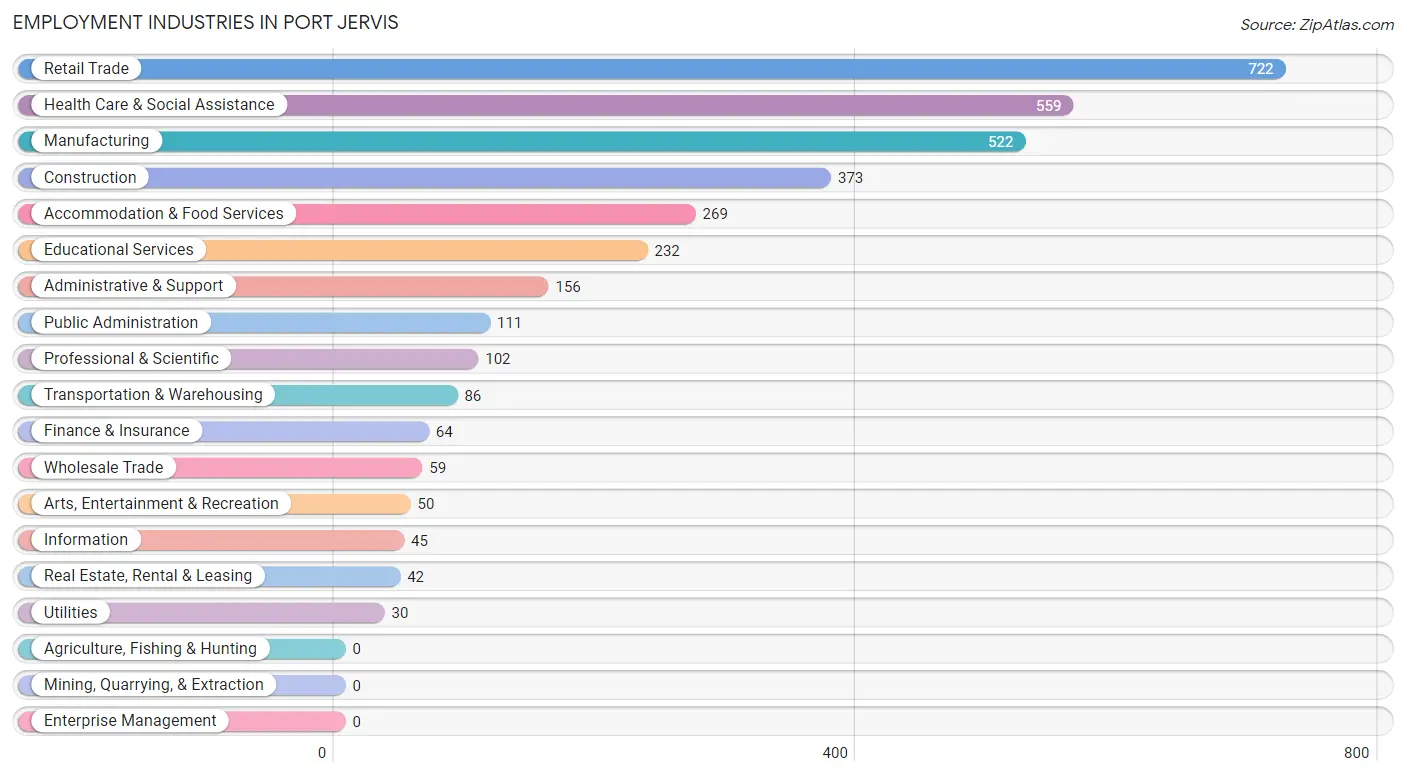
Employment Industries in Port Jervis
The major employment industries in Port Jervis include Retail Trade (722 | 19.8%), Health Care & Social Assistance (559 | 15.3%), Manufacturing (522 | 14.3%), Construction (373 | 10.2%), and Accommodation & Food Services (269 | 7.4%).
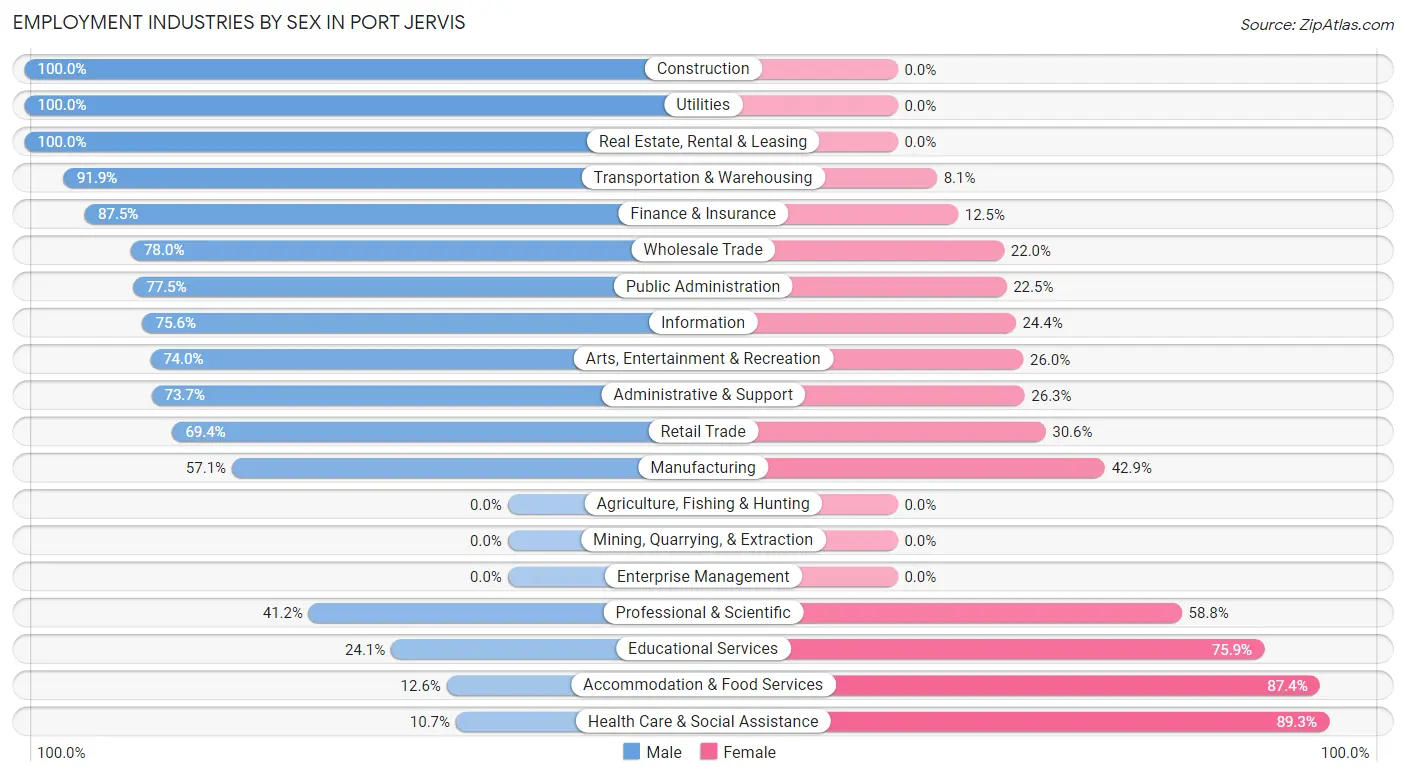
Employment Industries by Sex in Port Jervis
The Port Jervis industries that see more men than women are Construction (100.0%), Utilities (100.0%), and Real Estate, Rental & Leasing (100.0%), whereas the industries that tend to have a higher number of women are Health Care & Social Assistance (89.3%), Accommodation & Food Services (87.4%), and Educational Services (75.9%).
| Industry | Male | Female |
| Agriculture, Fishing & Hunting | 0 (0.0%) | 0 (0.0%) |
| Mining, Quarrying, & Extraction | 0 (0.0%) | 0 (0.0%) |
| Construction | 373 (100.0%) | 0 (0.0%) |
| Manufacturing | 298 (57.1%) | 224 (42.9%) |
| Wholesale Trade | 46 (78.0%) | 13 (22.0%) |
| Retail Trade | 501 (69.4%) | 221 (30.6%) |
| Transportation & Warehousing | 79 (91.9%) | 7 (8.1%) |
| Utilities | 30 (100.0%) | 0 (0.0%) |
| Information | 34 (75.6%) | 11 (24.4%) |
| Finance & Insurance | 56 (87.5%) | 8 (12.5%) |
| Real Estate, Rental & Leasing | 42 (100.0%) | 0 (0.0%) |
| Professional & Scientific | 42 (41.2%) | 60 (58.8%) |
| Enterprise Management | 0 (0.0%) | 0 (0.0%) |
| Administrative & Support | 115 (73.7%) | 41 (26.3%) |
| Educational Services | 56 (24.1%) | 176 (75.9%) |
| Health Care & Social Assistance | 60 (10.7%) | 499 (89.3%) |
| Arts, Entertainment & Recreation | 37 (74.0%) | 13 (26.0%) |
| Accommodation & Food Services | 34 (12.6%) | 235 (87.4%) |
| Public Administration | 86 (77.5%) | 25 (22.5%) |
| Total | 2,008 (55.1%) | 1,633 (44.9%) |
Education in Port Jervis
School Enrollment in Port Jervis
The most common levels of schooling among the 1,927 students in Port Jervis are high school (528 | 27.4%), middle school (414 | 21.5%), and elementary school (358 | 18.6%).
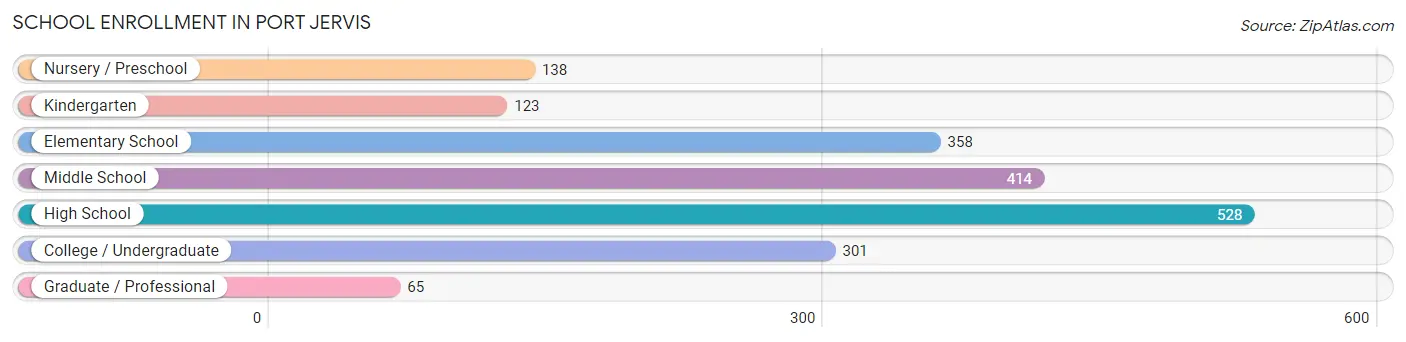
| School Level | # Students | % Students |
| Nursery / Preschool | 138 | 7.2% |
| Kindergarten | 123 | 6.4% |
| Elementary School | 358 | 18.6% |
| Middle School | 414 | 21.5% |
| High School | 528 | 27.4% |
| College / Undergraduate | 301 | 15.6% |
| Graduate / Professional | 65 | 3.4% |
| Total | 1,927 | 100.0% |
School Enrollment by Age by Funding Source in Port Jervis
Out of a total of 1,927 students who are enrolled in schools in Port Jervis, 239 (12.4%) attend a private institution, while the remaining 1,688 (87.6%) are enrolled in public schools. The age group of 25 to 34 year olds has the highest likelihood of being enrolled in private schools, with 45 (67.2% in the age bracket) enrolled. Conversely, the age group of 18 to 19 year olds has the lowest likelihood of being enrolled in a private school, with 168 (100.0% in the age bracket) attending a public institution.
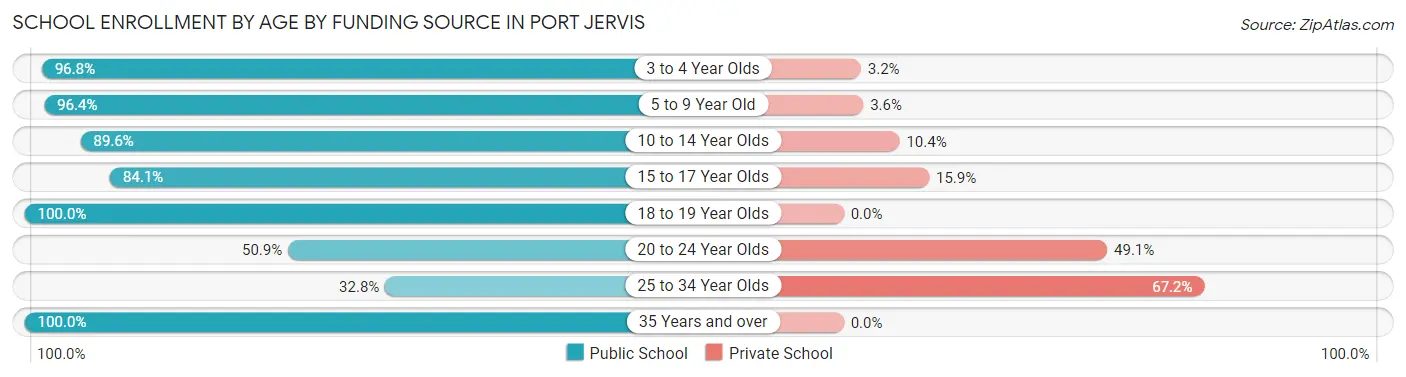
| Age Bracket | Public School | Private School |
| 3 to 4 Year Olds | 121 (96.8%) | 4 (3.2%) |
| 5 to 9 Year Old | 424 (96.4%) | 16 (3.6%) |
| 10 to 14 Year Olds | 448 (89.6%) | 52 (10.4%) |
| 15 to 17 Year Olds | 365 (84.1%) | 69 (15.9%) |
| 18 to 19 Year Olds | 168 (100.0%) | 0 (0.0%) |
| 20 to 24 Year Olds | 55 (50.9%) | 53 (49.1%) |
| 25 to 34 Year Olds | 22 (32.8%) | 45 (67.2%) |
| 35 Years and over | 85 (100.0%) | 0 (0.0%) |
| Total | 1,688 (87.6%) | 239 (12.4%) |
Educational Attainment by Field of Study in Port Jervis
Education (173 | 18.0%), engineering (111 | 11.5%), business (108 | 11.2%), visual & performing arts (103 | 10.7%), and science & technology (86 | 8.9%) are the most common fields of study among 962 individuals in Port Jervis who have obtained a bachelor's degree or higher.
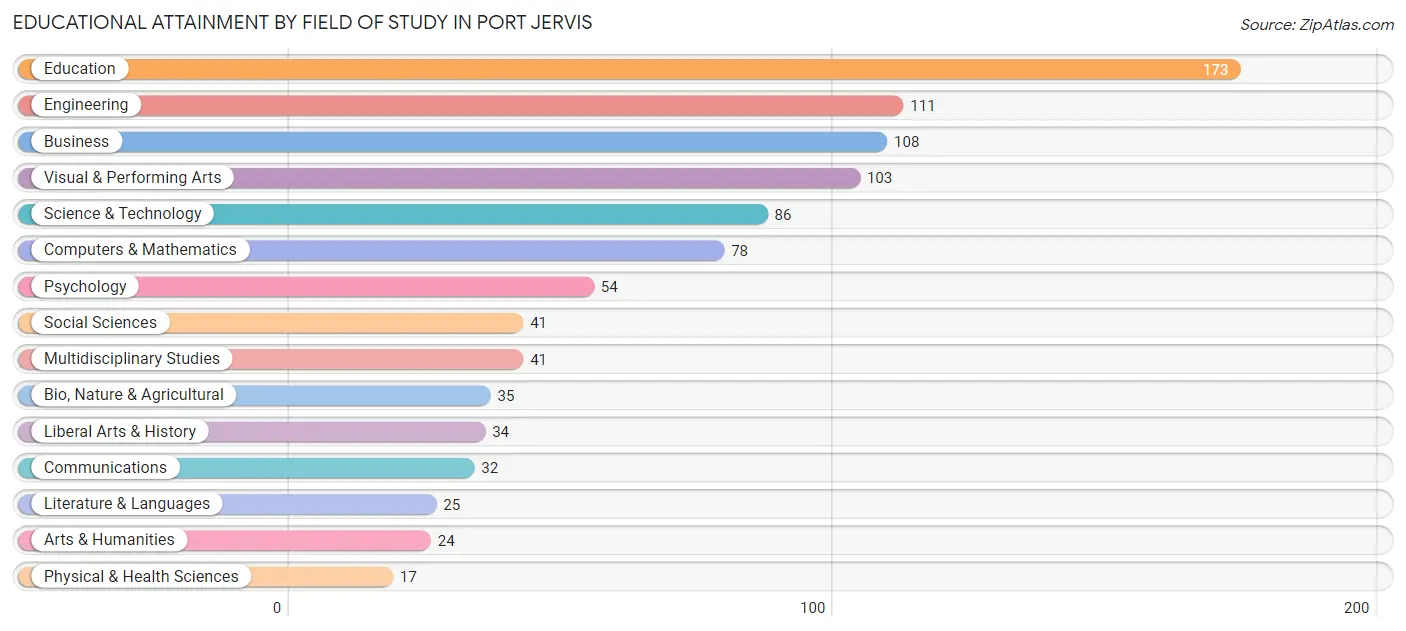
| Field of Study | # Graduates | % Graduates |
| Computers & Mathematics | 78 | 8.1% |
| Bio, Nature & Agricultural | 35 | 3.6% |
| Physical & Health Sciences | 17 | 1.8% |
| Psychology | 54 | 5.6% |
| Social Sciences | 41 | 4.3% |
| Engineering | 111 | 11.5% |
| Multidisciplinary Studies | 41 | 4.3% |
| Science & Technology | 86 | 8.9% |
| Business | 108 | 11.2% |
| Education | 173 | 18.0% |
| Literature & Languages | 25 | 2.6% |
| Liberal Arts & History | 34 | 3.5% |
| Visual & Performing Arts | 103 | 10.7% |
| Communications | 32 | 3.3% |
| Arts & Humanities | 24 | 2.5% |
| Total | 962 | 100.0% |
Transportation & Commute in Port Jervis
Vehicle Availability by Sex in Port Jervis
The most prevalent vehicle ownership categories in Port Jervis are males with 2 vehicles (789, accounting for 40.3%) and females with 2 vehicles (674, making up 49.3%).
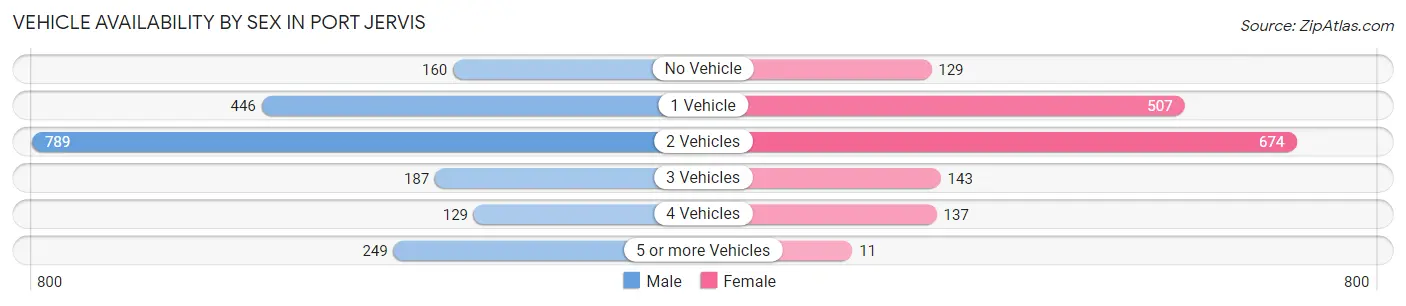
| Vehicles Available | Male | Female |
| No Vehicle | 160 (8.2%) | 129 (8.1%) |
| 1 Vehicle | 446 (22.8%) | 507 (31.7%) |
| 2 Vehicles | 789 (40.3%) | 674 (42.1%) |
| 3 Vehicles | 187 (9.5%) | 143 (8.9%) |
| 4 Vehicles | 129 (6.6%) | 137 (8.6%) |
| 5 or more Vehicles | 249 (12.7%) | 11 (0.7%) |
| Total | 1,960 (100.0%) | 1,601 (100.0%) |
Commute Time in Port Jervis
The most frequently occuring commute durations in Port Jervis are 5 to 9 minutes (758 commuters, 22.1%), less than 5 minutes (471 commuters, 13.7%), and 15 to 19 minutes (444 commuters, 12.9%).
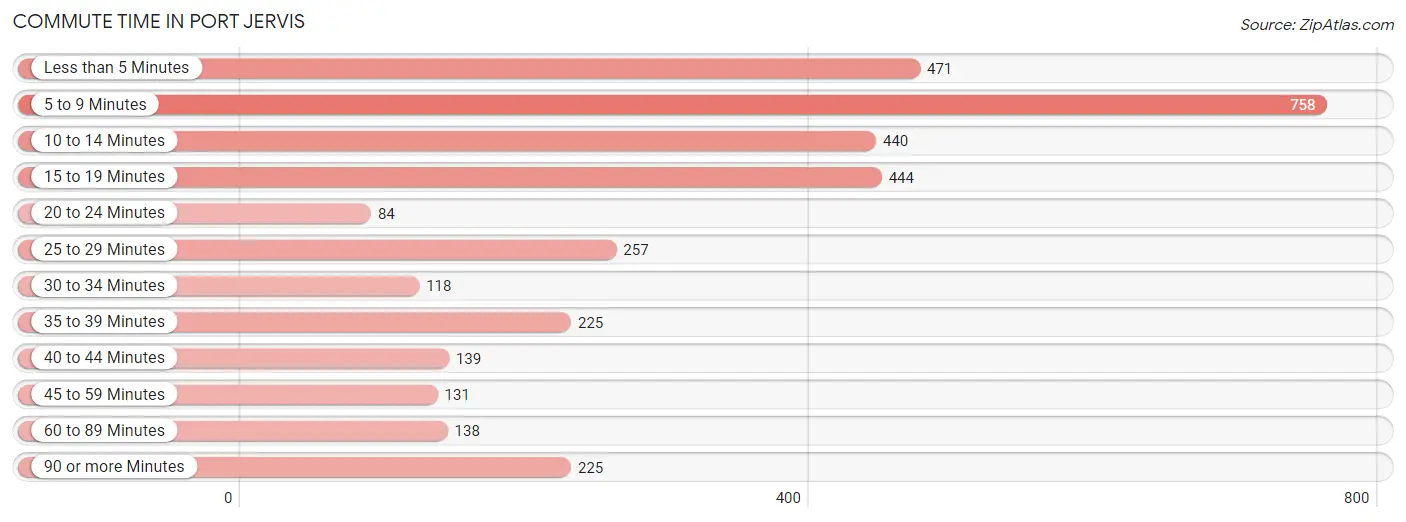
| Commute Time | # Commuters | % Commuters |
| Less than 5 Minutes | 471 | 13.7% |
| 5 to 9 Minutes | 758 | 22.1% |
| 10 to 14 Minutes | 440 | 12.8% |
| 15 to 19 Minutes | 444 | 12.9% |
| 20 to 24 Minutes | 84 | 2.5% |
| 25 to 29 Minutes | 257 | 7.5% |
| 30 to 34 Minutes | 118 | 3.4% |
| 35 to 39 Minutes | 225 | 6.6% |
| 40 to 44 Minutes | 139 | 4.1% |
| 45 to 59 Minutes | 131 | 3.8% |
| 60 to 89 Minutes | 138 | 4.0% |
| 90 or more Minutes | 225 | 6.6% |
Commute Time by Sex in Port Jervis
The most common commute times in Port Jervis are 5 to 9 minutes (356 commuters, 18.8%) for males and 5 to 9 minutes (402 commuters, 26.2%) for females.
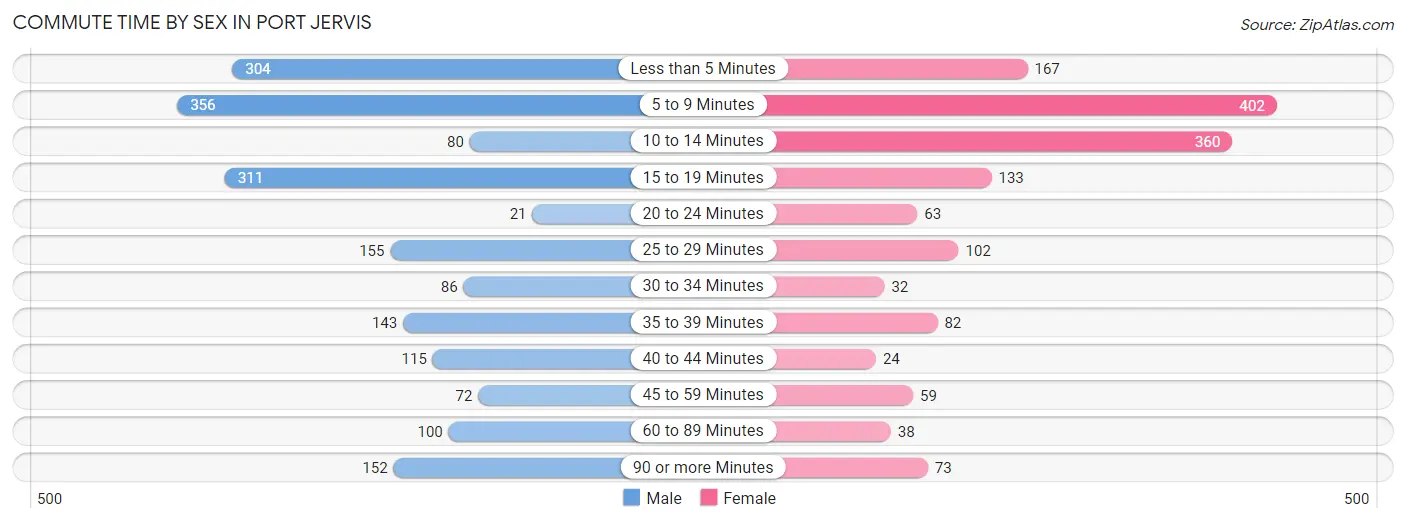
| Commute Time | Male | Female |
| Less than 5 Minutes | 304 (16.0%) | 167 (10.9%) |
| 5 to 9 Minutes | 356 (18.8%) | 402 (26.2%) |
| 10 to 14 Minutes | 80 (4.2%) | 360 (23.4%) |
| 15 to 19 Minutes | 311 (16.4%) | 133 (8.7%) |
| 20 to 24 Minutes | 21 (1.1%) | 63 (4.1%) |
| 25 to 29 Minutes | 155 (8.2%) | 102 (6.6%) |
| 30 to 34 Minutes | 86 (4.5%) | 32 (2.1%) |
| 35 to 39 Minutes | 143 (7.5%) | 82 (5.3%) |
| 40 to 44 Minutes | 115 (6.1%) | 24 (1.6%) |
| 45 to 59 Minutes | 72 (3.8%) | 59 (3.8%) |
| 60 to 89 Minutes | 100 (5.3%) | 38 (2.5%) |
| 90 or more Minutes | 152 (8.0%) | 73 (4.8%) |
Time of Departure to Work by Sex in Port Jervis
The most frequent times of departure to work in Port Jervis are 6:00 AM to 6:29 AM (447, 23.6%) for males and 12:00 PM to 3:59 PM (290, 18.9%) for females.
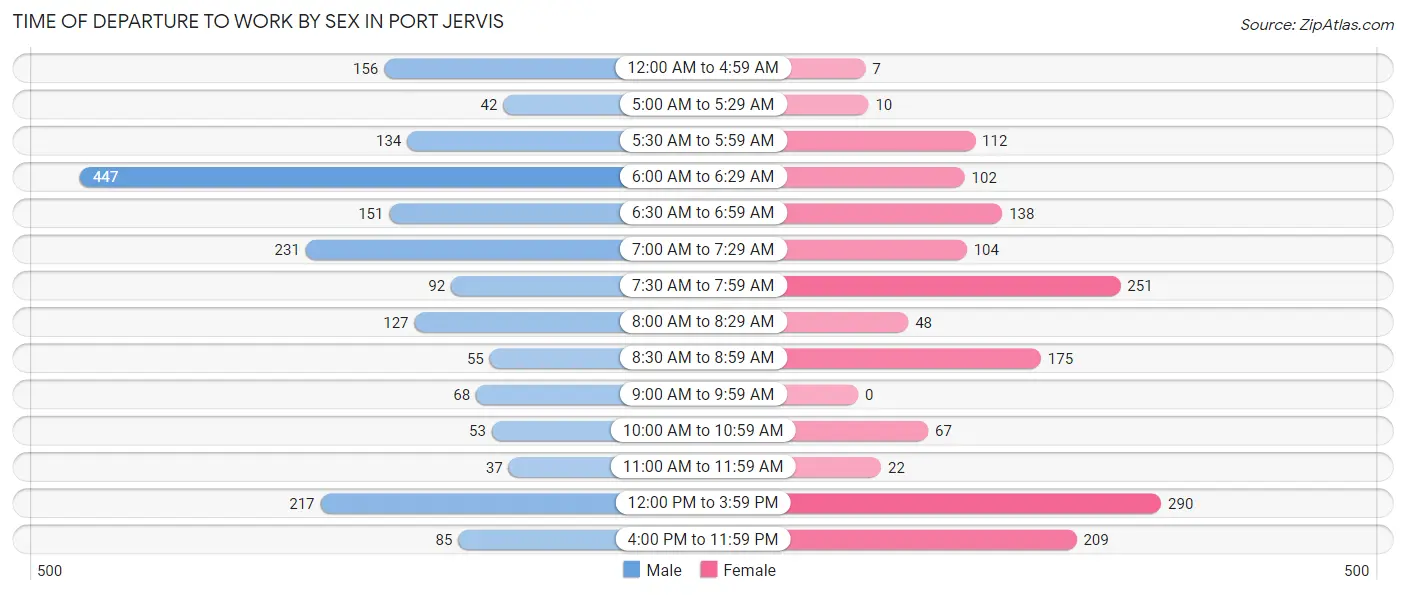
| Time of Departure | Male | Female |
| 12:00 AM to 4:59 AM | 156 (8.2%) | 7 (0.5%) |
| 5:00 AM to 5:29 AM | 42 (2.2%) | 10 (0.6%) |
| 5:30 AM to 5:59 AM | 134 (7.1%) | 112 (7.3%) |
| 6:00 AM to 6:29 AM | 447 (23.6%) | 102 (6.6%) |
| 6:30 AM to 6:59 AM | 151 (8.0%) | 138 (9.0%) |
| 7:00 AM to 7:29 AM | 231 (12.2%) | 104 (6.8%) |
| 7:30 AM to 7:59 AM | 92 (4.9%) | 251 (16.4%) |
| 8:00 AM to 8:29 AM | 127 (6.7%) | 48 (3.1%) |
| 8:30 AM to 8:59 AM | 55 (2.9%) | 175 (11.4%) |
| 9:00 AM to 9:59 AM | 68 (3.6%) | 0 (0.0%) |
| 10:00 AM to 10:59 AM | 53 (2.8%) | 67 (4.4%) |
| 11:00 AM to 11:59 AM | 37 (1.9%) | 22 (1.4%) |
| 12:00 PM to 3:59 PM | 217 (11.5%) | 290 (18.9%) |
| 4:00 PM to 11:59 PM | 85 (4.5%) | 209 (13.6%) |
| Total | 1,895 (100.0%) | 1,535 (100.0%) |
Housing Occupancy in Port Jervis
Occupancy by Ownership in Port Jervis
Of the total 3,515 dwellings in Port Jervis, owner-occupied units account for 1,747 (49.7%), while renter-occupied units make up 1,768 (50.3%).
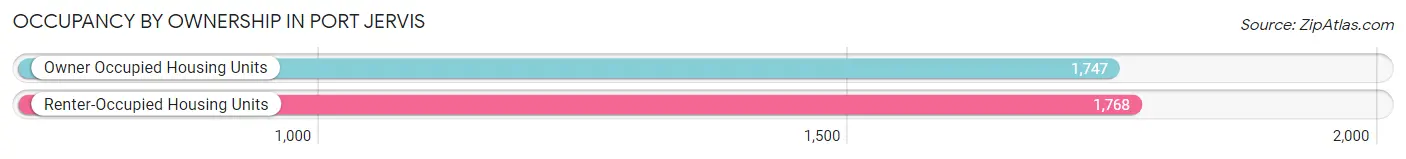
| Occupancy | # Housing Units | % Housing Units |
| Owner Occupied Housing Units | 1,747 | 49.7% |
| Renter-Occupied Housing Units | 1,768 | 50.3% |
| Total Occupied Housing Units | 3,515 | 100.0% |
Occupancy by Household Size in Port Jervis
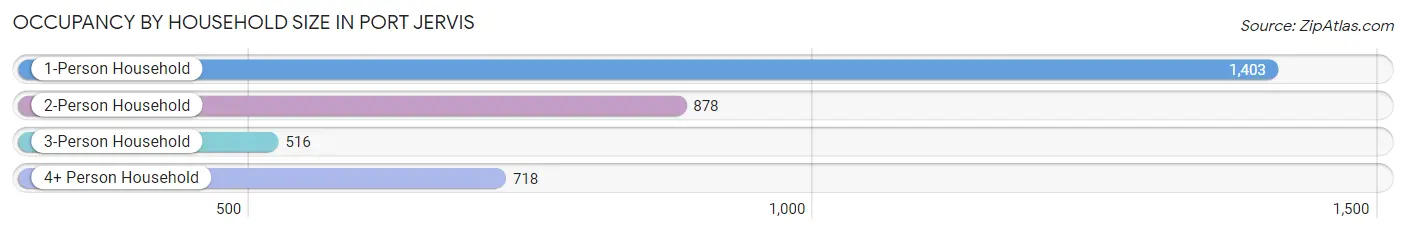
| Household Size | # Housing Units | % Housing Units |
| 1-Person Household | 1,403 | 39.9% |
| 2-Person Household | 878 | 25.0% |
| 3-Person Household | 516 | 14.7% |
| 4+ Person Household | 718 | 20.4% |
| Total Housing Units | 3,515 | 100.0% |
Occupancy by Ownership by Household Size in Port Jervis
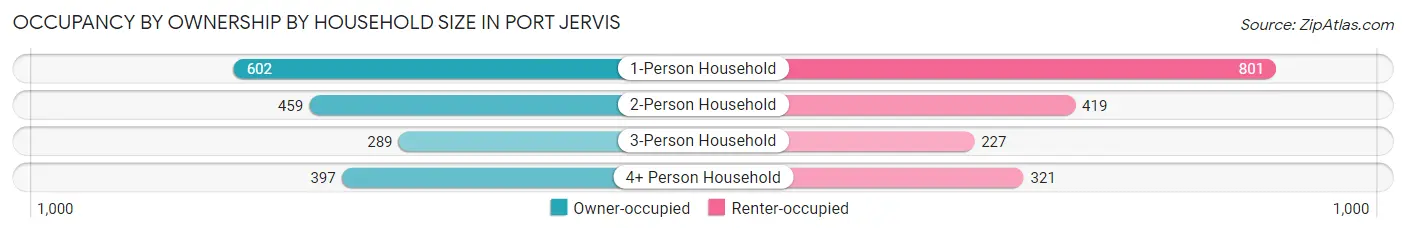
| Household Size | Owner-occupied | Renter-occupied |
| 1-Person Household | 602 (42.9%) | 801 (57.1%) |
| 2-Person Household | 459 (52.3%) | 419 (47.7%) |
| 3-Person Household | 289 (56.0%) | 227 (44.0%) |
| 4+ Person Household | 397 (55.3%) | 321 (44.7%) |
| Total Housing Units | 1,747 (49.7%) | 1,768 (50.3%) |
Occupancy by Educational Attainment in Port Jervis
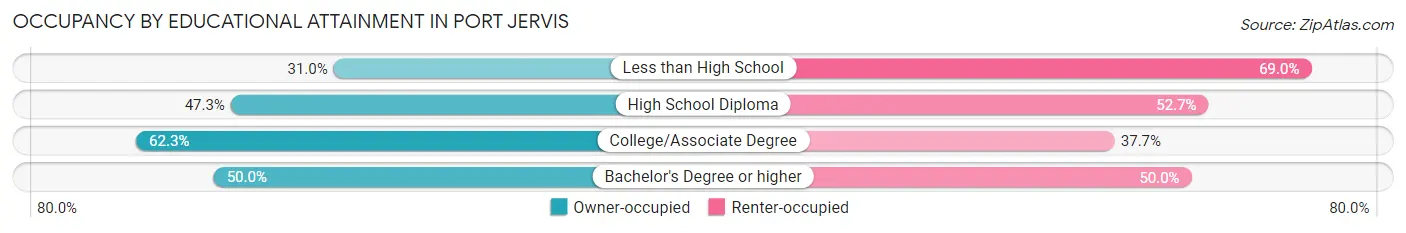
| Household Size | Owner-occupied | Renter-occupied |
| Less than High School | 102 (31.0%) | 227 (69.0%) |
| High School Diploma | 836 (47.3%) | 931 (52.7%) |
| College/Associate Degree | 504 (62.3%) | 305 (37.7%) |
| Bachelor's Degree or higher | 305 (50.0%) | 305 (50.0%) |
Occupancy by Age of Householder in Port Jervis
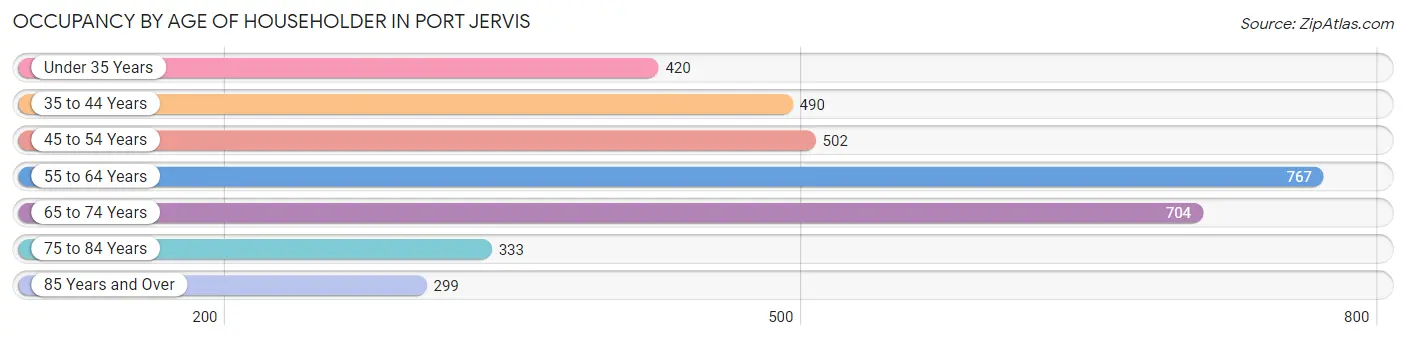
| Age Bracket | # Households | % Households |
| Under 35 Years | 420 | 11.9% |
| 35 to 44 Years | 490 | 13.9% |
| 45 to 54 Years | 502 | 14.3% |
| 55 to 64 Years | 767 | 21.8% |
| 65 to 74 Years | 704 | 20.0% |
| 75 to 84 Years | 333 | 9.5% |
| 85 Years and Over | 299 | 8.5% |
| Total | 3,515 | 100.0% |
Housing Finances in Port Jervis
Median Income by Occupancy in Port Jervis
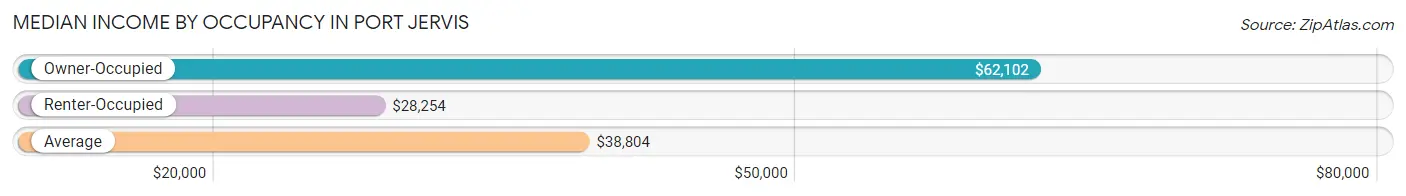
| Occupancy Type | # Households | Median Income |
| Owner-Occupied | 1,747 (49.7%) | $62,102 |
| Renter-Occupied | 1,768 (50.3%) | $28,254 |
| Average | 3,515 (100.0%) | $38,804 |
Occupancy by Householder Income Bracket in Port Jervis
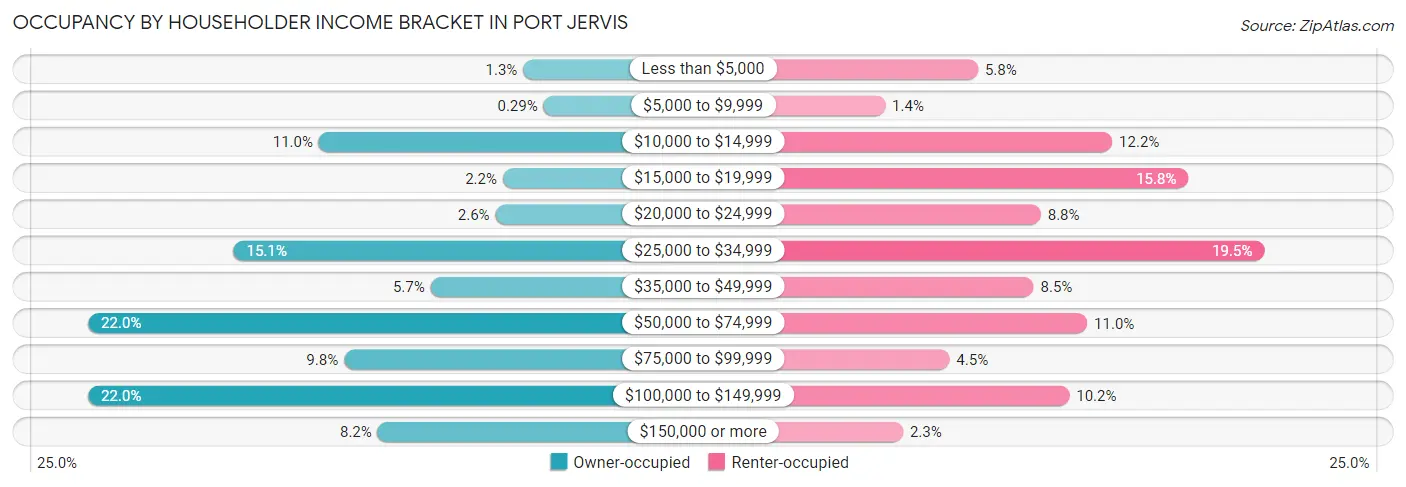
| Income Bracket | Owner-occupied | Renter-occupied |
| Less than $5,000 | 22 (1.3%) | 103 (5.8%) |
| $5,000 to $9,999 | 5 (0.3%) | 25 (1.4%) |
| $10,000 to $14,999 | 192 (11.0%) | 216 (12.2%) |
| $15,000 to $19,999 | 39 (2.2%) | 280 (15.8%) |
| $20,000 to $24,999 | 45 (2.6%) | 156 (8.8%) |
| $25,000 to $34,999 | 263 (15.0%) | 344 (19.5%) |
| $35,000 to $49,999 | 99 (5.7%) | 150 (8.5%) |
| $50,000 to $74,999 | 384 (22.0%) | 195 (11.0%) |
| $75,000 to $99,999 | 171 (9.8%) | 79 (4.5%) |
| $100,000 to $149,999 | 384 (22.0%) | 180 (10.2%) |
| $150,000 or more | 143 (8.2%) | 40 (2.3%) |
| Total | 1,747 (100.0%) | 1,768 (100.0%) |
Monthly Housing Cost Tiers in Port Jervis
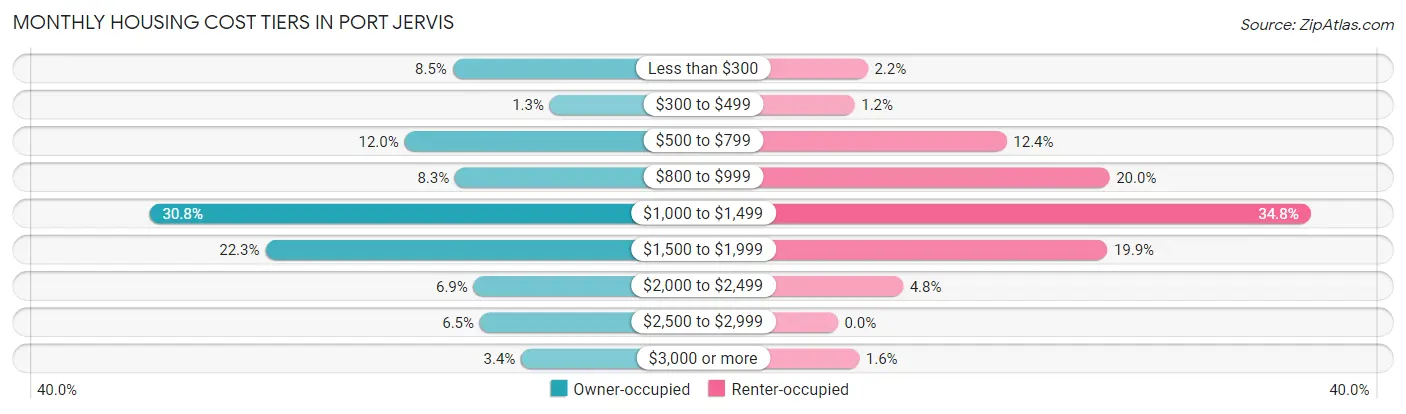
| Monthly Cost | Owner-occupied | Renter-occupied |
| Less than $300 | 148 (8.5%) | 39 (2.2%) |
| $300 to $499 | 23 (1.3%) | 22 (1.2%) |
| $500 to $799 | 210 (12.0%) | 220 (12.4%) |
| $800 to $999 | 145 (8.3%) | 354 (20.0%) |
| $1,000 to $1,499 | 538 (30.8%) | 616 (34.8%) |
| $1,500 to $1,999 | 389 (22.3%) | 351 (19.9%) |
| $2,000 to $2,499 | 121 (6.9%) | 85 (4.8%) |
| $2,500 to $2,999 | 113 (6.5%) | 0 (0.0%) |
| $3,000 or more | 60 (3.4%) | 28 (1.6%) |
| Total | 1,747 (100.0%) | 1,768 (100.0%) |
Physical Housing Characteristics in Port Jervis
Housing Structures in Port Jervis
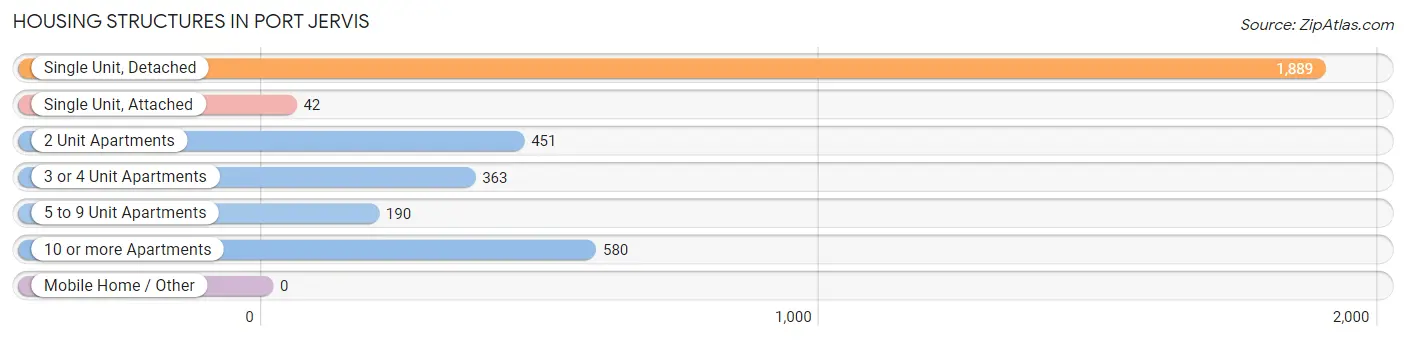
| Structure Type | # Housing Units | % Housing Units |
| Single Unit, Detached | 1,889 | 53.7% |
| Single Unit, Attached | 42 | 1.2% |
| 2 Unit Apartments | 451 | 12.8% |
| 3 or 4 Unit Apartments | 363 | 10.3% |
| 5 to 9 Unit Apartments | 190 | 5.4% |
| 10 or more Apartments | 580 | 16.5% |
| Mobile Home / Other | 0 | 0.0% |
| Total | 3,515 | 100.0% |
Housing Structures by Occupancy in Port Jervis
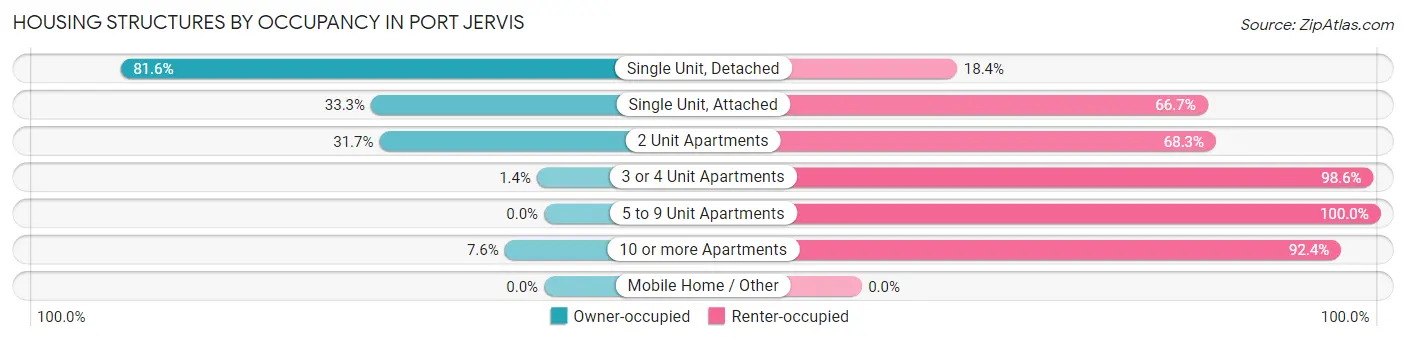
| Structure Type | Owner-occupied | Renter-occupied |
| Single Unit, Detached | 1,541 (81.6%) | 348 (18.4%) |
| Single Unit, Attached | 14 (33.3%) | 28 (66.7%) |
| 2 Unit Apartments | 143 (31.7%) | 308 (68.3%) |
| 3 or 4 Unit Apartments | 5 (1.4%) | 358 (98.6%) |
| 5 to 9 Unit Apartments | 0 (0.0%) | 190 (100.0%) |
| 10 or more Apartments | 44 (7.6%) | 536 (92.4%) |
| Mobile Home / Other | 0 (0.0%) | 0 (0.0%) |
| Total | 1,747 (49.7%) | 1,768 (50.3%) |
Housing Structures by Number of Rooms in Port Jervis
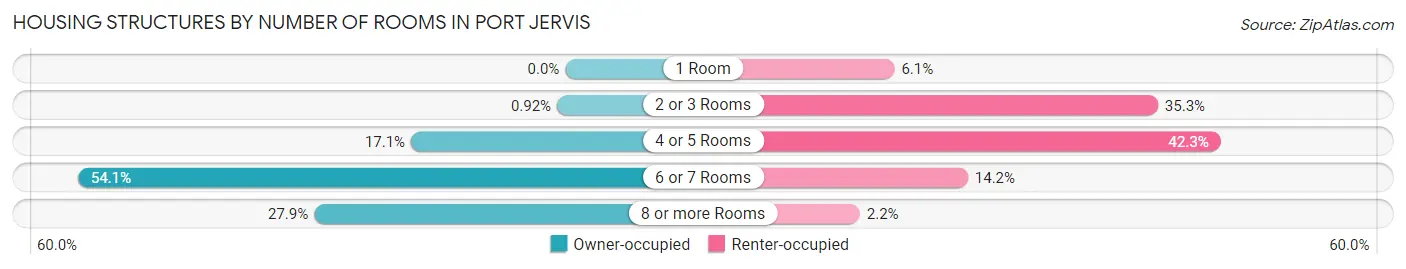
| Number of Rooms | Owner-occupied | Renter-occupied |
| 1 Room | 0 (0.0%) | 107 (6.0%) |
| 2 or 3 Rooms | 16 (0.9%) | 624 (35.3%) |
| 4 or 5 Rooms | 299 (17.1%) | 747 (42.2%) |
| 6 or 7 Rooms | 945 (54.1%) | 251 (14.2%) |
| 8 or more Rooms | 487 (27.9%) | 39 (2.2%) |
| Total | 1,747 (100.0%) | 1,768 (100.0%) |
Housing Structure by Heating Type in Port Jervis
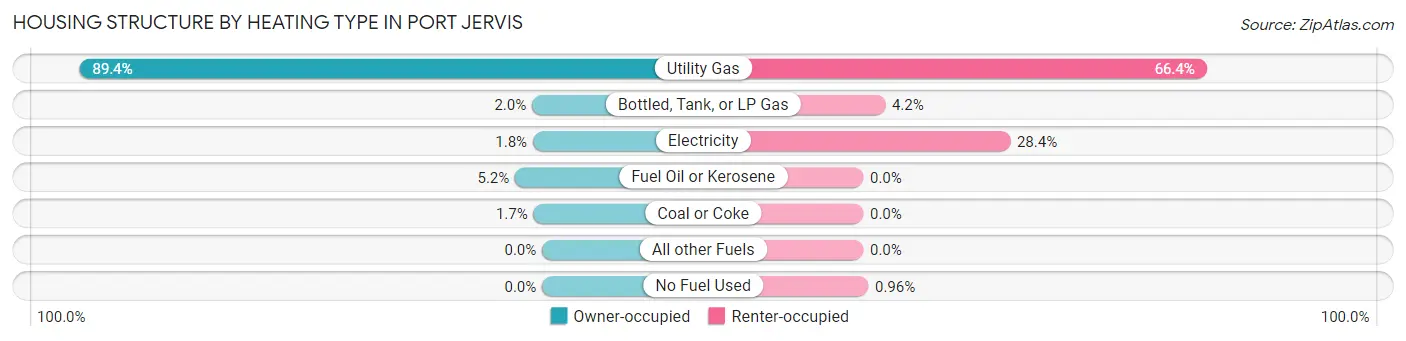
| Heating Type | Owner-occupied | Renter-occupied |
| Utility Gas | 1,562 (89.4%) | 1,174 (66.4%) |
| Bottled, Tank, or LP Gas | 34 (1.9%) | 75 (4.2%) |
| Electricity | 31 (1.8%) | 502 (28.4%) |
| Fuel Oil or Kerosene | 91 (5.2%) | 0 (0.0%) |
| Coal or Coke | 29 (1.7%) | 0 (0.0%) |
| All other Fuels | 0 (0.0%) | 0 (0.0%) |
| No Fuel Used | 0 (0.0%) | 17 (1.0%) |
| Total | 1,747 (100.0%) | 1,768 (100.0%) |
Household Vehicle Usage in Port Jervis
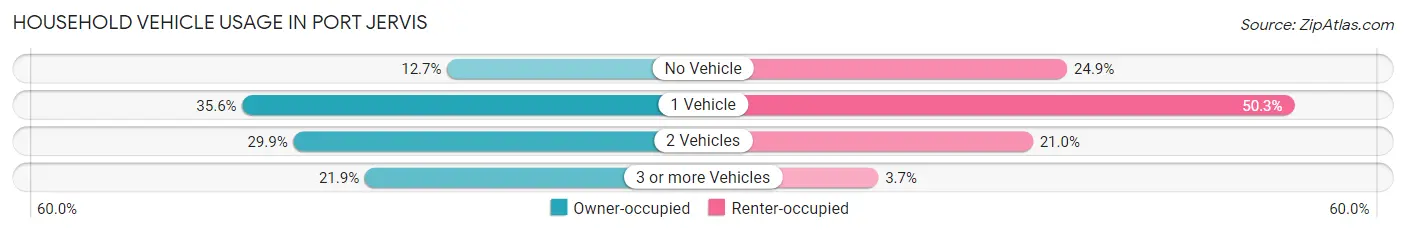
| Vehicles per Household | Owner-occupied | Renter-occupied |
| No Vehicle | 221 (12.7%) | 440 (24.9%) |
| 1 Vehicle | 622 (35.6%) | 890 (50.3%) |
| 2 Vehicles | 522 (29.9%) | 372 (21.0%) |
| 3 or more Vehicles | 382 (21.9%) | 66 (3.7%) |
| Total | 1,747 (100.0%) | 1,768 (100.0%) |
Real Estate & Mortgages in Port Jervis
Real Estate and Mortgage Overview in Port Jervis
| Characteristic | Without Mortgage | With Mortgage |
| Housing Units | 856 | 891 |
| Median Property Value | $187,300 | $189,700 |
| Median Household Income | $34,750 | $123 |
| Monthly Housing Costs | $921 | $60 |
| Real Estate Taxes | $4,576 | $69 |
Property Value by Mortgage Status in Port Jervis
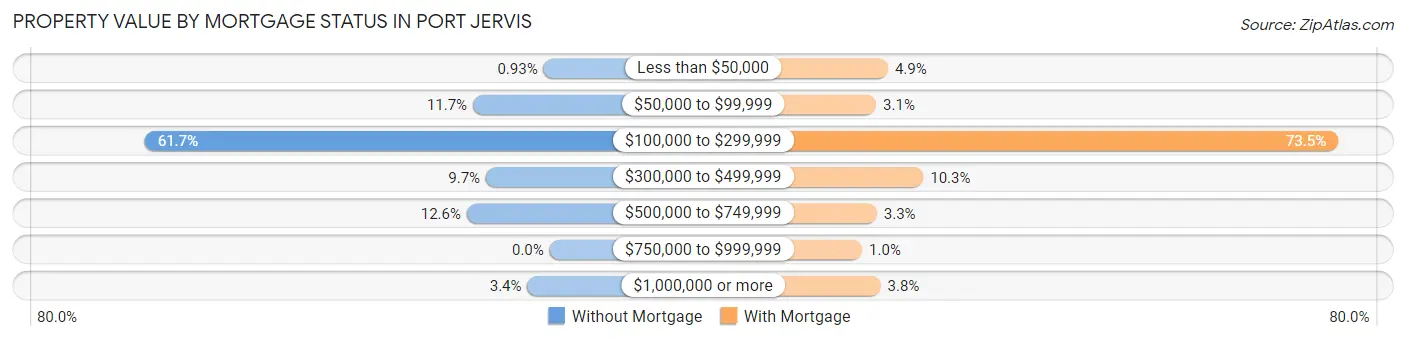
| Property Value | Without Mortgage | With Mortgage |
| Less than $50,000 | 8 (0.9%) | 44 (4.9%) |
| $50,000 to $99,999 | 100 (11.7%) | 28 (3.1%) |
| $100,000 to $299,999 | 528 (61.7%) | 655 (73.5%) |
| $300,000 to $499,999 | 83 (9.7%) | 92 (10.3%) |
| $500,000 to $749,999 | 108 (12.6%) | 29 (3.3%) |
| $750,000 to $999,999 | 0 (0.0%) | 9 (1.0%) |
| $1,000,000 or more | 29 (3.4%) | 34 (3.8%) |
| Total | 856 (100.0%) | 891 (100.0%) |
Household Income by Mortgage Status in Port Jervis
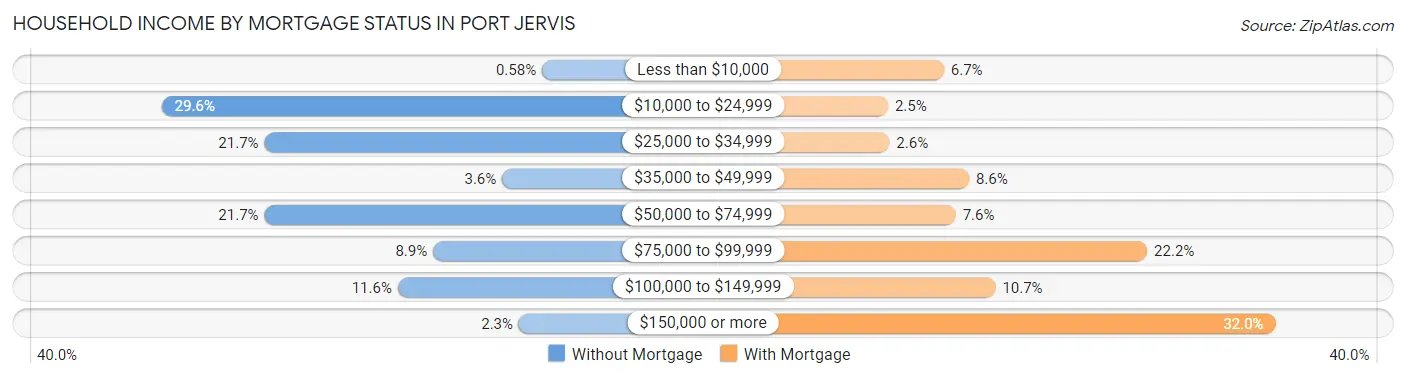
| Household Income | Without Mortgage | With Mortgage |
| Less than $10,000 | 5 (0.6%) | 60 (6.7%) |
| $10,000 to $24,999 | 253 (29.6%) | 22 (2.5%) |
| $25,000 to $34,999 | 186 (21.7%) | 23 (2.6%) |
| $35,000 to $49,999 | 31 (3.6%) | 77 (8.6%) |
| $50,000 to $74,999 | 186 (21.7%) | 68 (7.6%) |
| $75,000 to $99,999 | 76 (8.9%) | 198 (22.2%) |
| $100,000 to $149,999 | 99 (11.6%) | 95 (10.7%) |
| $150,000 or more | 20 (2.3%) | 285 (32.0%) |
| Total | 856 (100.0%) | 891 (100.0%) |
Property Value to Household Income Ratio in Port Jervis
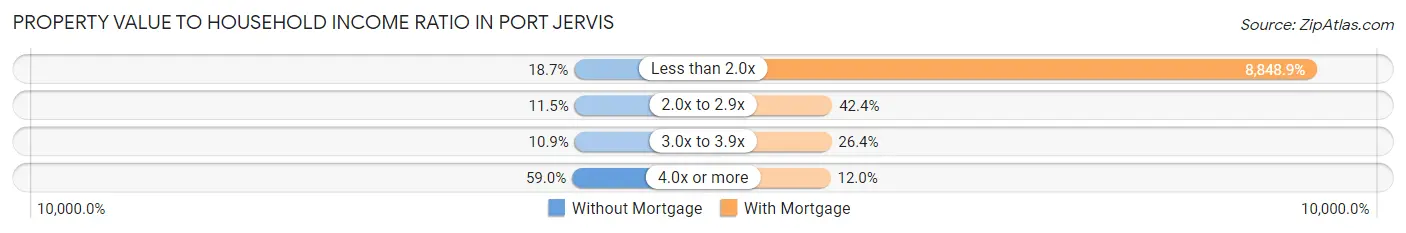
| Value-to-Income Ratio | Without Mortgage | With Mortgage |
| Less than 2.0x | 160 (18.7%) | 78,844 (8,848.9%) |
| 2.0x to 2.9x | 98 (11.5%) | 378 (42.4%) |
| 3.0x to 3.9x | 93 (10.9%) | 235 (26.4%) |
| 4.0x or more | 505 (59.0%) | 107 (12.0%) |
| Total | 856 (100.0%) | 891 (100.0%) |
Real Estate Taxes by Mortgage Status in Port Jervis
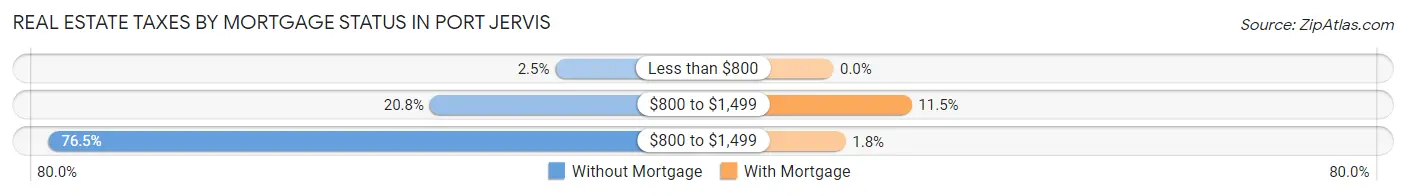
| Property Taxes | Without Mortgage | With Mortgage |
| Less than $800 | 21 (2.5%) | 0 (0.0%) |
| $800 to $1,499 | 178 (20.8%) | 102 (11.5%) |
| $800 to $1,499 | 655 (76.5%) | 16 (1.8%) |
| Total | 856 (100.0%) | 891 (100.0%) |
Health & Disability in Port Jervis
Health Insurance Coverage by Age in Port Jervis
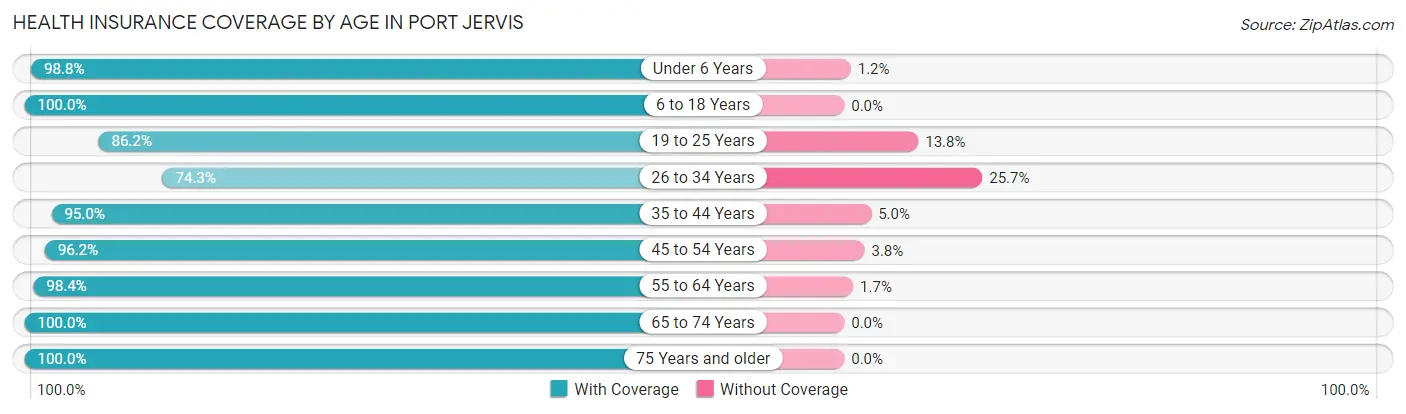
| Age Bracket | With Coverage | Without Coverage |
| Under 6 Years | 572 (98.8%) | 7 (1.2%) |
| 6 to 18 Years | 1,476 (100.0%) | 0 (0.0%) |
| 19 to 25 Years | 762 (86.2%) | 122 (13.8%) |
| 26 to 34 Years | 574 (74.3%) | 199 (25.7%) |
| 35 to 44 Years | 1,116 (95.0%) | 59 (5.0%) |
| 45 to 54 Years | 867 (96.2%) | 34 (3.8%) |
| 55 to 64 Years | 1,249 (98.4%) | 21 (1.7%) |
| 65 to 74 Years | 889 (100.0%) | 0 (0.0%) |
| 75 Years and older | 725 (100.0%) | 0 (0.0%) |
| Total | 8,230 (94.9%) | 442 (5.1%) |
Health Insurance Coverage by Citizenship Status in Port Jervis
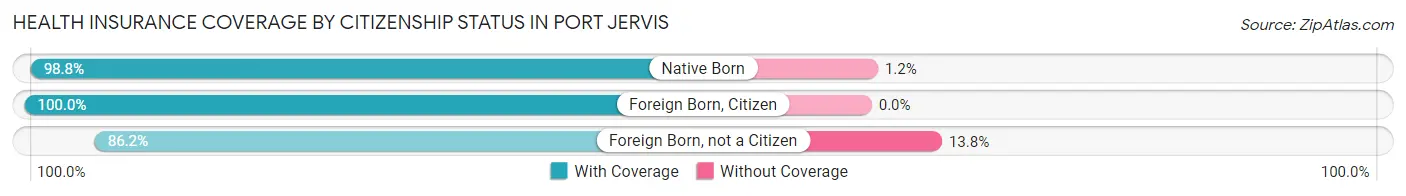
| Citizenship Status | With Coverage | Without Coverage |
| Native Born | 572 (98.8%) | 7 (1.2%) |
| Foreign Born, Citizen | 1,476 (100.0%) | 0 (0.0%) |
| Foreign Born, not a Citizen | 762 (86.2%) | 122 (13.8%) |
Health Insurance Coverage by Household Income in Port Jervis
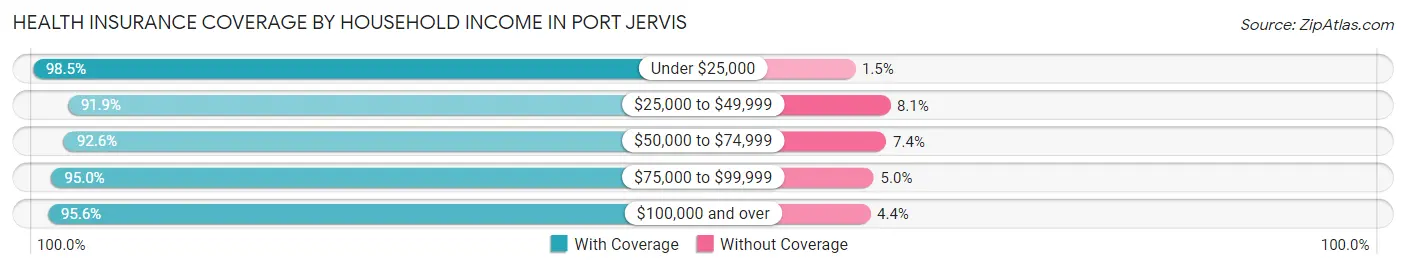
| Household Income | With Coverage | Without Coverage |
| Under $25,000 | 1,740 (98.5%) | 27 (1.5%) |
| $25,000 to $49,999 | 1,514 (91.9%) | 133 (8.1%) |
| $50,000 to $74,999 | 1,458 (92.6%) | 116 (7.4%) |
| $75,000 to $99,999 | 736 (95.0%) | 39 (5.0%) |
| $100,000 and over | 2,756 (95.6%) | 126 (4.4%) |
Public vs Private Health Insurance Coverage by Age in Port Jervis
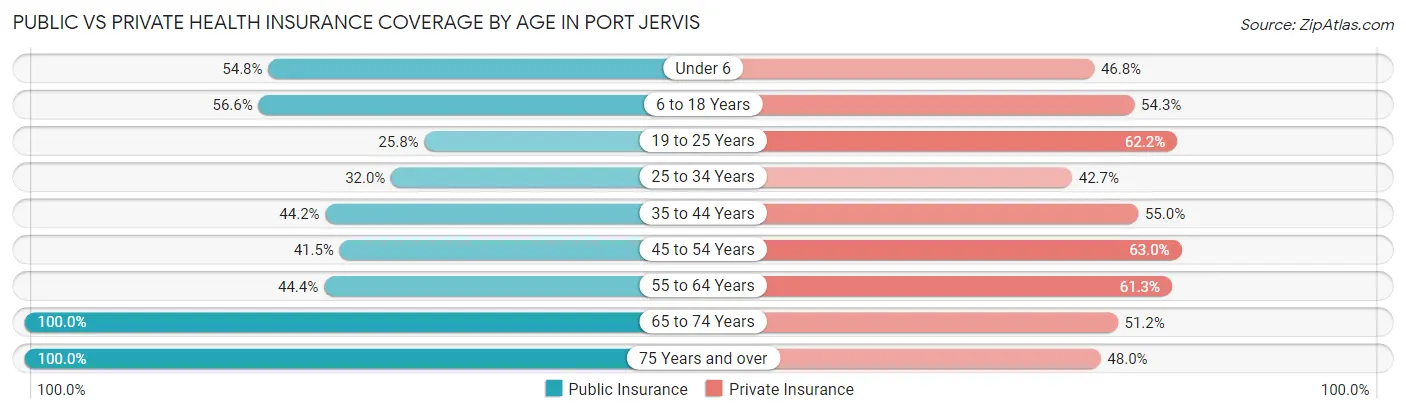
| Age Bracket | Public Insurance | Private Insurance |
| Under 6 | 317 (54.7%) | 271 (46.8%) |
| 6 to 18 Years | 835 (56.6%) | 801 (54.3%) |
| 19 to 25 Years | 228 (25.8%) | 550 (62.2%) |
| 25 to 34 Years | 247 (32.0%) | 330 (42.7%) |
| 35 to 44 Years | 519 (44.2%) | 646 (55.0%) |
| 45 to 54 Years | 374 (41.5%) | 568 (63.0%) |
| 55 to 64 Years | 564 (44.4%) | 778 (61.3%) |
| 65 to 74 Years | 889 (100.0%) | 455 (51.2%) |
| 75 Years and over | 725 (100.0%) | 348 (48.0%) |
| Total | 4,698 (54.2%) | 4,747 (54.7%) |
Disability Status by Sex by Age in Port Jervis
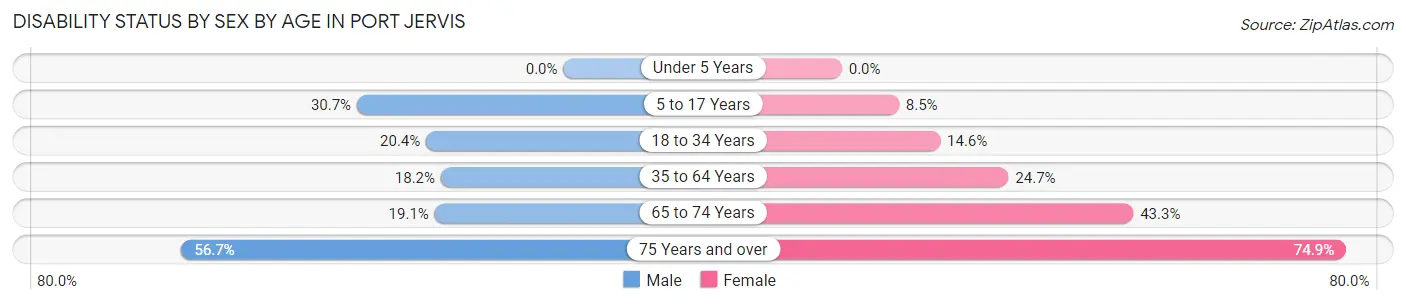
| Age Bracket | Male | Female |
| Under 5 Years | 0 (0.0%) | 0 (0.0%) |
| 5 to 17 Years | 213 (30.6%) | 58 (8.5%) |
| 18 to 34 Years | 195 (20.4%) | 133 (14.6%) |
| 35 to 64 Years | 313 (18.2%) | 402 (24.7%) |
| 65 to 74 Years | 86 (19.1%) | 190 (43.3%) |
| 75 Years and over | 93 (56.7%) | 420 (74.9%) |
Disability Class by Sex by Age in Port Jervis
Disability Class: Hearing Difficulty
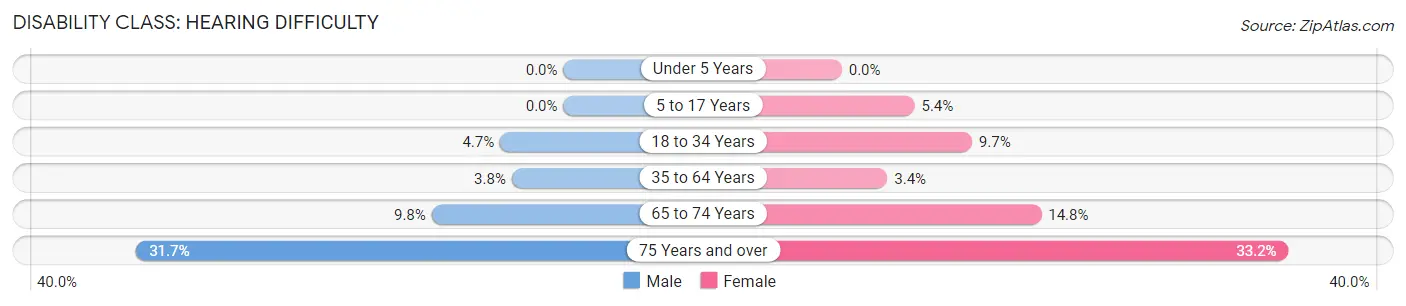
| Age Bracket | Male | Female |
| Under 5 Years | 0 (0.0%) | 0 (0.0%) |
| 5 to 17 Years | 0 (0.0%) | 37 (5.4%) |
| 18 to 34 Years | 45 (4.7%) | 88 (9.7%) |
| 35 to 64 Years | 66 (3.8%) | 55 (3.4%) |
| 65 to 74 Years | 44 (9.8%) | 65 (14.8%) |
| 75 Years and over | 52 (31.7%) | 186 (33.2%) |
Disability Class: Vision Difficulty
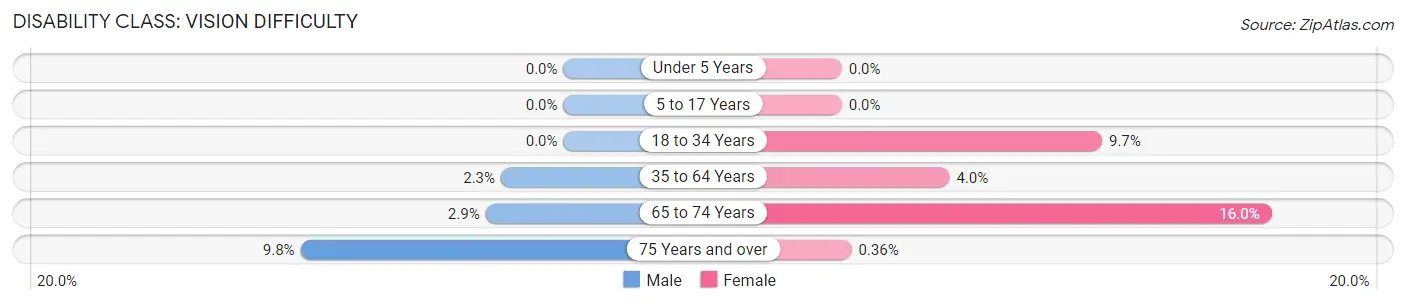
| Age Bracket | Male | Female |
| Under 5 Years | 0 (0.0%) | 0 (0.0%) |
| 5 to 17 Years | 0 (0.0%) | 0 (0.0%) |
| 18 to 34 Years | 0 (0.0%) | 88 (9.7%) |
| 35 to 64 Years | 40 (2.3%) | 65 (4.0%) |
| 65 to 74 Years | 13 (2.9%) | 70 (16.0%) |
| 75 Years and over | 16 (9.8%) | 2 (0.4%) |
Disability Class: Cognitive Difficulty
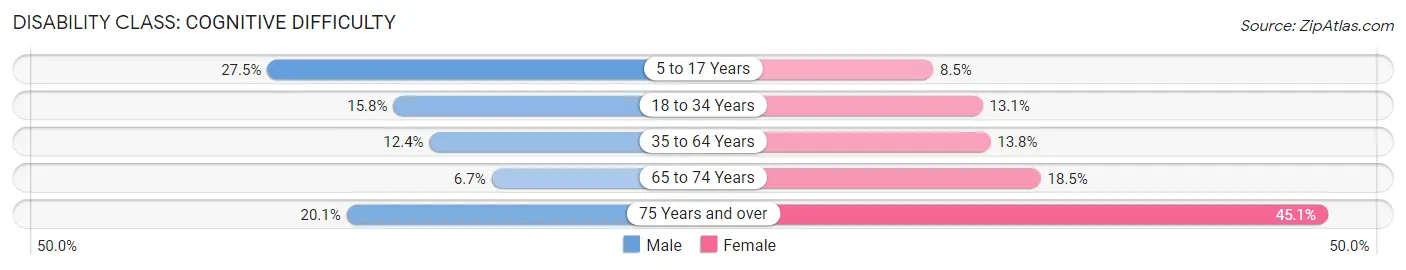
| Age Bracket | Male | Female |
| 5 to 17 Years | 191 (27.5%) | 58 (8.5%) |
| 18 to 34 Years | 151 (15.8%) | 119 (13.1%) |
| 35 to 64 Years | 214 (12.4%) | 224 (13.8%) |
| 65 to 74 Years | 30 (6.7%) | 81 (18.4%) |
| 75 Years and over | 33 (20.1%) | 253 (45.1%) |
Disability Class: Ambulatory Difficulty
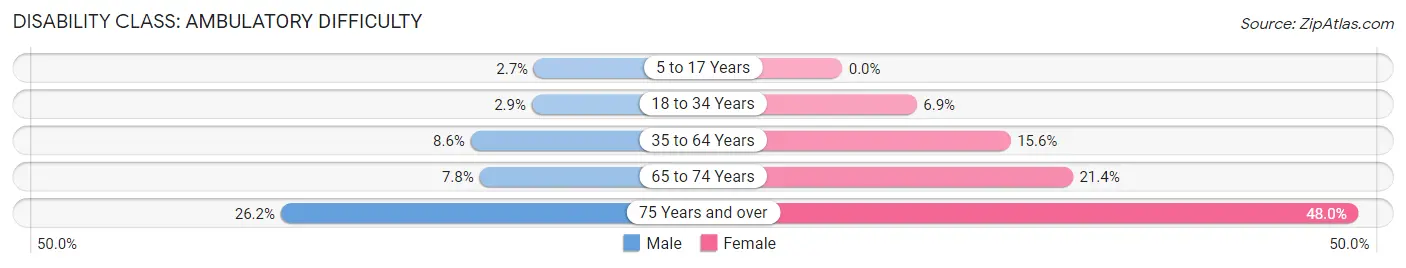
| Age Bracket | Male | Female |
| 5 to 17 Years | 19 (2.7%) | 0 (0.0%) |
| 18 to 34 Years | 28 (2.9%) | 63 (6.9%) |
| 35 to 64 Years | 148 (8.6%) | 254 (15.6%) |
| 65 to 74 Years | 35 (7.8%) | 94 (21.4%) |
| 75 Years and over | 43 (26.2%) | 269 (47.9%) |
Disability Class: Self-Care Difficulty
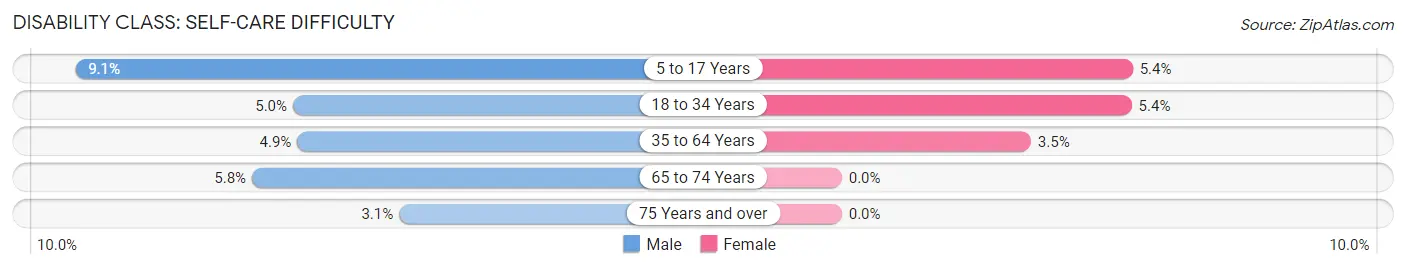
| Age Bracket | Male | Female |
| 5 to 17 Years | 63 (9.1%) | 37 (5.4%) |
| 18 to 34 Years | 48 (5.0%) | 49 (5.4%) |
| 35 to 64 Years | 85 (4.9%) | 57 (3.5%) |
| 65 to 74 Years | 26 (5.8%) | 0 (0.0%) |
| 75 Years and over | 5 (3.0%) | 0 (0.0%) |
Technology Access in Port Jervis
Computing Device Access in Port Jervis
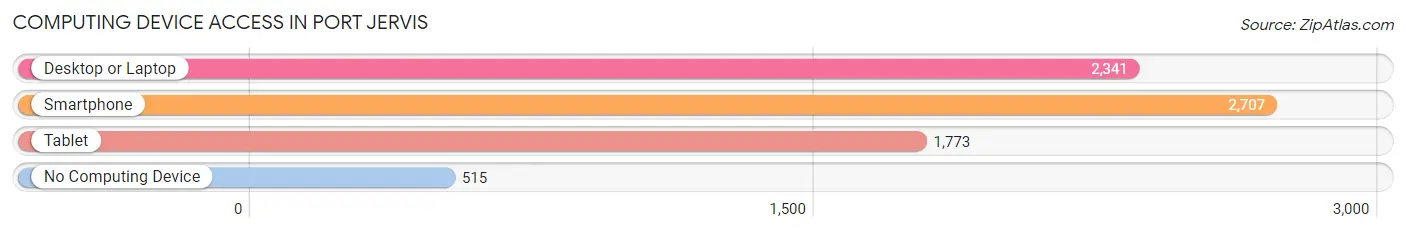
| Device Type | # Households | % Households |
| Desktop or Laptop | 2,341 | 66.6% |
| Smartphone | 2,707 | 77.0% |
| Tablet | 1,773 | 50.4% |
| No Computing Device | 515 | 14.6% |
| Total | 3,515 | 100.0% |
Internet Access in Port Jervis
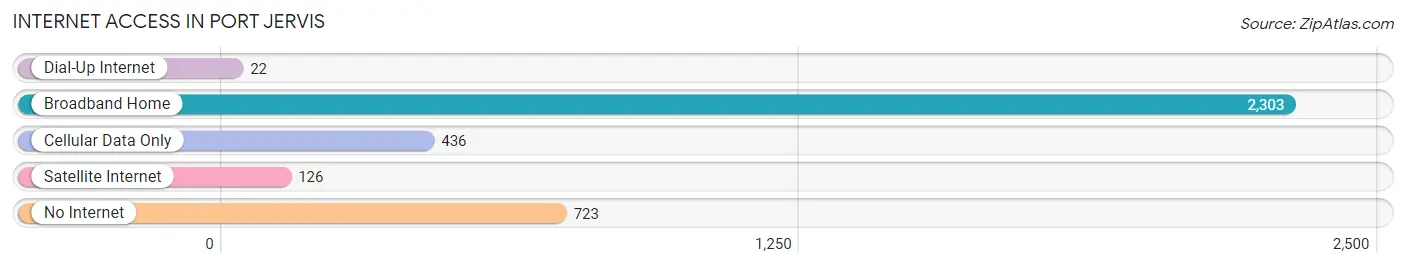
| Internet Type | # Households | % Households |
| Dial-Up Internet | 22 | 0.6% |
| Broadband Home | 2,303 | 65.5% |
| Cellular Data Only | 436 | 12.4% |
| Satellite Internet | 126 | 3.6% |
| No Internet | 723 | 20.6% |
| Total | 3,515 | 100.0% |
Port Jervis Summary
Port Jervis is a city located in Orange County, New York, United States. It is situated at the confluence of the Neversink and Delaware rivers, and is part of the Poughkeepsie–Newburgh–Middletown metropolitan area. As of the 2010 census, the city had a population of 8,828.
History
Port Jervis was originally settled in the early 1700s by Dutch and English settlers. The city was named after John de la Montagne, a Dutch settler who arrived in the area in 1709. The city was incorporated in 1853 and was originally known as Decker's Ferry.
In the late 1800s, the city became a major transportation hub, with the Delaware and Hudson Canal and the Erie Railroad connecting the city to the rest of the country. The city was also a major stop on the Underground Railroad, with many escaped slaves passing through the city on their way to freedom.
In the early 1900s, the city experienced a period of growth and prosperity, with many new businesses and industries opening in the area. The city was also home to a large number of immigrants, including Italians, Poles, and Irish.
Geography
Port Jervis is located at 41°20'N 74°41'W (41.33, -74.68). According to the United States Census Bureau, the city has a total area of 4.2 square miles (10.8 km2), of which 4.1 square miles (10.6 km2) is land and 0.1 square miles (0.2 km2) is water.
The city is located at the confluence of the Neversink and Delaware rivers, and is part of the Poughkeepsie–Newburgh–Middletown metropolitan area. The city is bordered by the towns of Deerpark, Matamoras, and Greenville.
Economy
Port Jervis is a small city with a diverse economy. The city is home to a number of manufacturing and industrial businesses, including a paper mill, a printing company, and a plastics factory. The city is also home to a number of retail businesses, including a grocery store, a hardware store, and a number of restaurants.
The city is also home to a number of medical facilities, including a hospital, a nursing home, and a number of medical offices. The city is also home to a number of educational institutions, including a community college and a number of public and private schools.
Demographics
As of the 2010 census, there were 8,828 people, 3,717 households, and 2,323 families residing in the city. The population density was 2,139.3 people per square mile (824.2/km2). There were 3,945 housing units at an average density of 962.2 per square mile (371.2/km2). The racial makeup of the city was 87.2% White, 5.3% African American, 0.3% Native American, 1.2% Asian, 0.1% Pacific Islander, 4.2% from other races, and 1.8% from two or more races. Hispanic or Latino of any race were 11.3% of the population.
There were 3,717 households, out of which 28.2% had children under the age of 18 living with them, 43.2% were married couples living together, 14.2% had a female householder with no husband present, and 37.2% were non-families. 32.2% of all households were made up of individuals, and 14.2% had someone living alone who was 65 years of age or older. The average household size was 2.37 and the average family size was 2.97.
In the city, the population was spread out, with 23.2% under the age of 18, 8.2% from 18 to 24, 27.2% from 25 to 44, 24.2% from 45 to 64, and 17.2% who were 65 years of age or older. The median age was 38 years. For every 100 females, there were 91.2 males. For every 100 females age 18 and over, there were 87.2 males.
The median income for a household in the city was $37,917, and the median income for a family was $45,917. Males had a median income of $35,917 versus $25,917 for females. The per capita income for the city was $19,917. About 9.2% of families and 11.2% of the population were below the poverty line, including 15.2% of those under age 18 and 8.2% of those age 65 or over.
Common Questions
What is the Total Population of Port Jervis?
Total Population of Port Jervis is 8,725.
What is the Total Male Population of Port Jervis?
Total Male Population of Port Jervis is 4,249.
What is the Total Female Population of Port Jervis?
Total Female Population of Port Jervis is 4,476.
What is the Ratio of Males per 100 Females in Port Jervis?
There are 94.93 Males per 100 Females in Port Jervis.
What is the Ratio of Females per 100 Males in Port Jervis?
There are 105.34 Females per 100 Males in Port Jervis.
What is the Median Population Age in Port Jervis?
Median Population Age in Port Jervis is 40.8 Years.
What is the Average Family Size in Port Jervis
Average Family Size in Port Jervis is 3.4 People.
What is the Average Household Size in Port Jervis
Average Household Size in Port Jervis is 2.5 People.
What is Per Capita Income in Port Jervis?
Per Capita income in Port Jervis is $24,106.
What is the Median Family Income in Port Jervis?
Median Family Income in Port Jervis is $57,817.
What is the Median Household income in Port Jervis?
Median Household Income in Port Jervis is $38,804.
What is Income or Wage Gap in Port Jervis?
Income or Wage Gap in Port Jervis is 35.3%.
Women in Port Jervis earn 64.7 cents for every dollar earned by a man.
What is Inequality or Gini Index in Port Jervis?
Inequality or Gini Index in Port Jervis is 0.44.
How Large is the Labor Force in Port Jervis?
There are 3,952 People in the Labor Forcein in Port Jervis.
What is the Percentage of People in the Labor Force in Port Jervis?
55.0% of People are in the Labor Force in Port Jervis.
What is the Unemployment Rate in Port Jervis?
Unemployment Rate in Port Jervis is 7.9%.