Utica, NY
Utica Map
Utica Overview
64,728
TOTAL POPULATION
32,231
MALE POPULATION
32,497
FEMALE POPULATION
99.18
MALES / 100 FEMALES
100.83
FEMALES / 100 MALES
34.5
MEDIAN AGE
3.3
AVG FAMILY SIZE
2.5
AVG HOUSEHOLD SIZE
$25,622
PER CAPITA INCOME
$56,924
AVG FAMILY INCOME
$48,212
AVG HOUSEHOLD INCOME
22.9%
WAGE / INCOME GAP [ % ]
77.1¢/ $1
WAGE / INCOME GAP [ $ ]
$12,614
FAMILY INCOME DEFICIT
0.48
INEQUALITY / GINI INDEX
27,882
LABOR FORCE [ PEOPLE ]
55.7%
PERCENT IN LABOR FORCE
7.0%
UNEMPLOYMENT RATE
Utica Area Codes
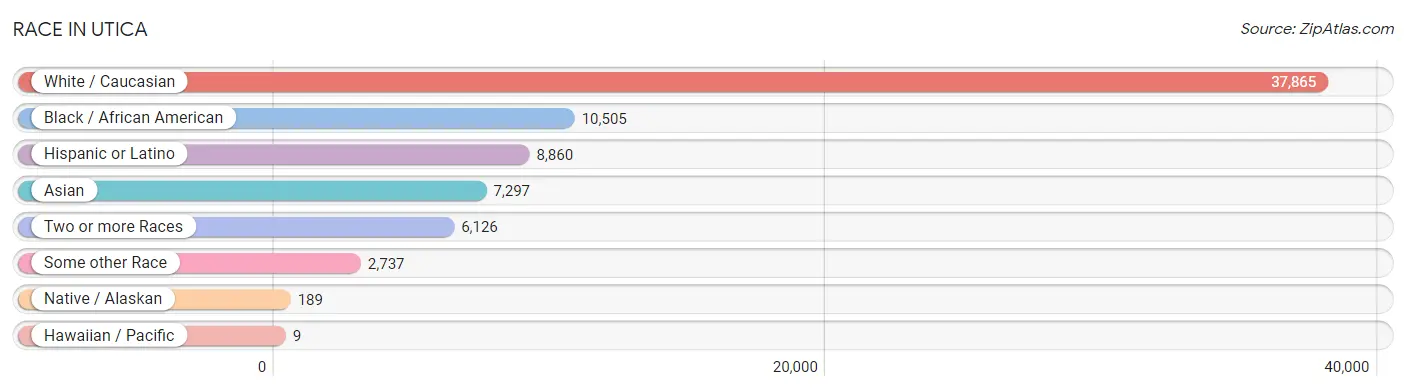
Race in Utica
The most populous races in Utica are White / Caucasian (37,865 | 58.5%), Black / African American (10,505 | 16.2%), and Hispanic or Latino (8,860 | 13.7%).
| Race | # Population | % Population |
| Asian | 7,297 | 11.3% |
| Black / African American | 10,505 | 16.2% |
| Hawaiian / Pacific | 9 | 0.0% |
| Hispanic or Latino | 8,860 | 13.7% |
| Native / Alaskan | 189 | 0.3% |
| White / Caucasian | 37,865 | 58.5% |
| Two or more Races | 6,126 | 9.5% |
| Some other Race | 2,737 | 4.2% |
| Total | 64,728 | 100.0% |
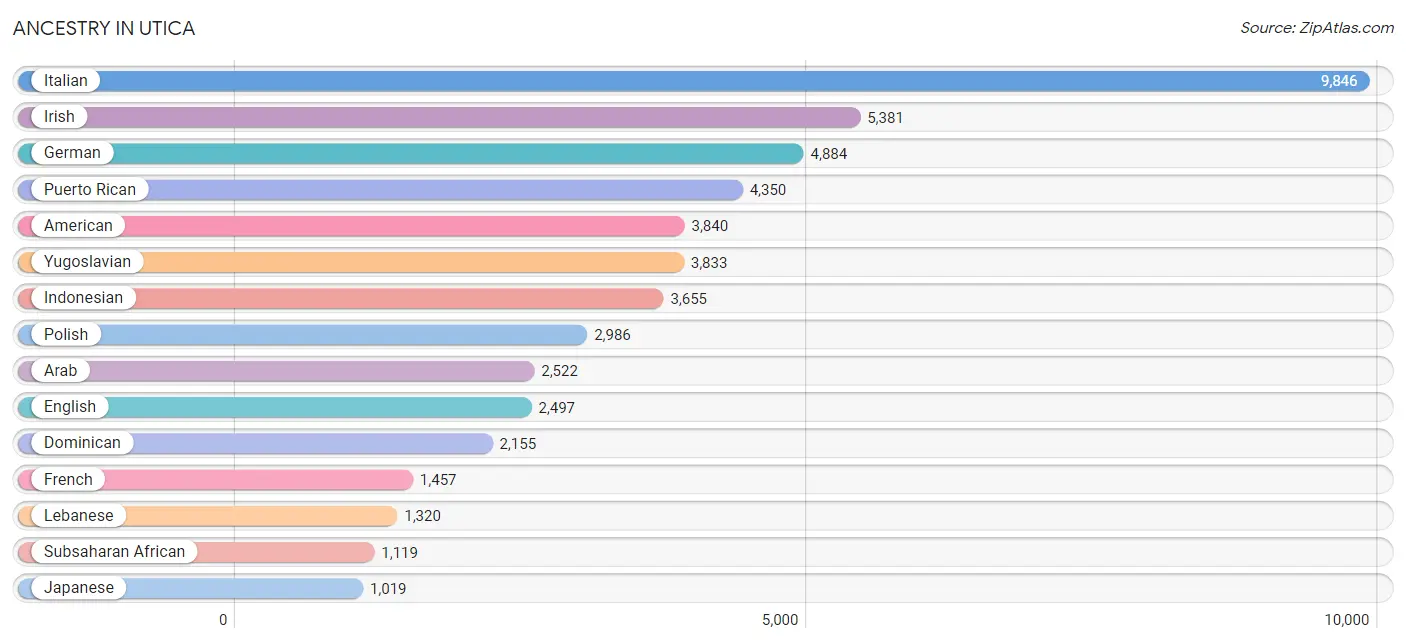
Ancestry in Utica
The most populous ancestries reported in Utica are Italian (9,846 | 15.2%), Irish (5,381 | 8.3%), German (4,884 | 7.5%), Puerto Rican (4,350 | 6.7%), and American (3,840 | 5.9%), together accounting for 43.7% of all Utica residents.
| Ancestry | # Population | % Population |
| Afghan | 70 | 0.1% |
| African | 538 | 0.8% |
| American | 3,840 | 5.9% |
| Arab | 2,522 | 3.9% |
| Armenian | 4 | 0.0% |
| Austrian | 12 | 0.0% |
| Barbadian | 46 | 0.1% |
| Belizean | 61 | 0.1% |
| Bhutanese | 67 | 0.1% |
| Blackfeet | 2 | 0.0% |
| British | 171 | 0.3% |
| Burmese | 174 | 0.3% |
| Cajun | 18 | 0.0% |
| Celtic | 5 | 0.0% |
| Central American | 433 | 0.7% |
| Central American Indian | 84 | 0.1% |
| Cherokee | 201 | 0.3% |
| Chilean | 7 | 0.0% |
| Colombian | 183 | 0.3% |
| Croatian | 82 | 0.1% |
| Cuban | 229 | 0.4% |
| Czech | 12 | 0.0% |
| Danish | 29 | 0.0% |
| Dominican | 2,155 | 3.3% |
| Dutch | 288 | 0.4% |
| Dutch West Indian | 7 | 0.0% |
| Eastern European | 25 | 0.0% |
| Ecuadorian | 248 | 0.4% |
| Egyptian | 33 | 0.1% |
| English | 2,497 | 3.9% |
| Ethiopian | 12 | 0.0% |
| European | 369 | 0.6% |
| Filipino | 72 | 0.1% |
| Finnish | 5 | 0.0% |
| French | 1,457 | 2.2% |
| French American Indian | 70 | 0.1% |
| French Canadian | 673 | 1.0% |
| German | 4,884 | 7.5% |
| Ghanaian | 17 | 0.0% |
| Greek | 95 | 0.2% |
| Guatemalan | 63 | 0.1% |
| Guyanese | 140 | 0.2% |
| Haitian | 127 | 0.2% |
| Honduran | 47 | 0.1% |
| Hungarian | 59 | 0.1% |
| Indian (Asian) | 590 | 0.9% |
| Indonesian | 3,655 | 5.7% |
| Iranian | 14 | 0.0% |
| Iraqi | 10 | 0.0% |
| Irish | 5,381 | 8.3% |
| Iroquois | 129 | 0.2% |
| Italian | 9,846 | 15.2% |
| Jamaican | 395 | 0.6% |
| Japanese | 1,019 | 1.6% |
| Kenyan | 98 | 0.2% |
| Korean | 89 | 0.1% |
| Laotian | 10 | 0.0% |
| Lebanese | 1,320 | 2.0% |
| Lithuanian | 150 | 0.2% |
| Luxembourger | 8 | 0.0% |
| Malaysian | 26 | 0.0% |
| Mexican | 496 | 0.8% |
| Mongolian | 23 | 0.0% |
| Native Hawaiian | 50 | 0.1% |
| Navajo | 2 | 0.0% |
| Nicaraguan | 26 | 0.0% |
| Nigerian | 8 | 0.0% |
| Northern European | 23 | 0.0% |
| Norwegian | 369 | 0.6% |
| Pakistani | 509 | 0.8% |
| Pennsylvania German | 18 | 0.0% |
| Polish | 2,986 | 4.6% |
| Portuguese | 84 | 0.1% |
| Puerto Rican | 4,350 | 6.7% |
| Romanian | 43 | 0.1% |
| Russian | 296 | 0.5% |
| Salvadoran | 297 | 0.5% |
| Samoan | 25 | 0.0% |
| Scandinavian | 67 | 0.1% |
| Scotch-Irish | 135 | 0.2% |
| Scottish | 296 | 0.5% |
| Seminole | 2 | 0.0% |
| Serbian | 12 | 0.0% |
| Slavic | 44 | 0.1% |
| Slovak | 14 | 0.0% |
| Somali | 359 | 0.5% |
| South American | 645 | 1.0% |
| Spaniard | 61 | 0.1% |
| Spanish | 205 | 0.3% |
| Sri Lankan | 663 | 1.0% |
| Subsaharan African | 1,119 | 1.7% |
| Sudanese | 27 | 0.0% |
| Swedish | 64 | 0.1% |
| Swiss | 24 | 0.0% |
| Syrian | 105 | 0.2% |
| Thai | 182 | 0.3% |
| Trinidadian and Tobagonian | 62 | 0.1% |
| Turkish | 10 | 0.0% |
| Ukrainian | 833 | 1.3% |
| Uruguayan | 45 | 0.1% |
| Venezuelan | 162 | 0.3% |
| Welsh | 464 | 0.7% |
| West Indian | 137 | 0.2% |
| Yugoslavian | 3,833 | 5.9% | View All 104 Rows |
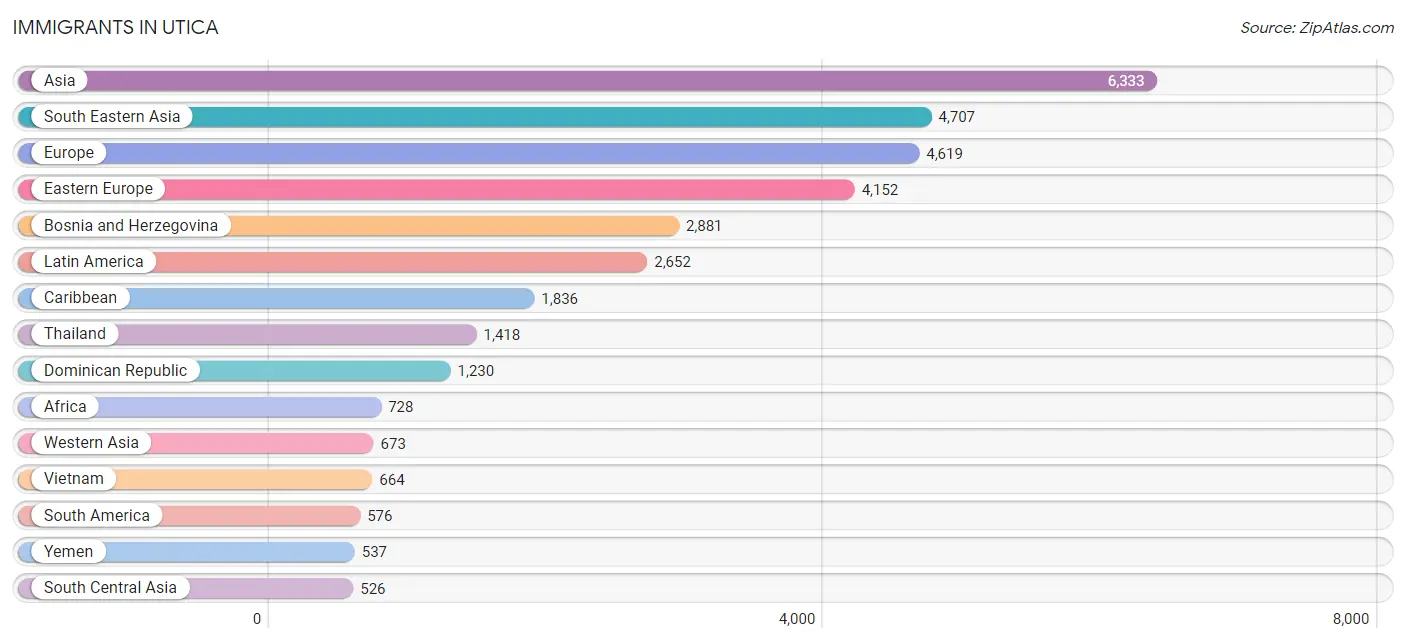
Immigrants in Utica
The most numerous immigrant groups reported in Utica came from Asia (6,333 | 9.8%), South Eastern Asia (4,707 | 7.3%), Europe (4,619 | 7.1%), Eastern Europe (4,152 | 6.4%), and Bosnia and Herzegovina (2,881 | 4.4%), together accounting for 35.0% of all Utica residents.
| Immigration Origin | # Population | % Population |
| Afghanistan | 95 | 0.2% |
| Africa | 728 | 1.1% |
| Asia | 6,333 | 9.8% |
| Australia | 7 | 0.0% |
| Austria | 20 | 0.0% |
| Barbados | 1 | 0.0% |
| Belarus | 373 | 0.6% |
| Belgium | 8 | 0.0% |
| Bosnia and Herzegovina | 2,881 | 4.4% |
| Cambodia | 427 | 0.7% |
| Canada | 34 | 0.1% |
| Caribbean | 1,836 | 2.8% |
| Central America | 240 | 0.4% |
| China | 302 | 0.5% |
| Colombia | 138 | 0.2% |
| Croatia | 80 | 0.1% |
| Cuba | 73 | 0.1% |
| Dominica | 48 | 0.1% |
| Dominican Republic | 1,230 | 1.9% |
| Eastern Africa | 510 | 0.8% |
| Eastern Asia | 400 | 0.6% |
| Eastern Europe | 4,152 | 6.4% |
| Ecuador | 213 | 0.3% |
| El Salvador | 45 | 0.1% |
| England | 43 | 0.1% |
| Ethiopia | 12 | 0.0% |
| Europe | 4,619 | 7.1% |
| France | 31 | 0.1% |
| Germany | 91 | 0.1% |
| Ghana | 3 | 0.0% |
| Grenada | 13 | 0.0% |
| Guatemala | 32 | 0.1% |
| Guyana | 61 | 0.1% |
| Haiti | 80 | 0.1% |
| Hong Kong | 37 | 0.1% |
| India | 104 | 0.2% |
| Indonesia | 10 | 0.0% |
| Iran | 32 | 0.1% |
| Iraq | 31 | 0.1% |
| Ireland | 17 | 0.0% |
| Italy | 210 | 0.3% |
| Jamaica | 326 | 0.5% |
| Japan | 15 | 0.0% |
| Jordan | 33 | 0.1% |
| Kazakhstan | 172 | 0.3% |
| Kenya | 179 | 0.3% |
| Korea | 83 | 0.1% |
| Laos | 17 | 0.0% |
| Latin America | 2,652 | 4.1% |
| Lebanon | 51 | 0.1% |
| Malaysia | 38 | 0.1% |
| Mexico | 138 | 0.2% |
| Moldova | 4 | 0.0% |
| Nepal | 37 | 0.1% |
| Netherlands | 39 | 0.1% |
| Nicaragua | 9 | 0.0% |
| Northern Africa | 18 | 0.0% |
| Northern Europe | 68 | 0.1% |
| Oceania | 16 | 0.0% |
| Pakistan | 24 | 0.0% |
| Panama | 16 | 0.0% |
| Philippines | 135 | 0.2% |
| Poland | 86 | 0.1% |
| Russia | 199 | 0.3% |
| Serbia | 36 | 0.1% |
| Somalia | 292 | 0.4% |
| South America | 576 | 0.9% |
| South Central Asia | 526 | 0.8% |
| South Eastern Asia | 4,707 | 7.3% |
| Southern Europe | 210 | 0.3% |
| St. Vincent and the Grenadines | 8 | 0.0% |
| Syria | 11 | 0.0% |
| Taiwan | 48 | 0.1% |
| Thailand | 1,418 | 2.2% |
| Trinidad and Tobago | 49 | 0.1% |
| Turkey | 10 | 0.0% |
| Ukraine | 299 | 0.5% |
| Uruguay | 45 | 0.1% |
| Uzbekistan | 4 | 0.0% |
| Venezuela | 119 | 0.2% |
| Vietnam | 664 | 1.0% |
| Western Africa | 198 | 0.3% |
| Western Asia | 673 | 1.0% |
| Western Europe | 189 | 0.3% |
| Yemen | 537 | 0.8% | View All 85 Rows |
Sex and Age in Utica
Sex and Age in Utica
The most populous age groups in Utica are 20 to 24 Years (2,767 | 8.6%) for men and 15 to 19 Years (2,383 | 7.3%) for women.
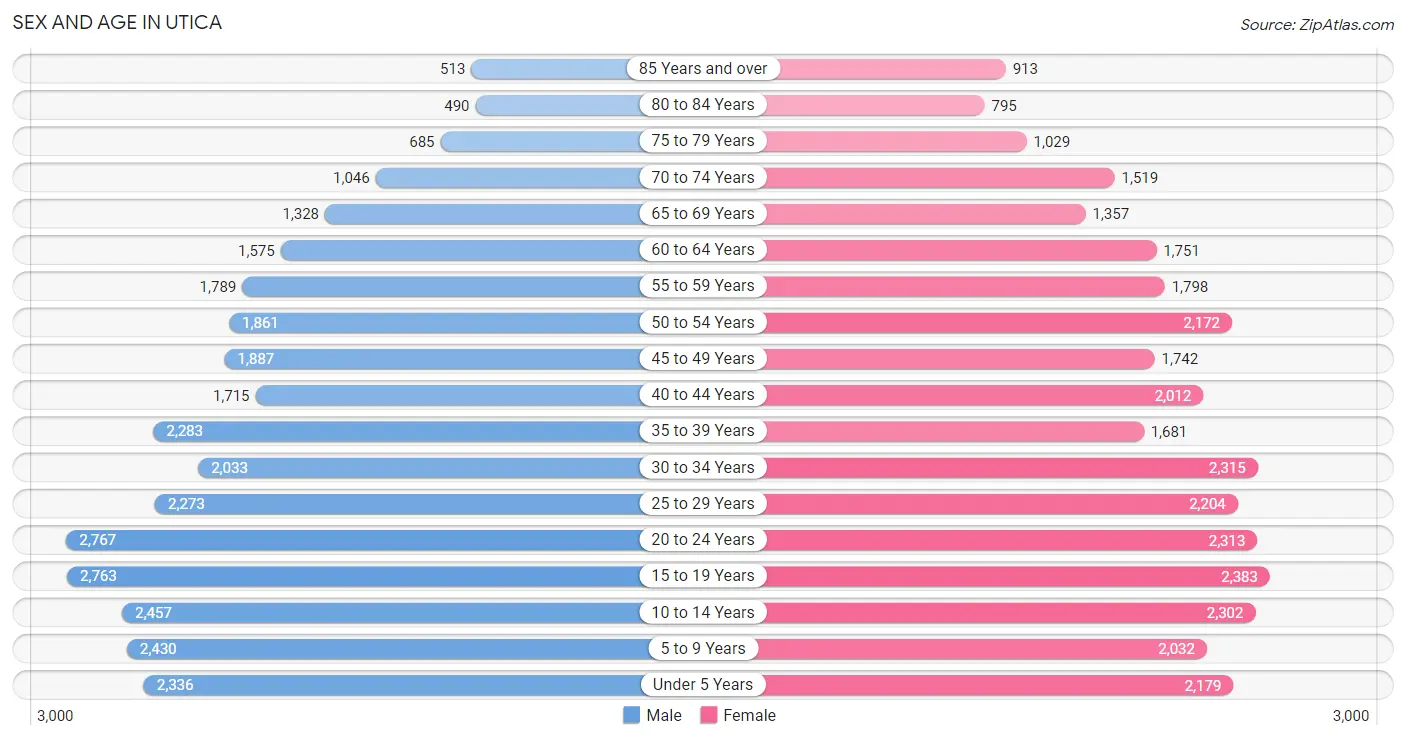
| Age Bracket | Male | Female |
| Under 5 Years | 2,336 (7.2%) | 2,179 (6.7%) |
| 5 to 9 Years | 2,430 (7.5%) | 2,032 (6.2%) |
| 10 to 14 Years | 2,457 (7.6%) | 2,302 (7.1%) |
| 15 to 19 Years | 2,763 (8.6%) | 2,383 (7.3%) |
| 20 to 24 Years | 2,767 (8.6%) | 2,313 (7.1%) |
| 25 to 29 Years | 2,273 (7.0%) | 2,204 (6.8%) |
| 30 to 34 Years | 2,033 (6.3%) | 2,315 (7.1%) |
| 35 to 39 Years | 2,283 (7.1%) | 1,681 (5.2%) |
| 40 to 44 Years | 1,715 (5.3%) | 2,012 (6.2%) |
| 45 to 49 Years | 1,887 (5.9%) | 1,742 (5.4%) |
| 50 to 54 Years | 1,861 (5.8%) | 2,172 (6.7%) |
| 55 to 59 Years | 1,789 (5.6%) | 1,798 (5.5%) |
| 60 to 64 Years | 1,575 (4.9%) | 1,751 (5.4%) |
| 65 to 69 Years | 1,328 (4.1%) | 1,357 (4.2%) |
| 70 to 74 Years | 1,046 (3.3%) | 1,519 (4.7%) |
| 75 to 79 Years | 685 (2.1%) | 1,029 (3.2%) |
| 80 to 84 Years | 490 (1.5%) | 795 (2.5%) |
| 85 Years and over | 513 (1.6%) | 913 (2.8%) |
| Total | 32,231 (100.0%) | 32,497 (100.0%) |
Families and Households in Utica
Median Family Size in Utica
The median family size in Utica is 3.31 persons per family, with married-couple families (8,200 | 56.8%) accounting for the largest median family size of 3.57 persons per family. On the other hand, single male/father families (1,390 | 9.6%) represent the smallest median family size with 2.53 persons per family.
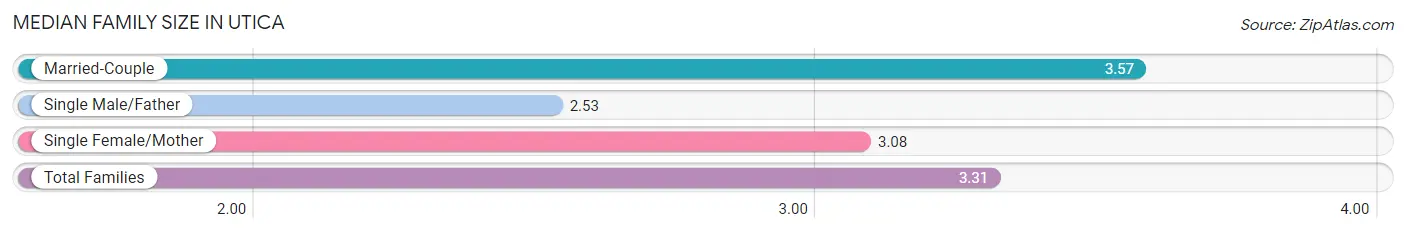
| Family Type | # Families | Family Size |
| Married-Couple | 8,200 (56.8%) | 3.57 |
| Single Male/Father | 1,390 (9.6%) | 2.53 |
| Single Female/Mother | 4,858 (33.6%) | 3.08 |
| Total Families | 14,448 (100.0%) | 3.31 |
Median Household Size in Utica
The median household size in Utica is 2.51 persons per household, with married-couple households (8,200 | 33.3%) accounting for the largest median household size of 3.6 persons per household. non-family households (10,169 | 41.3%) represent the smallest median household size with 1.23 persons per household.
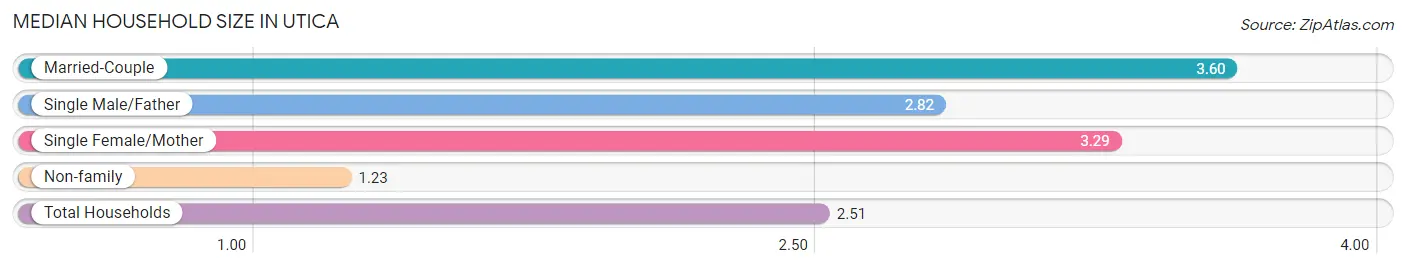
| Household Type | # Households | Household Size |
| Married-Couple | 8,200 (33.3%) | 3.60 |
| Single Male/Father | 1,390 (5.7%) | 2.82 |
| Single Female/Mother | 4,858 (19.7%) | 3.29 |
| Non-family | 10,169 (41.3%) | 1.23 |
| Total Households | 24,617 (100.0%) | 2.51 |
Household Size by Marriage Status in Utica
Out of a total of 24,617 households in Utica, 14,448 (58.7%) are family households, while 10,169 (41.3%) are nonfamily households. The most numerous type of family households are 2-person households, comprising 5,226, and the most common type of nonfamily households are 1-person households, comprising 8,323.
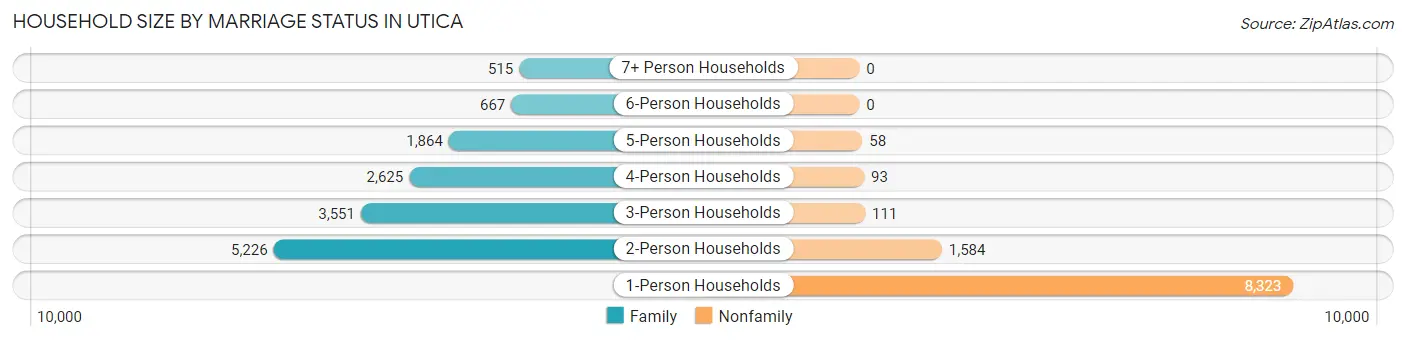
| Household Size | Family Households | Nonfamily Households |
| 1-Person Households | - | 8,323 (33.8%) |
| 2-Person Households | 5,226 (21.2%) | 1,584 (6.4%) |
| 3-Person Households | 3,551 (14.4%) | 111 (0.4%) |
| 4-Person Households | 2,625 (10.7%) | 93 (0.4%) |
| 5-Person Households | 1,864 (7.6%) | 58 (0.2%) |
| 6-Person Households | 667 (2.7%) | 0 (0.0%) |
| 7+ Person Households | 515 (2.1%) | 0 (0.0%) |
| Total | 14,448 (58.7%) | 10,169 (41.3%) |
Female Fertility in Utica
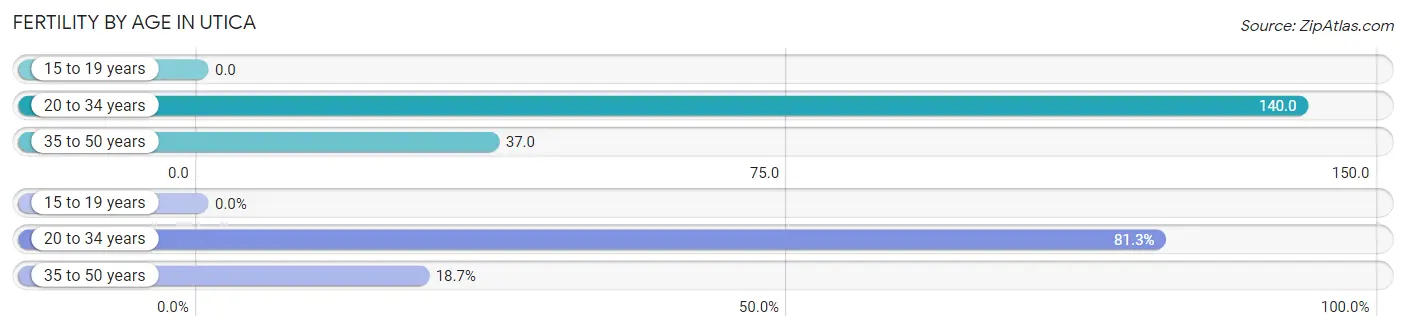
Fertility by Age in Utica
Average fertility rate in Utica is 78.0 births per 1,000 women. Women in the age bracket of 20 to 34 years have the highest fertility rate with 140.0 births per 1,000 women. Women in the age bracket of 20 to 34 years acount for 81.3% of all women with births.
| Age Bracket | Women with Births | Births / 1,000 Women |
| 15 to 19 years | 0 (0.0%) | 0.0 |
| 20 to 34 years | 955 (81.3%) | 140.0 |
| 35 to 50 years | 220 (18.7%) | 37.0 |
| Total | 1,175 (100.0%) | 78.0 |
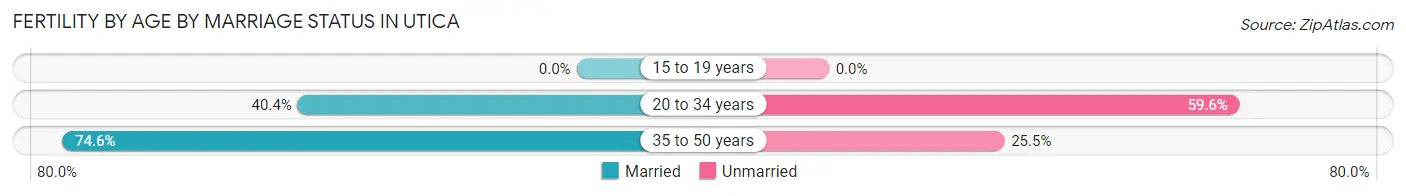
Fertility by Age by Marriage Status in Utica
46.8% of women with births (1,175) in Utica are married. The highest percentage of unmarried women with births falls into 20 to 34 years age bracket with 59.6% of them unmarried at the time of birth, while the lowest percentage of unmarried women with births belong to 35 to 50 years age bracket with 25.4% of them unmarried.
| Age Bracket | Married | Unmarried |
| 15 to 19 years | 0 (0.0%) | 0 (0.0%) |
| 20 to 34 years | 386 (40.4%) | 569 (59.6%) |
| 35 to 50 years | 164 (74.6%) | 56 (25.5%) |
| Total | 550 (46.8%) | 625 (53.2%) |
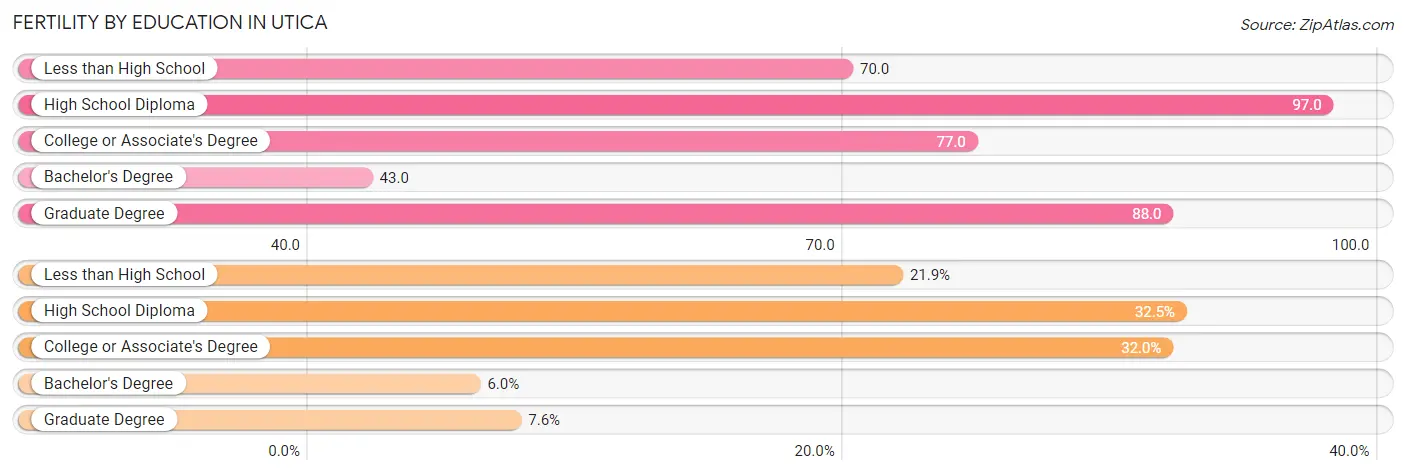
Fertility by Education in Utica
Average fertility rate in Utica is 78.0 births per 1,000 women. Women with the education attainment of high school diploma have the highest fertility rate of 97.0 births per 1,000 women, while women with the education attainment of bachelor's degree have the lowest fertility at 43.0 births per 1,000 women. Women with the education attainment of high school diploma represent 32.5% of all women with births.
| Educational Attainment | Women with Births | Births / 1,000 Women |
| Less than High School | 257 (21.9%) | 70.0 |
| High School Diploma | 382 (32.5%) | 97.0 |
| College or Associate's Degree | 376 (32.0%) | 77.0 |
| Bachelor's Degree | 71 (6.0%) | 43.0 |
| Graduate Degree | 89 (7.6%) | 88.0 |
| Total | 1,175 (100.0%) | 78.0 |
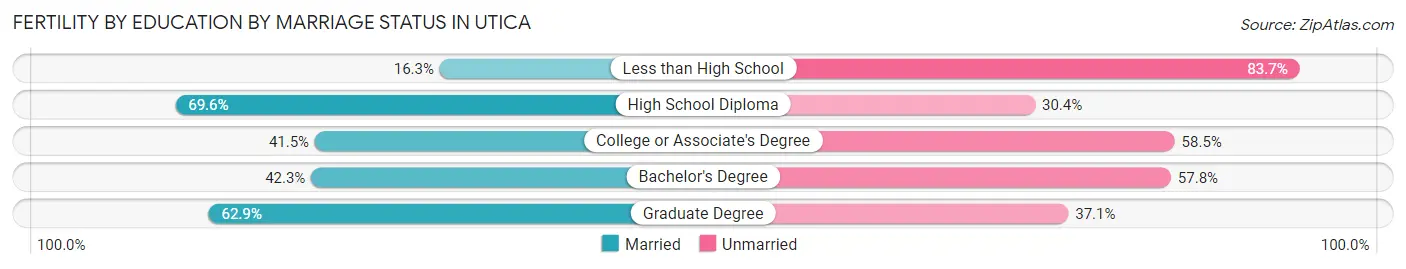
Fertility by Education by Marriage Status in Utica
53.2% of women with births in Utica are unmarried. Women with the educational attainment of high school diploma are most likely to be married with 69.6% of them married at childbirth, while women with the educational attainment of less than high school are least likely to be married with 83.7% of them unmarried at childbirth.
| Educational Attainment | Married | Unmarried |
| Less than High School | 42 (16.3%) | 215 (83.7%) |
| High School Diploma | 266 (69.6%) | 116 (30.4%) |
| College or Associate's Degree | 156 (41.5%) | 220 (58.5%) |
| Bachelor's Degree | 30 (42.2%) | 41 (57.8%) |
| Graduate Degree | 56 (62.9%) | 33 (37.1%) |
| Total | 550 (46.8%) | 625 (53.2%) |
Income in Utica
Income Overview in Utica
Per Capita Income in Utica is $25,622, while median incomes of families and households are $56,924 and $48,212 respectively.
| Characteristic | Number | Measure |
| Per Capita Income | 64,728 | $25,622 |
| Median Family Income | 14,448 | $56,924 |
| Mean Family Income | 14,448 | $74,061 |
| Median Household Income | 24,617 | $48,212 |
| Mean Household Income | 24,617 | $66,005 |
| Income Deficit | 14,448 | $12,614 |
| Wage / Income Gap (%) | 64,728 | 22.90% |
| Wage / Income Gap ($) | 64,728 | 77.10¢ per $1 |
| Gini / Inequality Index | 64,728 | 0.48 |
Earnings by Sex in Utica
Average Earnings in Utica are $32,461, $36,545 for men and $28,176 for women, a difference of 22.9%.
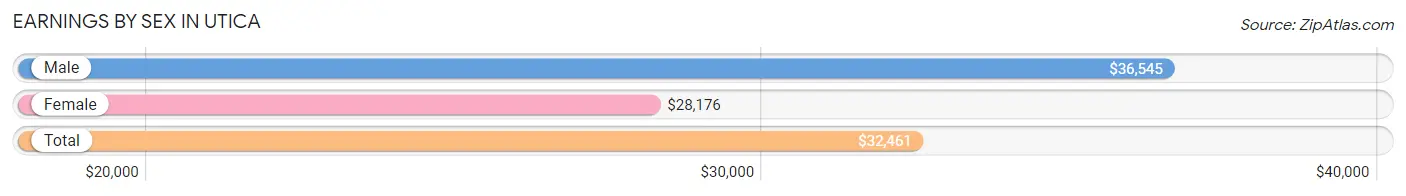
| Sex | Number | Average Earnings |
| Male | 14,941 (51.7%) | $36,545 |
| Female | 13,967 (48.3%) | $28,176 |
| Total | 28,908 (100.0%) | $32,461 |
Earnings by Sex by Income Bracket in Utica
The most common earnings brackets in Utica are $35,000 to $39,999 for men (1,311 | 8.8%) and $25,000 to $29,999 for women (1,328 | 9.5%).
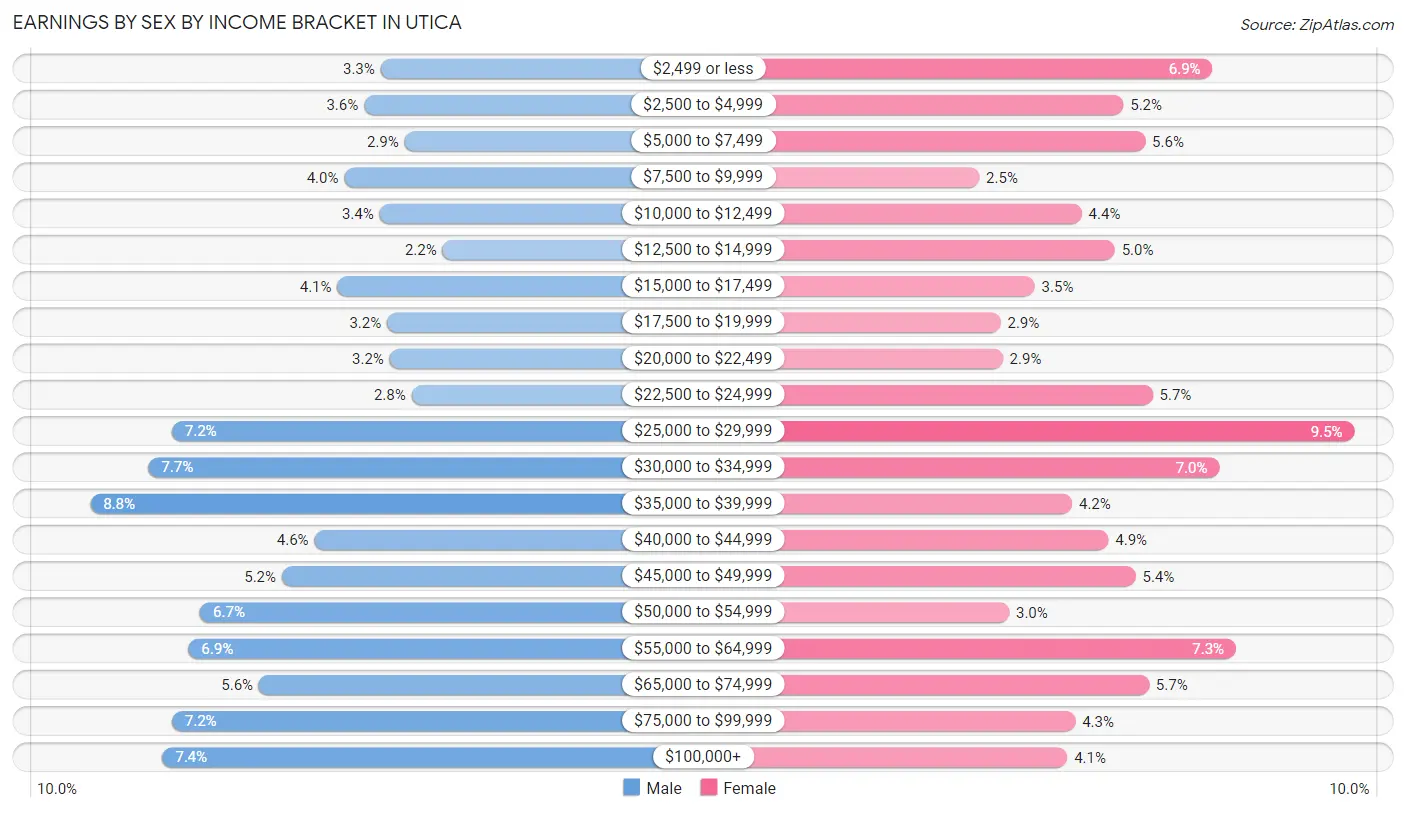
| Income | Male | Female |
| $2,499 or less | 498 (3.3%) | 957 (6.9%) |
| $2,500 to $4,999 | 544 (3.6%) | 724 (5.2%) |
| $5,000 to $7,499 | 431 (2.9%) | 781 (5.6%) |
| $7,500 to $9,999 | 599 (4.0%) | 346 (2.5%) |
| $10,000 to $12,499 | 501 (3.4%) | 615 (4.4%) |
| $12,500 to $14,999 | 324 (2.2%) | 701 (5.0%) |
| $15,000 to $17,499 | 618 (4.1%) | 491 (3.5%) |
| $17,500 to $19,999 | 479 (3.2%) | 402 (2.9%) |
| $20,000 to $22,499 | 472 (3.2%) | 408 (2.9%) |
| $22,500 to $24,999 | 411 (2.8%) | 801 (5.7%) |
| $25,000 to $29,999 | 1,082 (7.2%) | 1,328 (9.5%) |
| $30,000 to $34,999 | 1,148 (7.7%) | 975 (7.0%) |
| $35,000 to $39,999 | 1,311 (8.8%) | 589 (4.2%) |
| $40,000 to $44,999 | 683 (4.6%) | 685 (4.9%) |
| $45,000 to $49,999 | 774 (5.2%) | 755 (5.4%) |
| $50,000 to $54,999 | 1,002 (6.7%) | 425 (3.0%) |
| $55,000 to $64,999 | 1,036 (6.9%) | 1,018 (7.3%) |
| $65,000 to $74,999 | 838 (5.6%) | 791 (5.7%) |
| $75,000 to $99,999 | 1,081 (7.2%) | 598 (4.3%) |
| $100,000+ | 1,109 (7.4%) | 577 (4.1%) |
| Total | 14,941 (100.0%) | 13,967 (100.0%) |
Earnings by Sex by Educational Attainment in Utica
Average earnings in Utica are $41,222 for men and $32,383 for women, a difference of 21.4%. Men with an educational attainment of graduate degree enjoy the highest average annual earnings of $72,470, while those with less than high school education earn the least with $31,375. Women with an educational attainment of graduate degree earn the most with the average annual earnings of $58,721, while those with less than high school education have the smallest earnings of $24,720.
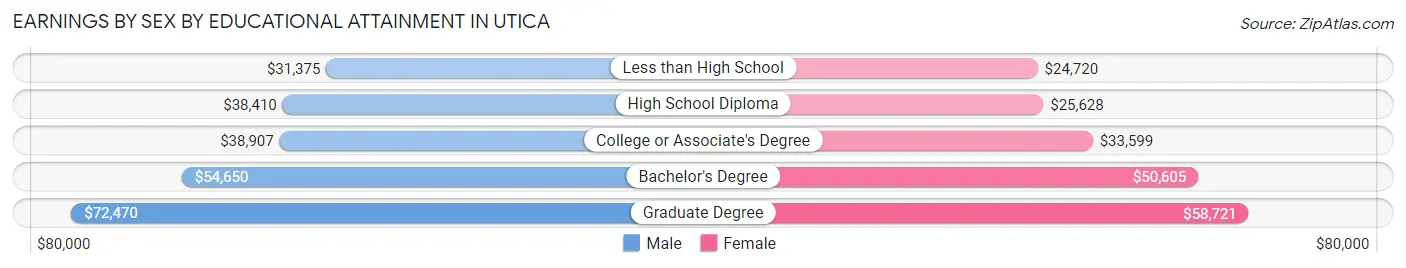
| Educational Attainment | Male Income | Female Income |
| Less than High School | $31,375 | $24,720 |
| High School Diploma | $38,410 | $25,628 |
| College or Associate's Degree | $38,907 | $33,599 |
| Bachelor's Degree | $54,650 | $50,605 |
| Graduate Degree | $72,470 | $58,721 |
| Total | $41,222 | $32,383 |
Family Income in Utica
Family Income Brackets in Utica
According to the Utica family income data, there are 2,615 families falling into the $50,000 to $74,999 income range, which is the most common income bracket and makes up 18.1% of all families. Conversely, the $200,000+ income bracket is the least frequent group with only 621 families (4.3%) belonging to this category.
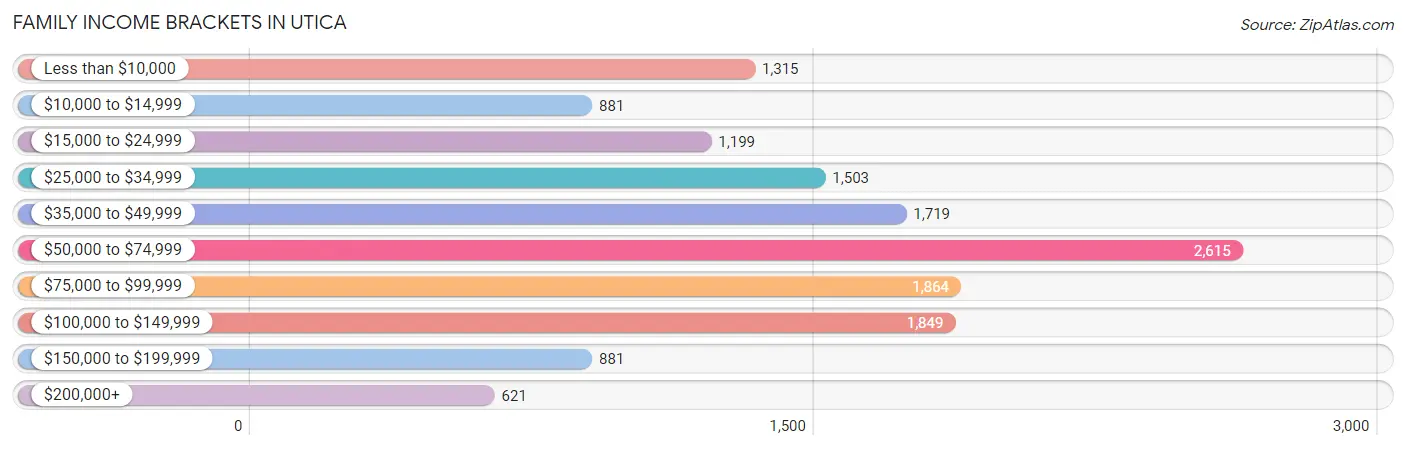
| Income Bracket | # Families | % Families |
| Less than $10,000 | 1,315 | 9.1% |
| $10,000 to $14,999 | 881 | 6.1% |
| $15,000 to $24,999 | 1,199 | 8.3% |
| $25,000 to $34,999 | 1,503 | 10.4% |
| $35,000 to $49,999 | 1,719 | 11.9% |
| $50,000 to $74,999 | 2,615 | 18.1% |
| $75,000 to $99,999 | 1,864 | 12.9% |
| $100,000 to $149,999 | 1,849 | 12.8% |
| $150,000 to $199,999 | 881 | 6.1% |
| $200,000+ | 621 | 4.3% |
Family Income by Famaliy Size in Utica
4-person families (2,734 | 18.9%) account for the highest median family income in Utica with $71,250 per family, while 2-person families (5,964 | 41.3%) have the highest median income of $26,466 per family member.
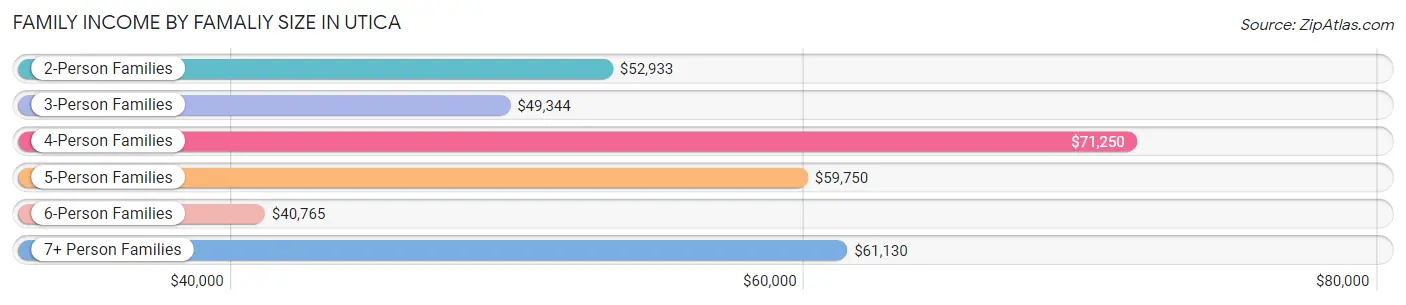
| Income Bracket | # Families | Median Income |
| 2-Person Families | 5,964 (41.3%) | $52,933 |
| 3-Person Families | 3,103 (21.5%) | $49,344 |
| 4-Person Families | 2,734 (18.9%) | $71,250 |
| 5-Person Families | 1,528 (10.6%) | $59,750 |
| 6-Person Families | 710 (4.9%) | $40,765 |
| 7+ Person Families | 409 (2.8%) | $61,130 |
| Total | 14,448 (100.0%) | $56,924 |
Family Income by Number of Earners in Utica
The median family income in Utica is $56,924, with families comprising 3+ earners (1,593) having the highest median family income of $103,031, while families with no earners (2,826) have the lowest median family income of $17,972, accounting for 11.0% and 19.6% of families, respectively.
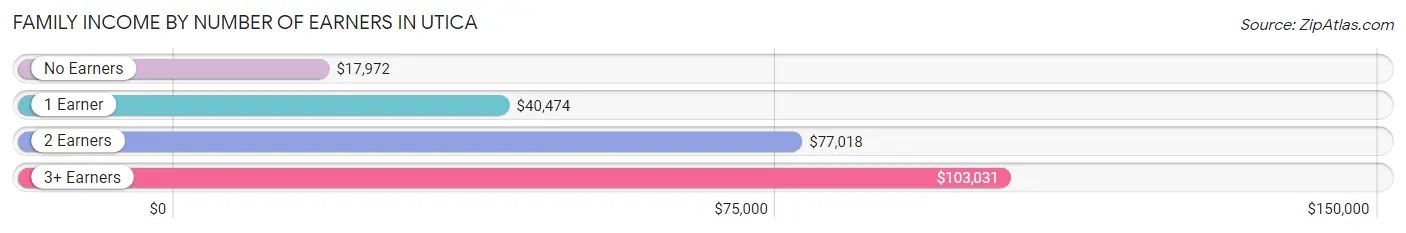
| Number of Earners | # Families | Median Income |
| No Earners | 2,826 (19.6%) | $17,972 |
| 1 Earner | 5,734 (39.7%) | $40,474 |
| 2 Earners | 4,295 (29.7%) | $77,018 |
| 3+ Earners | 1,593 (11.0%) | $103,031 |
| Total | 14,448 (100.0%) | $56,924 |
Household Income in Utica
Household Income Brackets in Utica
With 4,505 households falling in the category, the $50,000 to $74,999 income range is the most frequent in Utica, accounting for 18.3% of all households. In contrast, only 812 households (3.3%) fall into the $200,000+ income bracket, making it the least populous group.
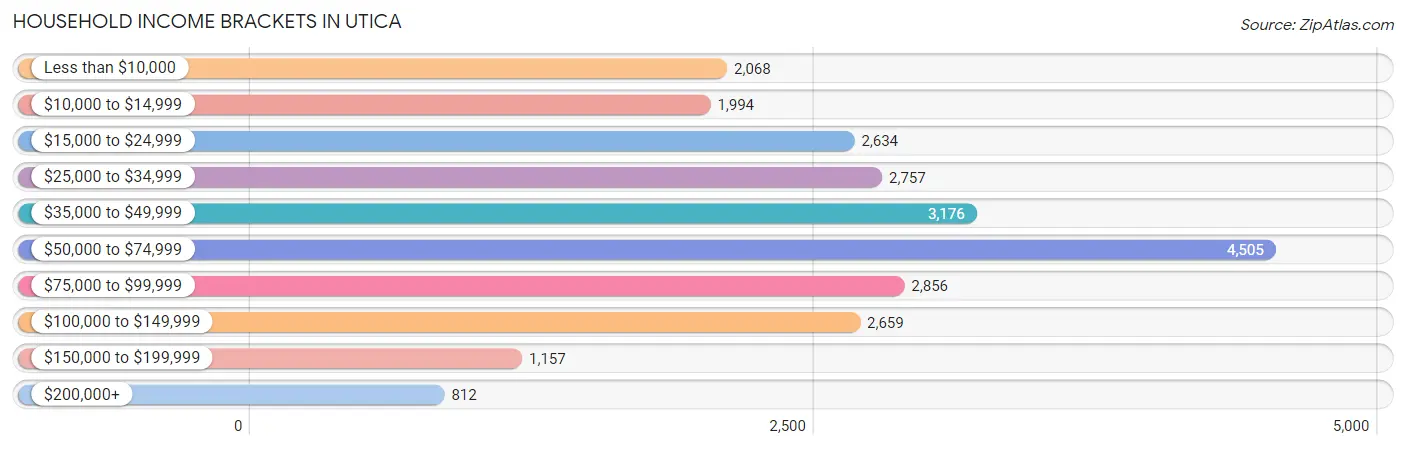
| Income Bracket | # Households | % Households |
| Less than $10,000 | 2,068 | 8.4% |
| $10,000 to $14,999 | 1,994 | 8.1% |
| $15,000 to $24,999 | 2,634 | 10.7% |
| $25,000 to $34,999 | 2,757 | 11.2% |
| $35,000 to $49,999 | 3,176 | 12.9% |
| $50,000 to $74,999 | 4,505 | 18.3% |
| $75,000 to $99,999 | 2,856 | 11.6% |
| $100,000 to $149,999 | 2,659 | 10.8% |
| $150,000 to $199,999 | 1,157 | 4.7% |
| $200,000+ | 812 | 3.3% |
Household Income by Householder Age in Utica
The median household income in Utica is $48,212, with the highest median household income of $54,860 found in the 45 to 64 years age bracket for the primary householder. A total of 8,706 households (35.4%) fall into this category. Meanwhile, the 15 to 24 years age bracket for the primary householder has the lowest median household income of $32,284, with 1,558 households (6.3%) in this group.
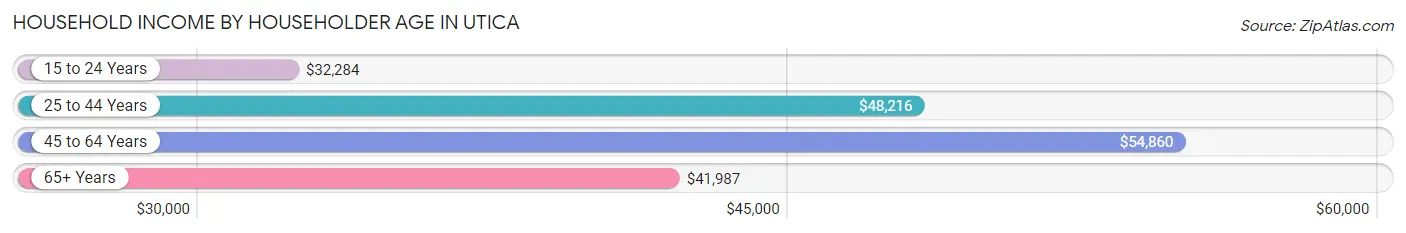
| Income Bracket | # Households | Median Income |
| 15 to 24 Years | 1,558 (6.3%) | $32,284 |
| 25 to 44 Years | 8,159 (33.1%) | $48,216 |
| 45 to 64 Years | 8,706 (35.4%) | $54,860 |
| 65+ Years | 6,194 (25.2%) | $41,987 |
| Total | 24,617 (100.0%) | $48,212 |
Poverty in Utica
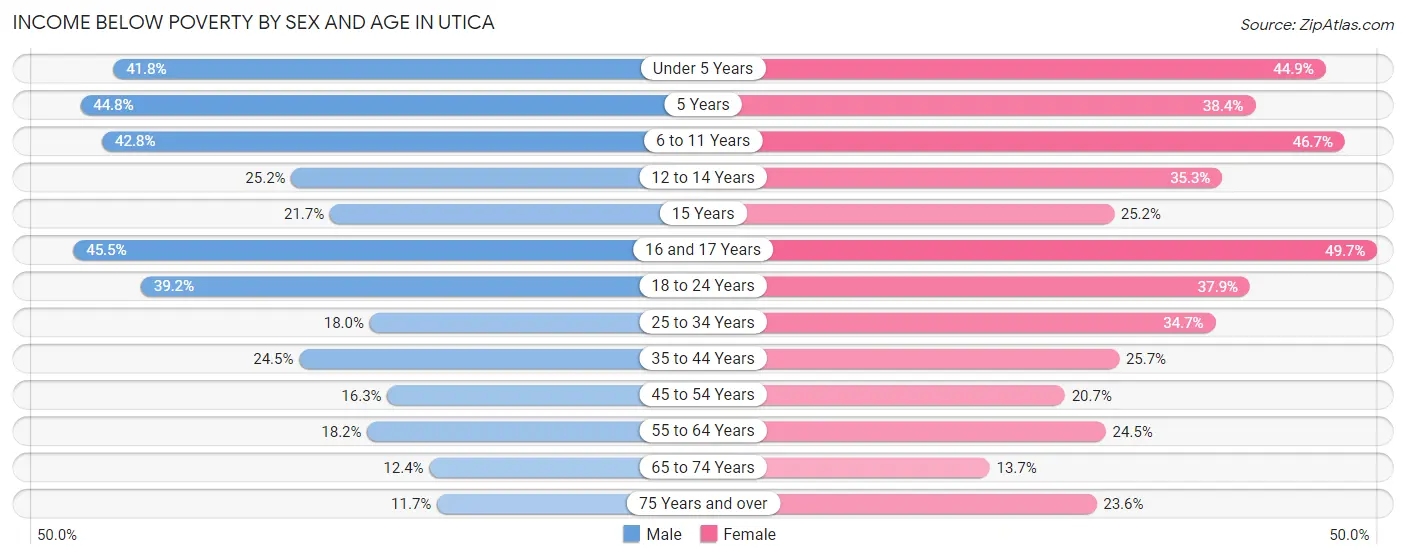
Income Below Poverty by Sex and Age in Utica
With 26.1% poverty level for males and 30.2% for females among the residents of Utica, 16 and 17 year old males and 16 and 17 year old females are the most vulnerable to poverty, with 418 males (45.5%) and 329 females (49.7%) in their respective age groups living below the poverty level.
| Age Bracket | Male | Female |
| Under 5 Years | 975 (41.8%) | 965 (44.9%) |
| 5 Years | 195 (44.8%) | 150 (38.4%) |
| 6 to 11 Years | 1,355 (42.8%) | 1,229 (46.7%) |
| 12 to 14 Years | 319 (25.2%) | 442 (35.3%) |
| 15 Years | 89 (21.6%) | 132 (25.2%) |
| 16 and 17 Years | 418 (45.5%) | 329 (49.7%) |
| 18 to 24 Years | 1,404 (39.2%) | 1,086 (37.9%) |
| 25 to 34 Years | 773 (18.0%) | 1,558 (34.7%) |
| 35 to 44 Years | 978 (24.5%) | 950 (25.7%) |
| 45 to 54 Years | 608 (16.3%) | 808 (20.7%) |
| 55 to 64 Years | 602 (18.2%) | 863 (24.5%) |
| 65 to 74 Years | 290 (12.4%) | 391 (13.7%) |
| 75 Years and over | 181 (11.7%) | 561 (23.6%) |
| Total | 8,187 (26.1%) | 9,464 (30.2%) |
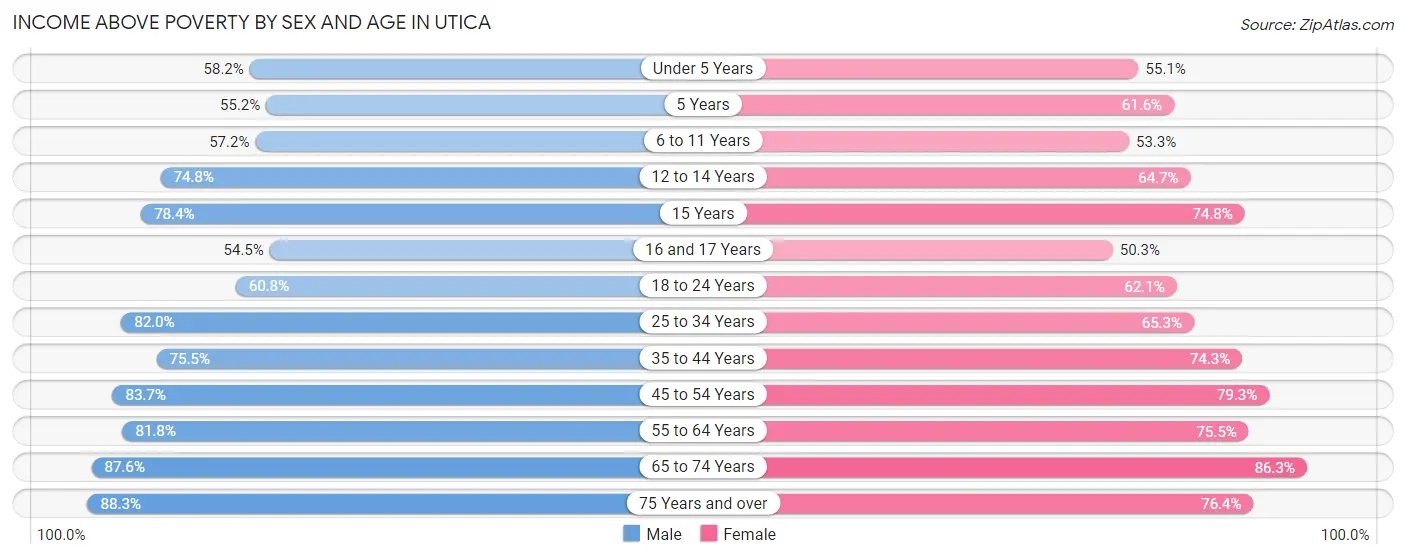
Income Above Poverty by Sex and Age in Utica
According to the poverty statistics in Utica, males aged 75 years and over and females aged 65 to 74 years are the age groups that are most secure financially, with 88.3% of males and 86.3% of females in these age groups living above the poverty line.
| Age Bracket | Male | Female |
| Under 5 Years | 1,359 (58.2%) | 1,184 (55.1%) |
| 5 Years | 240 (55.2%) | 241 (61.6%) |
| 6 to 11 Years | 1,810 (57.2%) | 1,404 (53.3%) |
| 12 to 14 Years | 945 (74.8%) | 810 (64.7%) |
| 15 Years | 322 (78.3%) | 391 (74.8%) |
| 16 and 17 Years | 501 (54.5%) | 333 (50.3%) |
| 18 to 24 Years | 2,177 (60.8%) | 1,782 (62.1%) |
| 25 to 34 Years | 3,532 (82.0%) | 2,936 (65.3%) |
| 35 to 44 Years | 3,013 (75.5%) | 2,743 (74.3%) |
| 45 to 54 Years | 3,115 (83.7%) | 3,097 (79.3%) |
| 55 to 64 Years | 2,707 (81.8%) | 2,661 (75.5%) |
| 65 to 74 Years | 2,043 (87.6%) | 2,460 (86.3%) |
| 75 Years and over | 1,365 (88.3%) | 1,814 (76.4%) |
| Total | 23,129 (73.9%) | 21,856 (69.8%) |
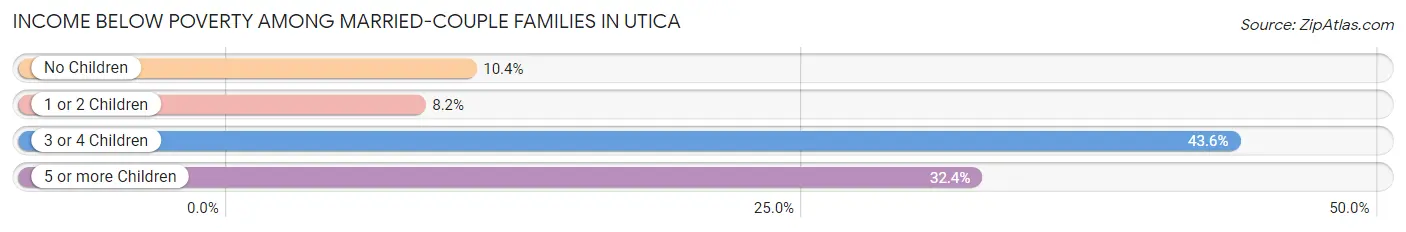
Income Below Poverty Among Married-Couple Families in Utica
The poverty statistics for married-couple families in Utica show that 13.7% or 1,126 of the total 8,200 families live below the poverty line. Families with 3 or 4 children have the highest poverty rate of 43.6%, comprising of 416 families. On the other hand, families with 1 or 2 children have the lowest poverty rate of 8.2%, which includes 236 families.
| Children | Above Poverty | Below Poverty |
| No Children | 3,805 (89.6%) | 440 (10.4%) |
| 1 or 2 Children | 2,660 (91.8%) | 236 (8.2%) |
| 3 or 4 Children | 538 (56.4%) | 416 (43.6%) |
| 5 or more Children | 71 (67.6%) | 34 (32.4%) |
| Total | 7,074 (86.3%) | 1,126 (13.7%) |
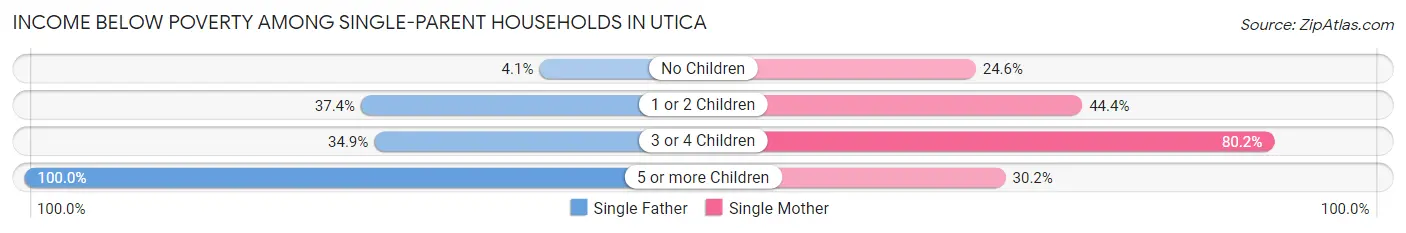
Income Below Poverty Among Single-Parent Households in Utica
According to the poverty data in Utica, 28.0% or 389 single-father households and 42.6% or 2,072 single-mother households are living below the poverty line. Among single-father households, those with 5 or more children have the highest poverty rate, with 58 households (100.0%) experiencing poverty. Likewise, among single-mother households, those with 3 or 4 children have the highest poverty rate, with 549 households (80.1%) falling below the poverty line.
| Children | Single Father | Single Mother |
| No Children | 20 (4.1%) | 378 (24.6%) |
| 1 or 2 Children | 222 (37.4%) | 1,088 (44.4%) |
| 3 or 4 Children | 89 (34.9%) | 549 (80.1%) |
| 5 or more Children | 58 (100.0%) | 57 (30.2%) |
| Total | 389 (28.0%) | 2,072 (42.6%) |
Income Below Poverty Among Married-Couple vs Single-Parent Households in Utica
The poverty data for Utica shows that 1,126 of the married-couple family households (13.7%) and 2,461 of the single-parent households (39.4%) are living below the poverty level. Within the married-couple family households, those with 3 or 4 children have the highest poverty rate, with 416 households (43.6%) falling below the poverty line. Among the single-parent households, those with 3 or 4 children have the highest poverty rate, with 638 household (67.9%) living below poverty.
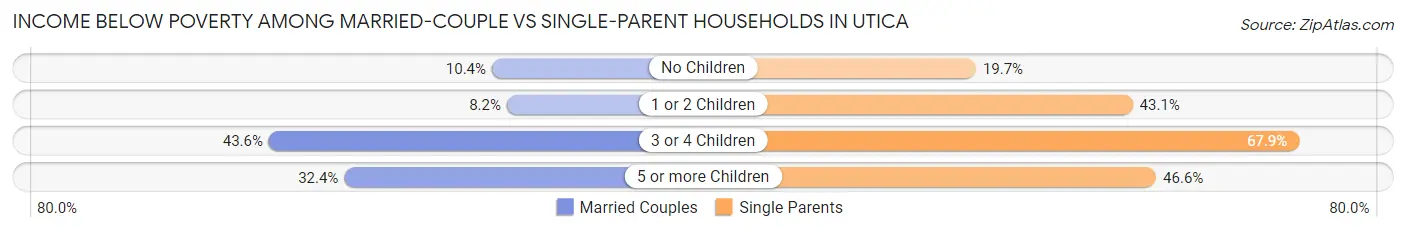
| Children | Married-Couple Families | Single-Parent Households |
| No Children | 440 (10.4%) | 398 (19.7%) |
| 1 or 2 Children | 236 (8.2%) | 1,310 (43.1%) |
| 3 or 4 Children | 416 (43.6%) | 638 (67.9%) |
| 5 or more Children | 34 (32.4%) | 115 (46.6%) |
| Total | 1,126 (13.7%) | 2,461 (39.4%) |
Employment Characteristics in Utica
Employment by Class of Employer in Utica
Among the 25,005 employed individuals in Utica, private company employees (16,550 | 66.2%), not-for-profit organizations (3,388 | 13.6%), and local government employees (1,787 | 7.1%) make up the most common classes of employment.
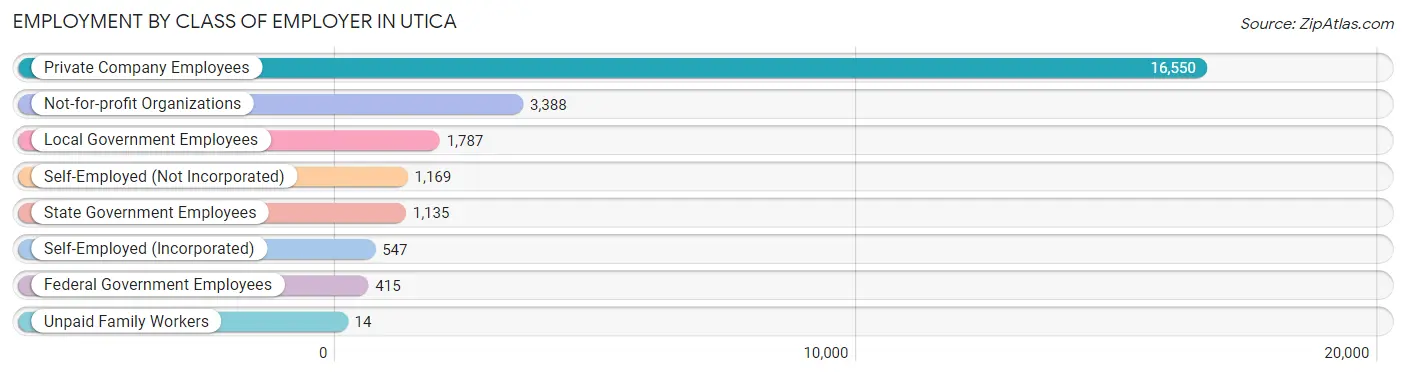
| Employer Class | # Employees | % Employees |
| Private Company Employees | 16,550 | 66.2% |
| Self-Employed (Incorporated) | 547 | 2.2% |
| Self-Employed (Not Incorporated) | 1,169 | 4.7% |
| Not-for-profit Organizations | 3,388 | 13.6% |
| Local Government Employees | 1,787 | 7.1% |
| State Government Employees | 1,135 | 4.5% |
| Federal Government Employees | 415 | 1.7% |
| Unpaid Family Workers | 14 | 0.1% |
| Total | 25,005 | 100.0% |
Employment Status by Age in Utica
According to the labor force statistics for Utica, out of the total population over 16 years of age (50,057), 55.7% or 27,882 individuals are in the labor force, with 7.0% or 1,952 of them unemployed. The age group with the highest labor force participation rate is 30 to 34 years, with 79.7% or 3,465 individuals in the labor force. Within the labor force, the 30 to 34 years age range has the highest percentage of unemployed individuals, with 12.3% or 426 of them being unemployed.
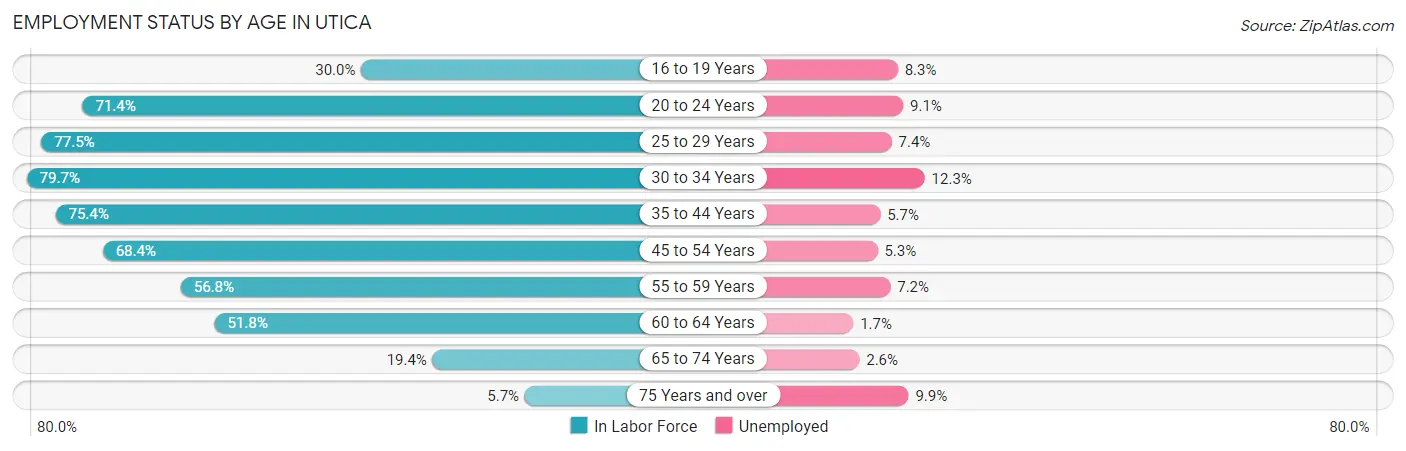
| Age Bracket | In Labor Force | Unemployed |
| 16 to 19 Years | 1,263 (30.0%) | 105 (8.3%) |
| 20 to 24 Years | 3,627 (71.4%) | 330 (9.1%) |
| 25 to 29 Years | 3,470 (77.5%) | 257 (7.4%) |
| 30 to 34 Years | 3,465 (79.7%) | 426 (12.3%) |
| 35 to 44 Years | 5,799 (75.4%) | 331 (5.7%) |
| 45 to 54 Years | 5,241 (68.4%) | 278 (5.3%) |
| 55 to 59 Years | 2,037 (56.8%) | 147 (7.2%) |
| 60 to 64 Years | 1,723 (51.8%) | 29 (1.7%) |
| 65 to 74 Years | 1,018 (19.4%) | 26 (2.6%) |
| 75 Years and over | 252 (5.7%) | 25 (9.9%) |
| Total | 27,882 (55.7%) | 1,952 (7.0%) |
Employment Status by Educational Attainment in Utica
According to labor force statistics for Utica, 69.9% of individuals (21,733) out of the total population between 25 and 64 years of age (31,091) are in the labor force, with 6.7% or 1,456 of them being unemployed. The group with the highest labor force participation rate are those with the educational attainment of bachelor's degree or higher, with 89.4% or 5,773 individuals in the labor force. Within the labor force, individuals with less than high school education have the highest percentage of unemployment, with 11.0% or 320 of them being unemployed.
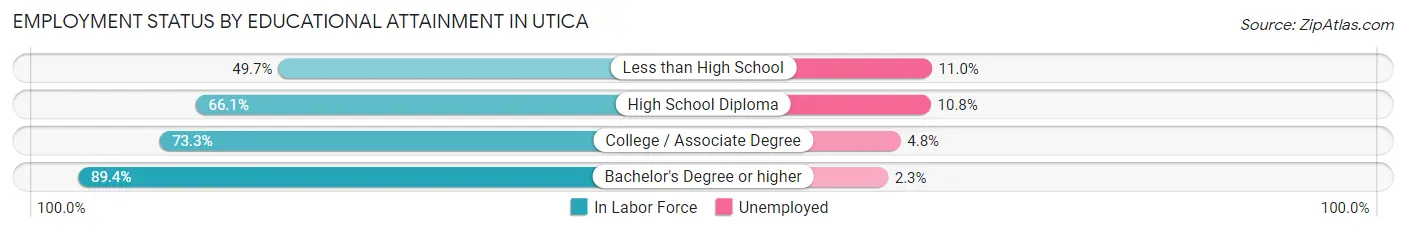
| Educational Attainment | In Labor Force | Unemployed |
| Less than High School | 2,911 (49.7%) | 644 (11.0%) |
| High School Diploma | 6,510 (66.1%) | 1,064 (10.8%) |
| College / Associate Degree | 6,543 (73.3%) | 428 (4.8%) |
| Bachelor's Degree or higher | 5,773 (89.4%) | 149 (2.3%) |
| Total | 21,733 (69.9%) | 2,083 (6.7%) |
Employment Occupations by Sex in Utica
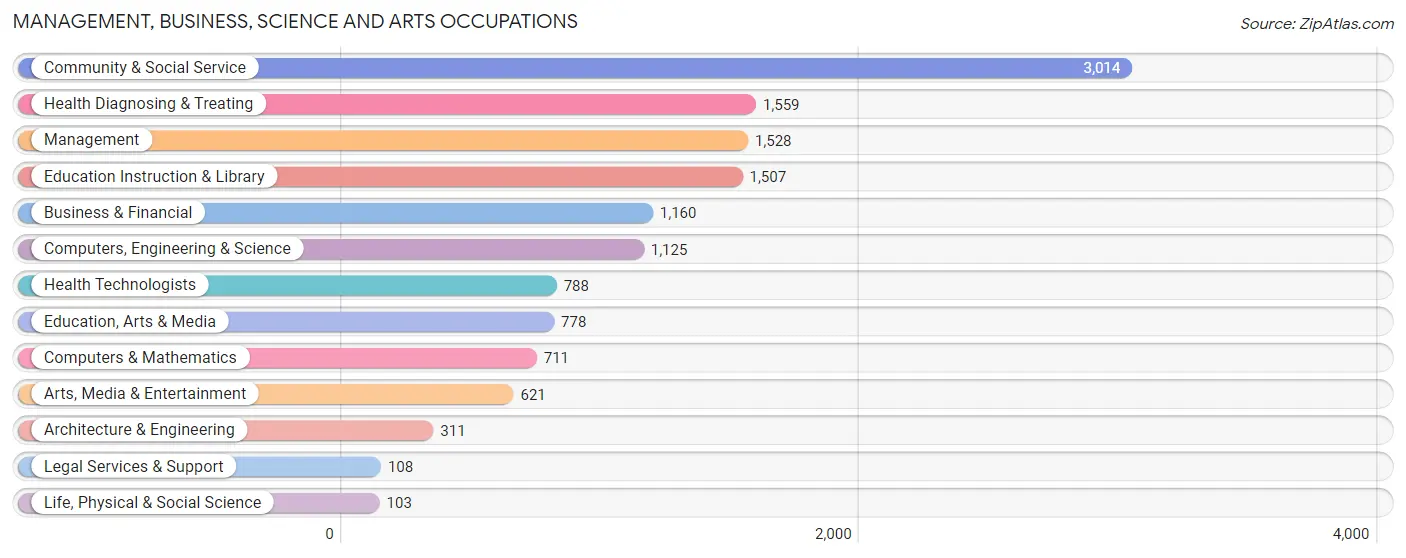
Management, Business, Science and Arts Occupations
The most common Management, Business, Science and Arts occupations in Utica are Community & Social Service (3,014 | 11.6%), Health Diagnosing & Treating (1,559 | 6.0%), Management (1,528 | 5.9%), Education Instruction & Library (1,507 | 5.8%), and Business & Financial (1,160 | 4.5%).
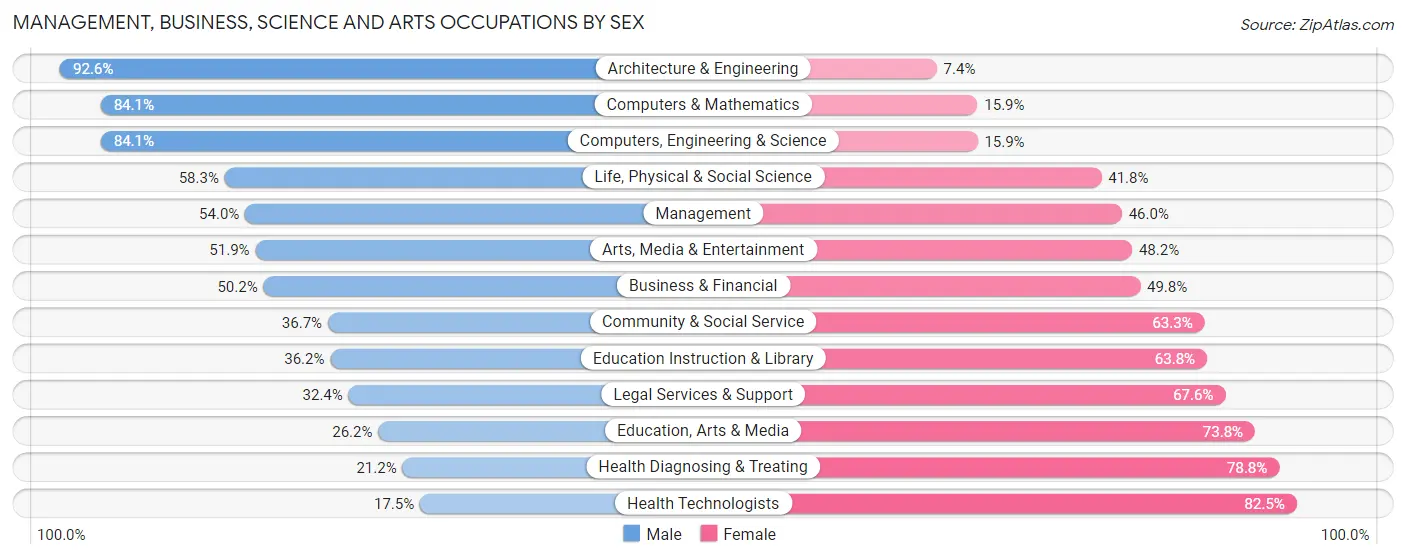
Management, Business, Science and Arts Occupations by Sex
Within the Management, Business, Science and Arts occupations in Utica, the most male-oriented occupations are Architecture & Engineering (92.6%), Computers & Mathematics (84.1%), and Computers, Engineering & Science (84.1%), while the most female-oriented occupations are Health Technologists (82.5%), Health Diagnosing & Treating (78.8%), and Education, Arts & Media (73.8%).
| Occupation | Male | Female |
| Management | 825 (54.0%) | 703 (46.0%) |
| Business & Financial | 582 (50.2%) | 578 (49.8%) |
| Computers, Engineering & Science | 946 (84.1%) | 179 (15.9%) |
| Computers & Mathematics | 598 (84.1%) | 113 (15.9%) |
| Architecture & Engineering | 288 (92.6%) | 23 (7.4%) |
| Life, Physical & Social Science | 60 (58.3%) | 43 (41.7%) |
| Community & Social Service | 1,107 (36.7%) | 1,907 (63.3%) |
| Education, Arts & Media | 204 (26.2%) | 574 (73.8%) |
| Legal Services & Support | 35 (32.4%) | 73 (67.6%) |
| Education Instruction & Library | 546 (36.2%) | 961 (63.8%) |
| Arts, Media & Entertainment | 322 (51.8%) | 299 (48.1%) |
| Health Diagnosing & Treating | 330 (21.2%) | 1,229 (78.8%) |
| Health Technologists | 138 (17.5%) | 650 (82.5%) |
| Total (Category) | 3,790 (45.2%) | 4,596 (54.8%) |
| Total (Overall) | 13,380 (51.7%) | 12,512 (48.3%) |
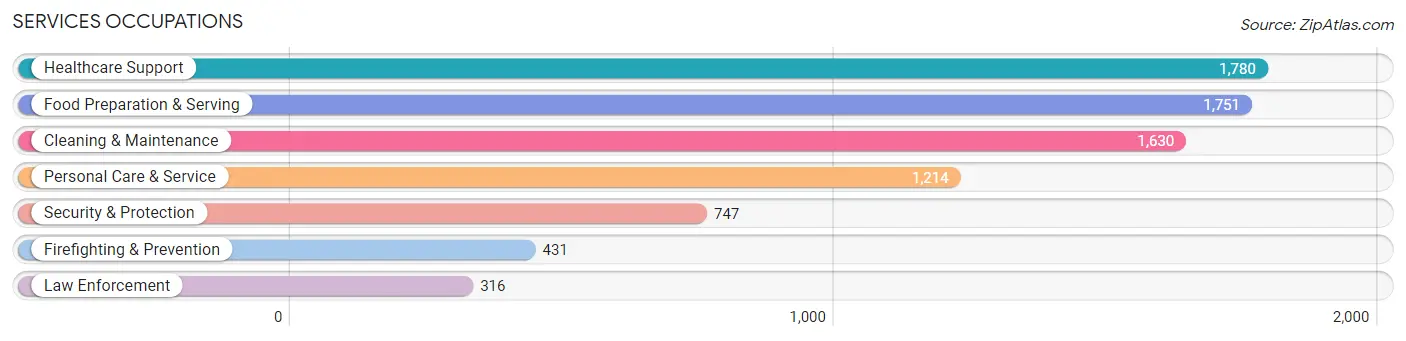
Services Occupations
The most common Services occupations in Utica are Healthcare Support (1,780 | 6.9%), Food Preparation & Serving (1,751 | 6.8%), Cleaning & Maintenance (1,630 | 6.3%), Personal Care & Service (1,214 | 4.7%), and Security & Protection (747 | 2.9%).
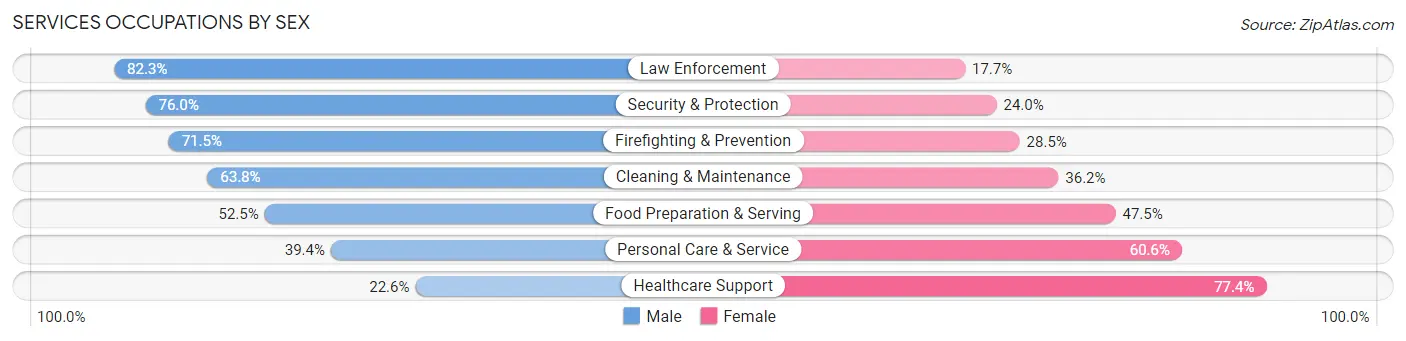
Services Occupations by Sex
Within the Services occupations in Utica, the most male-oriented occupations are Law Enforcement (82.3%), Security & Protection (76.0%), and Firefighting & Prevention (71.5%), while the most female-oriented occupations are Healthcare Support (77.4%), Personal Care & Service (60.6%), and Food Preparation & Serving (47.5%).
| Occupation | Male | Female |
| Healthcare Support | 403 (22.6%) | 1,377 (77.4%) |
| Security & Protection | 568 (76.0%) | 179 (24.0%) |
| Firefighting & Prevention | 308 (71.5%) | 123 (28.5%) |
| Law Enforcement | 260 (82.3%) | 56 (17.7%) |
| Food Preparation & Serving | 919 (52.5%) | 832 (47.5%) |
| Cleaning & Maintenance | 1,040 (63.8%) | 590 (36.2%) |
| Personal Care & Service | 478 (39.4%) | 736 (60.6%) |
| Total (Category) | 3,408 (47.8%) | 3,714 (52.1%) |
| Total (Overall) | 13,380 (51.7%) | 12,512 (48.3%) |
Sales and Office Occupations
The most common Sales and Office occupations in Utica are Sales & Related (2,844 | 11.0%), and Office & Administration (2,826 | 10.9%).

Sales and Office Occupations by Sex
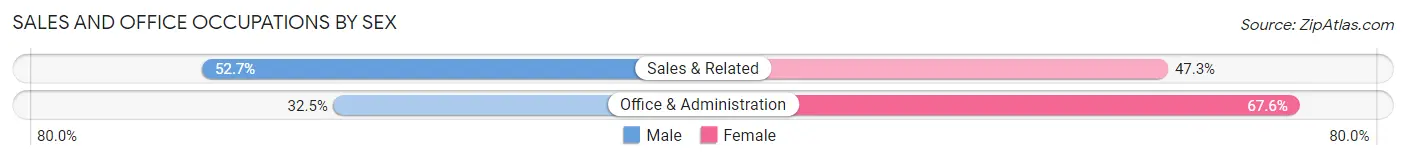
| Occupation | Male | Female |
| Sales & Related | 1,499 (52.7%) | 1,345 (47.3%) |
| Office & Administration | 917 (32.5%) | 1,909 (67.5%) |
| Total (Category) | 2,416 (42.6%) | 3,254 (57.4%) |
| Total (Overall) | 13,380 (51.7%) | 12,512 (48.3%) |
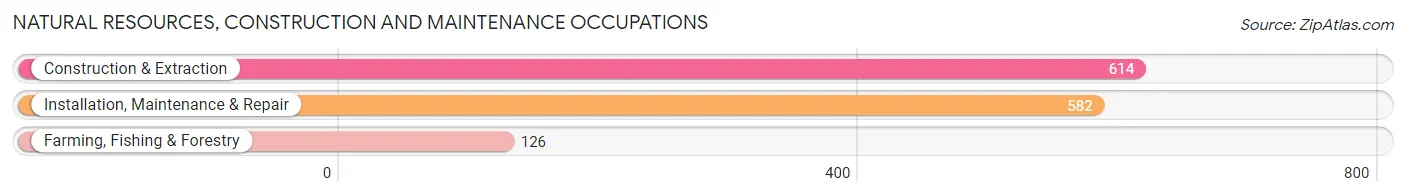
Natural Resources, Construction and Maintenance Occupations
The most common Natural Resources, Construction and Maintenance occupations in Utica are Construction & Extraction (614 | 2.4%), Installation, Maintenance & Repair (582 | 2.2%), and Farming, Fishing & Forestry (126 | 0.5%).
Natural Resources, Construction and Maintenance Occupations by Sex
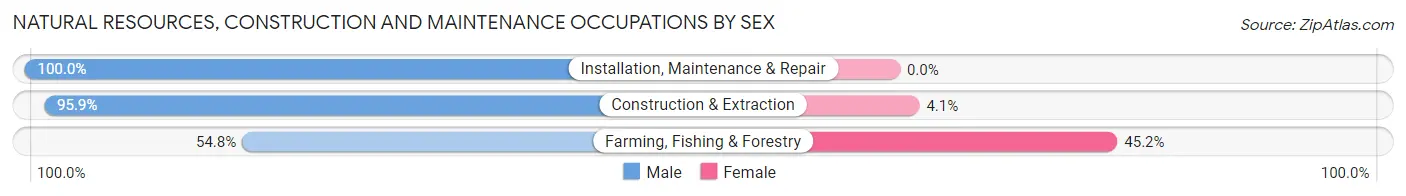
| Occupation | Male | Female |
| Farming, Fishing & Forestry | 69 (54.8%) | 57 (45.2%) |
| Construction & Extraction | 589 (95.9%) | 25 (4.1%) |
| Installation, Maintenance & Repair | 582 (100.0%) | 0 (0.0%) |
| Total (Category) | 1,240 (93.8%) | 82 (6.2%) |
| Total (Overall) | 13,380 (51.7%) | 12,512 (48.3%) |
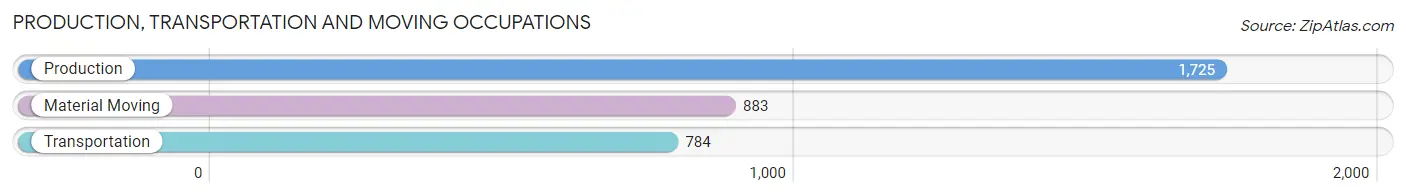
Production, Transportation and Moving Occupations
The most common Production, Transportation and Moving occupations in Utica are Production (1,725 | 6.7%), Material Moving (883 | 3.4%), and Transportation (784 | 3.0%).
Production, Transportation and Moving Occupations by Sex
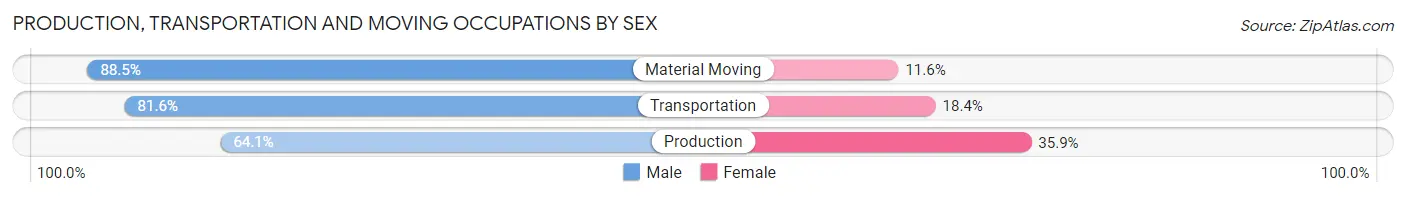
| Occupation | Male | Female |
| Production | 1,105 (64.1%) | 620 (35.9%) |
| Transportation | 640 (81.6%) | 144 (18.4%) |
| Material Moving | 781 (88.4%) | 102 (11.6%) |
| Total (Category) | 2,526 (74.5%) | 866 (25.5%) |
| Total (Overall) | 13,380 (51.7%) | 12,512 (48.3%) |
Employment Industries by Sex in Utica
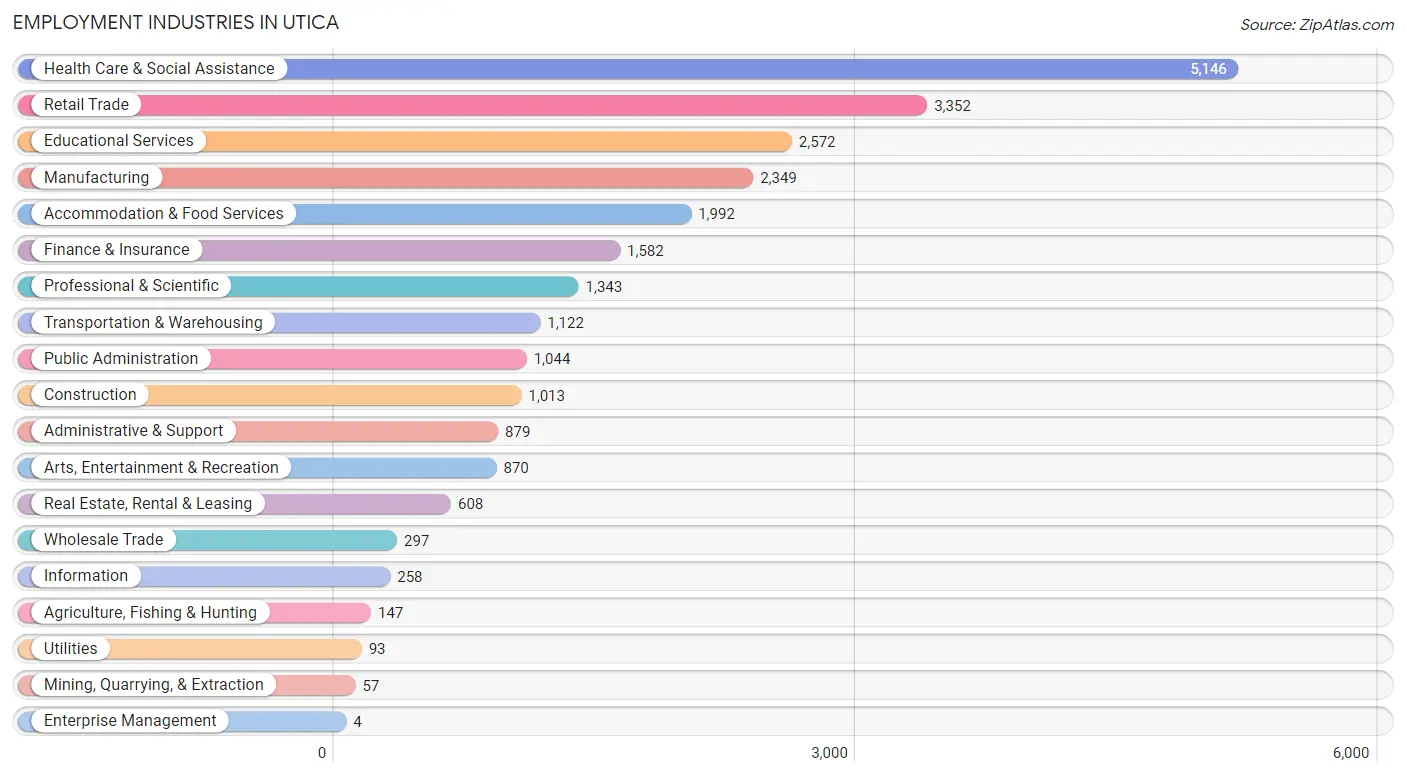
Employment Industries in Utica
The major employment industries in Utica include Health Care & Social Assistance (5,146 | 19.9%), Retail Trade (3,352 | 13.0%), Educational Services (2,572 | 9.9%), Manufacturing (2,349 | 9.1%), and Accommodation & Food Services (1,992 | 7.7%).
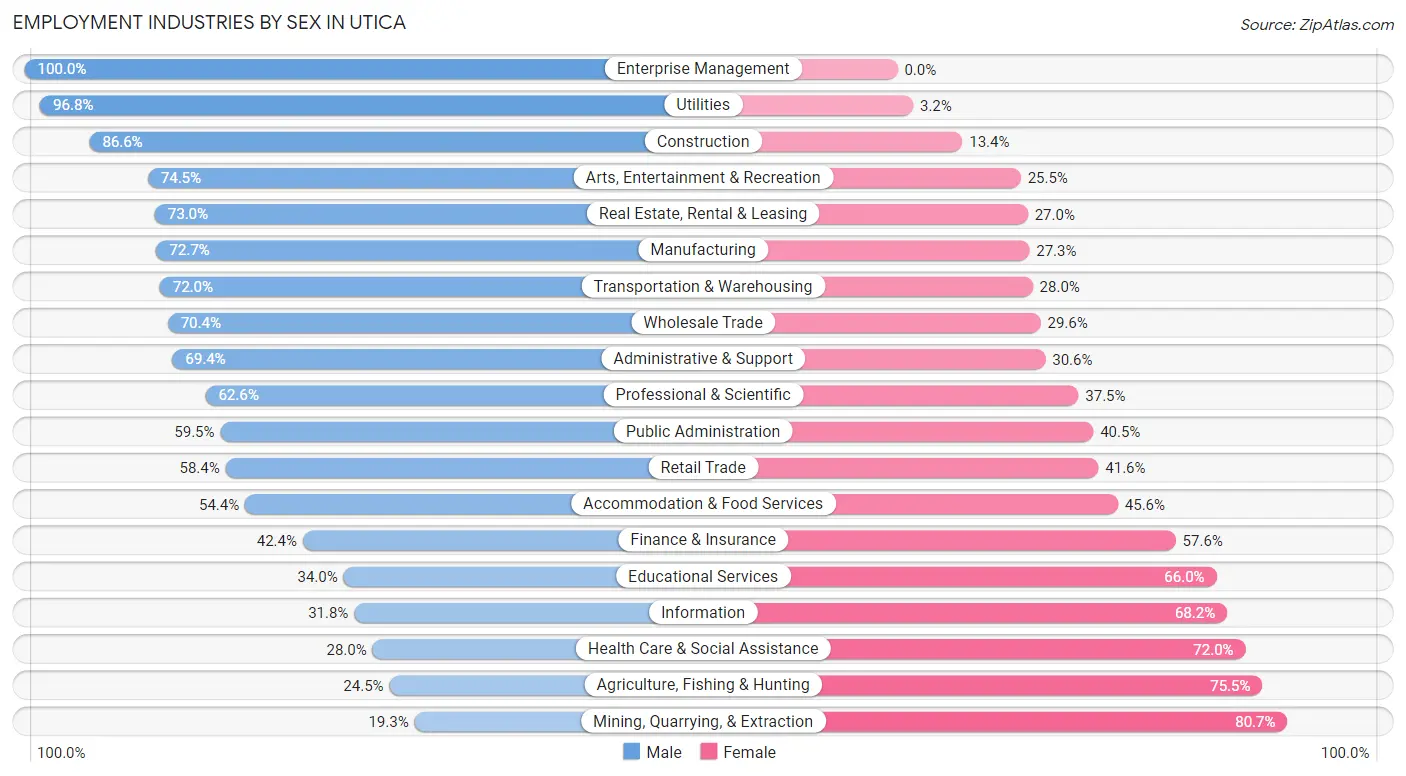
Employment Industries by Sex in Utica
The Utica industries that see more men than women are Enterprise Management (100.0%), Utilities (96.8%), and Construction (86.6%), whereas the industries that tend to have a higher number of women are Mining, Quarrying, & Extraction (80.7%), Agriculture, Fishing & Hunting (75.5%), and Health Care & Social Assistance (72.0%).
| Industry | Male | Female |
| Agriculture, Fishing & Hunting | 36 (24.5%) | 111 (75.5%) |
| Mining, Quarrying, & Extraction | 11 (19.3%) | 46 (80.7%) |
| Construction | 877 (86.6%) | 136 (13.4%) |
| Manufacturing | 1,708 (72.7%) | 641 (27.3%) |
| Wholesale Trade | 209 (70.4%) | 88 (29.6%) |
| Retail Trade | 1,958 (58.4%) | 1,394 (41.6%) |
| Transportation & Warehousing | 808 (72.0%) | 314 (28.0%) |
| Utilities | 90 (96.8%) | 3 (3.2%) |
| Information | 82 (31.8%) | 176 (68.2%) |
| Finance & Insurance | 671 (42.4%) | 911 (57.6%) |
| Real Estate, Rental & Leasing | 444 (73.0%) | 164 (27.0%) |
| Professional & Scientific | 840 (62.5%) | 503 (37.4%) |
| Enterprise Management | 4 (100.0%) | 0 (0.0%) |
| Administrative & Support | 610 (69.4%) | 269 (30.6%) |
| Educational Services | 874 (34.0%) | 1,698 (66.0%) |
| Health Care & Social Assistance | 1,440 (28.0%) | 3,706 (72.0%) |
| Arts, Entertainment & Recreation | 648 (74.5%) | 222 (25.5%) |
| Accommodation & Food Services | 1,083 (54.4%) | 909 (45.6%) |
| Public Administration | 621 (59.5%) | 423 (40.5%) |
| Total | 13,380 (51.7%) | 12,512 (48.3%) |
Education in Utica
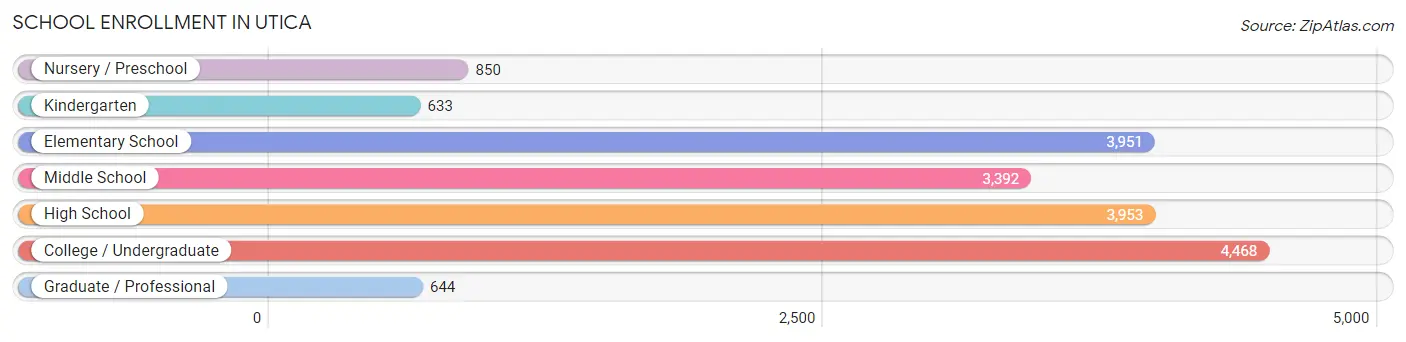
School Enrollment in Utica
The most common levels of schooling among the 17,891 students in Utica are college / undergraduate (4,468 | 25.0%), high school (3,953 | 22.1%), and elementary school (3,951 | 22.1%).
| School Level | # Students | % Students |
| Nursery / Preschool | 850 | 4.8% |
| Kindergarten | 633 | 3.5% |
| Elementary School | 3,951 | 22.1% |
| Middle School | 3,392 | 19.0% |
| High School | 3,953 | 22.1% |
| College / Undergraduate | 4,468 | 25.0% |
| Graduate / Professional | 644 | 3.6% |
| Total | 17,891 | 100.0% |
School Enrollment by Age by Funding Source in Utica
Out of a total of 17,891 students who are enrolled in schools in Utica, 3,149 (17.6%) attend a private institution, while the remaining 14,742 (82.4%) are enrolled in public schools. The age group of 20 to 24 year olds has the highest likelihood of being enrolled in private schools, with 1,105 (43.6% in the age bracket) enrolled. Conversely, the age group of 5 to 9 year old has the lowest likelihood of being enrolled in a private school, with 4,019 (95.0% in the age bracket) attending a public institution.
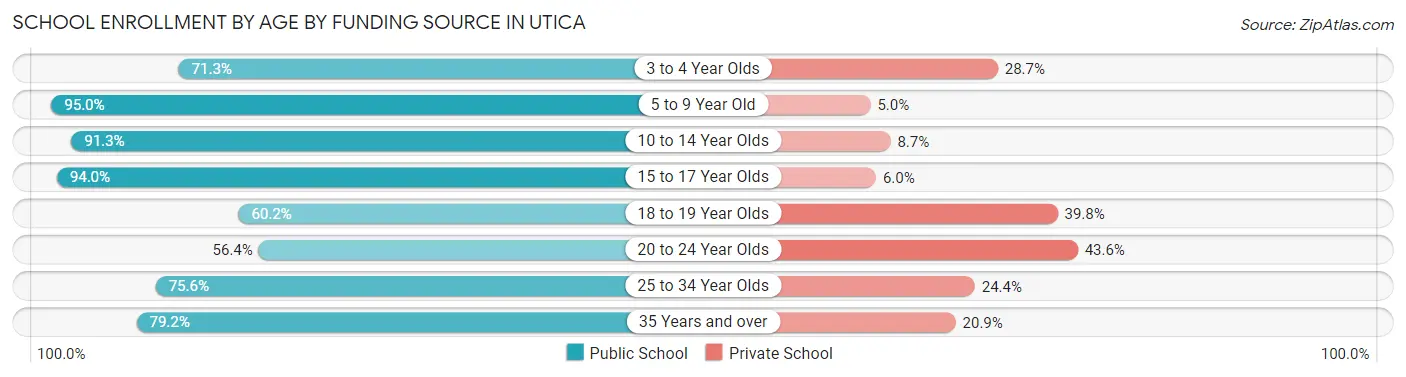
| Age Bracket | Public School | Private School |
| 3 to 4 Year Olds | 487 (71.3%) | 196 (28.7%) |
| 5 to 9 Year Old | 4,019 (95.0%) | 211 (5.0%) |
| 10 to 14 Year Olds | 4,232 (91.3%) | 404 (8.7%) |
| 15 to 17 Year Olds | 2,329 (94.0%) | 149 (6.0%) |
| 18 to 19 Year Olds | 1,161 (60.2%) | 769 (39.8%) |
| 20 to 24 Year Olds | 1,430 (56.4%) | 1,105 (43.6%) |
| 25 to 34 Year Olds | 597 (75.6%) | 193 (24.4%) |
| 35 Years and over | 482 (79.1%) | 127 (20.8%) |
| Total | 14,742 (82.4%) | 3,149 (17.6%) |
Educational Attainment by Field of Study in Utica
Business (1,246 | 13.9%), education (1,205 | 13.4%), science & technology (1,136 | 12.7%), social sciences (717 | 8.0%), and visual & performing arts (641 | 7.1%) are the most common fields of study among 8,976 individuals in Utica who have obtained a bachelor's degree or higher.
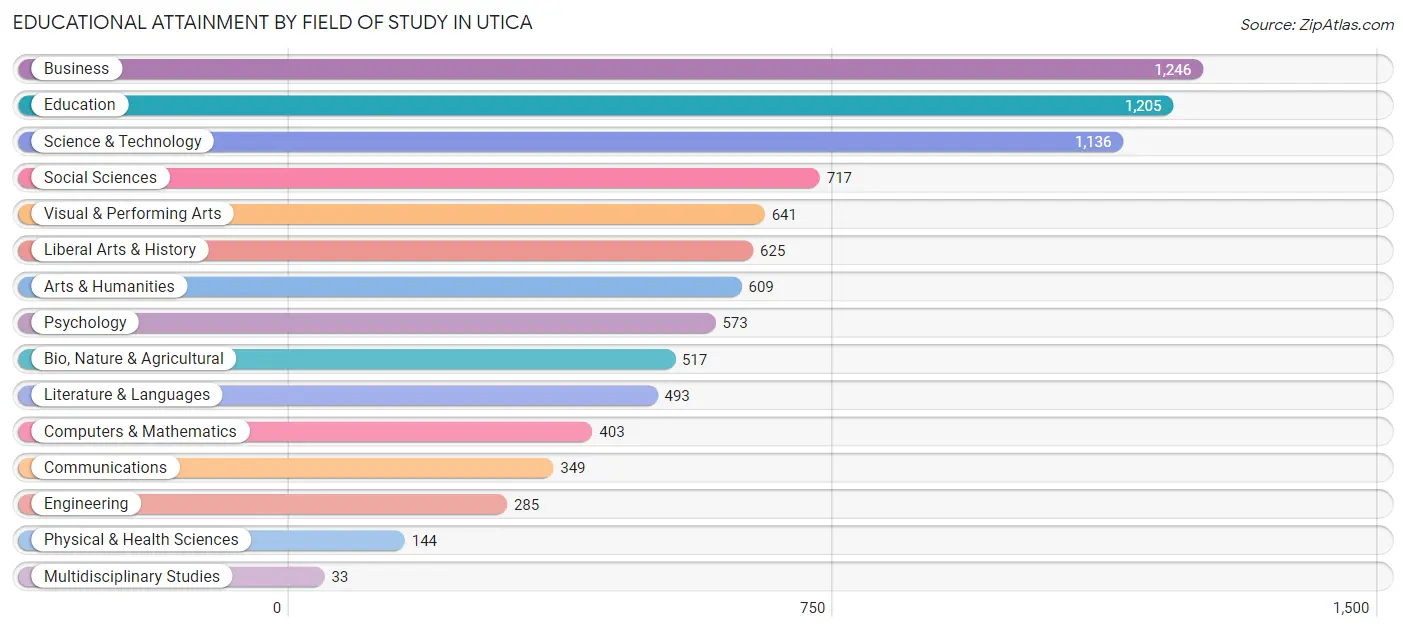
| Field of Study | # Graduates | % Graduates |
| Computers & Mathematics | 403 | 4.5% |
| Bio, Nature & Agricultural | 517 | 5.8% |
| Physical & Health Sciences | 144 | 1.6% |
| Psychology | 573 | 6.4% |
| Social Sciences | 717 | 8.0% |
| Engineering | 285 | 3.2% |
| Multidisciplinary Studies | 33 | 0.4% |
| Science & Technology | 1,136 | 12.7% |
| Business | 1,246 | 13.9% |
| Education | 1,205 | 13.4% |
| Literature & Languages | 493 | 5.5% |
| Liberal Arts & History | 625 | 7.0% |
| Visual & Performing Arts | 641 | 7.1% |
| Communications | 349 | 3.9% |
| Arts & Humanities | 609 | 6.8% |
| Total | 8,976 | 100.0% |
Transportation & Commute in Utica
Vehicle Availability by Sex in Utica
The most prevalent vehicle ownership categories in Utica are males with 2 vehicles (4,929, accounting for 38.1%) and females with 2 vehicles (4,262, making up 42.3%).
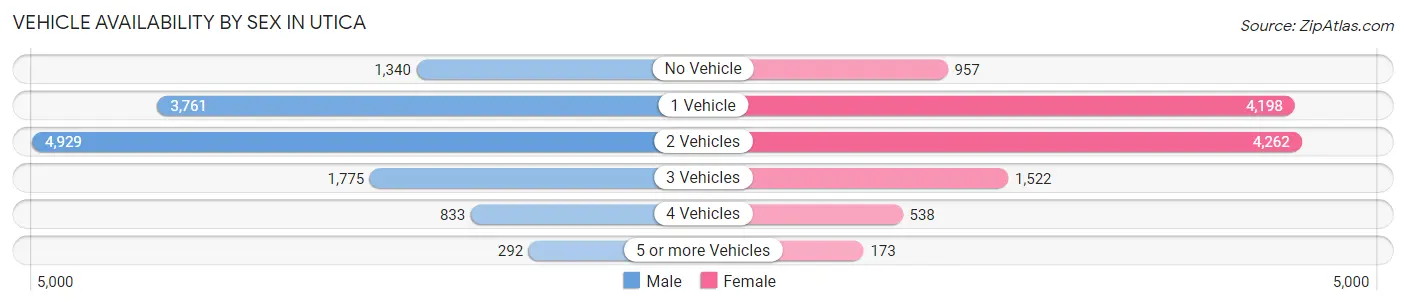
| Vehicles Available | Male | Female |
| No Vehicle | 1,340 (10.4%) | 957 (8.2%) |
| 1 Vehicle | 3,761 (29.1%) | 4,198 (36.0%) |
| 2 Vehicles | 4,929 (38.1%) | 4,262 (36.6%) |
| 3 Vehicles | 1,775 (13.7%) | 1,522 (13.1%) |
| 4 Vehicles | 833 (6.4%) | 538 (4.6%) |
| 5 or more Vehicles | 292 (2.3%) | 173 (1.5%) |
| Total | 12,930 (100.0%) | 11,650 (100.0%) |
Commute Time in Utica
The most frequently occuring commute durations in Utica are 10 to 14 minutes (5,887 commuters, 25.2%), 15 to 19 minutes (4,742 commuters, 20.3%), and 5 to 9 minutes (4,019 commuters, 17.2%).
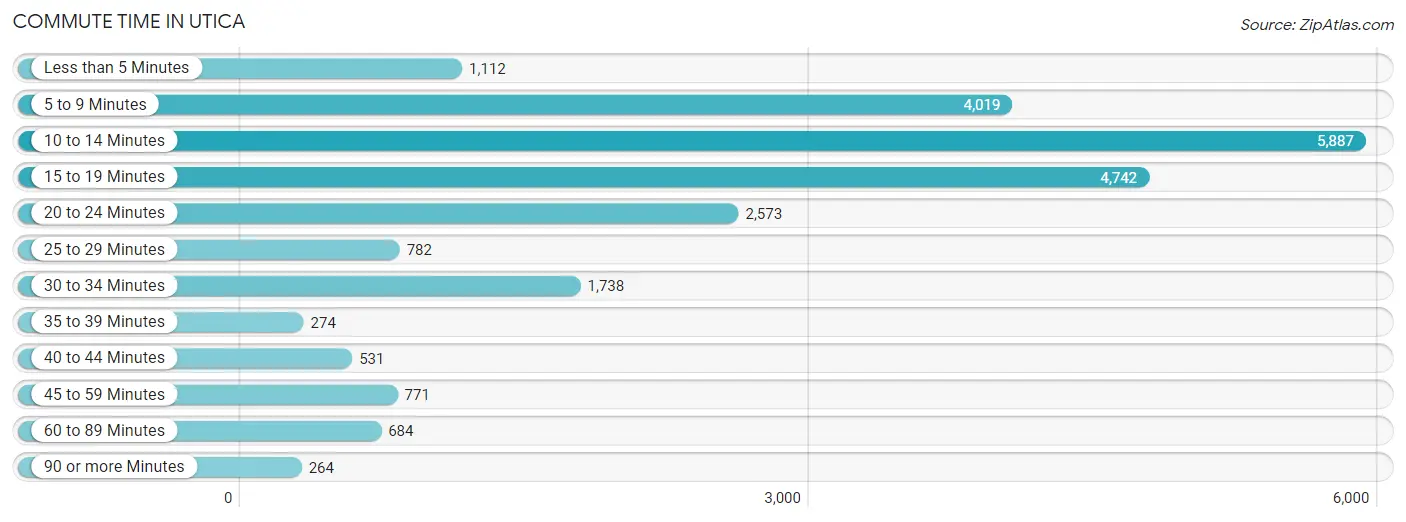
| Commute Time | # Commuters | % Commuters |
| Less than 5 Minutes | 1,112 | 4.8% |
| 5 to 9 Minutes | 4,019 | 17.2% |
| 10 to 14 Minutes | 5,887 | 25.2% |
| 15 to 19 Minutes | 4,742 | 20.3% |
| 20 to 24 Minutes | 2,573 | 11.0% |
| 25 to 29 Minutes | 782 | 3.4% |
| 30 to 34 Minutes | 1,738 | 7.4% |
| 35 to 39 Minutes | 274 | 1.2% |
| 40 to 44 Minutes | 531 | 2.3% |
| 45 to 59 Minutes | 771 | 3.3% |
| 60 to 89 Minutes | 684 | 2.9% |
| 90 or more Minutes | 264 | 1.1% |
Commute Time by Sex in Utica
The most common commute times in Utica are 10 to 14 minutes (3,040 commuters, 24.5%) for males and 10 to 14 minutes (2,847 commuters, 25.9%) for females.
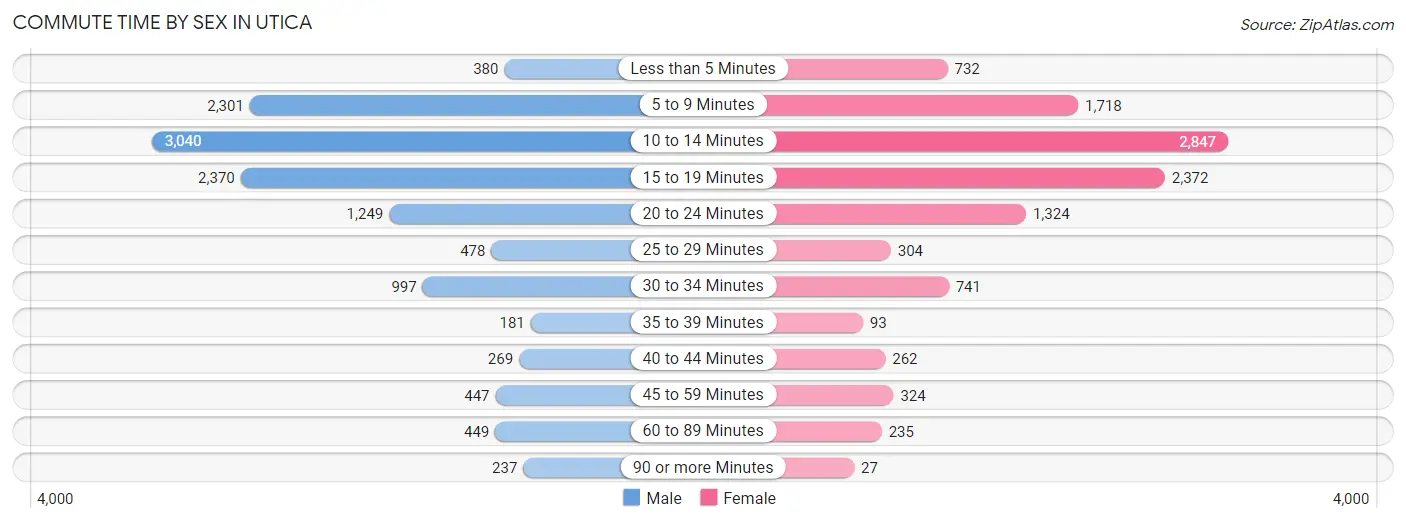
| Commute Time | Male | Female |
| Less than 5 Minutes | 380 (3.1%) | 732 (6.7%) |
| 5 to 9 Minutes | 2,301 (18.6%) | 1,718 (15.7%) |
| 10 to 14 Minutes | 3,040 (24.5%) | 2,847 (25.9%) |
| 15 to 19 Minutes | 2,370 (19.1%) | 2,372 (21.6%) |
| 20 to 24 Minutes | 1,249 (10.1%) | 1,324 (12.1%) |
| 25 to 29 Minutes | 478 (3.9%) | 304 (2.8%) |
| 30 to 34 Minutes | 997 (8.0%) | 741 (6.8%) |
| 35 to 39 Minutes | 181 (1.5%) | 93 (0.9%) |
| 40 to 44 Minutes | 269 (2.2%) | 262 (2.4%) |
| 45 to 59 Minutes | 447 (3.6%) | 324 (2.9%) |
| 60 to 89 Minutes | 449 (3.6%) | 235 (2.1%) |
| 90 or more Minutes | 237 (1.9%) | 27 (0.3%) |
Time of Departure to Work by Sex in Utica
The most frequent times of departure to work in Utica are 12:00 PM to 3:59 PM (1,827, 14.7%) for males and 7:30 AM to 7:59 AM (1,865, 17.0%) for females.
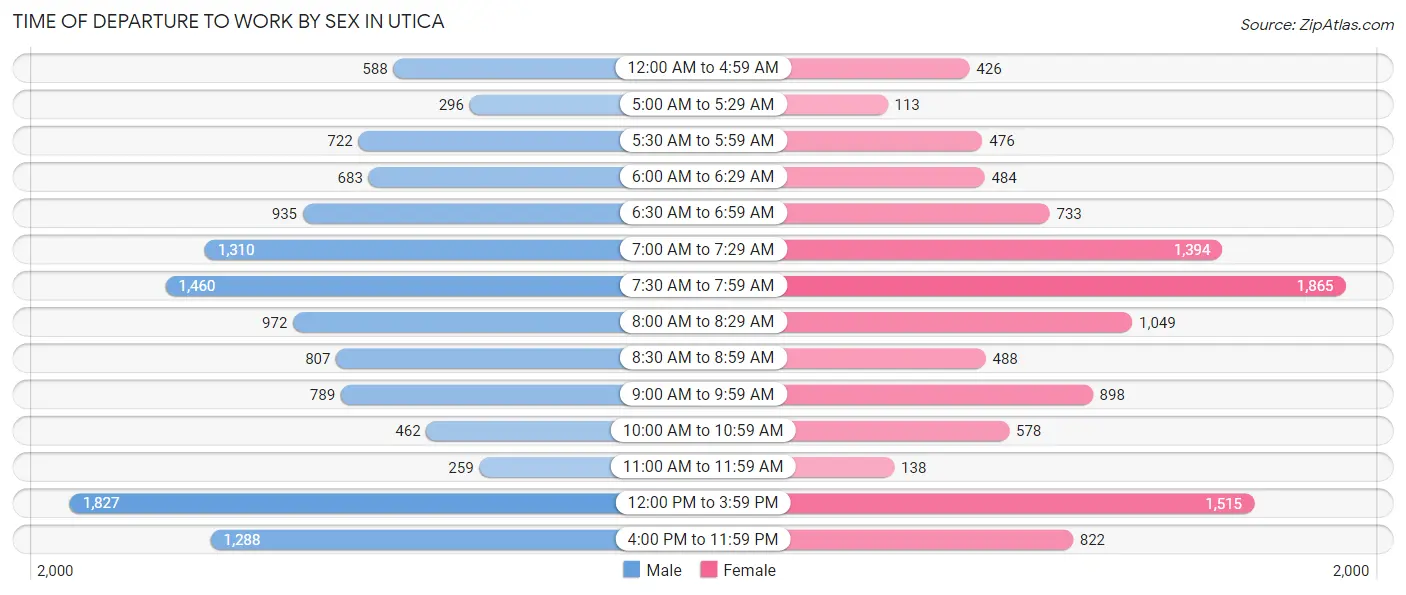
| Time of Departure | Male | Female |
| 12:00 AM to 4:59 AM | 588 (4.7%) | 426 (3.9%) |
| 5:00 AM to 5:29 AM | 296 (2.4%) | 113 (1.0%) |
| 5:30 AM to 5:59 AM | 722 (5.8%) | 476 (4.3%) |
| 6:00 AM to 6:29 AM | 683 (5.5%) | 484 (4.4%) |
| 6:30 AM to 6:59 AM | 935 (7.5%) | 733 (6.7%) |
| 7:00 AM to 7:29 AM | 1,310 (10.6%) | 1,394 (12.7%) |
| 7:30 AM to 7:59 AM | 1,460 (11.8%) | 1,865 (17.0%) |
| 8:00 AM to 8:29 AM | 972 (7.8%) | 1,049 (9.6%) |
| 8:30 AM to 8:59 AM | 807 (6.5%) | 488 (4.4%) |
| 9:00 AM to 9:59 AM | 789 (6.4%) | 898 (8.2%) |
| 10:00 AM to 10:59 AM | 462 (3.7%) | 578 (5.3%) |
| 11:00 AM to 11:59 AM | 259 (2.1%) | 138 (1.3%) |
| 12:00 PM to 3:59 PM | 1,827 (14.7%) | 1,515 (13.8%) |
| 4:00 PM to 11:59 PM | 1,288 (10.4%) | 822 (7.5%) |
| Total | 12,398 (100.0%) | 10,979 (100.0%) |
Housing Occupancy in Utica
Occupancy by Ownership in Utica
Of the total 24,617 dwellings in Utica, owner-occupied units account for 12,163 (49.4%), while renter-occupied units make up 12,454 (50.6%).
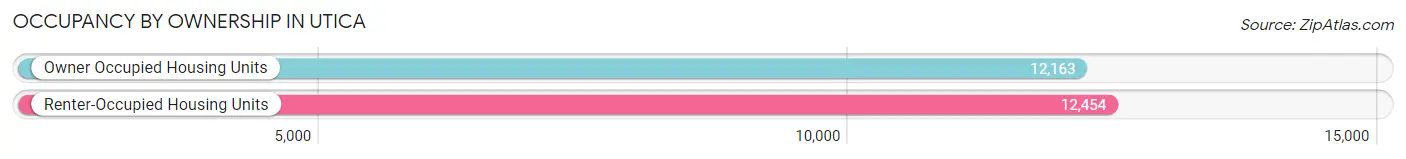
| Occupancy | # Housing Units | % Housing Units |
| Owner Occupied Housing Units | 12,163 | 49.4% |
| Renter-Occupied Housing Units | 12,454 | 50.6% |
| Total Occupied Housing Units | 24,617 | 100.0% |
Occupancy by Household Size in Utica
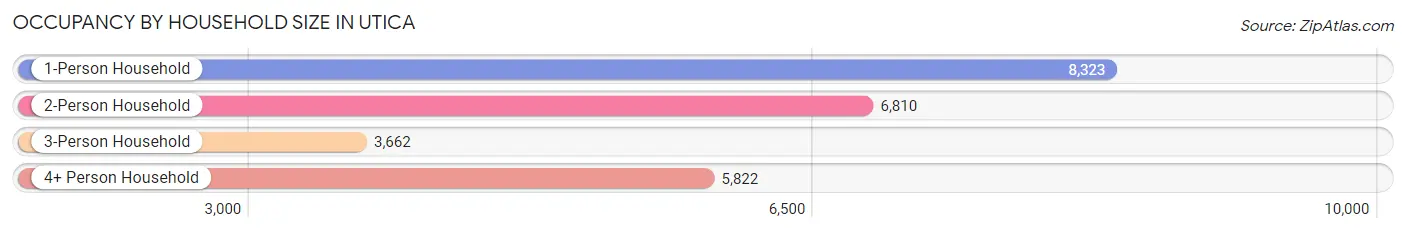
| Household Size | # Housing Units | % Housing Units |
| 1-Person Household | 8,323 | 33.8% |
| 2-Person Household | 6,810 | 27.7% |
| 3-Person Household | 3,662 | 14.9% |
| 4+ Person Household | 5,822 | 23.6% |
| Total Housing Units | 24,617 | 100.0% |
Occupancy by Ownership by Household Size in Utica
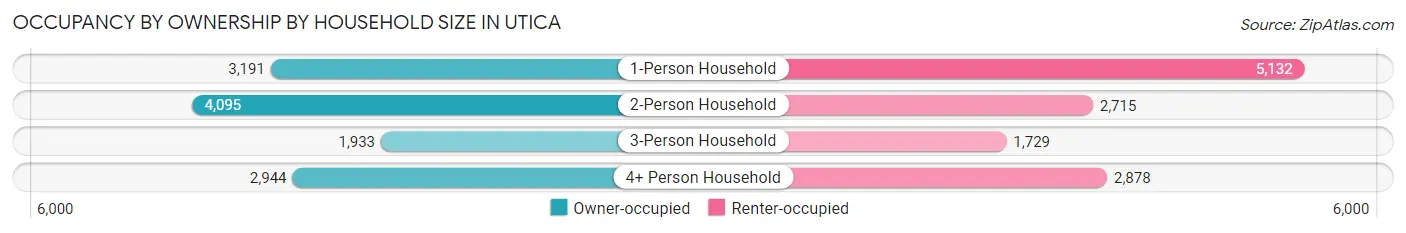
| Household Size | Owner-occupied | Renter-occupied |
| 1-Person Household | 3,191 (38.3%) | 5,132 (61.7%) |
| 2-Person Household | 4,095 (60.1%) | 2,715 (39.9%) |
| 3-Person Household | 1,933 (52.8%) | 1,729 (47.2%) |
| 4+ Person Household | 2,944 (50.6%) | 2,878 (49.4%) |
| Total Housing Units | 12,163 (49.4%) | 12,454 (50.6%) |
Occupancy by Educational Attainment in Utica
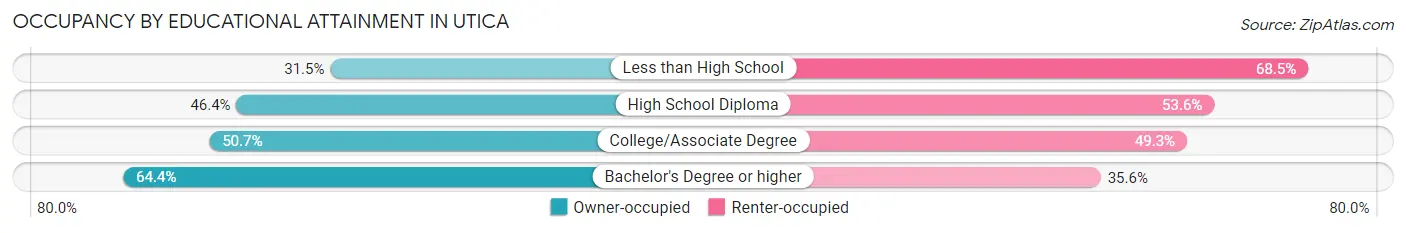
| Household Size | Owner-occupied | Renter-occupied |
| Less than High School | 1,312 (31.5%) | 2,852 (68.5%) |
| High School Diploma | 3,176 (46.4%) | 3,669 (53.6%) |
| College/Associate Degree | 4,027 (50.7%) | 3,915 (49.3%) |
| Bachelor's Degree or higher | 3,648 (64.4%) | 2,018 (35.6%) |
Occupancy by Age of Householder in Utica
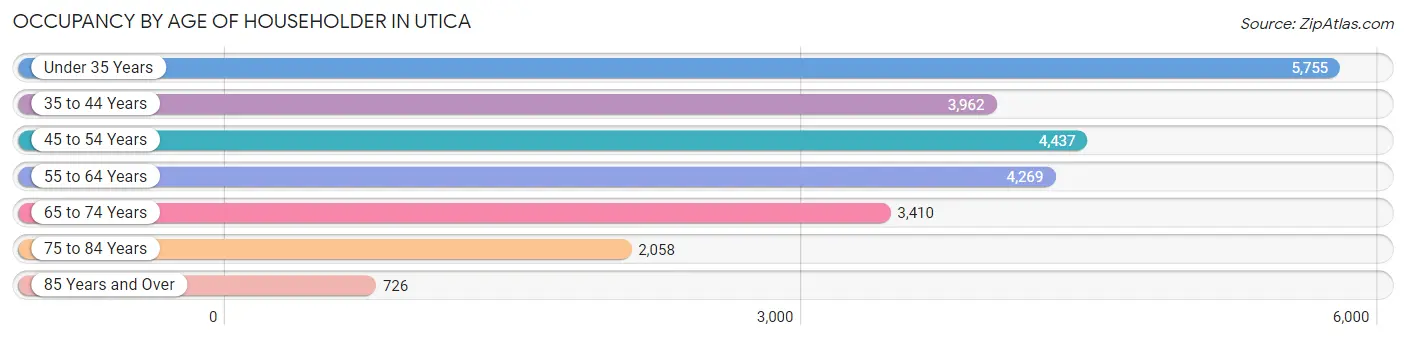
| Age Bracket | # Households | % Households |
| Under 35 Years | 5,755 | 23.4% |
| 35 to 44 Years | 3,962 | 16.1% |
| 45 to 54 Years | 4,437 | 18.0% |
| 55 to 64 Years | 4,269 | 17.3% |
| 65 to 74 Years | 3,410 | 13.9% |
| 75 to 84 Years | 2,058 | 8.4% |
| 85 Years and Over | 726 | 2.9% |
| Total | 24,617 | 100.0% |
Housing Finances in Utica
Median Income by Occupancy in Utica
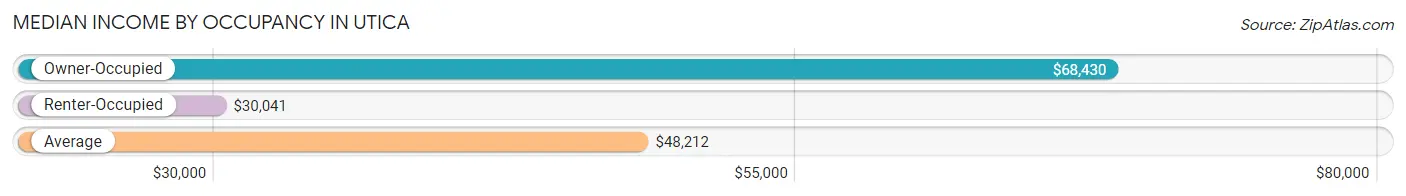
| Occupancy Type | # Households | Median Income |
| Owner-Occupied | 12,163 (49.4%) | $68,430 |
| Renter-Occupied | 12,454 (50.6%) | $30,041 |
| Average | 24,617 (100.0%) | $48,212 |
Occupancy by Householder Income Bracket in Utica
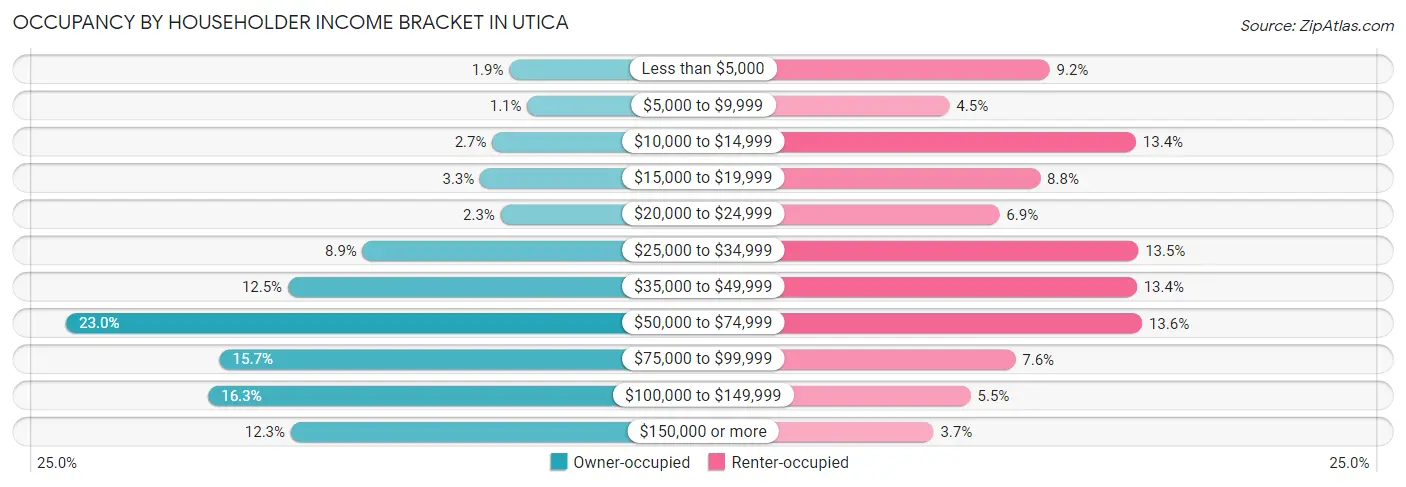
| Income Bracket | Owner-occupied | Renter-occupied |
| Less than $5,000 | 233 (1.9%) | 1,151 (9.2%) |
| $5,000 to $9,999 | 129 (1.1%) | 557 (4.5%) |
| $10,000 to $14,999 | 332 (2.7%) | 1,663 (13.4%) |
| $15,000 to $19,999 | 403 (3.3%) | 1,095 (8.8%) |
| $20,000 to $24,999 | 283 (2.3%) | 853 (6.9%) |
| $25,000 to $34,999 | 1,082 (8.9%) | 1,676 (13.5%) |
| $35,000 to $49,999 | 1,515 (12.5%) | 1,667 (13.4%) |
| $50,000 to $74,999 | 2,800 (23.0%) | 1,699 (13.6%) |
| $75,000 to $99,999 | 1,911 (15.7%) | 948 (7.6%) |
| $100,000 to $149,999 | 1,977 (16.3%) | 683 (5.5%) |
| $150,000 or more | 1,498 (12.3%) | 462 (3.7%) |
| Total | 12,163 (100.0%) | 12,454 (100.0%) |
Monthly Housing Cost Tiers in Utica
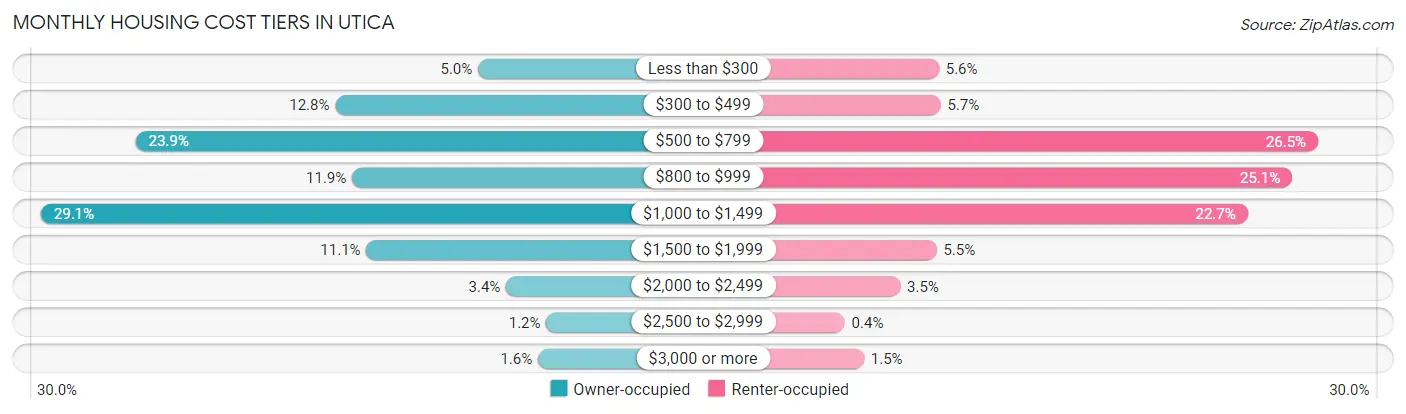
| Monthly Cost | Owner-occupied | Renter-occupied |
| Less than $300 | 602 (5.0%) | 698 (5.6%) |
| $300 to $499 | 1,562 (12.8%) | 709 (5.7%) |
| $500 to $799 | 2,903 (23.9%) | 3,305 (26.5%) |
| $800 to $999 | 1,449 (11.9%) | 3,127 (25.1%) |
| $1,000 to $1,499 | 3,539 (29.1%) | 2,821 (22.7%) |
| $1,500 to $1,999 | 1,352 (11.1%) | 681 (5.5%) |
| $2,000 to $2,499 | 413 (3.4%) | 431 (3.5%) |
| $2,500 to $2,999 | 143 (1.2%) | 50 (0.4%) |
| $3,000 or more | 200 (1.6%) | 182 (1.5%) |
| Total | 12,163 (100.0%) | 12,454 (100.0%) |
Physical Housing Characteristics in Utica
Housing Structures in Utica
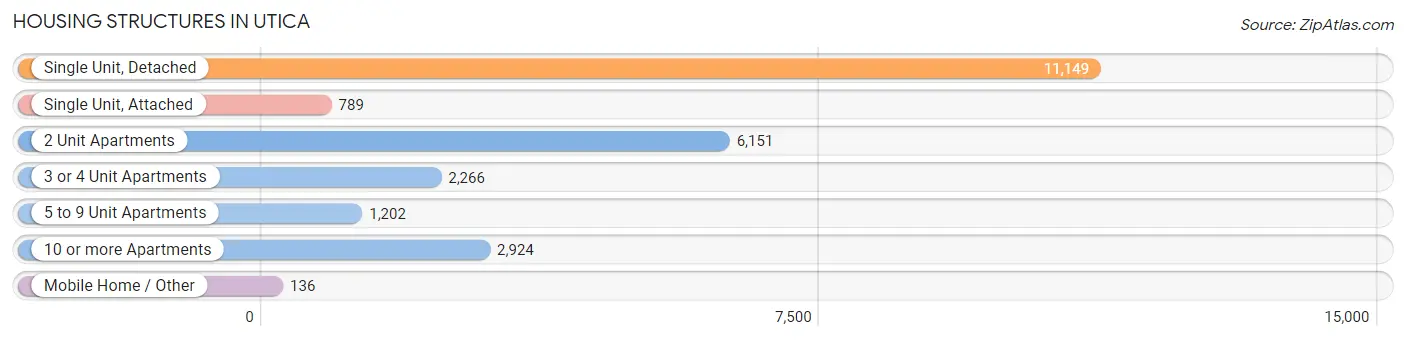
| Structure Type | # Housing Units | % Housing Units |
| Single Unit, Detached | 11,149 | 45.3% |
| Single Unit, Attached | 789 | 3.2% |
| 2 Unit Apartments | 6,151 | 25.0% |
| 3 or 4 Unit Apartments | 2,266 | 9.2% |
| 5 to 9 Unit Apartments | 1,202 | 4.9% |
| 10 or more Apartments | 2,924 | 11.9% |
| Mobile Home / Other | 136 | 0.5% |
| Total | 24,617 | 100.0% |
Housing Structures by Occupancy in Utica
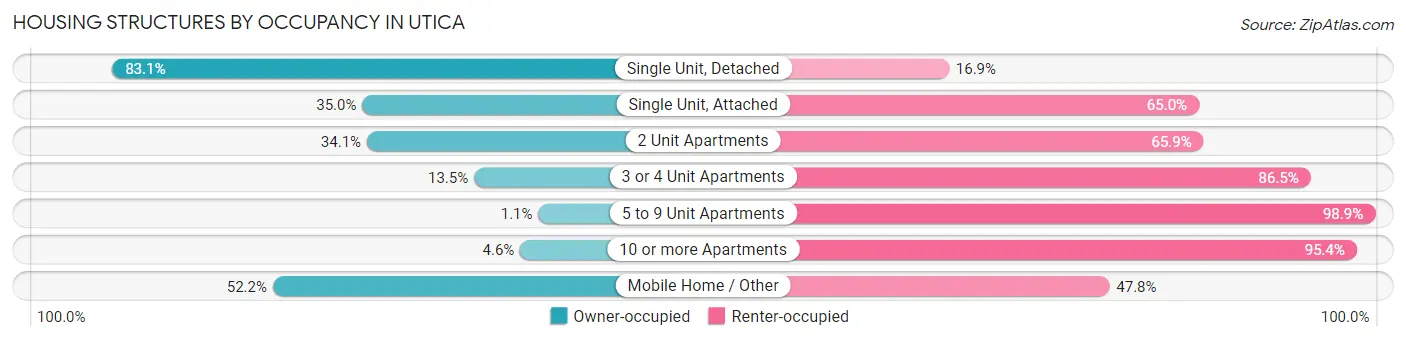
| Structure Type | Owner-occupied | Renter-occupied |
| Single Unit, Detached | 9,267 (83.1%) | 1,882 (16.9%) |
| Single Unit, Attached | 276 (35.0%) | 513 (65.0%) |
| 2 Unit Apartments | 2,097 (34.1%) | 4,054 (65.9%) |
| 3 or 4 Unit Apartments | 305 (13.5%) | 1,961 (86.5%) |
| 5 to 9 Unit Apartments | 13 (1.1%) | 1,189 (98.9%) |
| 10 or more Apartments | 134 (4.6%) | 2,790 (95.4%) |
| Mobile Home / Other | 71 (52.2%) | 65 (47.8%) |
| Total | 12,163 (49.4%) | 12,454 (50.6%) |
Housing Structures by Number of Rooms in Utica
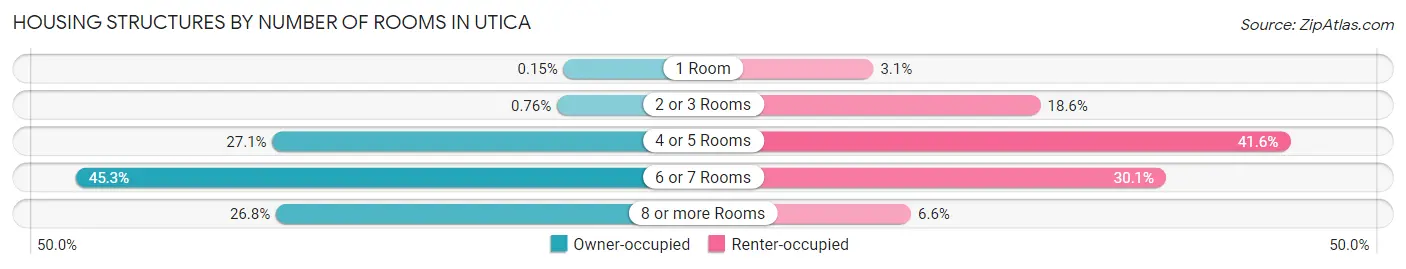
| Number of Rooms | Owner-occupied | Renter-occupied |
| 1 Room | 18 (0.2%) | 386 (3.1%) |
| 2 or 3 Rooms | 93 (0.8%) | 2,311 (18.6%) |
| 4 or 5 Rooms | 3,294 (27.1%) | 5,183 (41.6%) |
| 6 or 7 Rooms | 5,505 (45.3%) | 3,754 (30.1%) |
| 8 or more Rooms | 3,253 (26.8%) | 820 (6.6%) |
| Total | 12,163 (100.0%) | 12,454 (100.0%) |
Housing Structure by Heating Type in Utica
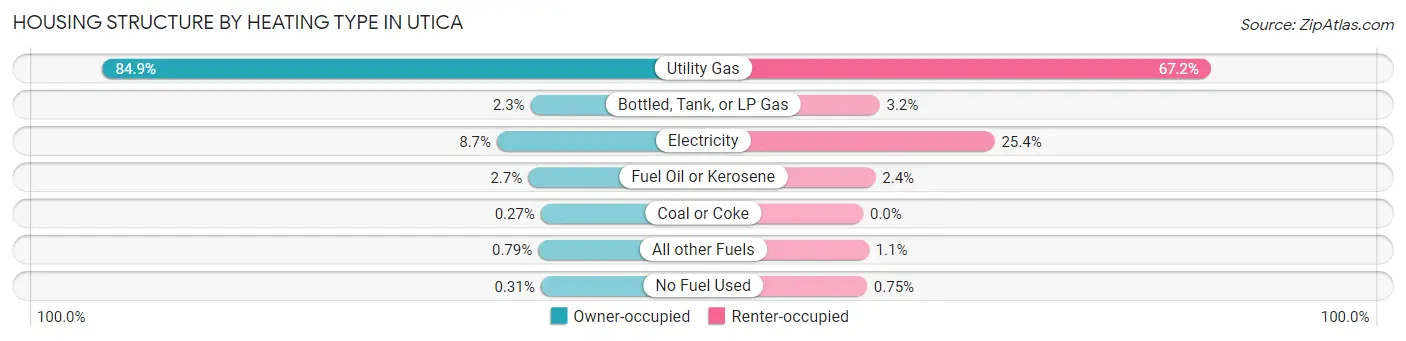
| Heating Type | Owner-occupied | Renter-occupied |
| Utility Gas | 10,328 (84.9%) | 8,368 (67.2%) |
| Bottled, Tank, or LP Gas | 274 (2.2%) | 397 (3.2%) |
| Electricity | 1,063 (8.7%) | 3,163 (25.4%) |
| Fuel Oil or Kerosene | 331 (2.7%) | 297 (2.4%) |
| Coal or Coke | 33 (0.3%) | 0 (0.0%) |
| All other Fuels | 96 (0.8%) | 136 (1.1%) |
| No Fuel Used | 38 (0.3%) | 93 (0.7%) |
| Total | 12,163 (100.0%) | 12,454 (100.0%) |
Household Vehicle Usage in Utica
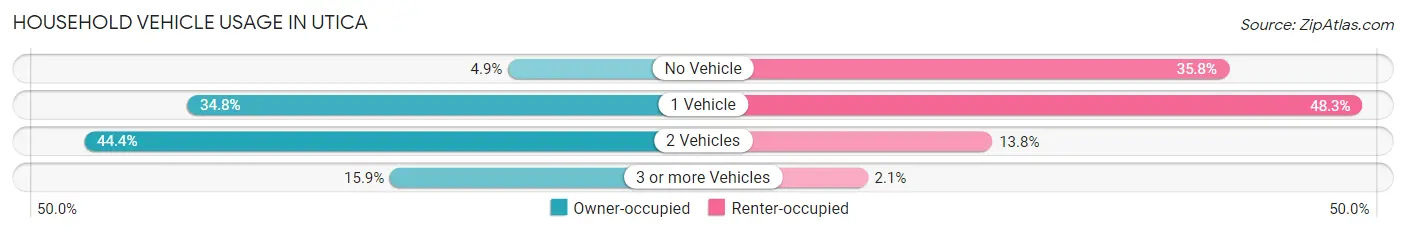
| Vehicles per Household | Owner-occupied | Renter-occupied |
| No Vehicle | 591 (4.9%) | 4,462 (35.8%) |
| 1 Vehicle | 4,235 (34.8%) | 6,015 (48.3%) |
| 2 Vehicles | 5,405 (44.4%) | 1,713 (13.8%) |
| 3 or more Vehicles | 1,932 (15.9%) | 264 (2.1%) |
| Total | 12,163 (100.0%) | 12,454 (100.0%) |
Real Estate & Mortgages in Utica
Real Estate and Mortgage Overview in Utica
| Characteristic | Without Mortgage | With Mortgage |
| Housing Units | 5,783 | 6,380 |
| Median Property Value | $114,400 | $133,200 |
| Median Household Income | $56,518 | $1,065 |
| Monthly Housing Costs | $567 | $175 |
| Real Estate Taxes | $2,673 | $356 |
Property Value by Mortgage Status in Utica
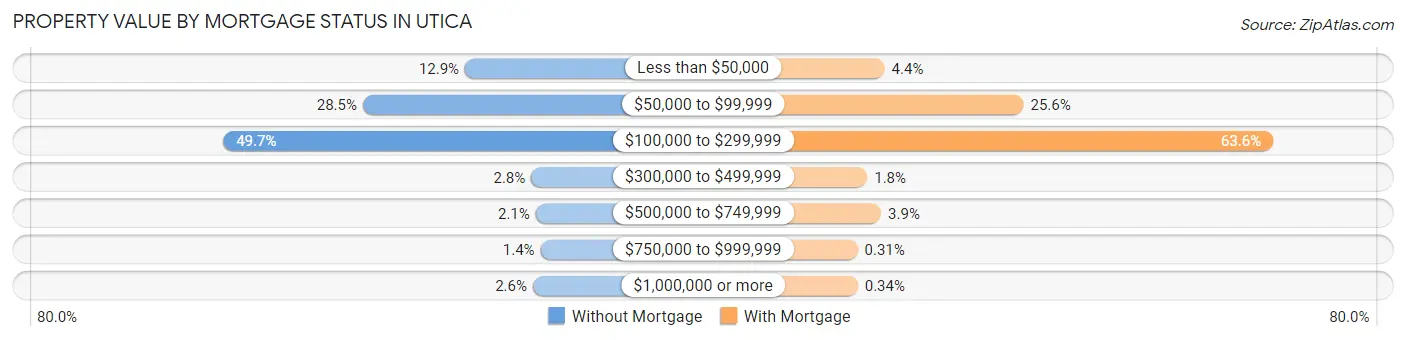
| Property Value | Without Mortgage | With Mortgage |
| Less than $50,000 | 746 (12.9%) | 283 (4.4%) |
| $50,000 to $99,999 | 1,646 (28.5%) | 1,633 (25.6%) |
| $100,000 to $299,999 | 2,876 (49.7%) | 4,059 (63.6%) |
| $300,000 to $499,999 | 163 (2.8%) | 114 (1.8%) |
| $500,000 to $749,999 | 123 (2.1%) | 249 (3.9%) |
| $750,000 to $999,999 | 81 (1.4%) | 20 (0.3%) |
| $1,000,000 or more | 148 (2.6%) | 22 (0.3%) |
| Total | 5,783 (100.0%) | 6,380 (100.0%) |
Household Income by Mortgage Status in Utica
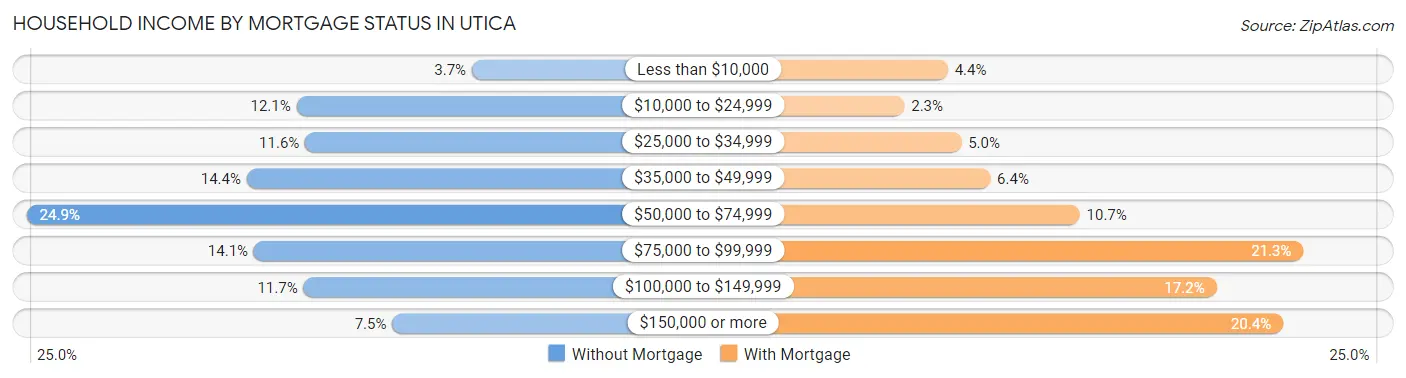
| Household Income | Without Mortgage | With Mortgage |
| Less than $10,000 | 214 (3.7%) | 280 (4.4%) |
| $10,000 to $24,999 | 697 (12.0%) | 148 (2.3%) |
| $25,000 to $34,999 | 673 (11.6%) | 321 (5.0%) |
| $35,000 to $49,999 | 834 (14.4%) | 409 (6.4%) |
| $50,000 to $74,999 | 1,440 (24.9%) | 681 (10.7%) |
| $75,000 to $99,999 | 814 (14.1%) | 1,360 (21.3%) |
| $100,000 to $149,999 | 678 (11.7%) | 1,097 (17.2%) |
| $150,000 or more | 433 (7.5%) | 1,299 (20.4%) |
| Total | 5,783 (100.0%) | 6,380 (100.0%) |
Property Value to Household Income Ratio in Utica
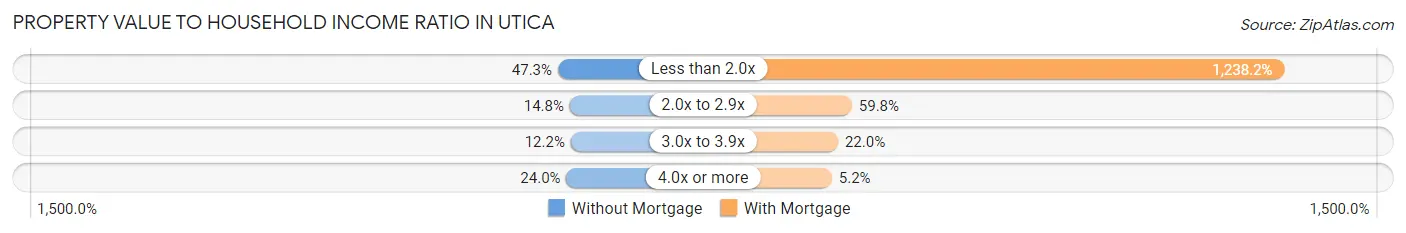
| Value-to-Income Ratio | Without Mortgage | With Mortgage |
| Less than 2.0x | 2,734 (47.3%) | 78,995 (1,238.2%) |
| 2.0x to 2.9x | 856 (14.8%) | 3,816 (59.8%) |
| 3.0x to 3.9x | 707 (12.2%) | 1,404 (22.0%) |
| 4.0x or more | 1,389 (24.0%) | 333 (5.2%) |
| Total | 5,783 (100.0%) | 6,380 (100.0%) |
Real Estate Taxes by Mortgage Status in Utica
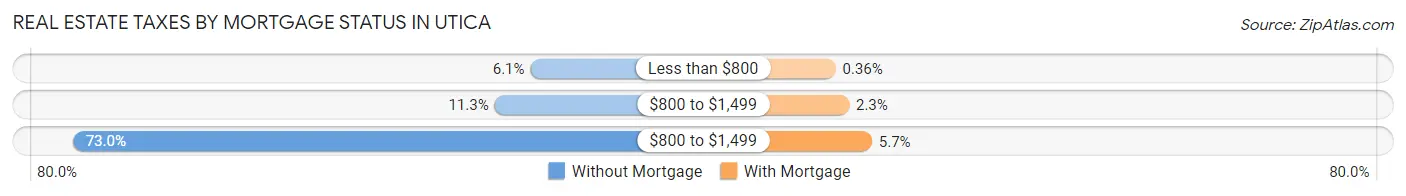
| Property Taxes | Without Mortgage | With Mortgage |
| Less than $800 | 353 (6.1%) | 23 (0.4%) |
| $800 to $1,499 | 655 (11.3%) | 149 (2.3%) |
| $800 to $1,499 | 4,219 (73.0%) | 362 (5.7%) |
| Total | 5,783 (100.0%) | 6,380 (100.0%) |
Health & Disability in Utica
Health Insurance Coverage by Age in Utica
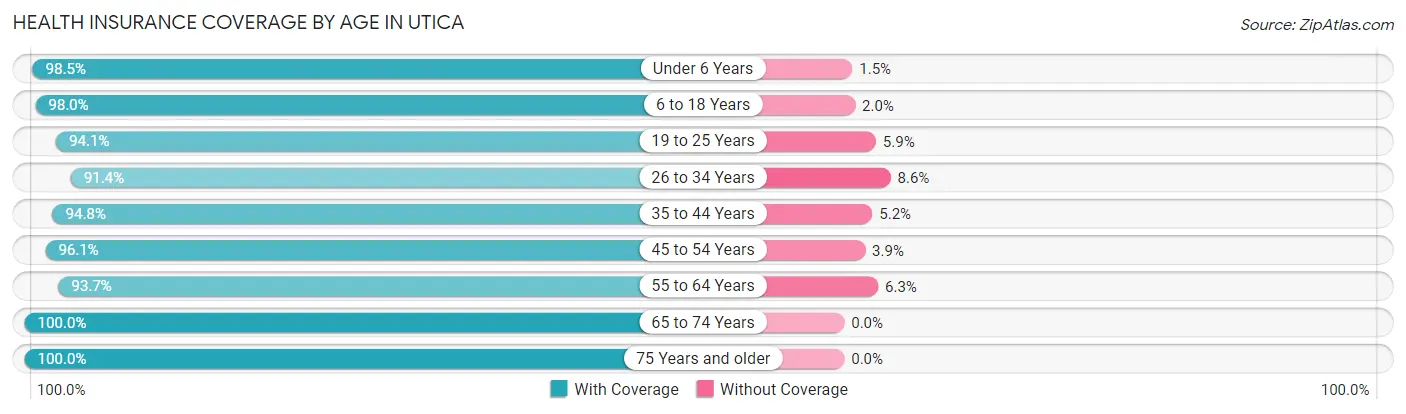
| Age Bracket | With Coverage | Without Coverage |
| Under 6 Years | 5,261 (98.5%) | 80 (1.5%) |
| 6 to 18 Years | 11,827 (98.0%) | 242 (2.0%) |
| 19 to 25 Years | 7,004 (94.1%) | 438 (5.9%) |
| 26 to 34 Years | 7,179 (91.4%) | 678 (8.6%) |
| 35 to 44 Years | 7,263 (94.8%) | 401 (5.2%) |
| 45 to 54 Years | 7,321 (96.1%) | 296 (3.9%) |
| 55 to 64 Years | 6,402 (93.7%) | 431 (6.3%) |
| 65 to 74 Years | 5,184 (100.0%) | 0 (0.0%) |
| 75 Years and older | 3,921 (100.0%) | 0 (0.0%) |
| Total | 61,362 (96.0%) | 2,566 (4.0%) |
Health Insurance Coverage by Citizenship Status in Utica
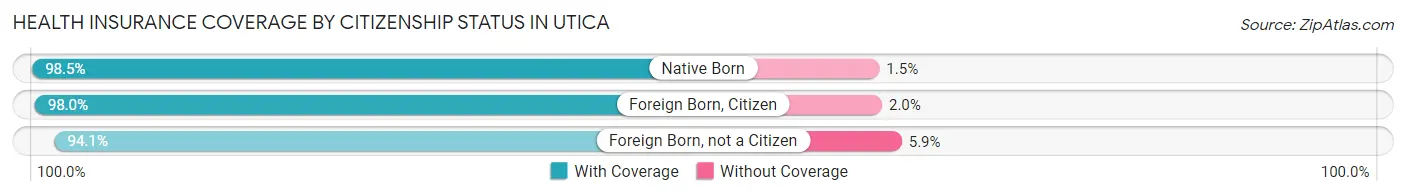
| Citizenship Status | With Coverage | Without Coverage |
| Native Born | 5,261 (98.5%) | 80 (1.5%) |
| Foreign Born, Citizen | 11,827 (98.0%) | 242 (2.0%) |
| Foreign Born, not a Citizen | 7,004 (94.1%) | 438 (5.9%) |
Health Insurance Coverage by Household Income in Utica
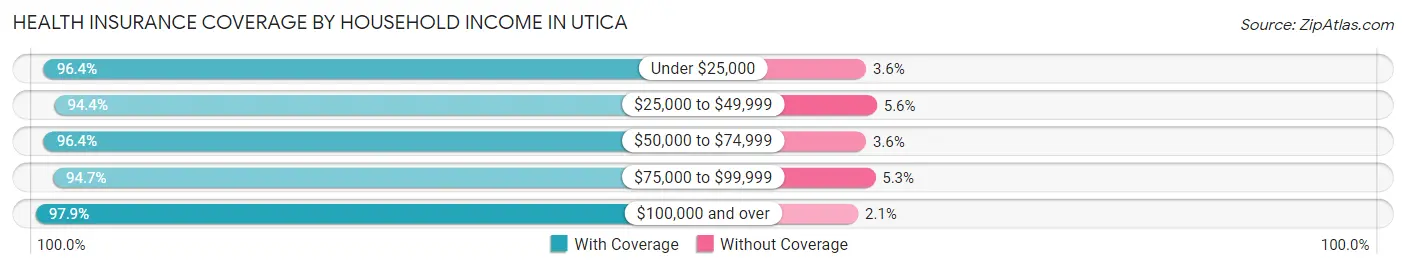
| Household Income | With Coverage | Without Coverage |
| Under $25,000 | 12,898 (96.4%) | 482 (3.6%) |
| $25,000 to $49,999 | 13,357 (94.4%) | 796 (5.6%) |
| $50,000 to $74,999 | 11,649 (96.4%) | 435 (3.6%) |
| $75,000 to $99,999 | 8,053 (94.7%) | 454 (5.3%) |
| $100,000 and over | 13,417 (97.9%) | 291 (2.1%) |
Public vs Private Health Insurance Coverage by Age in Utica
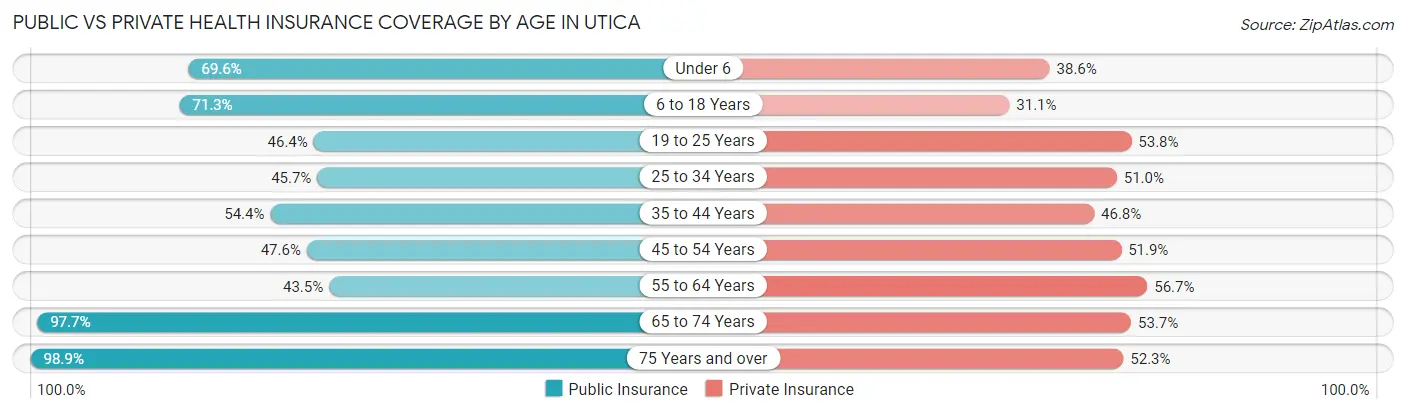
| Age Bracket | Public Insurance | Private Insurance |
| Under 6 | 3,717 (69.6%) | 2,060 (38.6%) |
| 6 to 18 Years | 8,602 (71.3%) | 3,754 (31.1%) |
| 19 to 25 Years | 3,450 (46.4%) | 4,000 (53.7%) |
| 25 to 34 Years | 3,590 (45.7%) | 4,010 (51.0%) |
| 35 to 44 Years | 4,169 (54.4%) | 3,589 (46.8%) |
| 45 to 54 Years | 3,628 (47.6%) | 3,950 (51.9%) |
| 55 to 64 Years | 2,972 (43.5%) | 3,875 (56.7%) |
| 65 to 74 Years | 5,062 (97.7%) | 2,784 (53.7%) |
| 75 Years and over | 3,878 (98.9%) | 2,049 (52.3%) |
| Total | 39,068 (61.1%) | 30,071 (47.0%) |
Disability Status by Sex by Age in Utica
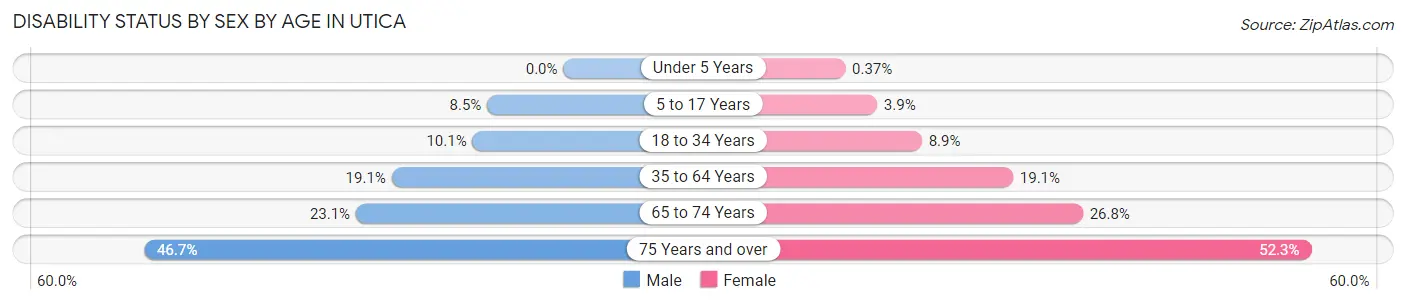
| Age Bracket | Male | Female |
| Under 5 Years | 0 (0.0%) | 8 (0.4%) |
| 5 to 17 Years | 526 (8.5%) | 216 (3.9%) |
| 18 to 34 Years | 857 (10.1%) | 712 (8.9%) |
| 35 to 64 Years | 2,102 (19.1%) | 2,119 (19.1%) |
| 65 to 74 Years | 539 (23.1%) | 765 (26.8%) |
| 75 Years and over | 722 (46.7%) | 1,242 (52.3%) |
Disability Class by Sex by Age in Utica
Disability Class: Hearing Difficulty
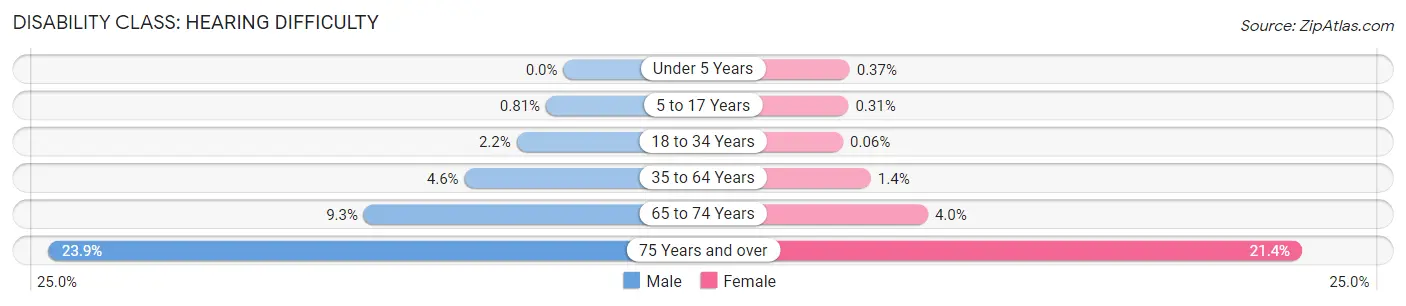
| Age Bracket | Male | Female |
| Under 5 Years | 0 (0.0%) | 8 (0.4%) |
| 5 to 17 Years | 50 (0.8%) | 17 (0.3%) |
| 18 to 34 Years | 184 (2.2%) | 5 (0.1%) |
| 35 to 64 Years | 505 (4.6%) | 150 (1.3%) |
| 65 to 74 Years | 216 (9.3%) | 114 (4.0%) |
| 75 Years and over | 369 (23.9%) | 507 (21.3%) |
Disability Class: Vision Difficulty
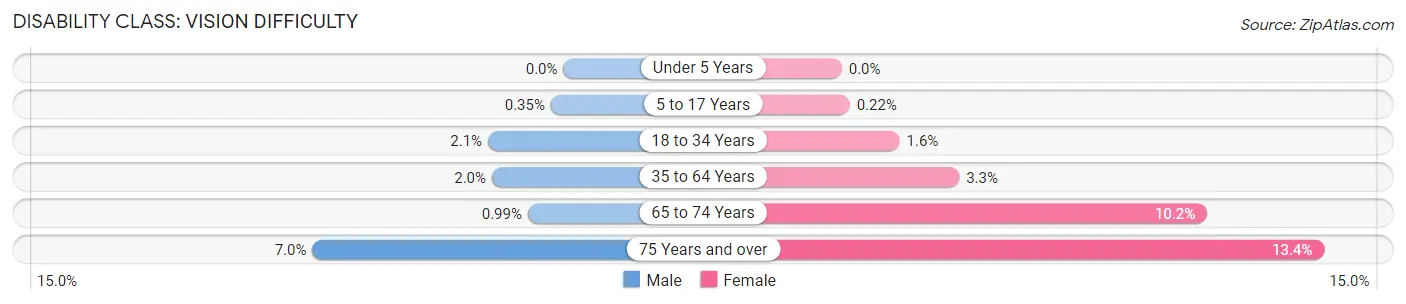
| Age Bracket | Male | Female |
| Under 5 Years | 0 (0.0%) | 0 (0.0%) |
| 5 to 17 Years | 22 (0.4%) | 12 (0.2%) |
| 18 to 34 Years | 178 (2.1%) | 129 (1.6%) |
| 35 to 64 Years | 219 (2.0%) | 364 (3.3%) |
| 65 to 74 Years | 23 (1.0%) | 290 (10.2%) |
| 75 Years and over | 108 (7.0%) | 319 (13.4%) |
Disability Class: Cognitive Difficulty
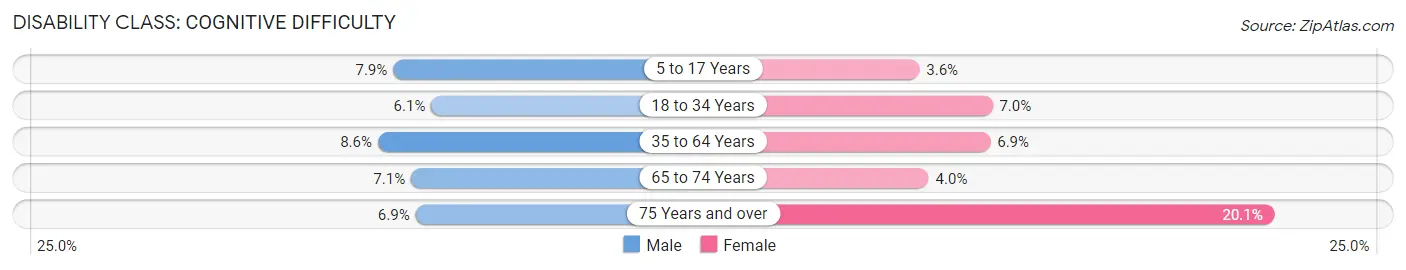
| Age Bracket | Male | Female |
| 5 to 17 Years | 490 (7.9%) | 199 (3.6%) |
| 18 to 34 Years | 519 (6.1%) | 559 (7.0%) |
| 35 to 64 Years | 946 (8.6%) | 766 (6.9%) |
| 65 to 74 Years | 165 (7.1%) | 115 (4.0%) |
| 75 Years and over | 106 (6.9%) | 477 (20.1%) |
Disability Class: Ambulatory Difficulty
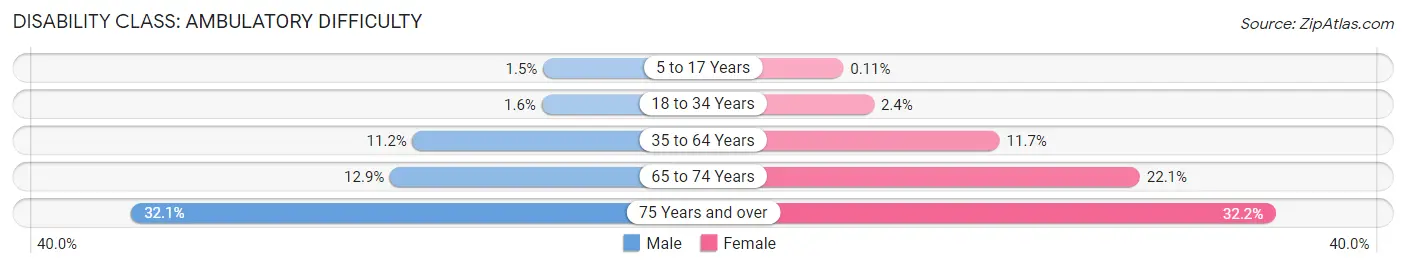
| Age Bracket | Male | Female |
| 5 to 17 Years | 93 (1.5%) | 6 (0.1%) |
| 18 to 34 Years | 136 (1.6%) | 191 (2.4%) |
| 35 to 64 Years | 1,230 (11.2%) | 1,304 (11.7%) |
| 65 to 74 Years | 300 (12.9%) | 631 (22.1%) |
| 75 Years and over | 496 (32.1%) | 764 (32.2%) |
Disability Class: Self-Care Difficulty
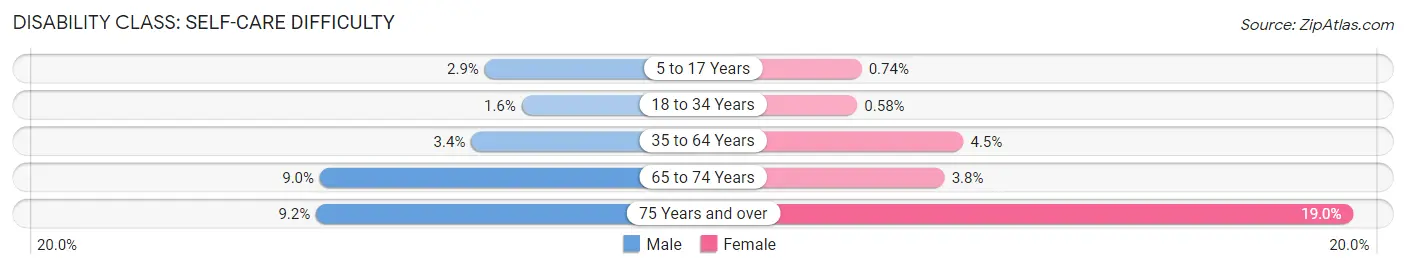
| Age Bracket | Male | Female |
| 5 to 17 Years | 181 (2.9%) | 41 (0.7%) |
| 18 to 34 Years | 131 (1.5%) | 46 (0.6%) |
| 35 to 64 Years | 376 (3.4%) | 503 (4.5%) |
| 65 to 74 Years | 211 (9.0%) | 109 (3.8%) |
| 75 Years and over | 142 (9.2%) | 451 (19.0%) |
Technology Access in Utica
Computing Device Access in Utica
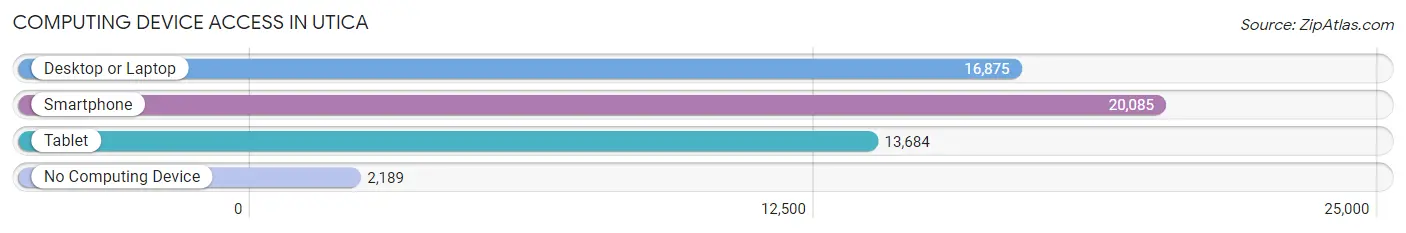
| Device Type | # Households | % Households |
| Desktop or Laptop | 16,875 | 68.5% |
| Smartphone | 20,085 | 81.6% |
| Tablet | 13,684 | 55.6% |
| No Computing Device | 2,189 | 8.9% |
| Total | 24,617 | 100.0% |
Internet Access in Utica
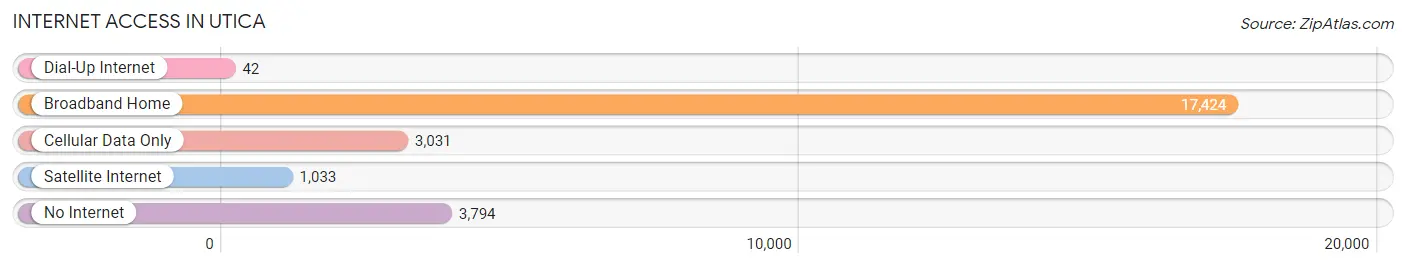
| Internet Type | # Households | % Households |
| Dial-Up Internet | 42 | 0.2% |
| Broadband Home | 17,424 | 70.8% |
| Cellular Data Only | 3,031 | 12.3% |
| Satellite Internet | 1,033 | 4.2% |
| No Internet | 3,794 | 15.4% |
| Total | 24,617 | 100.0% |
Utica Summary
Utica, New York is a city located in the Mohawk Valley region of the state of New York. It is the county seat of Oneida County and the tenth-largest city in the state. Utica is located in the foothills of the Adirondack Mountains and is approximately 90 miles east of Syracuse and 200 miles northwest of New York City. The city has a population of 62,235 as of the 2010 census, making it the tenth-largest city in the state.
History
Utica was first settled in 1758 by a group of German Palatines who were fleeing religious persecution in their homeland. The settlement was originally known as Old Fort Schuyler, and was later renamed Utica in 1798. The city was incorporated in 1832 and quickly became an important industrial center in the region. Utica was the site of the first cotton mill in the state, and the city was home to several major manufacturing companies, including the Utica Cutlery Company, the Utica Steam Engine Company, and the Utica Knitting Mills.
The city was also an important transportation hub in the 19th century, with the Erie Canal and the New York Central Railroad both running through the city. Utica was also the site of the first interurban railway in the United States, which connected the city to nearby Rome.
In the 20th century, Utica experienced a period of decline as the city’s manufacturing base declined. The city’s population peaked in 1950 at over 100,000, but has since declined to its current population of 62,235.
Geography
Utica is located in the Mohawk Valley region of New York, in the foothills of the Adirondack Mountains. The city is situated on the Mohawk River, which flows through the city from north to south. The city is located approximately 90 miles east of Syracuse and 200 miles northwest of New York City.
The city has a total area of 16.2 square miles, of which 15.9 square miles is land and 0.3 square miles is water. The city is located at an elevation of 830 feet above sea level.
Economy
Utica’s economy is largely based on manufacturing and healthcare. The city is home to several major manufacturing companies, including the Utica Cutlery Company, the Utica Steam Engine Company, and the Utica Knitting Mills. The city is also home to several healthcare providers, including Faxton-St. Luke’s Healthcare, St. Elizabeth Medical Center, and the Mohawk Valley Health System.
The city is also home to several educational institutions, including Utica College, Mohawk Valley Community College, and SUNY Polytechnic Institute.
Demographics
As of the 2010 census, Utica had a population of 62,235. The racial makeup of the city was 79.2% White, 11.3% African American, 0.3% Native American, 2.2% Asian, 0.1% Pacific Islander, 4.2% from other races, and 2.9% from two or more races. Hispanic or Latino of any race were 8.7% of the population.
The median income for a household in the city was $33,902, and the median income for a family was $41,945. The per capita income for the city was $19,845. About 17.2% of the population was below the poverty line.
Common Questions
What is the Total Population of Utica?
Total Population of Utica is 64,728.
What is the Total Male Population of Utica?
Total Male Population of Utica is 32,231.
What is the Total Female Population of Utica?
Total Female Population of Utica is 32,497.
What is the Ratio of Males per 100 Females in Utica?
There are 99.18 Males per 100 Females in Utica.
What is the Ratio of Females per 100 Males in Utica?
There are 100.83 Females per 100 Males in Utica.
What is the Median Population Age in Utica?
Median Population Age in Utica is 34.5 Years.
What is the Average Family Size in Utica
Average Family Size in Utica is 3.3 People.
What is the Average Household Size in Utica
Average Household Size in Utica is 2.5 People.
What is Per Capita Income in Utica?
Per Capita income in Utica is $25,622.
What is the Median Family Income in Utica?
Median Family Income in Utica is $56,924.
What is the Median Household income in Utica?
Median Household Income in Utica is $48,212.
What is Income or Wage Gap in Utica?
Income or Wage Gap in Utica is 22.9%.
Women in Utica earn 77.1 cents for every dollar earned by a man.
What is Family Income Deficit in Utica?
Family Income Deficit in Utica is $12,614.
Families that are below poverty line in Utica earn $12,614 less on average than the poverty threshold level.
What is Inequality or Gini Index in Utica?
Inequality or Gini Index in Utica is 0.48.
How Large is the Labor Force in Utica?
There are 27,882 People in the Labor Forcein in Utica.
What is the Percentage of People in the Labor Force in Utica?
55.7% of People are in the Labor Force in Utica.
What is the Unemployment Rate in Utica?
Unemployment Rate in Utica is 7.0%.