University Gardens, NY
University Gardens Map
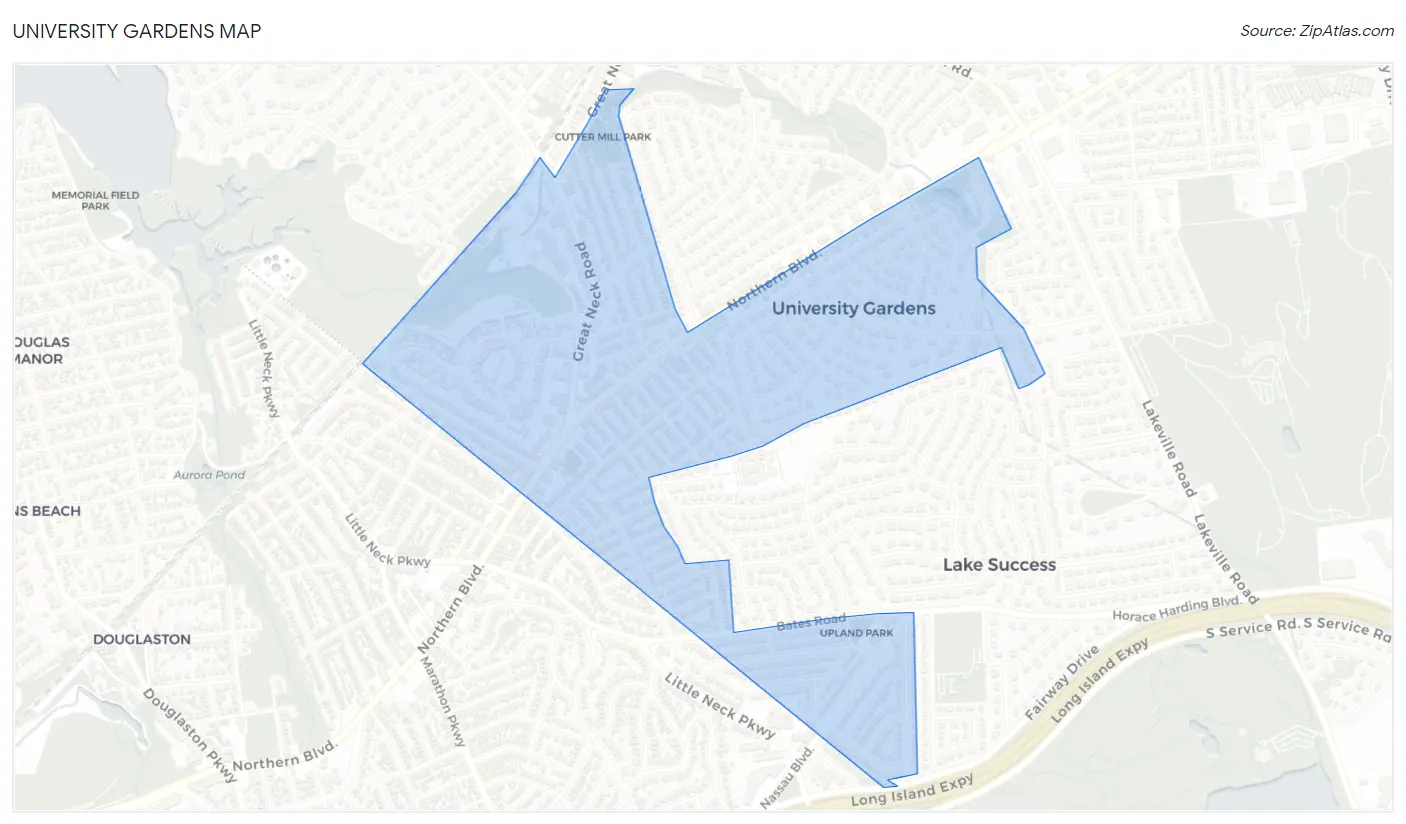
University Gardens Overview
4,171
TOTAL POPULATION
1,928
MALE POPULATION
2,243
FEMALE POPULATION
85.96
MALES / 100 FEMALES
116.34
FEMALES / 100 MALES
45.6
MEDIAN AGE
3.2
AVG FAMILY SIZE
2.7
AVG HOUSEHOLD SIZE
$58,988
PER CAPITA INCOME
$138,167
AVG FAMILY INCOME
$104,844
AVG HOUSEHOLD INCOME
14.7%
WAGE / INCOME GAP [ % ]
85.3¢/ $1
WAGE / INCOME GAP [ $ ]
0.46
INEQUALITY / GINI INDEX
2,258
LABOR FORCE [ PEOPLE ]
64.1%
PERCENT IN LABOR FORCE
5.0%
UNEMPLOYMENT RATE
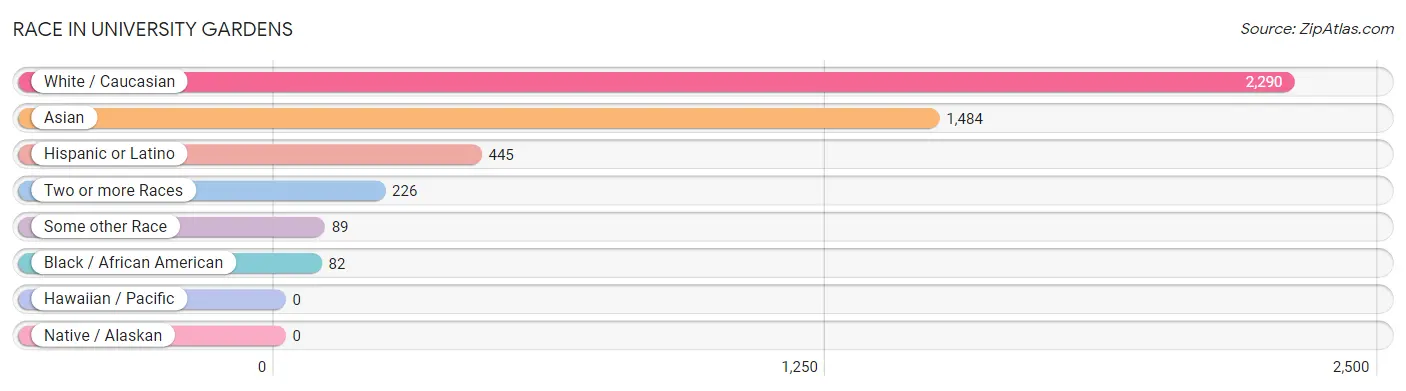
Race in University Gardens
The most populous races in University Gardens are White / Caucasian (2,290 | 54.9%), Asian (1,484 | 35.6%), and Hispanic or Latino (445 | 10.7%).
| Race | # Population | % Population |
| Asian | 1,484 | 35.6% |
| Black / African American | 82 | 2.0% |
| Hawaiian / Pacific | 0 | 0.0% |
| Hispanic or Latino | 445 | 10.7% |
| Native / Alaskan | 0 | 0.0% |
| White / Caucasian | 2,290 | 54.9% |
| Two or more Races | 226 | 5.4% |
| Some other Race | 89 | 2.1% |
| Total | 4,171 | 100.0% |
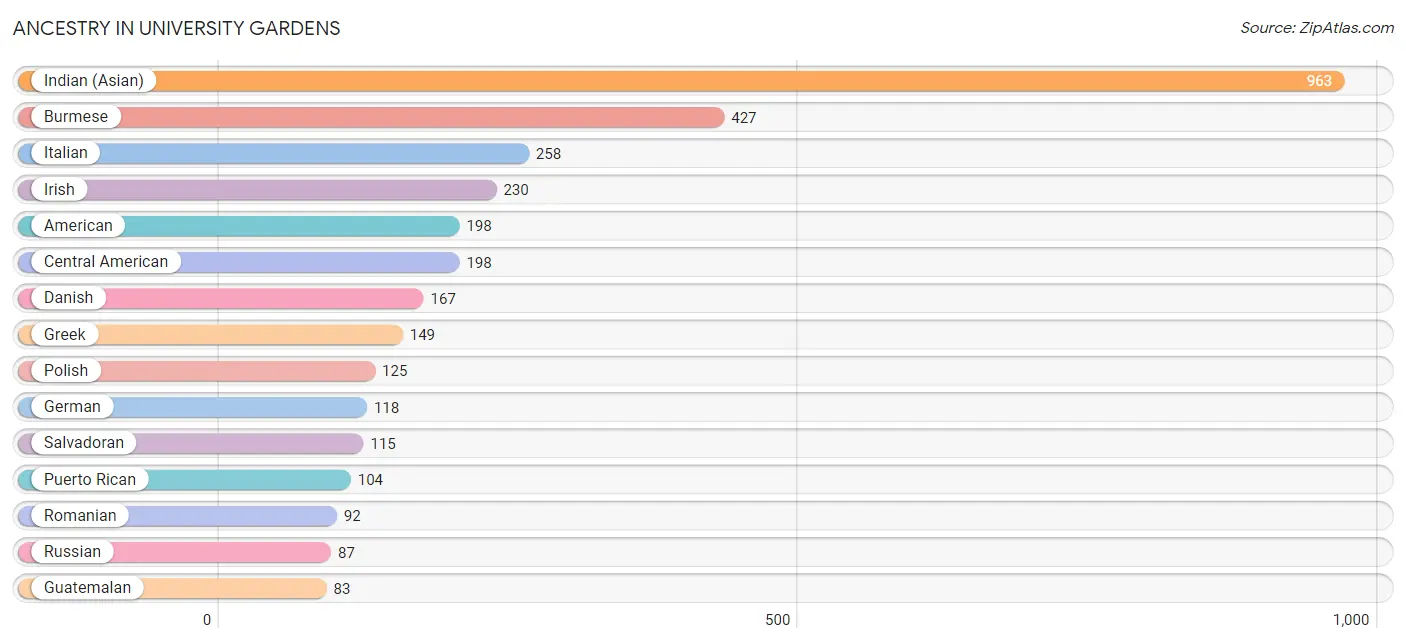
Ancestry in University Gardens
The most populous ancestries reported in University Gardens are Indian (Asian) (963 | 23.1%), Burmese (427 | 10.2%), Italian (258 | 6.2%), Irish (230 | 5.5%), and American (198 | 4.8%), together accounting for 49.8% of all University Gardens residents.
| Ancestry | # Population | % Population |
| African | 13 | 0.3% |
| American | 198 | 4.8% |
| Arab | 25 | 0.6% |
| Austrian | 29 | 0.7% |
| Belgian | 8 | 0.2% |
| Bhutanese | 7 | 0.2% |
| Burmese | 427 | 10.2% |
| Canadian | 72 | 1.7% |
| Central American | 198 | 4.8% |
| Colombian | 11 | 0.3% |
| Danish | 167 | 4.0% |
| Dominican | 12 | 0.3% |
| Eastern European | 68 | 1.6% |
| Ecuadorian | 34 | 0.8% |
| English | 68 | 1.6% |
| European | 9 | 0.2% |
| Filipino | 23 | 0.5% |
| French | 6 | 0.1% |
| German | 118 | 2.8% |
| Greek | 149 | 3.6% |
| Guatemalan | 83 | 2.0% |
| Hungarian | 41 | 1.0% |
| Indian (Asian) | 963 | 23.1% |
| Iranian | 15 | 0.4% |
| Irish | 230 | 5.5% |
| Italian | 258 | 6.2% |
| Korean | 39 | 0.9% |
| Lebanese | 15 | 0.4% |
| Lithuanian | 7 | 0.2% |
| Mexican | 52 | 1.3% |
| Polish | 125 | 3.0% |
| Puerto Rican | 104 | 2.5% |
| Romanian | 92 | 2.2% |
| Russian | 87 | 2.1% |
| Salvadoran | 115 | 2.8% |
| Scottish | 7 | 0.2% |
| South American | 45 | 1.1% |
| Spaniard | 34 | 0.8% |
| Subsaharan African | 13 | 0.3% |
| Swedish | 9 | 0.2% |
| Thai | 25 | 0.6% |
| Turkish | 71 | 1.7% |
| Ukrainian | 17 | 0.4% | View All 43 Rows |
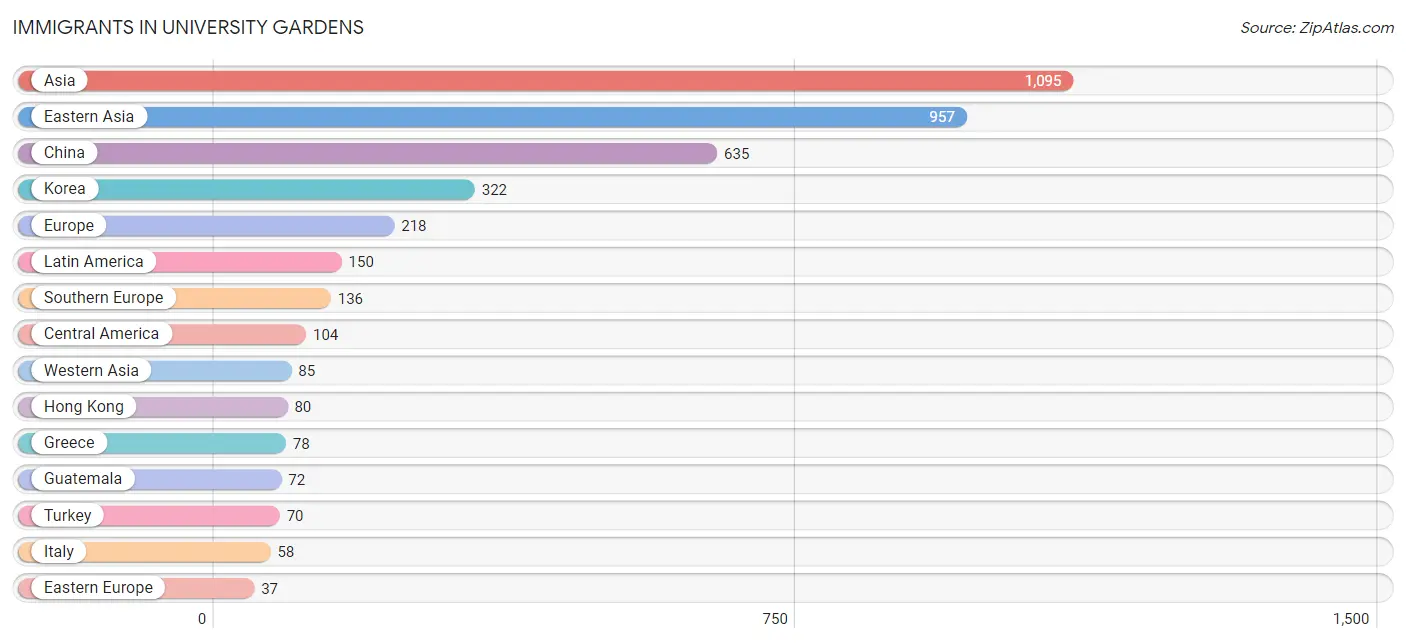
Immigrants in University Gardens
The most numerous immigrant groups reported in University Gardens came from Asia (1,095 | 26.3%), Eastern Asia (957 | 22.9%), China (635 | 15.2%), Korea (322 | 7.7%), and Europe (218 | 5.2%), together accounting for 77.4% of all University Gardens residents.
| Immigration Origin | # Population | % Population |
| Afghanistan | 6 | 0.1% |
| Asia | 1,095 | 26.3% |
| Canada | 6 | 0.1% |
| Caribbean | 12 | 0.3% |
| Central America | 104 | 2.5% |
| China | 635 | 15.2% |
| Dominican Republic | 12 | 0.3% |
| Eastern Asia | 957 | 22.9% |
| Eastern Europe | 37 | 0.9% |
| Ecuador | 34 | 0.8% |
| El Salvador | 15 | 0.4% |
| Europe | 218 | 5.2% |
| Germany | 36 | 0.9% |
| Greece | 78 | 1.9% |
| Guatemala | 72 | 1.7% |
| Hong Kong | 80 | 1.9% |
| Iran | 9 | 0.2% |
| Italy | 58 | 1.4% |
| Korea | 322 | 7.7% |
| Latin America | 150 | 3.6% |
| Lebanon | 15 | 0.4% |
| Mexico | 17 | 0.4% |
| Northern Europe | 9 | 0.2% |
| Pakistan | 5 | 0.1% |
| Philippines | 26 | 0.6% |
| Poland | 12 | 0.3% |
| South America | 34 | 0.8% |
| South Central Asia | 20 | 0.5% |
| South Eastern Asia | 33 | 0.8% |
| Southern Europe | 136 | 3.3% |
| Taiwan | 33 | 0.8% |
| Turkey | 70 | 1.7% |
| Ukraine | 25 | 0.6% |
| Vietnam | 7 | 0.2% |
| Western Asia | 85 | 2.0% |
| Western Europe | 36 | 0.9% | View All 36 Rows |
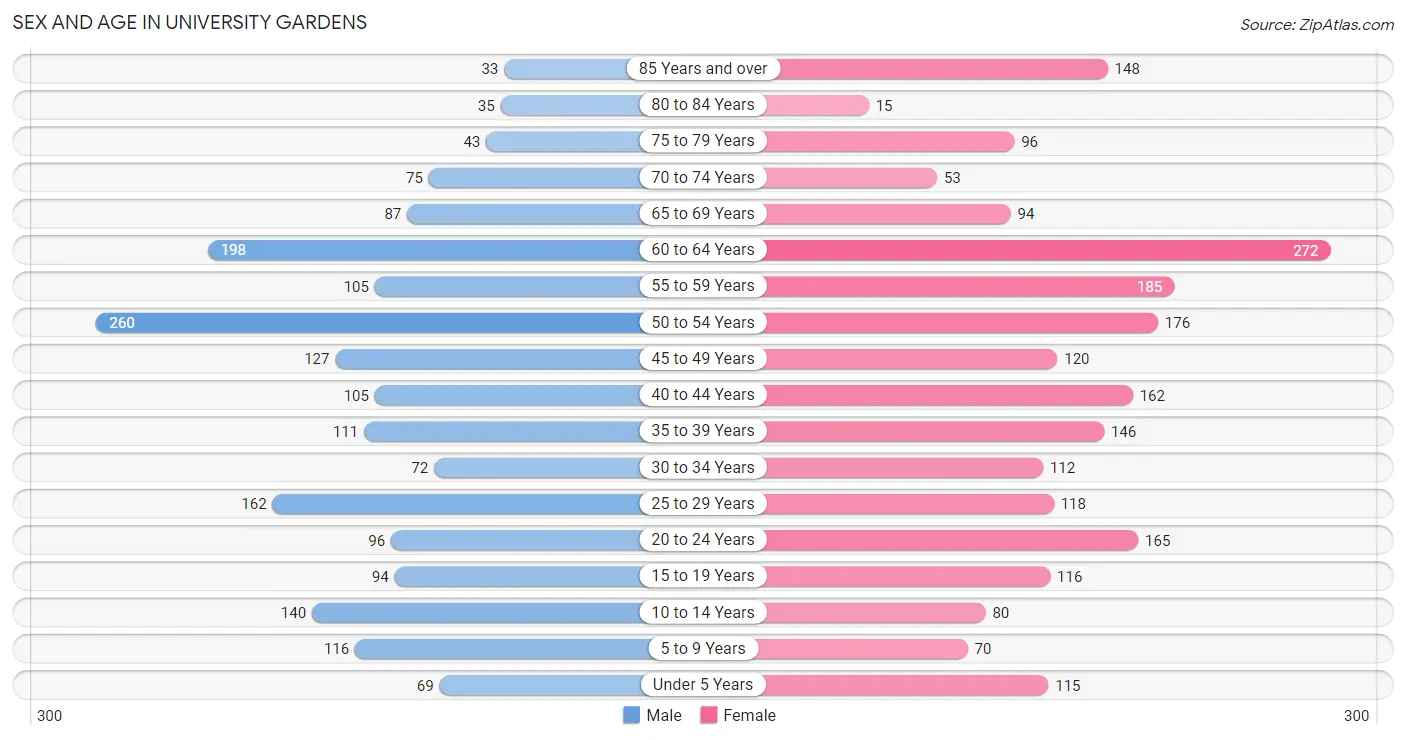
Sex and Age in University Gardens
Sex and Age in University Gardens
The most populous age groups in University Gardens are 50 to 54 Years (260 | 13.5%) for men and 60 to 64 Years (272 | 12.1%) for women.
| Age Bracket | Male | Female |
| Under 5 Years | 69 (3.6%) | 115 (5.1%) |
| 5 to 9 Years | 116 (6.0%) | 70 (3.1%) |
| 10 to 14 Years | 140 (7.3%) | 80 (3.6%) |
| 15 to 19 Years | 94 (4.9%) | 116 (5.2%) |
| 20 to 24 Years | 96 (5.0%) | 165 (7.4%) |
| 25 to 29 Years | 162 (8.4%) | 118 (5.3%) |
| 30 to 34 Years | 72 (3.7%) | 112 (5.0%) |
| 35 to 39 Years | 111 (5.8%) | 146 (6.5%) |
| 40 to 44 Years | 105 (5.4%) | 162 (7.2%) |
| 45 to 49 Years | 127 (6.6%) | 120 (5.3%) |
| 50 to 54 Years | 260 (13.5%) | 176 (7.9%) |
| 55 to 59 Years | 105 (5.4%) | 185 (8.3%) |
| 60 to 64 Years | 198 (10.3%) | 272 (12.1%) |
| 65 to 69 Years | 87 (4.5%) | 94 (4.2%) |
| 70 to 74 Years | 75 (3.9%) | 53 (2.4%) |
| 75 to 79 Years | 43 (2.2%) | 96 (4.3%) |
| 80 to 84 Years | 35 (1.8%) | 15 (0.7%) |
| 85 Years and over | 33 (1.7%) | 148 (6.6%) |
| Total | 1,928 (100.0%) | 2,243 (100.0%) |
Families and Households in University Gardens
Median Family Size in University Gardens
The median family size in University Gardens is 3.23 persons per family, with single male/father families (55 | 4.9%) accounting for the largest median family size of 3.35 persons per family. On the other hand, single female/mother families (203 | 17.9%) represent the smallest median family size with 2.78 persons per family.
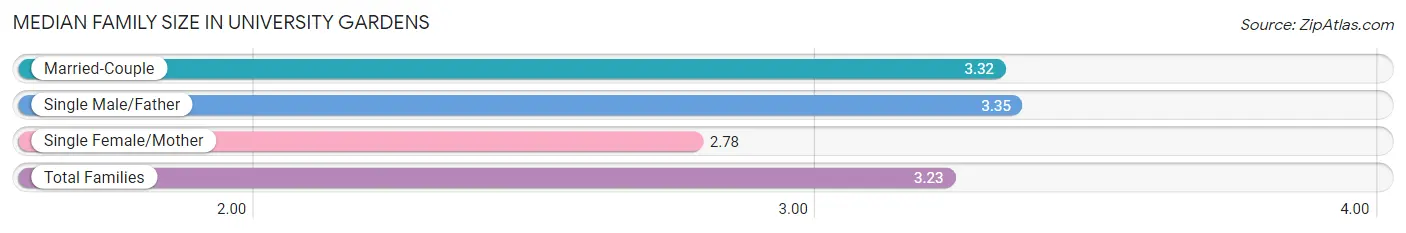
| Family Type | # Families | Family Size |
| Married-Couple | 876 (77.2%) | 3.32 |
| Single Male/Father | 55 (4.9%) | 3.35 |
| Single Female/Mother | 203 (17.9%) | 2.78 |
| Total Families | 1,134 (100.0%) | 3.23 |
Median Household Size in University Gardens
The median household size in University Gardens is 2.70 persons per household, with single male/father households (55 | 3.6%) accounting for the largest median household size of 3.65 persons per household. non-family households (412 | 26.7%) represent the smallest median household size with 1.20 persons per household.
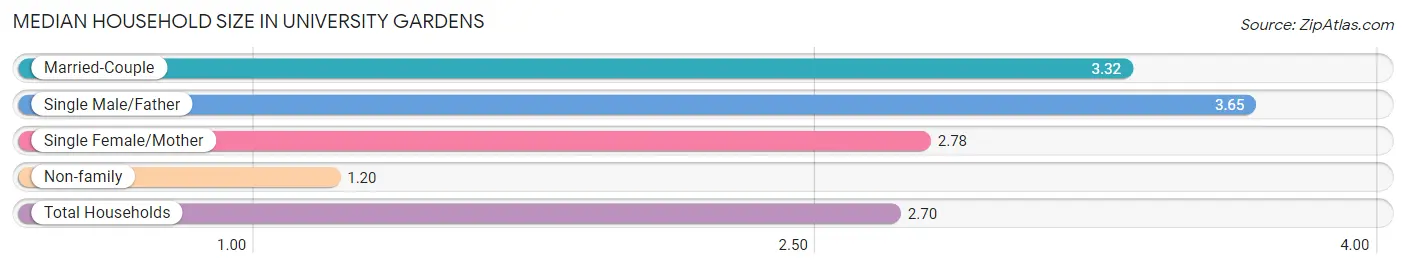
| Household Type | # Households | Household Size |
| Married-Couple | 876 (56.7%) | 3.32 |
| Single Male/Father | 55 (3.6%) | 3.65 |
| Single Female/Mother | 203 (13.1%) | 2.78 |
| Non-family | 412 (26.7%) | 1.20 |
| Total Households | 1,546 (100.0%) | 2.70 |
Household Size by Marriage Status in University Gardens
Out of a total of 1,546 households in University Gardens, 1,134 (73.4%) are family households, while 412 (26.7%) are nonfamily households. The most numerous type of family households are 2-person households, comprising 370, and the most common type of nonfamily households are 1-person households, comprising 330.
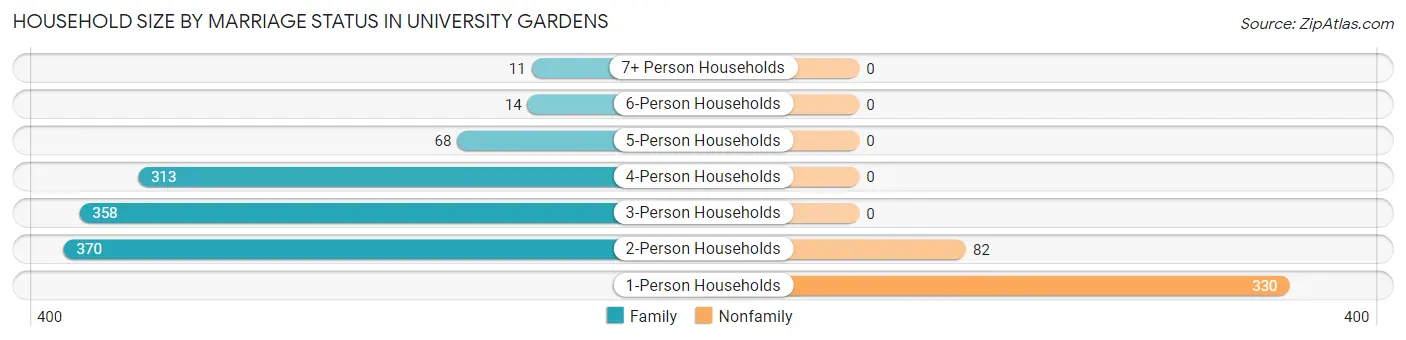
| Household Size | Family Households | Nonfamily Households |
| 1-Person Households | - | 330 (21.3%) |
| 2-Person Households | 370 (23.9%) | 82 (5.3%) |
| 3-Person Households | 358 (23.2%) | 0 (0.0%) |
| 4-Person Households | 313 (20.3%) | 0 (0.0%) |
| 5-Person Households | 68 (4.4%) | 0 (0.0%) |
| 6-Person Households | 14 (0.9%) | 0 (0.0%) |
| 7+ Person Households | 11 (0.7%) | 0 (0.0%) |
| Total | 1,134 (73.4%) | 412 (26.7%) |
Female Fertility in University Gardens
Fertility by Age in University Gardens
Average fertility rate in University Gardens is 12.0 births per 1,000 women. Women in the age bracket of 35 to 50 years have the highest fertility rate with 26.0 births per 1,000 women. Women in the age bracket of 35 to 50 years acount for 100.0% of all women with births.
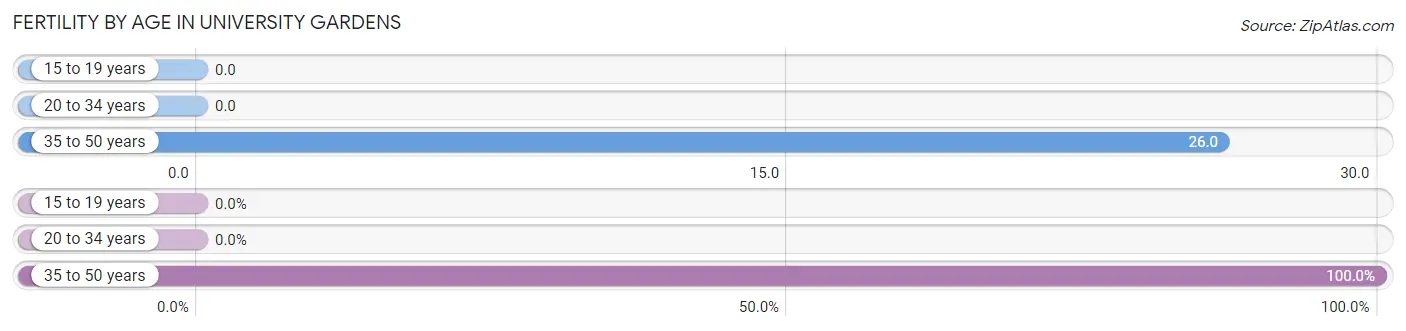
| Age Bracket | Women with Births | Births / 1,000 Women |
| 15 to 19 years | 0 (0.0%) | 0.0 |
| 20 to 34 years | 0 (0.0%) | 0.0 |
| 35 to 50 years | 12 (100.0%) | 26.0 |
| Total | 12 (100.0%) | 12.0 |
Fertility by Age by Marriage Status in University Gardens
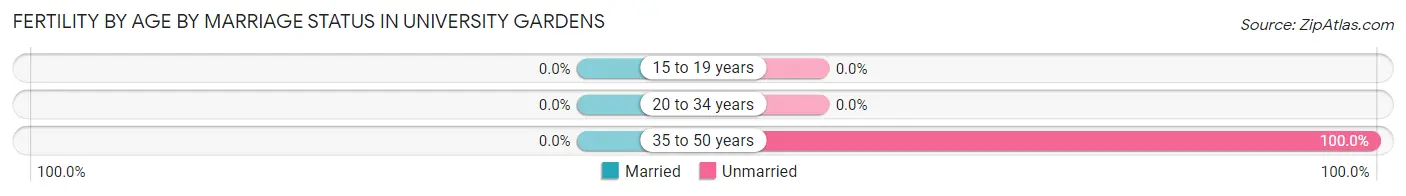
| Age Bracket | Married | Unmarried |
| 15 to 19 years | 0 (0.0%) | 0 (0.0%) |
| 20 to 34 years | 0 (0.0%) | 0 (0.0%) |
| 35 to 50 years | 0 (0.0%) | 12 (100.0%) |
| Total | 0 (0.0%) | 12 (100.0%) |
Fertility by Education in University Gardens
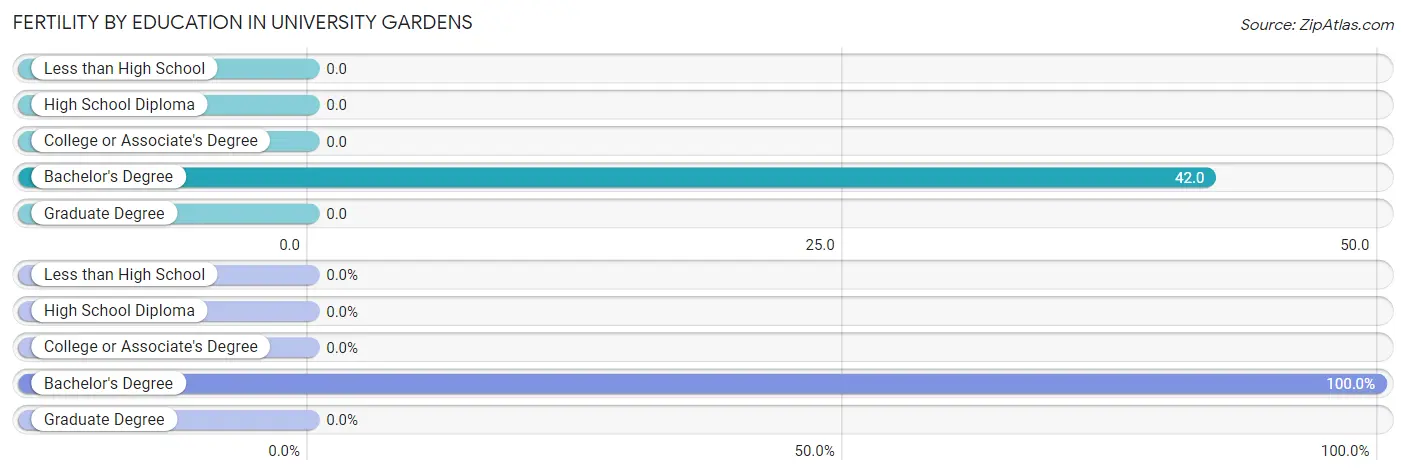
| Educational Attainment | Women with Births | Births / 1,000 Women |
| Less than High School | 0 (0.0%) | 0.0 |
| High School Diploma | 0 (0.0%) | 0.0 |
| College or Associate's Degree | 0 (0.0%) | 0.0 |
| Bachelor's Degree | 12 (100.0%) | 42.0 |
| Graduate Degree | 0 (0.0%) | 0.0 |
| Total | 12 (100.0%) | 12.0 |
Fertility by Education by Marriage Status in University Gardens
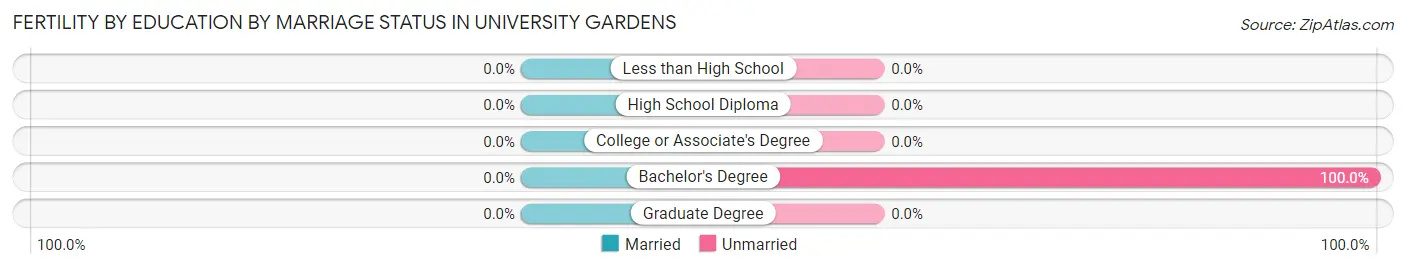
| Educational Attainment | Married | Unmarried |
| Less than High School | 0 (0.0%) | 0 (0.0%) |
| High School Diploma | 0 (0.0%) | 0 (0.0%) |
| College or Associate's Degree | 0 (0.0%) | 0 (0.0%) |
| Bachelor's Degree | 0 (0.0%) | 12 (100.0%) |
| Graduate Degree | 0 (0.0%) | 0 (0.0%) |
| Total | 0 (0.0%) | 12 (100.0%) |
Income in University Gardens
Income Overview in University Gardens
Per Capita Income in University Gardens is $58,988, while median incomes of families and households are $138,167 and $104,844 respectively.
| Characteristic | Number | Measure |
| Per Capita Income | 4,171 | $58,988 |
| Median Family Income | 1,134 | $138,167 |
| Mean Family Income | 1,134 | $167,525 |
| Median Household Income | 1,546 | $104,844 |
| Mean Household Income | 1,546 | $152,152 |
| Income Deficit | 1,134 | $0 |
| Wage / Income Gap (%) | 4,171 | 14.73% |
| Wage / Income Gap ($) | 4,171 | 85.27¢ per $1 |
| Gini / Inequality Index | 4,171 | 0.46 |
Earnings by Sex in University Gardens
Average Earnings in University Gardens are $50,987, $55,990 for men and $47,740 for women, a difference of 14.7%.
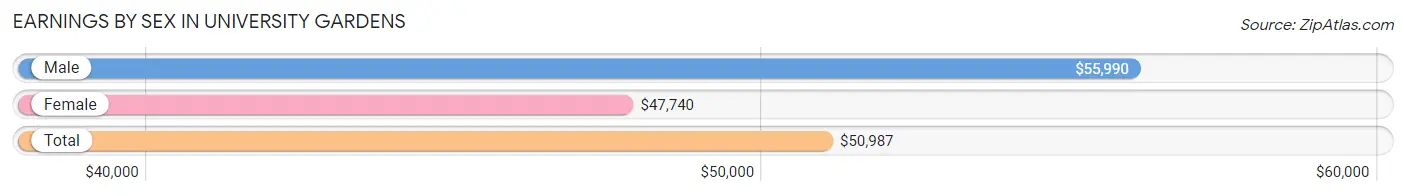
| Sex | Number | Average Earnings |
| Male | 1,257 (49.4%) | $55,990 |
| Female | 1,289 (50.6%) | $47,740 |
| Total | 2,546 (100.0%) | $50,987 |
Earnings by Sex by Income Bracket in University Gardens
The most common earnings brackets in University Gardens are $100,000+ for men (434 | 34.5%) and $100,000+ for women (215 | 16.7%).
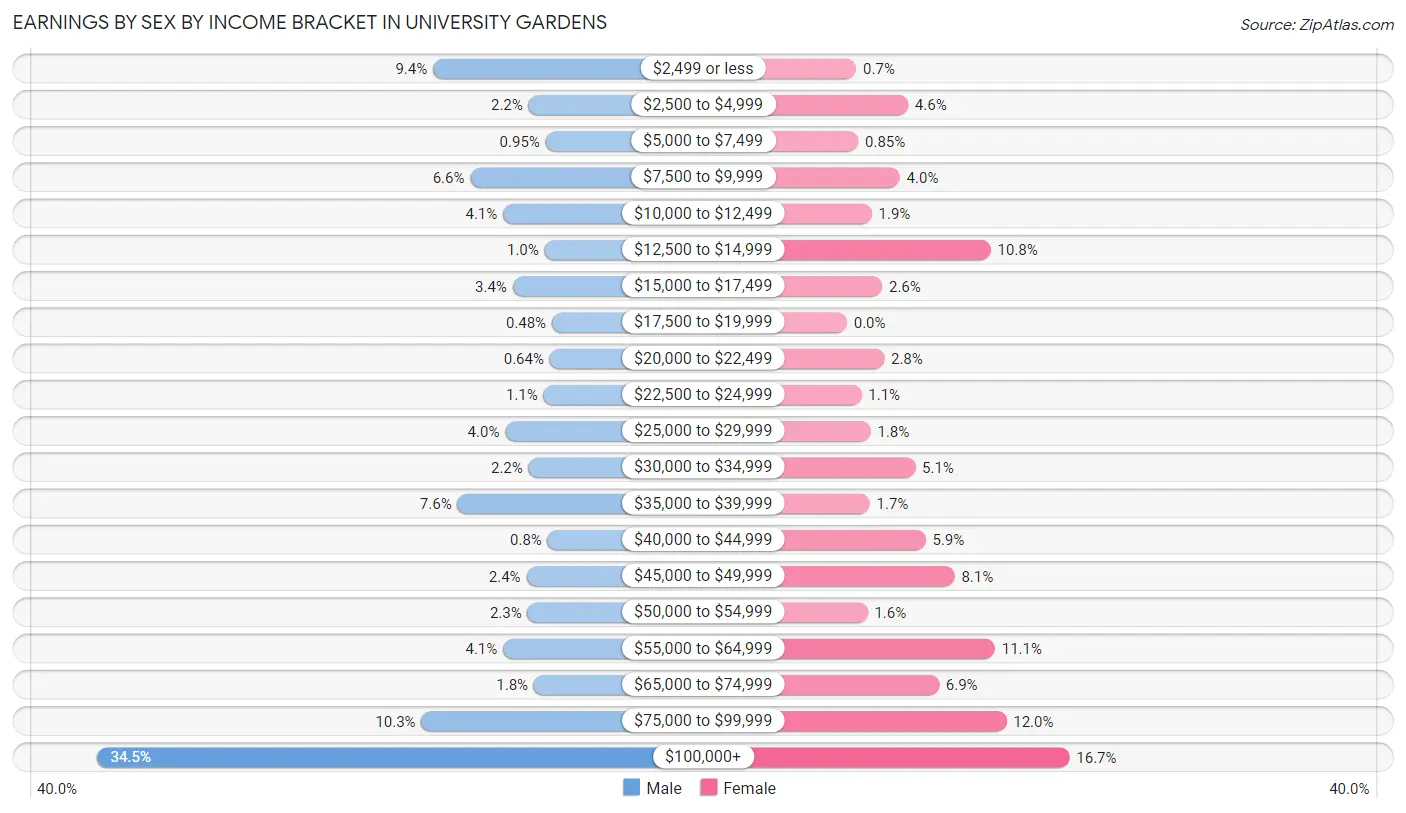
| Income | Male | Female |
| $2,499 or less | 118 (9.4%) | 9 (0.7%) |
| $2,500 to $4,999 | 28 (2.2%) | 59 (4.6%) |
| $5,000 to $7,499 | 12 (0.9%) | 11 (0.9%) |
| $7,500 to $9,999 | 83 (6.6%) | 51 (4.0%) |
| $10,000 to $12,499 | 52 (4.1%) | 24 (1.9%) |
| $12,500 to $14,999 | 13 (1.0%) | 139 (10.8%) |
| $15,000 to $17,499 | 43 (3.4%) | 34 (2.6%) |
| $17,500 to $19,999 | 6 (0.5%) | 0 (0.0%) |
| $20,000 to $22,499 | 8 (0.6%) | 36 (2.8%) |
| $22,500 to $24,999 | 14 (1.1%) | 14 (1.1%) |
| $25,000 to $29,999 | 50 (4.0%) | 23 (1.8%) |
| $30,000 to $34,999 | 28 (2.2%) | 66 (5.1%) |
| $35,000 to $39,999 | 95 (7.6%) | 22 (1.7%) |
| $40,000 to $44,999 | 10 (0.8%) | 76 (5.9%) |
| $45,000 to $49,999 | 30 (2.4%) | 104 (8.1%) |
| $50,000 to $54,999 | 29 (2.3%) | 20 (1.5%) |
| $55,000 to $64,999 | 52 (4.1%) | 143 (11.1%) |
| $65,000 to $74,999 | 23 (1.8%) | 89 (6.9%) |
| $75,000 to $99,999 | 129 (10.3%) | 154 (11.9%) |
| $100,000+ | 434 (34.5%) | 215 (16.7%) |
| Total | 1,257 (100.0%) | 1,289 (100.0%) |
Earnings by Sex by Educational Attainment in University Gardens
Average earnings in University Gardens are $74,620 for men and $55,833 for women, a difference of 25.2%. Men with an educational attainment of graduate degree enjoy the highest average annual earnings of $92,177, while those with less than high school education earn the least with $45,815. Women with an educational attainment of bachelor's degree earn the most with the average annual earnings of $80,375, while those with less than high school education have the smallest earnings of $30,331.
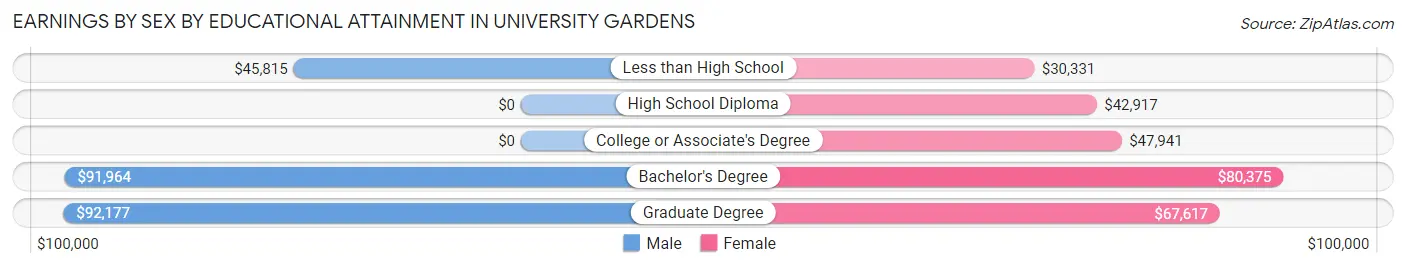
| Educational Attainment | Male Income | Female Income |
| Less than High School | $45,815 | $30,331 |
| High School Diploma | - | - |
| College or Associate's Degree | - | - |
| Bachelor's Degree | $91,964 | $80,375 |
| Graduate Degree | $92,177 | $67,617 |
| Total | $74,620 | $55,833 |
Family Income in University Gardens
Family Income Brackets in University Gardens
According to the University Gardens family income data, there are 277 families falling into the $200,000+ income range, which is the most common income bracket and makes up 24.4% of all families. Conversely, the less than $10,000 income bracket is the least frequent group with only 9 families (0.8%) belonging to this category.
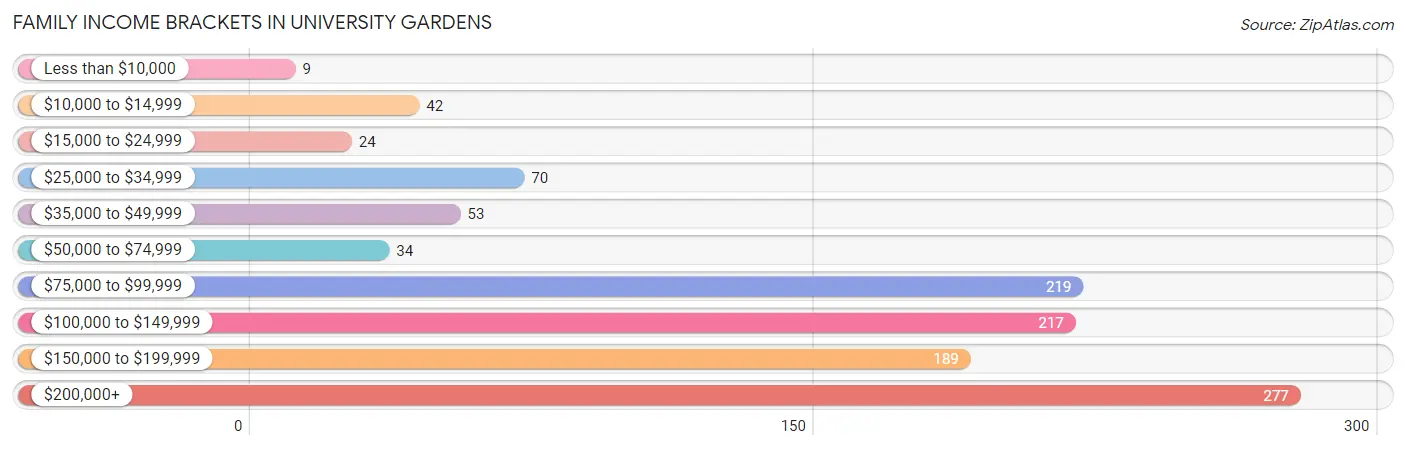
| Income Bracket | # Families | % Families |
| Less than $10,000 | 9 | 0.8% |
| $10,000 to $14,999 | 42 | 3.7% |
| $15,000 to $24,999 | 24 | 2.1% |
| $25,000 to $34,999 | 70 | 6.2% |
| $35,000 to $49,999 | 53 | 4.7% |
| $50,000 to $74,999 | 34 | 3.0% |
| $75,000 to $99,999 | 219 | 19.3% |
| $100,000 to $149,999 | 217 | 19.1% |
| $150,000 to $199,999 | 189 | 16.7% |
| $200,000+ | 277 | 24.4% |
Family Income by Famaliy Size in University Gardens
5-person families (46 | 4.1%) account for the highest median family income in University Gardens with $250,001 per family, while 2-person families (370 | 32.6%) have the highest median income of $50,312 per family member.
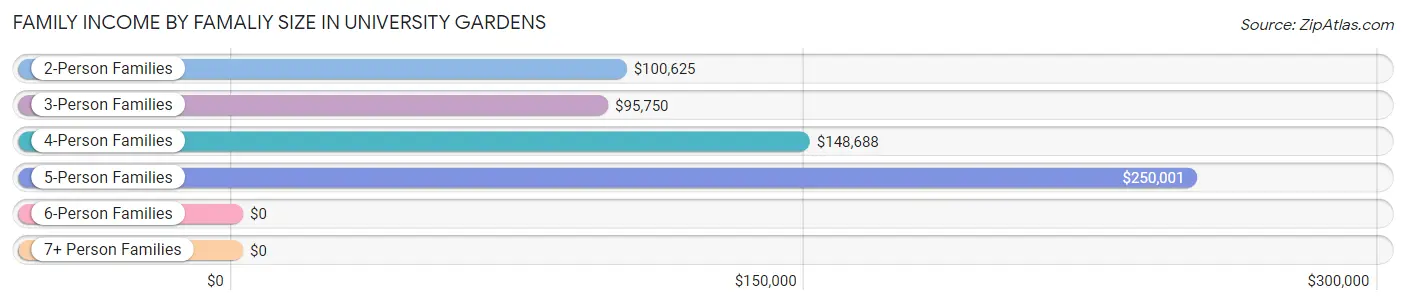
| Income Bracket | # Families | Median Income |
| 2-Person Families | 370 (32.6%) | $100,625 |
| 3-Person Families | 358 (31.6%) | $95,750 |
| 4-Person Families | 335 (29.5%) | $148,688 |
| 5-Person Families | 46 (4.1%) | $250,001 |
| 6-Person Families | 14 (1.2%) | $0 |
| 7+ Person Families | 11 (1.0%) | $0 |
| Total | 1,134 (100.0%) | $138,167 |
Family Income by Number of Earners in University Gardens
The median family income in University Gardens is $138,167, with families comprising 2 earners (547) having the highest median family income of $173,633, while families with no earners (95) have the lowest median family income of $76,971, accounting for 48.2% and 8.4% of families, respectively.
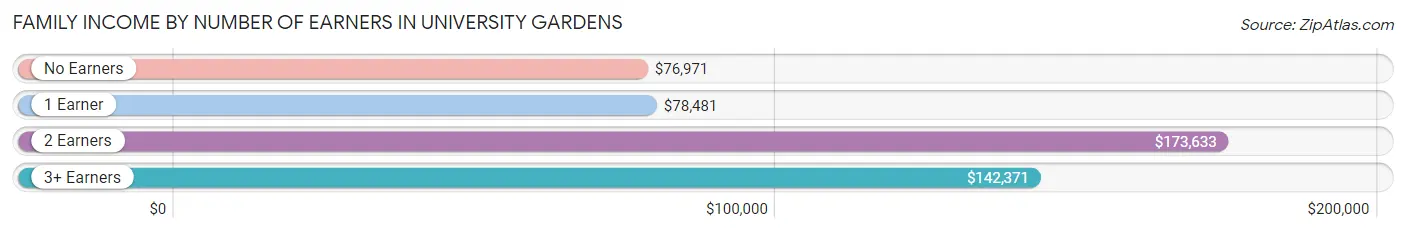
| Number of Earners | # Families | Median Income |
| No Earners | 95 (8.4%) | $76,971 |
| 1 Earner | 316 (27.9%) | $78,481 |
| 2 Earners | 547 (48.2%) | $173,633 |
| 3+ Earners | 176 (15.5%) | $142,371 |
| Total | 1,134 (100.0%) | $138,167 |
Household Income in University Gardens
Household Income Brackets in University Gardens
With 329 households falling in the category, the $200,000+ income range is the most frequent in University Gardens, accounting for 21.3% of all households. In contrast, only 17 households (1.1%) fall into the less than $10,000 income bracket, making it the least populous group.
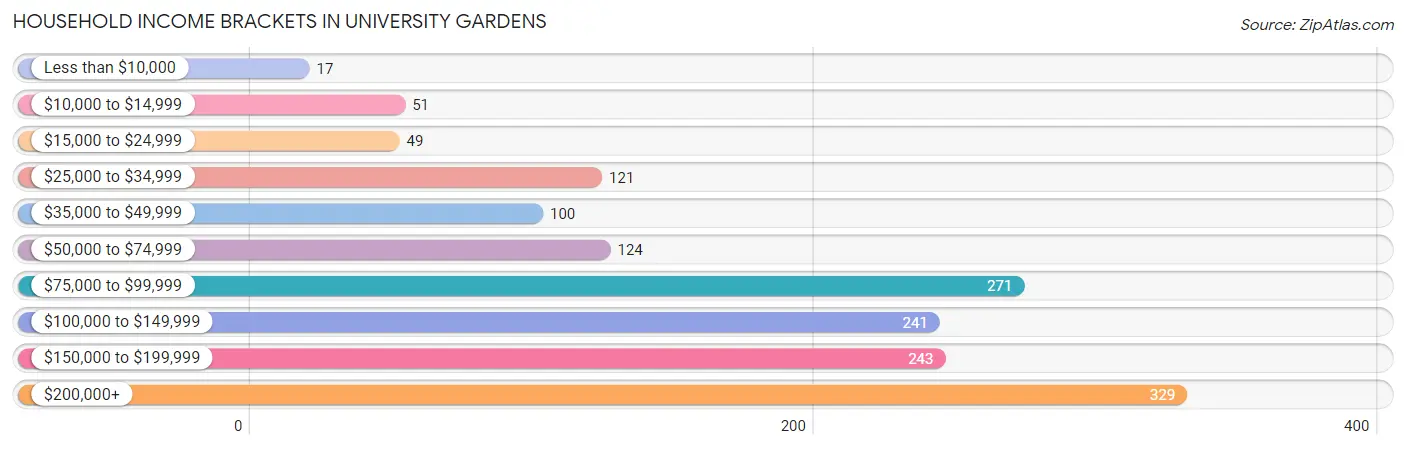
| Income Bracket | # Households | % Households |
| Less than $10,000 | 17 | 1.1% |
| $10,000 to $14,999 | 51 | 3.3% |
| $15,000 to $24,999 | 49 | 3.2% |
| $25,000 to $34,999 | 121 | 7.8% |
| $35,000 to $49,999 | 100 | 6.5% |
| $50,000 to $74,999 | 124 | 8.0% |
| $75,000 to $99,999 | 271 | 17.5% |
| $100,000 to $149,999 | 241 | 15.6% |
| $150,000 to $199,999 | 243 | 15.7% |
| $200,000+ | 329 | 21.3% |
Household Income by Householder Age in University Gardens
The median household income in University Gardens is $104,844, with the highest median household income of $139,917 found in the 45 to 64 years age bracket for the primary householder. A total of 833 households (53.9%) fall into this category. Meanwhile, the 15 to 24 years age bracket for the primary householder has the lowest median household income of $0, with 9 households (0.6%) in this group.
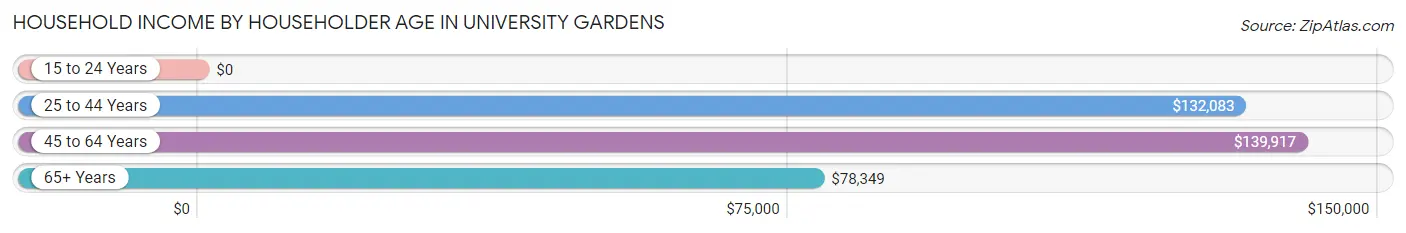
| Income Bracket | # Households | Median Income |
| 15 to 24 Years | 9 (0.6%) | $0 |
| 25 to 44 Years | 334 (21.6%) | $132,083 |
| 45 to 64 Years | 833 (53.9%) | $139,917 |
| 65+ Years | 370 (23.9%) | $78,349 |
| Total | 1,546 (100.0%) | $104,844 |
Poverty in University Gardens
Income Below Poverty by Sex and Age in University Gardens
With 7.7% poverty level for males and 4.8% for females among the residents of University Gardens, 16 and 17 year old males and 6 to 11 year old females are the most vulnerable to poverty, with 39 males (62.9%) and 19 females (19.4%) in their respective age groups living below the poverty level.
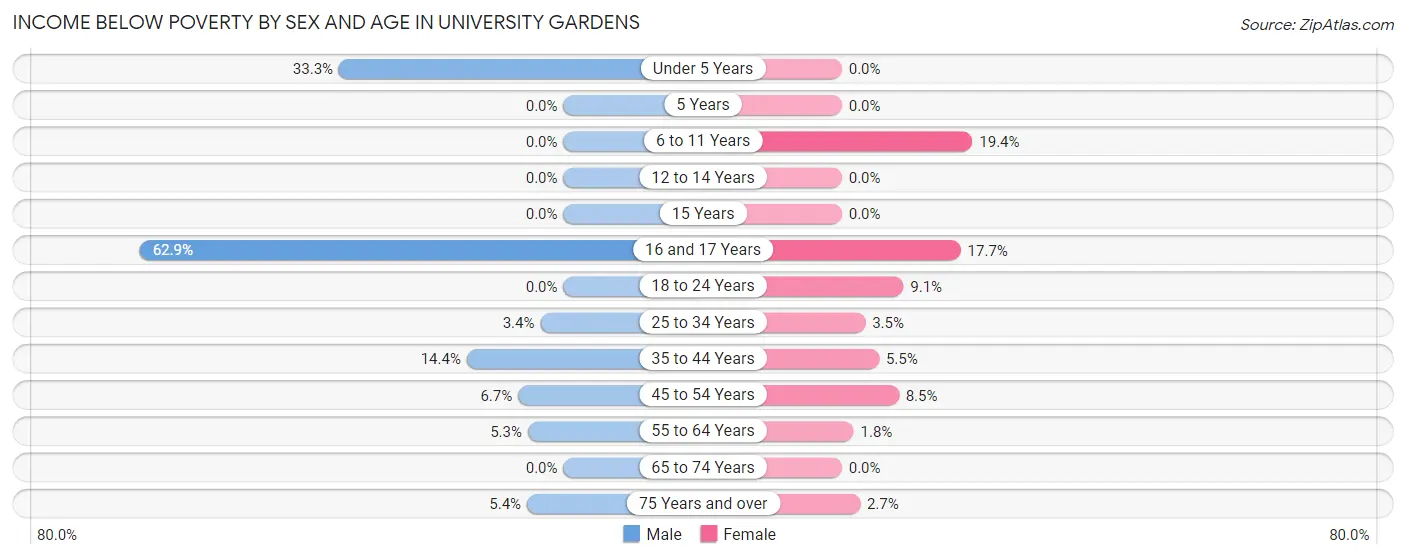
| Age Bracket | Male | Female |
| Under 5 Years | 23 (33.3%) | 0 (0.0%) |
| 5 Years | 0 (0.0%) | 0 (0.0%) |
| 6 to 11 Years | 0 (0.0%) | 19 (19.4%) |
| 12 to 14 Years | 0 (0.0%) | 0 (0.0%) |
| 15 Years | 0 (0.0%) | 0 (0.0%) |
| 16 and 17 Years | 39 (62.9%) | 6 (17.6%) |
| 18 to 24 Years | 0 (0.0%) | 18 (9.1%) |
| 25 to 34 Years | 8 (3.4%) | 8 (3.5%) |
| 35 to 44 Years | 31 (14.3%) | 17 (5.5%) |
| 45 to 54 Years | 26 (6.7%) | 25 (8.5%) |
| 55 to 64 Years | 16 (5.3%) | 8 (1.8%) |
| 65 to 74 Years | 0 (0.0%) | 0 (0.0%) |
| 75 Years and over | 6 (5.4%) | 7 (2.7%) |
| Total | 149 (7.7%) | 108 (4.8%) |
Income Above Poverty by Sex and Age in University Gardens
According to the poverty statistics in University Gardens, males aged 5 years and females aged under 5 years are the age groups that are most secure financially, with 100.0% of males and 100.0% of females in these age groups living above the poverty line.
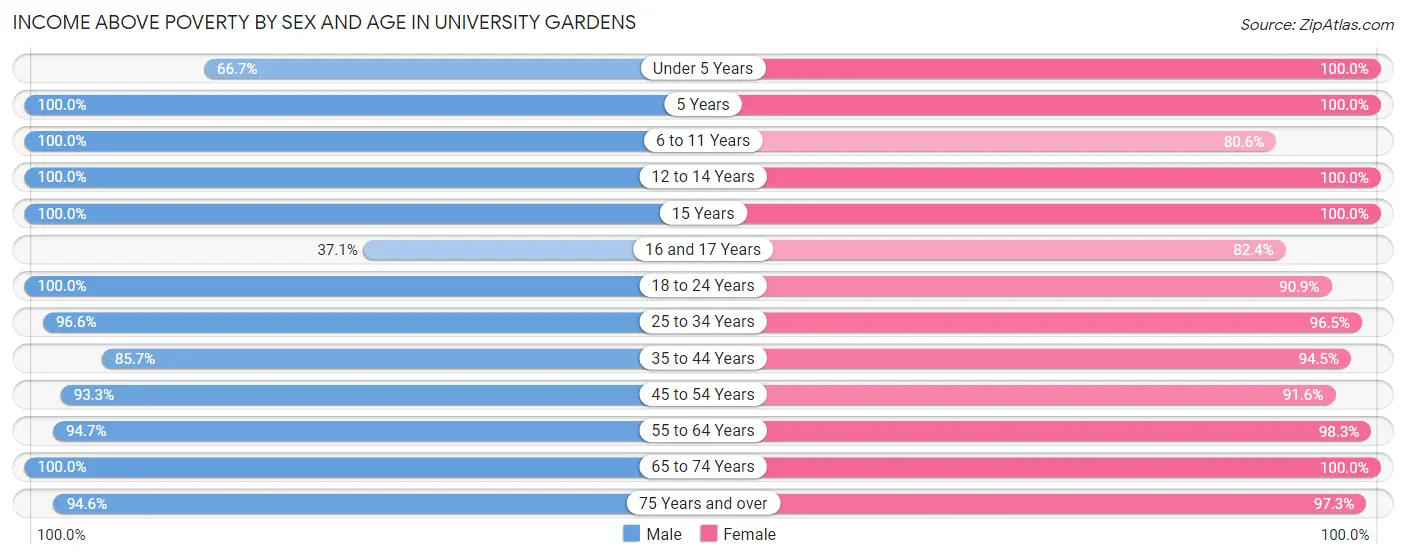
| Age Bracket | Male | Female |
| Under 5 Years | 46 (66.7%) | 115 (100.0%) |
| 5 Years | 12 (100.0%) | 11 (100.0%) |
| 6 to 11 Years | 187 (100.0%) | 79 (80.6%) |
| 12 to 14 Years | 57 (100.0%) | 41 (100.0%) |
| 15 Years | 8 (100.0%) | 50 (100.0%) |
| 16 and 17 Years | 23 (37.1%) | 28 (82.4%) |
| 18 to 24 Years | 120 (100.0%) | 179 (90.9%) |
| 25 to 34 Years | 226 (96.6%) | 222 (96.5%) |
| 35 to 44 Years | 185 (85.7%) | 291 (94.5%) |
| 45 to 54 Years | 361 (93.3%) | 271 (91.5%) |
| 55 to 64 Years | 287 (94.7%) | 449 (98.3%) |
| 65 to 74 Years | 162 (100.0%) | 147 (100.0%) |
| 75 Years and over | 105 (94.6%) | 252 (97.3%) |
| Total | 1,779 (92.3%) | 2,135 (95.2%) |
Income Below Poverty Among Married-Couple Families in University Gardens
The poverty statistics for married-couple families in University Gardens show that 4.8% or 42 of the total 876 families live below the poverty line. Families with 1 or 2 children have the highest poverty rate of 8.0%, comprising of 26 families. On the other hand, families with 3 or 4 children have the lowest poverty rate of 0.0%, which includes 0 families.
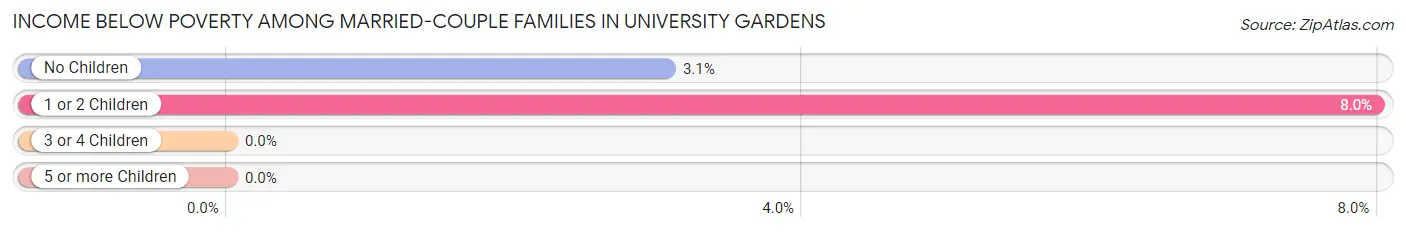
| Children | Above Poverty | Below Poverty |
| No Children | 509 (97.0%) | 16 (3.0%) |
| 1 or 2 Children | 300 (92.0%) | 26 (8.0%) |
| 3 or 4 Children | 14 (100.0%) | 0 (0.0%) |
| 5 or more Children | 11 (100.0%) | 0 (0.0%) |
| Total | 834 (95.2%) | 42 (4.8%) |
Income Below Poverty Among Single-Parent Households in University Gardens
According to the poverty data in University Gardens, 40.0% or 22 single-father households and 0.5% or 1 single-mother households are living below the poverty line. Among single-father households, those with 3 or 4 children have the highest poverty rate, with 22 households (100.0%) experiencing poverty. Likewise, among single-mother households, those with no children have the highest poverty rate, with 1 households (0.7%) falling below the poverty line.
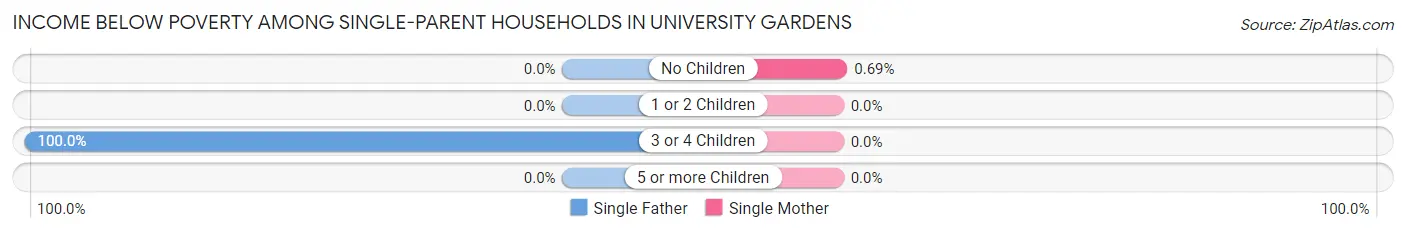
| Children | Single Father | Single Mother |
| No Children | 0 (0.0%) | 1 (0.7%) |
| 1 or 2 Children | 0 (0.0%) | 0 (0.0%) |
| 3 or 4 Children | 22 (100.0%) | 0 (0.0%) |
| 5 or more Children | 0 (0.0%) | 0 (0.0%) |
| Total | 22 (40.0%) | 1 (0.5%) |
Income Below Poverty Among Married-Couple vs Single-Parent Households in University Gardens
The poverty data for University Gardens shows that 42 of the married-couple family households (4.8%) and 23 of the single-parent households (8.9%) are living below the poverty level. Within the married-couple family households, those with 1 or 2 children have the highest poverty rate, with 26 households (8.0%) falling below the poverty line. Among the single-parent households, those with 3 or 4 children have the highest poverty rate, with 22 household (100.0%) living below poverty.
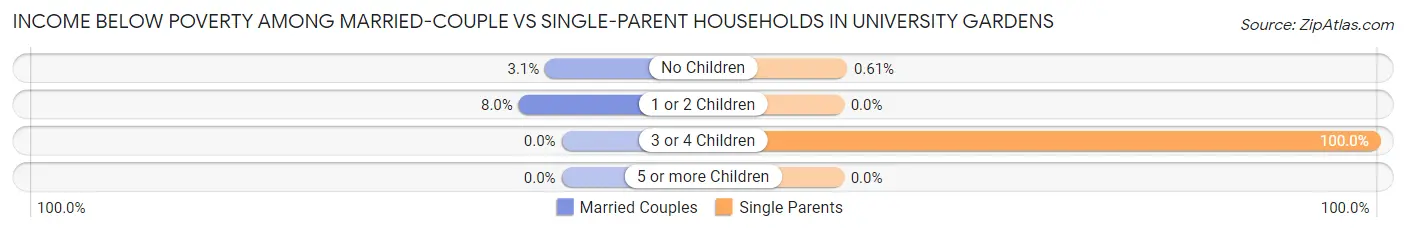
| Children | Married-Couple Families | Single-Parent Households |
| No Children | 16 (3.0%) | 1 (0.6%) |
| 1 or 2 Children | 26 (8.0%) | 0 (0.0%) |
| 3 or 4 Children | 0 (0.0%) | 22 (100.0%) |
| 5 or more Children | 0 (0.0%) | 0 (0.0%) |
| Total | 42 (4.8%) | 23 (8.9%) |
Employment Characteristics in University Gardens
Employment by Class of Employer in University Gardens
Among the 2,147 employed individuals in University Gardens, private company employees (1,350 | 62.9%), not-for-profit organizations (281 | 13.1%), and local government employees (238 | 11.1%) make up the most common classes of employment.
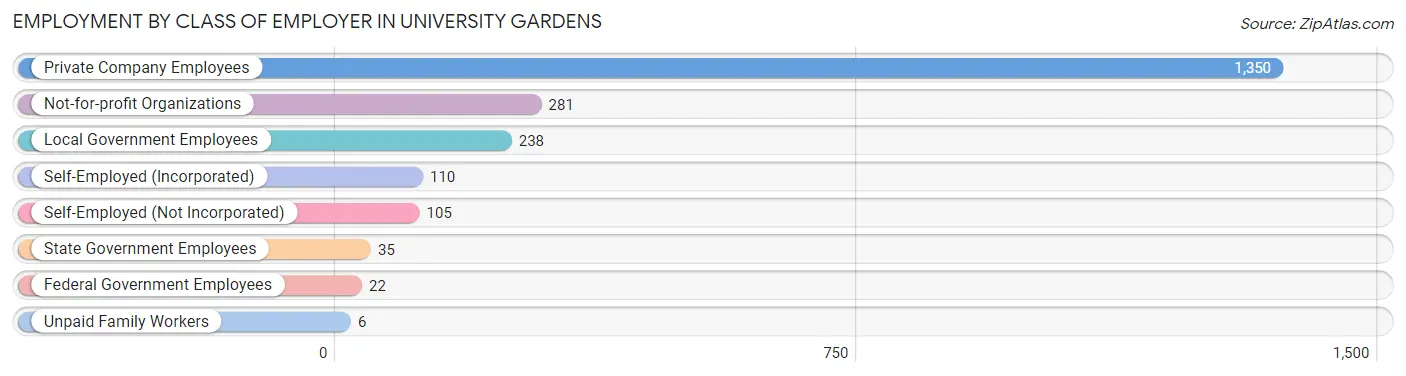
| Employer Class | # Employees | % Employees |
| Private Company Employees | 1,350 | 62.9% |
| Self-Employed (Incorporated) | 110 | 5.1% |
| Self-Employed (Not Incorporated) | 105 | 4.9% |
| Not-for-profit Organizations | 281 | 13.1% |
| Local Government Employees | 238 | 11.1% |
| State Government Employees | 35 | 1.6% |
| Federal Government Employees | 22 | 1.0% |
| Unpaid Family Workers | 6 | 0.3% |
| Total | 2,147 | 100.0% |
Employment Status by Age in University Gardens
According to the labor force statistics for University Gardens, out of the total population over 16 years of age (3,523), 64.1% or 2,258 individuals are in the labor force, with 5.0% or 113 of them unemployed. The age group with the highest labor force participation rate is 45 to 54 years, with 88.7% or 606 individuals in the labor force. Within the labor force, the 16 to 19 years age range has the highest percentage of unemployed individuals, with 50.0% or 12 of them being unemployed.
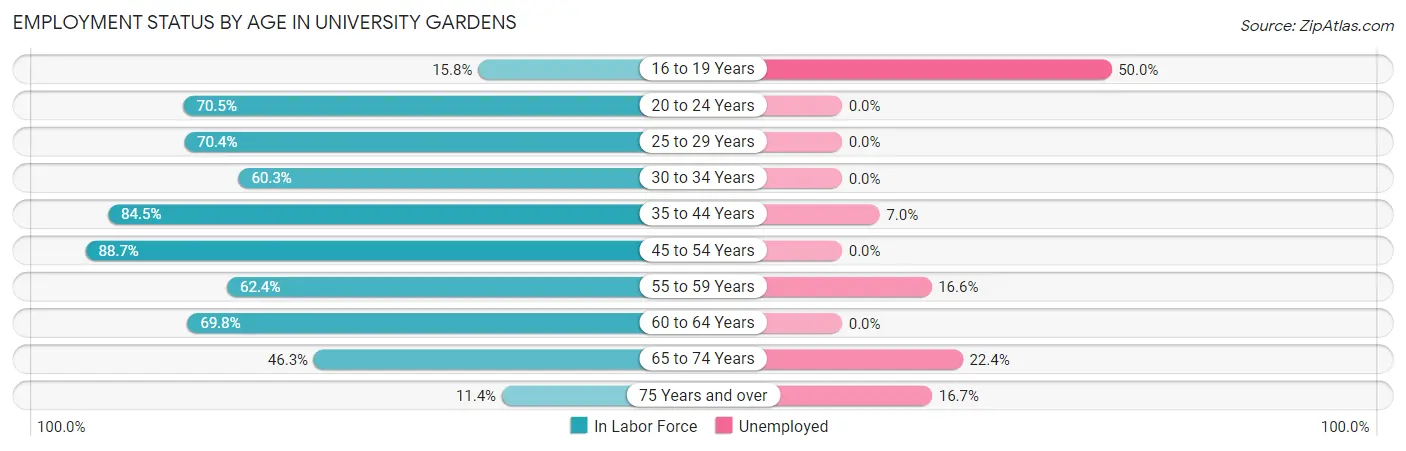
| Age Bracket | In Labor Force | Unemployed |
| 16 to 19 Years | 24 (15.8%) | 12 (50.0%) |
| 20 to 24 Years | 184 (70.5%) | 0 (0.0%) |
| 25 to 29 Years | 197 (70.4%) | 0 (0.0%) |
| 30 to 34 Years | 111 (60.3%) | 0 (0.0%) |
| 35 to 44 Years | 443 (84.5%) | 31 (7.0%) |
| 45 to 54 Years | 606 (88.7%) | 0 (0.0%) |
| 55 to 59 Years | 181 (62.4%) | 30 (16.6%) |
| 60 to 64 Years | 328 (69.8%) | 0 (0.0%) |
| 65 to 74 Years | 143 (46.3%) | 32 (22.4%) |
| 75 Years and over | 42 (11.4%) | 7 (16.7%) |
| Total | 2,258 (64.1%) | 113 (5.0%) |
Employment Status by Educational Attainment in University Gardens
According to labor force statistics for University Gardens, 76.8% of individuals (1,867) out of the total population between 25 and 64 years of age (2,431) are in the labor force, with 3.3% or 62 of them being unemployed. The group with the highest labor force participation rate are those with the educational attainment of college / associate degree, with 96.0% or 554 individuals in the labor force. Within the labor force, individuals with bachelor's degree or higher education have the highest percentage of unemployment, with 5.5% or 61 of them being unemployed.
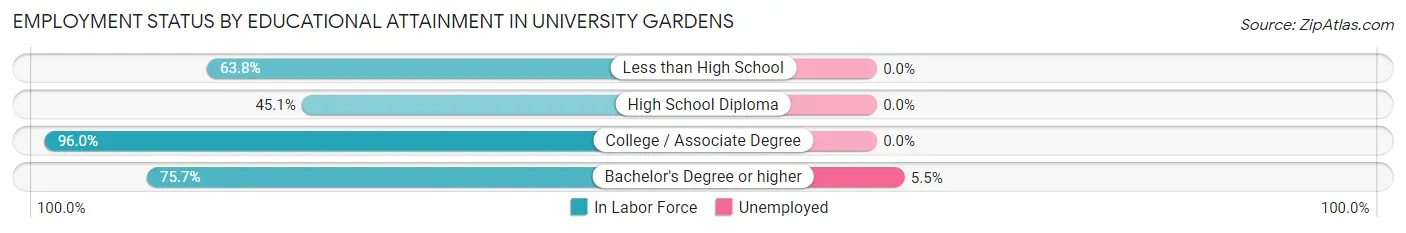
| Educational Attainment | In Labor Force | Unemployed |
| Less than High School | 90 (63.8%) | 0 (0.0%) |
| High School Diploma | 111 (45.1%) | 0 (0.0%) |
| College / Associate Degree | 554 (96.0%) | 0 (0.0%) |
| Bachelor's Degree or higher | 1,111 (75.7%) | 81 (5.5%) |
| Total | 1,867 (76.8%) | 80 (3.3%) |
Employment Occupations by Sex in University Gardens
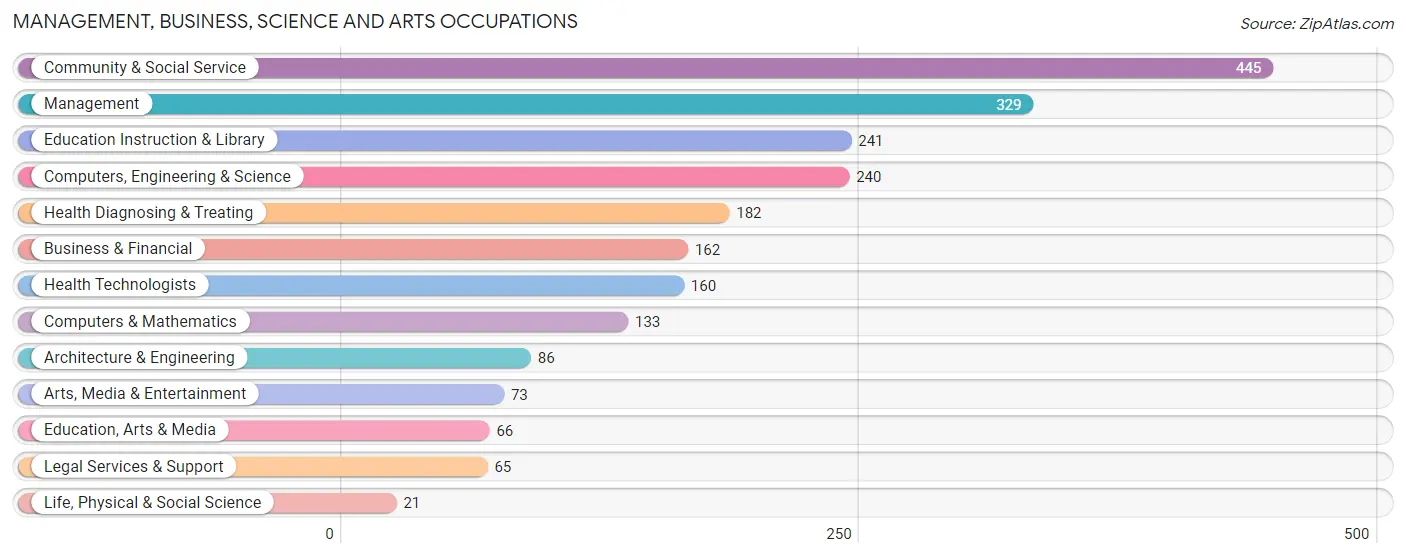
Management, Business, Science and Arts Occupations
The most common Management, Business, Science and Arts occupations in University Gardens are Community & Social Service (445 | 20.7%), Management (329 | 15.3%), Education Instruction & Library (241 | 11.2%), Computers, Engineering & Science (240 | 11.2%), and Health Diagnosing & Treating (182 | 8.5%).
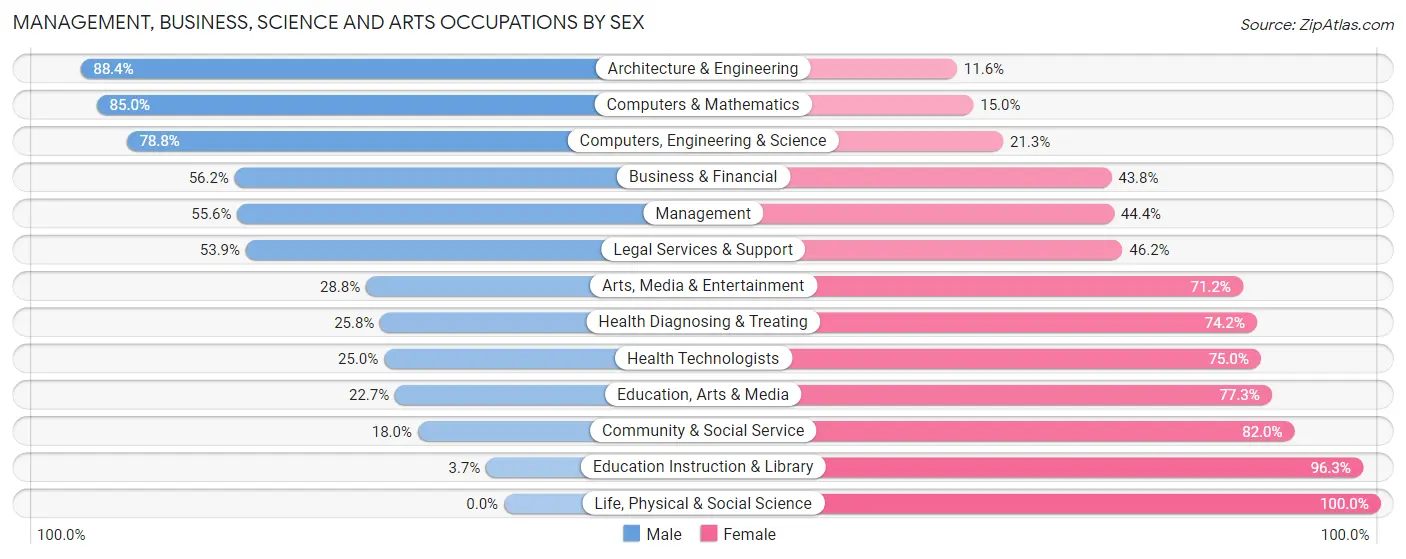
Management, Business, Science and Arts Occupations by Sex
Within the Management, Business, Science and Arts occupations in University Gardens, the most male-oriented occupations are Architecture & Engineering (88.4%), Computers & Mathematics (85.0%), and Computers, Engineering & Science (78.7%), while the most female-oriented occupations are Life, Physical & Social Science (100.0%), Education Instruction & Library (96.3%), and Community & Social Service (82.0%).
| Occupation | Male | Female |
| Management | 183 (55.6%) | 146 (44.4%) |
| Business & Financial | 91 (56.2%) | 71 (43.8%) |
| Computers, Engineering & Science | 189 (78.7%) | 51 (21.2%) |
| Computers & Mathematics | 113 (85.0%) | 20 (15.0%) |
| Architecture & Engineering | 76 (88.4%) | 10 (11.6%) |
| Life, Physical & Social Science | 0 (0.0%) | 21 (100.0%) |
| Community & Social Service | 80 (18.0%) | 365 (82.0%) |
| Education, Arts & Media | 15 (22.7%) | 51 (77.3%) |
| Legal Services & Support | 35 (53.8%) | 30 (46.2%) |
| Education Instruction & Library | 9 (3.7%) | 232 (96.3%) |
| Arts, Media & Entertainment | 21 (28.8%) | 52 (71.2%) |
| Health Diagnosing & Treating | 47 (25.8%) | 135 (74.2%) |
| Health Technologists | 40 (25.0%) | 120 (75.0%) |
| Total (Category) | 590 (43.4%) | 768 (56.6%) |
| Total (Overall) | 1,019 (47.5%) | 1,128 (52.5%) |
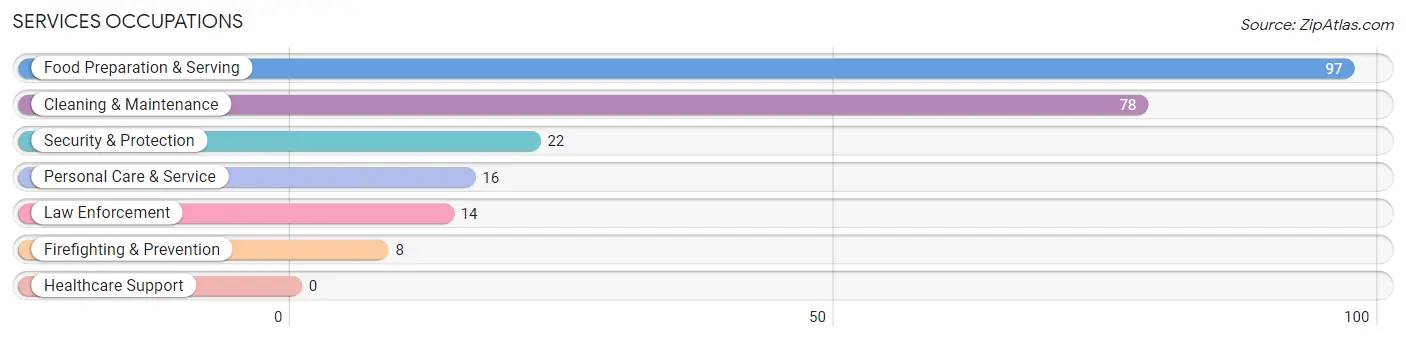
Services Occupations
The most common Services occupations in University Gardens are Food Preparation & Serving (97 | 4.5%), Cleaning & Maintenance (78 | 3.6%), Security & Protection (22 | 1.0%), Personal Care & Service (16 | 0.7%), and Law Enforcement (14 | 0.6%).
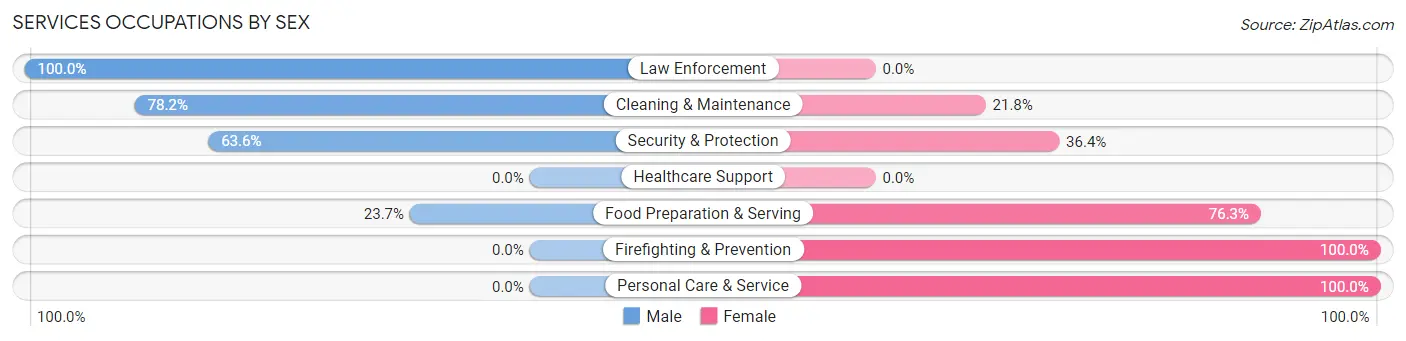
Services Occupations by Sex
Within the Services occupations in University Gardens, the most male-oriented occupations are Law Enforcement (100.0%), Cleaning & Maintenance (78.2%), and Security & Protection (63.6%), while the most female-oriented occupations are Firefighting & Prevention (100.0%), Personal Care & Service (100.0%), and Food Preparation & Serving (76.3%).
| Occupation | Male | Female |
| Healthcare Support | 0 (0.0%) | 0 (0.0%) |
| Security & Protection | 14 (63.6%) | 8 (36.4%) |
| Firefighting & Prevention | 0 (0.0%) | 8 (100.0%) |
| Law Enforcement | 14 (100.0%) | 0 (0.0%) |
| Food Preparation & Serving | 23 (23.7%) | 74 (76.3%) |
| Cleaning & Maintenance | 61 (78.2%) | 17 (21.8%) |
| Personal Care & Service | 0 (0.0%) | 16 (100.0%) |
| Total (Category) | 98 (46.0%) | 115 (54.0%) |
| Total (Overall) | 1,019 (47.5%) | 1,128 (52.5%) |
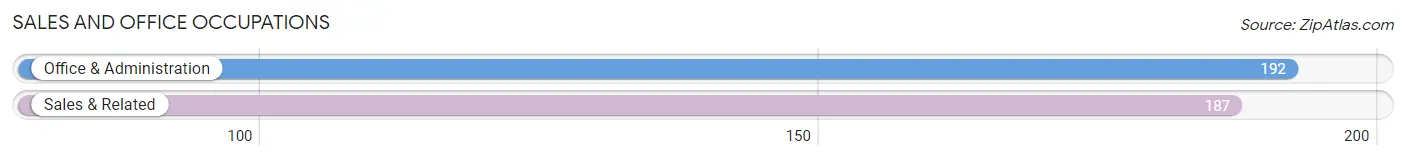
Sales and Office Occupations
The most common Sales and Office occupations in University Gardens are Office & Administration (192 | 8.9%), and Sales & Related (187 | 8.7%).
Sales and Office Occupations by Sex
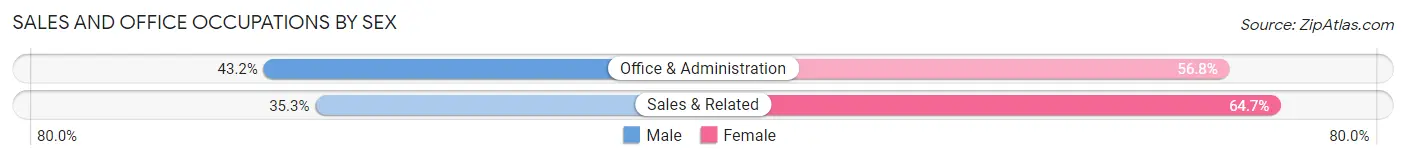
| Occupation | Male | Female |
| Sales & Related | 66 (35.3%) | 121 (64.7%) |
| Office & Administration | 83 (43.2%) | 109 (56.8%) |
| Total (Category) | 149 (39.3%) | 230 (60.7%) |
| Total (Overall) | 1,019 (47.5%) | 1,128 (52.5%) |
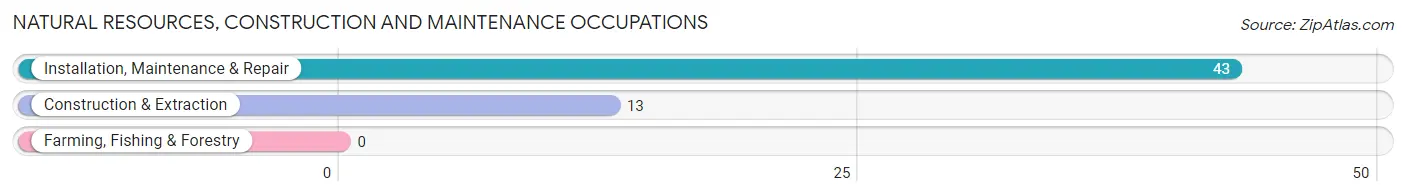
Natural Resources, Construction and Maintenance Occupations
The most common Natural Resources, Construction and Maintenance occupations in University Gardens are Installation, Maintenance & Repair (43 | 2.0%), and Construction & Extraction (13 | 0.6%).
Natural Resources, Construction and Maintenance Occupations by Sex
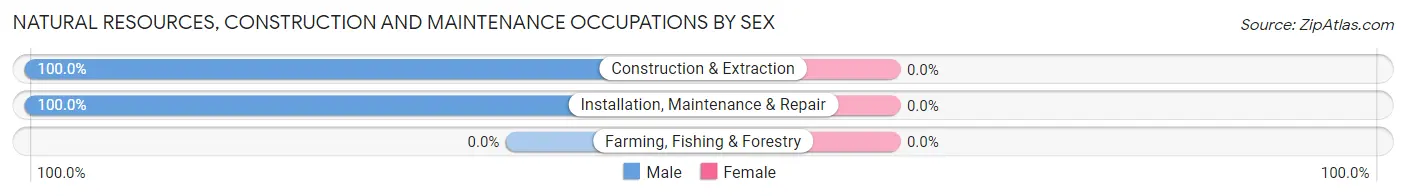
| Occupation | Male | Female |
| Farming, Fishing & Forestry | 0 (0.0%) | 0 (0.0%) |
| Construction & Extraction | 13 (100.0%) | 0 (0.0%) |
| Installation, Maintenance & Repair | 43 (100.0%) | 0 (0.0%) |
| Total (Category) | 56 (100.0%) | 0 (0.0%) |
| Total (Overall) | 1,019 (47.5%) | 1,128 (52.5%) |
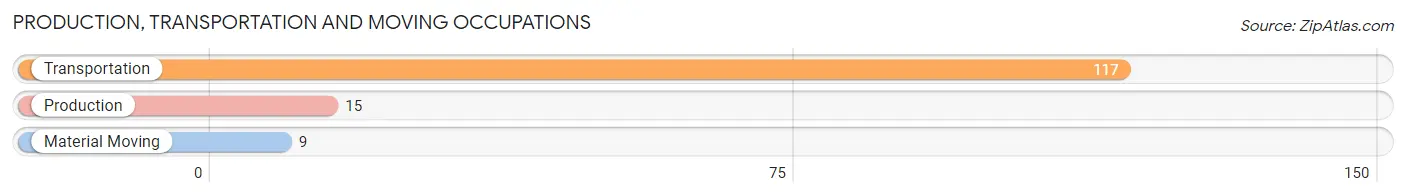
Production, Transportation and Moving Occupations
The most common Production, Transportation and Moving occupations in University Gardens are Transportation (117 | 5.4%), Production (15 | 0.7%), and Material Moving (9 | 0.4%).
Production, Transportation and Moving Occupations by Sex
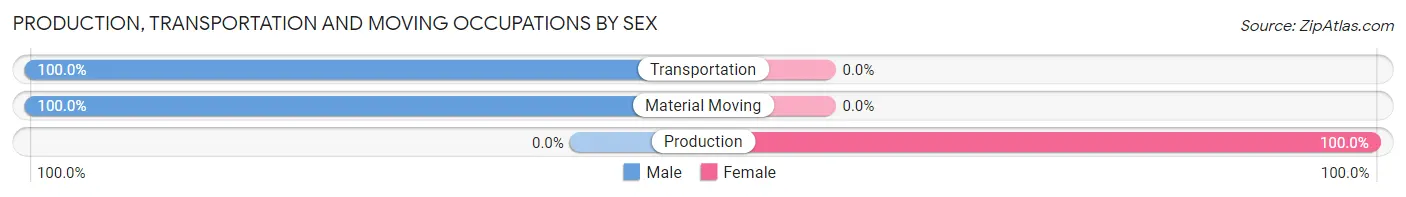
| Occupation | Male | Female |
| Production | 0 (0.0%) | 15 (100.0%) |
| Transportation | 117 (100.0%) | 0 (0.0%) |
| Material Moving | 9 (100.0%) | 0 (0.0%) |
| Total (Category) | 126 (89.4%) | 15 (10.6%) |
| Total (Overall) | 1,019 (47.5%) | 1,128 (52.5%) |
Employment Industries by Sex in University Gardens
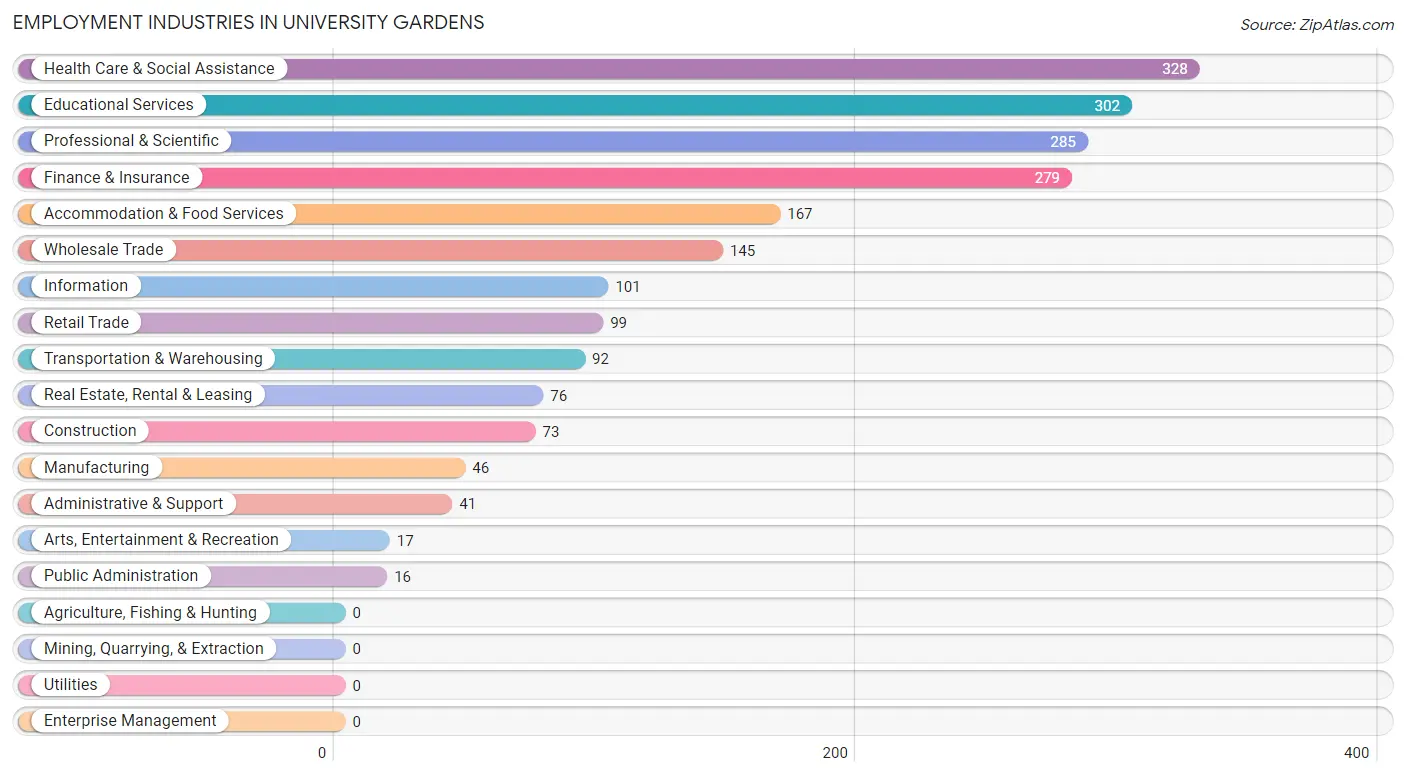
Employment Industries in University Gardens
The major employment industries in University Gardens include Health Care & Social Assistance (328 | 15.3%), Educational Services (302 | 14.1%), Professional & Scientific (285 | 13.3%), Finance & Insurance (279 | 13.0%), and Accommodation & Food Services (167 | 7.8%).
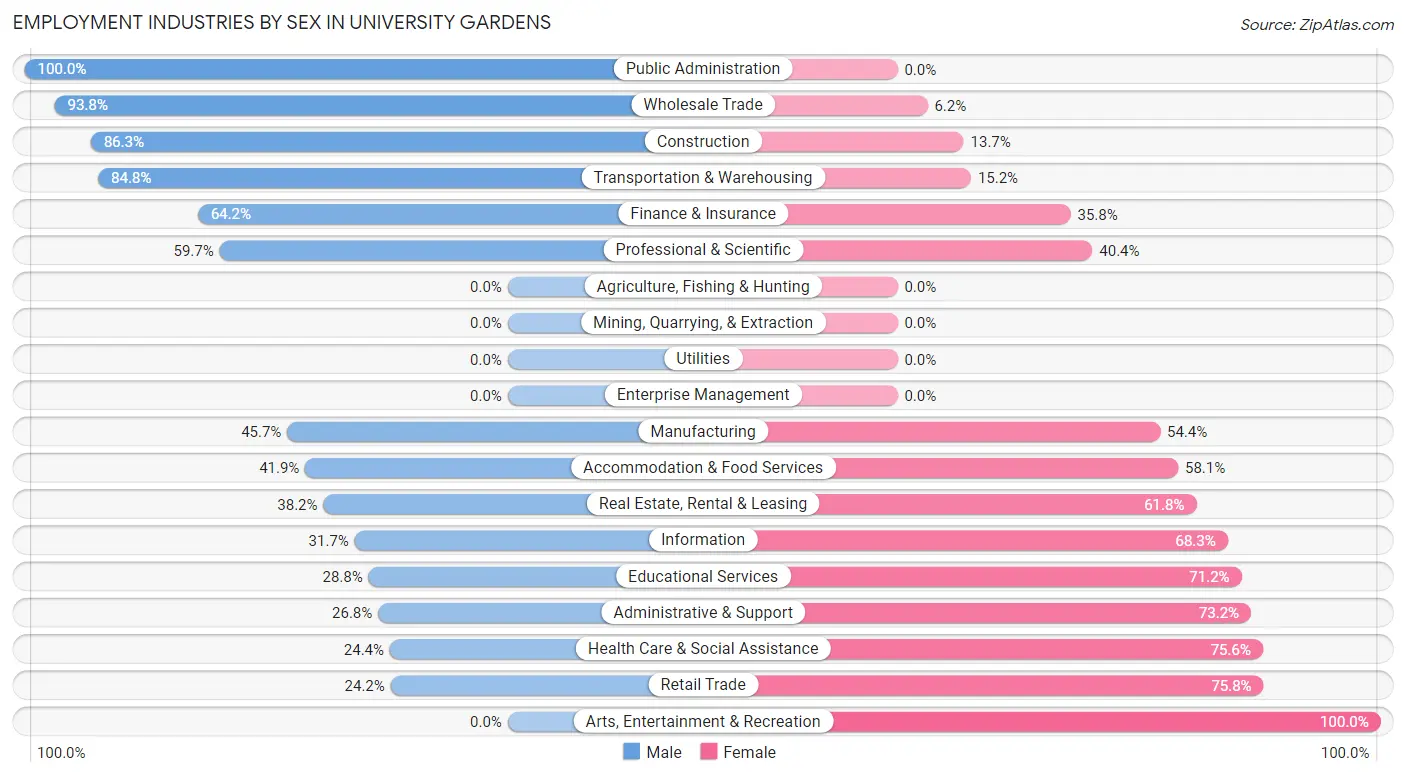
Employment Industries by Sex in University Gardens
The University Gardens industries that see more men than women are Public Administration (100.0%), Wholesale Trade (93.8%), and Construction (86.3%), whereas the industries that tend to have a higher number of women are Arts, Entertainment & Recreation (100.0%), Retail Trade (75.8%), and Health Care & Social Assistance (75.6%).
| Industry | Male | Female |
| Agriculture, Fishing & Hunting | 0 (0.0%) | 0 (0.0%) |
| Mining, Quarrying, & Extraction | 0 (0.0%) | 0 (0.0%) |
| Construction | 63 (86.3%) | 10 (13.7%) |
| Manufacturing | 21 (45.7%) | 25 (54.3%) |
| Wholesale Trade | 136 (93.8%) | 9 (6.2%) |
| Retail Trade | 24 (24.2%) | 75 (75.8%) |
| Transportation & Warehousing | 78 (84.8%) | 14 (15.2%) |
| Utilities | 0 (0.0%) | 0 (0.0%) |
| Information | 32 (31.7%) | 69 (68.3%) |
| Finance & Insurance | 179 (64.2%) | 100 (35.8%) |
| Real Estate, Rental & Leasing | 29 (38.2%) | 47 (61.8%) |
| Professional & Scientific | 170 (59.7%) | 115 (40.4%) |
| Enterprise Management | 0 (0.0%) | 0 (0.0%) |
| Administrative & Support | 11 (26.8%) | 30 (73.2%) |
| Educational Services | 87 (28.8%) | 215 (71.2%) |
| Health Care & Social Assistance | 80 (24.4%) | 248 (75.6%) |
| Arts, Entertainment & Recreation | 0 (0.0%) | 17 (100.0%) |
| Accommodation & Food Services | 70 (41.9%) | 97 (58.1%) |
| Public Administration | 16 (100.0%) | 0 (0.0%) |
| Total | 1,019 (47.5%) | 1,128 (52.5%) |
Education in University Gardens
School Enrollment in University Gardens
The most common levels of schooling among the 976 students in University Gardens are high school (208 | 21.3%), college / undergraduate (200 | 20.5%), and middle school (177 | 18.1%).
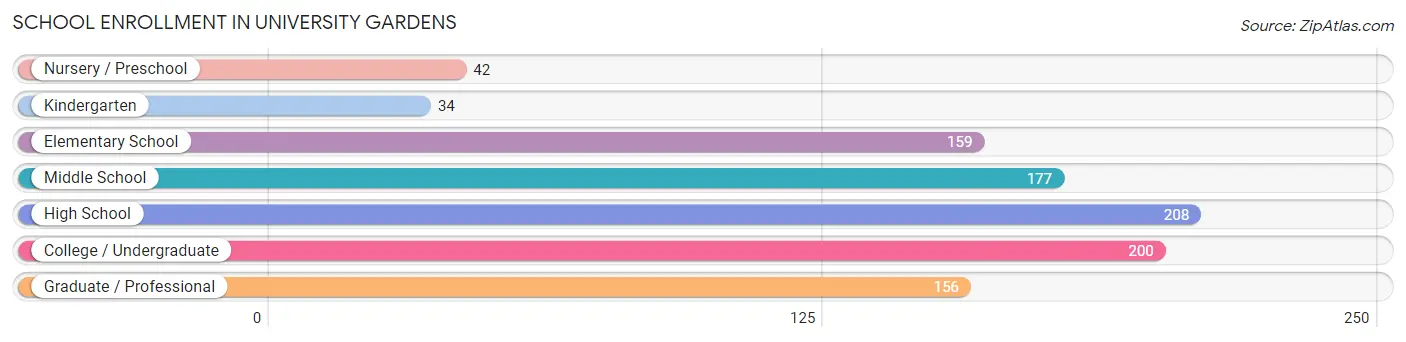
| School Level | # Students | % Students |
| Nursery / Preschool | 42 | 4.3% |
| Kindergarten | 34 | 3.5% |
| Elementary School | 159 | 16.3% |
| Middle School | 177 | 18.1% |
| High School | 208 | 21.3% |
| College / Undergraduate | 200 | 20.5% |
| Graduate / Professional | 156 | 16.0% |
| Total | 976 | 100.0% |
School Enrollment by Age by Funding Source in University Gardens
Out of a total of 976 students who are enrolled in schools in University Gardens, 211 (21.6%) attend a private institution, while the remaining 765 (78.4%) are enrolled in public schools. The age group of 25 to 34 year olds has the highest likelihood of being enrolled in private schools, with 127 (84.1% in the age bracket) enrolled. Conversely, the age group of 5 to 9 year old has the lowest likelihood of being enrolled in a private school, with 186 (100.0% in the age bracket) attending a public institution.
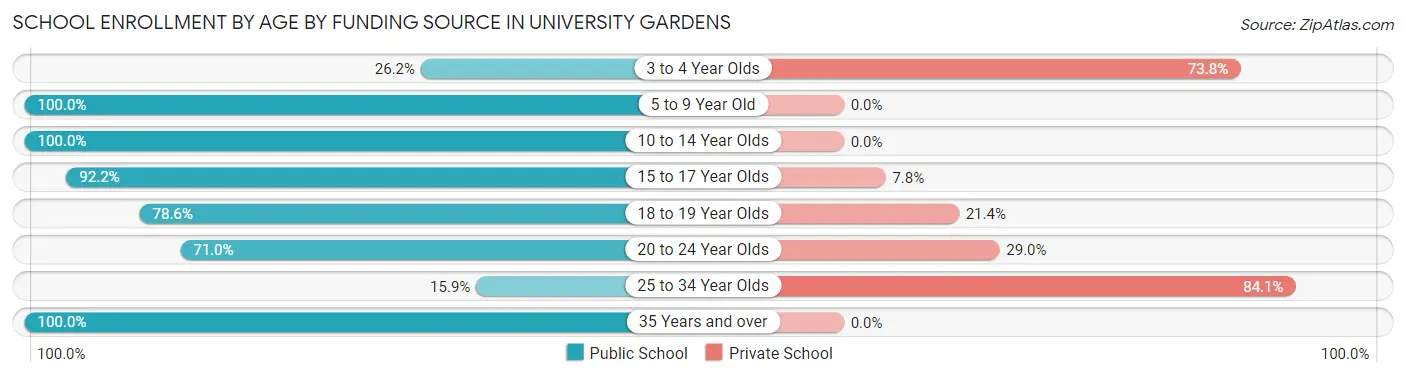
| Age Bracket | Public School | Private School |
| 3 to 4 Year Olds | 11 (26.2%) | 31 (73.8%) |
| 5 to 9 Year Old | 186 (100.0%) | 0 (0.0%) |
| 10 to 14 Year Olds | 220 (100.0%) | 0 (0.0%) |
| 15 to 17 Year Olds | 142 (92.2%) | 12 (7.8%) |
| 18 to 19 Year Olds | 44 (78.6%) | 12 (21.4%) |
| 20 to 24 Year Olds | 71 (71.0%) | 29 (29.0%) |
| 25 to 34 Year Olds | 24 (15.9%) | 127 (84.1%) |
| 35 Years and over | 67 (100.0%) | 0 (0.0%) |
| Total | 765 (78.4%) | 211 (21.6%) |
Educational Attainment by Field of Study in University Gardens
Social sciences (335 | 17.9%), business (297 | 15.9%), science & technology (210 | 11.2%), education (156 | 8.3%), and computers & mathematics (132 | 7.1%) are the most common fields of study among 1,871 individuals in University Gardens who have obtained a bachelor's degree or higher.
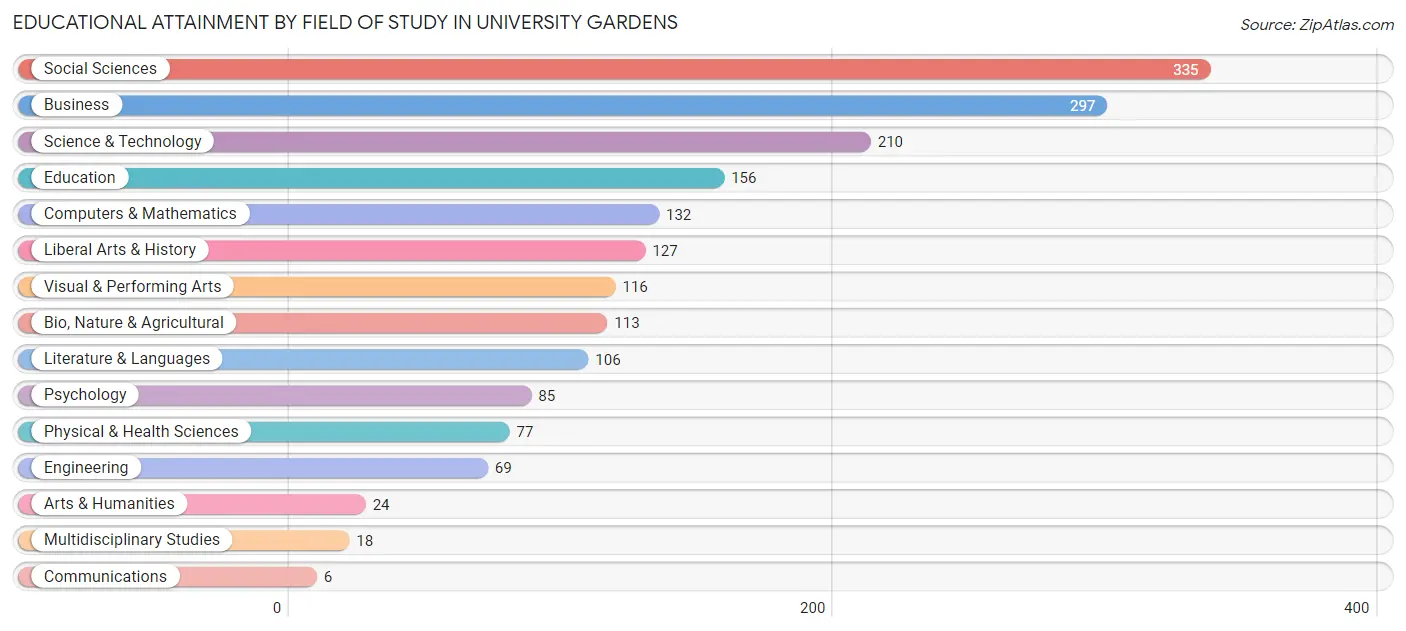
| Field of Study | # Graduates | % Graduates |
| Computers & Mathematics | 132 | 7.1% |
| Bio, Nature & Agricultural | 113 | 6.0% |
| Physical & Health Sciences | 77 | 4.1% |
| Psychology | 85 | 4.5% |
| Social Sciences | 335 | 17.9% |
| Engineering | 69 | 3.7% |
| Multidisciplinary Studies | 18 | 1.0% |
| Science & Technology | 210 | 11.2% |
| Business | 297 | 15.9% |
| Education | 156 | 8.3% |
| Literature & Languages | 106 | 5.7% |
| Liberal Arts & History | 127 | 6.8% |
| Visual & Performing Arts | 116 | 6.2% |
| Communications | 6 | 0.3% |
| Arts & Humanities | 24 | 1.3% |
| Total | 1,871 | 100.0% |
Transportation & Commute in University Gardens
Vehicle Availability by Sex in University Gardens
The most prevalent vehicle ownership categories in University Gardens are males with 2 vehicles (393, accounting for 38.6%) and females with 2 vehicles (371, making up 34.8%).
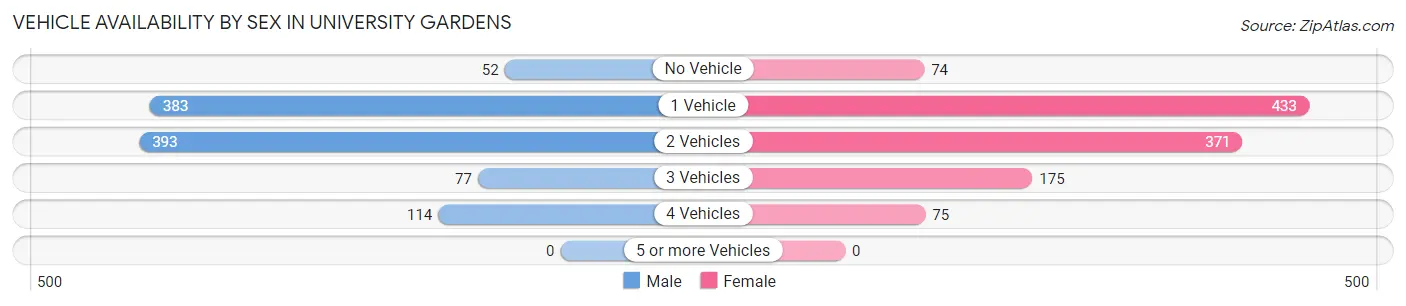
| Vehicles Available | Male | Female |
| No Vehicle | 52 (5.1%) | 74 (6.6%) |
| 1 Vehicle | 383 (37.6%) | 433 (38.4%) |
| 2 Vehicles | 393 (38.6%) | 371 (32.9%) |
| 3 Vehicles | 77 (7.6%) | 175 (15.5%) |
| 4 Vehicles | 114 (11.2%) | 75 (6.7%) |
| 5 or more Vehicles | 0 (0.0%) | 0 (0.0%) |
| Total | 1,019 (100.0%) | 1,128 (100.0%) |
Commute Time in University Gardens
The most frequently occuring commute durations in University Gardens are 60 to 89 minutes (641 commuters, 34.4%), 30 to 34 minutes (238 commuters, 12.8%), and 10 to 14 minutes (180 commuters, 9.7%).
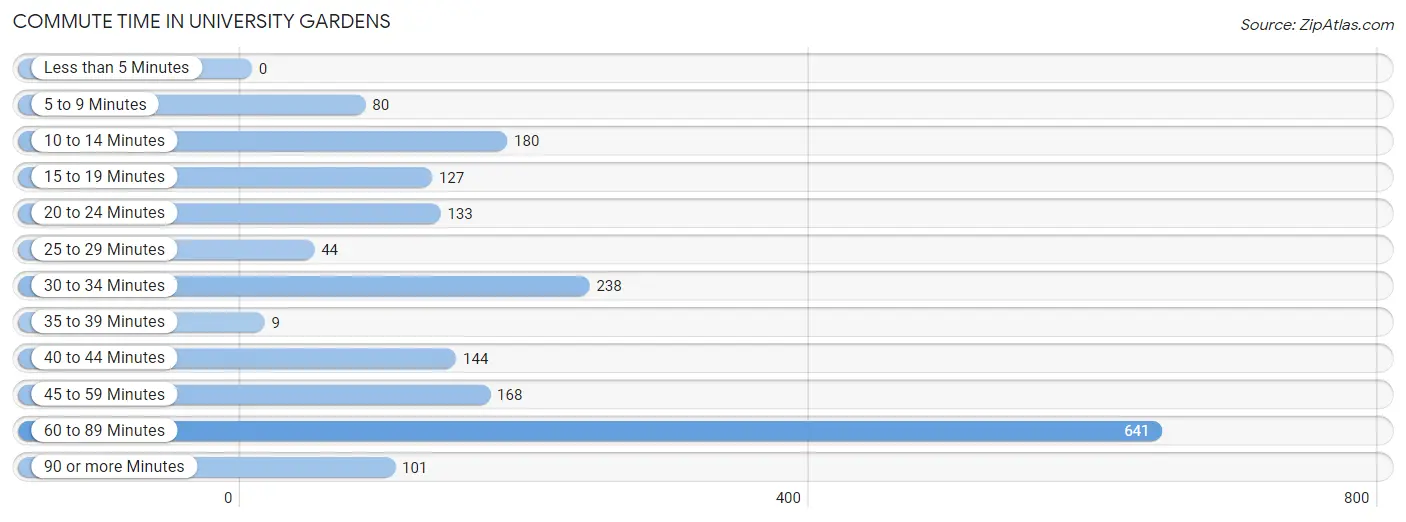
| Commute Time | # Commuters | % Commuters |
| Less than 5 Minutes | 0 | 0.0% |
| 5 to 9 Minutes | 80 | 4.3% |
| 10 to 14 Minutes | 180 | 9.7% |
| 15 to 19 Minutes | 127 | 6.8% |
| 20 to 24 Minutes | 133 | 7.1% |
| 25 to 29 Minutes | 44 | 2.4% |
| 30 to 34 Minutes | 238 | 12.8% |
| 35 to 39 Minutes | 9 | 0.5% |
| 40 to 44 Minutes | 144 | 7.7% |
| 45 to 59 Minutes | 168 | 9.0% |
| 60 to 89 Minutes | 641 | 34.4% |
| 90 or more Minutes | 101 | 5.4% |
Commute Time by Sex in University Gardens
The most common commute times in University Gardens are 60 to 89 minutes (280 commuters, 31.0%) for males and 60 to 89 minutes (361 commuters, 37.5%) for females.
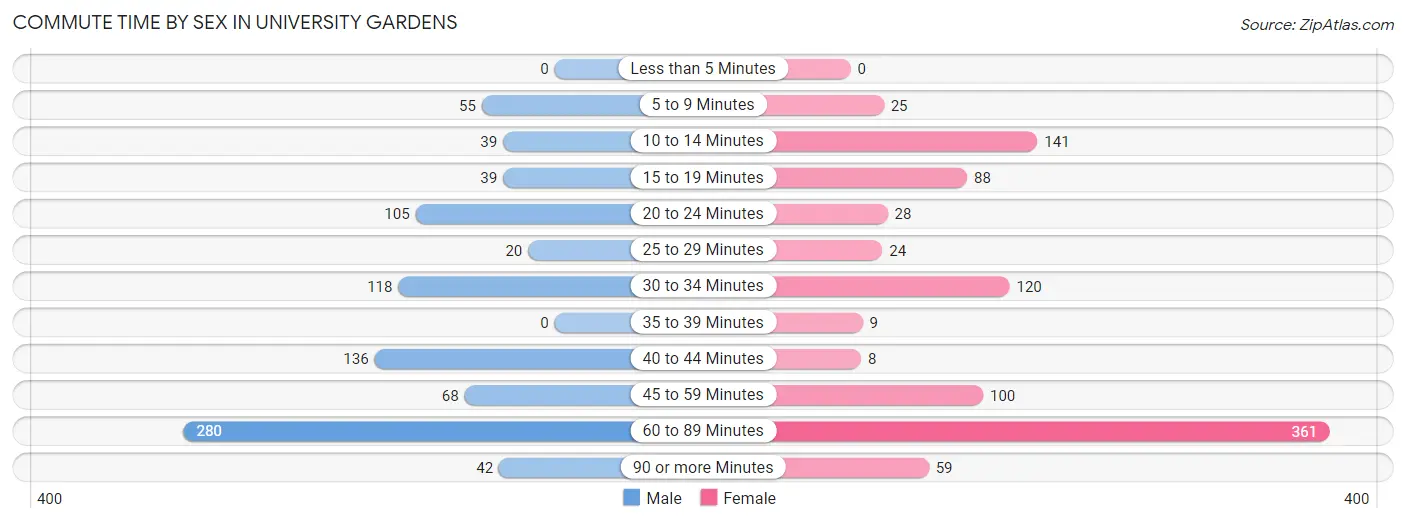
| Commute Time | Male | Female |
| Less than 5 Minutes | 0 (0.0%) | 0 (0.0%) |
| 5 to 9 Minutes | 55 (6.1%) | 25 (2.6%) |
| 10 to 14 Minutes | 39 (4.3%) | 141 (14.6%) |
| 15 to 19 Minutes | 39 (4.3%) | 88 (9.1%) |
| 20 to 24 Minutes | 105 (11.6%) | 28 (2.9%) |
| 25 to 29 Minutes | 20 (2.2%) | 24 (2.5%) |
| 30 to 34 Minutes | 118 (13.1%) | 120 (12.5%) |
| 35 to 39 Minutes | 0 (0.0%) | 9 (0.9%) |
| 40 to 44 Minutes | 136 (15.1%) | 8 (0.8%) |
| 45 to 59 Minutes | 68 (7.5%) | 100 (10.4%) |
| 60 to 89 Minutes | 280 (31.0%) | 361 (37.5%) |
| 90 or more Minutes | 42 (4.7%) | 59 (6.1%) |
Time of Departure to Work by Sex in University Gardens
The most frequent times of departure to work in University Gardens are 8:00 AM to 8:29 AM (171, 19.0%) for males and 7:00 AM to 7:29 AM (221, 23.0%) for females.
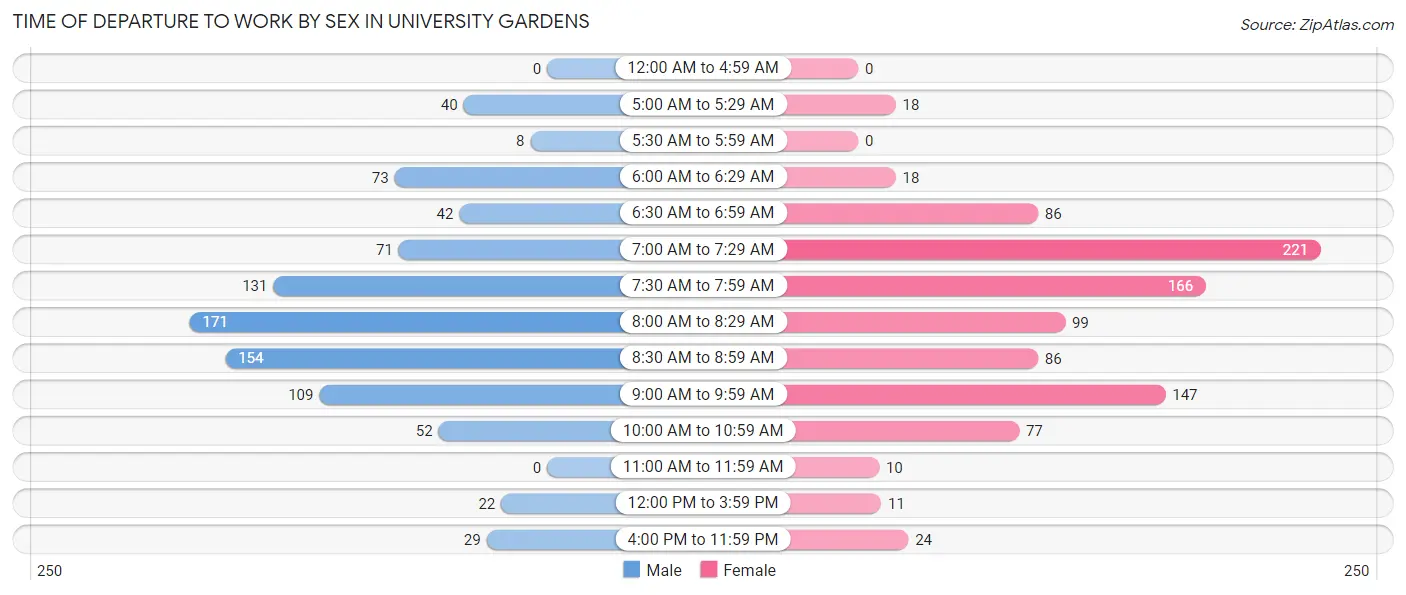
| Time of Departure | Male | Female |
| 12:00 AM to 4:59 AM | 0 (0.0%) | 0 (0.0%) |
| 5:00 AM to 5:29 AM | 40 (4.4%) | 18 (1.9%) |
| 5:30 AM to 5:59 AM | 8 (0.9%) | 0 (0.0%) |
| 6:00 AM to 6:29 AM | 73 (8.1%) | 18 (1.9%) |
| 6:30 AM to 6:59 AM | 42 (4.7%) | 86 (8.9%) |
| 7:00 AM to 7:29 AM | 71 (7.9%) | 221 (23.0%) |
| 7:30 AM to 7:59 AM | 131 (14.5%) | 166 (17.2%) |
| 8:00 AM to 8:29 AM | 171 (19.0%) | 99 (10.3%) |
| 8:30 AM to 8:59 AM | 154 (17.1%) | 86 (8.9%) |
| 9:00 AM to 9:59 AM | 109 (12.1%) | 147 (15.3%) |
| 10:00 AM to 10:59 AM | 52 (5.8%) | 77 (8.0%) |
| 11:00 AM to 11:59 AM | 0 (0.0%) | 10 (1.0%) |
| 12:00 PM to 3:59 PM | 22 (2.4%) | 11 (1.1%) |
| 4:00 PM to 11:59 PM | 29 (3.2%) | 24 (2.5%) |
| Total | 902 (100.0%) | 963 (100.0%) |
Housing Occupancy in University Gardens
Occupancy by Ownership in University Gardens
Of the total 1,546 dwellings in University Gardens, owner-occupied units account for 1,256 (81.2%), while renter-occupied units make up 290 (18.8%).
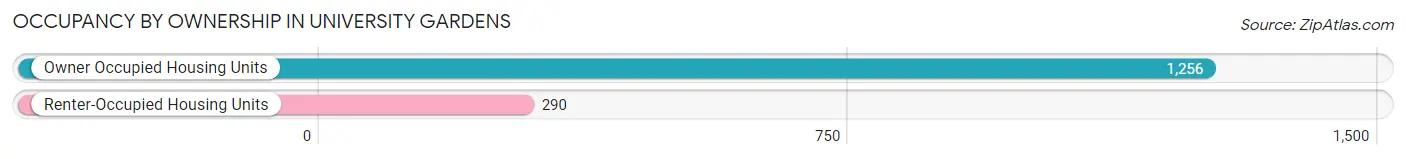
| Occupancy | # Housing Units | % Housing Units |
| Owner Occupied Housing Units | 1,256 | 81.2% |
| Renter-Occupied Housing Units | 290 | 18.8% |
| Total Occupied Housing Units | 1,546 | 100.0% |
Occupancy by Household Size in University Gardens
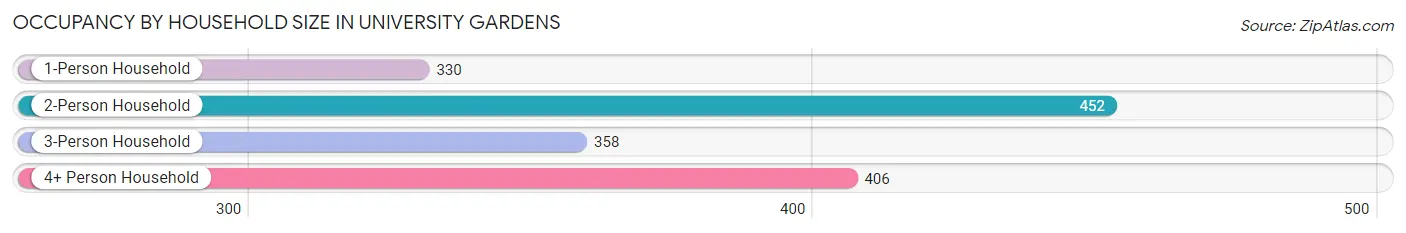
| Household Size | # Housing Units | % Housing Units |
| 1-Person Household | 330 | 21.3% |
| 2-Person Household | 452 | 29.2% |
| 3-Person Household | 358 | 23.2% |
| 4+ Person Household | 406 | 26.3% |
| Total Housing Units | 1,546 | 100.0% |
Occupancy by Ownership by Household Size in University Gardens
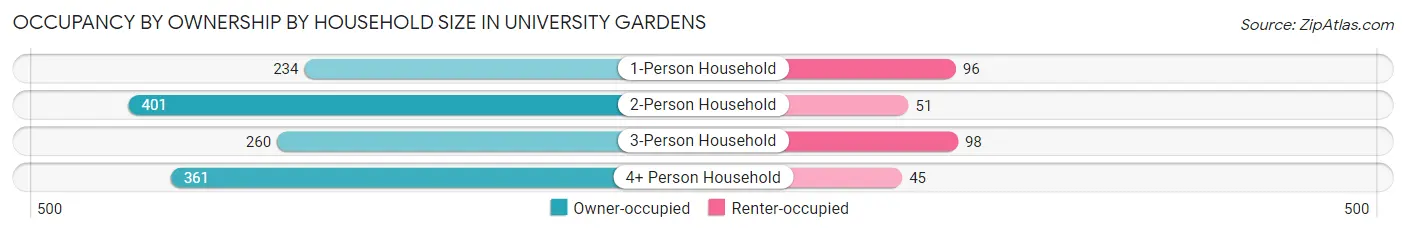
| Household Size | Owner-occupied | Renter-occupied |
| 1-Person Household | 234 (70.9%) | 96 (29.1%) |
| 2-Person Household | 401 (88.7%) | 51 (11.3%) |
| 3-Person Household | 260 (72.6%) | 98 (27.4%) |
| 4+ Person Household | 361 (88.9%) | 45 (11.1%) |
| Total Housing Units | 1,256 (81.2%) | 290 (18.8%) |
Occupancy by Educational Attainment in University Gardens
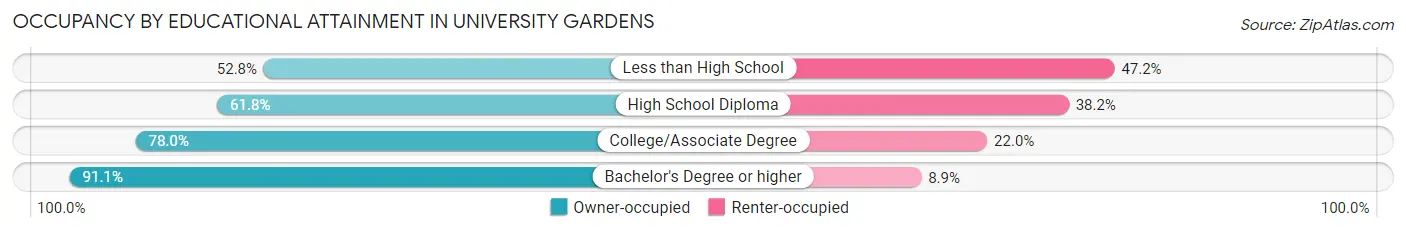
| Household Size | Owner-occupied | Renter-occupied |
| Less than High School | 86 (52.8%) | 77 (47.2%) |
| High School Diploma | 115 (61.8%) | 71 (38.2%) |
| College/Associate Degree | 209 (78.0%) | 59 (22.0%) |
| Bachelor's Degree or higher | 846 (91.1%) | 83 (8.9%) |
Occupancy by Age of Householder in University Gardens
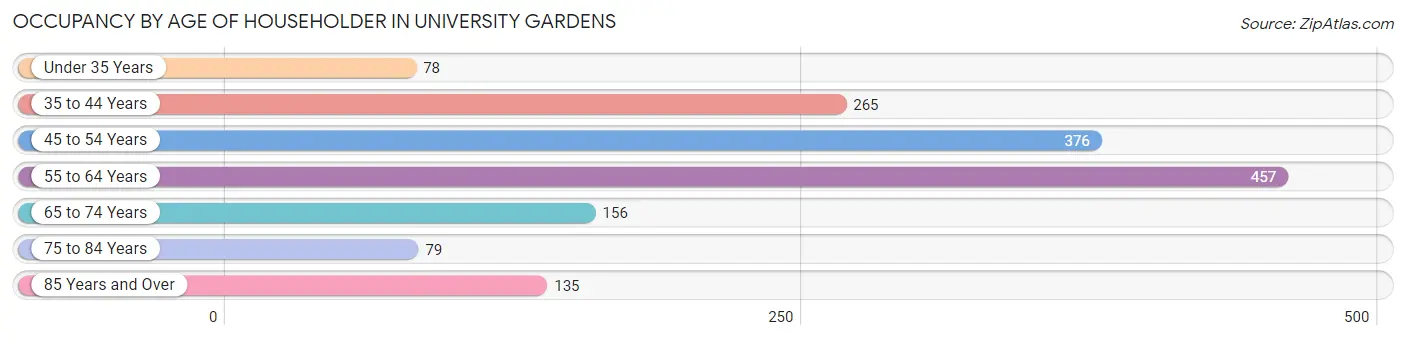
| Age Bracket | # Households | % Households |
| Under 35 Years | 78 | 5.1% |
| 35 to 44 Years | 265 | 17.1% |
| 45 to 54 Years | 376 | 24.3% |
| 55 to 64 Years | 457 | 29.6% |
| 65 to 74 Years | 156 | 10.1% |
| 75 to 84 Years | 79 | 5.1% |
| 85 Years and Over | 135 | 8.7% |
| Total | 1,546 | 100.0% |
Housing Finances in University Gardens
Median Income by Occupancy in University Gardens
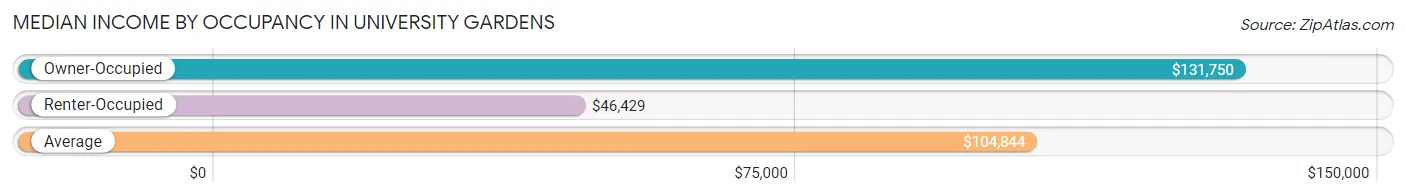
| Occupancy Type | # Households | Median Income |
| Owner-Occupied | 1,256 (81.2%) | $131,750 |
| Renter-Occupied | 290 (18.8%) | $46,429 |
| Average | 1,546 (100.0%) | $104,844 |
Occupancy by Householder Income Bracket in University Gardens
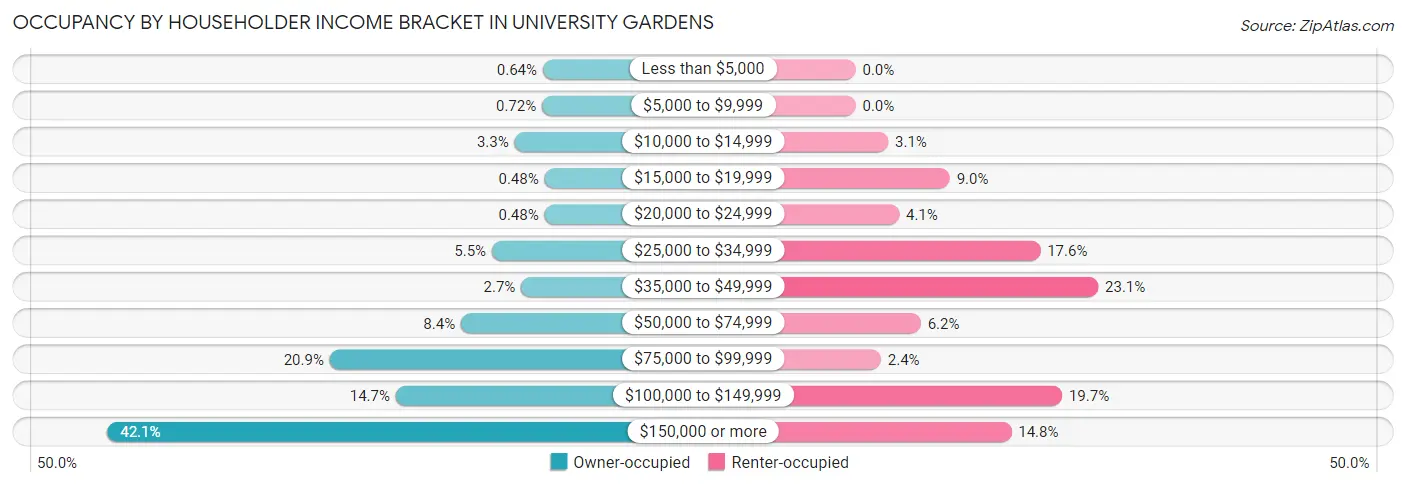
| Income Bracket | Owner-occupied | Renter-occupied |
| Less than $5,000 | 8 (0.6%) | 0 (0.0%) |
| $5,000 to $9,999 | 9 (0.7%) | 0 (0.0%) |
| $10,000 to $14,999 | 42 (3.3%) | 9 (3.1%) |
| $15,000 to $19,999 | 6 (0.5%) | 26 (9.0%) |
| $20,000 to $24,999 | 6 (0.5%) | 12 (4.1%) |
| $25,000 to $34,999 | 69 (5.5%) | 51 (17.6%) |
| $35,000 to $49,999 | 34 (2.7%) | 67 (23.1%) |
| $50,000 to $74,999 | 106 (8.4%) | 18 (6.2%) |
| $75,000 to $99,999 | 263 (20.9%) | 7 (2.4%) |
| $100,000 to $149,999 | 184 (14.6%) | 57 (19.7%) |
| $150,000 or more | 529 (42.1%) | 43 (14.8%) |
| Total | 1,256 (100.0%) | 290 (100.0%) |
Monthly Housing Cost Tiers in University Gardens
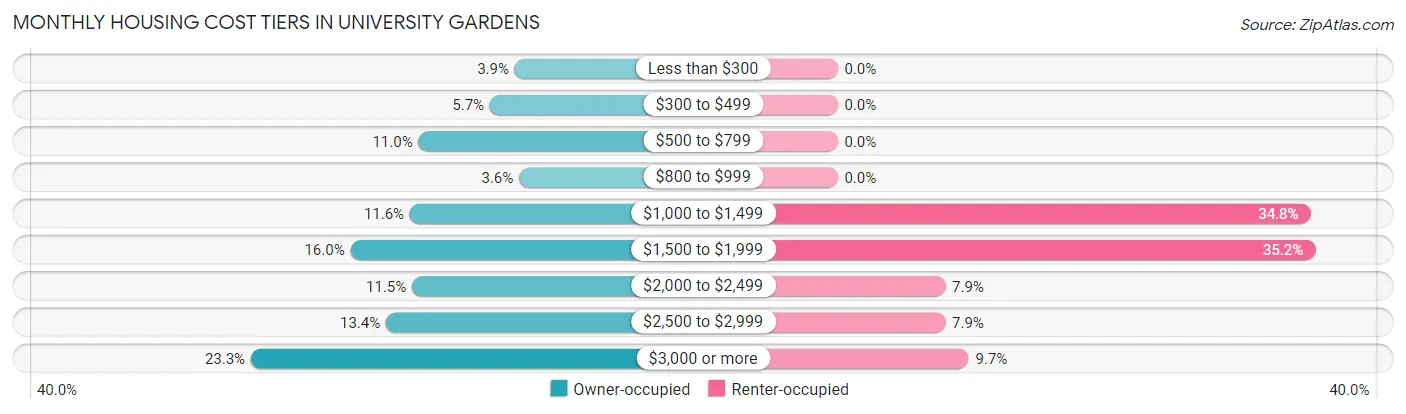
| Monthly Cost | Owner-occupied | Renter-occupied |
| Less than $300 | 49 (3.9%) | 0 (0.0%) |
| $300 to $499 | 72 (5.7%) | 0 (0.0%) |
| $500 to $799 | 138 (11.0%) | 0 (0.0%) |
| $800 to $999 | 45 (3.6%) | 0 (0.0%) |
| $1,000 to $1,499 | 146 (11.6%) | 101 (34.8%) |
| $1,500 to $1,999 | 201 (16.0%) | 102 (35.2%) |
| $2,000 to $2,499 | 144 (11.5%) | 23 (7.9%) |
| $2,500 to $2,999 | 168 (13.4%) | 23 (7.9%) |
| $3,000 or more | 293 (23.3%) | 28 (9.7%) |
| Total | 1,256 (100.0%) | 290 (100.0%) |
Physical Housing Characteristics in University Gardens
Housing Structures in University Gardens
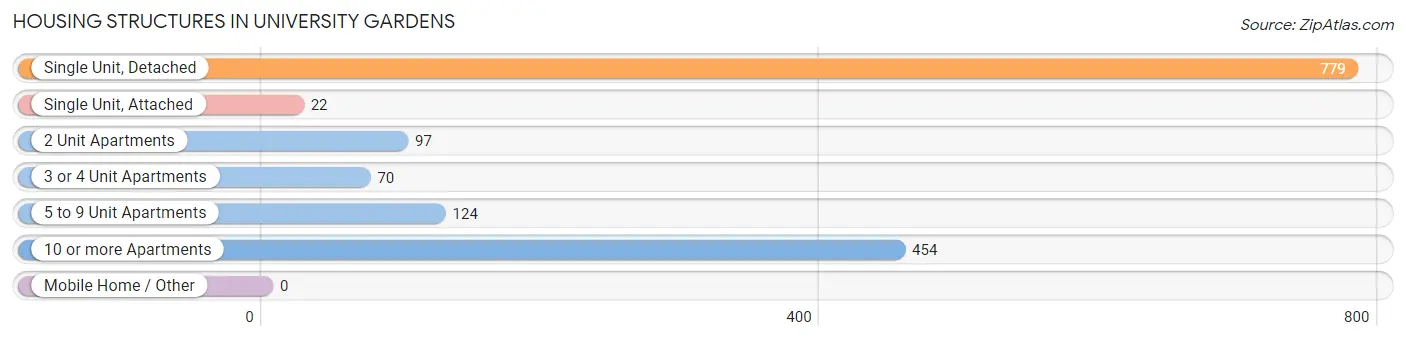
| Structure Type | # Housing Units | % Housing Units |
| Single Unit, Detached | 779 | 50.4% |
| Single Unit, Attached | 22 | 1.4% |
| 2 Unit Apartments | 97 | 6.3% |
| 3 or 4 Unit Apartments | 70 | 4.5% |
| 5 to 9 Unit Apartments | 124 | 8.0% |
| 10 or more Apartments | 454 | 29.4% |
| Mobile Home / Other | 0 | 0.0% |
| Total | 1,546 | 100.0% |
Housing Structures by Occupancy in University Gardens
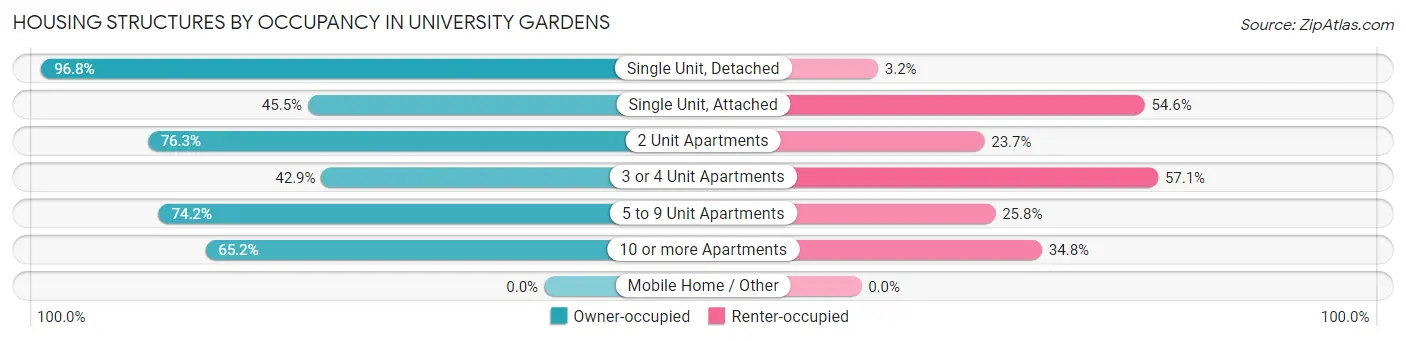
| Structure Type | Owner-occupied | Renter-occupied |
| Single Unit, Detached | 754 (96.8%) | 25 (3.2%) |
| Single Unit, Attached | 10 (45.5%) | 12 (54.5%) |
| 2 Unit Apartments | 74 (76.3%) | 23 (23.7%) |
| 3 or 4 Unit Apartments | 30 (42.9%) | 40 (57.1%) |
| 5 to 9 Unit Apartments | 92 (74.2%) | 32 (25.8%) |
| 10 or more Apartments | 296 (65.2%) | 158 (34.8%) |
| Mobile Home / Other | 0 (0.0%) | 0 (0.0%) |
| Total | 1,256 (81.2%) | 290 (18.8%) |
Housing Structures by Number of Rooms in University Gardens
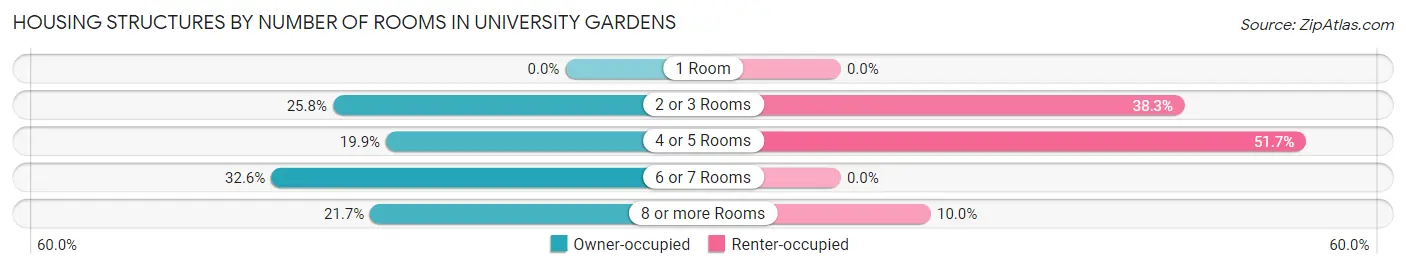
| Number of Rooms | Owner-occupied | Renter-occupied |
| 1 Room | 0 (0.0%) | 0 (0.0%) |
| 2 or 3 Rooms | 324 (25.8%) | 111 (38.3%) |
| 4 or 5 Rooms | 250 (19.9%) | 150 (51.7%) |
| 6 or 7 Rooms | 410 (32.6%) | 0 (0.0%) |
| 8 or more Rooms | 272 (21.7%) | 29 (10.0%) |
| Total | 1,256 (100.0%) | 290 (100.0%) |
Housing Structure by Heating Type in University Gardens
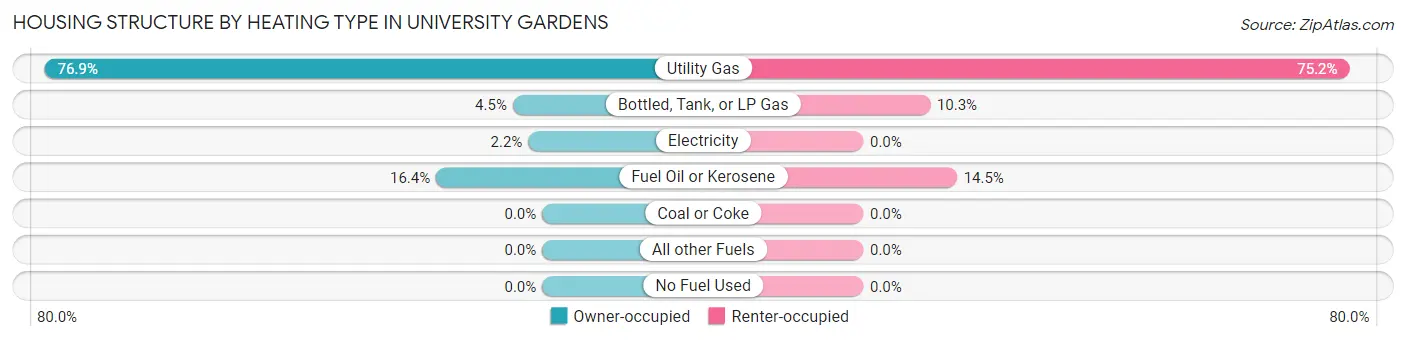
| Heating Type | Owner-occupied | Renter-occupied |
| Utility Gas | 966 (76.9%) | 218 (75.2%) |
| Bottled, Tank, or LP Gas | 57 (4.5%) | 30 (10.3%) |
| Electricity | 27 (2.1%) | 0 (0.0%) |
| Fuel Oil or Kerosene | 206 (16.4%) | 42 (14.5%) |
| Coal or Coke | 0 (0.0%) | 0 (0.0%) |
| All other Fuels | 0 (0.0%) | 0 (0.0%) |
| No Fuel Used | 0 (0.0%) | 0 (0.0%) |
| Total | 1,256 (100.0%) | 290 (100.0%) |
Household Vehicle Usage in University Gardens
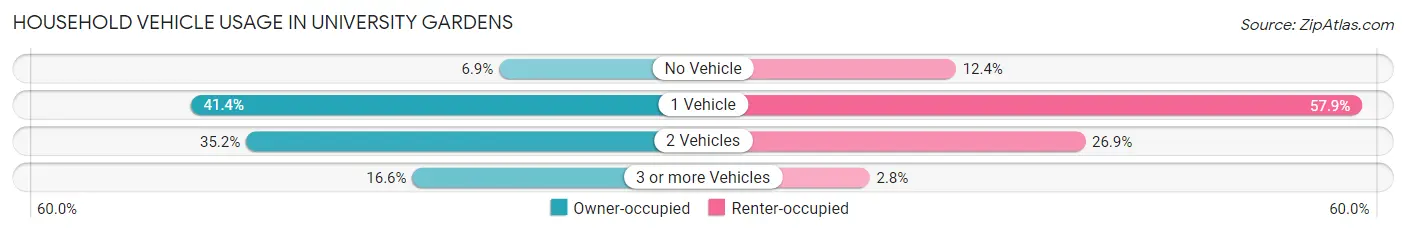
| Vehicles per Household | Owner-occupied | Renter-occupied |
| No Vehicle | 86 (6.9%) | 36 (12.4%) |
| 1 Vehicle | 520 (41.4%) | 168 (57.9%) |
| 2 Vehicles | 442 (35.2%) | 78 (26.9%) |
| 3 or more Vehicles | 208 (16.6%) | 8 (2.8%) |
| Total | 1,256 (100.0%) | 290 (100.0%) |
Real Estate & Mortgages in University Gardens
Real Estate and Mortgage Overview in University Gardens
| Characteristic | Without Mortgage | With Mortgage |
| Housing Units | 581 | 675 |
| Median Property Value | $812,500 | $872,000 |
| Median Household Income | $91,615 | $298 |
| Monthly Housing Costs | $1,430 | $280 |
| Real Estate Taxes | $10,001 | $146 |
Property Value by Mortgage Status in University Gardens
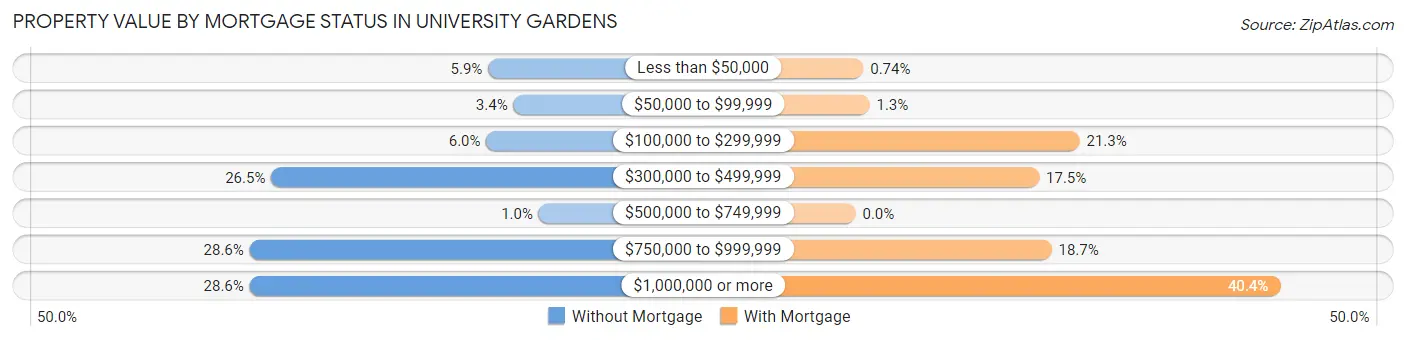
| Property Value | Without Mortgage | With Mortgage |
| Less than $50,000 | 34 (5.9%) | 5 (0.7%) |
| $50,000 to $99,999 | 20 (3.4%) | 9 (1.3%) |
| $100,000 to $299,999 | 35 (6.0%) | 144 (21.3%) |
| $300,000 to $499,999 | 154 (26.5%) | 118 (17.5%) |
| $500,000 to $749,999 | 6 (1.0%) | 0 (0.0%) |
| $750,000 to $999,999 | 166 (28.6%) | 126 (18.7%) |
| $1,000,000 or more | 166 (28.6%) | 273 (40.4%) |
| Total | 581 (100.0%) | 675 (100.0%) |
Household Income by Mortgage Status in University Gardens
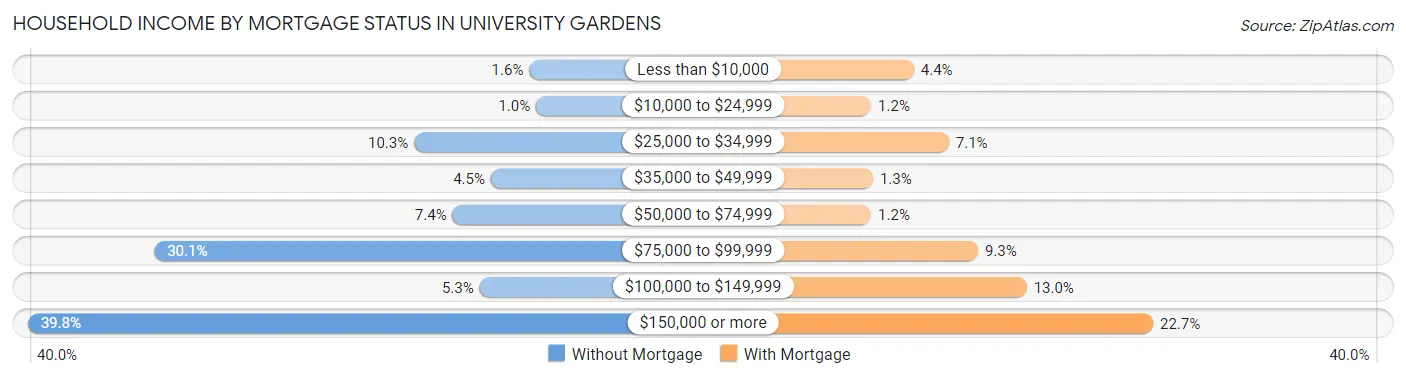
| Household Income | Without Mortgage | With Mortgage |
| Less than $10,000 | 9 (1.5%) | 30 (4.4%) |
| $10,000 to $24,999 | 6 (1.0%) | 8 (1.2%) |
| $25,000 to $34,999 | 60 (10.3%) | 48 (7.1%) |
| $35,000 to $49,999 | 26 (4.5%) | 9 (1.3%) |
| $50,000 to $74,999 | 43 (7.4%) | 8 (1.2%) |
| $75,000 to $99,999 | 175 (30.1%) | 63 (9.3%) |
| $100,000 to $149,999 | 31 (5.3%) | 88 (13.0%) |
| $150,000 or more | 231 (39.8%) | 153 (22.7%) |
| Total | 581 (100.0%) | 675 (100.0%) |
Property Value to Household Income Ratio in University Gardens
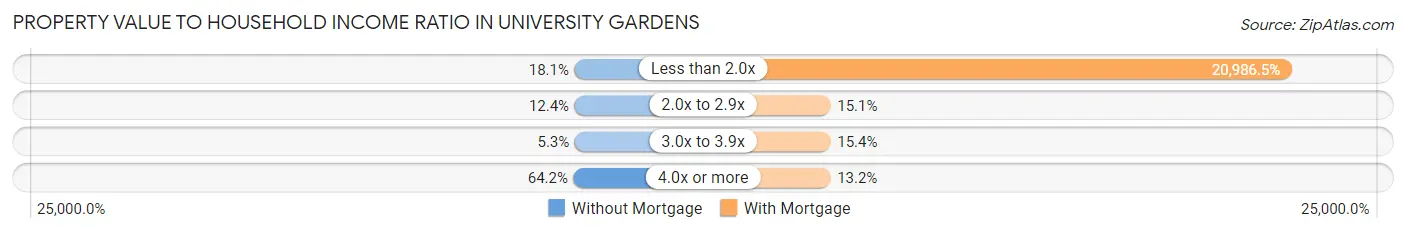
| Value-to-Income Ratio | Without Mortgage | With Mortgage |
| Less than 2.0x | 105 (18.1%) | 141,659 (20,986.5%) |
| 2.0x to 2.9x | 72 (12.4%) | 102 (15.1%) |
| 3.0x to 3.9x | 31 (5.3%) | 104 (15.4%) |
| 4.0x or more | 373 (64.2%) | 89 (13.2%) |
| Total | 581 (100.0%) | 675 (100.0%) |
Real Estate Taxes by Mortgage Status in University Gardens
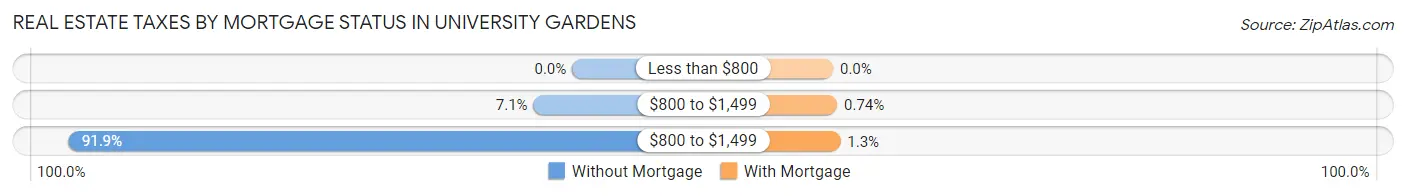
| Property Taxes | Without Mortgage | With Mortgage |
| Less than $800 | 0 (0.0%) | 0 (0.0%) |
| $800 to $1,499 | 41 (7.1%) | 5 (0.7%) |
| $800 to $1,499 | 534 (91.9%) | 9 (1.3%) |
| Total | 581 (100.0%) | 675 (100.0%) |
Health & Disability in University Gardens
Health Insurance Coverage by Age in University Gardens
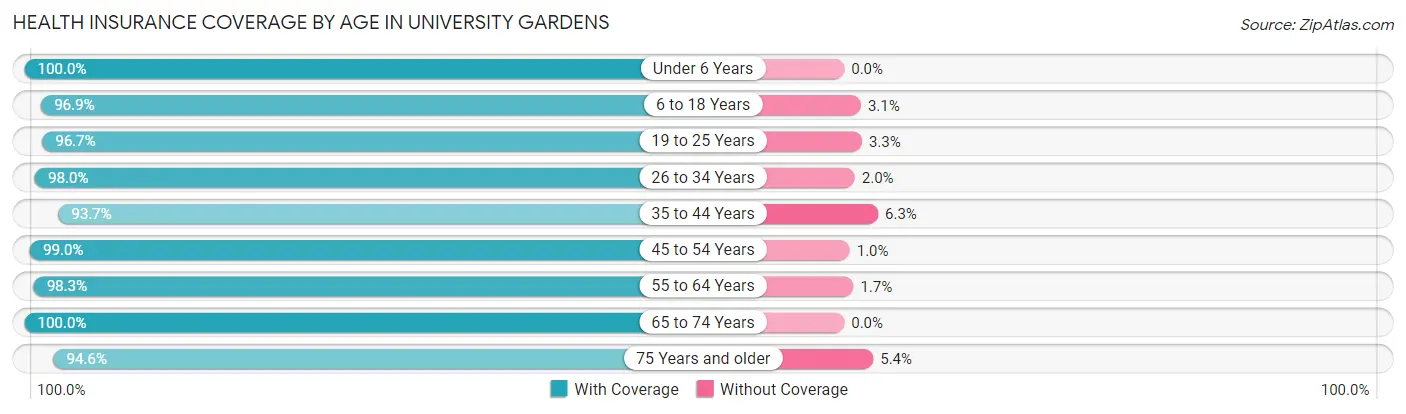
| Age Bracket | With Coverage | Without Coverage |
| Under 6 Years | 207 (100.0%) | 0 (0.0%) |
| 6 to 18 Years | 561 (96.9%) | 18 (3.1%) |
| 19 to 25 Years | 322 (96.7%) | 11 (3.3%) |
| 26 to 34 Years | 398 (98.0%) | 8 (2.0%) |
| 35 to 44 Years | 491 (93.7%) | 33 (6.3%) |
| 45 to 54 Years | 676 (99.0%) | 7 (1.0%) |
| 55 to 64 Years | 747 (98.3%) | 13 (1.7%) |
| 65 to 74 Years | 309 (100.0%) | 0 (0.0%) |
| 75 Years and older | 350 (94.6%) | 20 (5.4%) |
| Total | 4,061 (97.4%) | 110 (2.6%) |
Health Insurance Coverage by Citizenship Status in University Gardens
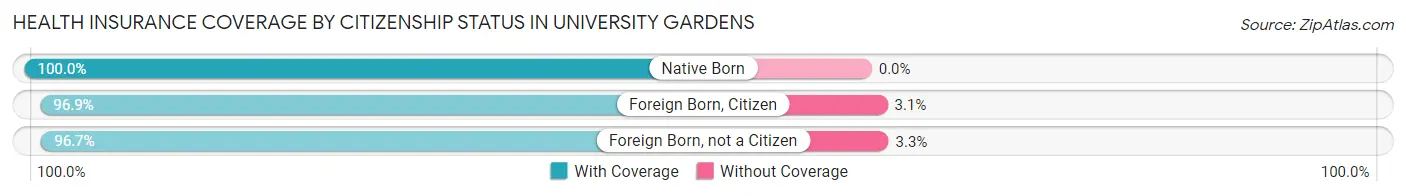
| Citizenship Status | With Coverage | Without Coverage |
| Native Born | 207 (100.0%) | 0 (0.0%) |
| Foreign Born, Citizen | 561 (96.9%) | 18 (3.1%) |
| Foreign Born, not a Citizen | 322 (96.7%) | 11 (3.3%) |
Health Insurance Coverage by Household Income in University Gardens
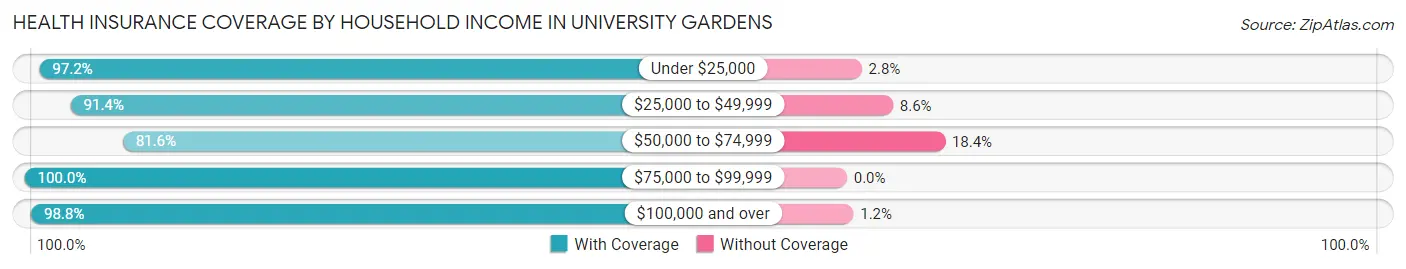
| Household Income | With Coverage | Without Coverage |
| Under $25,000 | 280 (97.2%) | 8 (2.8%) |
| $25,000 to $49,999 | 413 (91.4%) | 39 (8.6%) |
| $50,000 to $74,999 | 142 (81.6%) | 32 (18.4%) |
| $75,000 to $99,999 | 713 (100.0%) | 0 (0.0%) |
| $100,000 and over | 2,513 (98.8%) | 31 (1.2%) |
Public vs Private Health Insurance Coverage by Age in University Gardens
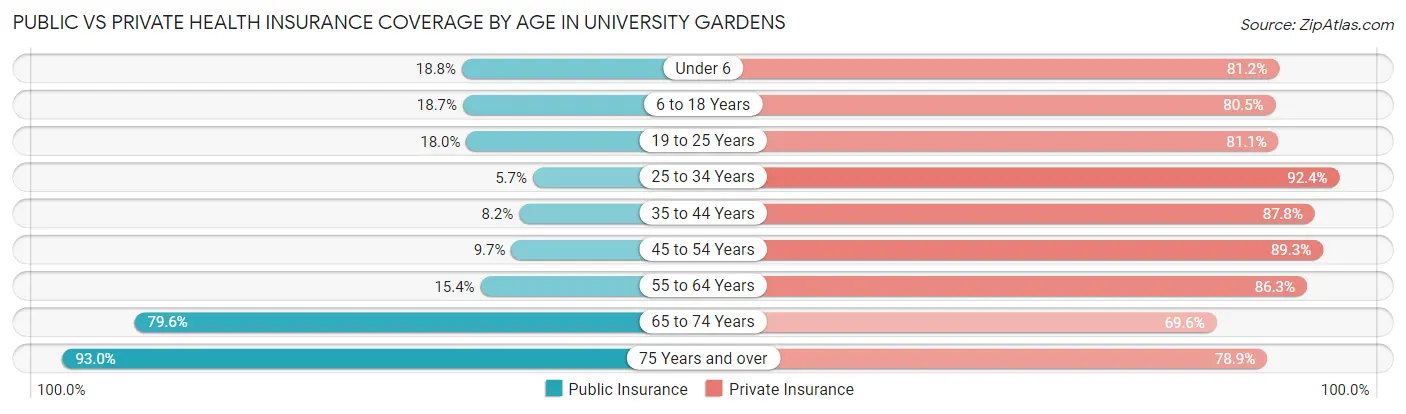
| Age Bracket | Public Insurance | Private Insurance |
| Under 6 | 39 (18.8%) | 168 (81.2%) |
| 6 to 18 Years | 108 (18.6%) | 466 (80.5%) |
| 19 to 25 Years | 60 (18.0%) | 270 (81.1%) |
| 25 to 34 Years | 23 (5.7%) | 375 (92.4%) |
| 35 to 44 Years | 43 (8.2%) | 460 (87.8%) |
| 45 to 54 Years | 66 (9.7%) | 610 (89.3%) |
| 55 to 64 Years | 117 (15.4%) | 656 (86.3%) |
| 65 to 74 Years | 246 (79.6%) | 215 (69.6%) |
| 75 Years and over | 344 (93.0%) | 292 (78.9%) |
| Total | 1,046 (25.1%) | 3,512 (84.2%) |
Disability Status by Sex by Age in University Gardens
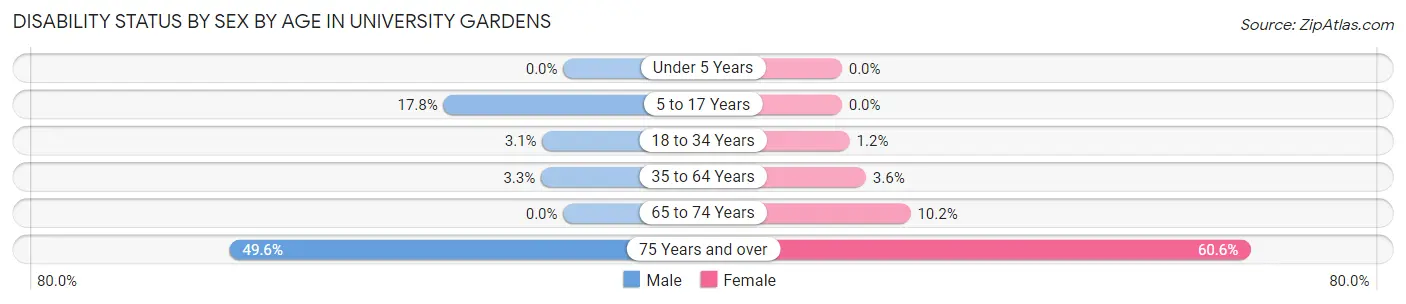
| Age Bracket | Male | Female |
| Under 5 Years | 0 (0.0%) | 0 (0.0%) |
| 5 to 17 Years | 58 (17.8%) | 0 (0.0%) |
| 18 to 34 Years | 11 (3.1%) | 5 (1.2%) |
| 35 to 64 Years | 30 (3.3%) | 38 (3.6%) |
| 65 to 74 Years | 0 (0.0%) | 15 (10.2%) |
| 75 Years and over | 55 (49.5%) | 157 (60.6%) |
Disability Class by Sex by Age in University Gardens
Disability Class: Hearing Difficulty
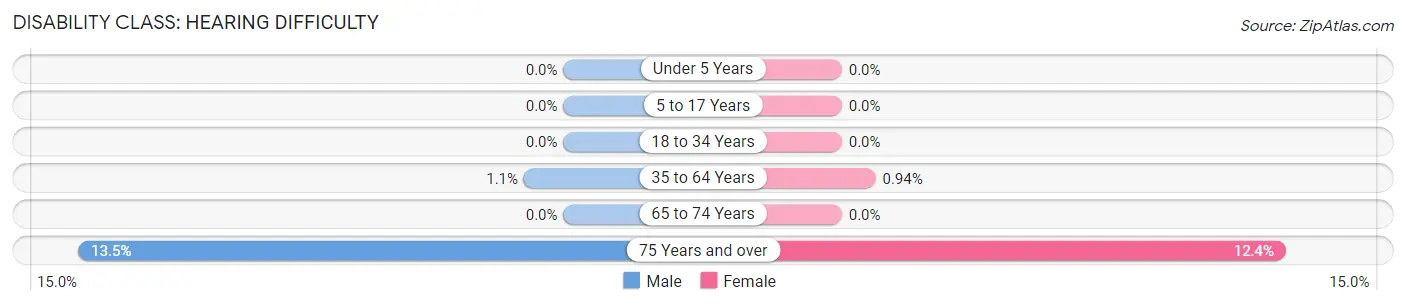
| Age Bracket | Male | Female |
| Under 5 Years | 0 (0.0%) | 0 (0.0%) |
| 5 to 17 Years | 0 (0.0%) | 0 (0.0%) |
| 18 to 34 Years | 0 (0.0%) | 0 (0.0%) |
| 35 to 64 Years | 10 (1.1%) | 10 (0.9%) |
| 65 to 74 Years | 0 (0.0%) | 0 (0.0%) |
| 75 Years and over | 15 (13.5%) | 32 (12.4%) |
Disability Class: Vision Difficulty
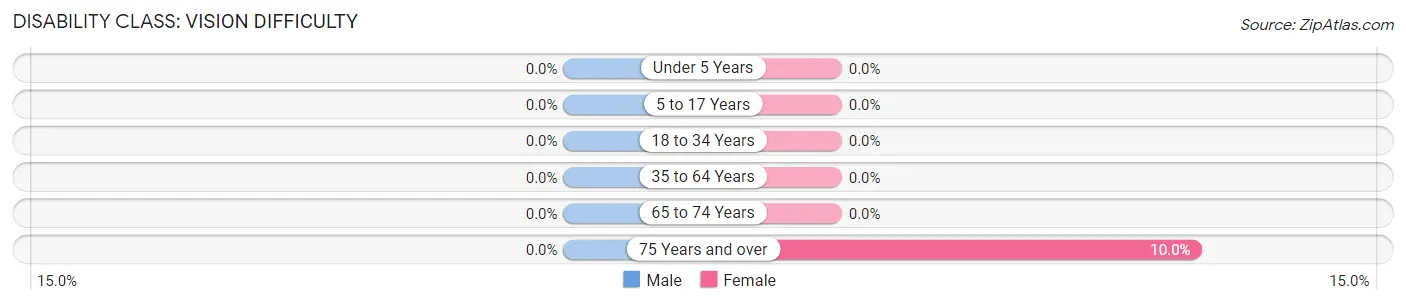
| Age Bracket | Male | Female |
| Under 5 Years | 0 (0.0%) | 0 (0.0%) |
| 5 to 17 Years | 0 (0.0%) | 0 (0.0%) |
| 18 to 34 Years | 0 (0.0%) | 0 (0.0%) |
| 35 to 64 Years | 0 (0.0%) | 0 (0.0%) |
| 65 to 74 Years | 0 (0.0%) | 0 (0.0%) |
| 75 Years and over | 0 (0.0%) | 26 (10.0%) |
Disability Class: Cognitive Difficulty
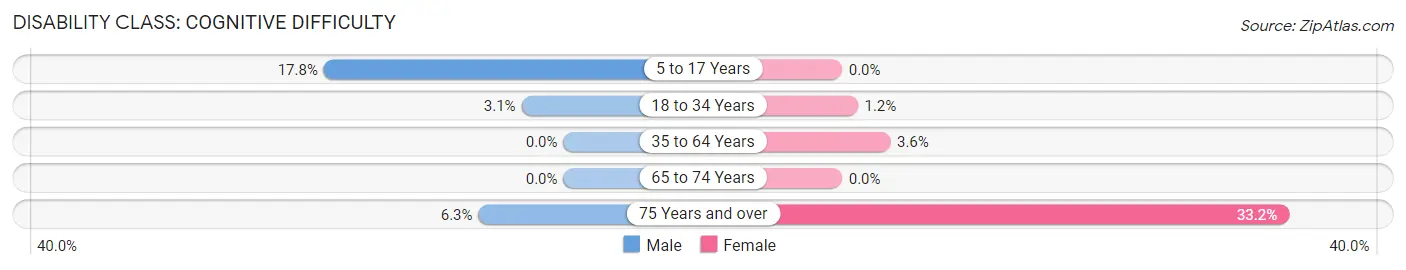
| Age Bracket | Male | Female |
| 5 to 17 Years | 58 (17.8%) | 0 (0.0%) |
| 18 to 34 Years | 11 (3.1%) | 5 (1.2%) |
| 35 to 64 Years | 0 (0.0%) | 38 (3.6%) |
| 65 to 74 Years | 0 (0.0%) | 0 (0.0%) |
| 75 Years and over | 7 (6.3%) | 86 (33.2%) |
Disability Class: Ambulatory Difficulty
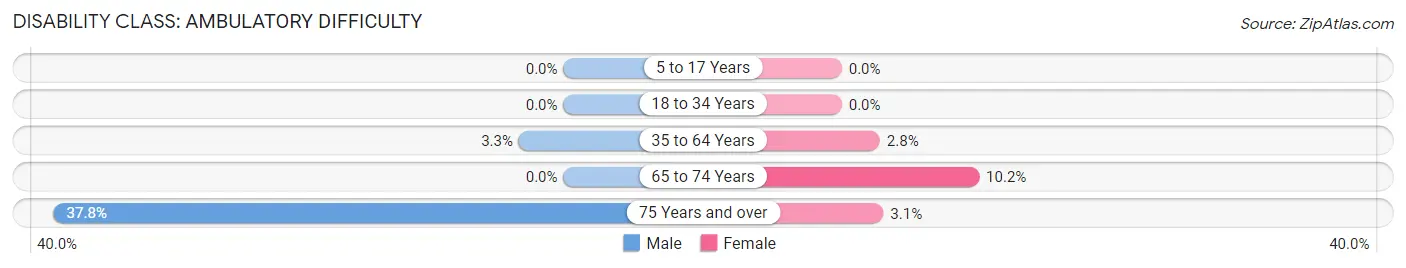
| Age Bracket | Male | Female |
| 5 to 17 Years | 0 (0.0%) | 0 (0.0%) |
| 18 to 34 Years | 0 (0.0%) | 0 (0.0%) |
| 35 to 64 Years | 30 (3.3%) | 30 (2.8%) |
| 65 to 74 Years | 0 (0.0%) | 15 (10.2%) |
| 75 Years and over | 42 (37.8%) | 8 (3.1%) |
Disability Class: Self-Care Difficulty
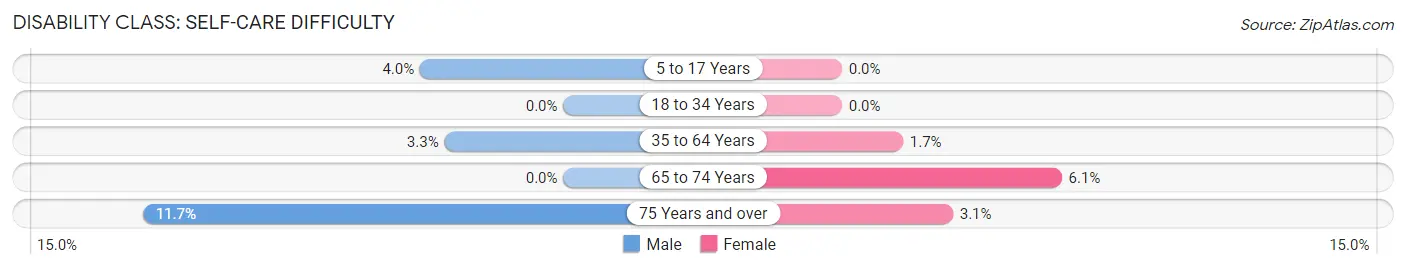
| Age Bracket | Male | Female |
| 5 to 17 Years | 13 (4.0%) | 0 (0.0%) |
| 18 to 34 Years | 0 (0.0%) | 0 (0.0%) |
| 35 to 64 Years | 30 (3.3%) | 18 (1.7%) |
| 65 to 74 Years | 0 (0.0%) | 9 (6.1%) |
| 75 Years and over | 13 (11.7%) | 8 (3.1%) |
Technology Access in University Gardens
Computing Device Access in University Gardens
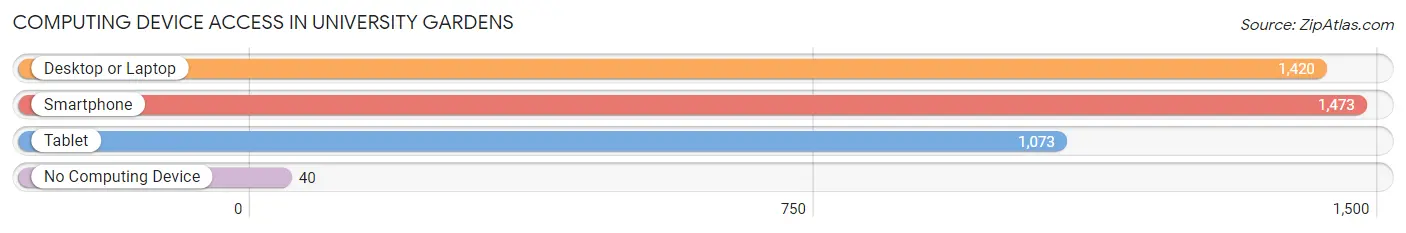
| Device Type | # Households | % Households |
| Desktop or Laptop | 1,420 | 91.8% |
| Smartphone | 1,473 | 95.3% |
| Tablet | 1,073 | 69.4% |
| No Computing Device | 40 | 2.6% |
| Total | 1,546 | 100.0% |
Internet Access in University Gardens
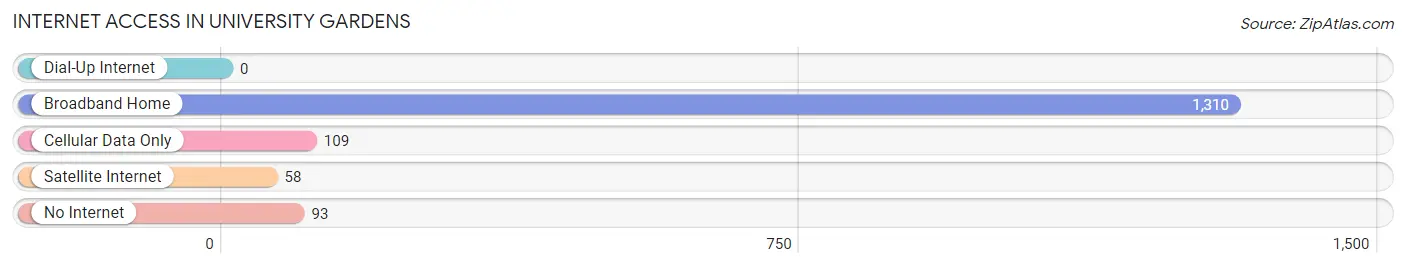
| Internet Type | # Households | % Households |
| Dial-Up Internet | 0 | 0.0% |
| Broadband Home | 1,310 | 84.7% |
| Cellular Data Only | 109 | 7.0% |
| Satellite Internet | 58 | 3.7% |
| No Internet | 93 | 6.0% |
| Total | 1,546 | 100.0% |
University Gardens Summary
History
University Gardens is a small hamlet located in the Town of Oyster Bay in Nassau County, New York. It is located on the north shore of Long Island, approximately 25 miles east of Manhattan. The hamlet was originally part of the Matinecock Native American tribe’s land, and was first settled by Europeans in the late 1600s. The area was known as “The Gardens” due to its abundance of fruit trees and vegetable gardens.
In the late 1800s, the area was developed as a summer resort community for wealthy New Yorkers. The area was known for its grand estates and luxurious homes. In the early 1900s, the area was re-developed as a residential community for middle-class families. The area was renamed “University Gardens” in the 1920s, when a local university opened a campus in the area.
Geography
University Gardens is located in the Town of Oyster Bay in Nassau County, New York. It is located on the north shore of Long Island, approximately 25 miles east of Manhattan. The hamlet is bordered by the hamlets of East Norwich to the west, Oyster Bay to the south, and Brookville to the east.
The area is mostly residential, with some commercial and industrial development. The area is served by the Long Island Rail Road, which provides access to Manhattan and other parts of Long Island. The area is also served by several bus routes.
The area is mostly flat, with some hills in the western part of the hamlet. The area is mostly wooded, with some open fields and wetlands. The area is home to several parks, including the University Gardens Park and the Oyster Bay Nature Preserve.
Economy
University Gardens is a primarily residential community, with some commercial and industrial development. The area is home to several small businesses, including restaurants, retail stores, and professional services. The area is also home to several corporate offices, including a regional office of a major insurance company.
The area is also home to several educational institutions, including a local university and several private schools. The area is also home to several medical facilities, including a hospital and several medical offices.
Demographics
As of the 2010 census, the population of University Gardens was 8,945. The population is primarily white (83.3%), with a small percentage of African Americans (7.2%), Asians (4.2%), and Hispanics (3.7%). The median household income is $107,945, and the median home value is $717,000.
The area is mostly residential, with some commercial and industrial development. The area is served by the Long Island Rail Road, which provides access to Manhattan and other parts of Long Island. The area is also served by several bus routes. The area is home to several parks, including the University Gardens Park and the Oyster Bay Nature Preserve.
Common Questions
What is the Total Population of University Gardens?
Total Population of University Gardens is 4,171.
What is the Total Male Population of University Gardens?
Total Male Population of University Gardens is 1,928.
What is the Total Female Population of University Gardens?
Total Female Population of University Gardens is 2,243.
What is the Ratio of Males per 100 Females in University Gardens?
There are 85.96 Males per 100 Females in University Gardens.
What is the Ratio of Females per 100 Males in University Gardens?
There are 116.34 Females per 100 Males in University Gardens.
What is the Median Population Age in University Gardens?
Median Population Age in University Gardens is 45.6 Years.
What is the Average Family Size in University Gardens
Average Family Size in University Gardens is 3.2 People.
What is the Average Household Size in University Gardens
Average Household Size in University Gardens is 2.7 People.
What is Per Capita Income in University Gardens?
Per Capita income in University Gardens is $58,988.
What is the Median Family Income in University Gardens?
Median Family Income in University Gardens is $138,167.
What is the Median Household income in University Gardens?
Median Household Income in University Gardens is $104,844.
What is Income or Wage Gap in University Gardens?
Income or Wage Gap in University Gardens is 14.7%.
Women in University Gardens earn 85.3 cents for every dollar earned by a man.
What is Inequality or Gini Index in University Gardens?
Inequality or Gini Index in University Gardens is 0.46.
How Large is the Labor Force in University Gardens?
There are 2,258 People in the Labor Forcein in University Gardens.
What is the Percentage of People in the Labor Force in University Gardens?
64.1% of People are in the Labor Force in University Gardens.
What is the Unemployment Rate in University Gardens?
Unemployment Rate in University Gardens is 5.0%.