Buffalo, NY
Buffalo Map
Buffalo Overview
276,688
TOTAL POPULATION
133,447
MALE POPULATION
143,241
FEMALE POPULATION
93.16
MALES / 100 FEMALES
107.34
FEMALES / 100 MALES
33.9
MEDIAN AGE
3.1
AVG FAMILY SIZE
2.2
AVG HOUSEHOLD SIZE
$29,558
PER CAPITA INCOME
$57,678
AVG FAMILY INCOME
$46,184
AVG HOUSEHOLD INCOME
8.9%
WAGE / INCOME GAP [ % ]
91.1¢/ $1
WAGE / INCOME GAP [ $ ]
$11,808
FAMILY INCOME DEFICIT
0.50
INEQUALITY / GINI INDEX
133,294
LABOR FORCE [ PEOPLE ]
60.2%
PERCENT IN LABOR FORCE
7.0%
UNEMPLOYMENT RATE
Buffalo Zip Codes
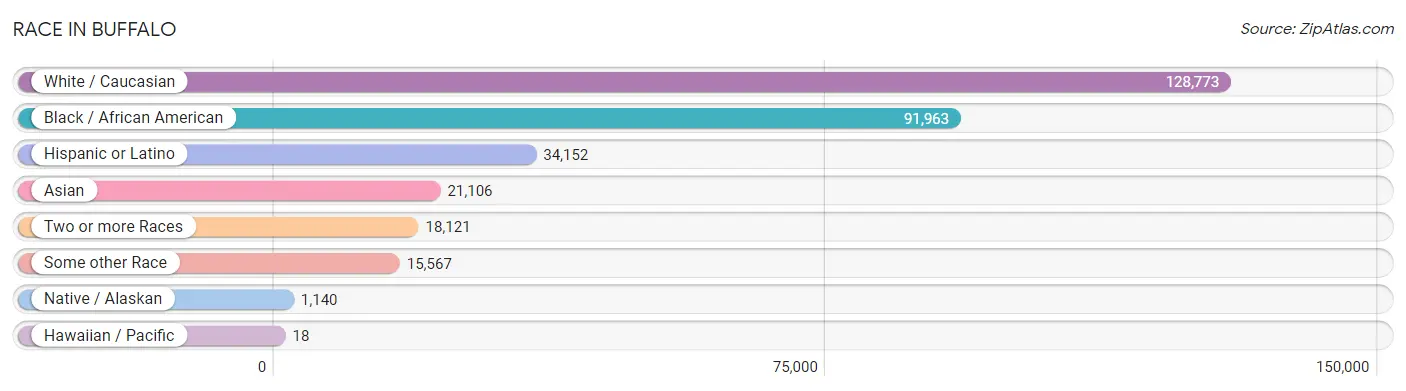
Race in Buffalo
The most populous races in Buffalo are White / Caucasian (128,773 | 46.5%), Black / African American (91,963 | 33.2%), and Hispanic or Latino (34,152 | 12.3%).
| Race | # Population | % Population |
| Asian | 21,106 | 7.6% |
| Black / African American | 91,963 | 33.2% |
| Hawaiian / Pacific | 18 | 0.0% |
| Hispanic or Latino | 34,152 | 12.3% |
| Native / Alaskan | 1,140 | 0.4% |
| White / Caucasian | 128,773 | 46.5% |
| Two or more Races | 18,121 | 6.6% |
| Some other Race | 15,567 | 5.6% |
| Total | 276,688 | 100.0% |
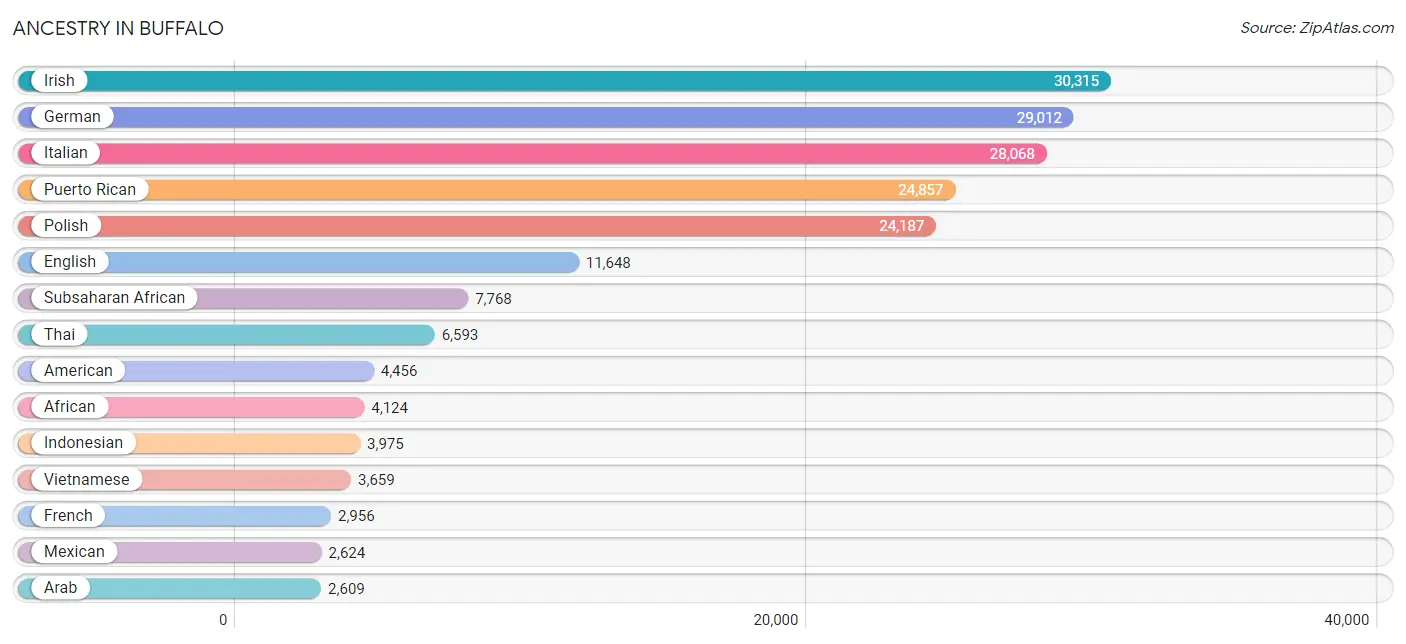
Ancestry in Buffalo
The most populous ancestries reported in Buffalo are Irish (30,315 | 11.0%), German (29,012 | 10.5%), Italian (28,068 | 10.1%), Puerto Rican (24,857 | 9.0%), and Polish (24,187 | 8.7%), together accounting for 49.3% of all Buffalo residents.
| Ancestry | # Population | % Population |
| Afghan | 213 | 0.1% |
| African | 4,124 | 1.5% |
| Albanian | 50 | 0.0% |
| Alsatian | 28 | 0.0% |
| American | 4,456 | 1.6% |
| Arab | 2,609 | 0.9% |
| Argentinean | 110 | 0.0% |
| Armenian | 35 | 0.0% |
| Australian | 37 | 0.0% |
| Austrian | 430 | 0.2% |
| Bahamian | 49 | 0.0% |
| Barbadian | 11 | 0.0% |
| Belgian | 35 | 0.0% |
| Belizean | 120 | 0.0% |
| Bermudan | 13 | 0.0% |
| Bhutanese | 169 | 0.1% |
| Blackfeet | 207 | 0.1% |
| Bolivian | 23 | 0.0% |
| Brazilian | 22 | 0.0% |
| British | 628 | 0.2% |
| British West Indian | 115 | 0.0% |
| Bulgarian | 62 | 0.0% |
| Burmese | 661 | 0.2% |
| Cajun | 10 | 0.0% |
| Cambodian | 7 | 0.0% |
| Canadian | 468 | 0.2% |
| Celtic | 88 | 0.0% |
| Central American | 711 | 0.3% |
| Central American Indian | 151 | 0.1% |
| Cherokee | 388 | 0.1% |
| Chilean | 45 | 0.0% |
| Colombian | 481 | 0.2% |
| Costa Rican | 22 | 0.0% |
| Cree | 36 | 0.0% |
| Creek | 26 | 0.0% |
| Croatian | 255 | 0.1% |
| Crow | 40 | 0.0% |
| Cuban | 798 | 0.3% |
| Czech | 271 | 0.1% |
| Czechoslovakian | 130 | 0.1% |
| Danish | 169 | 0.1% |
| Dominican | 2,173 | 0.8% |
| Dutch | 1,615 | 0.6% |
| Dutch West Indian | 48 | 0.0% |
| Eastern European | 458 | 0.2% |
| Ecuadorian | 527 | 0.2% |
| Egyptian | 77 | 0.0% |
| English | 11,648 | 4.2% |
| Estonian | 28 | 0.0% |
| Ethiopian | 617 | 0.2% |
| European | 1,630 | 0.6% |
| Filipino | 55 | 0.0% |
| Finnish | 361 | 0.1% |
| French | 2,956 | 1.1% |
| French American Indian | 65 | 0.0% |
| French Canadian | 1,109 | 0.4% |
| German | 29,012 | 10.5% |
| German Russian | 55 | 0.0% |
| Ghanaian | 134 | 0.1% |
| Greek | 889 | 0.3% |
| Guamanian / Chamorro | 4 | 0.0% |
| Guatemalan | 288 | 0.1% |
| Guyanese | 151 | 0.1% |
| Haitian | 451 | 0.2% |
| Honduran | 87 | 0.0% |
| Hungarian | 1,264 | 0.5% |
| Icelander | 21 | 0.0% |
| Indian (Asian) | 1,705 | 0.6% |
| Indonesian | 3,975 | 1.4% |
| Iranian | 26 | 0.0% |
| Iraqi | 444 | 0.2% |
| Irish | 30,315 | 11.0% |
| Iroquois | 1,616 | 0.6% |
| Israeli | 226 | 0.1% |
| Italian | 28,068 | 10.1% |
| Jamaican | 874 | 0.3% |
| Japanese | 8 | 0.0% |
| Jordanian | 25 | 0.0% |
| Kenyan | 6 | 0.0% |
| Korean | 600 | 0.2% |
| Laotian | 36 | 0.0% |
| Latvian | 110 | 0.0% |
| Lebanese | 368 | 0.1% |
| Liberian | 114 | 0.0% |
| Lithuanian | 309 | 0.1% |
| Lumbee | 11 | 0.0% |
| Macedonian | 5 | 0.0% |
| Malaysian | 521 | 0.2% |
| Maltese | 20 | 0.0% |
| Mexican | 2,624 | 0.9% |
| Mexican American Indian | 45 | 0.0% |
| Mongolian | 9 | 0.0% |
| Moroccan | 40 | 0.0% |
| Native Hawaiian | 77 | 0.0% |
| Navajo | 47 | 0.0% |
| Nicaraguan | 37 | 0.0% |
| Nigerian | 437 | 0.2% |
| Northern European | 127 | 0.1% |
| Norwegian | 730 | 0.3% |
| Okinawan | 128 | 0.1% |
| Pakistani | 979 | 0.4% |
| Palestinian | 79 | 0.0% |
| Panamanian | 40 | 0.0% |
| Paraguayan | 14 | 0.0% |
| Pennsylvania German | 46 | 0.0% |
| Peruvian | 136 | 0.1% |
| Polish | 24,187 | 8.7% |
| Portuguese | 320 | 0.1% |
| Puerto Rican | 24,857 | 9.0% |
| Romanian | 251 | 0.1% |
| Russian | 1,484 | 0.5% |
| Salvadoran | 197 | 0.1% |
| Samoan | 4 | 0.0% |
| Scandinavian | 329 | 0.1% |
| Scotch-Irish | 679 | 0.3% |
| Scottish | 1,631 | 0.6% |
| Serbian | 212 | 0.1% |
| Sioux | 19 | 0.0% |
| Slavic | 91 | 0.0% |
| Slovak | 265 | 0.1% |
| Slovene | 29 | 0.0% |
| Somali | 817 | 0.3% |
| South American | 1,493 | 0.5% |
| South American Indian | 202 | 0.1% |
| Spaniard | 233 | 0.1% |
| Spanish | 549 | 0.2% |
| Sri Lankan | 713 | 0.3% |
| Subsaharan African | 7,768 | 2.8% |
| Sudanese | 297 | 0.1% |
| Swedish | 906 | 0.3% |
| Swiss | 275 | 0.1% |
| Syrian | 302 | 0.1% |
| Taiwanese | 6 | 0.0% |
| Thai | 6,593 | 2.4% |
| Trinidadian and Tobagonian | 500 | 0.2% |
| Turkish | 217 | 0.1% |
| U.S. Virgin Islander | 18 | 0.0% |
| Ugandan | 87 | 0.0% |
| Ukrainian | 1,104 | 0.4% |
| Venezuelan | 157 | 0.1% |
| Vietnamese | 3,659 | 1.3% |
| Welsh | 834 | 0.3% |
| West Indian | 362 | 0.1% |
| Yugoslavian | 214 | 0.1% | View All 144 Rows |
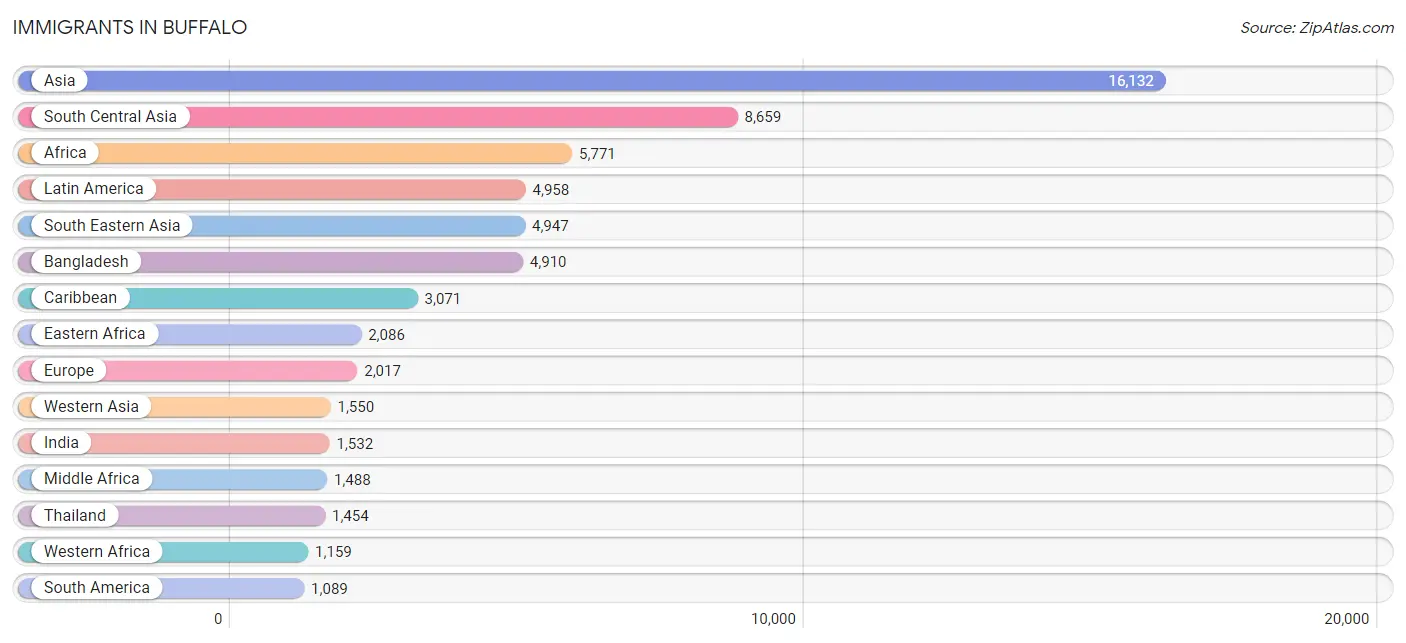
Immigrants in Buffalo
The most numerous immigrant groups reported in Buffalo came from Asia (16,132 | 5.8%), South Central Asia (8,659 | 3.1%), Africa (5,771 | 2.1%), Latin America (4,958 | 1.8%), and South Eastern Asia (4,947 | 1.8%), together accounting for 14.6% of all Buffalo residents.
| Immigration Origin | # Population | % Population |
| Afghanistan | 101 | 0.0% |
| Africa | 5,771 | 2.1% |
| Albania | 36 | 0.0% |
| Argentina | 45 | 0.0% |
| Asia | 16,132 | 5.8% |
| Australia | 44 | 0.0% |
| Austria | 36 | 0.0% |
| Bangladesh | 4,910 | 1.8% |
| Barbados | 52 | 0.0% |
| Belarus | 2 | 0.0% |
| Belgium | 13 | 0.0% |
| Bolivia | 19 | 0.0% |
| Bosnia and Herzegovina | 72 | 0.0% |
| Brazil | 50 | 0.0% |
| Bulgaria | 8 | 0.0% |
| Cambodia | 8 | 0.0% |
| Cameroon | 5 | 0.0% |
| Canada | 811 | 0.3% |
| Caribbean | 3,071 | 1.1% |
| Central America | 798 | 0.3% |
| Chile | 12 | 0.0% |
| China | 681 | 0.3% |
| Colombia | 249 | 0.1% |
| Congo | 592 | 0.2% |
| Costa Rica | 22 | 0.0% |
| Croatia | 106 | 0.0% |
| Cuba | 355 | 0.1% |
| Czechoslovakia | 10 | 0.0% |
| Dominica | 13 | 0.0% |
| Dominican Republic | 901 | 0.3% |
| Eastern Africa | 2,086 | 0.7% |
| Eastern Asia | 966 | 0.4% |
| Eastern Europe | 809 | 0.3% |
| Ecuador | 299 | 0.1% |
| Egypt | 56 | 0.0% |
| El Salvador | 74 | 0.0% |
| England | 44 | 0.0% |
| Eritrea | 199 | 0.1% |
| Ethiopia | 338 | 0.1% |
| Europe | 2,017 | 0.7% |
| France | 57 | 0.0% |
| Germany | 378 | 0.1% |
| Ghana | 263 | 0.1% |
| Greece | 20 | 0.0% |
| Guatemala | 102 | 0.0% |
| Guyana | 183 | 0.1% |
| Haiti | 372 | 0.1% |
| Honduras | 21 | 0.0% |
| Hong Kong | 34 | 0.0% |
| Hungary | 58 | 0.0% |
| India | 1,532 | 0.5% |
| Indonesia | 19 | 0.0% |
| Iran | 78 | 0.0% |
| Iraq | 402 | 0.2% |
| Ireland | 38 | 0.0% |
| Israel | 106 | 0.0% |
| Italy | 216 | 0.1% |
| Jamaica | 752 | 0.3% |
| Japan | 31 | 0.0% |
| Jordan | 48 | 0.0% |
| Kenya | 95 | 0.0% |
| Korea | 254 | 0.1% |
| Kuwait | 36 | 0.0% |
| Laos | 304 | 0.1% |
| Latin America | 4,958 | 1.8% |
| Latvia | 23 | 0.0% |
| Lebanon | 34 | 0.0% |
| Liberia | 304 | 0.1% |
| Lithuania | 7 | 0.0% |
| Malaysia | 147 | 0.1% |
| Mexico | 512 | 0.2% |
| Micronesia | 4 | 0.0% |
| Middle Africa | 1,488 | 0.5% |
| Morocco | 17 | 0.0% |
| Nepal | 511 | 0.2% |
| Netherlands | 43 | 0.0% |
| Nicaragua | 14 | 0.0% |
| Nigeria | 319 | 0.1% |
| Northern Africa | 557 | 0.2% |
| Northern Europe | 304 | 0.1% |
| Oceania | 72 | 0.0% |
| Pakistan | 741 | 0.3% |
| Panama | 53 | 0.0% |
| Peru | 52 | 0.0% |
| Philippines | 214 | 0.1% |
| Poland | 172 | 0.1% |
| Romania | 113 | 0.0% |
| Russia | 138 | 0.1% |
| Saudi Arabia | 24 | 0.0% |
| Scotland | 62 | 0.0% |
| Senegal | 44 | 0.0% |
| Serbia | 18 | 0.0% |
| Sierra Leone | 8 | 0.0% |
| Singapore | 65 | 0.0% |
| Somalia | 676 | 0.2% |
| South Africa | 173 | 0.1% |
| South America | 1,089 | 0.4% |
| South Central Asia | 8,659 | 3.1% |
| South Eastern Asia | 4,947 | 1.8% |
| Southern Europe | 271 | 0.1% |
| Spain | 35 | 0.0% |
| Sri Lanka | 38 | 0.0% |
| St. Vincent and the Grenadines | 13 | 0.0% |
| Sudan | 448 | 0.2% |
| Sweden | 42 | 0.0% |
| Switzerland | 106 | 0.0% |
| Syria | 279 | 0.1% |
| Taiwan | 64 | 0.0% |
| Thailand | 1,454 | 0.5% |
| Trinidad and Tobago | 431 | 0.2% |
| Turkey | 23 | 0.0% |
| Uganda | 44 | 0.0% |
| Ukraine | 46 | 0.0% |
| Uzbekistan | 177 | 0.1% |
| Venezuela | 143 | 0.1% |
| Vietnam | 326 | 0.1% |
| West Indies | 106 | 0.0% |
| Western Africa | 1,159 | 0.4% |
| Western Asia | 1,550 | 0.6% |
| Western Europe | 633 | 0.2% |
| Yemen | 572 | 0.2% |
| Zaire | 840 | 0.3% |
| Zimbabwe | 26 | 0.0% | View All 123 Rows |
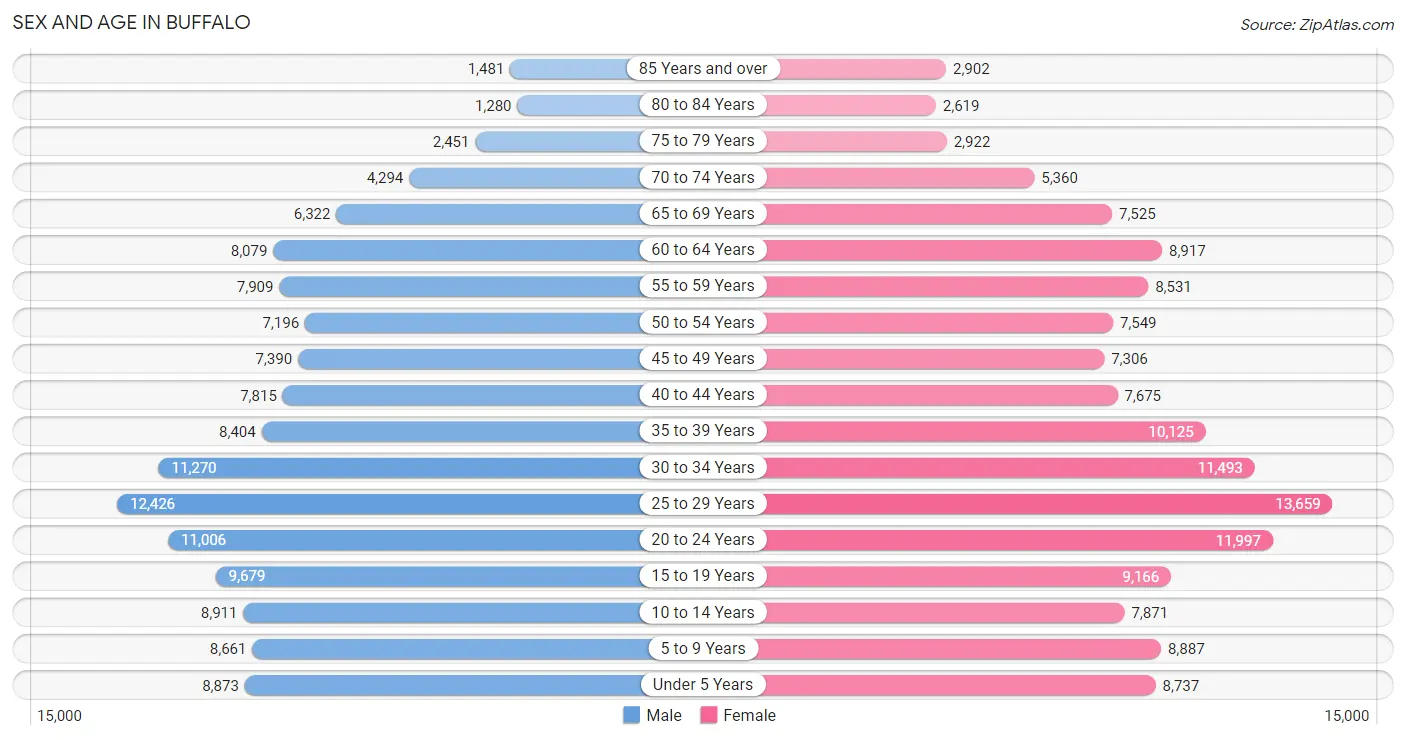
Sex and Age in Buffalo
Sex and Age in Buffalo
The most populous age groups in Buffalo are 25 to 29 Years (12,426 | 9.3%) for men and 25 to 29 Years (13,659 | 9.5%) for women.
| Age Bracket | Male | Female |
| Under 5 Years | 8,873 (6.7%) | 8,737 (6.1%) |
| 5 to 9 Years | 8,661 (6.5%) | 8,887 (6.2%) |
| 10 to 14 Years | 8,911 (6.7%) | 7,871 (5.5%) |
| 15 to 19 Years | 9,679 (7.2%) | 9,166 (6.4%) |
| 20 to 24 Years | 11,006 (8.3%) | 11,997 (8.4%) |
| 25 to 29 Years | 12,426 (9.3%) | 13,659 (9.5%) |
| 30 to 34 Years | 11,270 (8.5%) | 11,493 (8.0%) |
| 35 to 39 Years | 8,404 (6.3%) | 10,125 (7.1%) |
| 40 to 44 Years | 7,815 (5.9%) | 7,675 (5.4%) |
| 45 to 49 Years | 7,390 (5.5%) | 7,306 (5.1%) |
| 50 to 54 Years | 7,196 (5.4%) | 7,549 (5.3%) |
| 55 to 59 Years | 7,909 (5.9%) | 8,531 (6.0%) |
| 60 to 64 Years | 8,079 (6.0%) | 8,917 (6.2%) |
| 65 to 69 Years | 6,322 (4.7%) | 7,525 (5.2%) |
| 70 to 74 Years | 4,294 (3.2%) | 5,360 (3.7%) |
| 75 to 79 Years | 2,451 (1.8%) | 2,922 (2.0%) |
| 80 to 84 Years | 1,280 (1.0%) | 2,619 (1.8%) |
| 85 Years and over | 1,481 (1.1%) | 2,902 (2.0%) |
| Total | 133,447 (100.0%) | 143,241 (100.0%) |
Families and Households in Buffalo
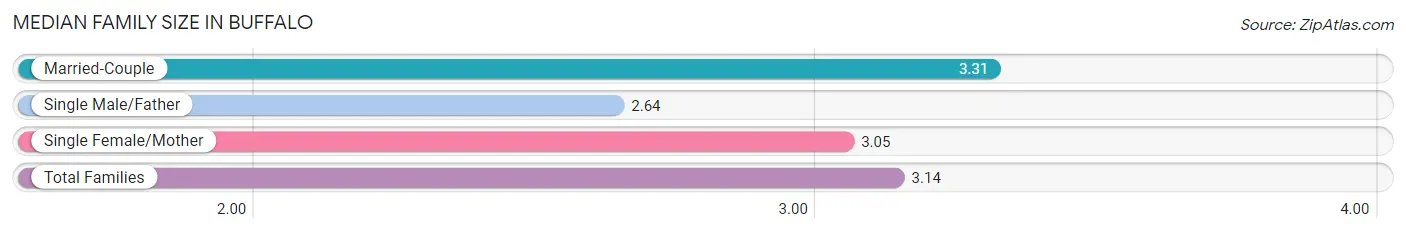
Median Family Size in Buffalo
The median family size in Buffalo is 3.14 persons per family, with married-couple families (29,225 | 50.2%) accounting for the largest median family size of 3.31 persons per family. On the other hand, single male/father families (6,060 | 10.4%) represent the smallest median family size with 2.64 persons per family.
| Family Type | # Families | Family Size |
| Married-Couple | 29,225 (50.2%) | 3.31 |
| Single Male/Father | 6,060 (10.4%) | 2.64 |
| Single Female/Mother | 22,892 (39.4%) | 3.05 |
| Total Families | 58,177 (100.0%) | 3.14 |
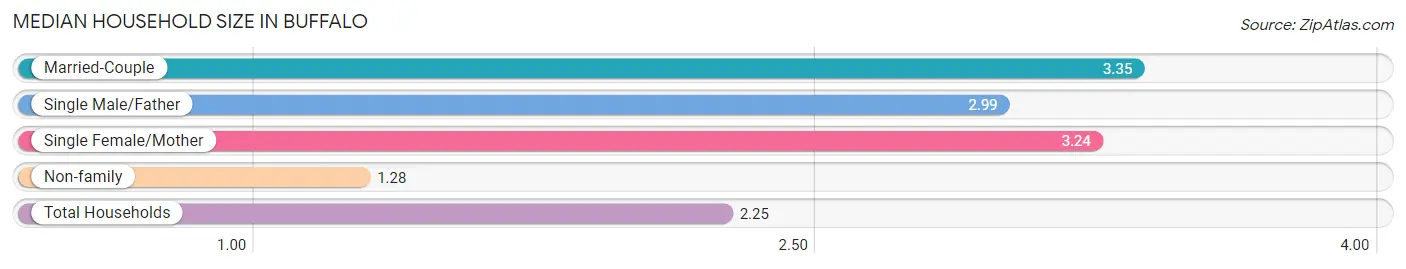
Median Household Size in Buffalo
The median household size in Buffalo is 2.25 persons per household, with married-couple households (29,225 | 24.6%) accounting for the largest median household size of 3.35 persons per household. non-family households (60,720 | 51.1%) represent the smallest median household size with 1.28 persons per household.
| Household Type | # Households | Household Size |
| Married-Couple | 29,225 (24.6%) | 3.35 |
| Single Male/Father | 6,060 (5.1%) | 2.99 |
| Single Female/Mother | 22,892 (19.3%) | 3.24 |
| Non-family | 60,720 (51.1%) | 1.28 |
| Total Households | 118,897 (100.0%) | 2.25 |
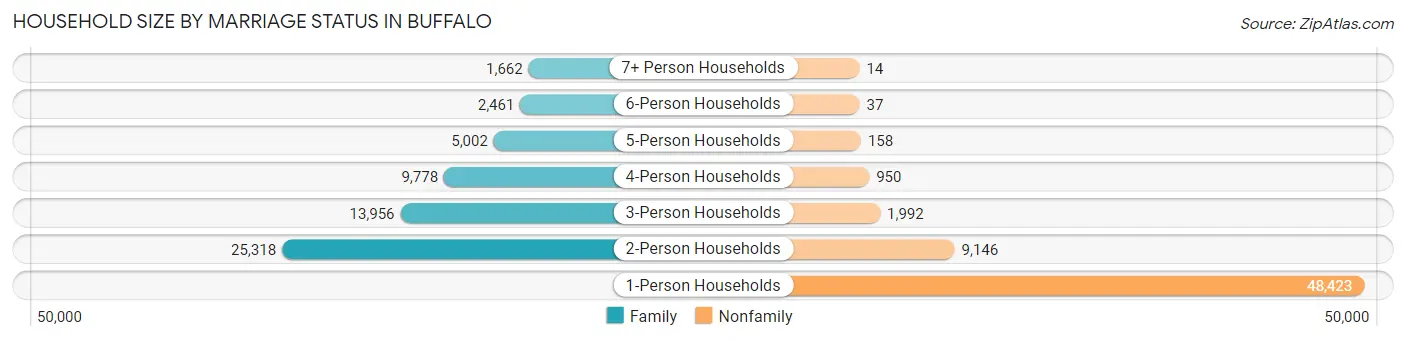
Household Size by Marriage Status in Buffalo
Out of a total of 118,897 households in Buffalo, 58,177 (48.9%) are family households, while 60,720 (51.1%) are nonfamily households. The most numerous type of family households are 2-person households, comprising 25,318, and the most common type of nonfamily households are 1-person households, comprising 48,423.
| Household Size | Family Households | Nonfamily Households |
| 1-Person Households | - | 48,423 (40.7%) |
| 2-Person Households | 25,318 (21.3%) | 9,146 (7.7%) |
| 3-Person Households | 13,956 (11.7%) | 1,992 (1.7%) |
| 4-Person Households | 9,778 (8.2%) | 950 (0.8%) |
| 5-Person Households | 5,002 (4.2%) | 158 (0.1%) |
| 6-Person Households | 2,461 (2.1%) | 37 (0.0%) |
| 7+ Person Households | 1,662 (1.4%) | 14 (0.0%) |
| Total | 58,177 (48.9%) | 60,720 (51.1%) |
Female Fertility in Buffalo
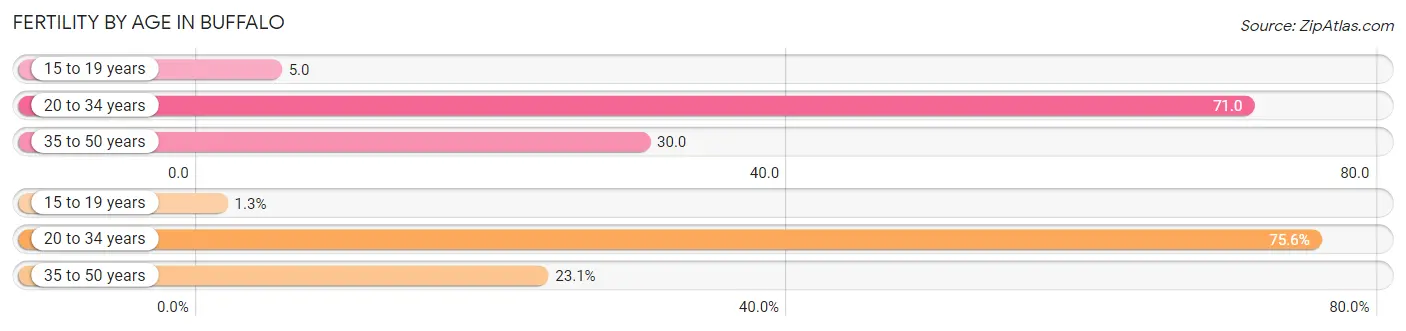
Fertility by Age in Buffalo
Average fertility rate in Buffalo is 47.0 births per 1,000 women. Women in the age bracket of 20 to 34 years have the highest fertility rate with 71.0 births per 1,000 women. Women in the age bracket of 20 to 34 years acount for 75.6% of all women with births.
| Age Bracket | Women with Births | Births / 1,000 Women |
| 15 to 19 years | 46 (1.3%) | 5.0 |
| 20 to 34 years | 2,620 (75.6%) | 71.0 |
| 35 to 50 years | 801 (23.1%) | 30.0 |
| Total | 3,467 (100.0%) | 47.0 |
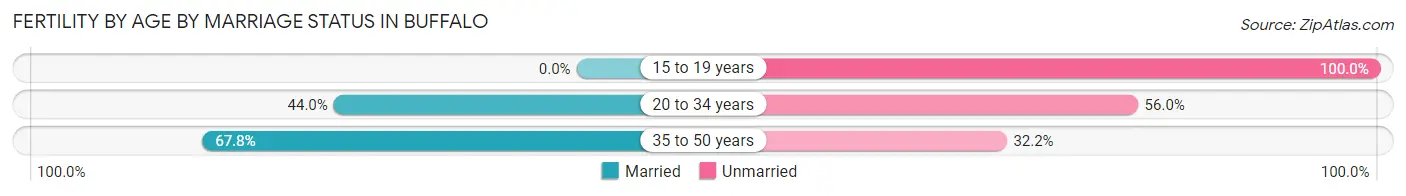
Fertility by Age by Marriage Status in Buffalo
48.9% of women with births (3,467) in Buffalo are married. The highest percentage of unmarried women with births falls into 15 to 19 years age bracket with 100.0% of them unmarried at the time of birth, while the lowest percentage of unmarried women with births belong to 35 to 50 years age bracket with 32.2% of them unmarried.
| Age Bracket | Married | Unmarried |
| 15 to 19 years | 0 (0.0%) | 46 (100.0%) |
| 20 to 34 years | 1,153 (44.0%) | 1,467 (56.0%) |
| 35 to 50 years | 543 (67.8%) | 258 (32.2%) |
| Total | 1,695 (48.9%) | 1,772 (51.1%) |
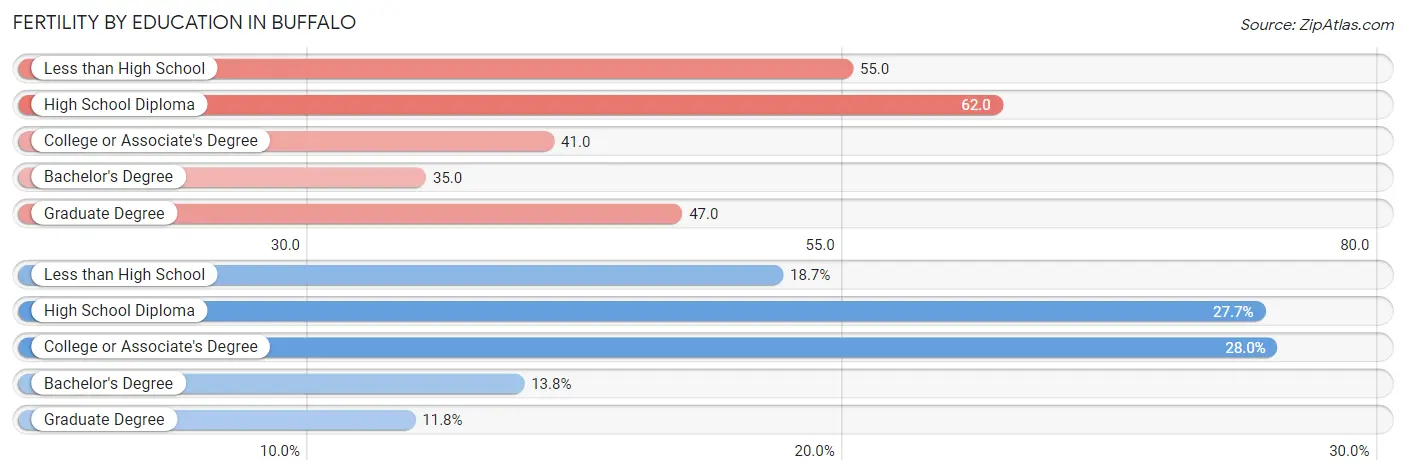
Fertility by Education in Buffalo
Average fertility rate in Buffalo is 47.0 births per 1,000 women. Women with the education attainment of high school diploma have the highest fertility rate of 62.0 births per 1,000 women, while women with the education attainment of bachelor's degree have the lowest fertility at 35.0 births per 1,000 women. Women with the education attainment of college or associate's degree represent 28.0% of all women with births.
| Educational Attainment | Women with Births | Births / 1,000 Women |
| Less than High School | 648 (18.7%) | 55.0 |
| High School Diploma | 961 (27.7%) | 62.0 |
| College or Associate's Degree | 969 (28.0%) | 41.0 |
| Bachelor's Degree | 480 (13.8%) | 35.0 |
| Graduate Degree | 409 (11.8%) | 47.0 |
| Total | 3,467 (100.0%) | 47.0 |
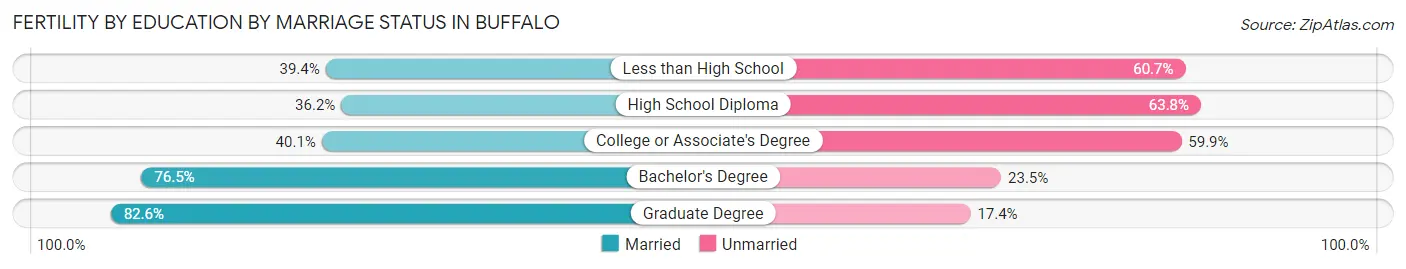
Fertility by Education by Marriage Status in Buffalo
51.1% of women with births in Buffalo are unmarried. Women with the educational attainment of graduate degree are most likely to be married with 82.6% of them married at childbirth, while women with the educational attainment of high school diploma are least likely to be married with 63.8% of them unmarried at childbirth.
| Educational Attainment | Married | Unmarried |
| Less than High School | 255 (39.4%) | 393 (60.7%) |
| High School Diploma | 348 (36.2%) | 613 (63.8%) |
| College or Associate's Degree | 389 (40.1%) | 580 (59.9%) |
| Bachelor's Degree | 367 (76.5%) | 113 (23.5%) |
| Graduate Degree | 338 (82.6%) | 71 (17.4%) |
| Total | 1,695 (48.9%) | 1,772 (51.1%) |
Income in Buffalo
Income Overview in Buffalo
Per Capita Income in Buffalo is $29,558, while median incomes of families and households are $57,678 and $46,184 respectively.
| Characteristic | Number | Measure |
| Per Capita Income | 276,688 | $29,558 |
| Median Family Income | 58,177 | $57,678 |
| Mean Family Income | 58,177 | $78,682 |
| Median Household Income | 118,897 | $46,184 |
| Mean Household Income | 118,897 | $66,571 |
| Income Deficit | 58,177 | $11,808 |
| Wage / Income Gap (%) | 276,688 | 8.92% |
| Wage / Income Gap ($) | 276,688 | 91.08¢ per $1 |
| Gini / Inequality Index | 276,688 | 0.50 |
Earnings by Sex in Buffalo
Average Earnings in Buffalo are $32,876, $34,270 for men and $31,214 for women, a difference of 8.9%.
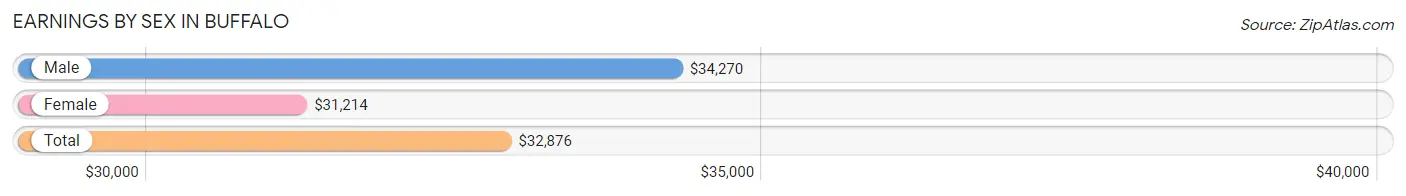
| Sex | Number | Average Earnings |
| Male | 69,831 (49.2%) | $34,270 |
| Female | 72,120 (50.8%) | $31,214 |
| Total | 141,951 (100.0%) | $32,876 |
Earnings by Sex by Income Bracket in Buffalo
The most common earnings brackets in Buffalo are $100,000+ for men (6,525 | 9.3%) and $30,000 to $34,999 for women (5,456 | 7.6%).
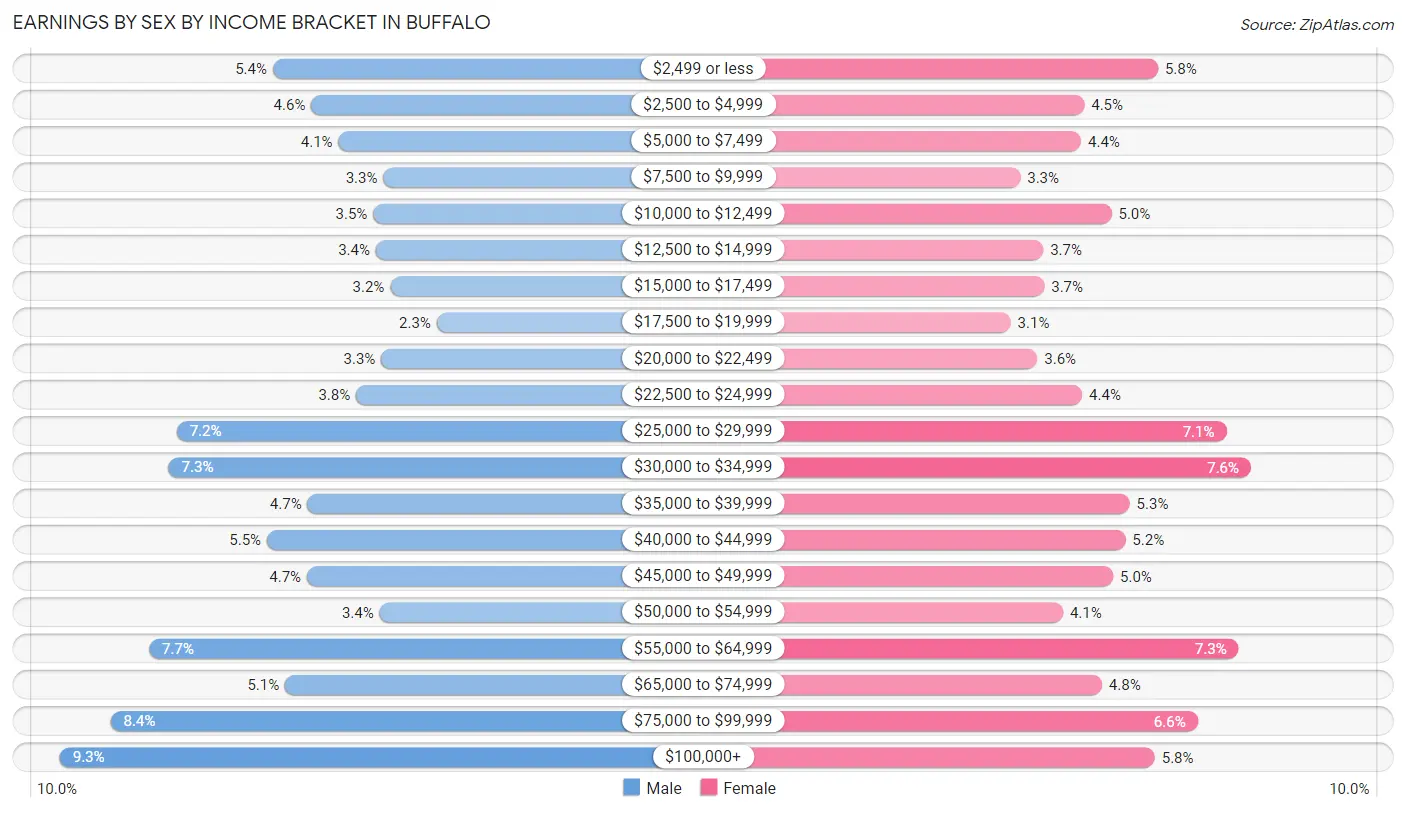
| Income | Male | Female |
| $2,499 or less | 3,736 (5.3%) | 4,205 (5.8%) |
| $2,500 to $4,999 | 3,233 (4.6%) | 3,207 (4.4%) |
| $5,000 to $7,499 | 2,879 (4.1%) | 3,167 (4.4%) |
| $7,500 to $9,999 | 2,289 (3.3%) | 2,343 (3.3%) |
| $10,000 to $12,499 | 2,421 (3.5%) | 3,579 (5.0%) |
| $12,500 to $14,999 | 2,387 (3.4%) | 2,653 (3.7%) |
| $15,000 to $17,499 | 2,199 (3.2%) | 2,665 (3.7%) |
| $17,500 to $19,999 | 1,593 (2.3%) | 2,212 (3.1%) |
| $20,000 to $22,499 | 2,319 (3.3%) | 2,574 (3.6%) |
| $22,500 to $24,999 | 2,647 (3.8%) | 3,177 (4.4%) |
| $25,000 to $29,999 | 4,994 (7.1%) | 5,130 (7.1%) |
| $30,000 to $34,999 | 5,098 (7.3%) | 5,456 (7.6%) |
| $35,000 to $39,999 | 3,281 (4.7%) | 3,824 (5.3%) |
| $40,000 to $44,999 | 3,814 (5.5%) | 3,768 (5.2%) |
| $45,000 to $49,999 | 3,289 (4.7%) | 3,599 (5.0%) |
| $50,000 to $54,999 | 2,340 (3.4%) | 2,921 (4.1%) |
| $55,000 to $64,999 | 5,359 (7.7%) | 5,292 (7.3%) |
| $65,000 to $74,999 | 3,572 (5.1%) | 3,449 (4.8%) |
| $75,000 to $99,999 | 5,856 (8.4%) | 4,740 (6.6%) |
| $100,000+ | 6,525 (9.3%) | 4,159 (5.8%) |
| Total | 69,831 (100.0%) | 72,120 (100.0%) |
Earnings by Sex by Educational Attainment in Buffalo
Average earnings in Buffalo are $41,001 for men and $36,458 for women, a difference of 11.1%. Men with an educational attainment of graduate degree enjoy the highest average annual earnings of $71,250, while those with less than high school education earn the least with $22,289. Women with an educational attainment of graduate degree earn the most with the average annual earnings of $64,338, while those with less than high school education have the smallest earnings of $17,394.
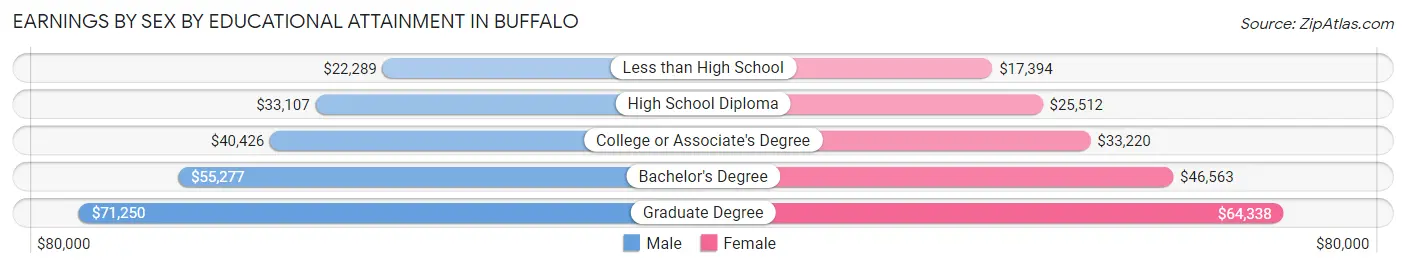
| Educational Attainment | Male Income | Female Income |
| Less than High School | $22,289 | $17,394 |
| High School Diploma | $33,107 | $25,512 |
| College or Associate's Degree | $40,426 | $33,220 |
| Bachelor's Degree | $55,277 | $46,563 |
| Graduate Degree | $71,250 | $64,338 |
| Total | $41,001 | $36,458 |
Family Income in Buffalo
Family Income Brackets in Buffalo
According to the Buffalo family income data, there are 10,123 families falling into the $50,000 to $74,999 income range, which is the most common income bracket and makes up 17.4% of all families. Conversely, the $10,000 to $14,999 income bracket is the least frequent group with only 2,560 families (4.4%) belonging to this category.
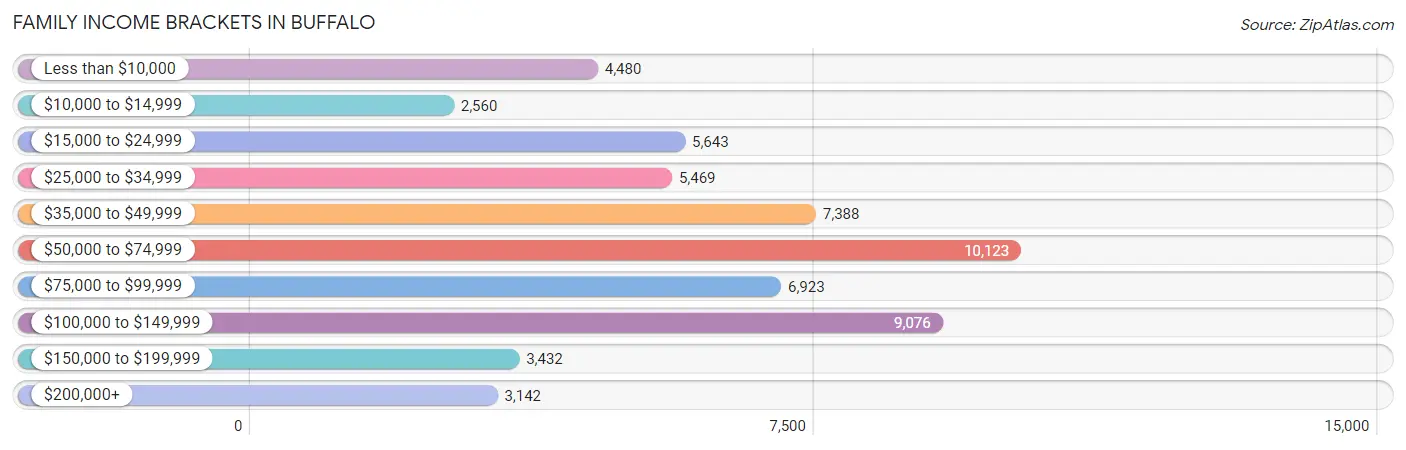
| Income Bracket | # Families | % Families |
| Less than $10,000 | 4,480 | 7.7% |
| $10,000 to $14,999 | 2,560 | 4.4% |
| $15,000 to $24,999 | 5,643 | 9.7% |
| $25,000 to $34,999 | 5,469 | 9.4% |
| $35,000 to $49,999 | 7,388 | 12.7% |
| $50,000 to $74,999 | 10,123 | 17.4% |
| $75,000 to $99,999 | 6,923 | 11.9% |
| $100,000 to $149,999 | 9,076 | 15.6% |
| $150,000 to $199,999 | 3,432 | 5.9% |
| $200,000+ | 3,142 | 5.4% |
Family Income by Famaliy Size in Buffalo
4-person families (9,252 | 15.9%) account for the highest median family income in Buffalo with $63,518 per family, while 2-person families (28,189 | 48.4%) have the highest median income of $29,157 per family member.
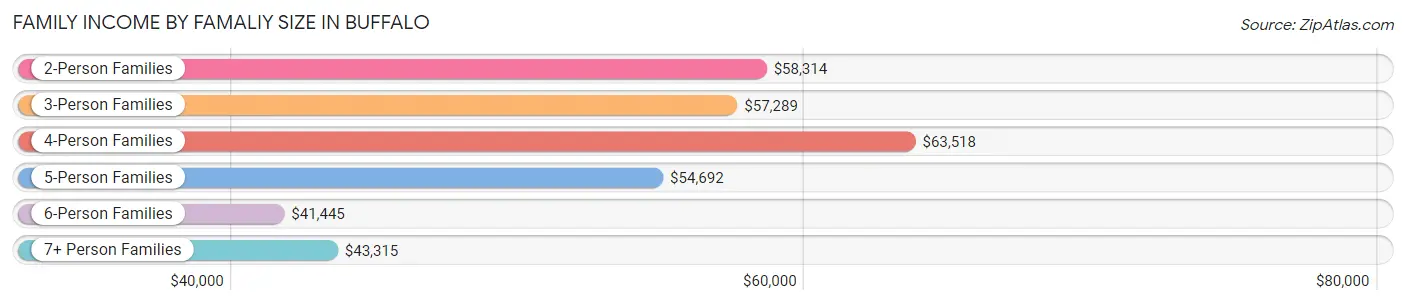
| Income Bracket | # Families | Median Income |
| 2-Person Families | 28,189 (48.4%) | $58,314 |
| 3-Person Families | 13,025 (22.4%) | $57,289 |
| 4-Person Families | 9,252 (15.9%) | $63,518 |
| 5-Person Families | 4,000 (6.9%) | $54,692 |
| 6-Person Families | 2,376 (4.1%) | $41,445 |
| 7+ Person Families | 1,335 (2.3%) | $43,315 |
| Total | 58,177 (100.0%) | $57,678 |
Family Income by Number of Earners in Buffalo
The median family income in Buffalo is $57,678, with families comprising 3+ earners (4,452) having the highest median family income of $110,571, while families with no earners (10,185) have the lowest median family income of $22,133, accounting for 7.6% and 17.5% of families, respectively.
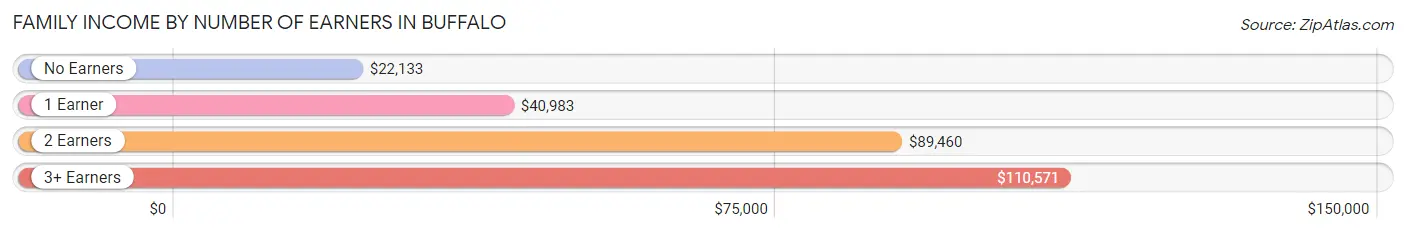
| Number of Earners | # Families | Median Income |
| No Earners | 10,185 (17.5%) | $22,133 |
| 1 Earner | 22,480 (38.6%) | $40,983 |
| 2 Earners | 21,060 (36.2%) | $89,460 |
| 3+ Earners | 4,452 (7.6%) | $110,571 |
| Total | 58,177 (100.0%) | $57,678 |
Household Income in Buffalo
Household Income Brackets in Buffalo
With 19,975 households falling in the category, the $50,000 to $74,999 income range is the most frequent in Buffalo, accounting for 16.8% of all households. In contrast, only 4,994 households (4.2%) fall into the $150,000 to $199,999 income bracket, making it the least populous group.
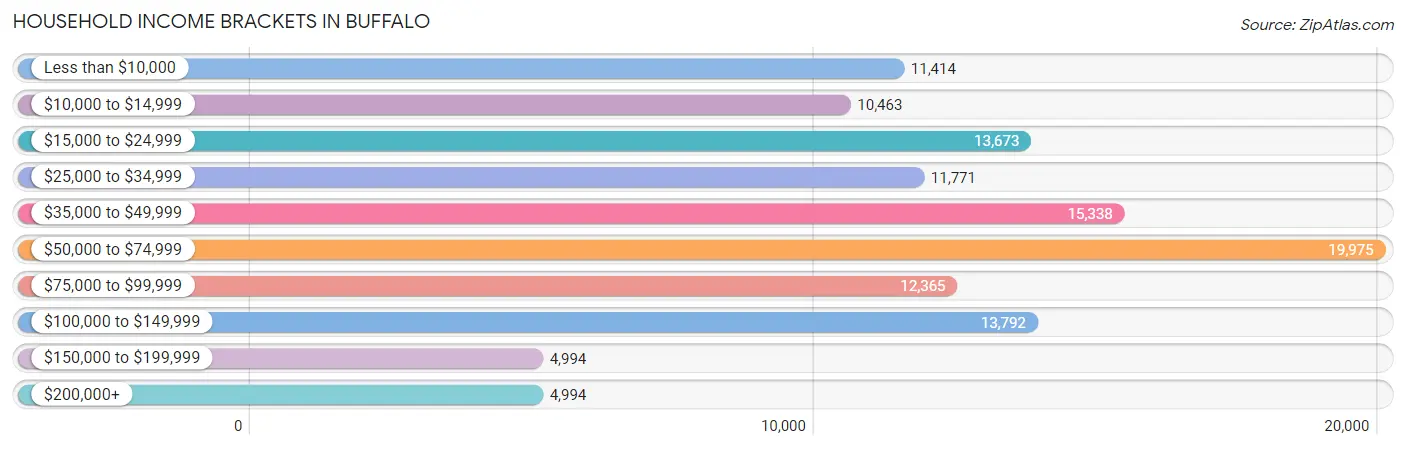
| Income Bracket | # Households | % Households |
| Less than $10,000 | 11,414 | 9.6% |
| $10,000 to $14,999 | 10,463 | 8.8% |
| $15,000 to $24,999 | 13,673 | 11.5% |
| $25,000 to $34,999 | 11,771 | 9.9% |
| $35,000 to $49,999 | 15,338 | 12.9% |
| $50,000 to $74,999 | 19,975 | 16.8% |
| $75,000 to $99,999 | 12,365 | 10.4% |
| $100,000 to $149,999 | 13,792 | 11.6% |
| $150,000 to $199,999 | 4,994 | 4.2% |
| $200,000+ | 4,994 | 4.2% |
Household Income by Householder Age in Buffalo
The median household income in Buffalo is $46,184, with the highest median household income of $52,452 found in the 25 to 44 years age bracket for the primary householder. A total of 44,746 households (37.6%) fall into this category. Meanwhile, the 15 to 24 years age bracket for the primary householder has the lowest median household income of $33,557, with 7,118 households (6.0%) in this group.
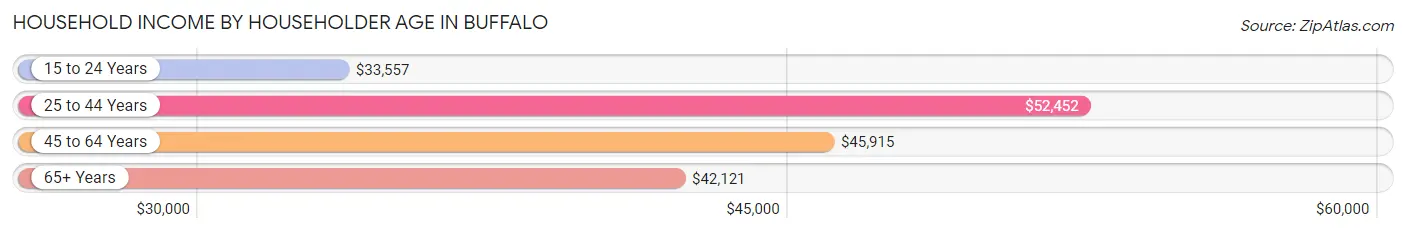
| Income Bracket | # Households | Median Income |
| 15 to 24 Years | 7,118 (6.0%) | $33,557 |
| 25 to 44 Years | 44,746 (37.6%) | $52,452 |
| 45 to 64 Years | 40,373 (34.0%) | $45,915 |
| 65+ Years | 26,660 (22.4%) | $42,121 |
| Total | 118,897 (100.0%) | $46,184 |
Poverty in Buffalo
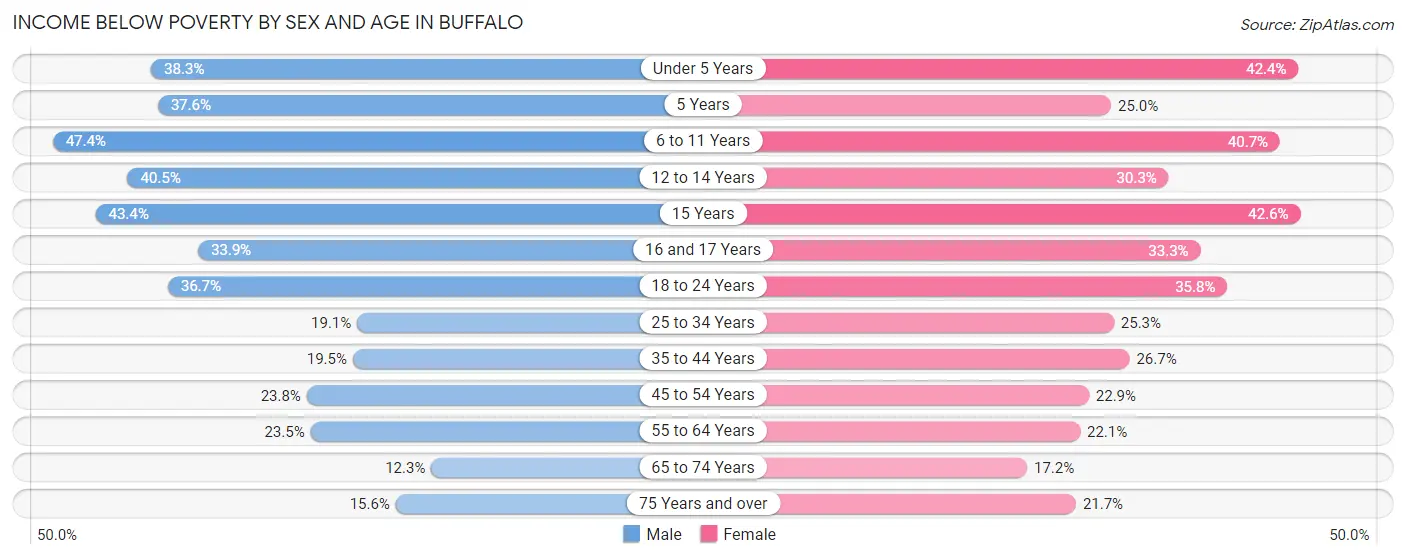
Income Below Poverty by Sex and Age in Buffalo
With 26.7% poverty level for males and 27.6% for females among the residents of Buffalo, 6 to 11 year old males and 15 year old females are the most vulnerable to poverty, with 4,942 males (47.4%) and 664 females (42.6%) in their respective age groups living below the poverty level.
| Age Bracket | Male | Female |
| Under 5 Years | 3,255 (38.3%) | 3,644 (42.4%) |
| 5 Years | 658 (37.6%) | 425 (25.0%) |
| 6 to 11 Years | 4,942 (47.4%) | 4,231 (40.7%) |
| 12 to 14 Years | 2,087 (40.5%) | 1,319 (30.3%) |
| 15 Years | 767 (43.4%) | 664 (42.6%) |
| 16 and 17 Years | 1,066 (33.9%) | 1,092 (33.3%) |
| 18 to 24 Years | 4,848 (36.7%) | 4,938 (35.8%) |
| 25 to 34 Years | 4,487 (19.1%) | 6,328 (25.3%) |
| 35 to 44 Years | 3,143 (19.5%) | 4,749 (26.7%) |
| 45 to 54 Years | 3,443 (23.8%) | 3,398 (22.9%) |
| 55 to 64 Years | 3,725 (23.5%) | 3,848 (22.1%) |
| 65 to 74 Years | 1,291 (12.3%) | 2,198 (17.2%) |
| 75 Years and over | 775 (15.6%) | 1,745 (21.7%) |
| Total | 34,487 (26.7%) | 38,579 (27.6%) |
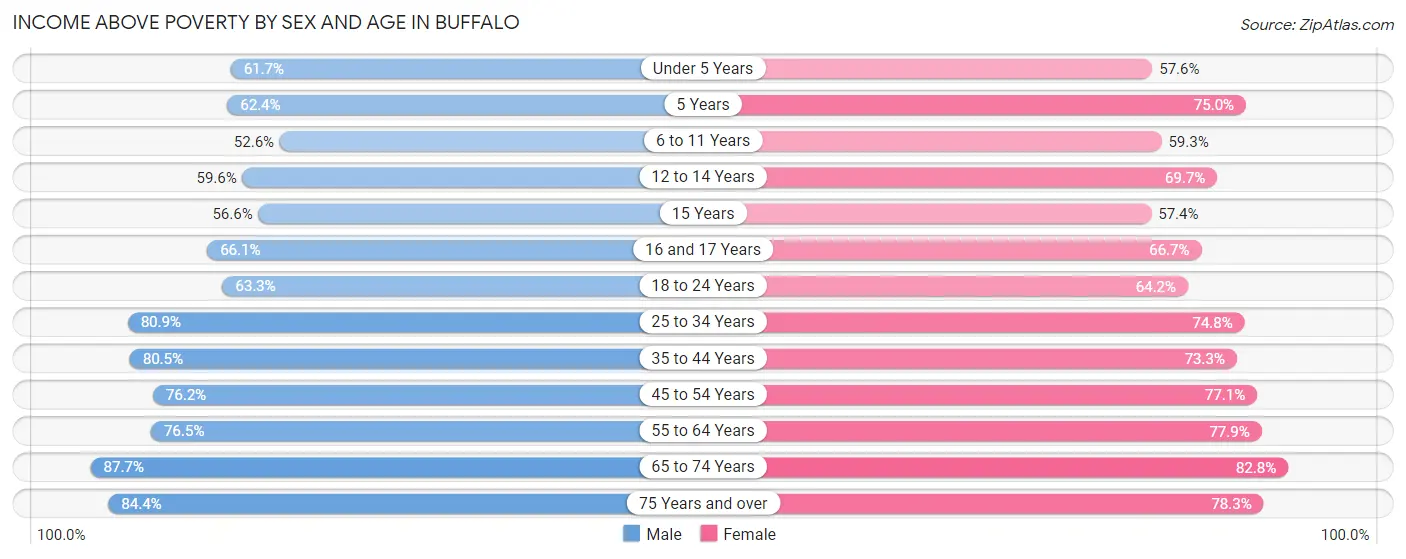
Income Above Poverty by Sex and Age in Buffalo
According to the poverty statistics in Buffalo, males aged 65 to 74 years and females aged 65 to 74 years are the age groups that are most secure financially, with 87.7% of males and 82.8% of females in these age groups living above the poverty line.
| Age Bracket | Male | Female |
| Under 5 Years | 5,253 (61.7%) | 4,958 (57.6%) |
| 5 Years | 1,090 (62.4%) | 1,276 (75.0%) |
| 6 to 11 Years | 5,487 (52.6%) | 6,174 (59.3%) |
| 12 to 14 Years | 3,072 (59.6%) | 3,030 (69.7%) |
| 15 Years | 1,000 (56.6%) | 896 (57.4%) |
| 16 and 17 Years | 2,078 (66.1%) | 2,189 (66.7%) |
| 18 to 24 Years | 8,360 (63.3%) | 8,865 (64.2%) |
| 25 to 34 Years | 18,955 (80.9%) | 18,736 (74.8%) |
| 35 to 44 Years | 12,944 (80.5%) | 13,039 (73.3%) |
| 45 to 54 Years | 11,012 (76.2%) | 11,419 (77.1%) |
| 55 to 64 Years | 12,147 (76.5%) | 13,553 (77.9%) |
| 65 to 74 Years | 9,242 (87.7%) | 10,588 (82.8%) |
| 75 Years and over | 4,205 (84.4%) | 6,285 (78.3%) |
| Total | 94,845 (73.3%) | 101,008 (72.4%) |
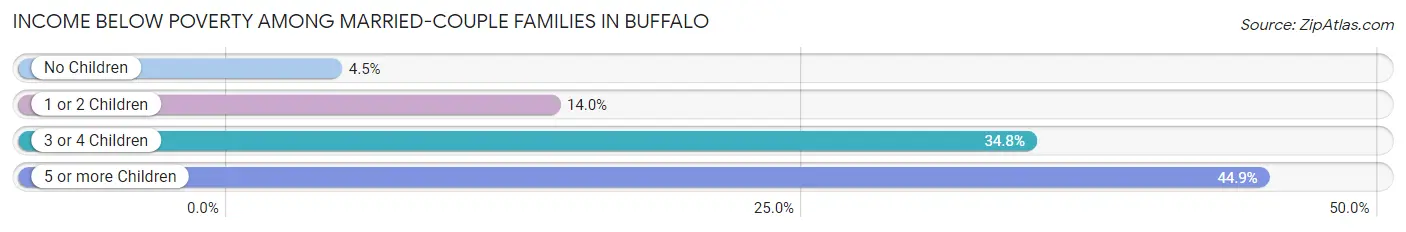
Income Below Poverty Among Married-Couple Families in Buffalo
The poverty statistics for married-couple families in Buffalo show that 11.7% or 3,407 of the total 29,225 families live below the poverty line. Families with 5 or more children have the highest poverty rate of 44.9%, comprising of 303 families. On the other hand, families with no children have the lowest poverty rate of 4.5%, which includes 727 families.
| Children | Above Poverty | Below Poverty |
| No Children | 15,343 (95.5%) | 727 (4.5%) |
| 1 or 2 Children | 8,126 (86.0%) | 1,324 (14.0%) |
| 3 or 4 Children | 1,977 (65.2%) | 1,053 (34.7%) |
| 5 or more Children | 372 (55.1%) | 303 (44.9%) |
| Total | 25,818 (88.3%) | 3,407 (11.7%) |
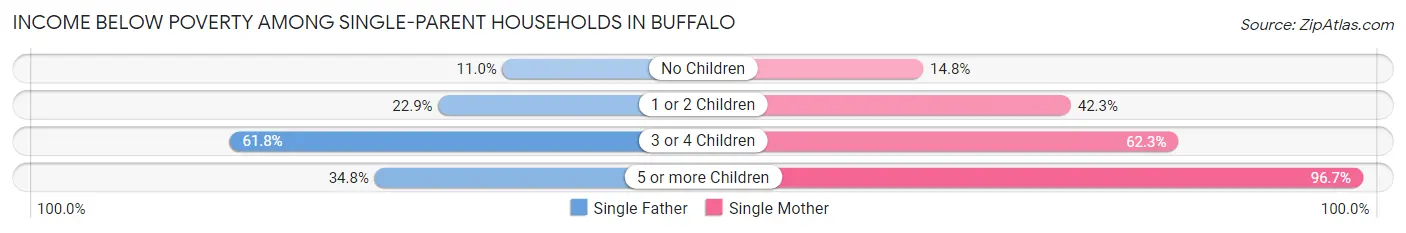
Income Below Poverty Among Single-Parent Households in Buffalo
According to the poverty data in Buffalo, 20.3% or 1,230 single-father households and 35.2% or 8,057 single-mother households are living below the poverty line. Among single-father households, those with 3 or 4 children have the highest poverty rate, with 363 households (61.8%) experiencing poverty. Likewise, among single-mother households, those with 5 or more children have the highest poverty rate, with 204 households (96.7%) falling below the poverty line.
| Children | Single Father | Single Mother |
| No Children | 360 (11.0%) | 1,268 (14.8%) |
| 1 or 2 Children | 491 (22.9%) | 4,677 (42.3%) |
| 3 or 4 Children | 363 (61.8%) | 1,908 (62.3%) |
| 5 or more Children | 16 (34.8%) | 204 (96.7%) |
| Total | 1,230 (20.3%) | 8,057 (35.2%) |
Income Below Poverty Among Married-Couple vs Single-Parent Households in Buffalo
The poverty data for Buffalo shows that 3,407 of the married-couple family households (11.7%) and 9,287 of the single-parent households (32.1%) are living below the poverty level. Within the married-couple family households, those with 5 or more children have the highest poverty rate, with 303 households (44.9%) falling below the poverty line. Among the single-parent households, those with 5 or more children have the highest poverty rate, with 220 household (85.6%) living below poverty.
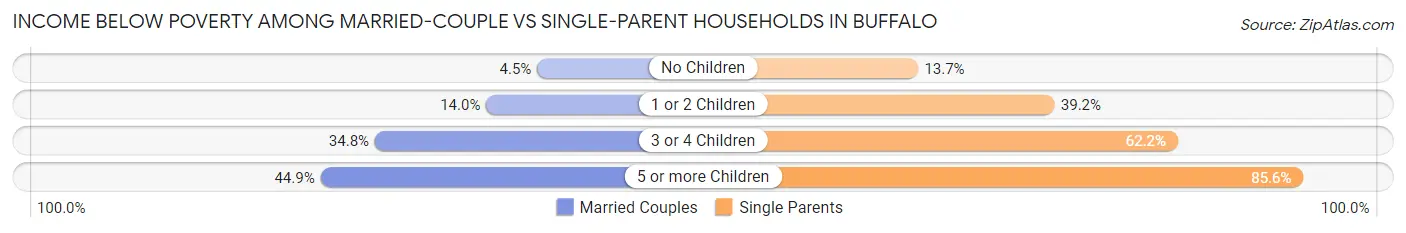
| Children | Married-Couple Families | Single-Parent Households |
| No Children | 727 (4.5%) | 1,628 (13.7%) |
| 1 or 2 Children | 1,324 (14.0%) | 5,168 (39.2%) |
| 3 or 4 Children | 1,053 (34.7%) | 2,271 (62.2%) |
| 5 or more Children | 303 (44.9%) | 220 (85.6%) |
| Total | 3,407 (11.7%) | 9,287 (32.1%) |
Employment Characteristics in Buffalo
Employment by Class of Employer in Buffalo
Among the 120,181 employed individuals in Buffalo, private company employees (74,871 | 62.3%), not-for-profit organizations (18,096 | 15.1%), and local government employees (10,657 | 8.9%) make up the most common classes of employment.
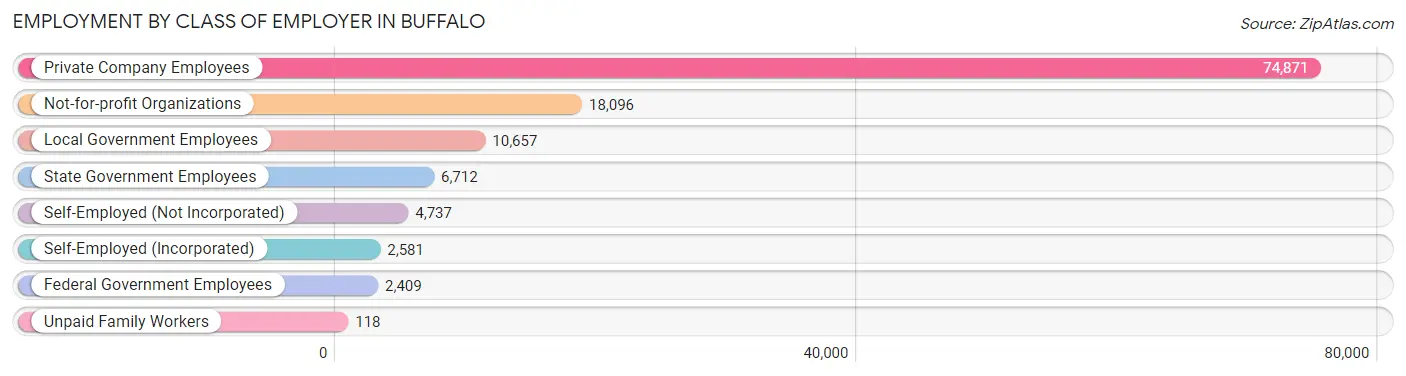
| Employer Class | # Employees | % Employees |
| Private Company Employees | 74,871 | 62.3% |
| Self-Employed (Incorporated) | 2,581 | 2.1% |
| Self-Employed (Not Incorporated) | 4,737 | 3.9% |
| Not-for-profit Organizations | 18,096 | 15.1% |
| Local Government Employees | 10,657 | 8.9% |
| State Government Employees | 6,712 | 5.6% |
| Federal Government Employees | 2,409 | 2.0% |
| Unpaid Family Workers | 118 | 0.1% |
| Total | 120,181 | 100.0% |
Employment Status by Age in Buffalo
According to the labor force statistics for Buffalo, out of the total population over 16 years of age (221,419), 60.2% or 133,294 individuals are in the labor force, with 7.0% or 9,331 of them unemployed. The age group with the highest labor force participation rate is 25 to 29 years, with 80.4% or 20,972 individuals in the labor force. Within the labor force, the 16 to 19 years age range has the highest percentage of unemployed individuals, with 14.9% or 805 of them being unemployed.
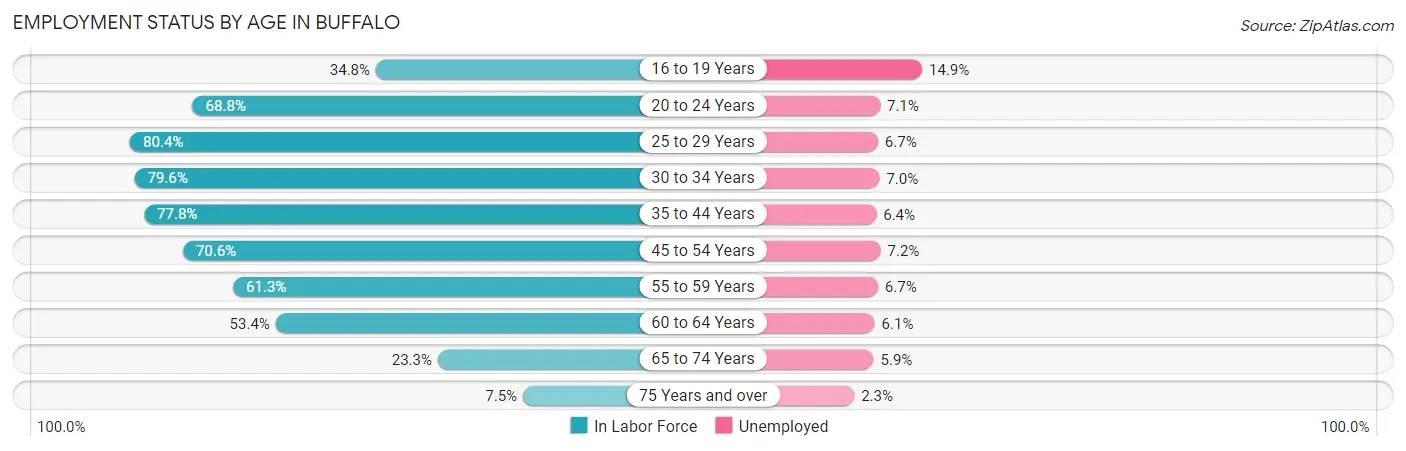
| Age Bracket | In Labor Force | Unemployed |
| 16 to 19 Years | 5,400 (34.8%) | 805 (14.9%) |
| 20 to 24 Years | 15,826 (68.8%) | 1,124 (7.1%) |
| 25 to 29 Years | 20,972 (80.4%) | 1,405 (6.7%) |
| 30 to 34 Years | 18,119 (79.6%) | 1,268 (7.0%) |
| 35 to 44 Years | 26,467 (77.8%) | 1,694 (6.4%) |
| 45 to 54 Years | 20,785 (70.6%) | 1,497 (7.2%) |
| 55 to 59 Years | 10,078 (61.3%) | 675 (6.7%) |
| 60 to 64 Years | 9,076 (53.4%) | 554 (6.1%) |
| 65 to 74 Years | 5,476 (23.3%) | 323 (5.9%) |
| 75 Years and over | 1,024 (7.5%) | 24 (2.3%) |
| Total | 133,294 (60.2%) | 9,331 (7.0%) |
Employment Status by Educational Attainment in Buffalo
According to labor force statistics for Buffalo, 72.4% of individuals (105,519) out of the total population between 25 and 64 years of age (145,744) are in the labor force, with 6.7% or 7,070 of them being unemployed. The group with the highest labor force participation rate are those with the educational attainment of bachelor's degree or higher, with 87.8% or 40,733 individuals in the labor force. Within the labor force, individuals with less than high school education have the highest percentage of unemployment, with 12.9% or 1,126 of them being unemployed.
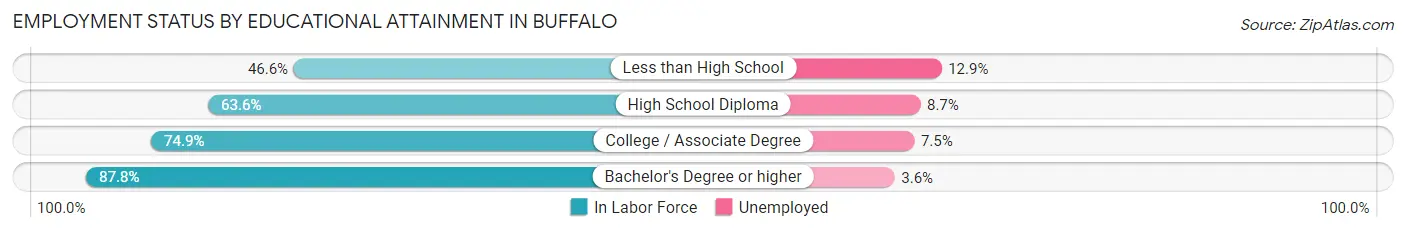
| Educational Attainment | In Labor Force | Unemployed |
| Less than High School | 8,732 (46.6%) | 2,417 (12.9%) |
| High School Diploma | 24,324 (63.6%) | 3,327 (8.7%) |
| College / Associate Degree | 31,732 (74.9%) | 3,177 (7.5%) |
| Bachelor's Degree or higher | 40,733 (87.8%) | 1,670 (3.6%) |
| Total | 105,519 (72.4%) | 9,765 (6.7%) |
Employment Occupations by Sex in Buffalo
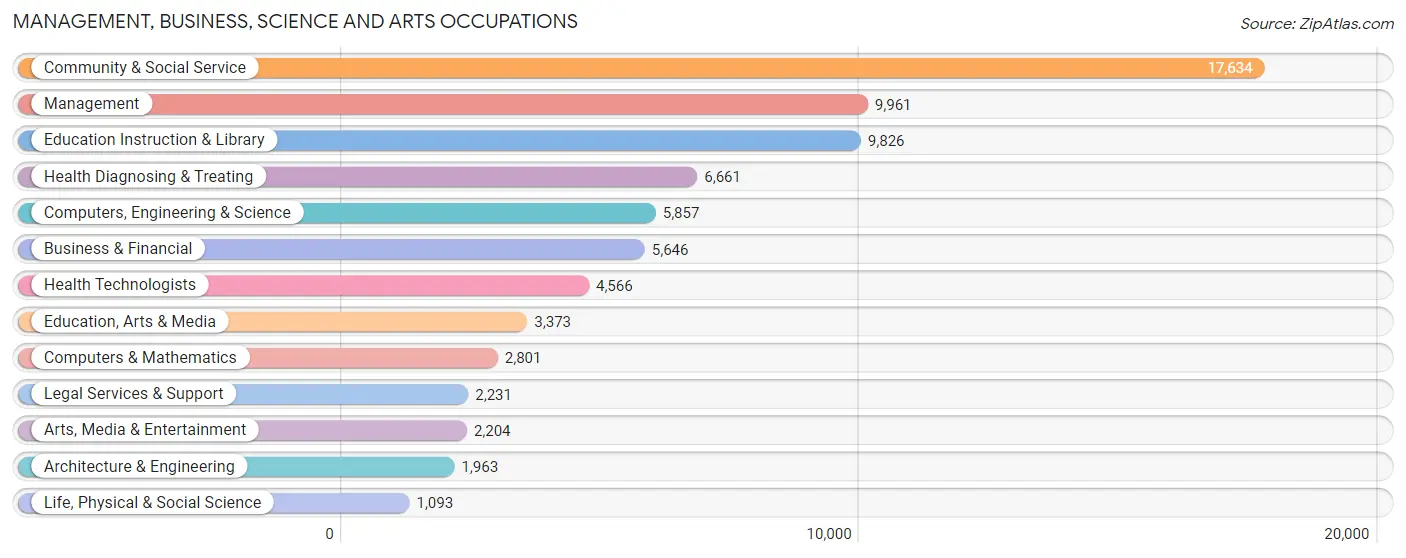
Management, Business, Science and Arts Occupations
The most common Management, Business, Science and Arts occupations in Buffalo are Community & Social Service (17,634 | 14.2%), Management (9,961 | 8.1%), Education Instruction & Library (9,826 | 7.9%), Health Diagnosing & Treating (6,661 | 5.4%), and Computers, Engineering & Science (5,857 | 4.7%).
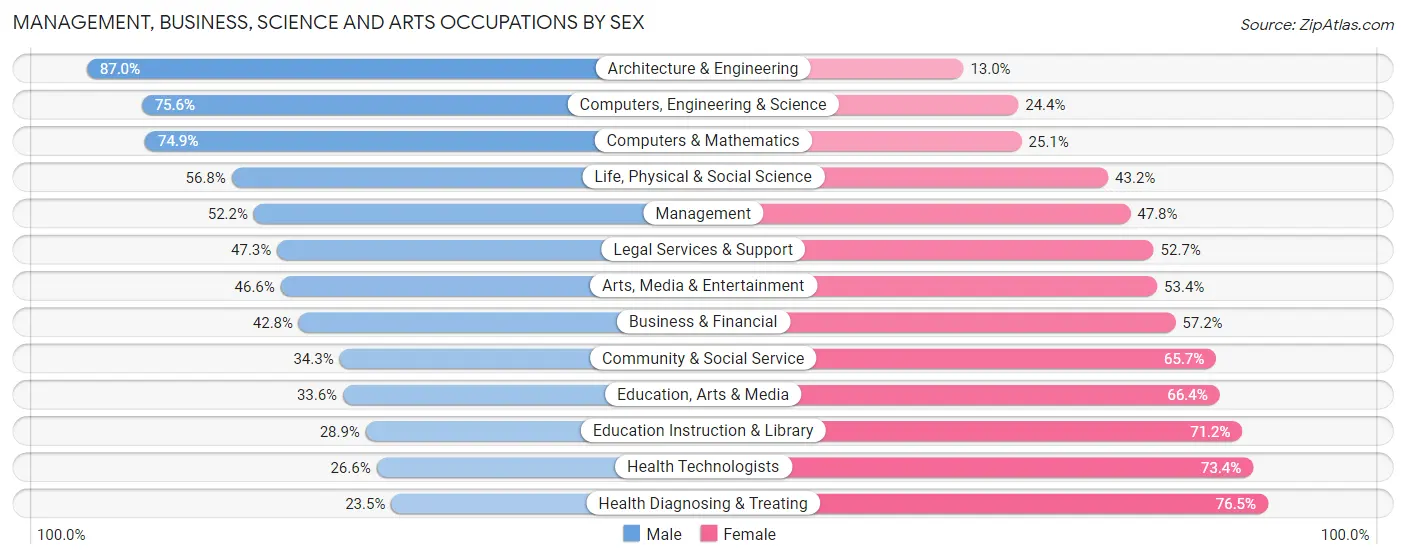
Management, Business, Science and Arts Occupations by Sex
Within the Management, Business, Science and Arts occupations in Buffalo, the most male-oriented occupations are Architecture & Engineering (87.0%), Computers, Engineering & Science (75.6%), and Computers & Mathematics (74.9%), while the most female-oriented occupations are Health Diagnosing & Treating (76.5%), Health Technologists (73.4%), and Education Instruction & Library (71.2%).
| Occupation | Male | Female |
| Management | 5,199 (52.2%) | 4,762 (47.8%) |
| Business & Financial | 2,416 (42.8%) | 3,230 (57.2%) |
| Computers, Engineering & Science | 4,426 (75.6%) | 1,431 (24.4%) |
| Computers & Mathematics | 2,097 (74.9%) | 704 (25.1%) |
| Architecture & Engineering | 1,708 (87.0%) | 255 (13.0%) |
| Life, Physical & Social Science | 621 (56.8%) | 472 (43.2%) |
| Community & Social Service | 6,051 (34.3%) | 11,583 (65.7%) |
| Education, Arts & Media | 1,133 (33.6%) | 2,240 (66.4%) |
| Legal Services & Support | 1,056 (47.3%) | 1,175 (52.7%) |
| Education Instruction & Library | 2,835 (28.8%) | 6,991 (71.2%) |
| Arts, Media & Entertainment | 1,027 (46.6%) | 1,177 (53.4%) |
| Health Diagnosing & Treating | 1,567 (23.5%) | 5,094 (76.5%) |
| Health Technologists | 1,214 (26.6%) | 3,352 (73.4%) |
| Total (Category) | 19,659 (43.0%) | 26,100 (57.0%) |
| Total (Overall) | 59,770 (48.3%) | 63,962 (51.7%) |
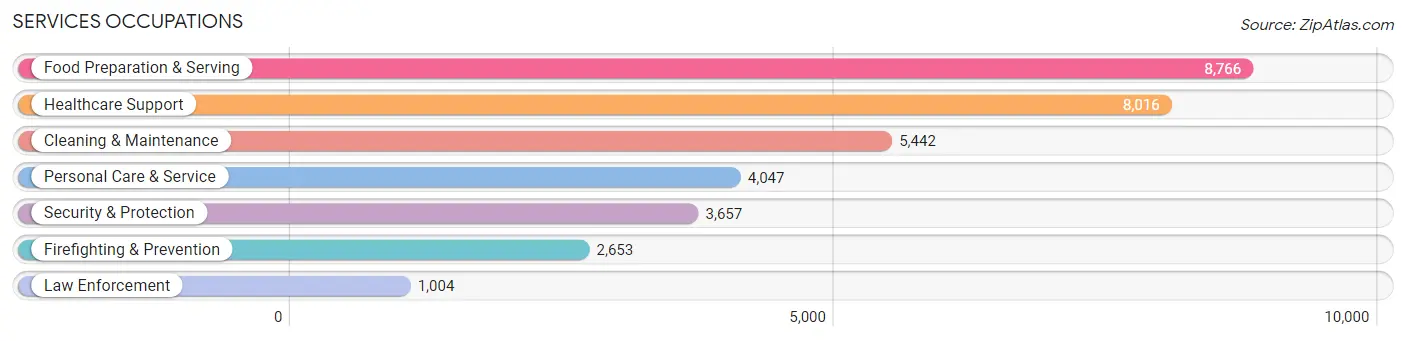
Services Occupations
The most common Services occupations in Buffalo are Food Preparation & Serving (8,766 | 7.1%), Healthcare Support (8,016 | 6.5%), Cleaning & Maintenance (5,442 | 4.4%), Personal Care & Service (4,047 | 3.3%), and Security & Protection (3,657 | 3.0%).
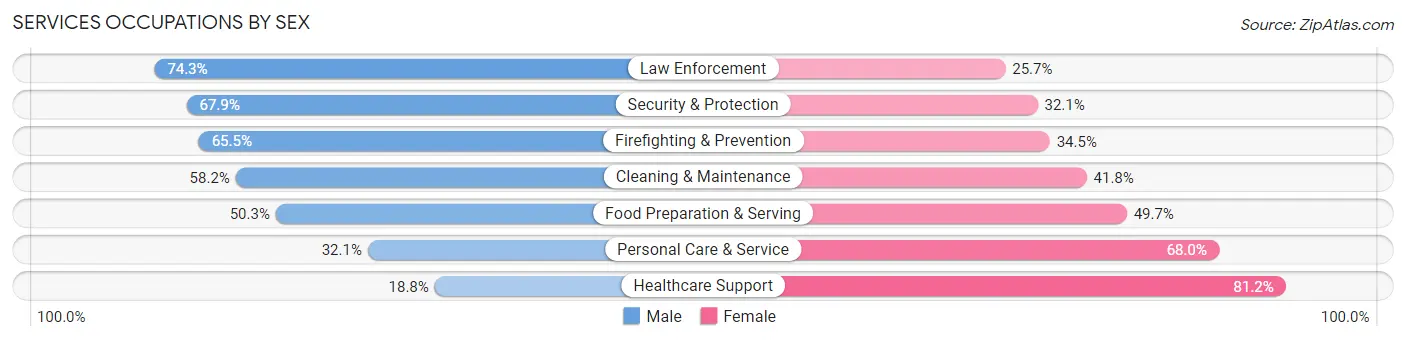
Services Occupations by Sex
Within the Services occupations in Buffalo, the most male-oriented occupations are Law Enforcement (74.3%), Security & Protection (67.9%), and Firefighting & Prevention (65.5%), while the most female-oriented occupations are Healthcare Support (81.2%), Personal Care & Service (67.9%), and Food Preparation & Serving (49.7%).
| Occupation | Male | Female |
| Healthcare Support | 1,508 (18.8%) | 6,508 (81.2%) |
| Security & Protection | 2,484 (67.9%) | 1,173 (32.1%) |
| Firefighting & Prevention | 1,738 (65.5%) | 915 (34.5%) |
| Law Enforcement | 746 (74.3%) | 258 (25.7%) |
| Food Preparation & Serving | 4,407 (50.3%) | 4,359 (49.7%) |
| Cleaning & Maintenance | 3,168 (58.2%) | 2,274 (41.8%) |
| Personal Care & Service | 1,297 (32.1%) | 2,750 (67.9%) |
| Total (Category) | 12,864 (43.0%) | 17,064 (57.0%) |
| Total (Overall) | 59,770 (48.3%) | 63,962 (51.7%) |
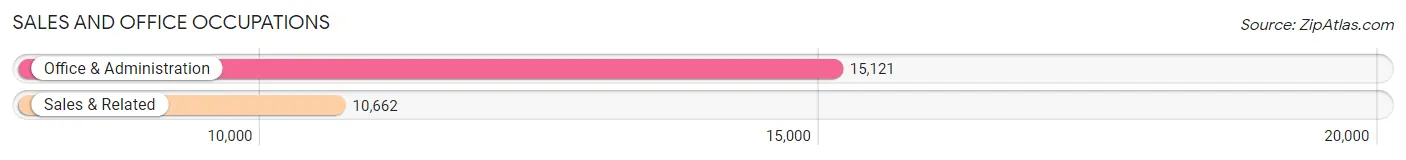
Sales and Office Occupations
The most common Sales and Office occupations in Buffalo are Office & Administration (15,121 | 12.2%), and Sales & Related (10,662 | 8.6%).
Sales and Office Occupations by Sex
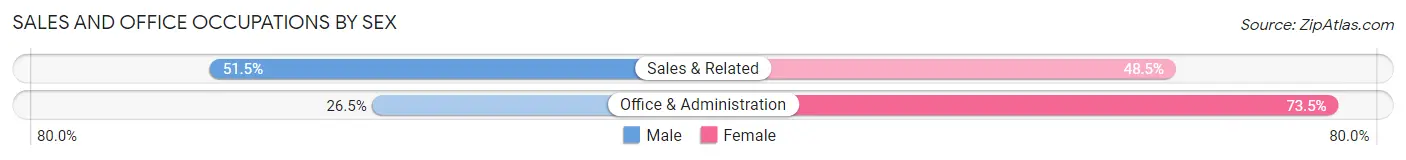
| Occupation | Male | Female |
| Sales & Related | 5,491 (51.5%) | 5,171 (48.5%) |
| Office & Administration | 4,004 (26.5%) | 11,117 (73.5%) |
| Total (Category) | 9,495 (36.8%) | 16,288 (63.2%) |
| Total (Overall) | 59,770 (48.3%) | 63,962 (51.7%) |
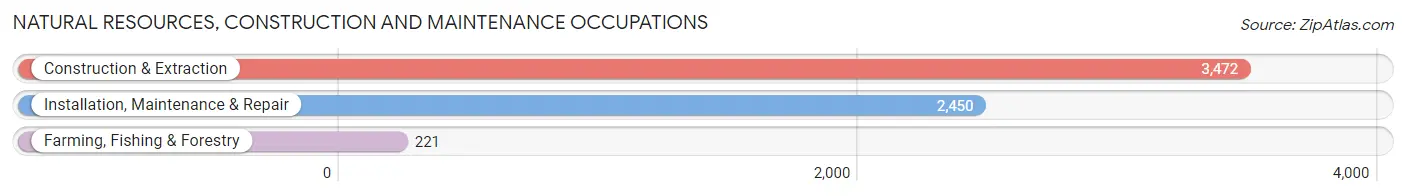
Natural Resources, Construction and Maintenance Occupations
The most common Natural Resources, Construction and Maintenance occupations in Buffalo are Construction & Extraction (3,472 | 2.8%), Installation, Maintenance & Repair (2,450 | 2.0%), and Farming, Fishing & Forestry (221 | 0.2%).
Natural Resources, Construction and Maintenance Occupations by Sex
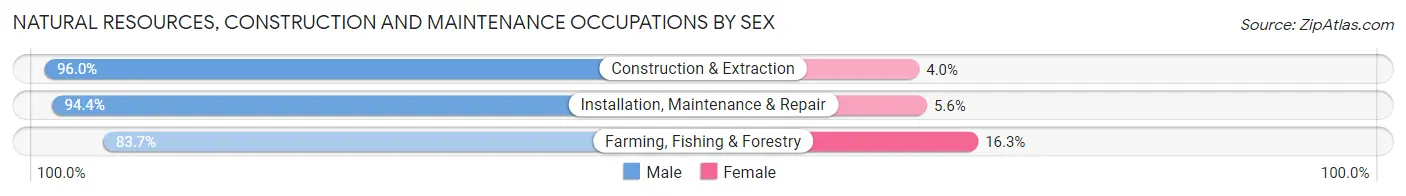
| Occupation | Male | Female |
| Farming, Fishing & Forestry | 185 (83.7%) | 36 (16.3%) |
| Construction & Extraction | 3,332 (96.0%) | 140 (4.0%) |
| Installation, Maintenance & Repair | 2,312 (94.4%) | 138 (5.6%) |
| Total (Category) | 5,829 (94.9%) | 314 (5.1%) |
| Total (Overall) | 59,770 (48.3%) | 63,962 (51.7%) |
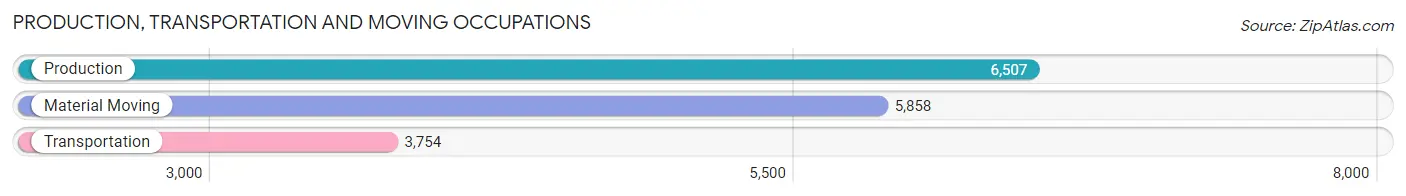
Production, Transportation and Moving Occupations
The most common Production, Transportation and Moving occupations in Buffalo are Production (6,507 | 5.3%), Material Moving (5,858 | 4.7%), and Transportation (3,754 | 3.0%).
Production, Transportation and Moving Occupations by Sex
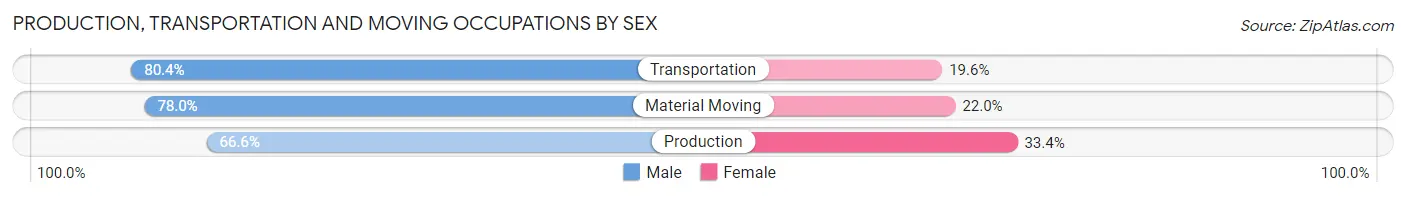
| Occupation | Male | Female |
| Production | 4,335 (66.6%) | 2,172 (33.4%) |
| Transportation | 3,019 (80.4%) | 735 (19.6%) |
| Material Moving | 4,569 (78.0%) | 1,289 (22.0%) |
| Total (Category) | 11,923 (74.0%) | 4,196 (26.0%) |
| Total (Overall) | 59,770 (48.3%) | 63,962 (51.7%) |
Employment Industries by Sex in Buffalo
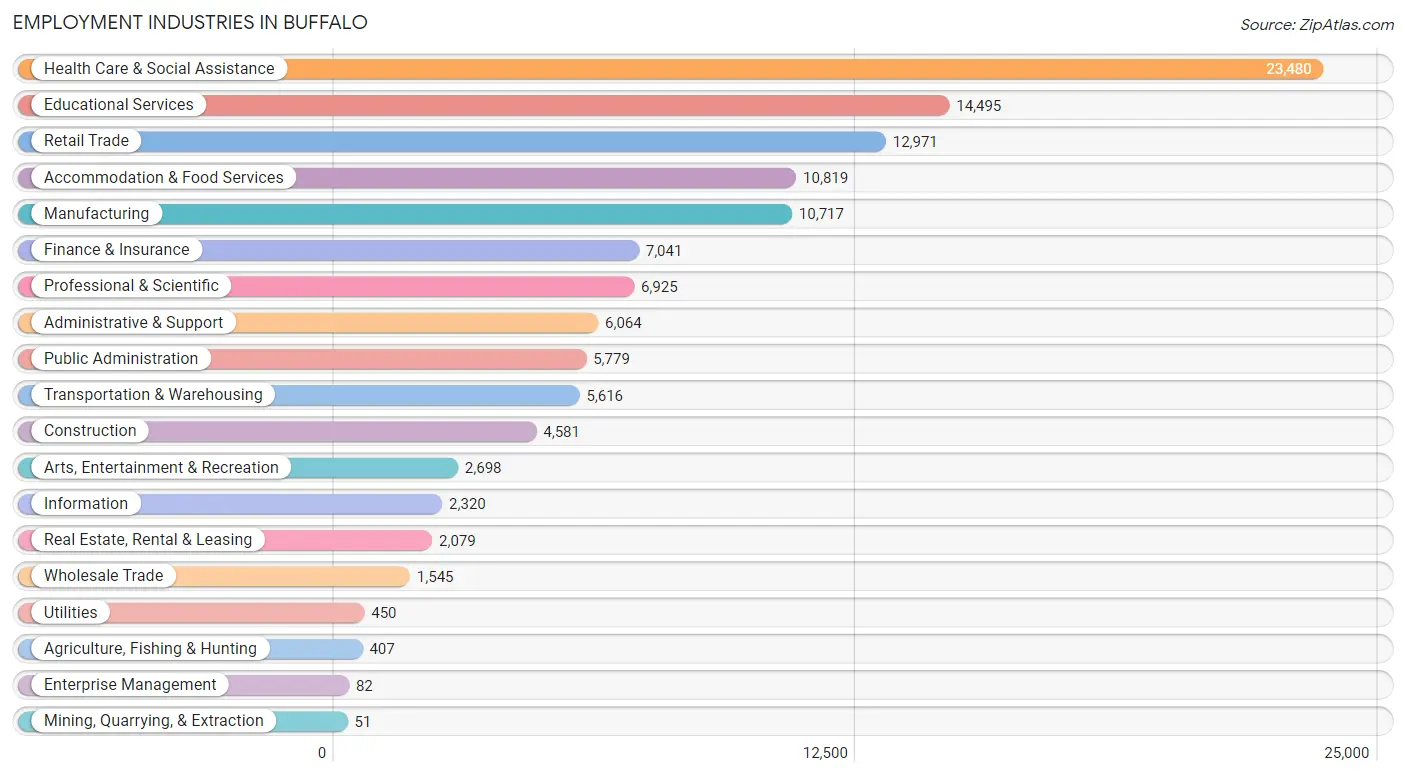
Employment Industries in Buffalo
The major employment industries in Buffalo include Health Care & Social Assistance (23,480 | 19.0%), Educational Services (14,495 | 11.7%), Retail Trade (12,971 | 10.5%), Accommodation & Food Services (10,819 | 8.7%), and Manufacturing (10,717 | 8.7%).
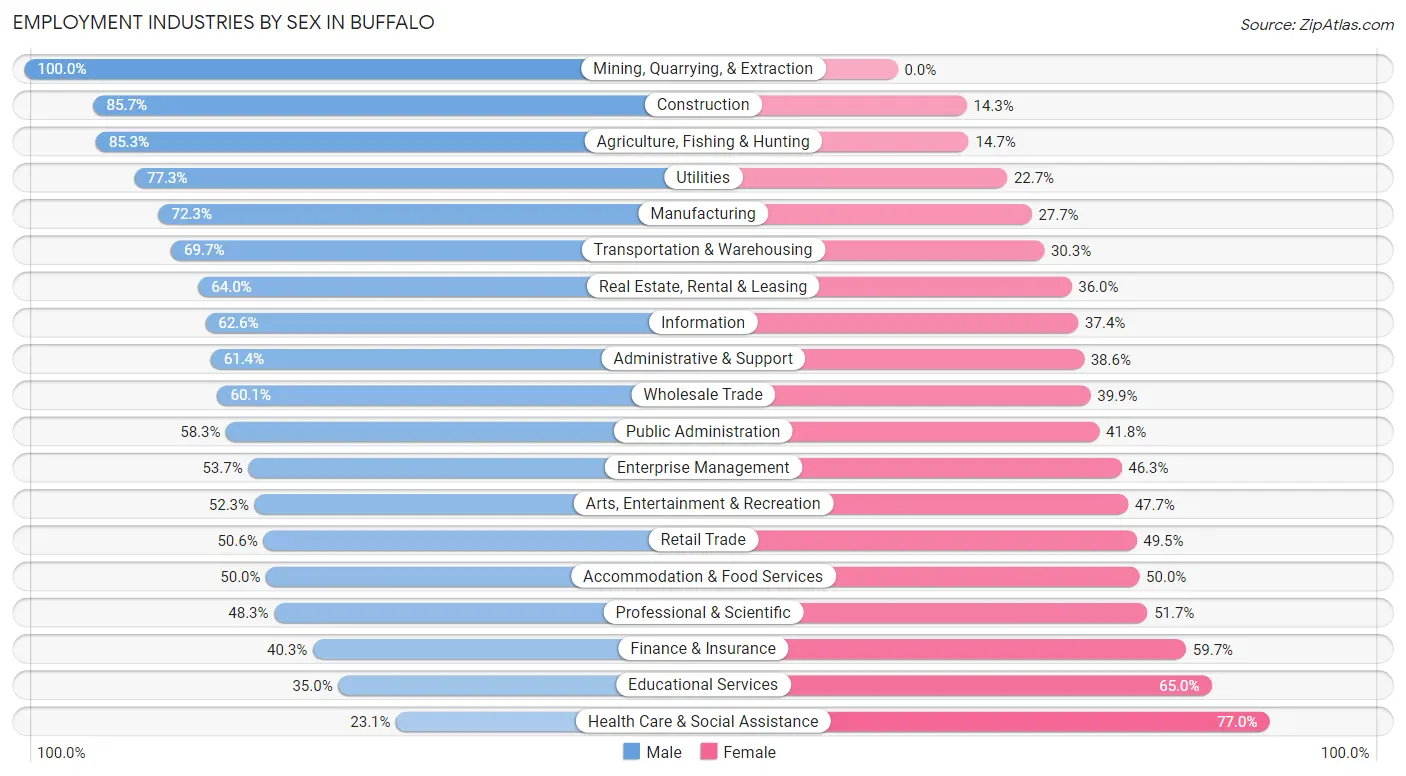
Employment Industries by Sex in Buffalo
The Buffalo industries that see more men than women are Mining, Quarrying, & Extraction (100.0%), Construction (85.7%), and Agriculture, Fishing & Hunting (85.3%), whereas the industries that tend to have a higher number of women are Health Care & Social Assistance (76.9%), Educational Services (65.0%), and Finance & Insurance (59.7%).
| Industry | Male | Female |
| Agriculture, Fishing & Hunting | 347 (85.3%) | 60 (14.7%) |
| Mining, Quarrying, & Extraction | 51 (100.0%) | 0 (0.0%) |
| Construction | 3,926 (85.7%) | 655 (14.3%) |
| Manufacturing | 7,744 (72.3%) | 2,973 (27.7%) |
| Wholesale Trade | 928 (60.1%) | 617 (39.9%) |
| Retail Trade | 6,557 (50.5%) | 6,414 (49.4%) |
| Transportation & Warehousing | 3,912 (69.7%) | 1,704 (30.3%) |
| Utilities | 348 (77.3%) | 102 (22.7%) |
| Information | 1,452 (62.6%) | 868 (37.4%) |
| Finance & Insurance | 2,837 (40.3%) | 4,204 (59.7%) |
| Real Estate, Rental & Leasing | 1,331 (64.0%) | 748 (36.0%) |
| Professional & Scientific | 3,345 (48.3%) | 3,580 (51.7%) |
| Enterprise Management | 44 (53.7%) | 38 (46.3%) |
| Administrative & Support | 3,726 (61.4%) | 2,338 (38.6%) |
| Educational Services | 5,077 (35.0%) | 9,418 (65.0%) |
| Health Care & Social Assistance | 5,412 (23.1%) | 18,068 (76.9%) |
| Arts, Entertainment & Recreation | 1,412 (52.3%) | 1,286 (47.7%) |
| Accommodation & Food Services | 5,405 (50.0%) | 5,414 (50.0%) |
| Public Administration | 3,366 (58.3%) | 2,413 (41.7%) |
| Total | 59,770 (48.3%) | 63,962 (51.7%) |
Education in Buffalo
School Enrollment in Buffalo
The most common levels of schooling among the 71,606 students in Buffalo are college / undergraduate (17,782 | 24.8%), elementary school (13,819 | 19.3%), and middle school (13,264 | 18.5%).
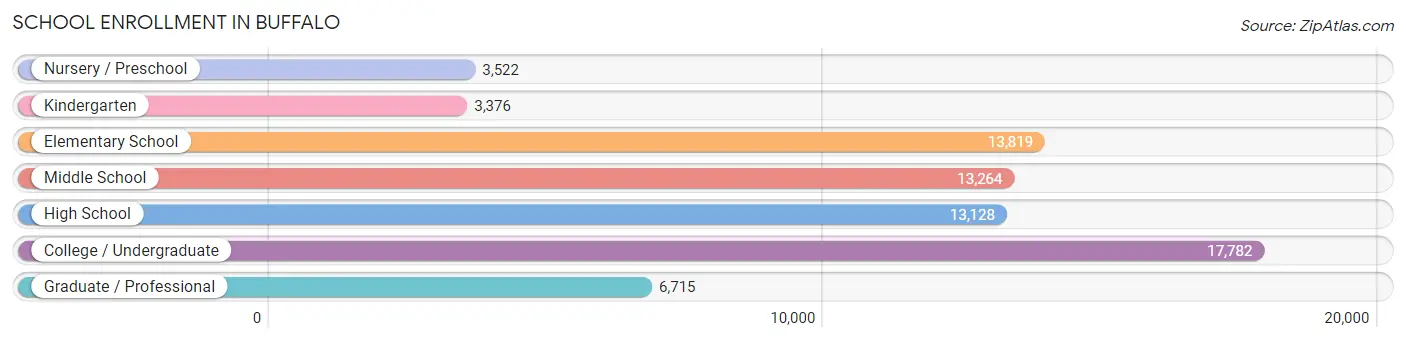
| School Level | # Students | % Students |
| Nursery / Preschool | 3,522 | 4.9% |
| Kindergarten | 3,376 | 4.7% |
| Elementary School | 13,819 | 19.3% |
| Middle School | 13,264 | 18.5% |
| High School | 13,128 | 18.3% |
| College / Undergraduate | 17,782 | 24.8% |
| Graduate / Professional | 6,715 | 9.4% |
| Total | 71,606 | 100.0% |
School Enrollment by Age by Funding Source in Buffalo
Out of a total of 71,606 students who are enrolled in schools in Buffalo, 13,605 (19.0%) attend a private institution, while the remaining 58,001 (81.0%) are enrolled in public schools. The age group of 35 years and over has the highest likelihood of being enrolled in private schools, with 1,064 (34.1% in the age bracket) enrolled. Conversely, the age group of 10 to 14 year olds has the lowest likelihood of being enrolled in a private school, with 14,047 (86.8% in the age bracket) attending a public institution.
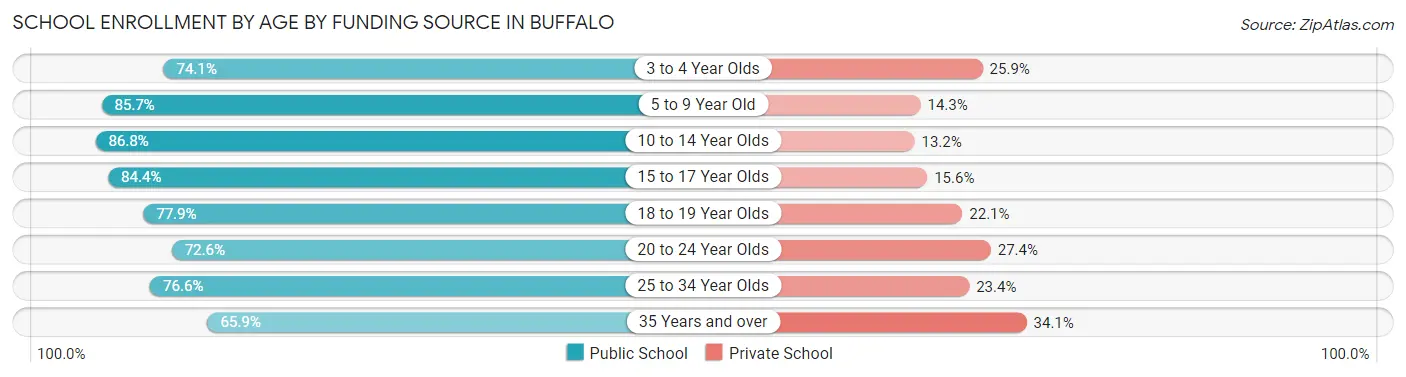
| Age Bracket | Public School | Private School |
| 3 to 4 Year Olds | 2,416 (74.1%) | 844 (25.9%) |
| 5 to 9 Year Old | 13,996 (85.7%) | 2,339 (14.3%) |
| 10 to 14 Year Olds | 14,047 (86.8%) | 2,136 (13.2%) |
| 15 to 17 Year Olds | 7,977 (84.4%) | 1,471 (15.6%) |
| 18 to 19 Year Olds | 5,289 (77.9%) | 1,501 (22.1%) |
| 20 to 24 Year Olds | 7,389 (72.6%) | 2,790 (27.4%) |
| 25 to 34 Year Olds | 4,817 (76.6%) | 1,471 (23.4%) |
| 35 Years and over | 2,059 (65.9%) | 1,064 (34.1%) |
| Total | 58,001 (81.0%) | 13,605 (19.0%) |
Educational Attainment by Field of Study in Buffalo
Business (9,328 | 15.3%), social sciences (6,089 | 10.0%), science & technology (5,592 | 9.2%), education (5,533 | 9.1%), and literature & languages (4,496 | 7.4%) are the most common fields of study among 60,914 individuals in Buffalo who have obtained a bachelor's degree or higher.
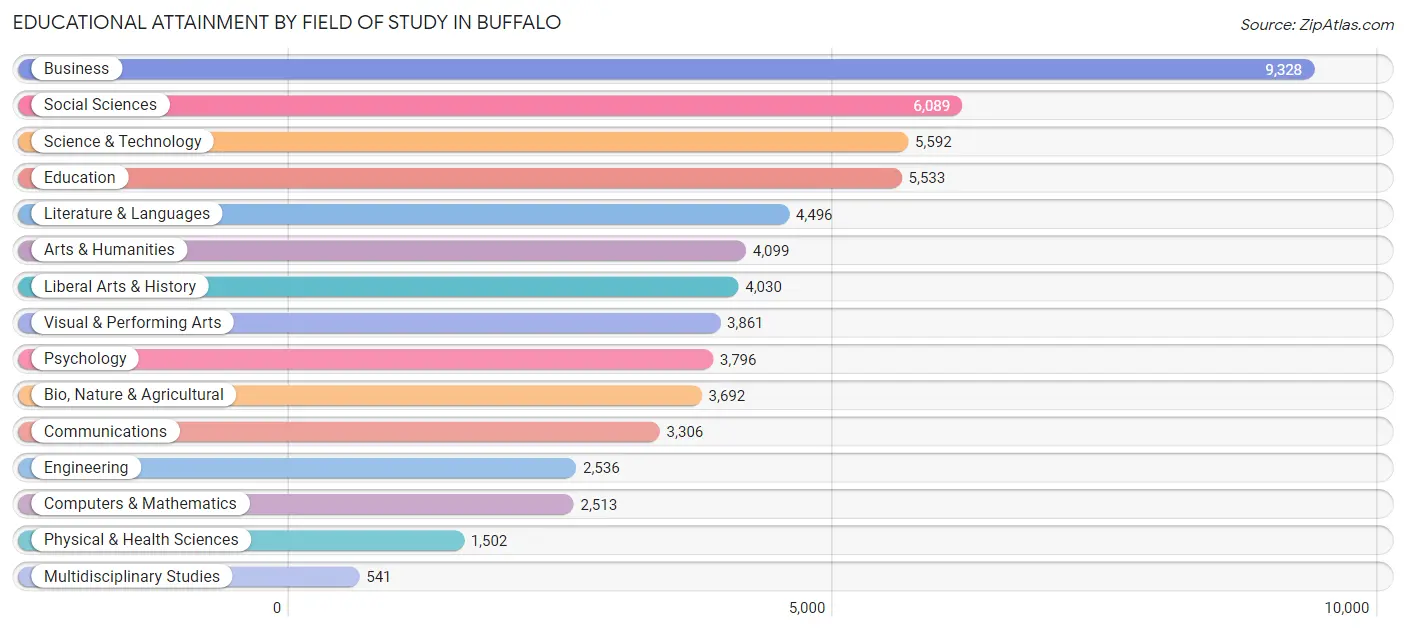
| Field of Study | # Graduates | % Graduates |
| Computers & Mathematics | 2,513 | 4.1% |
| Bio, Nature & Agricultural | 3,692 | 6.1% |
| Physical & Health Sciences | 1,502 | 2.5% |
| Psychology | 3,796 | 6.2% |
| Social Sciences | 6,089 | 10.0% |
| Engineering | 2,536 | 4.2% |
| Multidisciplinary Studies | 541 | 0.9% |
| Science & Technology | 5,592 | 9.2% |
| Business | 9,328 | 15.3% |
| Education | 5,533 | 9.1% |
| Literature & Languages | 4,496 | 7.4% |
| Liberal Arts & History | 4,030 | 6.6% |
| Visual & Performing Arts | 3,861 | 6.3% |
| Communications | 3,306 | 5.4% |
| Arts & Humanities | 4,099 | 6.7% |
| Total | 60,914 | 100.0% |
Transportation & Commute in Buffalo
Vehicle Availability by Sex in Buffalo
The most prevalent vehicle ownership categories in Buffalo are males with 2 vehicles (21,584, accounting for 37.3%) and females with 2 vehicles (21,580, making up 35.6%).
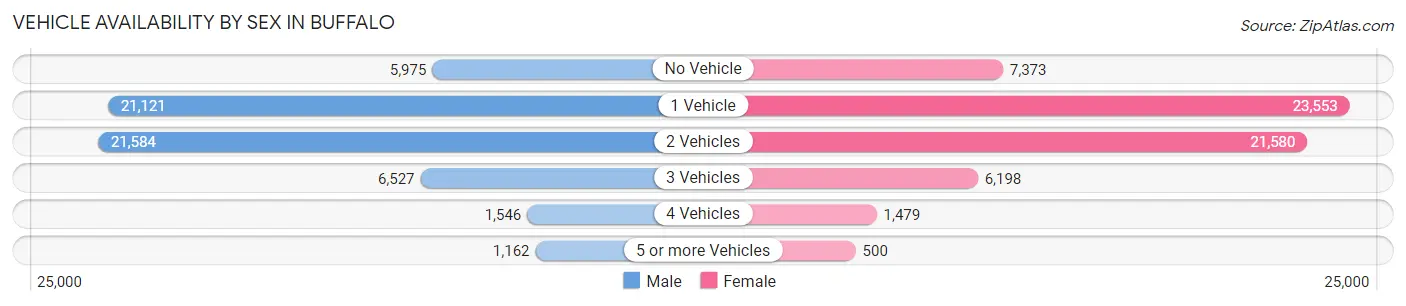
| Vehicles Available | Male | Female |
| No Vehicle | 5,975 (10.3%) | 7,373 (12.1%) |
| 1 Vehicle | 21,121 (36.5%) | 23,553 (38.8%) |
| 2 Vehicles | 21,584 (37.3%) | 21,580 (35.6%) |
| 3 Vehicles | 6,527 (11.3%) | 6,198 (10.2%) |
| 4 Vehicles | 1,546 (2.7%) | 1,479 (2.4%) |
| 5 or more Vehicles | 1,162 (2.0%) | 500 (0.8%) |
| Total | 57,915 (100.0%) | 60,683 (100.0%) |
Commute Time in Buffalo
The most frequently occuring commute durations in Buffalo are 15 to 19 minutes (24,450 commuters, 22.1%), 10 to 14 minutes (20,672 commuters, 18.7%), and 20 to 24 minutes (19,948 commuters, 18.0%).
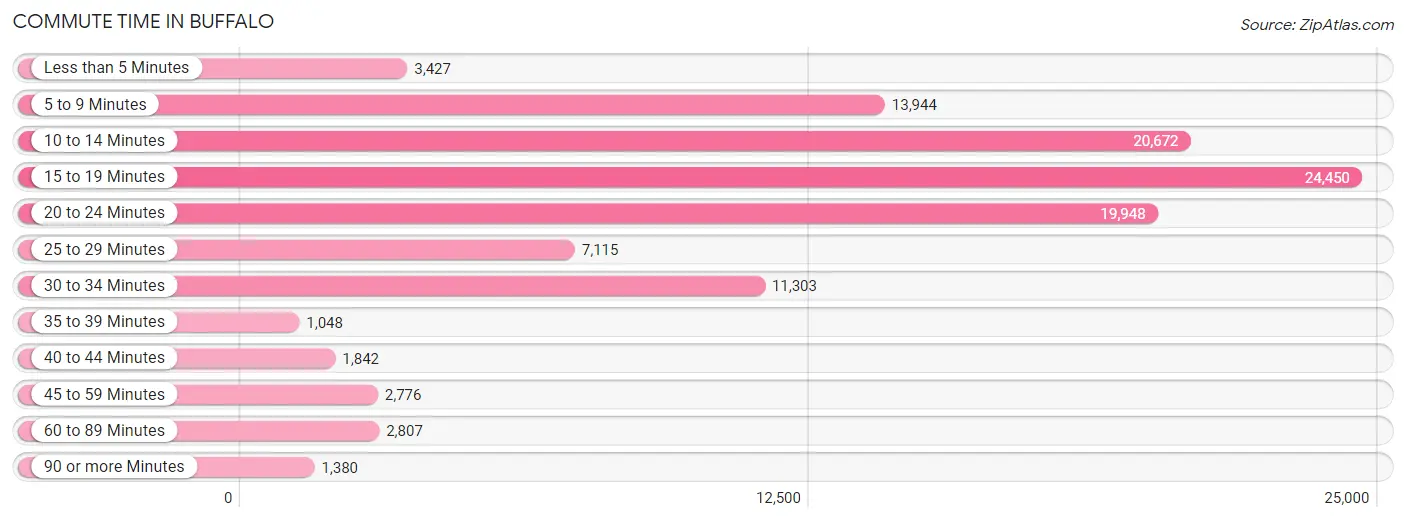
| Commute Time | # Commuters | % Commuters |
| Less than 5 Minutes | 3,427 | 3.1% |
| 5 to 9 Minutes | 13,944 | 12.6% |
| 10 to 14 Minutes | 20,672 | 18.7% |
| 15 to 19 Minutes | 24,450 | 22.1% |
| 20 to 24 Minutes | 19,948 | 18.0% |
| 25 to 29 Minutes | 7,115 | 6.4% |
| 30 to 34 Minutes | 11,303 | 10.2% |
| 35 to 39 Minutes | 1,048 | 0.9% |
| 40 to 44 Minutes | 1,842 | 1.7% |
| 45 to 59 Minutes | 2,776 | 2.5% |
| 60 to 89 Minutes | 2,807 | 2.5% |
| 90 or more Minutes | 1,380 | 1.3% |
Commute Time by Sex in Buffalo
The most common commute times in Buffalo are 15 to 19 minutes (11,752 commuters, 21.6%) for males and 15 to 19 minutes (12,698 commuters, 22.6%) for females.
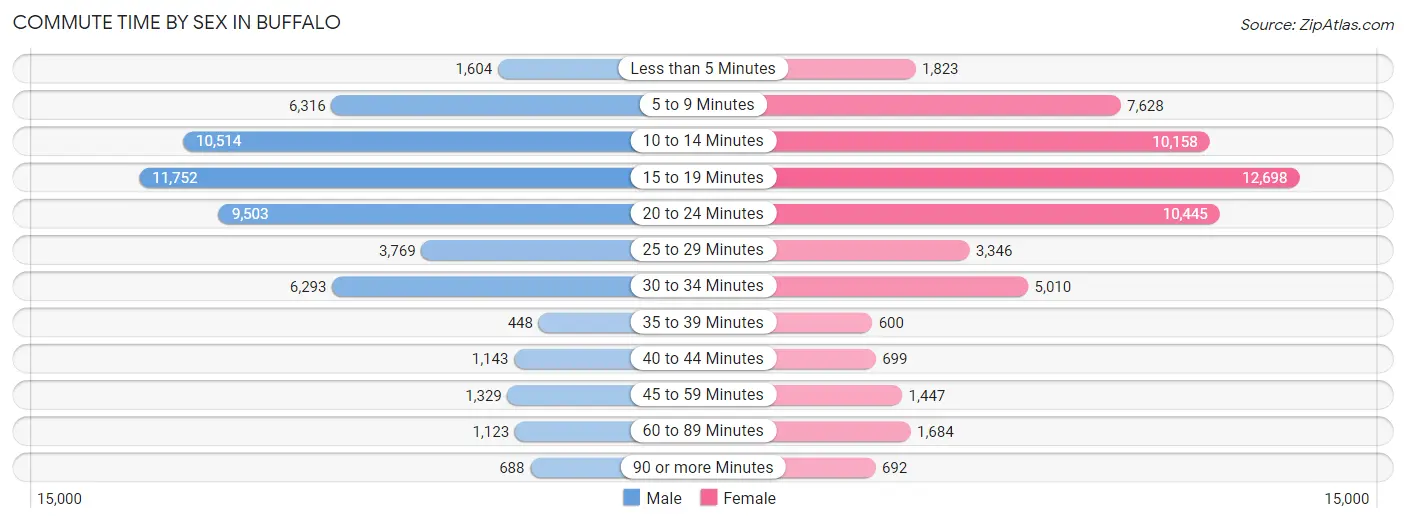
| Commute Time | Male | Female |
| Less than 5 Minutes | 1,604 (2.9%) | 1,823 (3.2%) |
| 5 to 9 Minutes | 6,316 (11.6%) | 7,628 (13.6%) |
| 10 to 14 Minutes | 10,514 (19.3%) | 10,158 (18.1%) |
| 15 to 19 Minutes | 11,752 (21.6%) | 12,698 (22.6%) |
| 20 to 24 Minutes | 9,503 (17.4%) | 10,445 (18.6%) |
| 25 to 29 Minutes | 3,769 (6.9%) | 3,346 (5.9%) |
| 30 to 34 Minutes | 6,293 (11.6%) | 5,010 (8.9%) |
| 35 to 39 Minutes | 448 (0.8%) | 600 (1.1%) |
| 40 to 44 Minutes | 1,143 (2.1%) | 699 (1.2%) |
| 45 to 59 Minutes | 1,329 (2.4%) | 1,447 (2.6%) |
| 60 to 89 Minutes | 1,123 (2.1%) | 1,684 (3.0%) |
| 90 or more Minutes | 688 (1.3%) | 692 (1.2%) |
Time of Departure to Work by Sex in Buffalo
The most frequent times of departure to work in Buffalo are 7:30 AM to 7:59 AM (6,635, 12.2%) for males and 7:30 AM to 7:59 AM (8,206, 14.6%) for females.
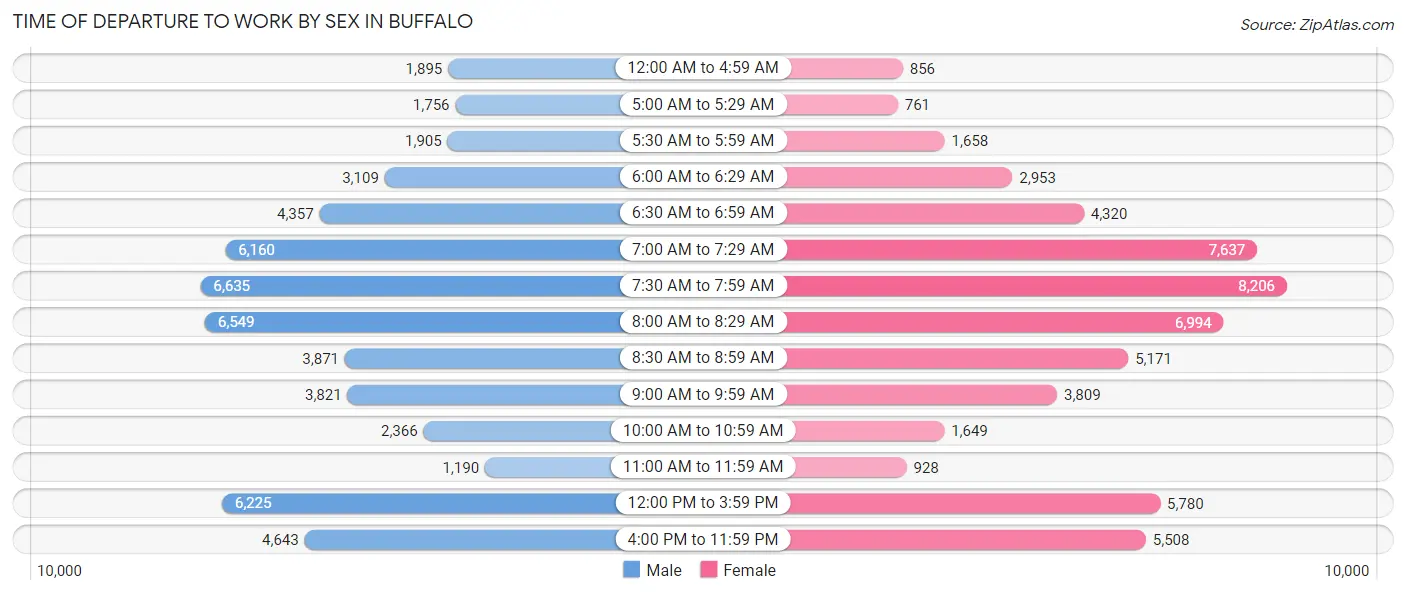
| Time of Departure | Male | Female |
| 12:00 AM to 4:59 AM | 1,895 (3.5%) | 856 (1.5%) |
| 5:00 AM to 5:29 AM | 1,756 (3.2%) | 761 (1.3%) |
| 5:30 AM to 5:59 AM | 1,905 (3.5%) | 1,658 (2.9%) |
| 6:00 AM to 6:29 AM | 3,109 (5.7%) | 2,953 (5.2%) |
| 6:30 AM to 6:59 AM | 4,357 (8.0%) | 4,320 (7.7%) |
| 7:00 AM to 7:29 AM | 6,160 (11.3%) | 7,637 (13.6%) |
| 7:30 AM to 7:59 AM | 6,635 (12.2%) | 8,206 (14.6%) |
| 8:00 AM to 8:29 AM | 6,549 (12.0%) | 6,994 (12.4%) |
| 8:30 AM to 8:59 AM | 3,871 (7.1%) | 5,171 (9.2%) |
| 9:00 AM to 9:59 AM | 3,821 (7.0%) | 3,809 (6.8%) |
| 10:00 AM to 10:59 AM | 2,366 (4.3%) | 1,649 (2.9%) |
| 11:00 AM to 11:59 AM | 1,190 (2.2%) | 928 (1.7%) |
| 12:00 PM to 3:59 PM | 6,225 (11.4%) | 5,780 (10.3%) |
| 4:00 PM to 11:59 PM | 4,643 (8.5%) | 5,508 (9.8%) |
| Total | 54,482 (100.0%) | 56,230 (100.0%) |
Housing Occupancy in Buffalo
Occupancy by Ownership in Buffalo
Of the total 118,897 dwellings in Buffalo, owner-occupied units account for 50,693 (42.6%), while renter-occupied units make up 68,204 (57.4%).
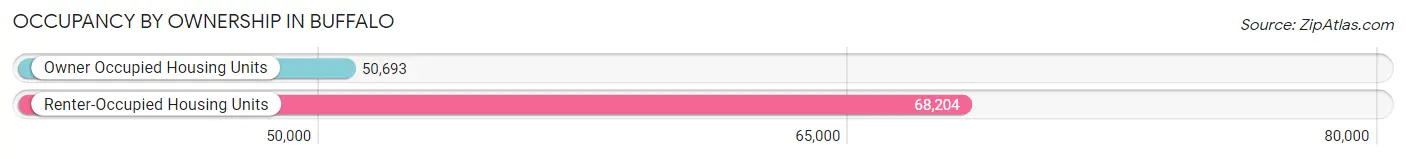
| Occupancy | # Housing Units | % Housing Units |
| Owner Occupied Housing Units | 50,693 | 42.6% |
| Renter-Occupied Housing Units | 68,204 | 57.4% |
| Total Occupied Housing Units | 118,897 | 100.0% |
Occupancy by Household Size in Buffalo
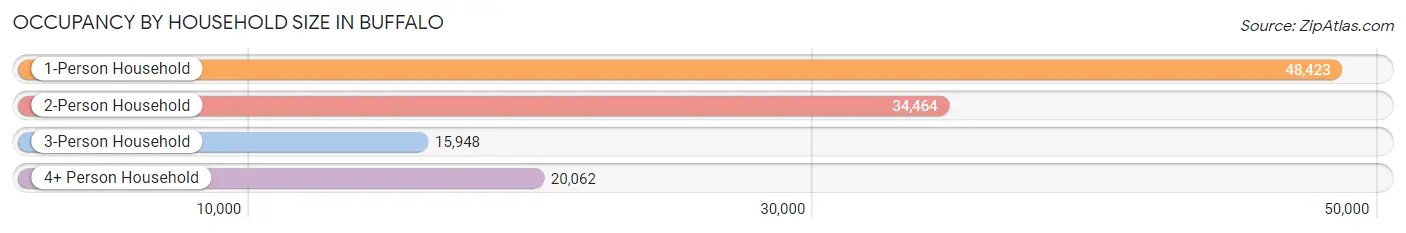
| Household Size | # Housing Units | % Housing Units |
| 1-Person Household | 48,423 | 40.7% |
| 2-Person Household | 34,464 | 29.0% |
| 3-Person Household | 15,948 | 13.4% |
| 4+ Person Household | 20,062 | 16.9% |
| Total Housing Units | 118,897 | 100.0% |
Occupancy by Ownership by Household Size in Buffalo
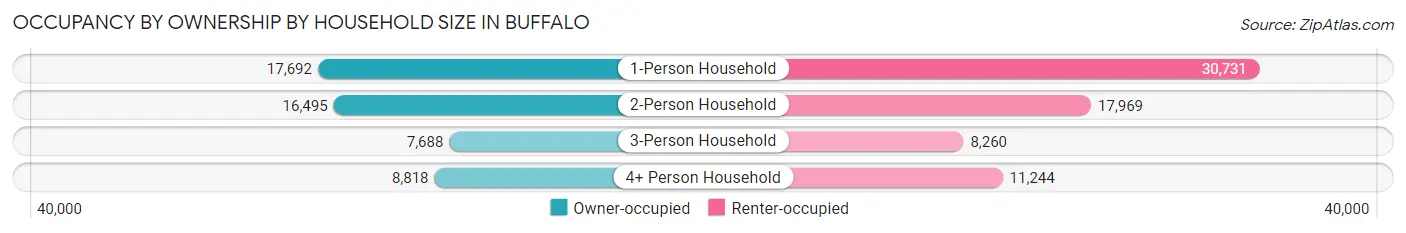
| Household Size | Owner-occupied | Renter-occupied |
| 1-Person Household | 17,692 (36.5%) | 30,731 (63.5%) |
| 2-Person Household | 16,495 (47.9%) | 17,969 (52.1%) |
| 3-Person Household | 7,688 (48.2%) | 8,260 (51.8%) |
| 4+ Person Household | 8,818 (44.0%) | 11,244 (56.0%) |
| Total Housing Units | 50,693 (42.6%) | 68,204 (57.4%) |
Occupancy by Educational Attainment in Buffalo
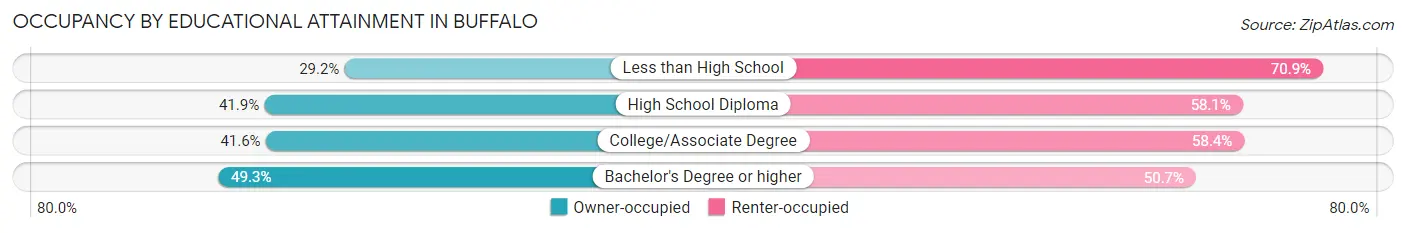
| Household Size | Owner-occupied | Renter-occupied |
| Less than High School | 4,037 (29.1%) | 9,810 (70.9%) |
| High School Diploma | 12,843 (41.9%) | 17,828 (58.1%) |
| College/Associate Degree | 15,520 (41.6%) | 21,751 (58.4%) |
| Bachelor's Degree or higher | 18,293 (49.3%) | 18,815 (50.7%) |
Occupancy by Age of Householder in Buffalo
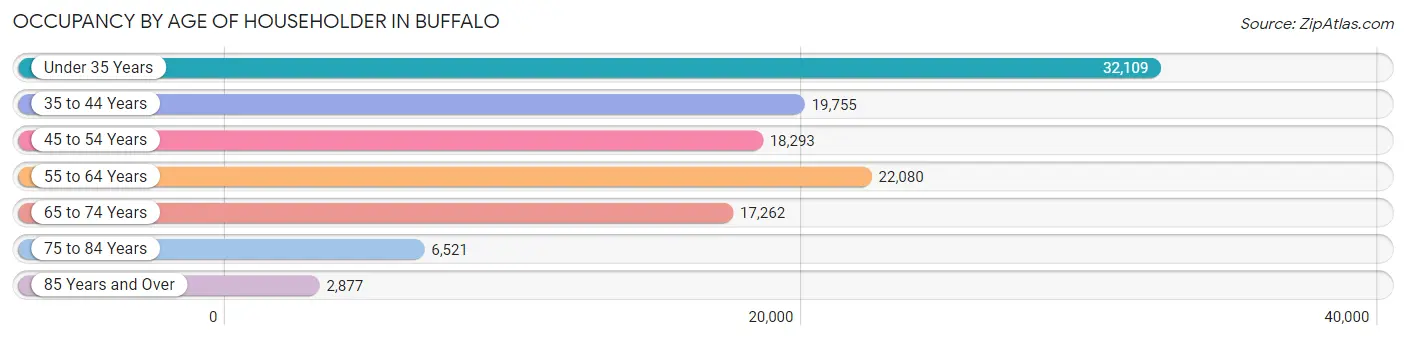
| Age Bracket | # Households | % Households |
| Under 35 Years | 32,109 | 27.0% |
| 35 to 44 Years | 19,755 | 16.6% |
| 45 to 54 Years | 18,293 | 15.4% |
| 55 to 64 Years | 22,080 | 18.6% |
| 65 to 74 Years | 17,262 | 14.5% |
| 75 to 84 Years | 6,521 | 5.5% |
| 85 Years and Over | 2,877 | 2.4% |
| Total | 118,897 | 100.0% |
Housing Finances in Buffalo
Median Income by Occupancy in Buffalo
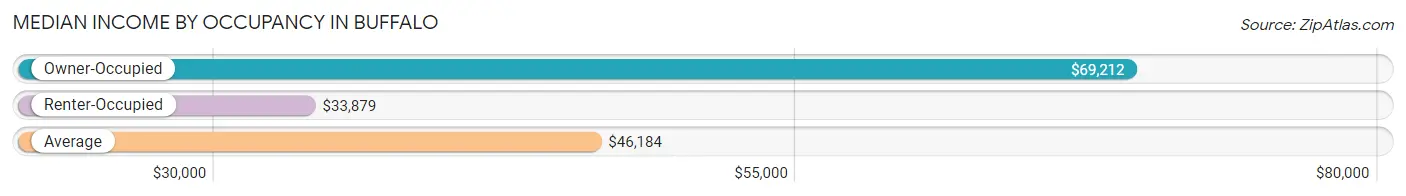
| Occupancy Type | # Households | Median Income |
| Owner-Occupied | 50,693 (42.6%) | $69,212 |
| Renter-Occupied | 68,204 (57.4%) | $33,879 |
| Average | 118,897 (100.0%) | $46,184 |
Occupancy by Householder Income Bracket in Buffalo
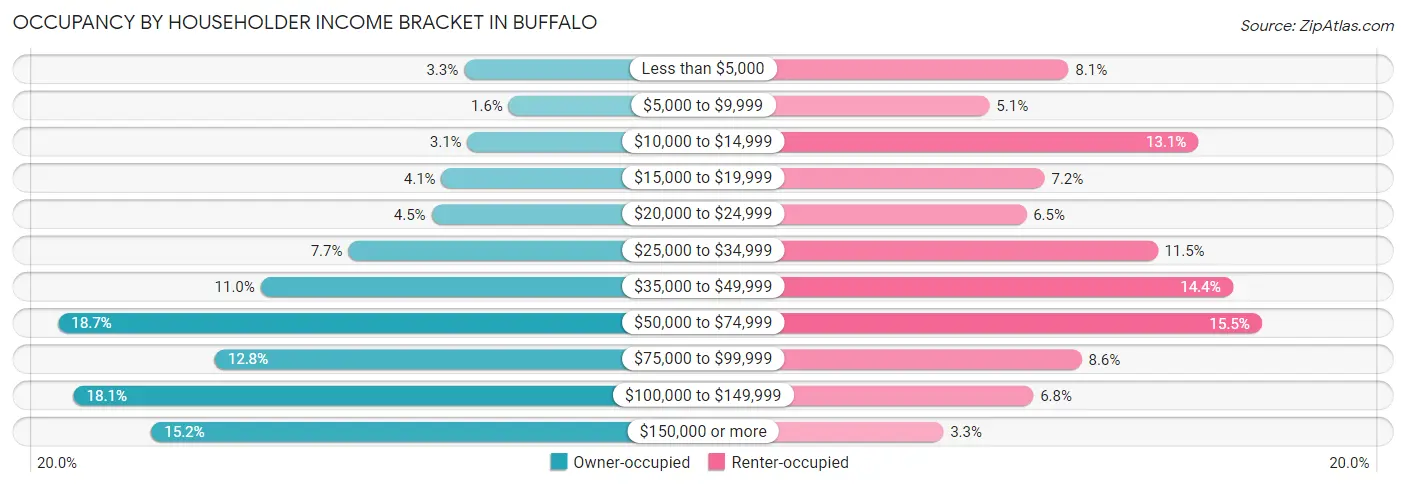
| Income Bracket | Owner-occupied | Renter-occupied |
| Less than $5,000 | 1,655 (3.3%) | 5,529 (8.1%) |
| $5,000 to $9,999 | 790 (1.6%) | 3,476 (5.1%) |
| $10,000 to $14,999 | 1,587 (3.1%) | 8,898 (13.1%) |
| $15,000 to $19,999 | 2,089 (4.1%) | 4,910 (7.2%) |
| $20,000 to $24,999 | 2,279 (4.5%) | 4,434 (6.5%) |
| $25,000 to $34,999 | 3,888 (7.7%) | 7,845 (11.5%) |
| $35,000 to $49,999 | 5,579 (11.0%) | 9,795 (14.4%) |
| $50,000 to $74,999 | 9,484 (18.7%) | 10,550 (15.5%) |
| $75,000 to $99,999 | 6,463 (12.8%) | 5,875 (8.6%) |
| $100,000 to $149,999 | 9,190 (18.1%) | 4,617 (6.8%) |
| $150,000 or more | 7,689 (15.2%) | 2,275 (3.3%) |
| Total | 50,693 (100.0%) | 68,204 (100.0%) |
Monthly Housing Cost Tiers in Buffalo
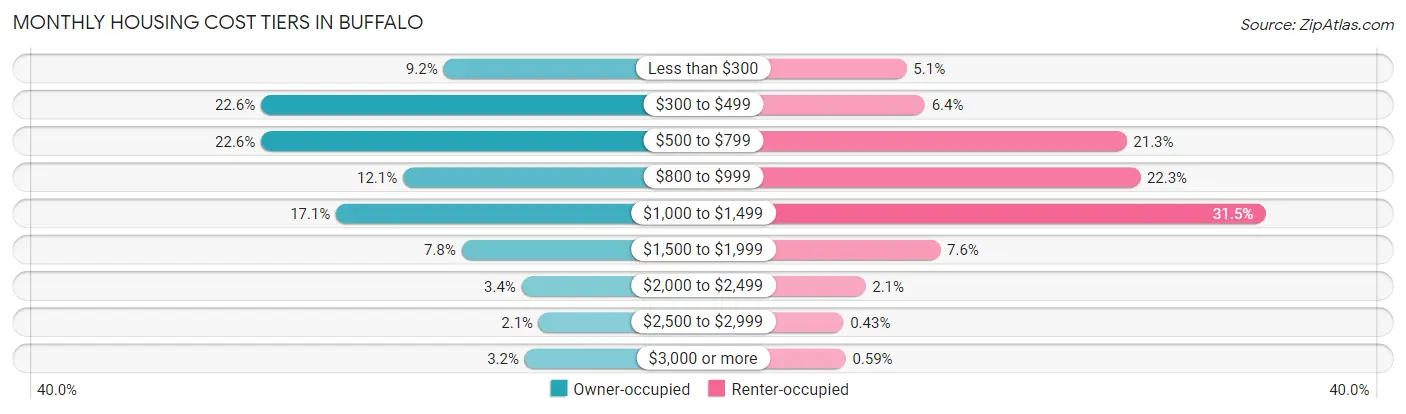
| Monthly Cost | Owner-occupied | Renter-occupied |
| Less than $300 | 4,638 (9.1%) | 3,463 (5.1%) |
| $300 to $499 | 11,452 (22.6%) | 4,385 (6.4%) |
| $500 to $799 | 11,449 (22.6%) | 14,516 (21.3%) |
| $800 to $999 | 6,148 (12.1%) | 15,194 (22.3%) |
| $1,000 to $1,499 | 8,645 (17.1%) | 21,481 (31.5%) |
| $1,500 to $1,999 | 3,964 (7.8%) | 5,154 (7.6%) |
| $2,000 to $2,499 | 1,721 (3.4%) | 1,400 (2.1%) |
| $2,500 to $2,999 | 1,075 (2.1%) | 294 (0.4%) |
| $3,000 or more | 1,601 (3.2%) | 400 (0.6%) |
| Total | 50,693 (100.0%) | 68,204 (100.0%) |
Physical Housing Characteristics in Buffalo
Housing Structures in Buffalo
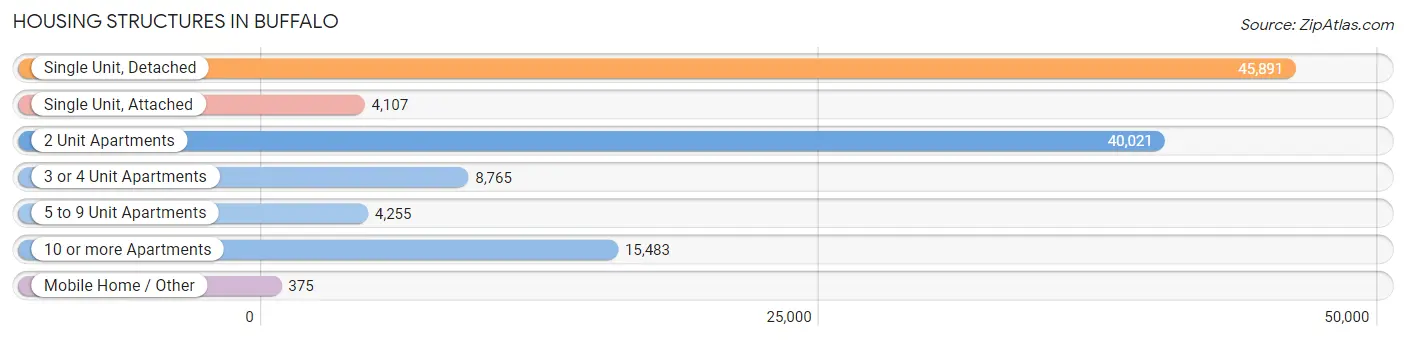
| Structure Type | # Housing Units | % Housing Units |
| Single Unit, Detached | 45,891 | 38.6% |
| Single Unit, Attached | 4,107 | 3.5% |
| 2 Unit Apartments | 40,021 | 33.7% |
| 3 or 4 Unit Apartments | 8,765 | 7.4% |
| 5 to 9 Unit Apartments | 4,255 | 3.6% |
| 10 or more Apartments | 15,483 | 13.0% |
| Mobile Home / Other | 375 | 0.3% |
| Total | 118,897 | 100.0% |
Housing Structures by Occupancy in Buffalo
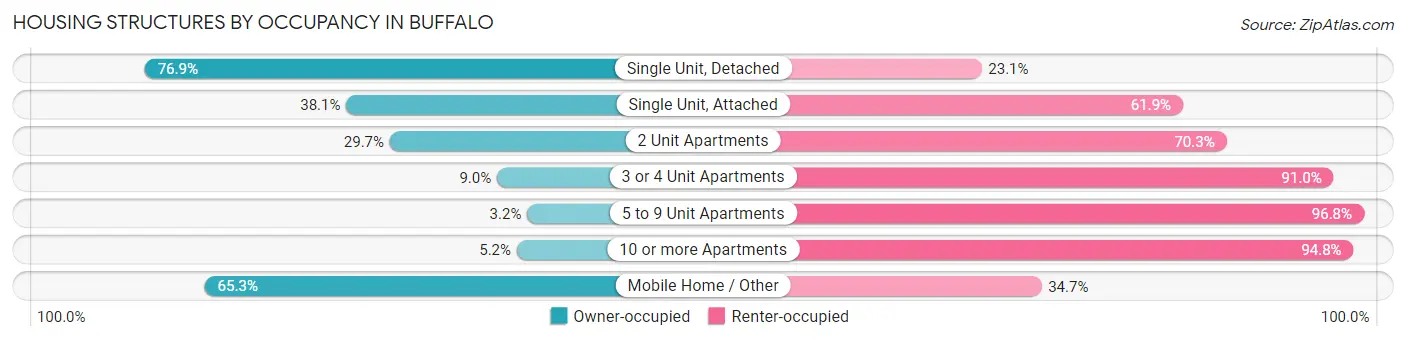
| Structure Type | Owner-occupied | Renter-occupied |
| Single Unit, Detached | 35,274 (76.9%) | 10,617 (23.1%) |
| Single Unit, Attached | 1,563 (38.1%) | 2,544 (61.9%) |
| 2 Unit Apartments | 11,874 (29.7%) | 28,147 (70.3%) |
| 3 or 4 Unit Apartments | 792 (9.0%) | 7,973 (91.0%) |
| 5 to 9 Unit Apartments | 137 (3.2%) | 4,118 (96.8%) |
| 10 or more Apartments | 808 (5.2%) | 14,675 (94.8%) |
| Mobile Home / Other | 245 (65.3%) | 130 (34.7%) |
| Total | 50,693 (42.6%) | 68,204 (57.4%) |
Housing Structures by Number of Rooms in Buffalo
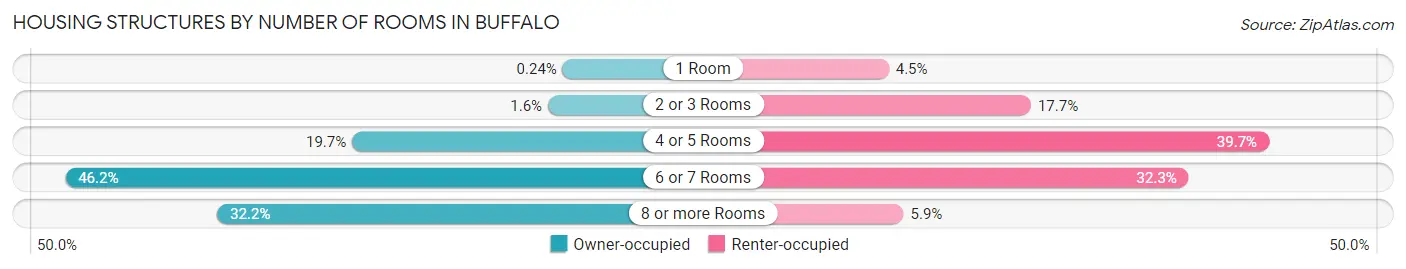
| Number of Rooms | Owner-occupied | Renter-occupied |
| 1 Room | 122 (0.2%) | 3,084 (4.5%) |
| 2 or 3 Rooms | 813 (1.6%) | 12,051 (17.7%) |
| 4 or 5 Rooms | 9,995 (19.7%) | 27,058 (39.7%) |
| 6 or 7 Rooms | 23,442 (46.2%) | 21,996 (32.3%) |
| 8 or more Rooms | 16,321 (32.2%) | 4,015 (5.9%) |
| Total | 50,693 (100.0%) | 68,204 (100.0%) |
Housing Structure by Heating Type in Buffalo
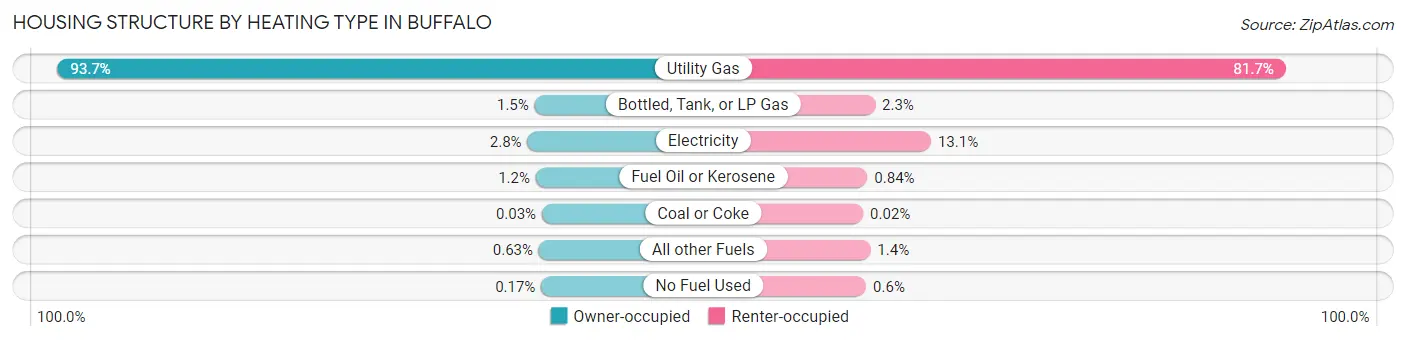
| Heating Type | Owner-occupied | Renter-occupied |
| Utility Gas | 47,475 (93.6%) | 55,694 (81.7%) |
| Bottled, Tank, or LP Gas | 737 (1.5%) | 1,592 (2.3%) |
| Electricity | 1,441 (2.8%) | 8,955 (13.1%) |
| Fuel Oil or Kerosene | 620 (1.2%) | 574 (0.8%) |
| Coal or Coke | 16 (0.0%) | 12 (0.0%) |
| All other Fuels | 317 (0.6%) | 967 (1.4%) |
| No Fuel Used | 87 (0.2%) | 410 (0.6%) |
| Total | 50,693 (100.0%) | 68,204 (100.0%) |
Household Vehicle Usage in Buffalo
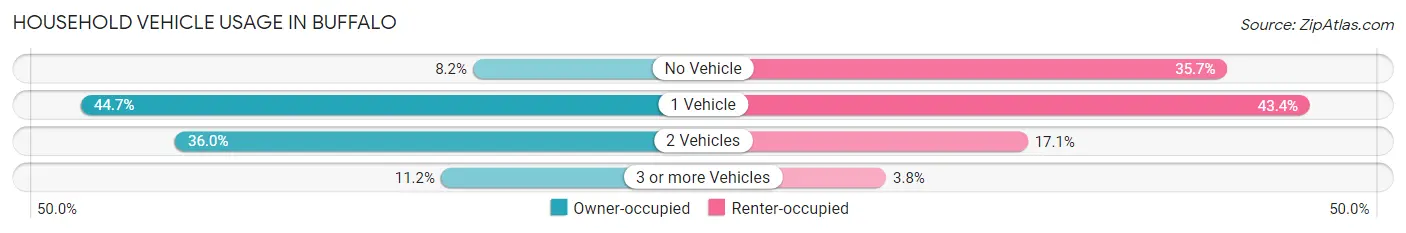
| Vehicles per Household | Owner-occupied | Renter-occupied |
| No Vehicle | 4,139 (8.2%) | 24,345 (35.7%) |
| 1 Vehicle | 22,674 (44.7%) | 29,599 (43.4%) |
| 2 Vehicles | 18,226 (35.9%) | 11,638 (17.1%) |
| 3 or more Vehicles | 5,654 (11.2%) | 2,622 (3.8%) |
| Total | 50,693 (100.0%) | 68,204 (100.0%) |
Real Estate & Mortgages in Buffalo
Real Estate and Mortgage Overview in Buffalo
| Characteristic | Without Mortgage | With Mortgage |
| Housing Units | 24,567 | 26,126 |
| Median Property Value | $104,600 | $167,800 |
| Median Household Income | $54,908 | $5,430 |
| Monthly Housing Costs | $444 | $1,516 |
| Real Estate Taxes | $1,267 | $742 |
Property Value by Mortgage Status in Buffalo
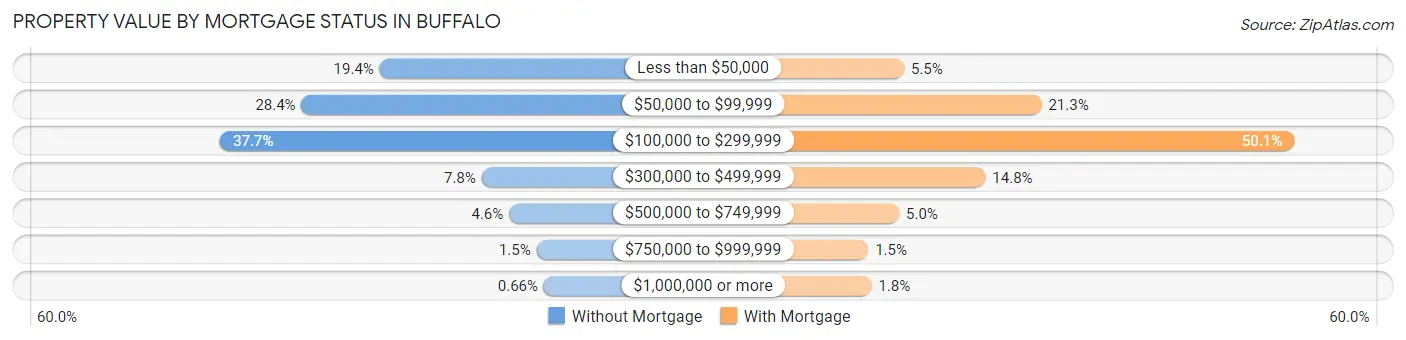
| Property Value | Without Mortgage | With Mortgage |
| Less than $50,000 | 4,771 (19.4%) | 1,448 (5.5%) |
| $50,000 to $99,999 | 6,968 (28.4%) | 5,553 (21.2%) |
| $100,000 to $299,999 | 9,253 (37.7%) | 13,095 (50.1%) |
| $300,000 to $499,999 | 1,910 (7.8%) | 3,876 (14.8%) |
| $500,000 to $749,999 | 1,138 (4.6%) | 1,300 (5.0%) |
| $750,000 to $999,999 | 365 (1.5%) | 378 (1.5%) |
| $1,000,000 or more | 162 (0.7%) | 476 (1.8%) |
| Total | 24,567 (100.0%) | 26,126 (100.0%) |
Household Income by Mortgage Status in Buffalo
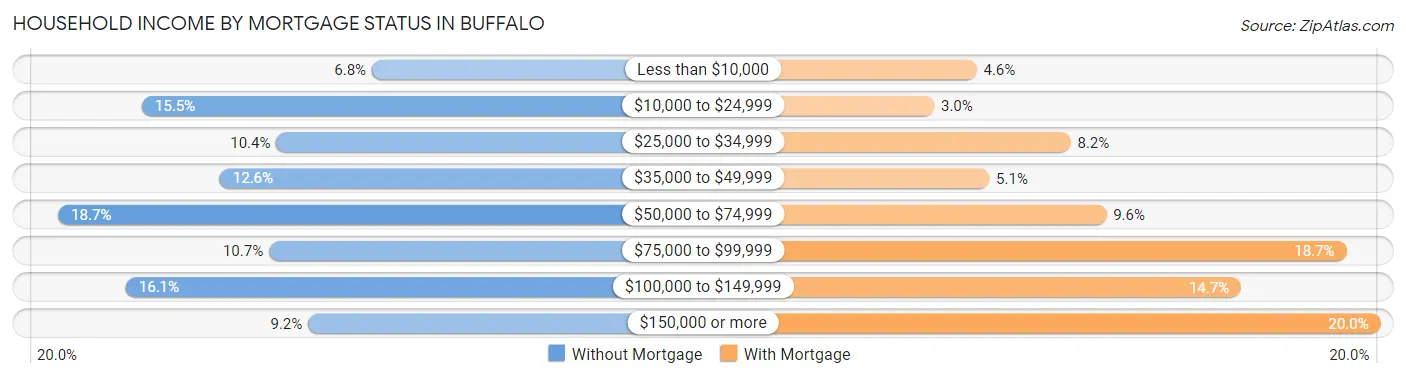
| Household Income | Without Mortgage | With Mortgage |
| Less than $10,000 | 1,663 (6.8%) | 1,204 (4.6%) |
| $10,000 to $24,999 | 3,816 (15.5%) | 782 (3.0%) |
| $25,000 to $34,999 | 2,557 (10.4%) | 2,139 (8.2%) |
| $35,000 to $49,999 | 3,085 (12.6%) | 1,331 (5.1%) |
| $50,000 to $74,999 | 4,598 (18.7%) | 2,494 (9.6%) |
| $75,000 to $99,999 | 2,625 (10.7%) | 4,886 (18.7%) |
| $100,000 to $149,999 | 3,964 (16.1%) | 3,838 (14.7%) |
| $150,000 or more | 2,259 (9.2%) | 5,226 (20.0%) |
| Total | 24,567 (100.0%) | 26,126 (100.0%) |
Property Value to Household Income Ratio in Buffalo
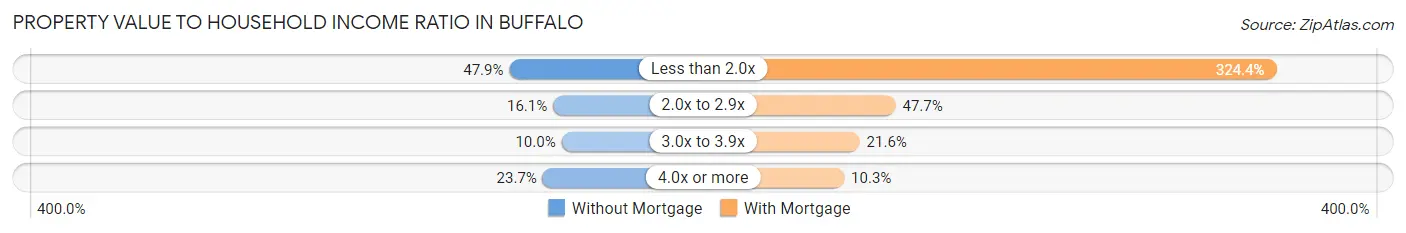
| Value-to-Income Ratio | Without Mortgage | With Mortgage |
| Less than 2.0x | 11,764 (47.9%) | 84,741 (324.4%) |
| 2.0x to 2.9x | 3,957 (16.1%) | 12,458 (47.7%) |
| 3.0x to 3.9x | 2,452 (10.0%) | 5,645 (21.6%) |
| 4.0x or more | 5,817 (23.7%) | 2,699 (10.3%) |
| Total | 24,567 (100.0%) | 26,126 (100.0%) |
Real Estate Taxes by Mortgage Status in Buffalo
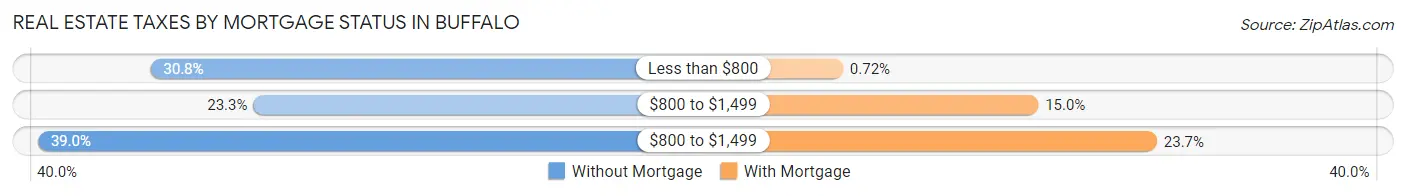
| Property Taxes | Without Mortgage | With Mortgage |
| Less than $800 | 7,568 (30.8%) | 187 (0.7%) |
| $800 to $1,499 | 5,721 (23.3%) | 3,915 (15.0%) |
| $800 to $1,499 | 9,592 (39.0%) | 6,182 (23.7%) |
| Total | 24,567 (100.0%) | 26,126 (100.0%) |
Health & Disability in Buffalo
Health Insurance Coverage by Age in Buffalo
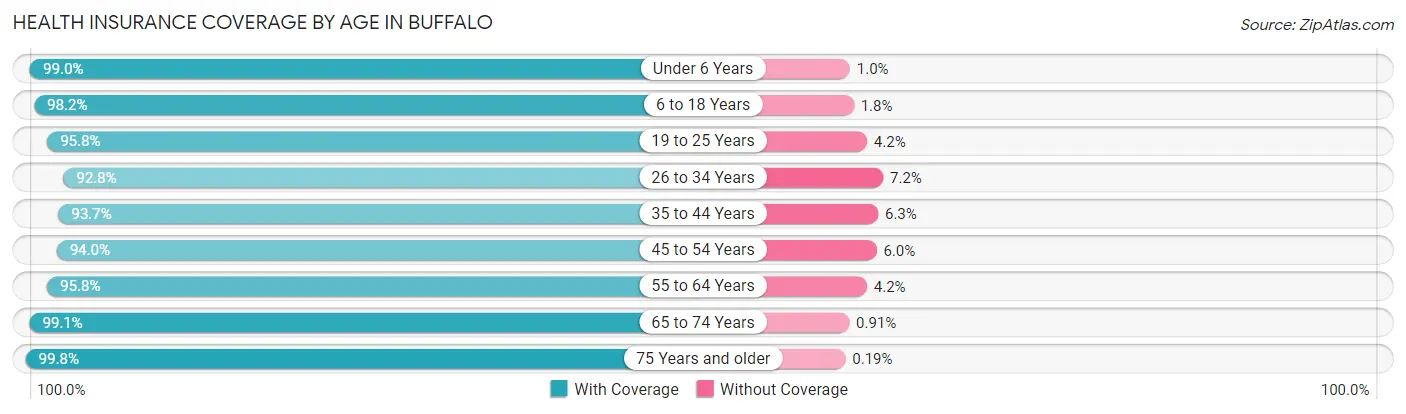
| Age Bracket | With Coverage | Without Coverage |
| Under 6 Years | 20,866 (99.0%) | 219 (1.0%) |
| 6 to 18 Years | 44,114 (98.2%) | 792 (1.8%) |
| 19 to 25 Years | 31,457 (95.8%) | 1,385 (4.2%) |
| 26 to 34 Years | 40,198 (92.8%) | 3,136 (7.2%) |
| 35 to 44 Years | 31,744 (93.7%) | 2,131 (6.3%) |
| 45 to 54 Years | 27,473 (94.0%) | 1,754 (6.0%) |
| 55 to 64 Years | 31,866 (95.8%) | 1,396 (4.2%) |
| 65 to 74 Years | 23,106 (99.1%) | 213 (0.9%) |
| 75 Years and older | 12,985 (99.8%) | 25 (0.2%) |
| Total | 263,809 (96.0%) | 11,051 (4.0%) |
Health Insurance Coverage by Citizenship Status in Buffalo
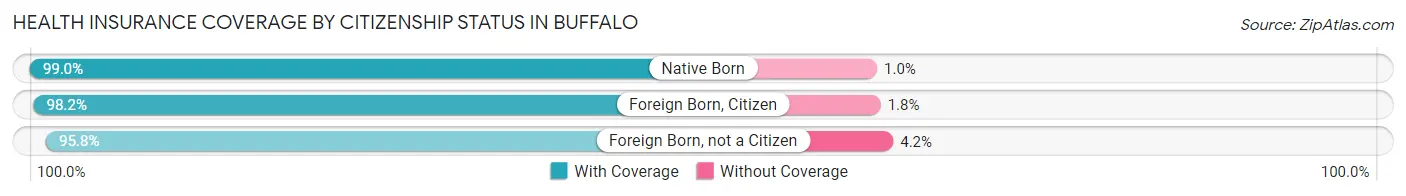
| Citizenship Status | With Coverage | Without Coverage |
| Native Born | 20,866 (99.0%) | 219 (1.0%) |
| Foreign Born, Citizen | 44,114 (98.2%) | 792 (1.8%) |
| Foreign Born, not a Citizen | 31,457 (95.8%) | 1,385 (4.2%) |
Health Insurance Coverage by Household Income in Buffalo
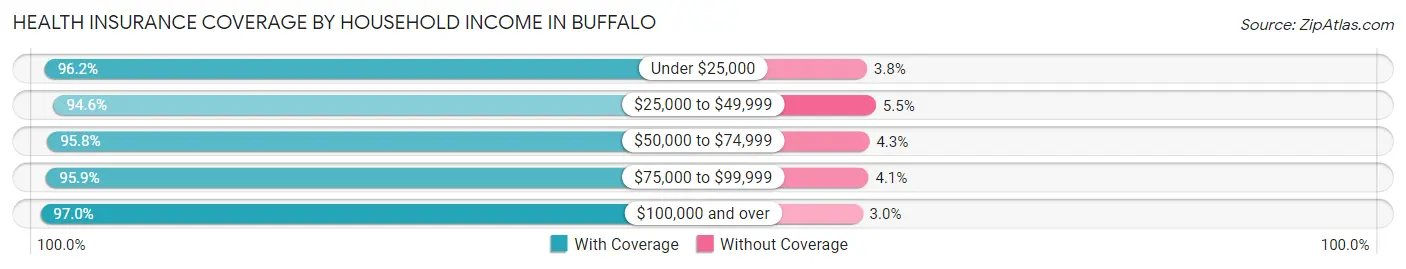
| Household Income | With Coverage | Without Coverage |
| Under $25,000 | 61,977 (96.2%) | 2,431 (3.8%) |
| $25,000 to $49,999 | 57,836 (94.6%) | 3,334 (5.4%) |
| $50,000 to $74,999 | 42,284 (95.8%) | 1,878 (4.3%) |
| $75,000 to $99,999 | 29,213 (95.9%) | 1,241 (4.1%) |
| $100,000 and over | 65,690 (97.0%) | 2,012 (3.0%) |
Public vs Private Health Insurance Coverage by Age in Buffalo
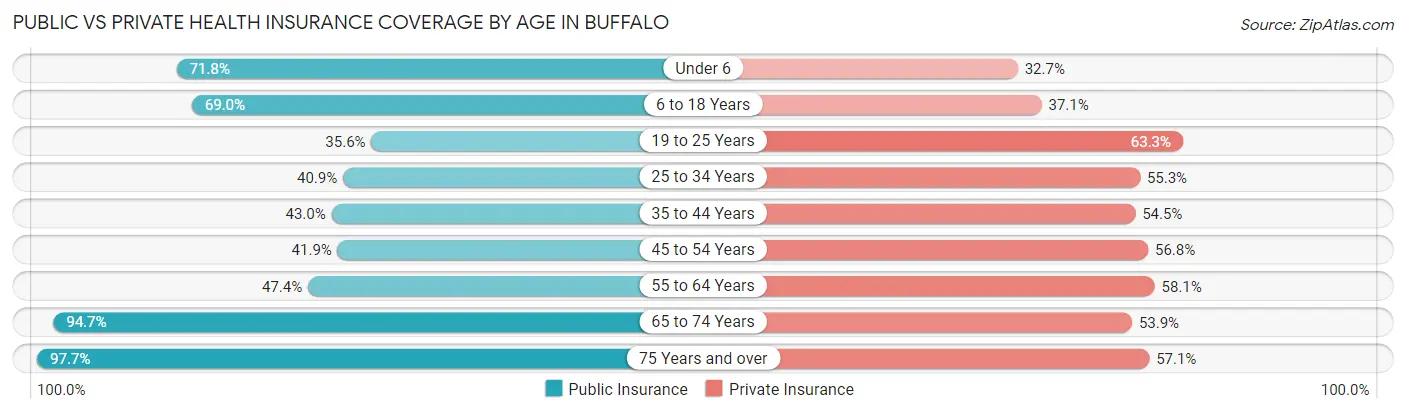
| Age Bracket | Public Insurance | Private Insurance |
| Under 6 | 15,139 (71.8%) | 6,886 (32.7%) |
| 6 to 18 Years | 30,965 (69.0%) | 16,645 (37.1%) |
| 19 to 25 Years | 11,700 (35.6%) | 20,788 (63.3%) |
| 25 to 34 Years | 17,724 (40.9%) | 23,982 (55.3%) |
| 35 to 44 Years | 14,573 (43.0%) | 18,449 (54.5%) |
| 45 to 54 Years | 12,242 (41.9%) | 16,612 (56.8%) |
| 55 to 64 Years | 15,763 (47.4%) | 19,311 (58.1%) |
| 65 to 74 Years | 22,073 (94.7%) | 12,560 (53.9%) |
| 75 Years and over | 12,707 (97.7%) | 7,423 (57.1%) |
| Total | 152,886 (55.6%) | 142,656 (51.9%) |
Disability Status by Sex by Age in Buffalo
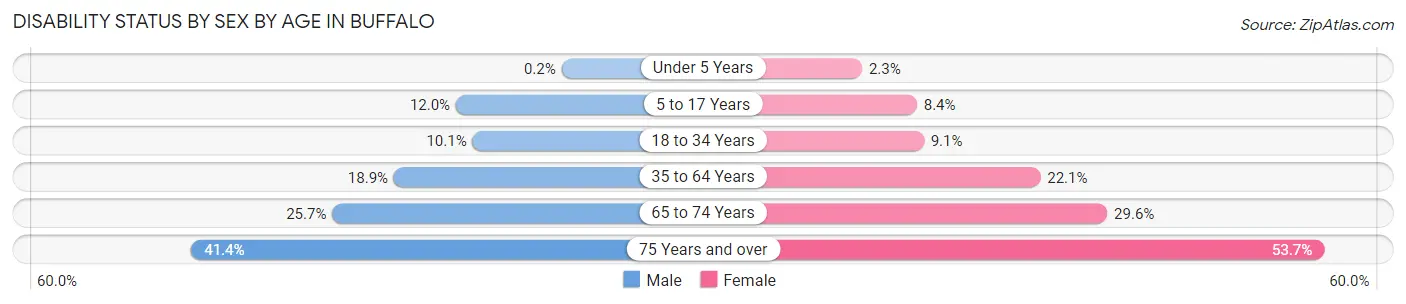
| Age Bracket | Male | Female |
| Under 5 Years | 18 (0.2%) | 197 (2.2%) |
| 5 to 17 Years | 2,695 (12.0%) | 1,807 (8.4%) |
| 18 to 34 Years | 3,950 (10.1%) | 3,770 (9.1%) |
| 35 to 64 Years | 8,748 (18.9%) | 11,054 (22.1%) |
| 65 to 74 Years | 2,711 (25.7%) | 3,778 (29.5%) |
| 75 Years and over | 2,063 (41.4%) | 4,313 (53.7%) |
Disability Class by Sex by Age in Buffalo
Disability Class: Hearing Difficulty
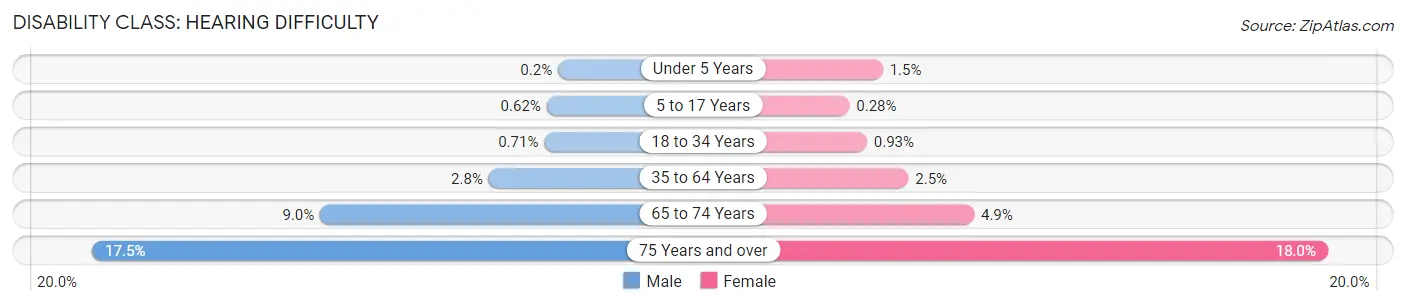
| Age Bracket | Male | Female |
| Under 5 Years | 18 (0.2%) | 133 (1.5%) |
| 5 to 17 Years | 140 (0.6%) | 60 (0.3%) |
| 18 to 34 Years | 276 (0.7%) | 384 (0.9%) |
| 35 to 64 Years | 1,286 (2.8%) | 1,233 (2.5%) |
| 65 to 74 Years | 951 (9.0%) | 628 (4.9%) |
| 75 Years and over | 871 (17.5%) | 1,449 (18.0%) |
Disability Class: Vision Difficulty
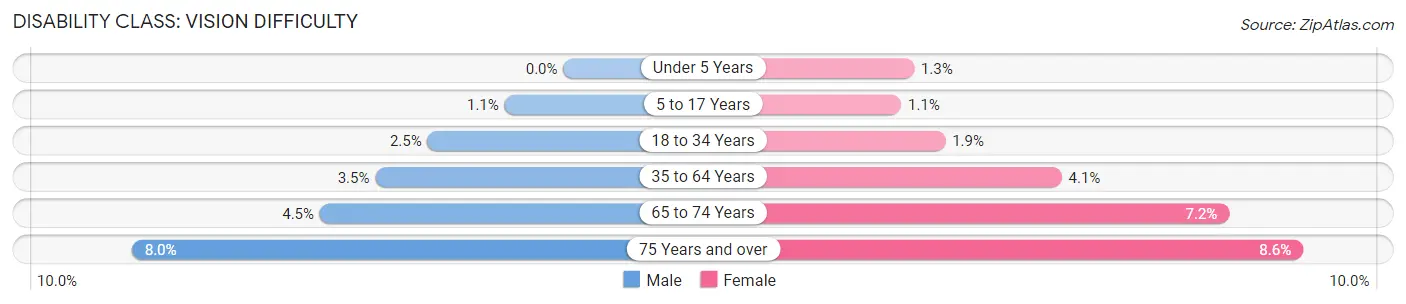
| Age Bracket | Male | Female |
| Under 5 Years | 0 (0.0%) | 117 (1.3%) |
| 5 to 17 Years | 246 (1.1%) | 238 (1.1%) |
| 18 to 34 Years | 984 (2.5%) | 793 (1.9%) |
| 35 to 64 Years | 1,619 (3.5%) | 2,041 (4.1%) |
| 65 to 74 Years | 476 (4.5%) | 919 (7.2%) |
| 75 Years and over | 399 (8.0%) | 687 (8.6%) |
Disability Class: Cognitive Difficulty
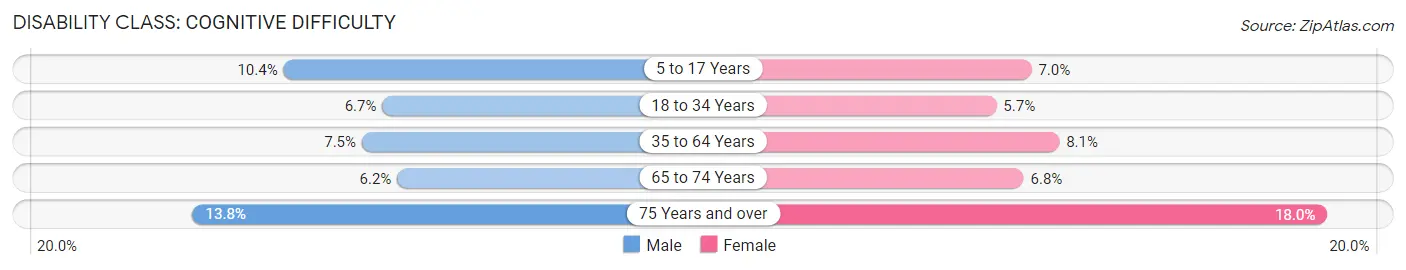
| Age Bracket | Male | Female |
| 5 to 17 Years | 2,342 (10.4%) | 1,525 (7.0%) |
| 18 to 34 Years | 2,624 (6.7%) | 2,371 (5.7%) |
| 35 to 64 Years | 3,467 (7.5%) | 4,035 (8.1%) |
| 65 to 74 Years | 650 (6.2%) | 863 (6.8%) |
| 75 Years and over | 685 (13.8%) | 1,447 (18.0%) |
Disability Class: Ambulatory Difficulty
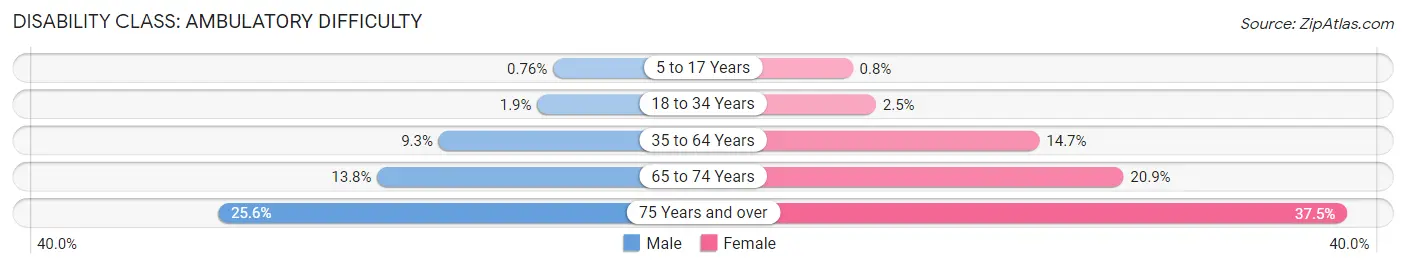
| Age Bracket | Male | Female |
| 5 to 17 Years | 171 (0.8%) | 173 (0.8%) |
| 18 to 34 Years | 753 (1.9%) | 1,047 (2.5%) |
| 35 to 64 Years | 4,286 (9.2%) | 7,334 (14.7%) |
| 65 to 74 Years | 1,455 (13.8%) | 2,674 (20.9%) |
| 75 Years and over | 1,277 (25.6%) | 3,013 (37.5%) |
Disability Class: Self-Care Difficulty
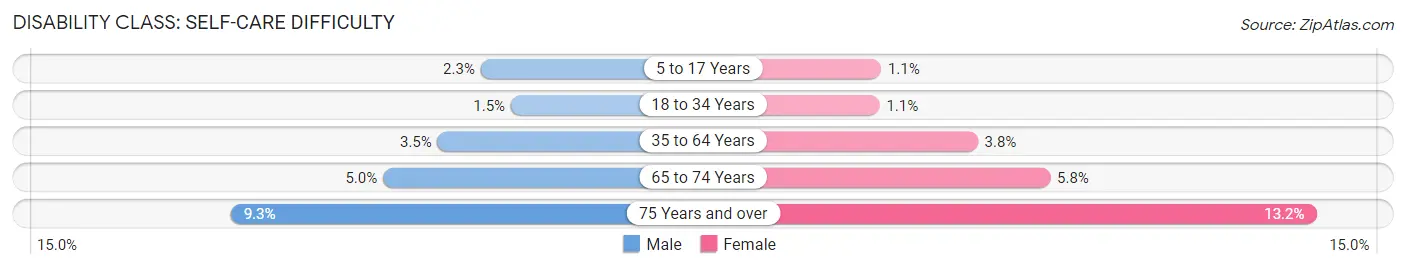
| Age Bracket | Male | Female |
| 5 to 17 Years | 518 (2.3%) | 237 (1.1%) |
| 18 to 34 Years | 572 (1.5%) | 434 (1.1%) |
| 35 to 64 Years | 1,621 (3.5%) | 1,889 (3.8%) |
| 65 to 74 Years | 529 (5.0%) | 741 (5.8%) |
| 75 Years and over | 461 (9.3%) | 1,061 (13.2%) |
Technology Access in Buffalo
Computing Device Access in Buffalo
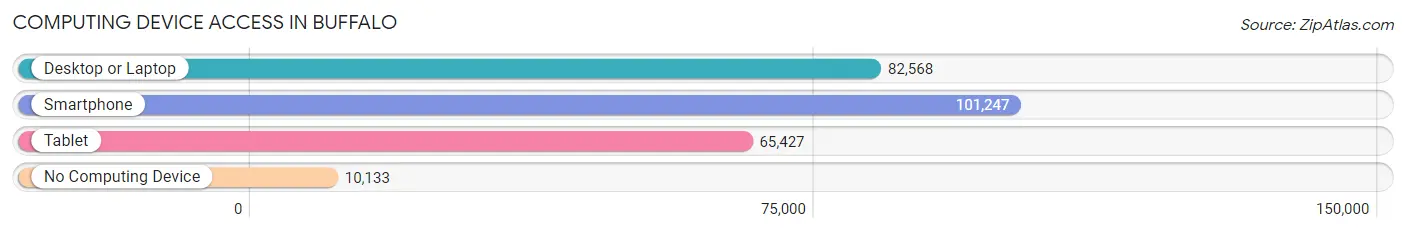
| Device Type | # Households | % Households |
| Desktop or Laptop | 82,568 | 69.4% |
| Smartphone | 101,247 | 85.2% |
| Tablet | 65,427 | 55.0% |
| No Computing Device | 10,133 | 8.5% |
| Total | 118,897 | 100.0% |
Internet Access in Buffalo
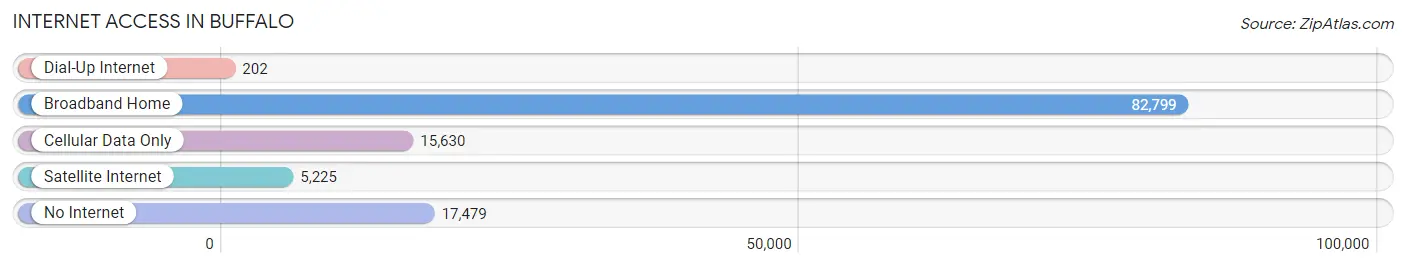
| Internet Type | # Households | % Households |
| Dial-Up Internet | 202 | 0.2% |
| Broadband Home | 82,799 | 69.6% |
| Cellular Data Only | 15,630 | 13.2% |
| Satellite Internet | 5,225 | 4.4% |
| No Internet | 17,479 | 14.7% |
| Total | 118,897 | 100.0% |
Buffalo Summary
Buffalo, New York is a city located in the western part of the state, along the eastern shore of Lake Erie. It is the second-largest city in the state, after New York City, and the county seat of Erie County. The city has a population of approximately 261,310, according to the 2010 census.
Geography
Buffalo is located in the western part of New York State, along the eastern shore of Lake Erie. It is the second-largest city in the state, after New York City, and the county seat of Erie County. The city is situated at the head of the Niagara River, which flows into Lake Erie. The city is bordered by the towns of Amherst, Cheektowaga, and Tonawanda. The city is located in a region known as the Niagara Frontier, which is characterized by its rolling hills, deep valleys, and numerous rivers and streams.
History
The area that is now Buffalo was first settled by the Seneca people in the late 17th century. The city was founded in 1801 by Joseph Ellicott, a surveyor for the Holland Land Company. The city was named after the nearby Buffalo Creek, which was named after the American bison that once roamed the area.
In the 19th century, Buffalo became an important port city, as it was located at the head of the Erie Canal. The city was also a major manufacturing center, producing steel, chemicals, and other products.
In the 20th century, Buffalo experienced a period of decline, as the city's manufacturing base declined and its population decreased. In the late 20th century, the city began to experience a resurgence, as new businesses and industries moved into the city.
Economy
Buffalo's economy is largely based on services, manufacturing, and tourism. The city is home to several major corporations, including M&T Bank, Rich Products Corporation, and Delaware North. The city is also home to several universities, including the University at Buffalo, Canisius College, and Buffalo State College.
The city is also a major tourist destination, as it is home to several attractions, including Niagara Falls, the Buffalo Zoo, and the Buffalo and Erie County Botanical Gardens.
Demographics
According to the 2010 census, Buffalo has a population of 261,310. The city is racially diverse, with the largest racial groups being White (54.2%), African American (32.2%), and Hispanic or Latino (11.2%). The city also has a large immigrant population, with the largest immigrant groups being from Mexico (7.2%), India (2.2%), and Poland (1.7%).
The median household income in Buffalo is $33,945, and the median home value is $90,000. The city has a poverty rate of 28.2%, which is higher than the national average.
Conclusion
Buffalo, New York is a city located in the western part of the state, along the eastern shore of Lake Erie. It is the second-largest city in the state, after New York City, and the county seat of Erie County. The city has a population of approximately 261,310, according to the 2010 census. Buffalo's economy is largely based on services, manufacturing, and tourism. The city is racially diverse, with the largest racial groups being White (54.2%), African American (32.2%), and Hispanic or Latino (11.2%). The city also has a large immigrant population, with the largest immigrant groups being from Mexico (7.2%), India (2.2%), and Poland (1.7%). Buffalo is a major tourist destination, as it is home to several attractions, including Niagara Falls, the Buffalo Zoo, and the Buffalo and Erie County Botanical Gardens.
Common Questions
What is the Total Population of Buffalo?
Total Population of Buffalo is 276,688.
What is the Total Male Population of Buffalo?
Total Male Population of Buffalo is 133,447.
What is the Total Female Population of Buffalo?
Total Female Population of Buffalo is 143,241.
What is the Ratio of Males per 100 Females in Buffalo?
There are 93.16 Males per 100 Females in Buffalo.
What is the Ratio of Females per 100 Males in Buffalo?
There are 107.34 Females per 100 Males in Buffalo.
What is the Median Population Age in Buffalo?
Median Population Age in Buffalo is 33.9 Years.
What is the Average Family Size in Buffalo
Average Family Size in Buffalo is 3.1 People.
What is the Average Household Size in Buffalo
Average Household Size in Buffalo is 2.2 People.
What is Per Capita Income in Buffalo?
Per Capita income in Buffalo is $29,558.
What is the Median Family Income in Buffalo?
Median Family Income in Buffalo is $57,678.
What is the Median Household income in Buffalo?
Median Household Income in Buffalo is $46,184.
What is Income or Wage Gap in Buffalo?
Income or Wage Gap in Buffalo is 8.9%.
Women in Buffalo earn 91.1 cents for every dollar earned by a man.
What is Family Income Deficit in Buffalo?
Family Income Deficit in Buffalo is $11,808.
Families that are below poverty line in Buffalo earn $11,808 less on average than the poverty threshold level.
What is Inequality or Gini Index in Buffalo?
Inequality or Gini Index in Buffalo is 0.50.
How Large is the Labor Force in Buffalo?
There are 133,294 People in the Labor Forcein in Buffalo.
What is the Percentage of People in the Labor Force in Buffalo?
60.2% of People are in the Labor Force in Buffalo.
What is the Unemployment Rate in Buffalo?
Unemployment Rate in Buffalo is 7.0%.