Great Neck, NY
Great Neck Map
Great Neck Overview
11,060
TOTAL POPULATION
5,738
MALE POPULATION
5,322
FEMALE POPULATION
107.82
MALES / 100 FEMALES
92.75
FEMALES / 100 MALES
33.4
MEDIAN AGE
3.8
AVG FAMILY SIZE
3.3
AVG HOUSEHOLD SIZE
$56,199
PER CAPITA INCOME
$129,391
AVG FAMILY INCOME
$128,457
AVG HOUSEHOLD INCOME
57.6%
WAGE / INCOME GAP [ % ]
42.4¢/ $1
WAGE / INCOME GAP [ $ ]
0.48
INEQUALITY / GINI INDEX
4,208
LABOR FORCE [ PEOPLE ]
56.7%
PERCENT IN LABOR FORCE
4.7%
UNEMPLOYMENT RATE
Great Neck Area Codes
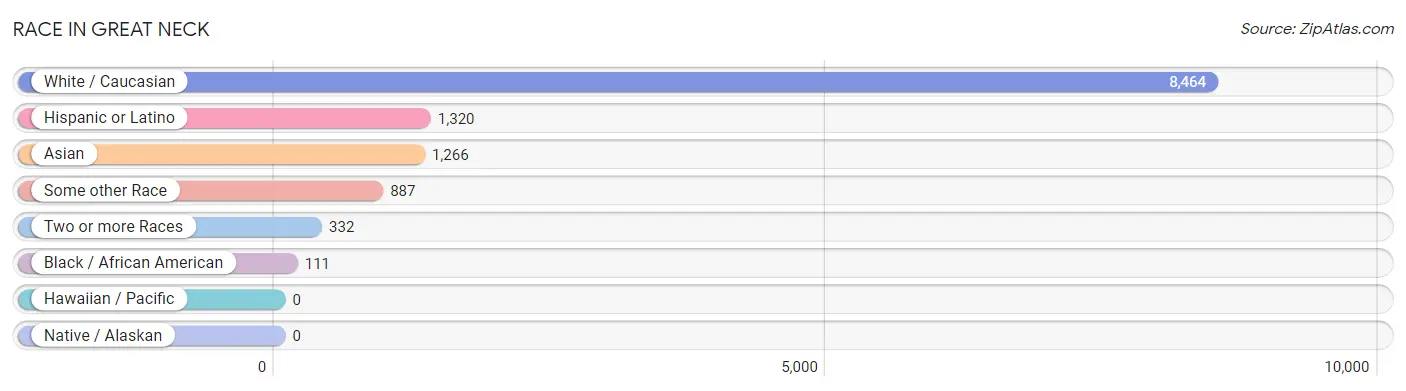
Race in Great Neck
The most populous races in Great Neck are White / Caucasian (8,464 | 76.5%), Hispanic or Latino (1,320 | 11.9%), and Asian (1,266 | 11.5%).
| Race | # Population | % Population |
| Asian | 1,266 | 11.5% |
| Black / African American | 111 | 1.0% |
| Hawaiian / Pacific | 0 | 0.0% |
| Hispanic or Latino | 1,320 | 11.9% |
| Native / Alaskan | 0 | 0.0% |
| White / Caucasian | 8,464 | 76.5% |
| Two or more Races | 332 | 3.0% |
| Some other Race | 887 | 8.0% |
| Total | 11,060 | 100.0% |
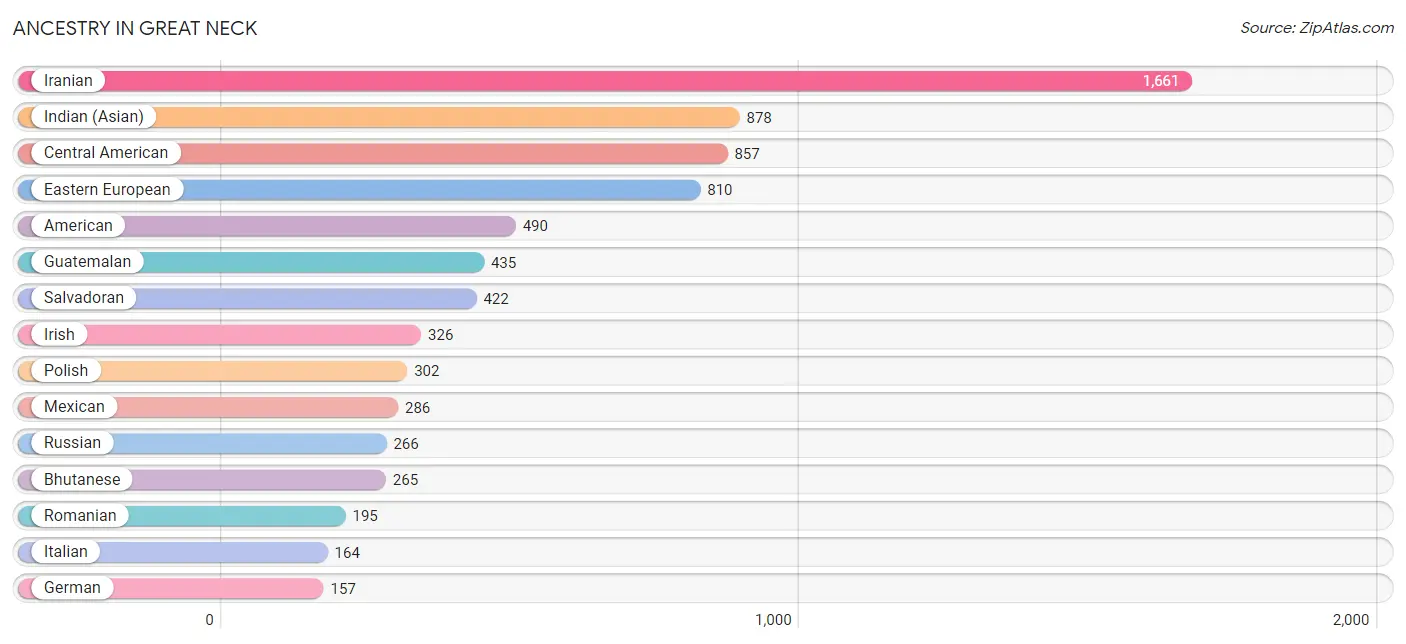
Ancestry in Great Neck
The most populous ancestries reported in Great Neck are Iranian (1,661 | 15.0%), Indian (Asian) (878 | 7.9%), Central American (857 | 7.7%), Eastern European (810 | 7.3%), and American (490 | 4.4%), together accounting for 42.5% of all Great Neck residents.
| Ancestry | # Population | % Population |
| Afghan | 8 | 0.1% |
| Albanian | 2 | 0.0% |
| American | 490 | 4.4% |
| Arab | 109 | 1.0% |
| Austrian | 36 | 0.3% |
| Bhutanese | 265 | 2.4% |
| British | 30 | 0.3% |
| Burmese | 114 | 1.0% |
| Canadian | 58 | 0.5% |
| Central American | 857 | 7.7% |
| Colombian | 35 | 0.3% |
| Czech | 65 | 0.6% |
| Eastern European | 810 | 7.3% |
| English | 82 | 0.7% |
| European | 124 | 1.1% |
| Filipino | 25 | 0.2% |
| German | 157 | 1.4% |
| Greek | 14 | 0.1% |
| Guatemalan | 435 | 3.9% |
| Hungarian | 140 | 1.3% |
| Indian (Asian) | 878 | 7.9% |
| Iranian | 1,661 | 15.0% |
| Iraqi | 71 | 0.6% |
| Irish | 326 | 2.9% |
| Israeli | 145 | 1.3% |
| Italian | 164 | 1.5% |
| Korean | 4 | 0.0% |
| Lebanese | 38 | 0.3% |
| Lithuanian | 124 | 1.1% |
| Mexican | 286 | 2.6% |
| Polish | 302 | 2.7% |
| Puerto Rican | 86 | 0.8% |
| Romanian | 195 | 1.8% |
| Russian | 266 | 2.4% |
| Salvadoran | 422 | 3.8% |
| South American | 35 | 0.3% |
| Spanish | 12 | 0.1% |
| Subsaharan African | 11 | 0.1% |
| Thai | 86 | 0.8% |
| Ukrainian | 36 | 0.3% |
| Vietnamese | 10 | 0.1% |
| Yugoslavian | 32 | 0.3% |
| Zimbabwean | 11 | 0.1% | View All 43 Rows |
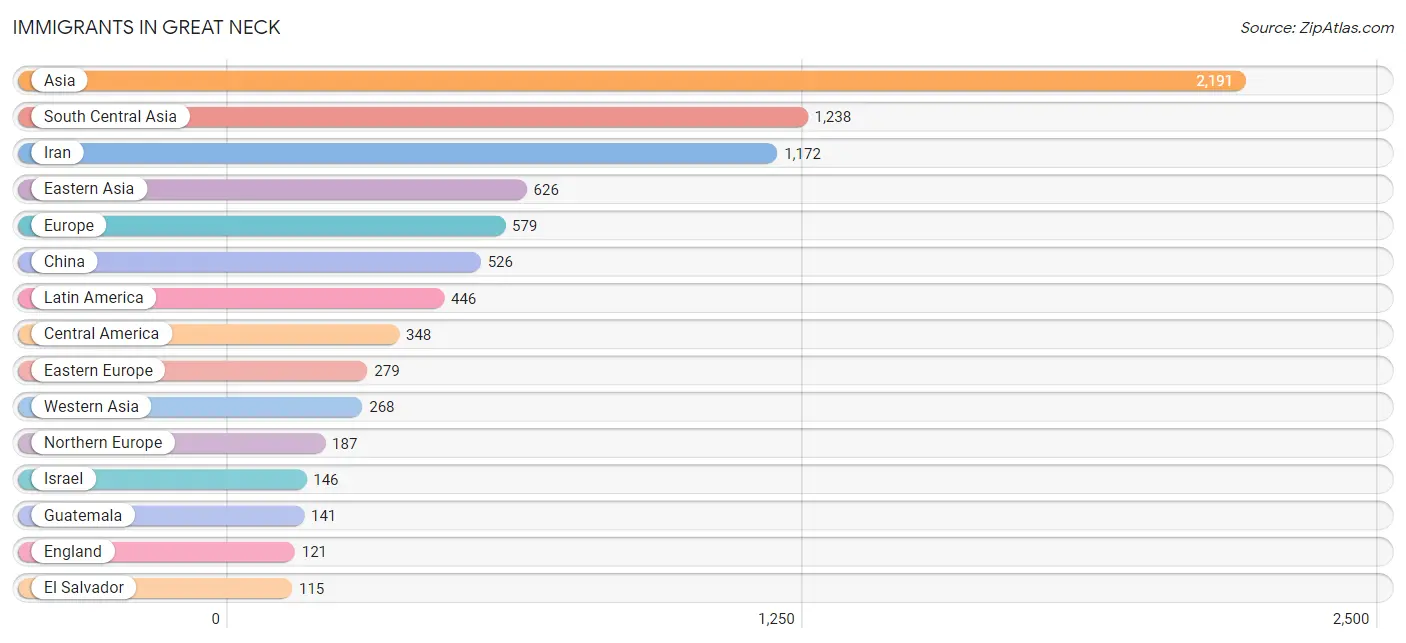
Immigrants in Great Neck
The most numerous immigrant groups reported in Great Neck came from Asia (2,191 | 19.8%), South Central Asia (1,238 | 11.2%), Iran (1,172 | 10.6%), Eastern Asia (626 | 5.7%), and Europe (579 | 5.2%), together accounting for 52.5% of all Great Neck residents.
| Immigration Origin | # Population | % Population |
| Africa | 40 | 0.4% |
| Argentina | 31 | 0.3% |
| Asia | 2,191 | 19.8% |
| Austria | 32 | 0.3% |
| Bangladesh | 1 | 0.0% |
| Belgium | 15 | 0.1% |
| Canada | 33 | 0.3% |
| Central America | 348 | 3.2% |
| China | 526 | 4.8% |
| Colombia | 35 | 0.3% |
| Czechoslovakia | 16 | 0.1% |
| Eastern Africa | 11 | 0.1% |
| Eastern Asia | 626 | 5.7% |
| Eastern Europe | 279 | 2.5% |
| Ecuador | 32 | 0.3% |
| El Salvador | 115 | 1.0% |
| England | 121 | 1.1% |
| Europe | 579 | 5.2% |
| Guatemala | 141 | 1.3% |
| Hong Kong | 49 | 0.4% |
| Hungary | 12 | 0.1% |
| India | 26 | 0.2% |
| Iran | 1,172 | 10.6% |
| Iraq | 15 | 0.1% |
| Ireland | 16 | 0.1% |
| Israel | 146 | 1.3% |
| Italy | 61 | 0.5% |
| Japan | 69 | 0.6% |
| Kazakhstan | 11 | 0.1% |
| Korea | 31 | 0.3% |
| Latin America | 446 | 4.0% |
| Lebanon | 13 | 0.1% |
| Lithuania | 12 | 0.1% |
| Mexico | 92 | 0.8% |
| Morocco | 29 | 0.3% |
| Northern Africa | 29 | 0.3% |
| Northern Europe | 187 | 1.7% |
| Poland | 64 | 0.6% |
| Romania | 97 | 0.9% |
| Russia | 78 | 0.7% |
| Singapore | 19 | 0.2% |
| South America | 98 | 0.9% |
| South Central Asia | 1,238 | 11.2% |
| South Eastern Asia | 59 | 0.5% |
| Southern Europe | 66 | 0.6% |
| Spain | 5 | 0.1% |
| Sri Lanka | 28 | 0.3% |
| Sweden | 11 | 0.1% |
| Taiwan | 65 | 0.6% |
| Turkey | 71 | 0.6% |
| Vietnam | 40 | 0.4% |
| Western Asia | 268 | 2.4% |
| Western Europe | 47 | 0.4% |
| Zimbabwe | 11 | 0.1% | View All 54 Rows |
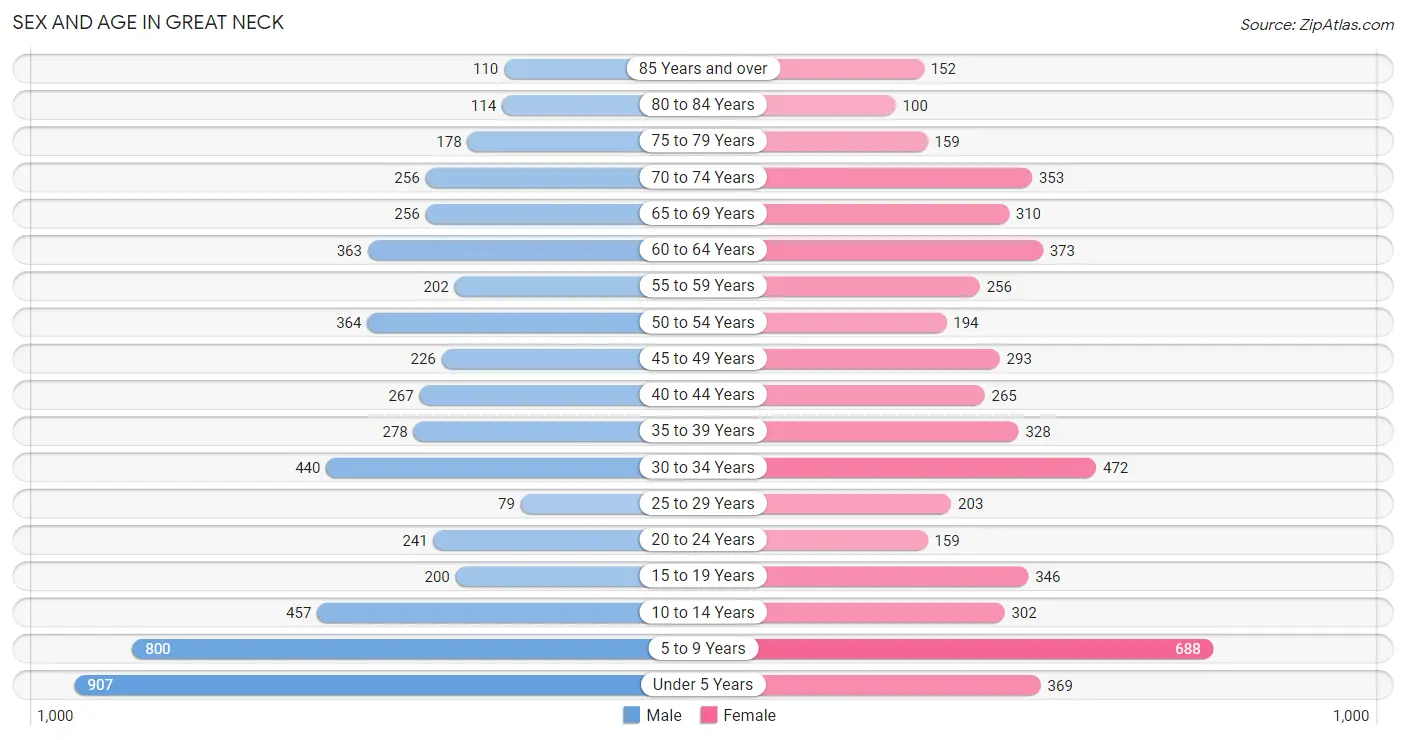
Sex and Age in Great Neck
Sex and Age in Great Neck
The most populous age groups in Great Neck are Under 5 Years (907 | 15.8%) for men and 5 to 9 Years (688 | 12.9%) for women.
| Age Bracket | Male | Female |
| Under 5 Years | 907 (15.8%) | 369 (6.9%) |
| 5 to 9 Years | 800 (13.9%) | 688 (12.9%) |
| 10 to 14 Years | 457 (8.0%) | 302 (5.7%) |
| 15 to 19 Years | 200 (3.5%) | 346 (6.5%) |
| 20 to 24 Years | 241 (4.2%) | 159 (3.0%) |
| 25 to 29 Years | 79 (1.4%) | 203 (3.8%) |
| 30 to 34 Years | 440 (7.7%) | 472 (8.9%) |
| 35 to 39 Years | 278 (4.8%) | 328 (6.2%) |
| 40 to 44 Years | 267 (4.6%) | 265 (5.0%) |
| 45 to 49 Years | 226 (3.9%) | 293 (5.5%) |
| 50 to 54 Years | 364 (6.3%) | 194 (3.6%) |
| 55 to 59 Years | 202 (3.5%) | 256 (4.8%) |
| 60 to 64 Years | 363 (6.3%) | 373 (7.0%) |
| 65 to 69 Years | 256 (4.5%) | 310 (5.8%) |
| 70 to 74 Years | 256 (4.5%) | 353 (6.6%) |
| 75 to 79 Years | 178 (3.1%) | 159 (3.0%) |
| 80 to 84 Years | 114 (2.0%) | 100 (1.9%) |
| 85 Years and over | 110 (1.9%) | 152 (2.9%) |
| Total | 5,738 (100.0%) | 5,322 (100.0%) |
Families and Households in Great Neck
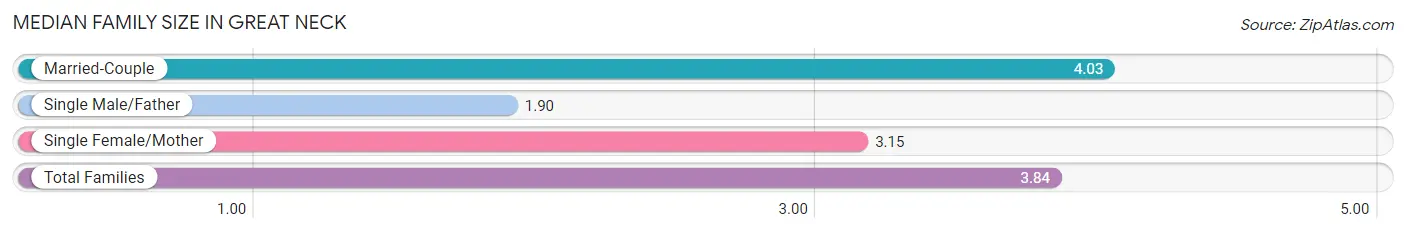
Median Family Size in Great Neck
The median family size in Great Neck is 3.84 persons per family, with married-couple families (2,256 | 84.4%) accounting for the largest median family size of 4.03 persons per family. On the other hand, single male/father families (121 | 4.5%) represent the smallest median family size with 1.90 persons per family.
| Family Type | # Families | Family Size |
| Married-Couple | 2,256 (84.4%) | 4.03 |
| Single Male/Father | 121 (4.5%) | 1.90 |
| Single Female/Mother | 297 (11.1%) | 3.15 |
| Total Families | 2,674 (100.0%) | 3.84 |
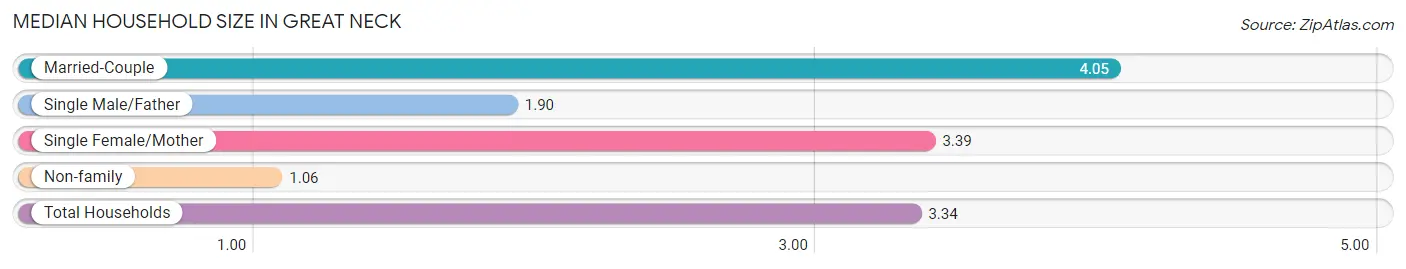
Median Household Size in Great Neck
The median household size in Great Neck is 3.34 persons per household, with married-couple households (2,256 | 68.4%) accounting for the largest median household size of 4.05 persons per household. non-family households (626 | 19.0%) represent the smallest median household size with 1.06 persons per household.
| Household Type | # Households | Household Size |
| Married-Couple | 2,256 (68.4%) | 4.05 |
| Single Male/Father | 121 (3.7%) | 1.90 |
| Single Female/Mother | 297 (9.0%) | 3.39 |
| Non-family | 626 (19.0%) | 1.06 |
| Total Households | 3,300 (100.0%) | 3.34 |
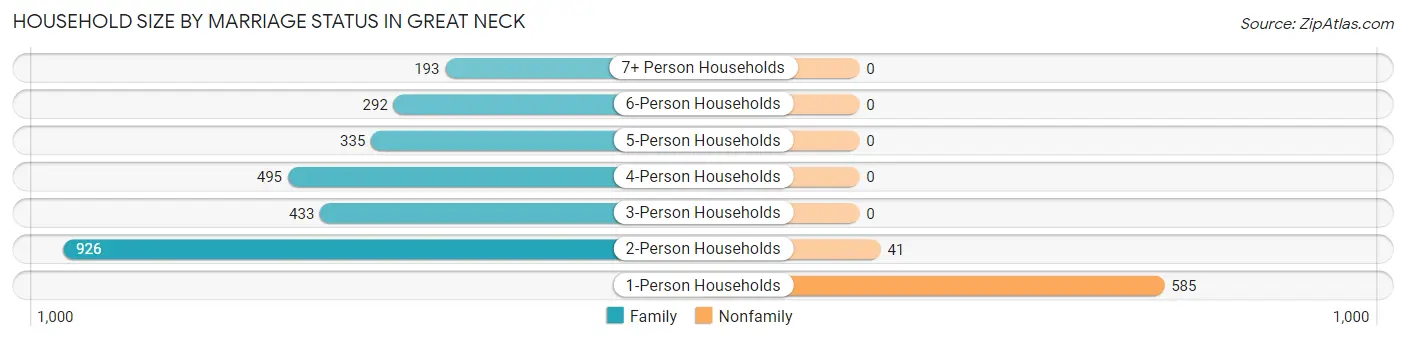
Household Size by Marriage Status in Great Neck
Out of a total of 3,300 households in Great Neck, 2,674 (81.0%) are family households, while 626 (19.0%) are nonfamily households. The most numerous type of family households are 2-person households, comprising 926, and the most common type of nonfamily households are 1-person households, comprising 585.
| Household Size | Family Households | Nonfamily Households |
| 1-Person Households | - | 585 (17.7%) |
| 2-Person Households | 926 (28.1%) | 41 (1.2%) |
| 3-Person Households | 433 (13.1%) | 0 (0.0%) |
| 4-Person Households | 495 (15.0%) | 0 (0.0%) |
| 5-Person Households | 335 (10.2%) | 0 (0.0%) |
| 6-Person Households | 292 (8.8%) | 0 (0.0%) |
| 7+ Person Households | 193 (5.9%) | 0 (0.0%) |
| Total | 2,674 (81.0%) | 626 (19.0%) |
Female Fertility in Great Neck
Fertility by Age in Great Neck
Average fertility rate in Great Neck is 74.0 births per 1,000 women. Women in the age bracket of 35 to 50 years have the highest fertility rate with 101.0 births per 1,000 women. Women in the age bracket of 35 to 50 years acount for 59.5% of all women with births.
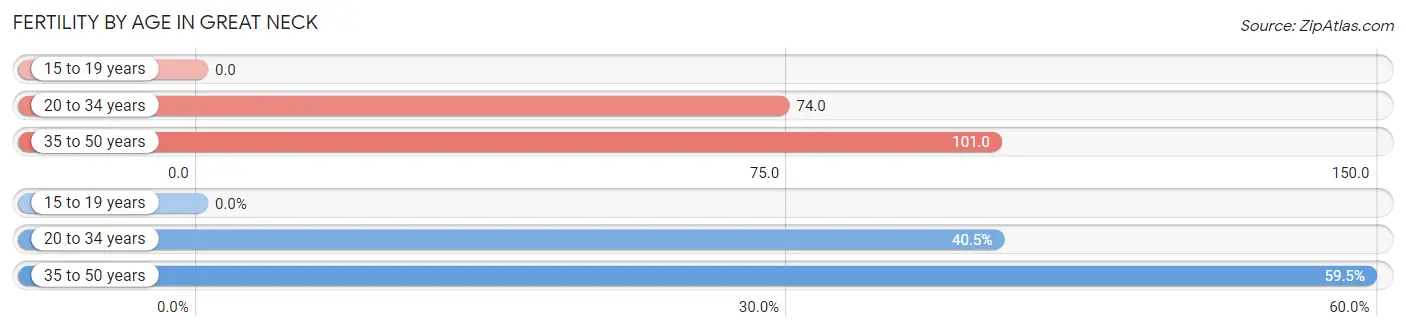
| Age Bracket | Women with Births | Births / 1,000 Women |
| 15 to 19 years | 0 (0.0%) | 0.0 |
| 20 to 34 years | 62 (40.5%) | 74.0 |
| 35 to 50 years | 91 (59.5%) | 101.0 |
| Total | 153 (100.0%) | 74.0 |
Fertility by Age by Marriage Status in Great Neck
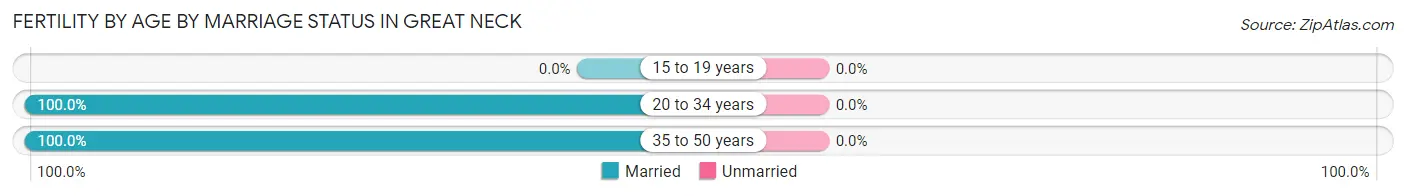
| Age Bracket | Married | Unmarried |
| 15 to 19 years | 0 (0.0%) | 0 (0.0%) |
| 20 to 34 years | 62 (100.0%) | 0 (0.0%) |
| 35 to 50 years | 91 (100.0%) | 0 (0.0%) |
| Total | 153 (100.0%) | 0 (0.0%) |
Fertility by Education in Great Neck
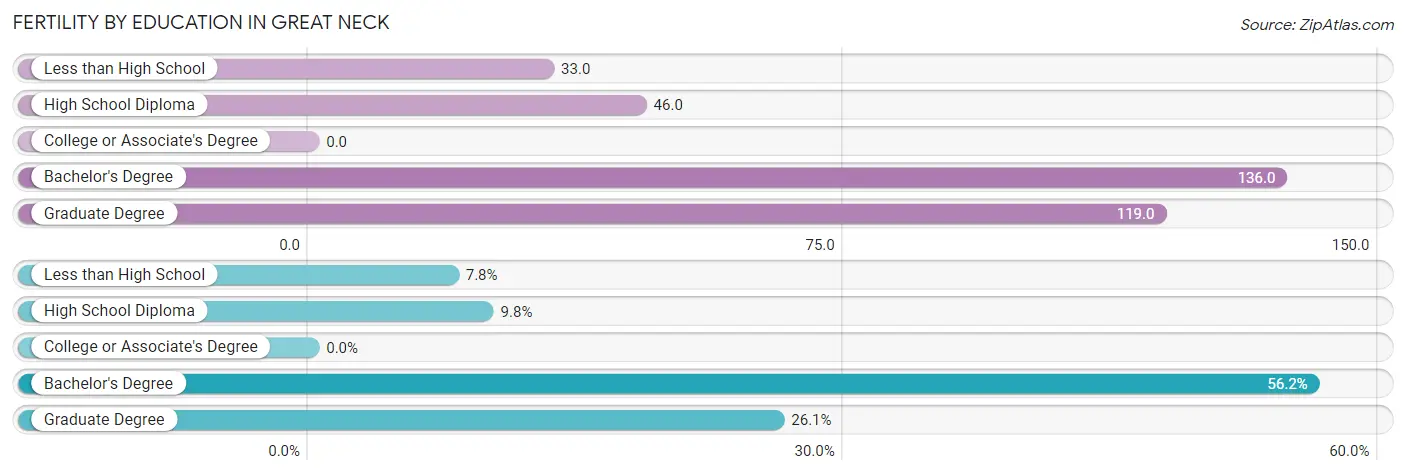
| Educational Attainment | Women with Births | Births / 1,000 Women |
| Less than High School | 12 (7.8%) | 33.0 |
| High School Diploma | 15 (9.8%) | 46.0 |
| College or Associate's Degree | 0 (0.0%) | 0.0 |
| Bachelor's Degree | 86 (56.2%) | 136.0 |
| Graduate Degree | 40 (26.1%) | 119.0 |
| Total | 153 (100.0%) | 74.0 |
Fertility by Education by Marriage Status in Great Neck
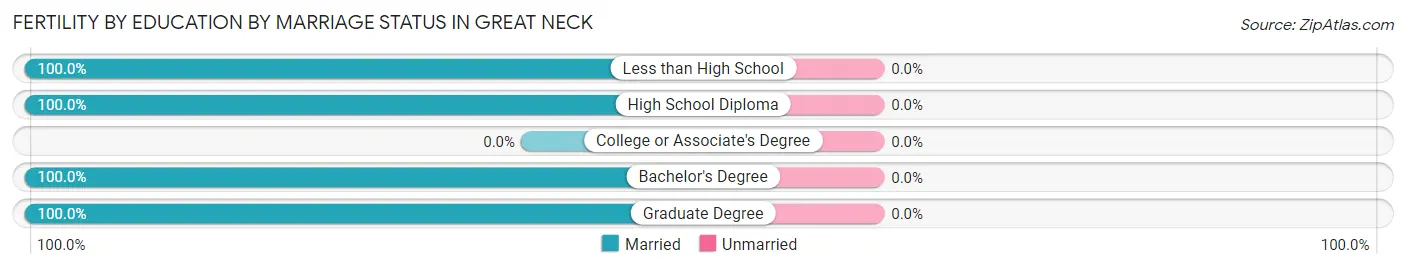
| Educational Attainment | Married | Unmarried |
| Less than High School | 12 (100.0%) | 0 (0.0%) |
| High School Diploma | 15 (100.0%) | 0 (0.0%) |
| College or Associate's Degree | 0 (0.0%) | 0 (0.0%) |
| Bachelor's Degree | 86 (100.0%) | 0 (0.0%) |
| Graduate Degree | 40 (100.0%) | 0 (0.0%) |
| Total | 153 (100.0%) | 0 (0.0%) |
Income in Great Neck
Income Overview in Great Neck
Per Capita Income in Great Neck is $56,199, while median incomes of families and households are $129,391 and $128,457 respectively.
| Characteristic | Number | Measure |
| Per Capita Income | 11,060 | $56,199 |
| Median Family Income | 2,674 | $129,391 |
| Mean Family Income | 2,674 | $199,524 |
| Median Household Income | 3,300 | $128,457 |
| Mean Household Income | 3,300 | $185,621 |
| Income Deficit | 2,674 | $0 |
| Wage / Income Gap (%) | 11,060 | 57.64% |
| Wage / Income Gap ($) | 11,060 | 42.36¢ per $1 |
| Gini / Inequality Index | 11,060 | 0.48 |
Earnings by Sex in Great Neck
Average Earnings in Great Neck are $67,500, $83,163 for men and $35,230 for women, a difference of 57.6%.
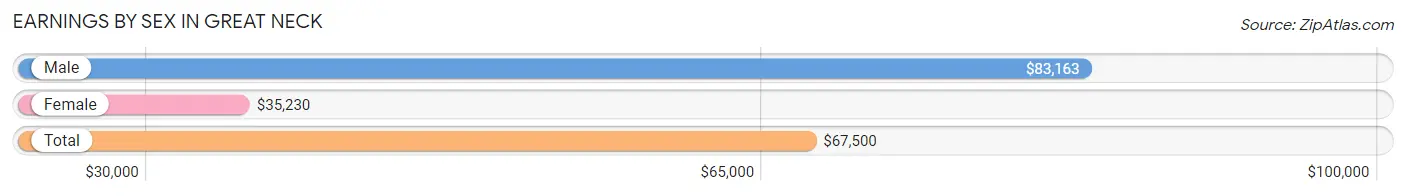
| Sex | Number | Average Earnings |
| Male | 2,466 (56.6%) | $83,163 |
| Female | 1,888 (43.4%) | $35,230 |
| Total | 4,354 (100.0%) | $67,500 |
Earnings by Sex by Income Bracket in Great Neck
The most common earnings brackets in Great Neck are $100,000+ for men (1,034 | 41.9%) and $100,000+ for women (541 | 28.6%).
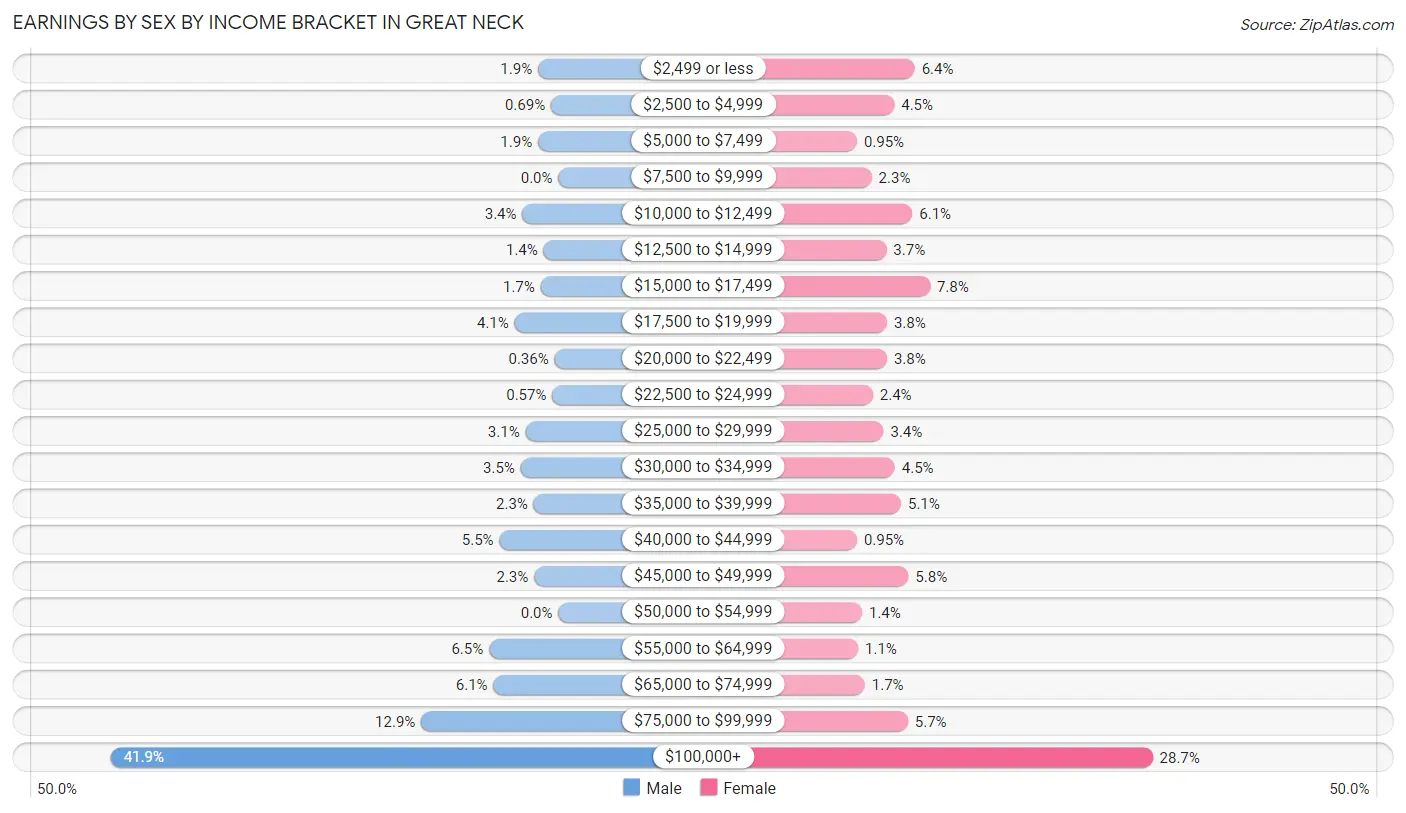
| Income | Male | Female |
| $2,499 or less | 47 (1.9%) | 120 (6.4%) |
| $2,500 to $4,999 | 17 (0.7%) | 84 (4.4%) |
| $5,000 to $7,499 | 47 (1.9%) | 18 (0.9%) |
| $7,500 to $9,999 | 0 (0.0%) | 44 (2.3%) |
| $10,000 to $12,499 | 83 (3.4%) | 116 (6.1%) |
| $12,500 to $14,999 | 34 (1.4%) | 70 (3.7%) |
| $15,000 to $17,499 | 41 (1.7%) | 147 (7.8%) |
| $17,500 to $19,999 | 101 (4.1%) | 71 (3.8%) |
| $20,000 to $22,499 | 9 (0.4%) | 71 (3.8%) |
| $22,500 to $24,999 | 14 (0.6%) | 46 (2.4%) |
| $25,000 to $29,999 | 76 (3.1%) | 65 (3.4%) |
| $30,000 to $34,999 | 87 (3.5%) | 85 (4.5%) |
| $35,000 to $39,999 | 57 (2.3%) | 96 (5.1%) |
| $40,000 to $44,999 | 136 (5.5%) | 18 (0.9%) |
| $45,000 to $49,999 | 56 (2.3%) | 109 (5.8%) |
| $50,000 to $54,999 | 0 (0.0%) | 27 (1.4%) |
| $55,000 to $64,999 | 160 (6.5%) | 20 (1.1%) |
| $65,000 to $74,999 | 150 (6.1%) | 32 (1.7%) |
| $75,000 to $99,999 | 317 (12.9%) | 108 (5.7%) |
| $100,000+ | 1,034 (41.9%) | 541 (28.6%) |
| Total | 2,466 (100.0%) | 1,888 (100.0%) |
Earnings by Sex by Educational Attainment in Great Neck
Average earnings in Great Neck are $87,775 for men and $36,579 for women, a difference of 58.3%. Men with an educational attainment of graduate degree enjoy the highest average annual earnings of $190,515, while those with less than high school education earn the least with $31,182. Women with an educational attainment of graduate degree earn the most with the average annual earnings of $100,000, while those with high school diploma education have the smallest earnings of $18,589.
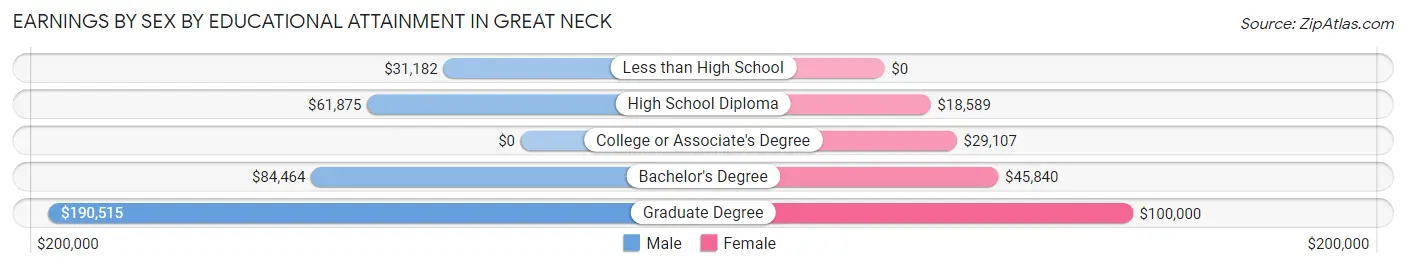
| Educational Attainment | Male Income | Female Income |
| Less than High School | $31,182 | $0 |
| High School Diploma | $61,875 | $18,589 |
| College or Associate's Degree | - | - |
| Bachelor's Degree | $84,464 | $45,840 |
| Graduate Degree | $190,515 | $100,000 |
| Total | $87,775 | $36,579 |
Family Income in Great Neck
Family Income Brackets in Great Neck
According to the Great Neck family income data, there are 864 families falling into the $200,000+ income range, which is the most common income bracket and makes up 32.3% of all families.
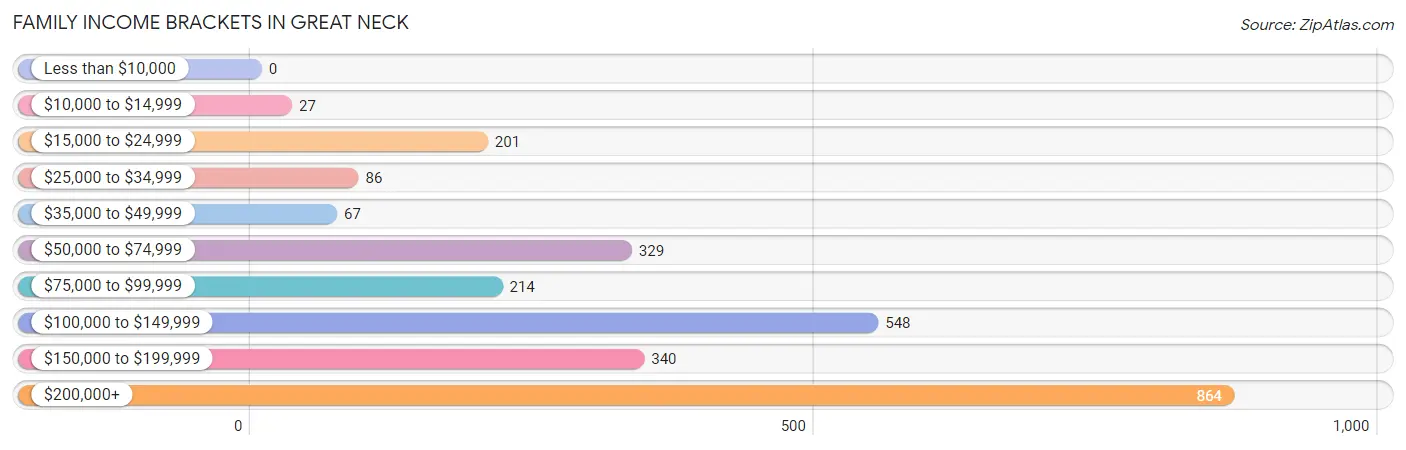
| Income Bracket | # Families | % Families |
| Less than $10,000 | 0 | 0.0% |
| $10,000 to $14,999 | 27 | 1.0% |
| $15,000 to $24,999 | 201 | 7.5% |
| $25,000 to $34,999 | 86 | 3.2% |
| $35,000 to $49,999 | 67 | 2.5% |
| $50,000 to $74,999 | 329 | 12.3% |
| $75,000 to $99,999 | 214 | 8.0% |
| $100,000 to $149,999 | 548 | 20.5% |
| $150,000 to $199,999 | 340 | 12.7% |
| $200,000+ | 864 | 32.3% |
Family Income by Famaliy Size in Great Neck
3-person families (416 | 15.6%) account for the highest median family income in Great Neck with $217,222 per family, while 3-person families (416 | 15.6%) have the highest median income of $72,407 per family member.
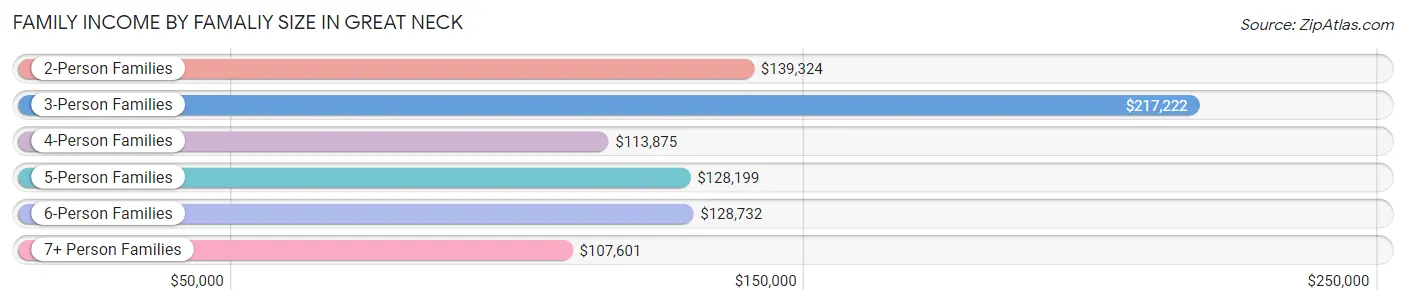
| Income Bracket | # Families | Median Income |
| 2-Person Families | 944 (35.3%) | $139,324 |
| 3-Person Families | 416 (15.6%) | $217,222 |
| 4-Person Families | 527 (19.7%) | $113,875 |
| 5-Person Families | 347 (13.0%) | $128,199 |
| 6-Person Families | 247 (9.2%) | $128,732 |
| 7+ Person Families | 193 (7.2%) | $107,601 |
| Total | 2,674 (100.0%) | $129,391 |
Family Income by Number of Earners in Great Neck
The median family income in Great Neck is $129,391, with families comprising 3+ earners (255) having the highest median family income of $250,001, while families with no earners (308) have the lowest median family income of $58,125, accounting for 9.5% and 11.5% of families, respectively.
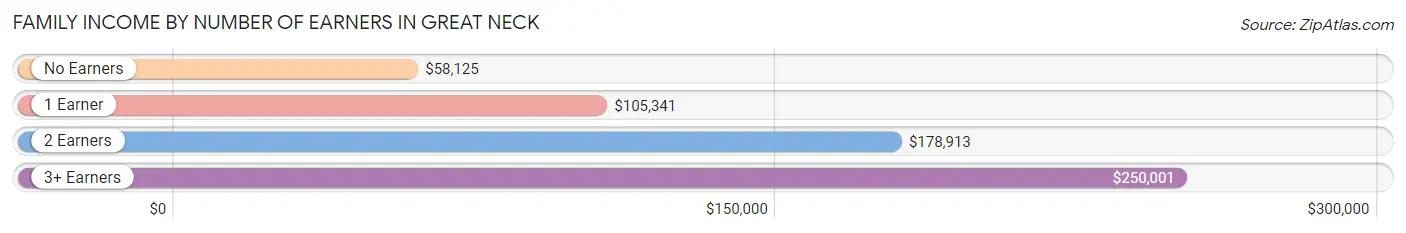
| Number of Earners | # Families | Median Income |
| No Earners | 308 (11.5%) | $58,125 |
| 1 Earner | 1,175 (43.9%) | $105,341 |
| 2 Earners | 936 (35.0%) | $178,913 |
| 3+ Earners | 255 (9.5%) | $250,001 |
| Total | 2,674 (100.0%) | $129,391 |
Household Income in Great Neck
Household Income Brackets in Great Neck
With 990 households falling in the category, the $200,000+ income range is the most frequent in Great Neck, accounting for 30.0% of all households. In contrast, only 59 households (1.8%) fall into the less than $10,000 income bracket, making it the least populous group.
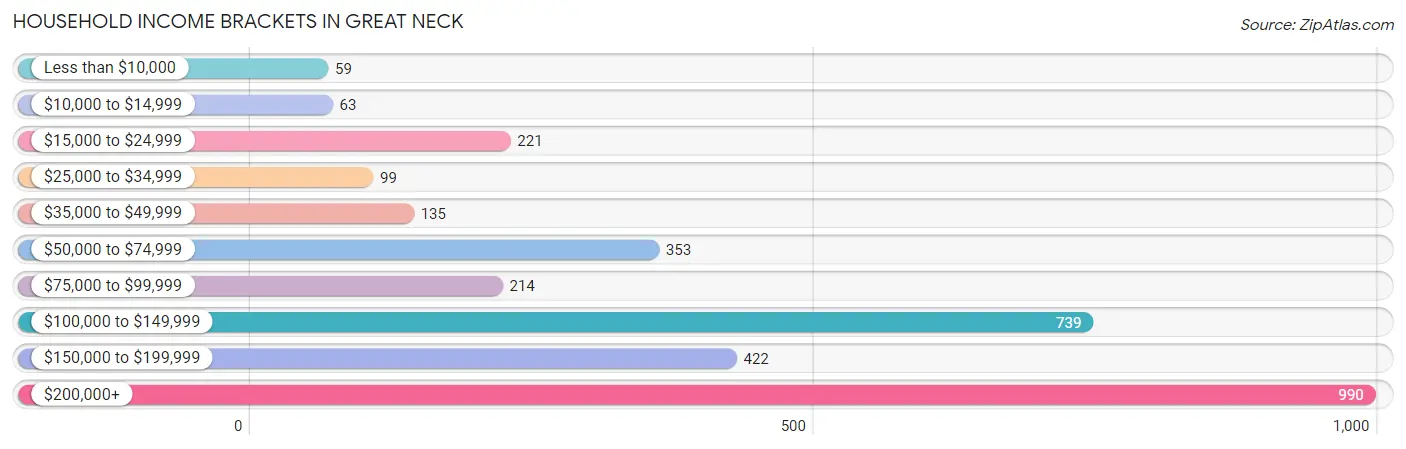
| Income Bracket | # Households | % Households |
| Less than $10,000 | 59 | 1.8% |
| $10,000 to $14,999 | 63 | 1.9% |
| $15,000 to $24,999 | 221 | 6.7% |
| $25,000 to $34,999 | 99 | 3.0% |
| $35,000 to $49,999 | 135 | 4.1% |
| $50,000 to $74,999 | 353 | 10.7% |
| $75,000 to $99,999 | 214 | 6.5% |
| $100,000 to $149,999 | 739 | 22.4% |
| $150,000 to $199,999 | 422 | 12.8% |
| $200,000+ | 990 | 30.0% |
Household Income by Householder Age in Great Neck
The median household income in Great Neck is $128,457, with the highest median household income of $163,750 found in the 45 to 64 years age bracket for the primary householder. A total of 1,252 households (37.9%) fall into this category.
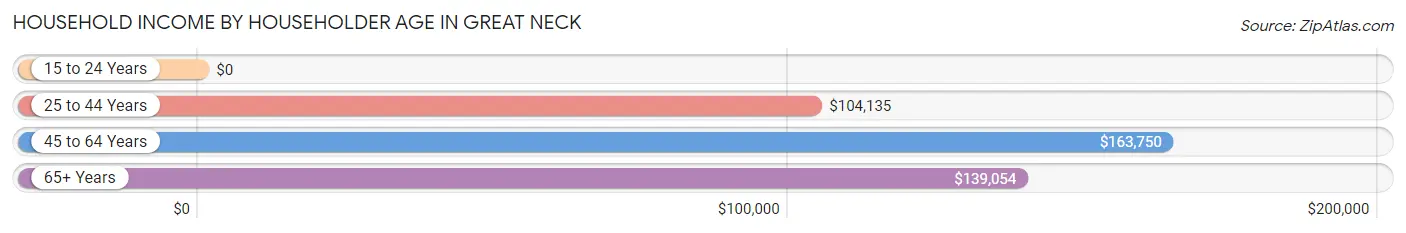
| Income Bracket | # Households | Median Income |
| 15 to 24 Years | 0 (0.0%) | $0 |
| 25 to 44 Years | 916 (27.8%) | $104,135 |
| 45 to 64 Years | 1,252 (37.9%) | $163,750 |
| 65+ Years | 1,132 (34.3%) | $139,054 |
| Total | 3,300 (100.0%) | $128,457 |
Poverty in Great Neck
Income Below Poverty by Sex and Age in Great Neck
With 9.3% poverty level for males and 8.5% for females among the residents of Great Neck, under 5 year old males and under 5 year old females are the most vulnerable to poverty, with 182 males (20.1%) and 112 females (30.3%) in their respective age groups living below the poverty level.
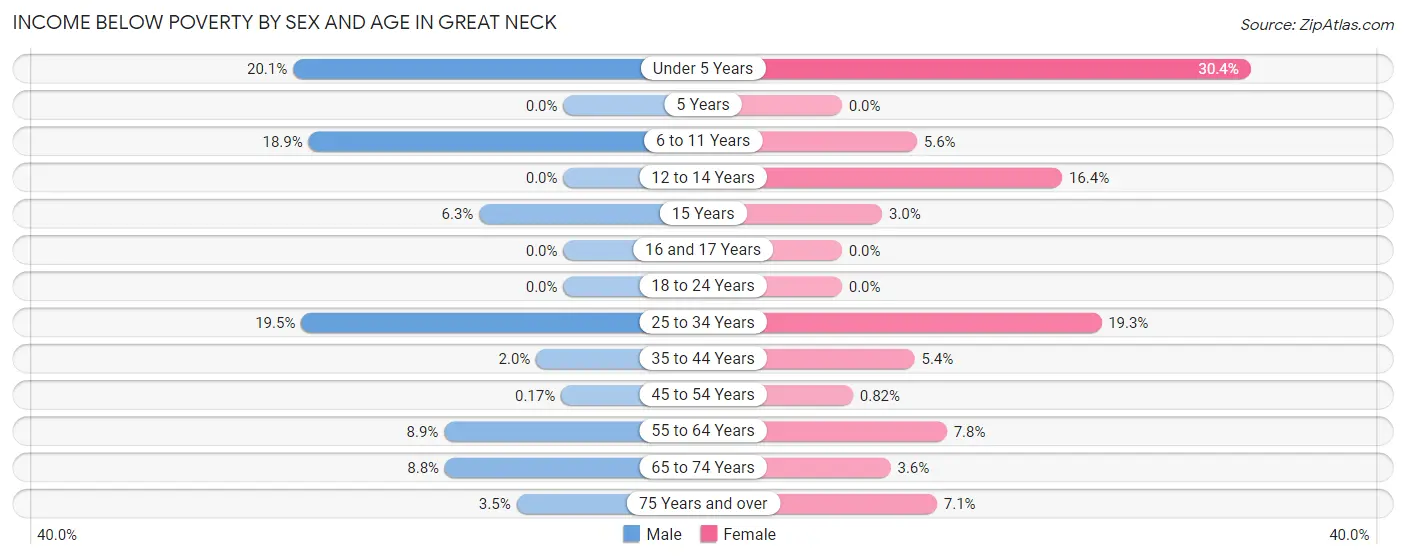
| Age Bracket | Male | Female |
| Under 5 Years | 182 (20.1%) | 112 (30.3%) |
| 5 Years | 0 (0.0%) | 0 (0.0%) |
| 6 to 11 Years | 126 (18.9%) | 37 (5.6%) |
| 12 to 14 Years | 0 (0.0%) | 34 (16.4%) |
| 15 Years | 3 (6.2%) | 2 (3.0%) |
| 16 and 17 Years | 0 (0.0%) | 0 (0.0%) |
| 18 to 24 Years | 0 (0.0%) | 0 (0.0%) |
| 25 to 34 Years | 101 (19.5%) | 130 (19.3%) |
| 35 to 44 Years | 11 (2.0%) | 32 (5.4%) |
| 45 to 54 Years | 1 (0.2%) | 4 (0.8%) |
| 55 to 64 Years | 50 (8.8%) | 49 (7.8%) |
| 65 to 74 Years | 45 (8.8%) | 24 (3.6%) |
| 75 Years and over | 14 (3.5%) | 29 (7.1%) |
| Total | 533 (9.3%) | 453 (8.5%) |
Income Above Poverty by Sex and Age in Great Neck
According to the poverty statistics in Great Neck, males aged 5 years and females aged 5 years are the age groups that are most secure financially, with 100.0% of males and 100.0% of females in these age groups living above the poverty line.
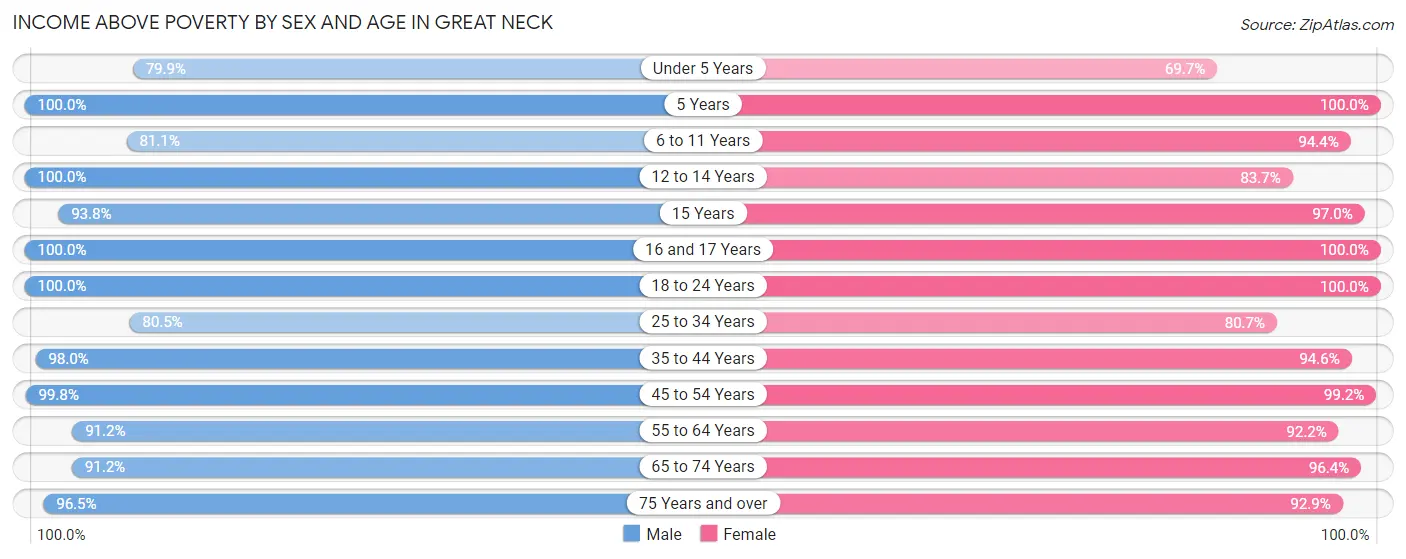
| Age Bracket | Male | Female |
| Under 5 Years | 725 (79.9%) | 257 (69.7%) |
| 5 Years | 302 (100.0%) | 118 (100.0%) |
| 6 to 11 Years | 540 (81.1%) | 627 (94.4%) |
| 12 to 14 Years | 289 (100.0%) | 174 (83.7%) |
| 15 Years | 45 (93.8%) | 65 (97.0%) |
| 16 and 17 Years | 141 (100.0%) | 177 (100.0%) |
| 18 to 24 Years | 252 (100.0%) | 261 (100.0%) |
| 25 to 34 Years | 418 (80.5%) | 545 (80.7%) |
| 35 to 44 Years | 534 (98.0%) | 561 (94.6%) |
| 45 to 54 Years | 589 (99.8%) | 483 (99.2%) |
| 55 to 64 Years | 515 (91.1%) | 580 (92.2%) |
| 65 to 74 Years | 467 (91.2%) | 639 (96.4%) |
| 75 Years and over | 388 (96.5%) | 382 (92.9%) |
| Total | 5,205 (90.7%) | 4,869 (91.5%) |
Income Below Poverty Among Married-Couple Families in Great Neck
The poverty statistics for married-couple families in Great Neck show that 4.2% or 94 of the total 2,256 families live below the poverty line. Families with 1 or 2 children have the highest poverty rate of 7.0%, comprising of 44 families. On the other hand, families with 5 or more children have the lowest poverty rate of 0.0%, which includes 0 families.
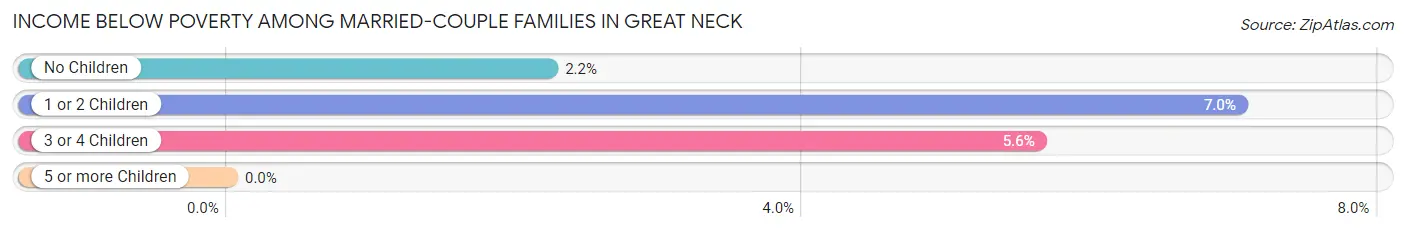
| Children | Above Poverty | Below Poverty |
| No Children | 964 (97.8%) | 22 (2.2%) |
| 1 or 2 Children | 582 (93.0%) | 44 (7.0%) |
| 3 or 4 Children | 469 (94.4%) | 28 (5.6%) |
| 5 or more Children | 147 (100.0%) | 0 (0.0%) |
| Total | 2,162 (95.8%) | 94 (4.2%) |
Income Below Poverty Among Single-Parent Households in Great Neck
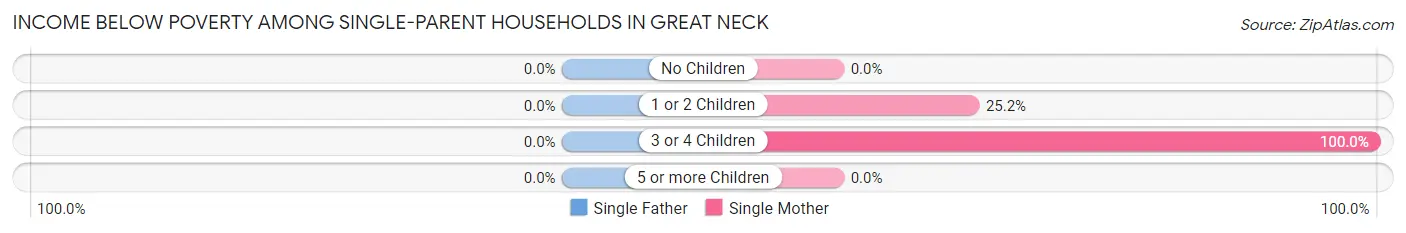
| Children | Single Father | Single Mother |
| No Children | 0 (0.0%) | 0 (0.0%) |
| 1 or 2 Children | 0 (0.0%) | 32 (25.2%) |
| 3 or 4 Children | 0 (0.0%) | 44 (100.0%) |
| 5 or more Children | 0 (0.0%) | 0 (0.0%) |
| Total | 0 (0.0%) | 76 (25.6%) |
Income Below Poverty Among Married-Couple vs Single-Parent Households in Great Neck
The poverty data for Great Neck shows that 94 of the married-couple family households (4.2%) and 76 of the single-parent households (18.2%) are living below the poverty level. Within the married-couple family households, those with 1 or 2 children have the highest poverty rate, with 44 households (7.0%) falling below the poverty line. Among the single-parent households, those with 3 or 4 children have the highest poverty rate, with 44 household (100.0%) living below poverty.
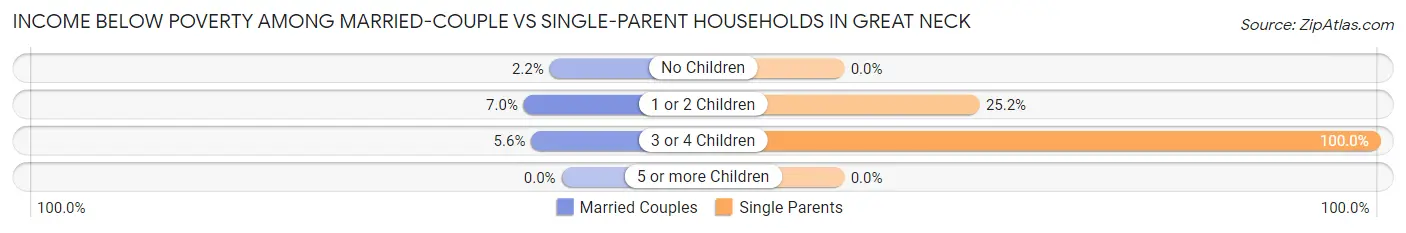
| Children | Married-Couple Families | Single-Parent Households |
| No Children | 22 (2.2%) | 0 (0.0%) |
| 1 or 2 Children | 44 (7.0%) | 32 (25.2%) |
| 3 or 4 Children | 28 (5.6%) | 44 (100.0%) |
| 5 or more Children | 0 (0.0%) | 0 (0.0%) |
| Total | 94 (4.2%) | 76 (18.2%) |
Employment Characteristics in Great Neck
Employment by Class of Employer in Great Neck
Among the 3,852 employed individuals in Great Neck, private company employees (2,328 | 60.4%), self-employed (incorporated) (478 | 12.4%), and not-for-profit organizations (400 | 10.4%) make up the most common classes of employment.
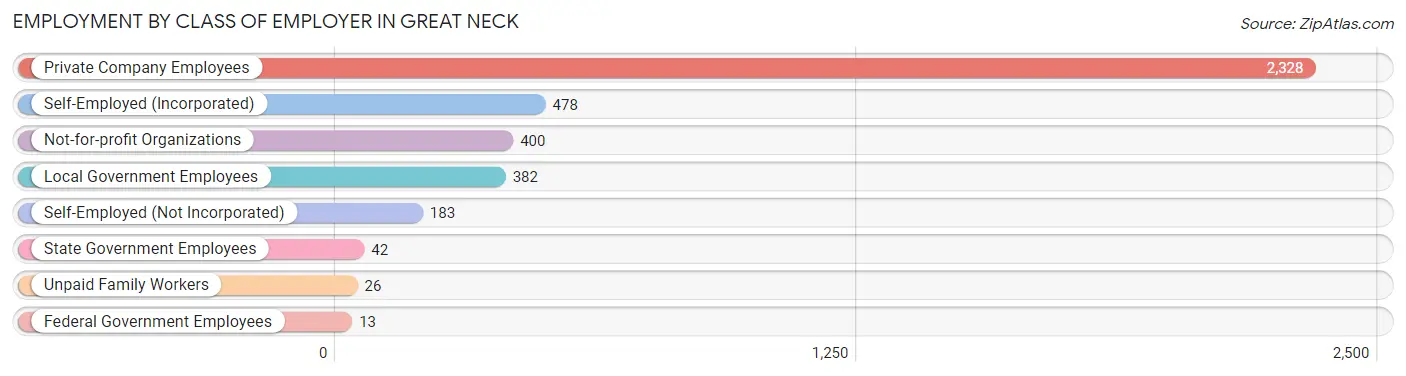
| Employer Class | # Employees | % Employees |
| Private Company Employees | 2,328 | 60.4% |
| Self-Employed (Incorporated) | 478 | 12.4% |
| Self-Employed (Not Incorporated) | 183 | 4.8% |
| Not-for-profit Organizations | 400 | 10.4% |
| Local Government Employees | 382 | 9.9% |
| State Government Employees | 42 | 1.1% |
| Federal Government Employees | 13 | 0.3% |
| Unpaid Family Workers | 26 | 0.7% |
| Total | 3,852 | 100.0% |
Employment Status by Age in Great Neck
According to the labor force statistics for Great Neck, out of the total population over 16 years of age (7,422), 56.7% or 4,208 individuals are in the labor force, with 4.7% or 198 of them unemployed. The age group with the highest labor force participation rate is 45 to 54 years, with 82.5% or 889 individuals in the labor force. Within the labor force, the 16 to 19 years age range has the highest percentage of unemployed individuals, with 25.3% or 19 of them being unemployed.
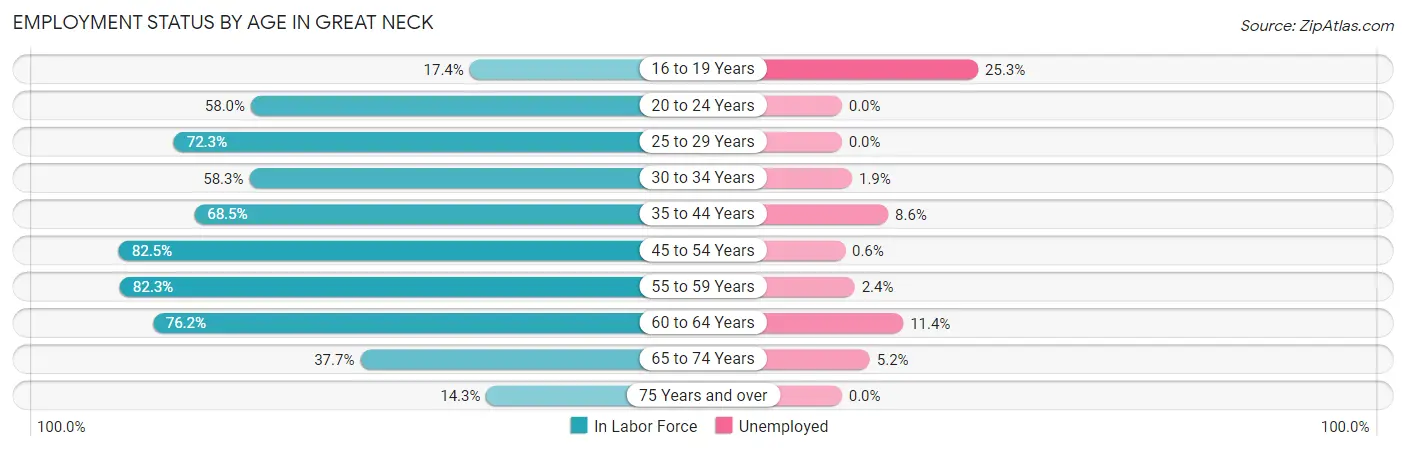
| Age Bracket | In Labor Force | Unemployed |
| 16 to 19 Years | 75 (17.4%) | 19 (25.3%) |
| 20 to 24 Years | 232 (58.0%) | 0 (0.0%) |
| 25 to 29 Years | 204 (72.3%) | 0 (0.0%) |
| 30 to 34 Years | 532 (58.3%) | 10 (1.9%) |
| 35 to 44 Years | 780 (68.5%) | 67 (8.6%) |
| 45 to 54 Years | 889 (82.5%) | 5 (0.6%) |
| 55 to 59 Years | 377 (82.3%) | 9 (2.4%) |
| 60 to 64 Years | 561 (76.2%) | 64 (11.4%) |
| 65 to 74 Years | 443 (37.7%) | 23 (5.2%) |
| 75 Years and over | 116 (14.3%) | 0 (0.0%) |
| Total | 4,208 (56.7%) | 198 (4.7%) |
Employment Status by Educational Attainment in Great Neck
According to labor force statistics for Great Neck, 72.6% of individuals (3,342) out of the total population between 25 and 64 years of age (4,603) are in the labor force, with 4.6% or 154 of them being unemployed. The group with the highest labor force participation rate are those with the educational attainment of bachelor's degree or higher, with 81.0% or 2,230 individuals in the labor force. Within the labor force, individuals with bachelor's degree or higher education have the highest percentage of unemployment, with 6.1% or 136 of them being unemployed.
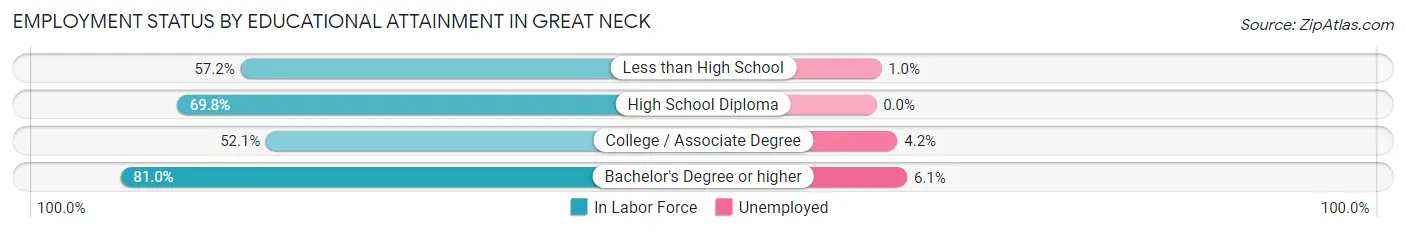
| Educational Attainment | In Labor Force | Unemployed |
| Less than High School | 198 (57.2%) | 3 (1.0%) |
| High School Diploma | 507 (69.8%) | 0 (0.0%) |
| College / Associate Degree | 405 (52.1%) | 33 (4.2%) |
| Bachelor's Degree or higher | 2,230 (81.0%) | 168 (6.1%) |
| Total | 3,342 (72.6%) | 212 (4.6%) |
Employment Occupations by Sex in Great Neck
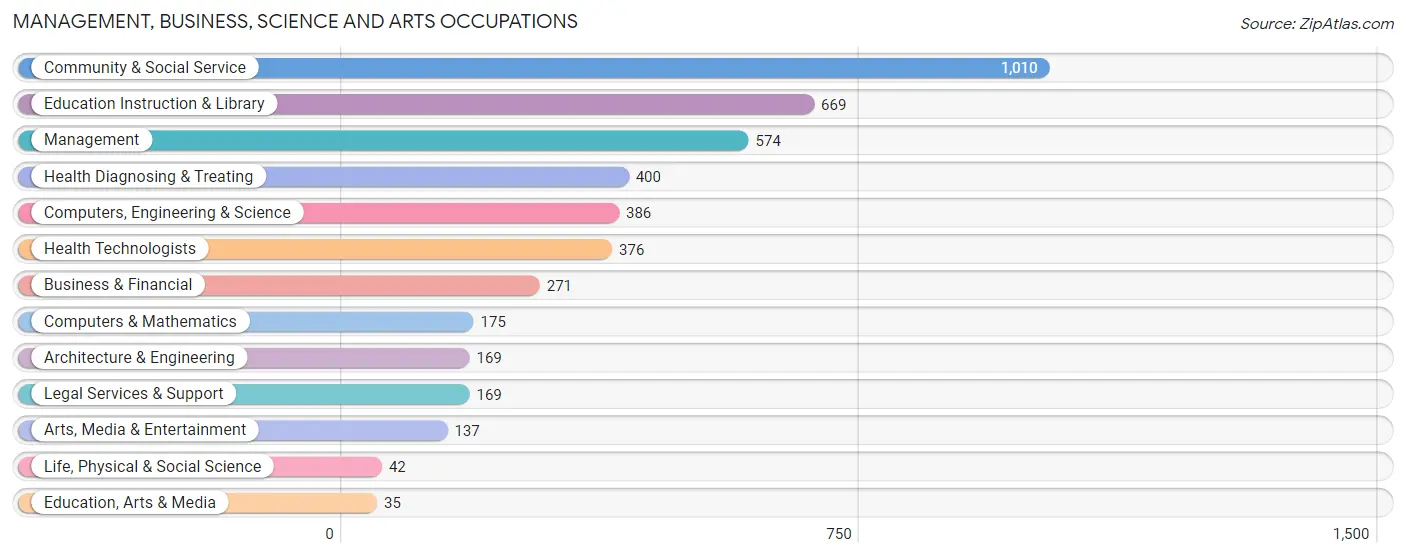
Management, Business, Science and Arts Occupations
The most common Management, Business, Science and Arts occupations in Great Neck are Community & Social Service (1,010 | 25.2%), Education Instruction & Library (669 | 16.7%), Management (574 | 14.3%), Health Diagnosing & Treating (400 | 10.0%), and Computers, Engineering & Science (386 | 9.6%).
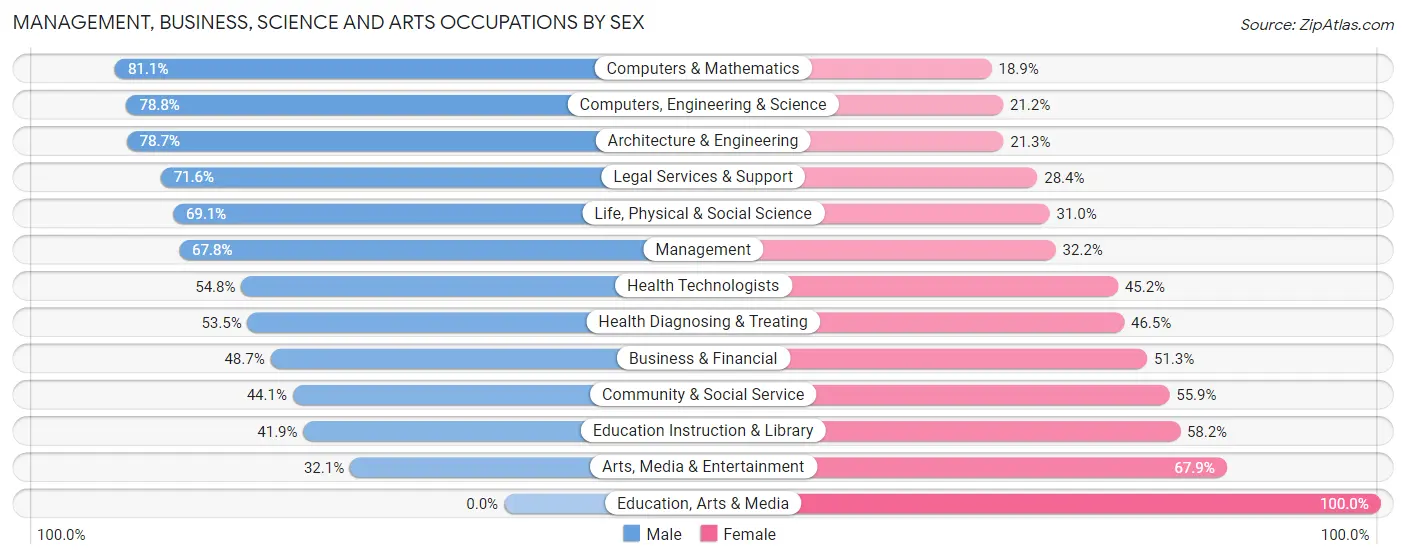
Management, Business, Science and Arts Occupations by Sex
Within the Management, Business, Science and Arts occupations in Great Neck, the most male-oriented occupations are Computers & Mathematics (81.1%), Computers, Engineering & Science (78.8%), and Architecture & Engineering (78.7%), while the most female-oriented occupations are Education, Arts & Media (100.0%), Arts, Media & Entertainment (67.9%), and Education Instruction & Library (58.2%).
| Occupation | Male | Female |
| Management | 389 (67.8%) | 185 (32.2%) |
| Business & Financial | 132 (48.7%) | 139 (51.3%) |
| Computers, Engineering & Science | 304 (78.8%) | 82 (21.2%) |
| Computers & Mathematics | 142 (81.1%) | 33 (18.9%) |
| Architecture & Engineering | 133 (78.7%) | 36 (21.3%) |
| Life, Physical & Social Science | 29 (69.1%) | 13 (30.9%) |
| Community & Social Service | 445 (44.1%) | 565 (55.9%) |
| Education, Arts & Media | 0 (0.0%) | 35 (100.0%) |
| Legal Services & Support | 121 (71.6%) | 48 (28.4%) |
| Education Instruction & Library | 280 (41.8%) | 389 (58.2%) |
| Arts, Media & Entertainment | 44 (32.1%) | 93 (67.9%) |
| Health Diagnosing & Treating | 214 (53.5%) | 186 (46.5%) |
| Health Technologists | 206 (54.8%) | 170 (45.2%) |
| Total (Category) | 1,484 (56.2%) | 1,157 (43.8%) |
| Total (Overall) | 2,404 (60.0%) | 1,606 (40.1%) |
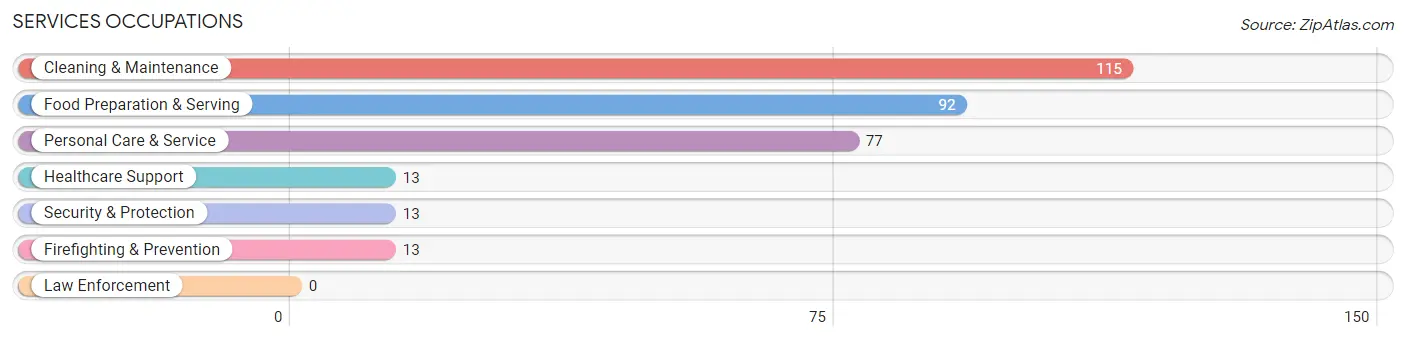
Services Occupations
The most common Services occupations in Great Neck are Cleaning & Maintenance (115 | 2.9%), Food Preparation & Serving (92 | 2.3%), Personal Care & Service (77 | 1.9%), Healthcare Support (13 | 0.3%), and Security & Protection (13 | 0.3%).
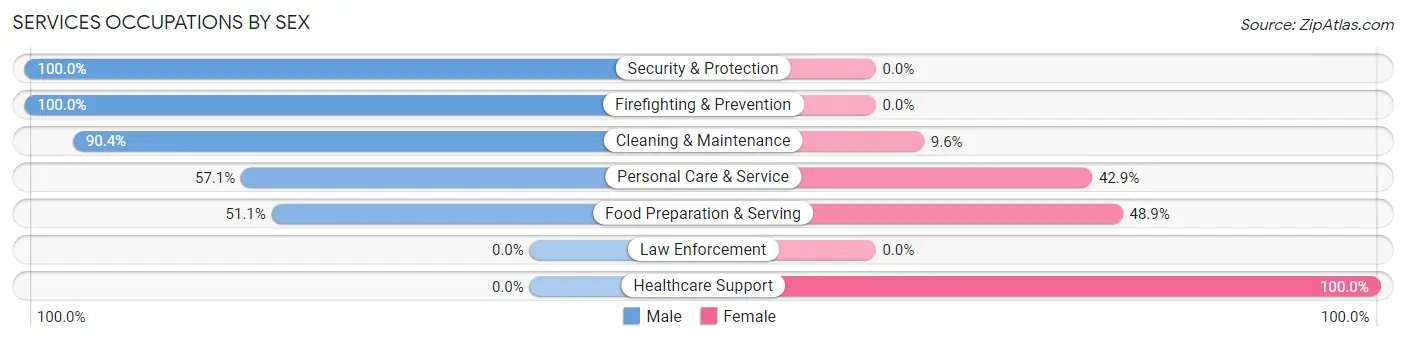
Services Occupations by Sex
Within the Services occupations in Great Neck, the most male-oriented occupations are Security & Protection (100.0%), Firefighting & Prevention (100.0%), and Cleaning & Maintenance (90.4%), while the most female-oriented occupations are Healthcare Support (100.0%), Food Preparation & Serving (48.9%), and Personal Care & Service (42.9%).
| Occupation | Male | Female |
| Healthcare Support | 0 (0.0%) | 13 (100.0%) |
| Security & Protection | 13 (100.0%) | 0 (0.0%) |
| Firefighting & Prevention | 13 (100.0%) | 0 (0.0%) |
| Law Enforcement | 0 (0.0%) | 0 (0.0%) |
| Food Preparation & Serving | 47 (51.1%) | 45 (48.9%) |
| Cleaning & Maintenance | 104 (90.4%) | 11 (9.6%) |
| Personal Care & Service | 44 (57.1%) | 33 (42.9%) |
| Total (Category) | 208 (67.1%) | 102 (32.9%) |
| Total (Overall) | 2,404 (60.0%) | 1,606 (40.1%) |
Sales and Office Occupations
The most common Sales and Office occupations in Great Neck are Sales & Related (470 | 11.7%), and Office & Administration (245 | 6.1%).

Sales and Office Occupations by Sex

| Occupation | Male | Female |
| Sales & Related | 304 (64.7%) | 166 (35.3%) |
| Office & Administration | 98 (40.0%) | 147 (60.0%) |
| Total (Category) | 402 (56.2%) | 313 (43.8%) |
| Total (Overall) | 2,404 (60.0%) | 1,606 (40.1%) |
Natural Resources, Construction and Maintenance Occupations
The most common Natural Resources, Construction and Maintenance occupations in Great Neck are Installation, Maintenance & Repair (113 | 2.8%), and Construction & Extraction (51 | 1.3%).

Natural Resources, Construction and Maintenance Occupations by Sex

| Occupation | Male | Female |
| Farming, Fishing & Forestry | 0 (0.0%) | 0 (0.0%) |
| Construction & Extraction | 51 (100.0%) | 0 (0.0%) |
| Installation, Maintenance & Repair | 113 (100.0%) | 0 (0.0%) |
| Total (Category) | 164 (100.0%) | 0 (0.0%) |
| Total (Overall) | 2,404 (60.0%) | 1,606 (40.1%) |
Production, Transportation and Moving Occupations
The most common Production, Transportation and Moving occupations in Great Neck are Production (113 | 2.8%), and Transportation (67 | 1.7%).
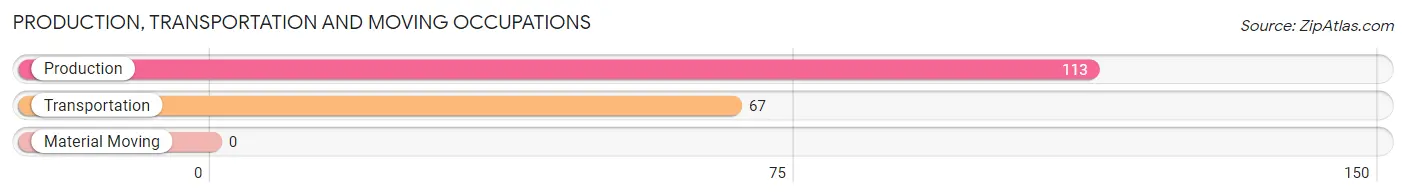
Production, Transportation and Moving Occupations by Sex
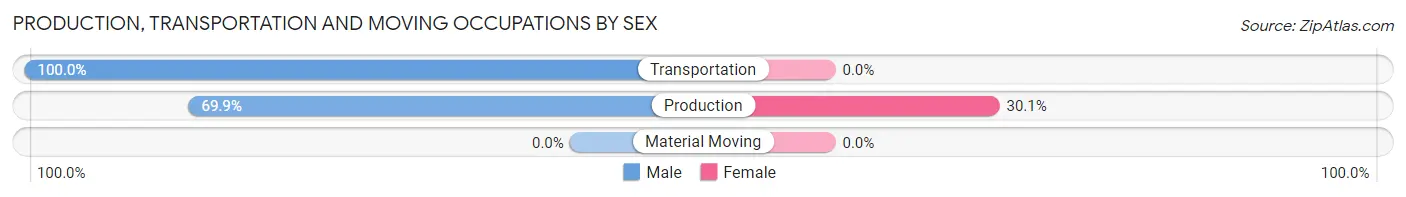
| Occupation | Male | Female |
| Production | 79 (69.9%) | 34 (30.1%) |
| Transportation | 67 (100.0%) | 0 (0.0%) |
| Material Moving | 0 (0.0%) | 0 (0.0%) |
| Total (Category) | 146 (81.1%) | 34 (18.9%) |
| Total (Overall) | 2,404 (60.0%) | 1,606 (40.1%) |
Employment Industries by Sex in Great Neck
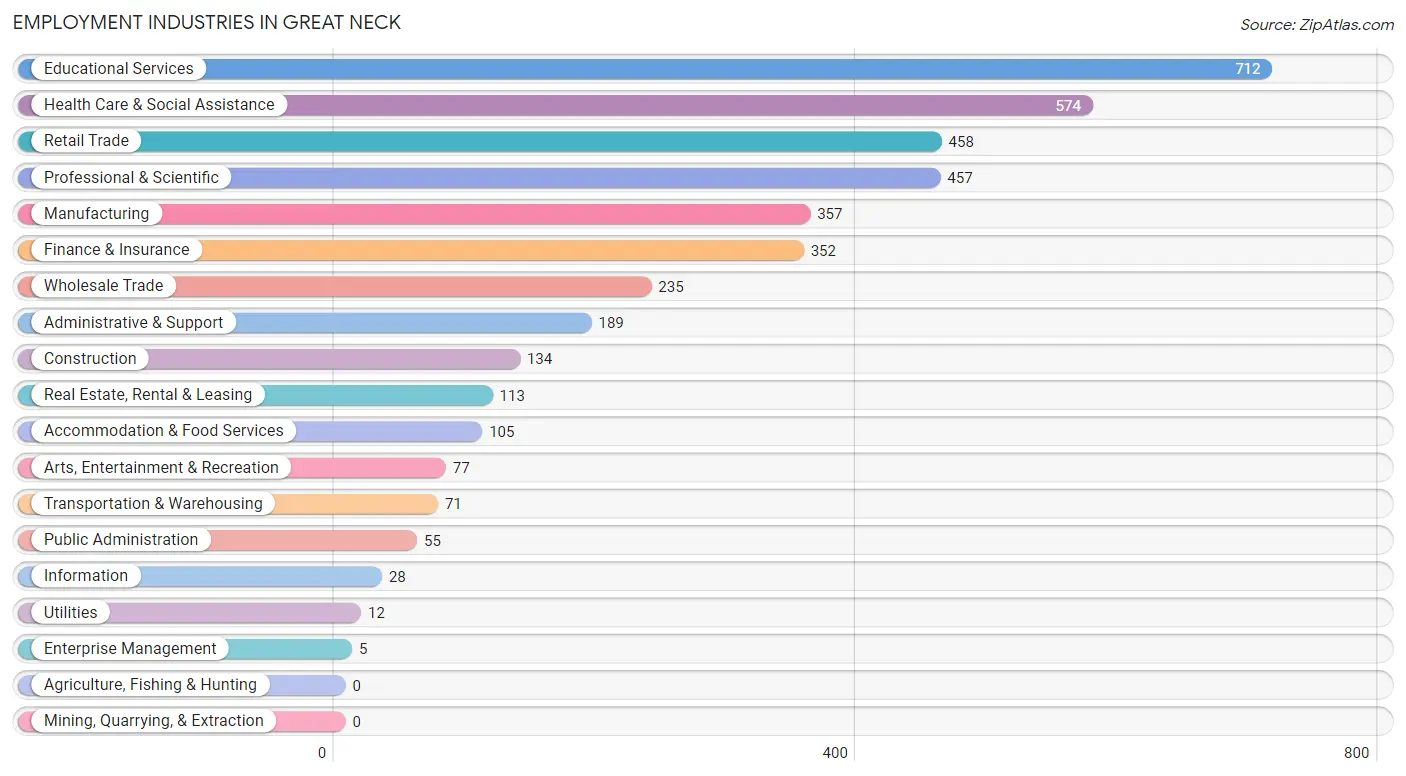
Employment Industries in Great Neck
The major employment industries in Great Neck include Educational Services (712 | 17.8%), Health Care & Social Assistance (574 | 14.3%), Retail Trade (458 | 11.4%), Professional & Scientific (457 | 11.4%), and Manufacturing (357 | 8.9%).
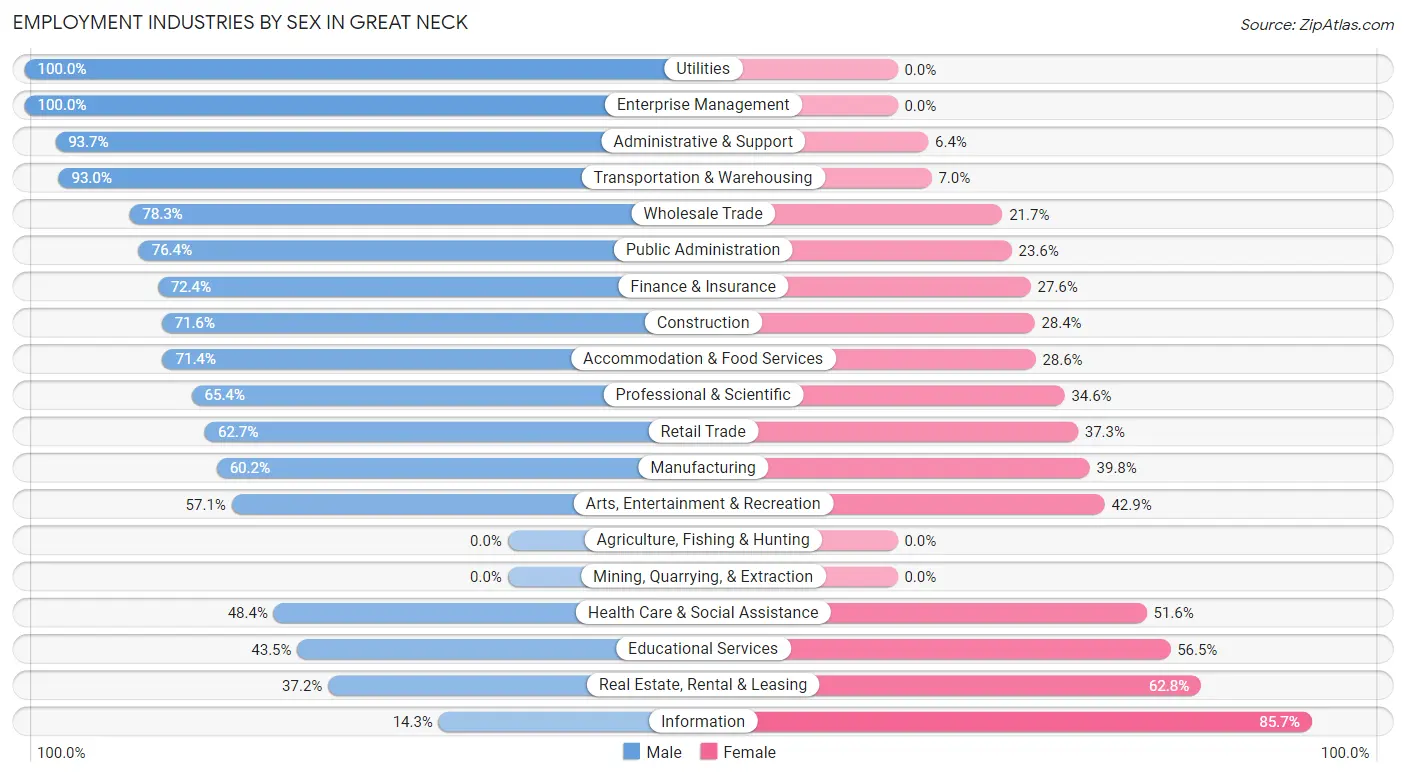
Employment Industries by Sex in Great Neck
The Great Neck industries that see more men than women are Utilities (100.0%), Enterprise Management (100.0%), and Administrative & Support (93.6%), whereas the industries that tend to have a higher number of women are Information (85.7%), Real Estate, Rental & Leasing (62.8%), and Educational Services (56.5%).
| Industry | Male | Female |
| Agriculture, Fishing & Hunting | 0 (0.0%) | 0 (0.0%) |
| Mining, Quarrying, & Extraction | 0 (0.0%) | 0 (0.0%) |
| Construction | 96 (71.6%) | 38 (28.4%) |
| Manufacturing | 215 (60.2%) | 142 (39.8%) |
| Wholesale Trade | 184 (78.3%) | 51 (21.7%) |
| Retail Trade | 287 (62.7%) | 171 (37.3%) |
| Transportation & Warehousing | 66 (93.0%) | 5 (7.0%) |
| Utilities | 12 (100.0%) | 0 (0.0%) |
| Information | 4 (14.3%) | 24 (85.7%) |
| Finance & Insurance | 255 (72.4%) | 97 (27.6%) |
| Real Estate, Rental & Leasing | 42 (37.2%) | 71 (62.8%) |
| Professional & Scientific | 299 (65.4%) | 158 (34.6%) |
| Enterprise Management | 5 (100.0%) | 0 (0.0%) |
| Administrative & Support | 177 (93.6%) | 12 (6.4%) |
| Educational Services | 310 (43.5%) | 402 (56.5%) |
| Health Care & Social Assistance | 278 (48.4%) | 296 (51.6%) |
| Arts, Entertainment & Recreation | 44 (57.1%) | 33 (42.9%) |
| Accommodation & Food Services | 75 (71.4%) | 30 (28.6%) |
| Public Administration | 42 (76.4%) | 13 (23.6%) |
| Total | 2,404 (60.0%) | 1,606 (40.1%) |
Education in Great Neck
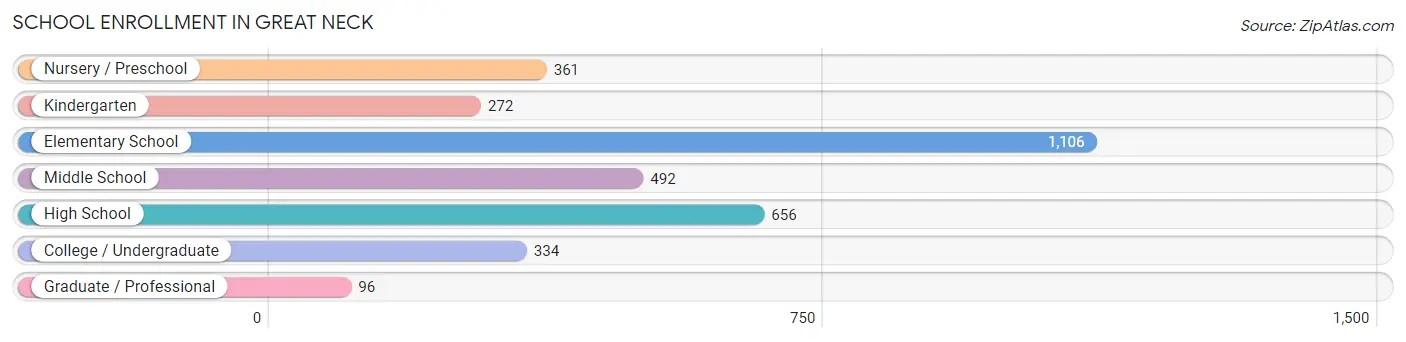
School Enrollment in Great Neck
The most common levels of schooling among the 3,317 students in Great Neck are elementary school (1,106 | 33.3%), high school (656 | 19.8%), and middle school (492 | 14.8%).
| School Level | # Students | % Students |
| Nursery / Preschool | 361 | 10.9% |
| Kindergarten | 272 | 8.2% |
| Elementary School | 1,106 | 33.3% |
| Middle School | 492 | 14.8% |
| High School | 656 | 19.8% |
| College / Undergraduate | 334 | 10.1% |
| Graduate / Professional | 96 | 2.9% |
| Total | 3,317 | 100.0% |
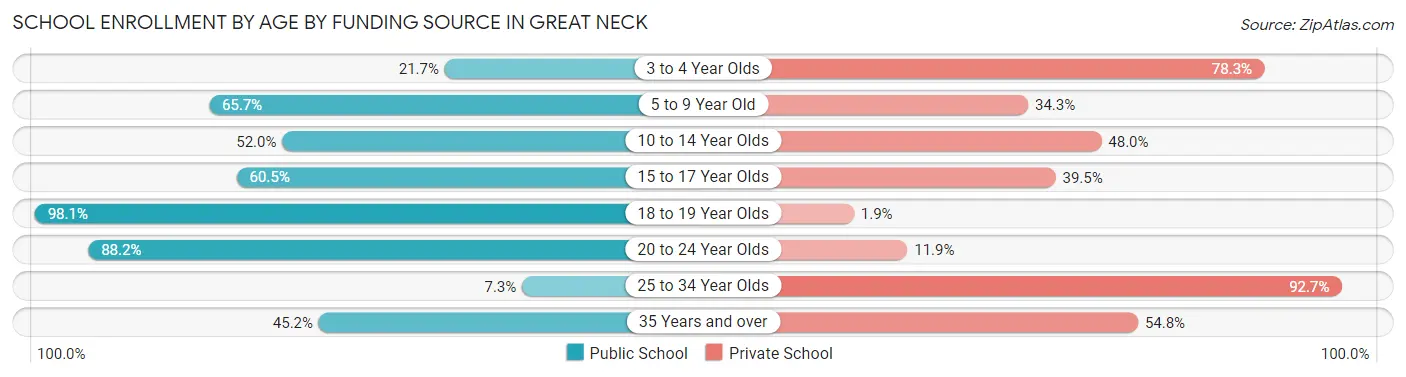
School Enrollment by Age by Funding Source in Great Neck
Out of a total of 3,317 students who are enrolled in schools in Great Neck, 1,469 (44.3%) attend a private institution, while the remaining 1,848 (55.7%) are enrolled in public schools. The age group of 25 to 34 year olds has the highest likelihood of being enrolled in private schools, with 139 (92.7% in the age bracket) enrolled. Conversely, the age group of 18 to 19 year olds has the lowest likelihood of being enrolled in a private school, with 52 (98.1% in the age bracket) attending a public institution.
| Age Bracket | Public School | Private School |
| 3 to 4 Year Olds | 68 (21.7%) | 245 (78.3%) |
| 5 to 9 Year Old | 895 (65.7%) | 468 (34.3%) |
| 10 to 14 Year Olds | 390 (52.0%) | 360 (48.0%) |
| 15 to 17 Year Olds | 253 (60.5%) | 165 (39.5%) |
| 18 to 19 Year Olds | 52 (98.1%) | 1 (1.9%) |
| 20 to 24 Year Olds | 119 (88.1%) | 16 (11.8%) |
| 25 to 34 Year Olds | 11 (7.3%) | 139 (92.7%) |
| 35 Years and over | 61 (45.2%) | 74 (54.8%) |
| Total | 1,848 (55.7%) | 1,469 (44.3%) |
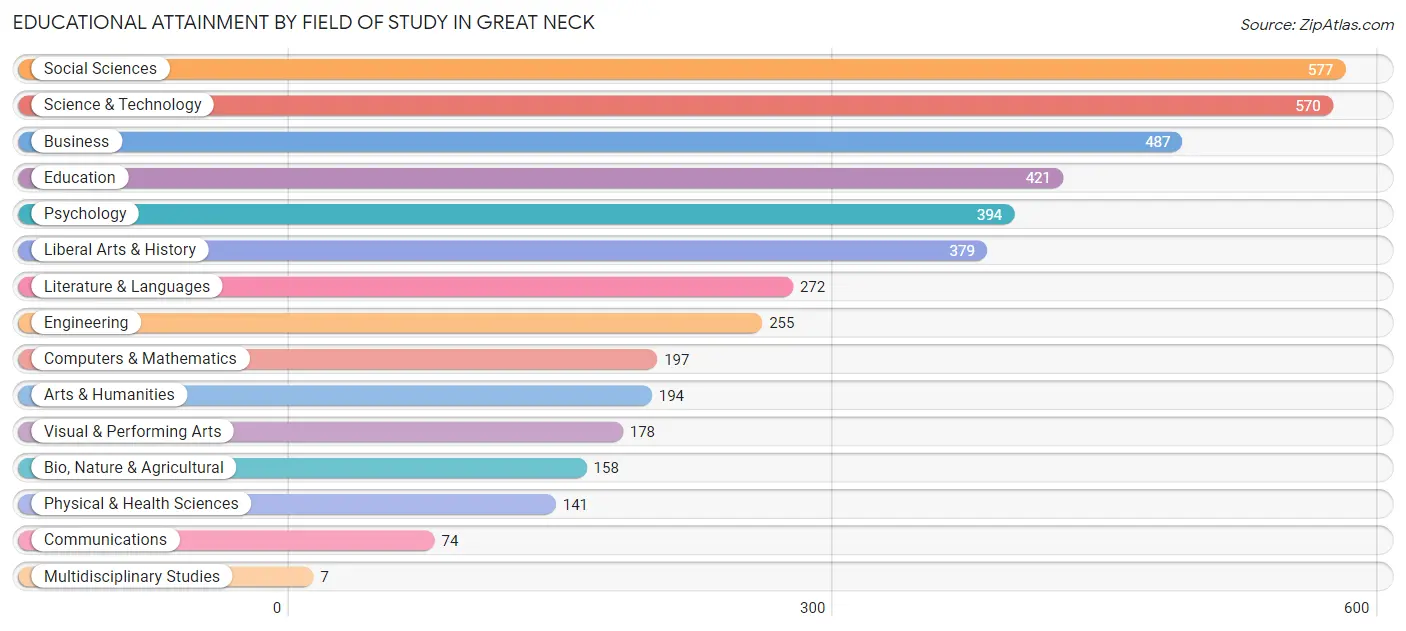
Educational Attainment by Field of Study in Great Neck
Social sciences (577 | 13.4%), science & technology (570 | 13.2%), business (487 | 11.3%), education (421 | 9.8%), and psychology (394 | 9.1%) are the most common fields of study among 4,304 individuals in Great Neck who have obtained a bachelor's degree or higher.
| Field of Study | # Graduates | % Graduates |
| Computers & Mathematics | 197 | 4.6% |
| Bio, Nature & Agricultural | 158 | 3.7% |
| Physical & Health Sciences | 141 | 3.3% |
| Psychology | 394 | 9.1% |
| Social Sciences | 577 | 13.4% |
| Engineering | 255 | 5.9% |
| Multidisciplinary Studies | 7 | 0.2% |
| Science & Technology | 570 | 13.2% |
| Business | 487 | 11.3% |
| Education | 421 | 9.8% |
| Literature & Languages | 272 | 6.3% |
| Liberal Arts & History | 379 | 8.8% |
| Visual & Performing Arts | 178 | 4.1% |
| Communications | 74 | 1.7% |
| Arts & Humanities | 194 | 4.5% |
| Total | 4,304 | 100.0% |
Transportation & Commute in Great Neck
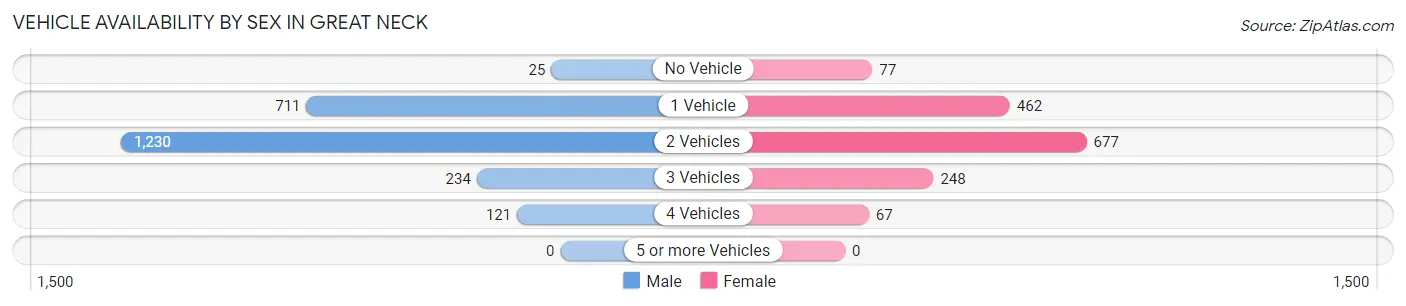
Vehicle Availability by Sex in Great Neck
The most prevalent vehicle ownership categories in Great Neck are males with 2 vehicles (1,230, accounting for 53.0%) and females with 2 vehicles (677, making up 80.3%).
| Vehicles Available | Male | Female |
| No Vehicle | 25 (1.1%) | 77 (5.0%) |
| 1 Vehicle | 711 (30.6%) | 462 (30.2%) |
| 2 Vehicles | 1,230 (53.0%) | 677 (44.2%) |
| 3 Vehicles | 234 (10.1%) | 248 (16.2%) |
| 4 Vehicles | 121 (5.2%) | 67 (4.4%) |
| 5 or more Vehicles | 0 (0.0%) | 0 (0.0%) |
| Total | 2,321 (100.0%) | 1,531 (100.0%) |
Commute Time in Great Neck
The most frequently occuring commute durations in Great Neck are 60 to 89 minutes (761 commuters, 22.2%), 30 to 34 minutes (490 commuters, 14.3%), and 45 to 59 minutes (417 commuters, 12.1%).
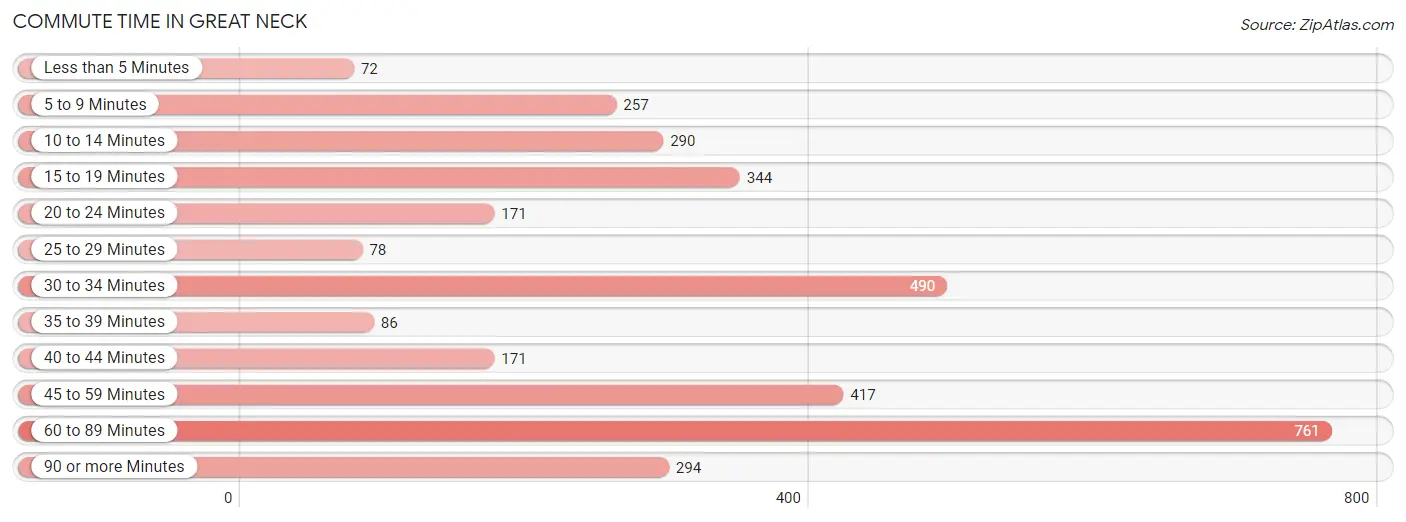
| Commute Time | # Commuters | % Commuters |
| Less than 5 Minutes | 72 | 2.1% |
| 5 to 9 Minutes | 257 | 7.5% |
| 10 to 14 Minutes | 290 | 8.5% |
| 15 to 19 Minutes | 344 | 10.0% |
| 20 to 24 Minutes | 171 | 5.0% |
| 25 to 29 Minutes | 78 | 2.3% |
| 30 to 34 Minutes | 490 | 14.3% |
| 35 to 39 Minutes | 86 | 2.5% |
| 40 to 44 Minutes | 171 | 5.0% |
| 45 to 59 Minutes | 417 | 12.1% |
| 60 to 89 Minutes | 761 | 22.2% |
| 90 or more Minutes | 294 | 8.6% |
Commute Time by Sex in Great Neck
The most common commute times in Great Neck are 60 to 89 minutes (632 commuters, 29.2%) for males and 30 to 34 minutes (168 commuters, 13.3%) for females.
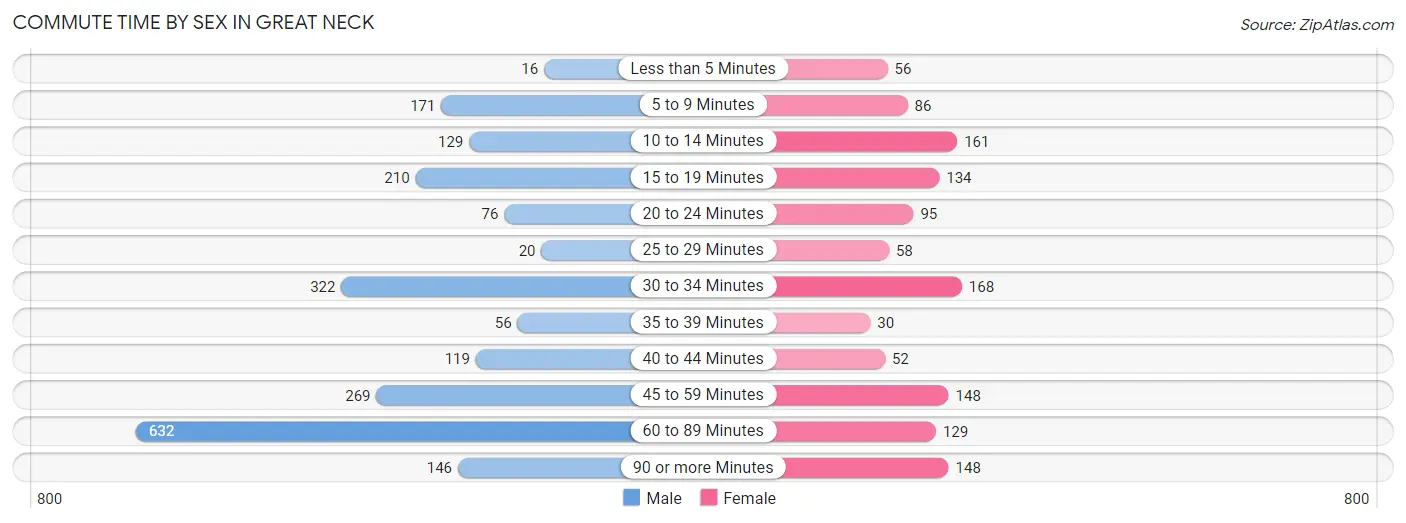
| Commute Time | Male | Female |
| Less than 5 Minutes | 16 (0.7%) | 56 (4.4%) |
| 5 to 9 Minutes | 171 (7.9%) | 86 (6.8%) |
| 10 to 14 Minutes | 129 (6.0%) | 161 (12.7%) |
| 15 to 19 Minutes | 210 (9.7%) | 134 (10.6%) |
| 20 to 24 Minutes | 76 (3.5%) | 95 (7.5%) |
| 25 to 29 Minutes | 20 (0.9%) | 58 (4.6%) |
| 30 to 34 Minutes | 322 (14.9%) | 168 (13.3%) |
| 35 to 39 Minutes | 56 (2.6%) | 30 (2.4%) |
| 40 to 44 Minutes | 119 (5.5%) | 52 (4.1%) |
| 45 to 59 Minutes | 269 (12.4%) | 148 (11.7%) |
| 60 to 89 Minutes | 632 (29.2%) | 129 (10.2%) |
| 90 or more Minutes | 146 (6.7%) | 148 (11.7%) |
Time of Departure to Work by Sex in Great Neck
The most frequent times of departure to work in Great Neck are 9:00 AM to 9:59 AM (517, 23.9%) for males and 7:30 AM to 7:59 AM (301, 23.8%) for females.
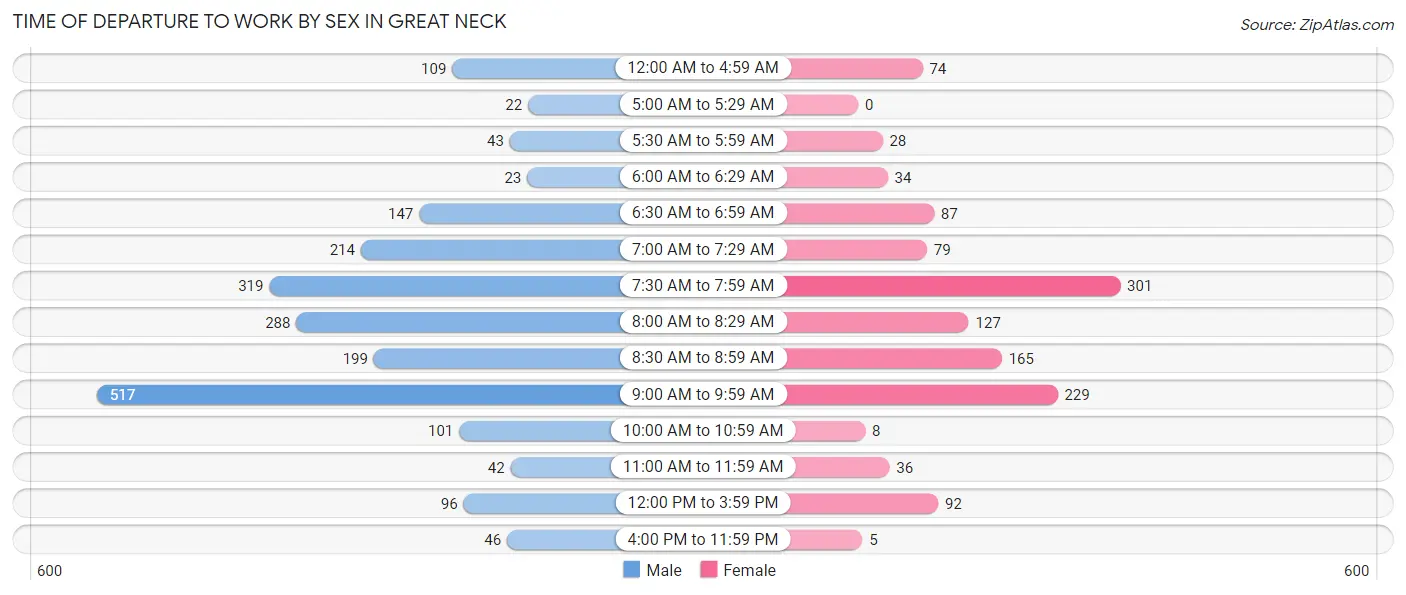
| Time of Departure | Male | Female |
| 12:00 AM to 4:59 AM | 109 (5.0%) | 74 (5.9%) |
| 5:00 AM to 5:29 AM | 22 (1.0%) | 0 (0.0%) |
| 5:30 AM to 5:59 AM | 43 (2.0%) | 28 (2.2%) |
| 6:00 AM to 6:29 AM | 23 (1.1%) | 34 (2.7%) |
| 6:30 AM to 6:59 AM | 147 (6.8%) | 87 (6.9%) |
| 7:00 AM to 7:29 AM | 214 (9.9%) | 79 (6.2%) |
| 7:30 AM to 7:59 AM | 319 (14.7%) | 301 (23.8%) |
| 8:00 AM to 8:29 AM | 288 (13.3%) | 127 (10.0%) |
| 8:30 AM to 8:59 AM | 199 (9.2%) | 165 (13.0%) |
| 9:00 AM to 9:59 AM | 517 (23.9%) | 229 (18.1%) |
| 10:00 AM to 10:59 AM | 101 (4.7%) | 8 (0.6%) |
| 11:00 AM to 11:59 AM | 42 (1.9%) | 36 (2.9%) |
| 12:00 PM to 3:59 PM | 96 (4.4%) | 92 (7.3%) |
| 4:00 PM to 11:59 PM | 46 (2.1%) | 5 (0.4%) |
| Total | 2,166 (100.0%) | 1,265 (100.0%) |
Housing Occupancy in Great Neck
Occupancy by Ownership in Great Neck
Of the total 3,300 dwellings in Great Neck, owner-occupied units account for 2,437 (73.9%), while renter-occupied units make up 863 (26.2%).
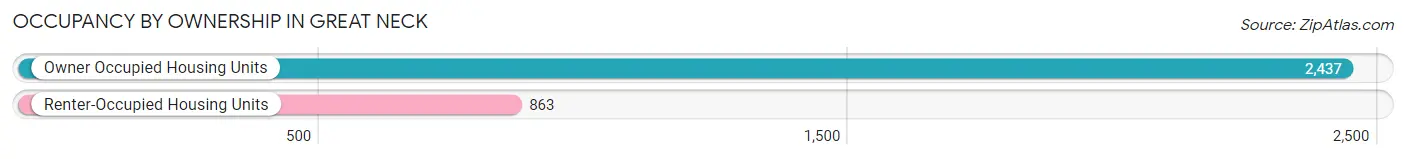
| Occupancy | # Housing Units | % Housing Units |
| Owner Occupied Housing Units | 2,437 | 73.9% |
| Renter-Occupied Housing Units | 863 | 26.2% |
| Total Occupied Housing Units | 3,300 | 100.0% |
Occupancy by Household Size in Great Neck
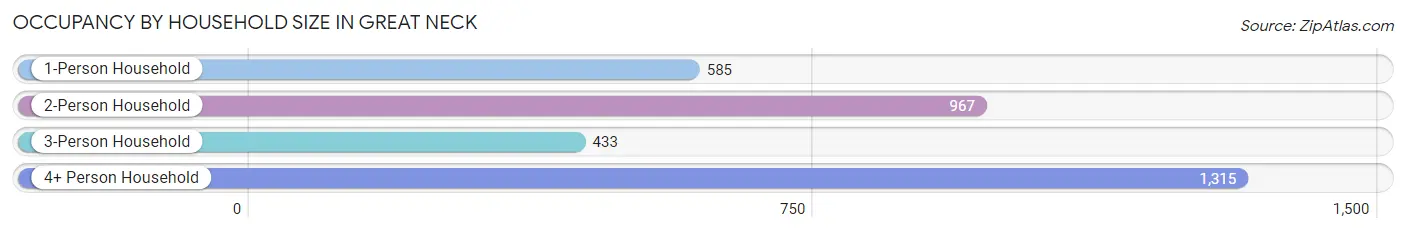
| Household Size | # Housing Units | % Housing Units |
| 1-Person Household | 585 | 17.7% |
| 2-Person Household | 967 | 29.3% |
| 3-Person Household | 433 | 13.1% |
| 4+ Person Household | 1,315 | 39.9% |
| Total Housing Units | 3,300 | 100.0% |
Occupancy by Ownership by Household Size in Great Neck
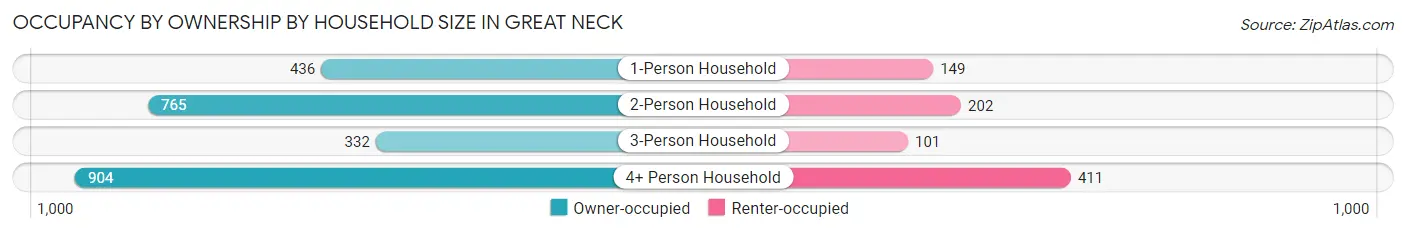
| Household Size | Owner-occupied | Renter-occupied |
| 1-Person Household | 436 (74.5%) | 149 (25.5%) |
| 2-Person Household | 765 (79.1%) | 202 (20.9%) |
| 3-Person Household | 332 (76.7%) | 101 (23.3%) |
| 4+ Person Household | 904 (68.8%) | 411 (31.2%) |
| Total Housing Units | 2,437 (73.9%) | 863 (26.2%) |
Occupancy by Educational Attainment in Great Neck
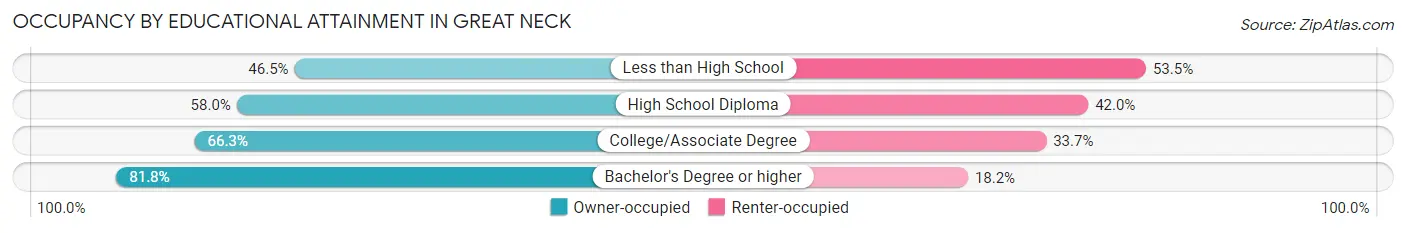
| Household Size | Owner-occupied | Renter-occupied |
| Less than High School | 120 (46.5%) | 138 (53.5%) |
| High School Diploma | 222 (58.0%) | 161 (42.0%) |
| College/Associate Degree | 342 (66.3%) | 174 (33.7%) |
| Bachelor's Degree or higher | 1,753 (81.8%) | 390 (18.2%) |
Occupancy by Age of Householder in Great Neck
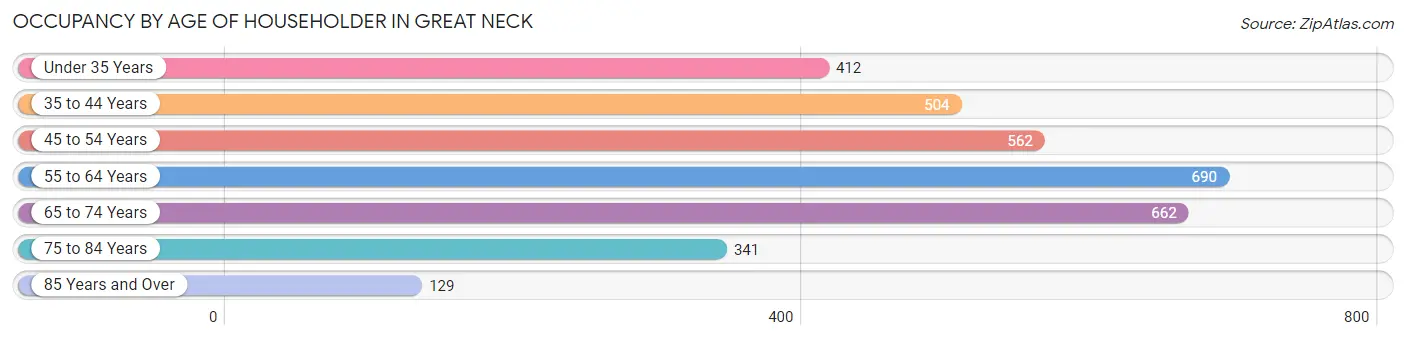
| Age Bracket | # Households | % Households |
| Under 35 Years | 412 | 12.5% |
| 35 to 44 Years | 504 | 15.3% |
| 45 to 54 Years | 562 | 17.0% |
| 55 to 64 Years | 690 | 20.9% |
| 65 to 74 Years | 662 | 20.1% |
| 75 to 84 Years | 341 | 10.3% |
| 85 Years and Over | 129 | 3.9% |
| Total | 3,300 | 100.0% |
Housing Finances in Great Neck
Median Income by Occupancy in Great Neck
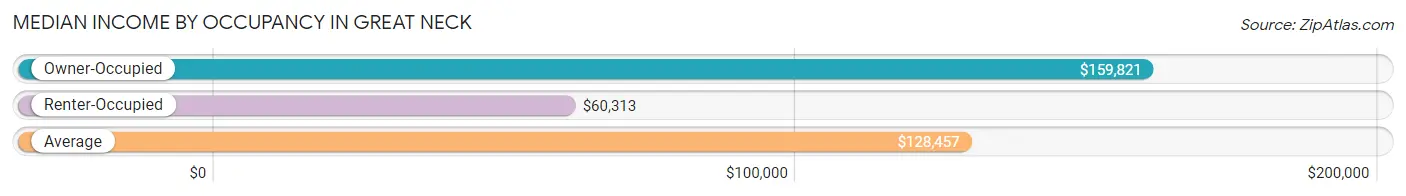
| Occupancy Type | # Households | Median Income |
| Owner-Occupied | 2,437 (73.9%) | $159,821 |
| Renter-Occupied | 863 (26.2%) | $60,313 |
| Average | 3,300 (100.0%) | $128,457 |
Occupancy by Householder Income Bracket in Great Neck
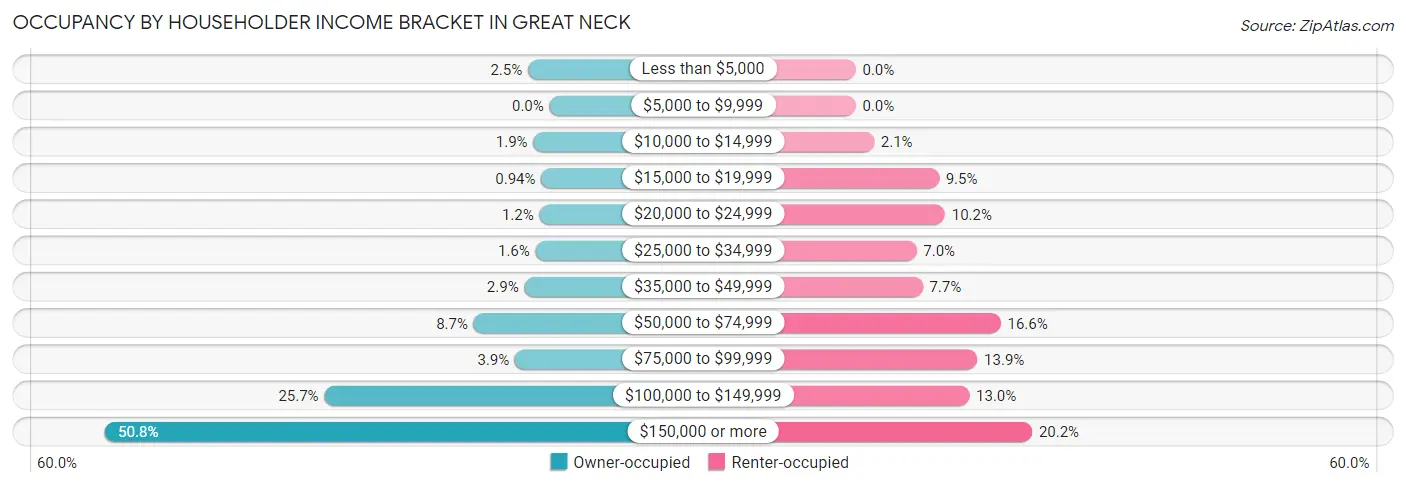
| Income Bracket | Owner-occupied | Renter-occupied |
| Less than $5,000 | 60 (2.5%) | 0 (0.0%) |
| $5,000 to $9,999 | 0 (0.0%) | 0 (0.0%) |
| $10,000 to $14,999 | 45 (1.8%) | 18 (2.1%) |
| $15,000 to $19,999 | 23 (0.9%) | 82 (9.5%) |
| $20,000 to $24,999 | 28 (1.1%) | 88 (10.2%) |
| $25,000 to $34,999 | 39 (1.6%) | 60 (7.0%) |
| $35,000 to $49,999 | 70 (2.9%) | 66 (7.6%) |
| $50,000 to $74,999 | 211 (8.7%) | 143 (16.6%) |
| $75,000 to $99,999 | 96 (3.9%) | 120 (13.9%) |
| $100,000 to $149,999 | 627 (25.7%) | 112 (13.0%) |
| $150,000 or more | 1,238 (50.8%) | 174 (20.2%) |
| Total | 2,437 (100.0%) | 863 (100.0%) |
Monthly Housing Cost Tiers in Great Neck
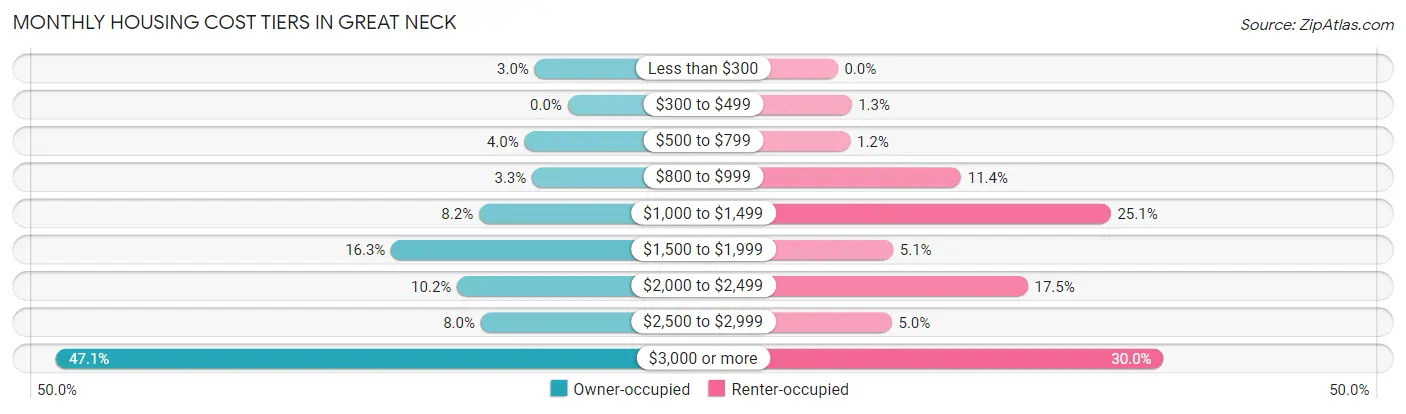
| Monthly Cost | Owner-occupied | Renter-occupied |
| Less than $300 | 74 (3.0%) | 0 (0.0%) |
| $300 to $499 | 0 (0.0%) | 11 (1.3%) |
| $500 to $799 | 97 (4.0%) | 10 (1.2%) |
| $800 to $999 | 80 (3.3%) | 98 (11.4%) |
| $1,000 to $1,499 | 199 (8.2%) | 217 (25.1%) |
| $1,500 to $1,999 | 396 (16.3%) | 44 (5.1%) |
| $2,000 to $2,499 | 248 (10.2%) | 151 (17.5%) |
| $2,500 to $2,999 | 195 (8.0%) | 43 (5.0%) |
| $3,000 or more | 1,148 (47.1%) | 259 (30.0%) |
| Total | 2,437 (100.0%) | 863 (100.0%) |
Physical Housing Characteristics in Great Neck
Housing Structures in Great Neck
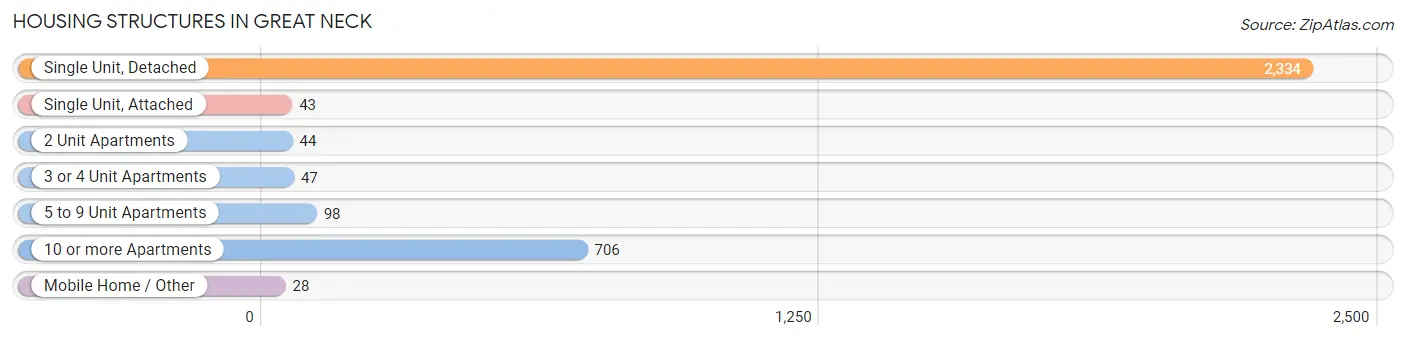
| Structure Type | # Housing Units | % Housing Units |
| Single Unit, Detached | 2,334 | 70.7% |
| Single Unit, Attached | 43 | 1.3% |
| 2 Unit Apartments | 44 | 1.3% |
| 3 or 4 Unit Apartments | 47 | 1.4% |
| 5 to 9 Unit Apartments | 98 | 3.0% |
| 10 or more Apartments | 706 | 21.4% |
| Mobile Home / Other | 28 | 0.9% |
| Total | 3,300 | 100.0% |
Housing Structures by Occupancy in Great Neck
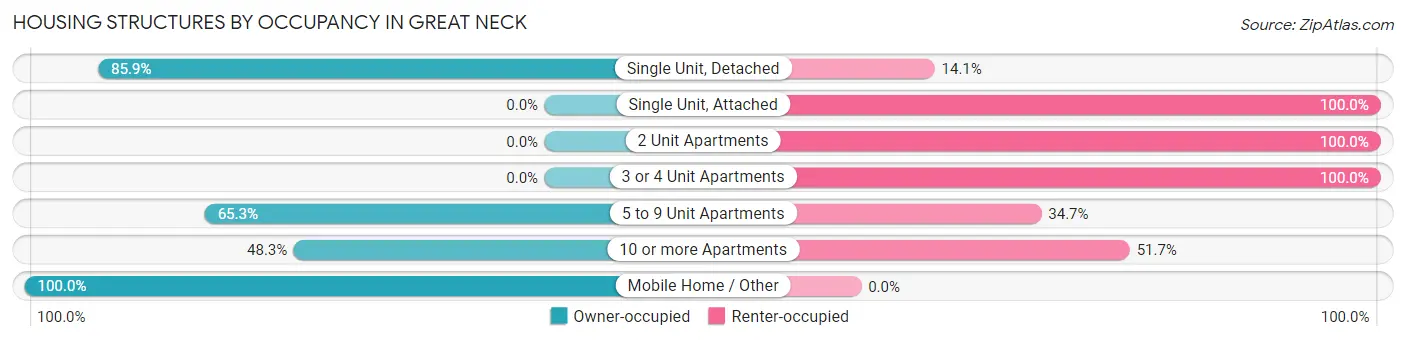
| Structure Type | Owner-occupied | Renter-occupied |
| Single Unit, Detached | 2,004 (85.9%) | 330 (14.1%) |
| Single Unit, Attached | 0 (0.0%) | 43 (100.0%) |
| 2 Unit Apartments | 0 (0.0%) | 44 (100.0%) |
| 3 or 4 Unit Apartments | 0 (0.0%) | 47 (100.0%) |
| 5 to 9 Unit Apartments | 64 (65.3%) | 34 (34.7%) |
| 10 or more Apartments | 341 (48.3%) | 365 (51.7%) |
| Mobile Home / Other | 28 (100.0%) | 0 (0.0%) |
| Total | 2,437 (73.9%) | 863 (26.2%) |
Housing Structures by Number of Rooms in Great Neck
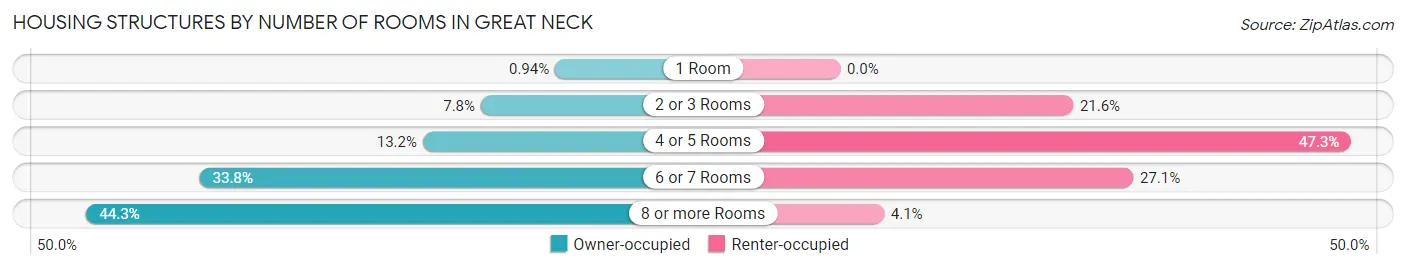
| Number of Rooms | Owner-occupied | Renter-occupied |
| 1 Room | 23 (0.9%) | 0 (0.0%) |
| 2 or 3 Rooms | 190 (7.8%) | 186 (21.5%) |
| 4 or 5 Rooms | 321 (13.2%) | 408 (47.3%) |
| 6 or 7 Rooms | 824 (33.8%) | 234 (27.1%) |
| 8 or more Rooms | 1,079 (44.3%) | 35 (4.1%) |
| Total | 2,437 (100.0%) | 863 (100.0%) |
Housing Structure by Heating Type in Great Neck
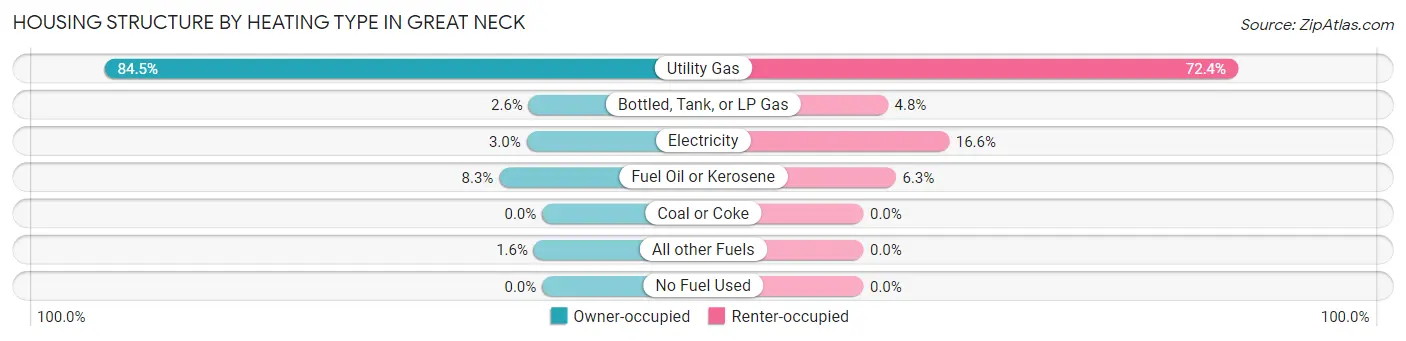
| Heating Type | Owner-occupied | Renter-occupied |
| Utility Gas | 2,060 (84.5%) | 625 (72.4%) |
| Bottled, Tank, or LP Gas | 63 (2.6%) | 41 (4.8%) |
| Electricity | 73 (3.0%) | 143 (16.6%) |
| Fuel Oil or Kerosene | 202 (8.3%) | 54 (6.3%) |
| Coal or Coke | 0 (0.0%) | 0 (0.0%) |
| All other Fuels | 39 (1.6%) | 0 (0.0%) |
| No Fuel Used | 0 (0.0%) | 0 (0.0%) |
| Total | 2,437 (100.0%) | 863 (100.0%) |
Household Vehicle Usage in Great Neck
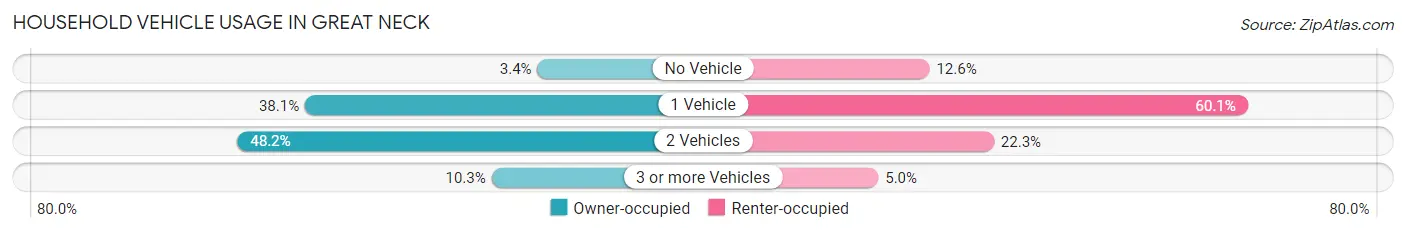
| Vehicles per Household | Owner-occupied | Renter-occupied |
| No Vehicle | 83 (3.4%) | 109 (12.6%) |
| 1 Vehicle | 929 (38.1%) | 519 (60.1%) |
| 2 Vehicles | 1,175 (48.2%) | 192 (22.3%) |
| 3 or more Vehicles | 250 (10.3%) | 43 (5.0%) |
| Total | 2,437 (100.0%) | 863 (100.0%) |
Real Estate & Mortgages in Great Neck
Real Estate and Mortgage Overview in Great Neck
| Characteristic | Without Mortgage | With Mortgage |
| Housing Units | 1,010 | 1,427 |
| Median Property Value | $917,700 | $993,400 |
| Median Household Income | $162,955 | $731 |
| Monthly Housing Costs | $1,501 | $1,013 |
| Real Estate Taxes | $10,001 | $44 |
Property Value by Mortgage Status in Great Neck
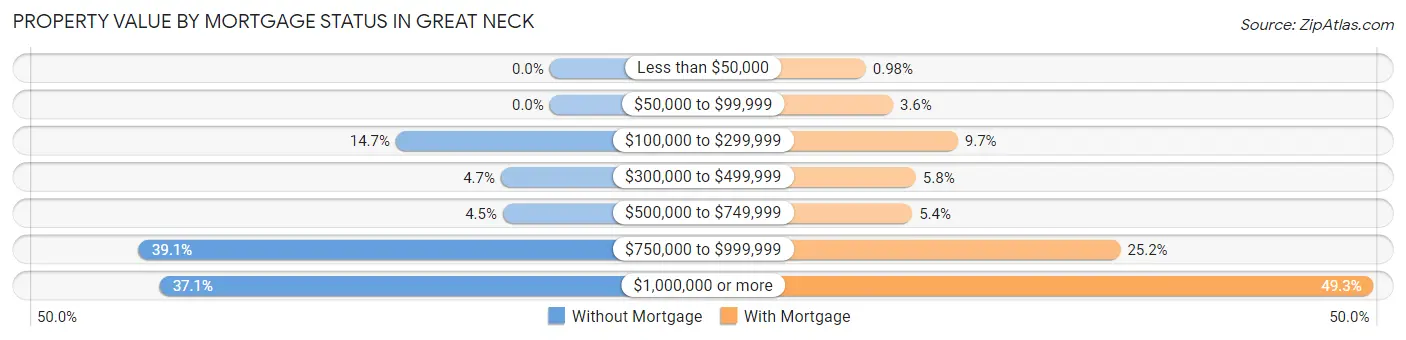
| Property Value | Without Mortgage | With Mortgage |
| Less than $50,000 | 0 (0.0%) | 14 (1.0%) |
| $50,000 to $99,999 | 0 (0.0%) | 51 (3.6%) |
| $100,000 to $299,999 | 148 (14.6%) | 139 (9.7%) |
| $300,000 to $499,999 | 47 (4.6%) | 82 (5.8%) |
| $500,000 to $749,999 | 45 (4.5%) | 77 (5.4%) |
| $750,000 to $999,999 | 395 (39.1%) | 360 (25.2%) |
| $1,000,000 or more | 375 (37.1%) | 704 (49.3%) |
| Total | 1,010 (100.0%) | 1,427 (100.0%) |
Household Income by Mortgage Status in Great Neck
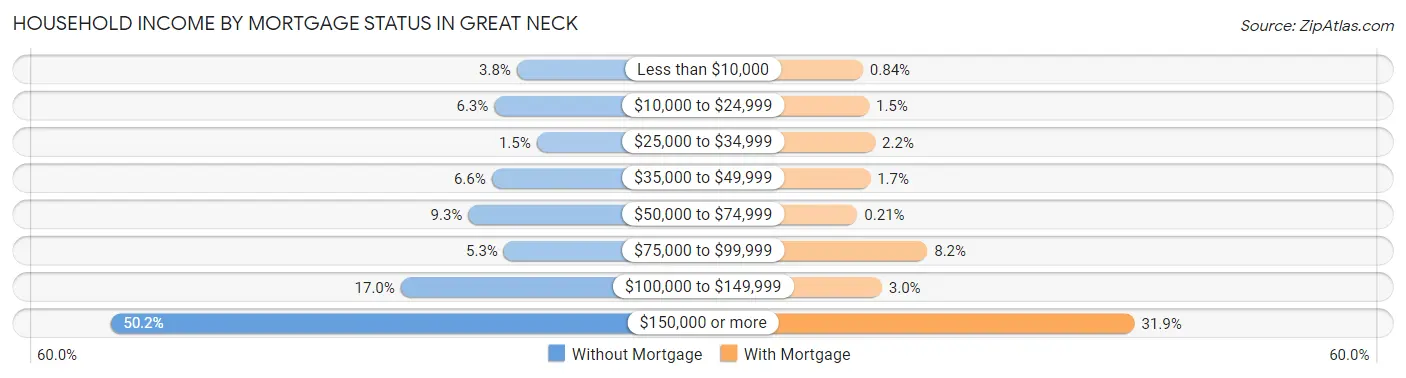
| Household Income | Without Mortgage | With Mortgage |
| Less than $10,000 | 38 (3.8%) | 12 (0.8%) |
| $10,000 to $24,999 | 64 (6.3%) | 22 (1.5%) |
| $25,000 to $34,999 | 15 (1.5%) | 32 (2.2%) |
| $35,000 to $49,999 | 67 (6.6%) | 24 (1.7%) |
| $50,000 to $74,999 | 94 (9.3%) | 3 (0.2%) |
| $75,000 to $99,999 | 53 (5.2%) | 117 (8.2%) |
| $100,000 to $149,999 | 172 (17.0%) | 43 (3.0%) |
| $150,000 or more | 507 (50.2%) | 455 (31.9%) |
| Total | 1,010 (100.0%) | 1,427 (100.0%) |
Property Value to Household Income Ratio in Great Neck
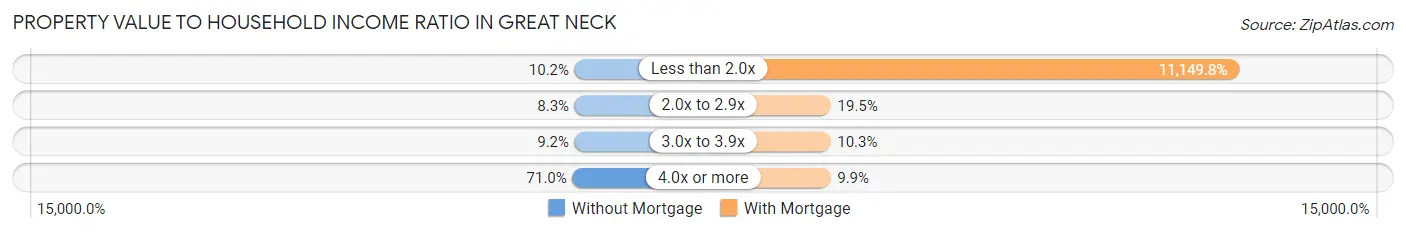
| Value-to-Income Ratio | Without Mortgage | With Mortgage |
| Less than 2.0x | 103 (10.2%) | 159,107 (11,149.8%) |
| 2.0x to 2.9x | 84 (8.3%) | 278 (19.5%) |
| 3.0x to 3.9x | 93 (9.2%) | 147 (10.3%) |
| 4.0x or more | 717 (71.0%) | 141 (9.9%) |
| Total | 1,010 (100.0%) | 1,427 (100.0%) |
Real Estate Taxes by Mortgage Status in Great Neck

| Property Taxes | Without Mortgage | With Mortgage |
| Less than $800 | 0 (0.0%) | 0 (0.0%) |
| $800 to $1,499 | 0 (0.0%) | 71 (5.0%) |
| $800 to $1,499 | 914 (90.5%) | 40 (2.8%) |
| Total | 1,010 (100.0%) | 1,427 (100.0%) |
Health & Disability in Great Neck
Health Insurance Coverage by Age in Great Neck
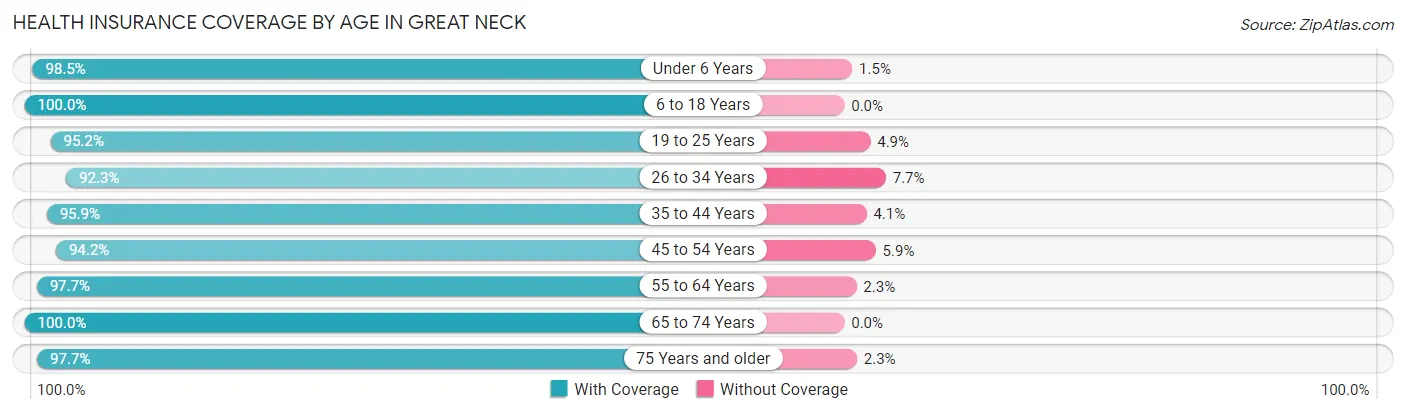
| Age Bracket | With Coverage | Without Coverage |
| Under 6 Years | 1,671 (98.5%) | 25 (1.5%) |
| 6 to 18 Years | 2,302 (100.0%) | 0 (0.0%) |
| 19 to 25 Years | 490 (95.2%) | 25 (4.9%) |
| 26 to 34 Years | 1,061 (92.3%) | 89 (7.7%) |
| 35 to 44 Years | 1,091 (95.9%) | 47 (4.1%) |
| 45 to 54 Years | 1,014 (94.2%) | 63 (5.9%) |
| 55 to 64 Years | 1,167 (97.7%) | 27 (2.3%) |
| 65 to 74 Years | 1,175 (100.0%) | 0 (0.0%) |
| 75 Years and older | 794 (97.7%) | 19 (2.3%) |
| Total | 10,765 (97.3%) | 295 (2.7%) |
Health Insurance Coverage by Citizenship Status in Great Neck

| Citizenship Status | With Coverage | Without Coverage |
| Native Born | 1,671 (98.5%) | 25 (1.5%) |
| Foreign Born, Citizen | 2,302 (100.0%) | 0 (0.0%) |
| Foreign Born, not a Citizen | 490 (95.2%) | 25 (4.9%) |
Health Insurance Coverage by Household Income in Great Neck
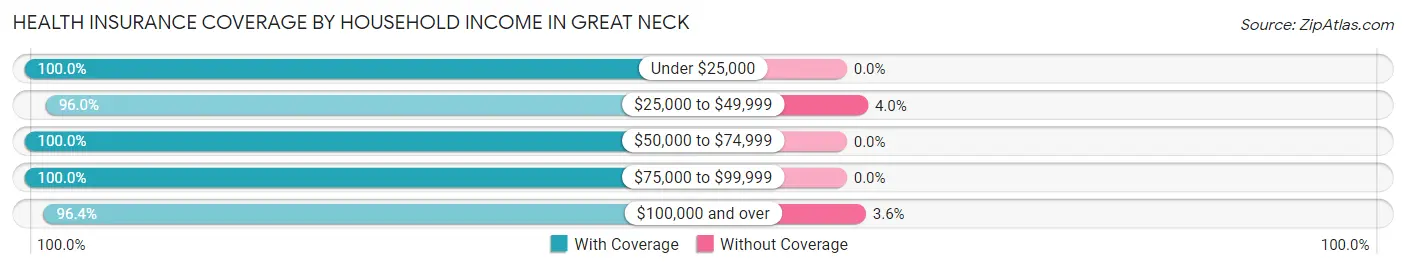
| Household Income | With Coverage | Without Coverage |
| Under $25,000 | 901 (100.0%) | 0 (0.0%) |
| $25,000 to $49,999 | 631 (96.0%) | 26 (4.0%) |
| $50,000 to $74,999 | 1,237 (100.0%) | 0 (0.0%) |
| $75,000 to $99,999 | 716 (100.0%) | 0 (0.0%) |
| $100,000 and over | 7,256 (96.4%) | 269 (3.6%) |
Public vs Private Health Insurance Coverage by Age in Great Neck
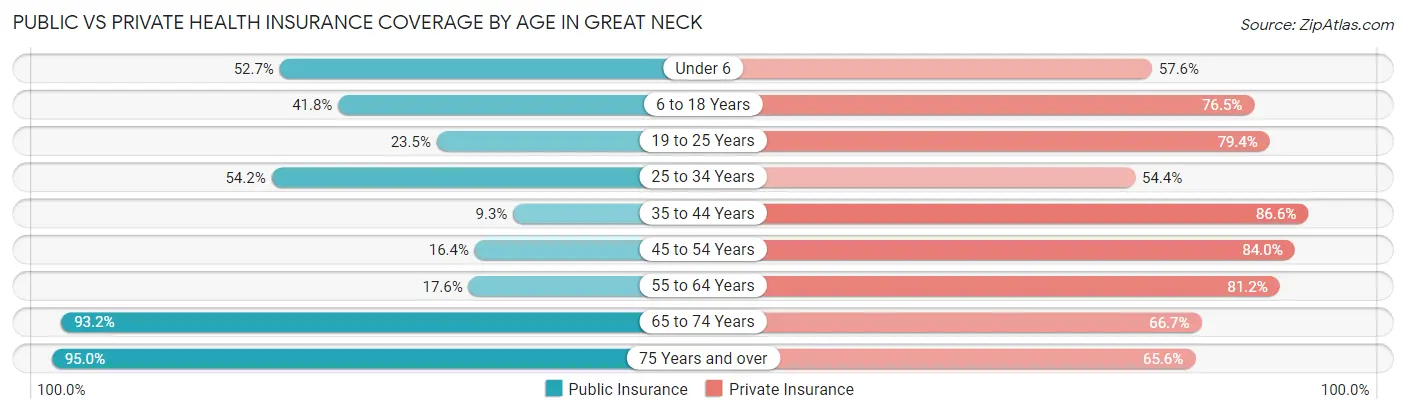
| Age Bracket | Public Insurance | Private Insurance |
| Under 6 | 893 (52.6%) | 976 (57.6%) |
| 6 to 18 Years | 962 (41.8%) | 1,762 (76.5%) |
| 19 to 25 Years | 121 (23.5%) | 409 (79.4%) |
| 25 to 34 Years | 623 (54.2%) | 626 (54.4%) |
| 35 to 44 Years | 106 (9.3%) | 985 (86.6%) |
| 45 to 54 Years | 177 (16.4%) | 905 (84.0%) |
| 55 to 64 Years | 210 (17.6%) | 970 (81.2%) |
| 65 to 74 Years | 1,095 (93.2%) | 784 (66.7%) |
| 75 Years and over | 772 (95.0%) | 533 (65.6%) |
| Total | 4,959 (44.8%) | 7,950 (71.9%) |
Disability Status by Sex by Age in Great Neck
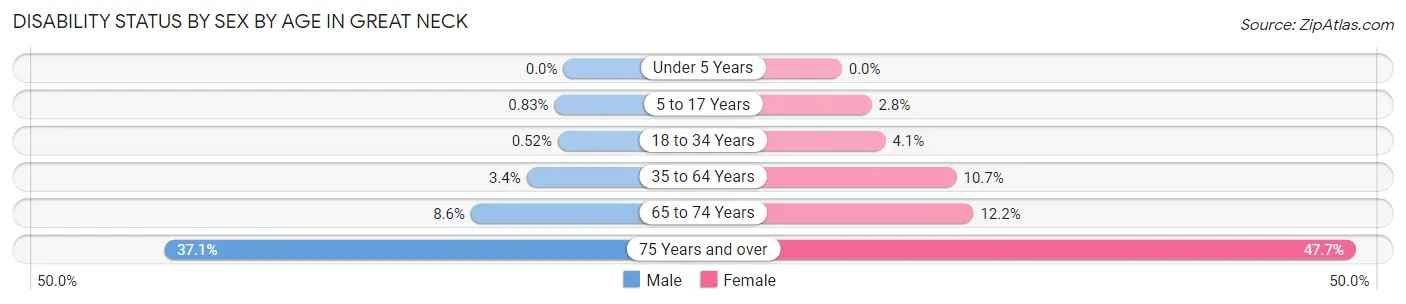
| Age Bracket | Male | Female |
| Under 5 Years | 0 (0.0%) | 0 (0.0%) |
| 5 to 17 Years | 12 (0.8%) | 34 (2.8%) |
| 18 to 34 Years | 4 (0.5%) | 38 (4.1%) |
| 35 to 64 Years | 58 (3.4%) | 182 (10.6%) |
| 65 to 74 Years | 44 (8.6%) | 81 (12.2%) |
| 75 Years and over | 149 (37.1%) | 196 (47.7%) |
Disability Class by Sex by Age in Great Neck
Disability Class: Hearing Difficulty
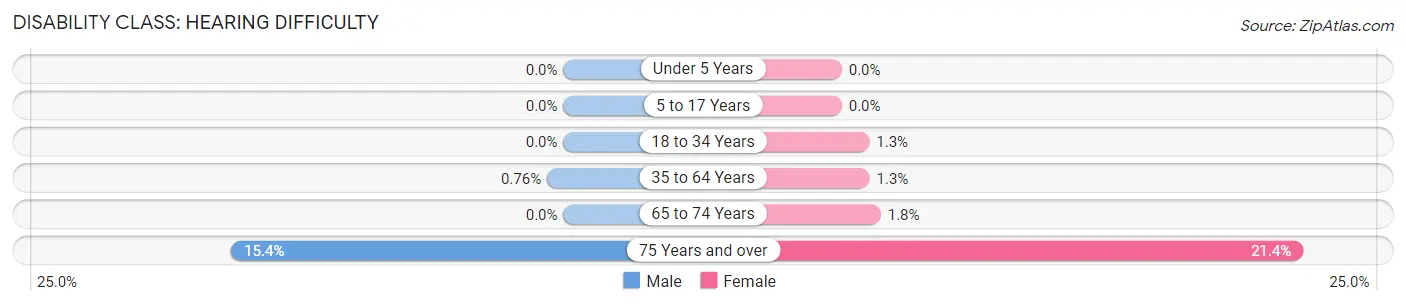
| Age Bracket | Male | Female |
| Under 5 Years | 0 (0.0%) | 0 (0.0%) |
| 5 to 17 Years | 0 (0.0%) | 0 (0.0%) |
| 18 to 34 Years | 0 (0.0%) | 12 (1.3%) |
| 35 to 64 Years | 13 (0.8%) | 22 (1.3%) |
| 65 to 74 Years | 0 (0.0%) | 12 (1.8%) |
| 75 Years and over | 62 (15.4%) | 88 (21.4%) |
Disability Class: Vision Difficulty
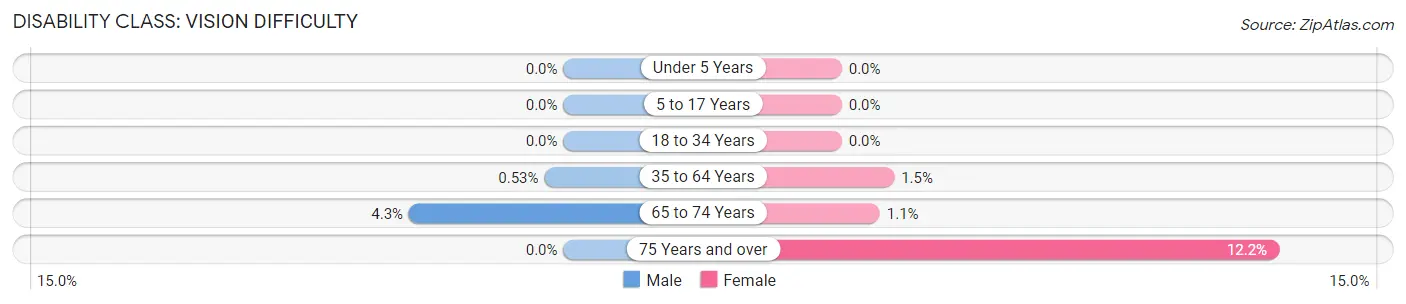
| Age Bracket | Male | Female |
| Under 5 Years | 0 (0.0%) | 0 (0.0%) |
| 5 to 17 Years | 0 (0.0%) | 0 (0.0%) |
| 18 to 34 Years | 0 (0.0%) | 0 (0.0%) |
| 35 to 64 Years | 9 (0.5%) | 25 (1.5%) |
| 65 to 74 Years | 22 (4.3%) | 7 (1.1%) |
| 75 Years and over | 0 (0.0%) | 50 (12.2%) |
Disability Class: Cognitive Difficulty
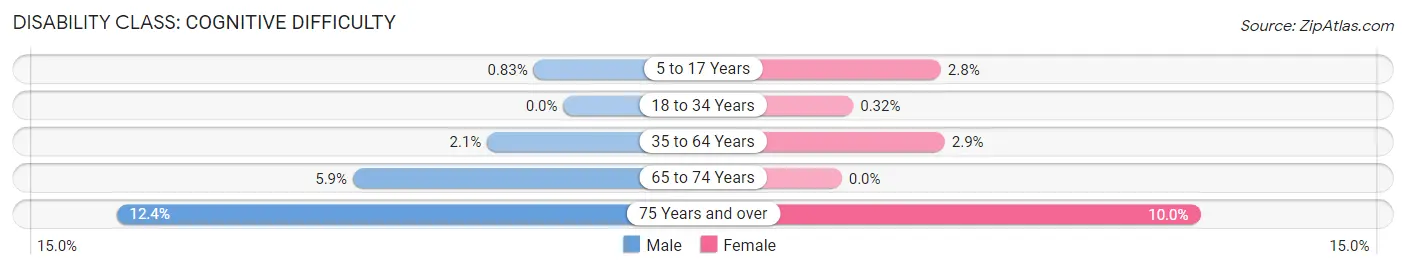
| Age Bracket | Male | Female |
| 5 to 17 Years | 12 (0.8%) | 34 (2.8%) |
| 18 to 34 Years | 0 (0.0%) | 3 (0.3%) |
| 35 to 64 Years | 36 (2.1%) | 49 (2.9%) |
| 65 to 74 Years | 30 (5.9%) | 0 (0.0%) |
| 75 Years and over | 50 (12.4%) | 41 (10.0%) |
Disability Class: Ambulatory Difficulty
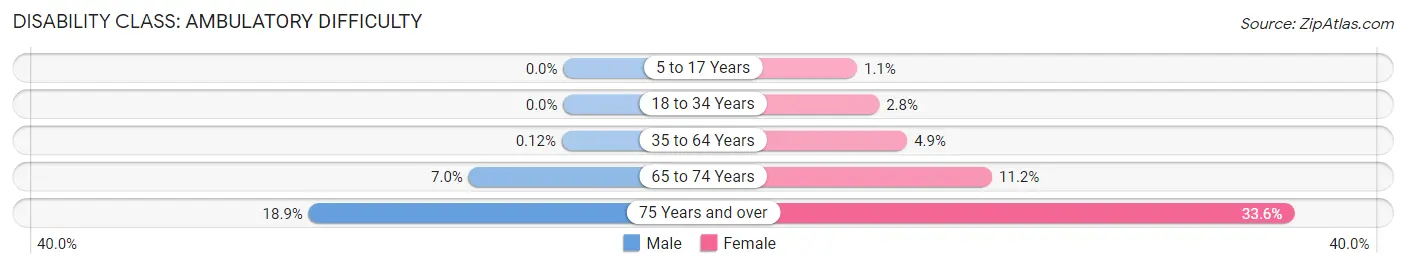
| Age Bracket | Male | Female |
| 5 to 17 Years | 0 (0.0%) | 14 (1.1%) |
| 18 to 34 Years | 0 (0.0%) | 26 (2.8%) |
| 35 to 64 Years | 2 (0.1%) | 83 (4.9%) |
| 65 to 74 Years | 36 (7.0%) | 74 (11.2%) |
| 75 Years and over | 76 (18.9%) | 138 (33.6%) |
Disability Class: Self-Care Difficulty
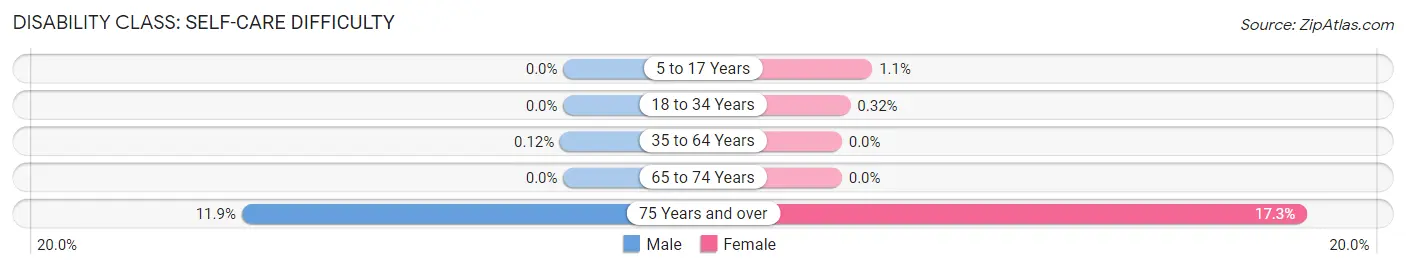
| Age Bracket | Male | Female |
| 5 to 17 Years | 0 (0.0%) | 14 (1.1%) |
| 18 to 34 Years | 0 (0.0%) | 3 (0.3%) |
| 35 to 64 Years | 2 (0.1%) | 0 (0.0%) |
| 65 to 74 Years | 0 (0.0%) | 0 (0.0%) |
| 75 Years and over | 48 (11.9%) | 71 (17.3%) |
Technology Access in Great Neck
Computing Device Access in Great Neck
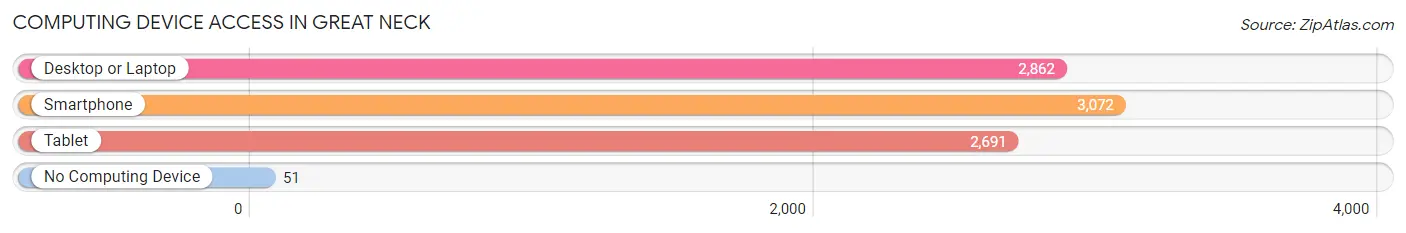
| Device Type | # Households | % Households |
| Desktop or Laptop | 2,862 | 86.7% |
| Smartphone | 3,072 | 93.1% |
| Tablet | 2,691 | 81.6% |
| No Computing Device | 51 | 1.5% |
| Total | 3,300 | 100.0% |
Internet Access in Great Neck
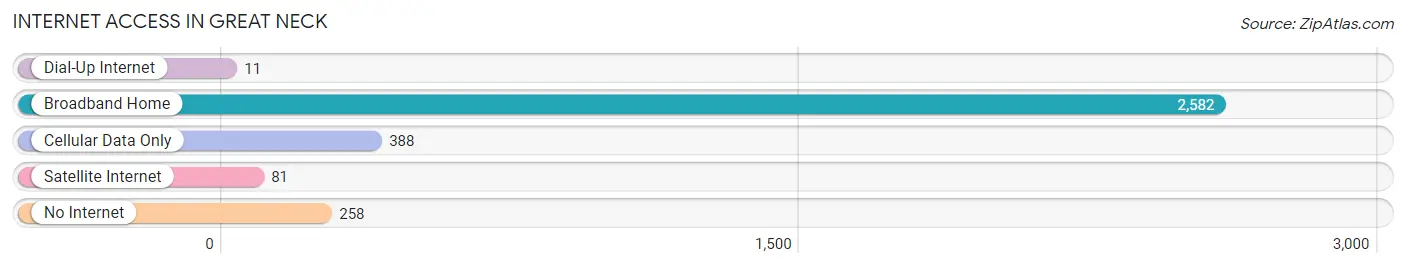
| Internet Type | # Households | % Households |
| Dial-Up Internet | 11 | 0.3% |
| Broadband Home | 2,582 | 78.2% |
| Cellular Data Only | 388 | 11.8% |
| Satellite Internet | 81 | 2.5% |
| No Internet | 258 | 7.8% |
| Total | 3,300 | 100.0% |
Great Neck Summary
History
Great Neck is a hamlet located in Nassau County, New York, on the North Shore of Long Island. It is part of the town of North Hempstead and is situated on the Great Neck Peninsula, which is bordered by Manhasset Bay to the north, Long Island Sound to the east, and Hempstead Harbor to the south. The area was originally inhabited by the Matinecock Native American tribe, who called it Menhaden Neck. The first European settlers arrived in the area in the 1640s, and the area was officially established as the town of Great Neck in 1784.
The area was originally a farming community, but in the late 19th century, it began to attract wealthy New Yorkers who built large estates and mansions. The area was also home to a number of prominent figures, including F. Scott Fitzgerald, who wrote The Great Gatsby while living in Great Neck.
In the early 20th century, the area began to develop rapidly, with the construction of the Long Island Rail Road and the opening of the Great Neck Plaza shopping center in 1926. The area continued to grow throughout the 20th century, and today it is a vibrant and diverse community.
Geography
Great Neck is located on the Great Neck Peninsula, which is bordered by Manhasset Bay to the north, Long Island Sound to the east, and Hempstead Harbor to the south. The peninsula is approximately 8 miles long and 2 miles wide, and is divided into two villages: Great Neck and Great Neck Estates. The area is mostly flat, with some hills in the northern part of the peninsula.
The area is home to several parks, including Steppingstone Park, which is located on the waterfront and features a playground, picnic area, and boat launch. The Great Neck Historical Society also operates a museum in the area, which features exhibits on the history of the area.
Economy
Great Neck is a largely residential community, but it is also home to a number of businesses and industries. The area is home to a number of corporate headquarters, including the headquarters of the North Shore-Long Island Jewish Health System, which is the largest health system in the region. The area is also home to a number of retail stores, restaurants, and other businesses.
The area is also home to a number of educational institutions, including the Great Neck Public Schools, which serve the area's students from kindergarten through 12th grade. The area is also home to a number of private schools, including the Great Neck School of Music and the Great Neck Chinese School.
Demographics
As of the 2010 census, the population of Great Neck was 9,989. The population is largely white (83.3%), with a significant Asian population (11.3%). The median household income is $107,817, and the median home value is $817,000.
Great Neck is a diverse community, with a large Jewish population (25.3%) and a significant Chinese population (7.3%). The area is also home to a number of other ethnic groups, including Koreans (3.2%), Indians (2.2%), and Filipinos (1.2%).
Conclusion
Great Neck is a vibrant and diverse community located on the North Shore of Long Island. The area has a long and rich history, and it has grown and developed over the years to become a thriving residential and business community. The area is home to a number of corporate headquarters, educational institutions, and other businesses, and it is also home to a diverse population of people from a variety of backgrounds.
Common Questions
What is the Total Population of Great Neck?
Total Population of Great Neck is 11,060.
What is the Total Male Population of Great Neck?
Total Male Population of Great Neck is 5,738.
What is the Total Female Population of Great Neck?
Total Female Population of Great Neck is 5,322.
What is the Ratio of Males per 100 Females in Great Neck?
There are 107.82 Males per 100 Females in Great Neck.
What is the Ratio of Females per 100 Males in Great Neck?
There are 92.75 Females per 100 Males in Great Neck.
What is the Median Population Age in Great Neck?
Median Population Age in Great Neck is 33.4 Years.
What is the Average Family Size in Great Neck
Average Family Size in Great Neck is 3.8 People.
What is the Average Household Size in Great Neck
Average Household Size in Great Neck is 3.3 People.
What is Per Capita Income in Great Neck?
Per Capita income in Great Neck is $56,199.
What is the Median Family Income in Great Neck?
Median Family Income in Great Neck is $129,391.
What is the Median Household income in Great Neck?
Median Household Income in Great Neck is $128,457.
What is Income or Wage Gap in Great Neck?
Income or Wage Gap in Great Neck is 57.6%.
Women in Great Neck earn 42.4 cents for every dollar earned by a man.
What is Inequality or Gini Index in Great Neck?
Inequality or Gini Index in Great Neck is 0.48.
How Large is the Labor Force in Great Neck?
There are 4,208 People in the Labor Forcein in Great Neck.
What is the Percentage of People in the Labor Force in Great Neck?
56.7% of People are in the Labor Force in Great Neck.
What is the Unemployment Rate in Great Neck?
Unemployment Rate in Great Neck is 4.7%.