Manhasset, NY
Manhasset Map
Manhasset Overview
7,720
TOTAL POPULATION
3,754
MALE POPULATION
3,966
FEMALE POPULATION
94.65
MALES / 100 FEMALES
105.65
FEMALES / 100 MALES
44.2
MEDIAN AGE
3.4
AVG FAMILY SIZE
2.9
AVG HOUSEHOLD SIZE
$86,719
PER CAPITA INCOME
$210,680
AVG FAMILY INCOME
$156,959
AVG HOUSEHOLD INCOME
51.9%
WAGE / INCOME GAP [ % ]
48.1¢/ $1
WAGE / INCOME GAP [ $ ]
$20,241
FAMILY INCOME DEFICIT
0.55
INEQUALITY / GINI INDEX
3,747
LABOR FORCE [ PEOPLE ]
60.2%
PERCENT IN LABOR FORCE
0.6%
UNEMPLOYMENT RATE
Manhasset Zip Codes
Manhasset Area Codes
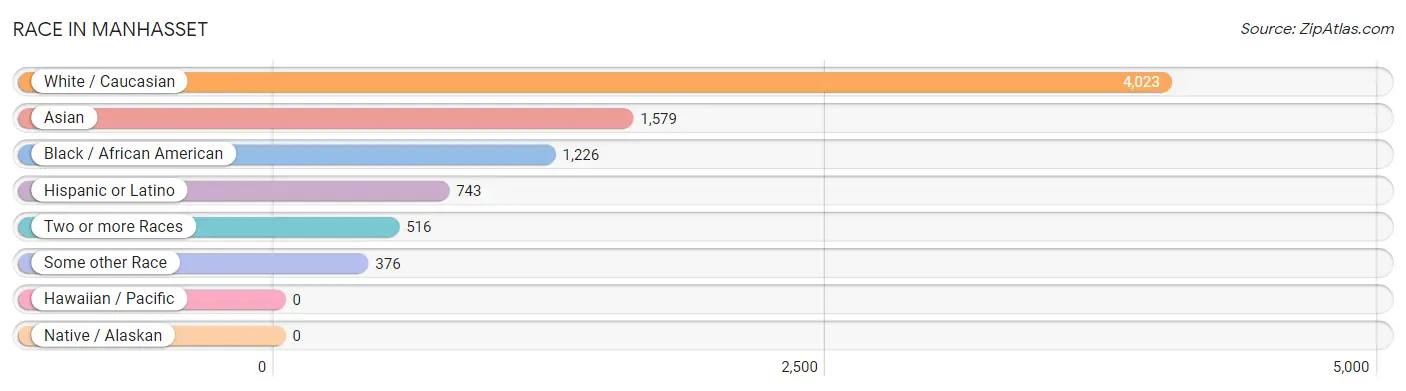
Race in Manhasset
The most populous races in Manhasset are White / Caucasian (4,023 | 52.1%), Asian (1,579 | 20.4%), and Black / African American (1,226 | 15.9%).
| Race | # Population | % Population |
| Asian | 1,579 | 20.4% |
| Black / African American | 1,226 | 15.9% |
| Hawaiian / Pacific | 0 | 0.0% |
| Hispanic or Latino | 743 | 9.6% |
| Native / Alaskan | 0 | 0.0% |
| White / Caucasian | 4,023 | 52.1% |
| Two or more Races | 516 | 6.7% |
| Some other Race | 376 | 4.9% |
| Total | 7,720 | 100.0% |
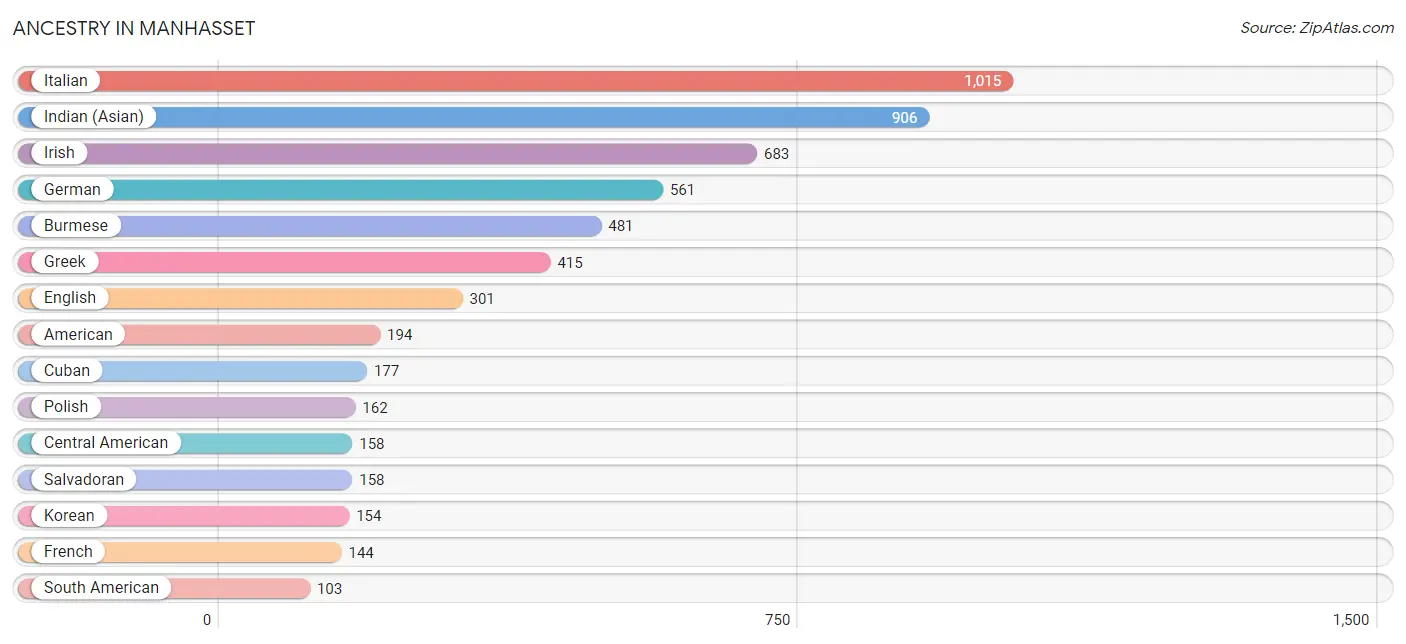
Ancestry in Manhasset
The most populous ancestries reported in Manhasset are Italian (1,015 | 13.2%), Indian (Asian) (906 | 11.7%), Irish (683 | 8.8%), German (561 | 7.3%), and Burmese (481 | 6.2%), together accounting for 47.2% of all Manhasset residents.
| Ancestry | # Population | % Population |
| African | 23 | 0.3% |
| Alsatian | 9 | 0.1% |
| American | 194 | 2.5% |
| Arab | 57 | 0.7% |
| Argentinean | 5 | 0.1% |
| Armenian | 37 | 0.5% |
| Austrian | 7 | 0.1% |
| Barbadian | 12 | 0.2% |
| Belgian | 7 | 0.1% |
| Bhutanese | 7 | 0.1% |
| British | 9 | 0.1% |
| Burmese | 481 | 6.2% |
| Central American | 158 | 2.1% |
| Colombian | 54 | 0.7% |
| Cuban | 177 | 2.3% |
| Czech | 36 | 0.5% |
| Czechoslovakian | 9 | 0.1% |
| Danish | 31 | 0.4% |
| Dominican | 52 | 0.7% |
| Eastern European | 28 | 0.4% |
| Egyptian | 9 | 0.1% |
| English | 301 | 3.9% |
| European | 90 | 1.2% |
| Filipino | 46 | 0.6% |
| French | 144 | 1.9% |
| French Canadian | 8 | 0.1% |
| German | 561 | 7.3% |
| Greek | 415 | 5.4% |
| Guyanese | 12 | 0.2% |
| Haitian | 21 | 0.3% |
| Hungarian | 27 | 0.4% |
| Indian (Asian) | 906 | 11.7% |
| Iranian | 99 | 1.3% |
| Iraqi | 48 | 0.6% |
| Irish | 683 | 8.8% |
| Israeli | 19 | 0.3% |
| Italian | 1,015 | 13.2% |
| Jamaican | 68 | 0.9% |
| Korean | 154 | 2.0% |
| Mexican | 65 | 0.8% |
| Northern European | 8 | 0.1% |
| Peruvian | 40 | 0.5% |
| Polish | 162 | 2.1% |
| Portuguese | 45 | 0.6% |
| Puerto Rican | 85 | 1.1% |
| Russian | 55 | 0.7% |
| Salvadoran | 158 | 2.1% |
| Scandinavian | 29 | 0.4% |
| Scottish | 59 | 0.8% |
| Slovak | 6 | 0.1% |
| South American | 103 | 1.3% |
| Spaniard | 33 | 0.4% |
| Subsaharan African | 23 | 0.3% |
| Swedish | 8 | 0.1% |
| Thai | 29 | 0.4% |
| Trinidadian and Tobagonian | 16 | 0.2% |
| Ukrainian | 24 | 0.3% |
| Venezuelan | 4 | 0.1% |
| Welsh | 26 | 0.3% | View All 59 Rows |
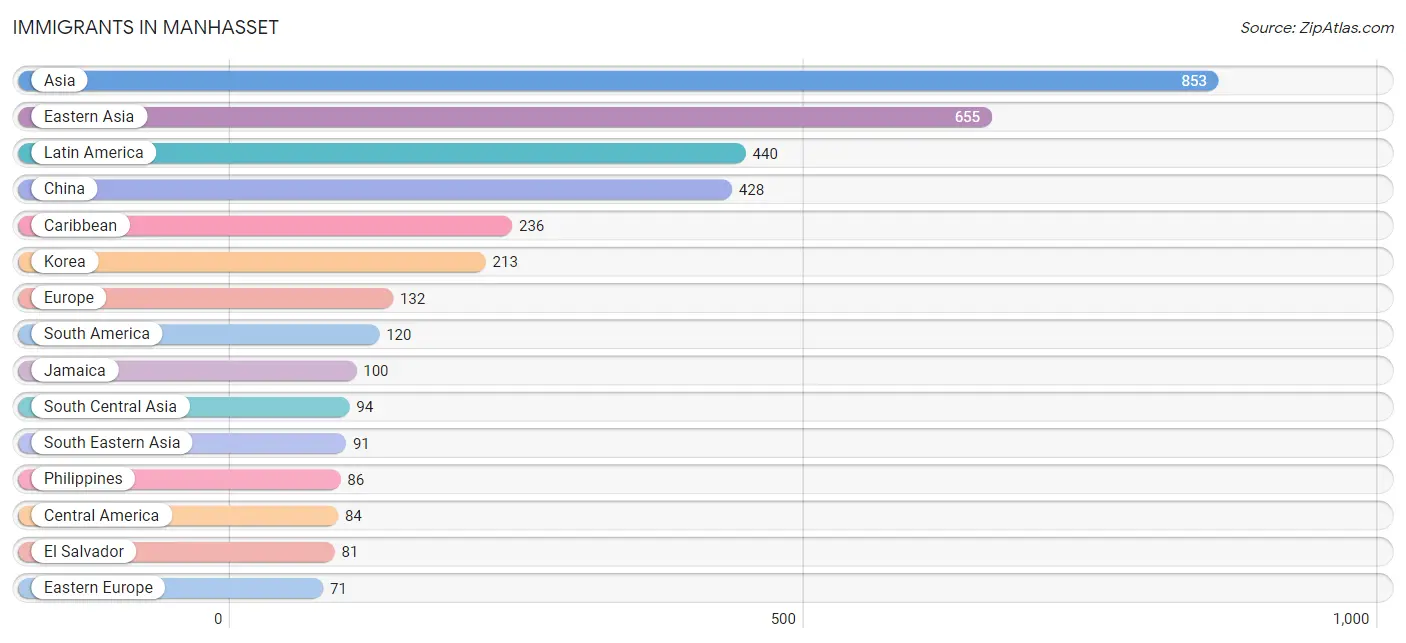
Immigrants in Manhasset
The most numerous immigrant groups reported in Manhasset came from Asia (853 | 11.1%), Eastern Asia (655 | 8.5%), Latin America (440 | 5.7%), China (428 | 5.5%), and Caribbean (236 | 3.1%), together accounting for 33.8% of all Manhasset residents.
| Immigration Origin | # Population | % Population |
| Africa | 17 | 0.2% |
| Argentina | 5 | 0.1% |
| Asia | 853 | 11.1% |
| Bahamas | 69 | 0.9% |
| Belarus | 13 | 0.2% |
| Caribbean | 236 | 3.1% |
| Central America | 84 | 1.1% |
| China | 428 | 5.5% |
| Colombia | 47 | 0.6% |
| Czechoslovakia | 36 | 0.5% |
| Dominican Republic | 37 | 0.5% |
| Eastern Asia | 655 | 8.5% |
| Eastern Europe | 71 | 0.9% |
| Egypt | 9 | 0.1% |
| El Salvador | 81 | 1.1% |
| Europe | 132 | 1.7% |
| Greece | 6 | 0.1% |
| Guyana | 24 | 0.3% |
| Haiti | 25 | 0.3% |
| Hong Kong | 48 | 0.6% |
| India | 57 | 0.7% |
| Iran | 21 | 0.3% |
| Italy | 46 | 0.6% |
| Jamaica | 100 | 1.3% |
| Japan | 14 | 0.2% |
| Korea | 213 | 2.8% |
| Latin America | 440 | 5.7% |
| Lebanon | 6 | 0.1% |
| Malaysia | 5 | 0.1% |
| Nepal | 16 | 0.2% |
| Nicaragua | 3 | 0.0% |
| Northern Africa | 17 | 0.2% |
| Northern Europe | 9 | 0.1% |
| Peru | 40 | 0.5% |
| Philippines | 86 | 1.1% |
| Russia | 22 | 0.3% |
| South America | 120 | 1.5% |
| South Central Asia | 94 | 1.2% |
| South Eastern Asia | 91 | 1.2% |
| Southern Europe | 52 | 0.7% |
| Taiwan | 46 | 0.6% |
| Trinidad and Tobago | 5 | 0.1% |
| Turkey | 7 | 0.1% |
| Venezuela | 4 | 0.1% |
| Western Asia | 13 | 0.2% | View All 45 Rows |
Sex and Age in Manhasset
Sex and Age in Manhasset
The most populous age groups in Manhasset are 45 to 49 Years (414 | 11.0%) for men and 15 to 19 Years (328 | 8.3%) for women.
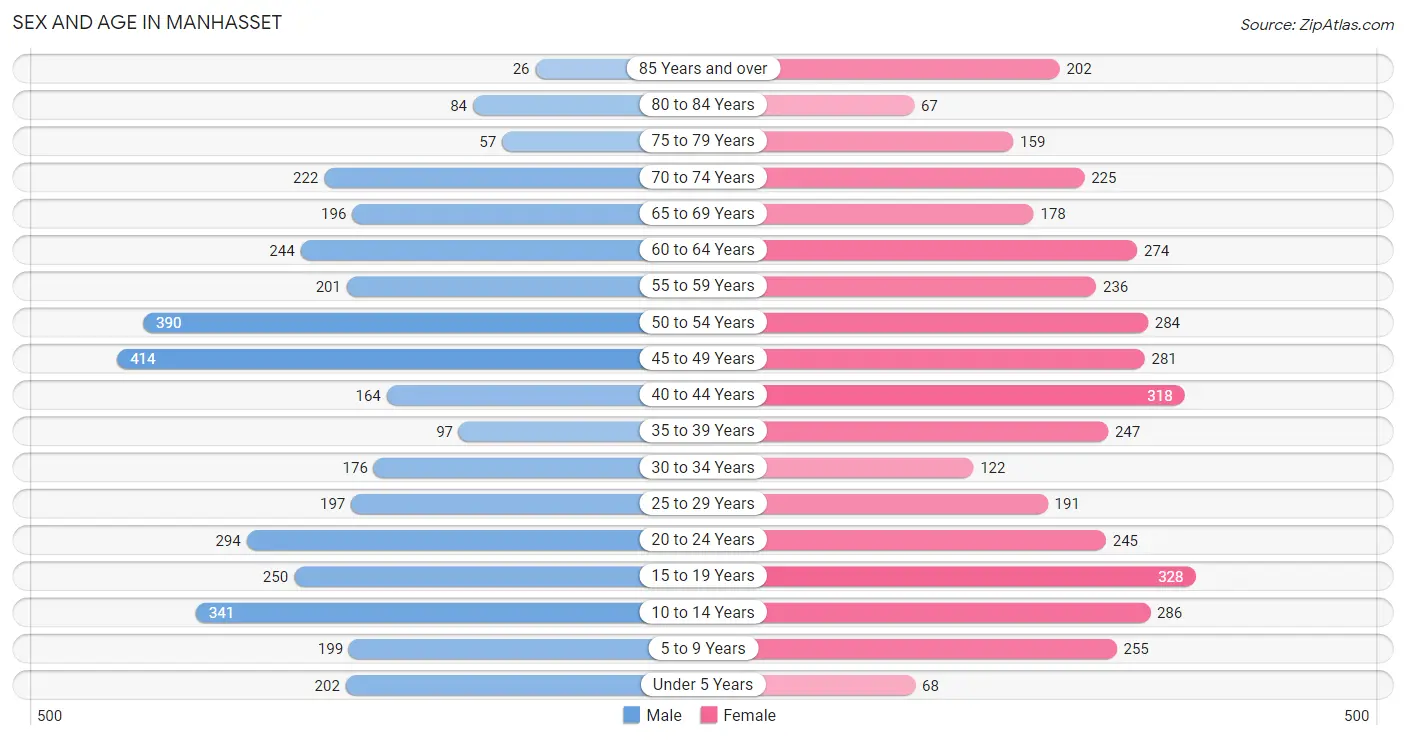
| Age Bracket | Male | Female |
| Under 5 Years | 202 (5.4%) | 68 (1.7%) |
| 5 to 9 Years | 199 (5.3%) | 255 (6.4%) |
| 10 to 14 Years | 341 (9.1%) | 286 (7.2%) |
| 15 to 19 Years | 250 (6.7%) | 328 (8.3%) |
| 20 to 24 Years | 294 (7.8%) | 245 (6.2%) |
| 25 to 29 Years | 197 (5.2%) | 191 (4.8%) |
| 30 to 34 Years | 176 (4.7%) | 122 (3.1%) |
| 35 to 39 Years | 97 (2.6%) | 247 (6.2%) |
| 40 to 44 Years | 164 (4.4%) | 318 (8.0%) |
| 45 to 49 Years | 414 (11.0%) | 281 (7.1%) |
| 50 to 54 Years | 390 (10.4%) | 284 (7.2%) |
| 55 to 59 Years | 201 (5.3%) | 236 (5.9%) |
| 60 to 64 Years | 244 (6.5%) | 274 (6.9%) |
| 65 to 69 Years | 196 (5.2%) | 178 (4.5%) |
| 70 to 74 Years | 222 (5.9%) | 225 (5.7%) |
| 75 to 79 Years | 57 (1.5%) | 159 (4.0%) |
| 80 to 84 Years | 84 (2.2%) | 67 (1.7%) |
| 85 Years and over | 26 (0.7%) | 202 (5.1%) |
| Total | 3,754 (100.0%) | 3,966 (100.0%) |
Families and Households in Manhasset
Median Family Size in Manhasset
The median family size in Manhasset is 3.39 persons per family, with married-couple families (1,626 | 82.5%) accounting for the largest median family size of 3.5 persons per family. On the other hand, single female/mother families (289 | 14.7%) represent the smallest median family size with 2.79 persons per family.
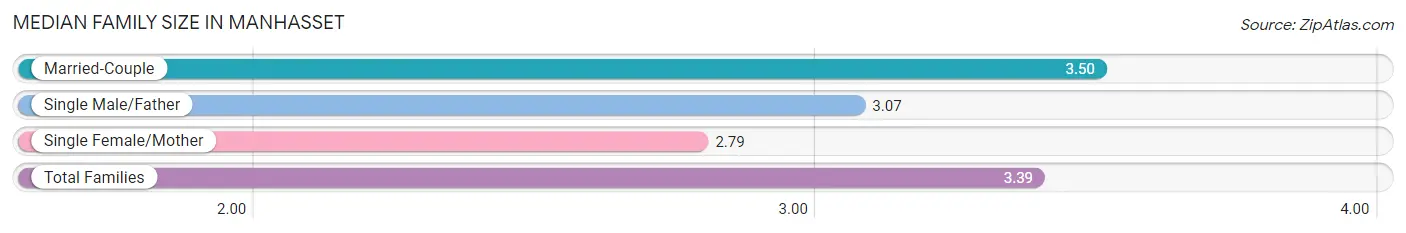
| Family Type | # Families | Family Size |
| Married-Couple | 1,626 (82.5%) | 3.50 |
| Single Male/Father | 55 (2.8%) | 3.07 |
| Single Female/Mother | 289 (14.7%) | 2.79 |
| Total Families | 1,970 (100.0%) | 3.39 |
Median Household Size in Manhasset
The median household size in Manhasset is 2.90 persons per household, with married-couple households (1,626 | 64.1%) accounting for the largest median household size of 3.51 persons per household. non-family households (567 | 22.4%) represent the smallest median household size with 1.11 persons per household.
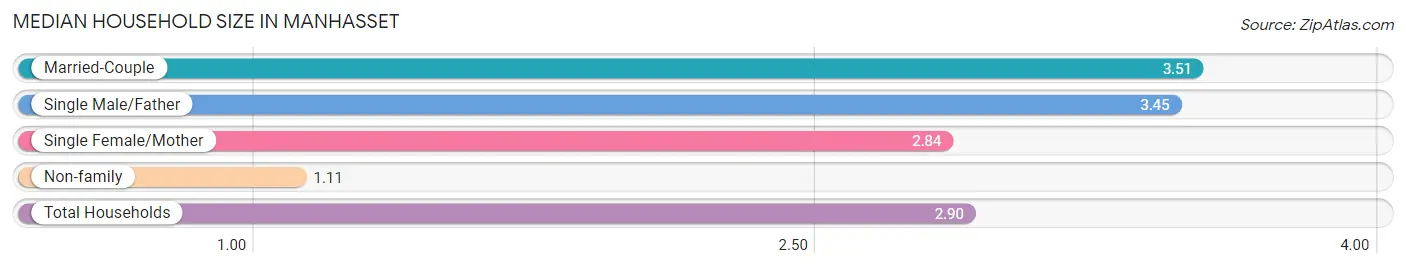
| Household Type | # Households | Household Size |
| Married-Couple | 1,626 (64.1%) | 3.51 |
| Single Male/Father | 55 (2.2%) | 3.45 |
| Single Female/Mother | 289 (11.4%) | 2.84 |
| Non-family | 567 (22.4%) | 1.11 |
| Total Households | 2,537 (100.0%) | 2.90 |
Household Size by Marriage Status in Manhasset
Out of a total of 2,537 households in Manhasset, 1,970 (77.6%) are family households, while 567 (22.4%) are nonfamily households. The most numerous type of family households are 2-person households, comprising 644, and the most common type of nonfamily households are 1-person households, comprising 521.
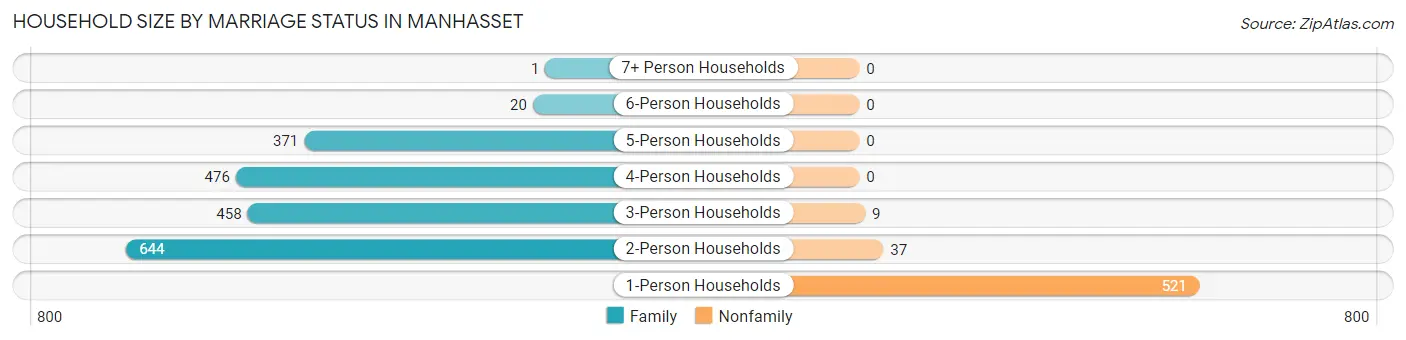
| Household Size | Family Households | Nonfamily Households |
| 1-Person Households | - | 521 (20.5%) |
| 2-Person Households | 644 (25.4%) | 37 (1.5%) |
| 3-Person Households | 458 (18.0%) | 9 (0.4%) |
| 4-Person Households | 476 (18.8%) | 0 (0.0%) |
| 5-Person Households | 371 (14.6%) | 0 (0.0%) |
| 6-Person Households | 20 (0.8%) | 0 (0.0%) |
| 7+ Person Households | 1 (0.0%) | 0 (0.0%) |
| Total | 1,970 (77.6%) | 567 (22.4%) |
Female Fertility in Manhasset
Fertility by Age in Manhasset
Average fertility rate in Manhasset is 18.0 births per 1,000 women. Women in the age bracket of 35 to 50 years have the highest fertility rate with 37.0 births per 1,000 women. Women in the age bracket of 35 to 50 years acount for 100.0% of all women with births.
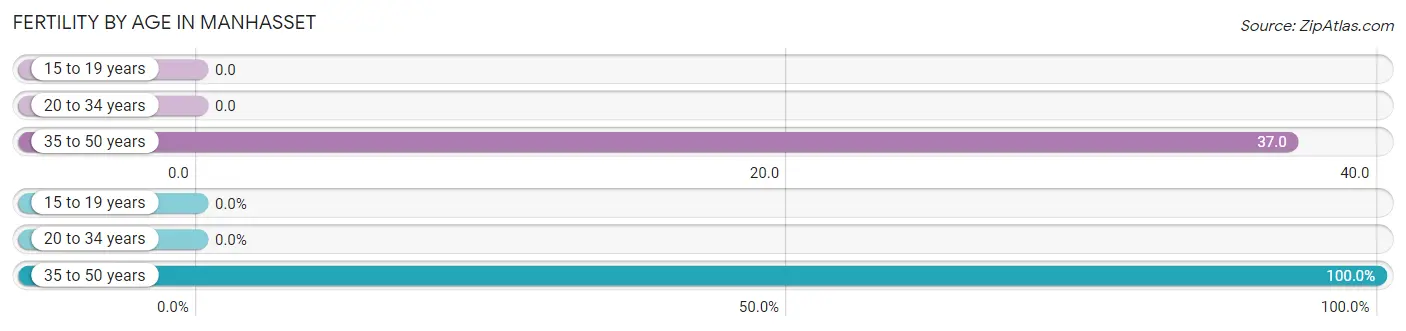
| Age Bracket | Women with Births | Births / 1,000 Women |
| 15 to 19 years | 0 (0.0%) | 0.0 |
| 20 to 34 years | 0 (0.0%) | 0.0 |
| 35 to 50 years | 32 (100.0%) | 37.0 |
| Total | 32 (100.0%) | 18.0 |
Fertility by Age by Marriage Status in Manhasset
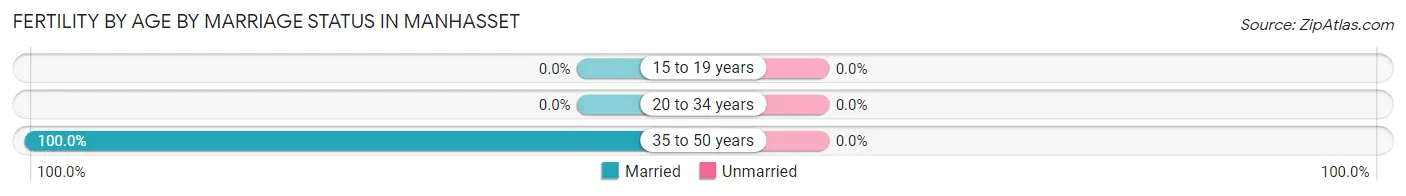
| Age Bracket | Married | Unmarried |
| 15 to 19 years | 0 (0.0%) | 0 (0.0%) |
| 20 to 34 years | 0 (0.0%) | 0 (0.0%) |
| 35 to 50 years | 32 (100.0%) | 0 (0.0%) |
| Total | 32 (100.0%) | 0 (0.0%) |
Fertility by Education in Manhasset
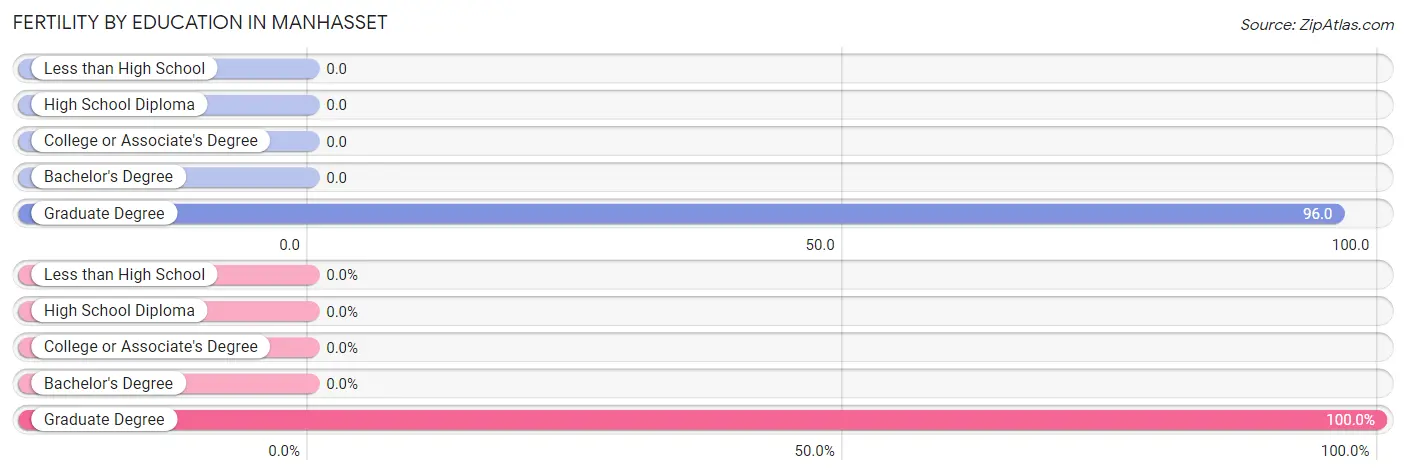
| Educational Attainment | Women with Births | Births / 1,000 Women |
| Less than High School | 0 (0.0%) | 0.0 |
| High School Diploma | 0 (0.0%) | 0.0 |
| College or Associate's Degree | 0 (0.0%) | 0.0 |
| Bachelor's Degree | 0 (0.0%) | 0.0 |
| Graduate Degree | 32 (100.0%) | 96.0 |
| Total | 32 (100.0%) | 18.0 |
Fertility by Education by Marriage Status in Manhasset
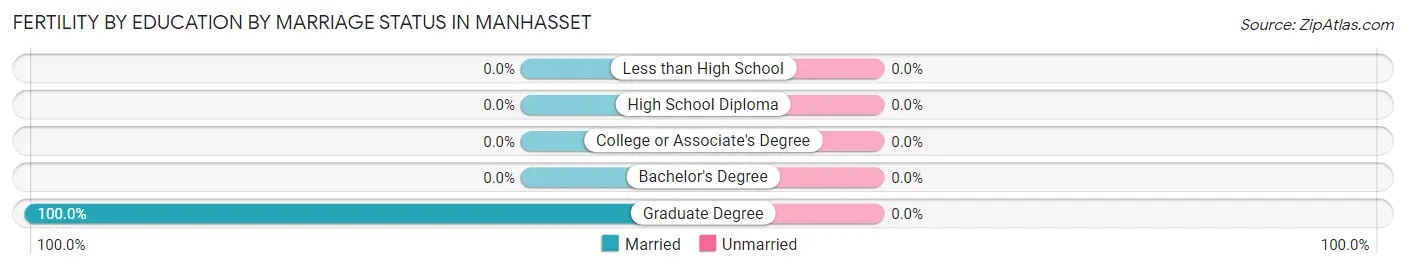
| Educational Attainment | Married | Unmarried |
| Less than High School | 0 (0.0%) | 0 (0.0%) |
| High School Diploma | 0 (0.0%) | 0 (0.0%) |
| College or Associate's Degree | 0 (0.0%) | 0 (0.0%) |
| Bachelor's Degree | 0 (0.0%) | 0 (0.0%) |
| Graduate Degree | 32 (100.0%) | 0 (0.0%) |
| Total | 32 (100.0%) | 0 (0.0%) |
Income in Manhasset
Income Overview in Manhasset
Per Capita Income in Manhasset is $86,719, while median incomes of families and households are $210,680 and $156,959 respectively.
| Characteristic | Number | Measure |
| Per Capita Income | 7,720 | $86,719 |
| Median Family Income | 1,970 | $210,680 |
| Mean Family Income | 1,970 | $296,200 |
| Median Household Income | 2,537 | $156,959 |
| Mean Household Income | 2,537 | $256,600 |
| Income Deficit | 1,970 | $20,241 |
| Wage / Income Gap (%) | 7,720 | 51.90% |
| Wage / Income Gap ($) | 7,720 | 48.10¢ per $1 |
| Gini / Inequality Index | 7,720 | 0.55 |
Earnings by Sex in Manhasset
Average Earnings in Manhasset are $76,875, $88,839 for men and $42,731 for women, a difference of 51.9%.
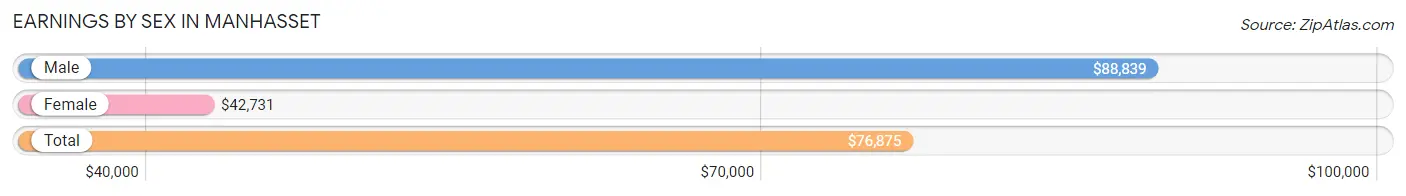
| Sex | Number | Average Earnings |
| Male | 2,160 (55.5%) | $88,839 |
| Female | 1,731 (44.5%) | $42,731 |
| Total | 3,891 (100.0%) | $76,875 |
Earnings by Sex by Income Bracket in Manhasset
The most common earnings brackets in Manhasset are $100,000+ for men (1,041 | 48.2%) and $100,000+ for women (463 | 26.8%).
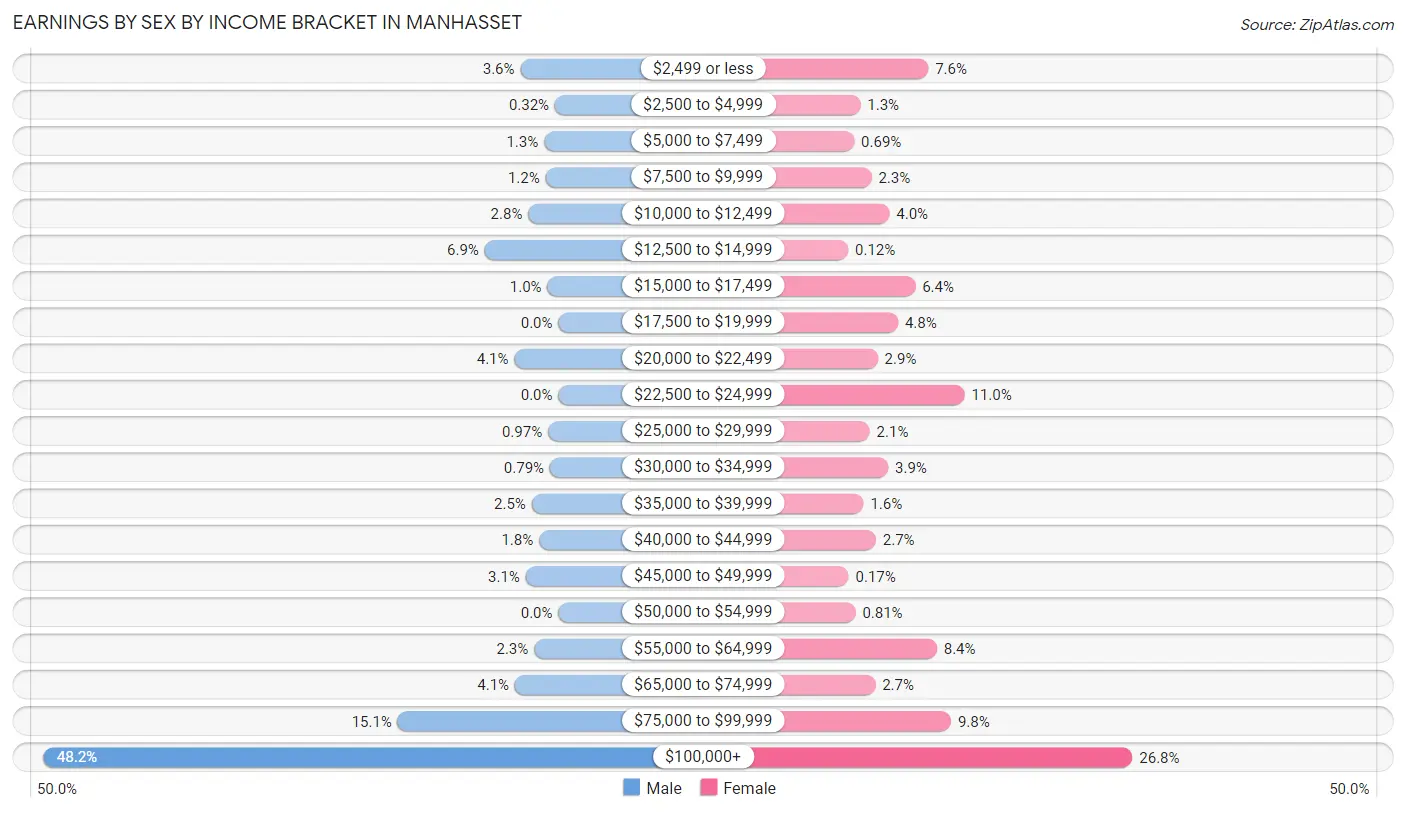
| Income | Male | Female |
| $2,499 or less | 77 (3.6%) | 132 (7.6%) |
| $2,500 to $4,999 | 7 (0.3%) | 22 (1.3%) |
| $5,000 to $7,499 | 29 (1.3%) | 12 (0.7%) |
| $7,500 to $9,999 | 26 (1.2%) | 40 (2.3%) |
| $10,000 to $12,499 | 61 (2.8%) | 69 (4.0%) |
| $12,500 to $14,999 | 149 (6.9%) | 2 (0.1%) |
| $15,000 to $17,499 | 22 (1.0%) | 111 (6.4%) |
| $17,500 to $19,999 | 0 (0.0%) | 83 (4.8%) |
| $20,000 to $22,499 | 89 (4.1%) | 50 (2.9%) |
| $22,500 to $24,999 | 0 (0.0%) | 191 (11.0%) |
| $25,000 to $29,999 | 21 (1.0%) | 37 (2.1%) |
| $30,000 to $34,999 | 17 (0.8%) | 67 (3.9%) |
| $35,000 to $39,999 | 54 (2.5%) | 27 (1.6%) |
| $40,000 to $44,999 | 39 (1.8%) | 47 (2.7%) |
| $45,000 to $49,999 | 66 (3.1%) | 3 (0.2%) |
| $50,000 to $54,999 | 0 (0.0%) | 14 (0.8%) |
| $55,000 to $64,999 | 49 (2.3%) | 146 (8.4%) |
| $65,000 to $74,999 | 88 (4.1%) | 46 (2.7%) |
| $75,000 to $99,999 | 325 (15.0%) | 169 (9.8%) |
| $100,000+ | 1,041 (48.2%) | 463 (26.8%) |
| Total | 2,160 (100.0%) | 1,731 (100.0%) |
Earnings by Sex by Educational Attainment in Manhasset
Average earnings in Manhasset are $103,724 for men and $51,964 for women, a difference of 49.9%. Men with an educational attainment of graduate degree enjoy the highest average annual earnings of $153,792, while those with high school diploma education earn the least with $77,859. Women with an educational attainment of bachelor's degree earn the most with the average annual earnings of $108,580, while those with high school diploma education have the smallest earnings of $24,065.
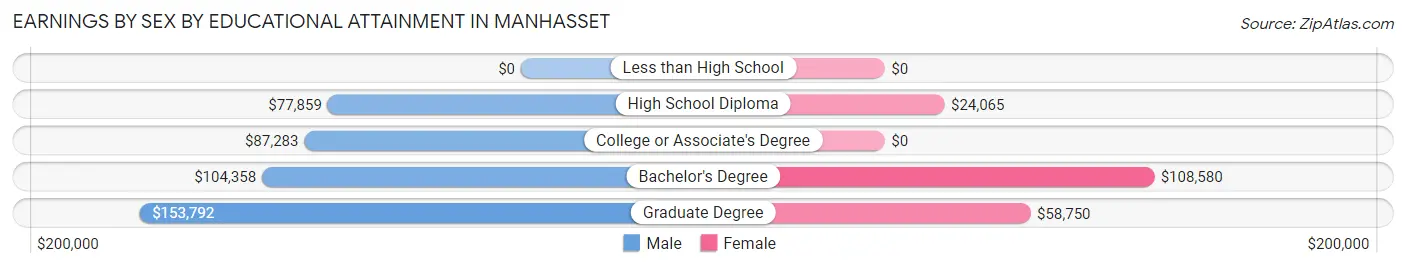
| Educational Attainment | Male Income | Female Income |
| Less than High School | - | - |
| High School Diploma | $77,859 | $24,065 |
| College or Associate's Degree | $87,283 | $0 |
| Bachelor's Degree | $104,358 | $108,580 |
| Graduate Degree | $153,792 | $58,750 |
| Total | $103,724 | $51,964 |
Family Income in Manhasset
Family Income Brackets in Manhasset
According to the Manhasset family income data, there are 1,056 families falling into the $200,000+ income range, which is the most common income bracket and makes up 53.6% of all families.
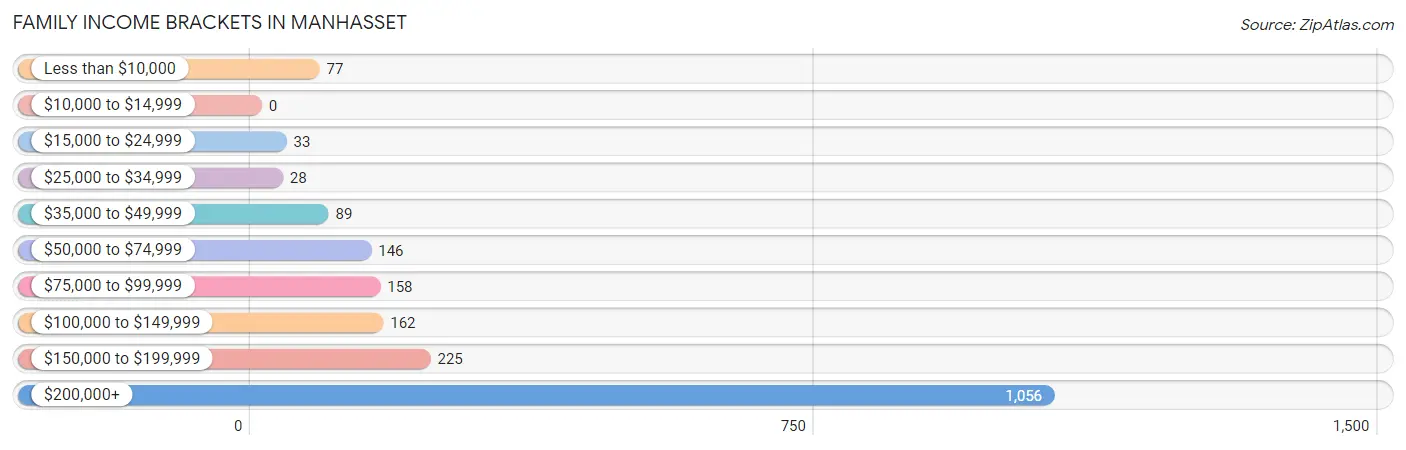
| Income Bracket | # Families | % Families |
| Less than $10,000 | 77 | 3.9% |
| $10,000 to $14,999 | 0 | 0.0% |
| $15,000 to $24,999 | 33 | 1.7% |
| $25,000 to $34,999 | 28 | 1.4% |
| $35,000 to $49,999 | 89 | 4.5% |
| $50,000 to $74,999 | 146 | 7.4% |
| $75,000 to $99,999 | 158 | 8.0% |
| $100,000 to $149,999 | 162 | 8.2% |
| $150,000 to $199,999 | 225 | 11.4% |
| $200,000+ | 1,056 | 53.6% |
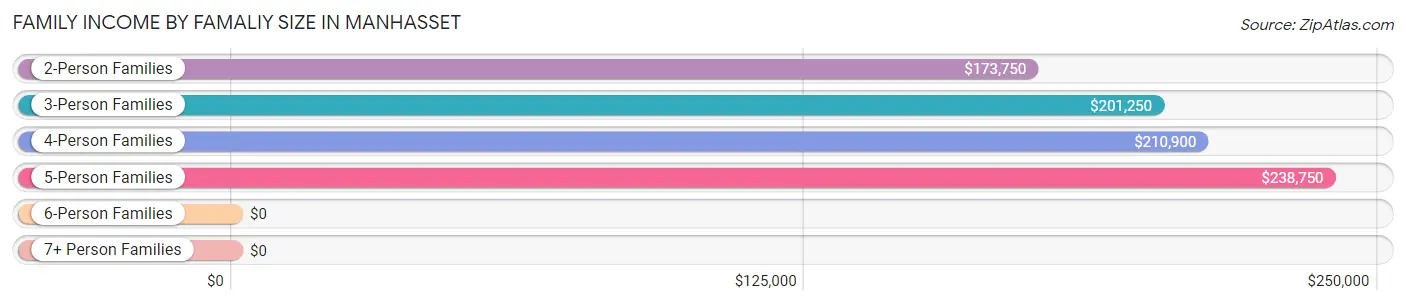
Family Income by Famaliy Size in Manhasset
5-person families (364 | 18.5%) account for the highest median family income in Manhasset with $238,750 per family, while 2-person families (658 | 33.4%) have the highest median income of $86,875 per family member.
| Income Bracket | # Families | Median Income |
| 2-Person Families | 658 (33.4%) | $173,750 |
| 3-Person Families | 447 (22.7%) | $201,250 |
| 4-Person Families | 490 (24.9%) | $210,900 |
| 5-Person Families | 364 (18.5%) | $238,750 |
| 6-Person Families | 10 (0.5%) | $0 |
| 7+ Person Families | 1 (0.1%) | $0 |
| Total | 1,970 (100.0%) | $210,680 |
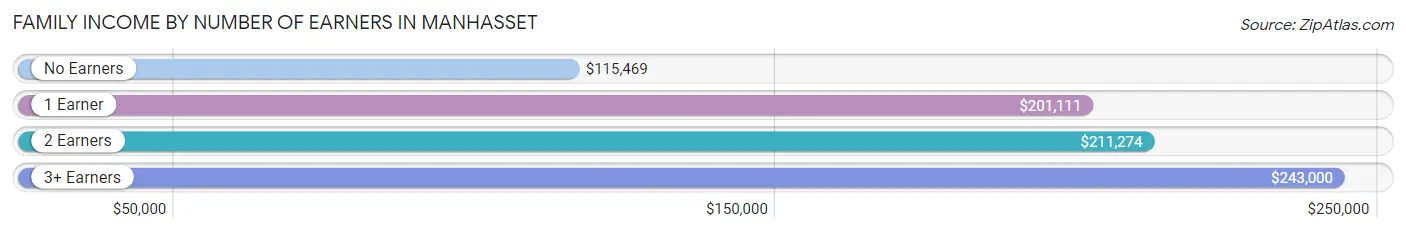
Family Income by Number of Earners in Manhasset
The median family income in Manhasset is $210,680, with families comprising 3+ earners (368) having the highest median family income of $243,000, while families with no earners (193) have the lowest median family income of $115,469, accounting for 18.7% and 9.8% of families, respectively.
| Number of Earners | # Families | Median Income |
| No Earners | 193 (9.8%) | $115,469 |
| 1 Earner | 632 (32.1%) | $201,111 |
| 2 Earners | 777 (39.4%) | $211,274 |
| 3+ Earners | 368 (18.7%) | $243,000 |
| Total | 1,970 (100.0%) | $210,680 |
Household Income in Manhasset
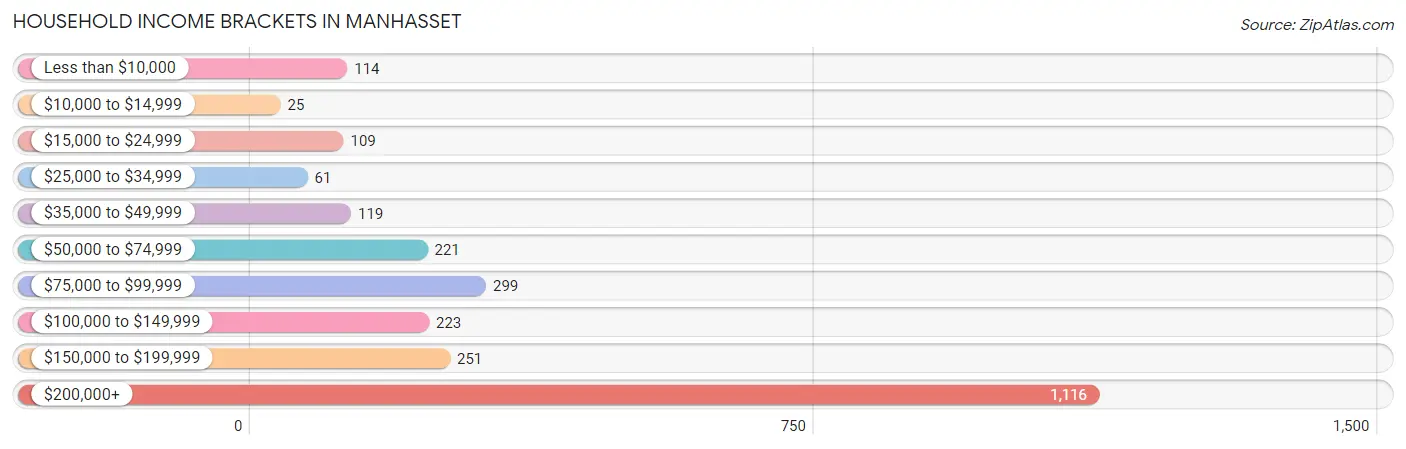
Household Income Brackets in Manhasset
With 1,116 households falling in the category, the $200,000+ income range is the most frequent in Manhasset, accounting for 44.0% of all households. In contrast, only 25 households (1.0%) fall into the $10,000 to $14,999 income bracket, making it the least populous group.
| Income Bracket | # Households | % Households |
| Less than $10,000 | 114 | 4.5% |
| $10,000 to $14,999 | 25 | 1.0% |
| $15,000 to $24,999 | 109 | 4.3% |
| $25,000 to $34,999 | 61 | 2.4% |
| $35,000 to $49,999 | 119 | 4.7% |
| $50,000 to $74,999 | 221 | 8.7% |
| $75,000 to $99,999 | 299 | 11.8% |
| $100,000 to $149,999 | 223 | 8.8% |
| $150,000 to $199,999 | 251 | 9.9% |
| $200,000+ | 1,116 | 44.0% |
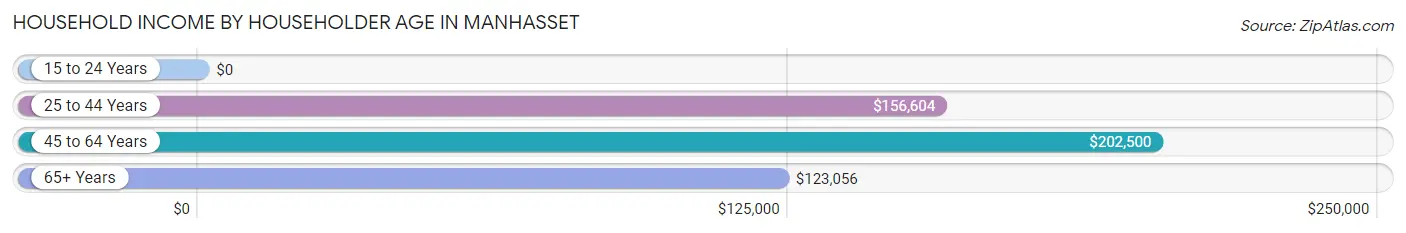
Household Income by Householder Age in Manhasset
The median household income in Manhasset is $156,959, with the highest median household income of $202,500 found in the 45 to 64 years age bracket for the primary householder. A total of 1,040 households (41.0%) fall into this category.
| Income Bracket | # Households | Median Income |
| 15 to 24 Years | 0 (0.0%) | $0 |
| 25 to 44 Years | 773 (30.5%) | $156,604 |
| 45 to 64 Years | 1,040 (41.0%) | $202,500 |
| 65+ Years | 724 (28.5%) | $123,056 |
| Total | 2,537 (100.0%) | $156,959 |
Poverty in Manhasset
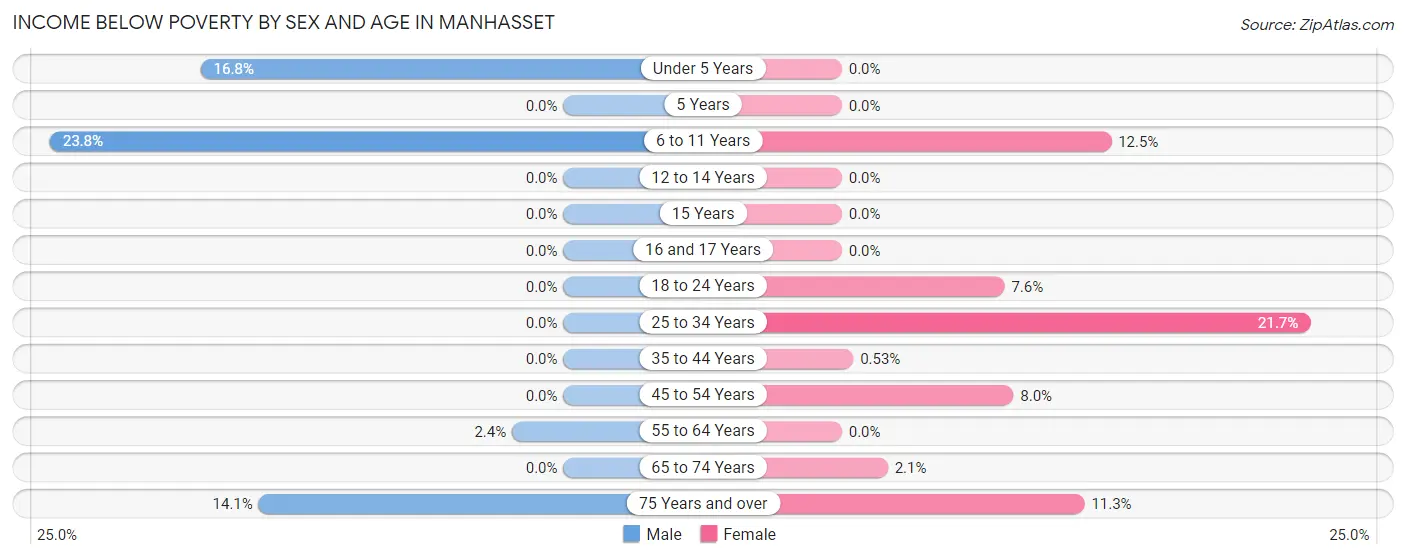
Income Below Poverty by Sex and Age in Manhasset
With 4.2% poverty level for males and 5.8% for females among the residents of Manhasset, 6 to 11 year old males and 25 to 34 year old females are the most vulnerable to poverty, with 92 males (23.8%) and 68 females (21.7%) in their respective age groups living below the poverty level.
| Age Bracket | Male | Female |
| Under 5 Years | 34 (16.8%) | 0 (0.0%) |
| 5 Years | 0 (0.0%) | 0 (0.0%) |
| 6 to 11 Years | 92 (23.8%) | 42 (12.5%) |
| 12 to 14 Years | 0 (0.0%) | 0 (0.0%) |
| 15 Years | 0 (0.0%) | 0 (0.0%) |
| 16 and 17 Years | 0 (0.0%) | 0 (0.0%) |
| 18 to 24 Years | 0 (0.0%) | 21 (7.5%) |
| 25 to 34 Years | 0 (0.0%) | 68 (21.7%) |
| 35 to 44 Years | 0 (0.0%) | 3 (0.5%) |
| 45 to 54 Years | 0 (0.0%) | 43 (8.0%) |
| 55 to 64 Years | 10 (2.4%) | 0 (0.0%) |
| 65 to 74 Years | 0 (0.0%) | 8 (2.1%) |
| 75 Years and over | 14 (14.1%) | 34 (11.3%) |
| Total | 150 (4.2%) | 219 (5.8%) |
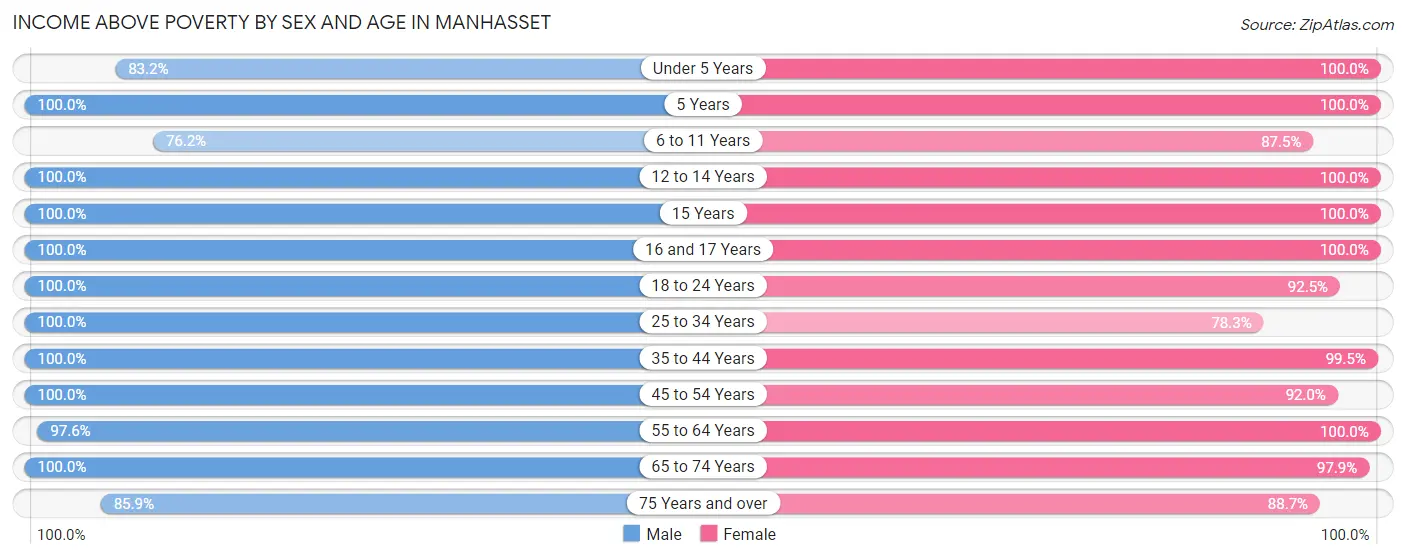
Income Above Poverty by Sex and Age in Manhasset
According to the poverty statistics in Manhasset, males aged 5 years and females aged under 5 years are the age groups that are most secure financially, with 100.0% of males and 100.0% of females in these age groups living above the poverty line.
| Age Bracket | Male | Female |
| Under 5 Years | 168 (83.2%) | 68 (100.0%) |
| 5 Years | 33 (100.0%) | 55 (100.0%) |
| 6 to 11 Years | 294 (76.2%) | 294 (87.5%) |
| 12 to 14 Years | 114 (100.0%) | 150 (100.0%) |
| 15 Years | 40 (100.0%) | 104 (100.0%) |
| 16 and 17 Years | 145 (100.0%) | 191 (100.0%) |
| 18 to 24 Years | 359 (100.0%) | 257 (92.4%) |
| 25 to 34 Years | 373 (100.0%) | 245 (78.3%) |
| 35 to 44 Years | 261 (100.0%) | 562 (99.5%) |
| 45 to 54 Years | 794 (100.0%) | 497 (92.0%) |
| 55 to 64 Years | 410 (97.6%) | 492 (100.0%) |
| 65 to 74 Years | 378 (100.0%) | 368 (97.9%) |
| 75 Years and over | 85 (85.9%) | 268 (88.7%) |
| Total | 3,454 (95.8%) | 3,551 (94.2%) |
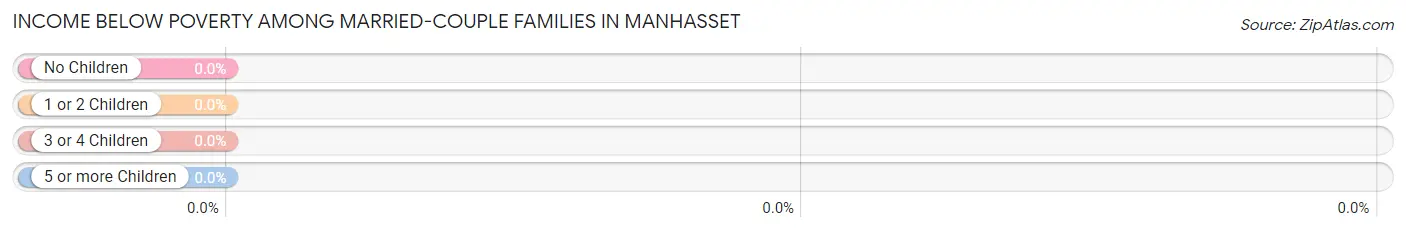
Income Below Poverty Among Married-Couple Families in Manhasset
| Children | Above Poverty | Below Poverty |
| No Children | 827 (100.0%) | 0 (0.0%) |
| 1 or 2 Children | 650 (100.0%) | 0 (0.0%) |
| 3 or 4 Children | 149 (100.0%) | 0 (0.0%) |
| 5 or more Children | 0 (0.0%) | 0 (0.0%) |
| Total | 1,626 (100.0%) | 0 (0.0%) |
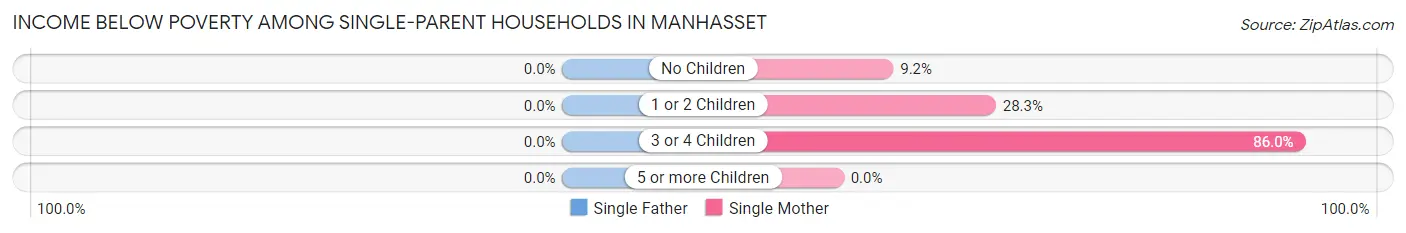
Income Below Poverty Among Single-Parent Households in Manhasset
| Children | Single Father | Single Mother |
| No Children | 0 (0.0%) | 11 (9.2%) |
| 1 or 2 Children | 0 (0.0%) | 34 (28.3%) |
| 3 or 4 Children | 0 (0.0%) | 43 (86.0%) |
| 5 or more Children | 0 (0.0%) | 0 (0.0%) |
| Total | 0 (0.0%) | 88 (30.4%) |
Income Below Poverty Among Married-Couple vs Single-Parent Households in Manhasset
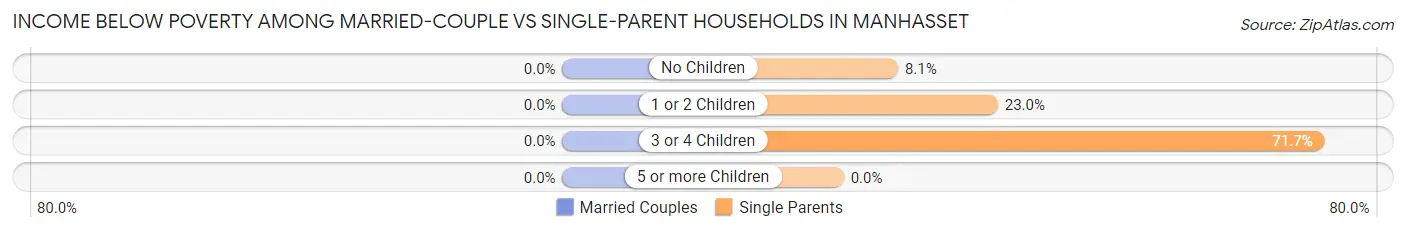
| Children | Married-Couple Families | Single-Parent Households |
| No Children | 0 (0.0%) | 11 (8.1%) |
| 1 or 2 Children | 0 (0.0%) | 34 (23.0%) |
| 3 or 4 Children | 0 (0.0%) | 43 (71.7%) |
| 5 or more Children | 0 (0.0%) | 0 (0.0%) |
| Total | 0 (0.0%) | 88 (25.6%) |
Employment Characteristics in Manhasset
Employment by Class of Employer in Manhasset
Among the 3,698 employed individuals in Manhasset, private company employees (2,570 | 69.5%), not-for-profit organizations (293 | 7.9%), and self-employed (incorporated) (230 | 6.2%) make up the most common classes of employment.
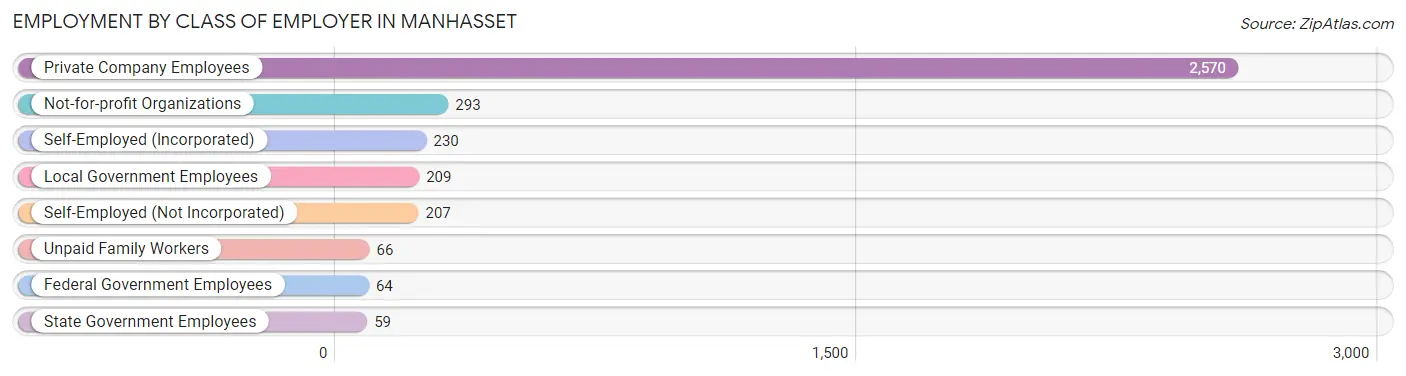
| Employer Class | # Employees | % Employees |
| Private Company Employees | 2,570 | 69.5% |
| Self-Employed (Incorporated) | 230 | 6.2% |
| Self-Employed (Not Incorporated) | 207 | 5.6% |
| Not-for-profit Organizations | 293 | 7.9% |
| Local Government Employees | 209 | 5.7% |
| State Government Employees | 59 | 1.6% |
| Federal Government Employees | 64 | 1.7% |
| Unpaid Family Workers | 66 | 1.8% |
| Total | 3,698 | 100.0% |
Employment Status by Age in Manhasset
According to the labor force statistics for Manhasset, out of the total population over 16 years of age (6,225), 60.2% or 3,747 individuals are in the labor force, with 0.6% or 22 of them unemployed. The age group with the highest labor force participation rate is 30 to 34 years, with 98.3% or 293 individuals in the labor force. Within the labor force, the 75 years and over age range has the highest percentage of unemployed individuals, with 9.7% or 7 of them being unemployed.
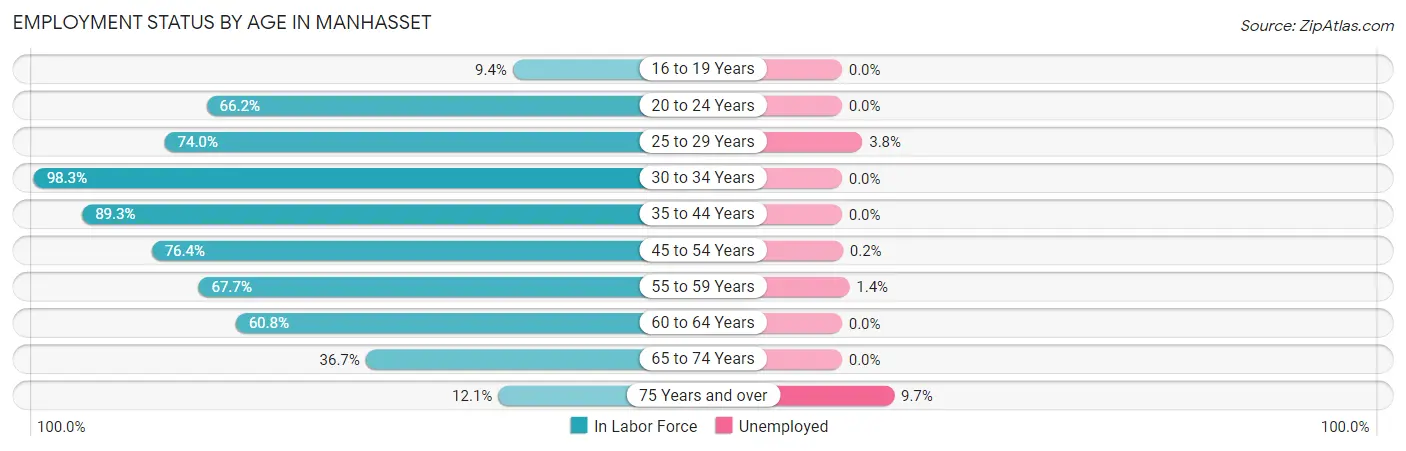
| Age Bracket | In Labor Force | Unemployed |
| 16 to 19 Years | 41 (9.4%) | 0 (0.0%) |
| 20 to 24 Years | 357 (66.2%) | 0 (0.0%) |
| 25 to 29 Years | 287 (74.0%) | 11 (3.8%) |
| 30 to 34 Years | 293 (98.3%) | 0 (0.0%) |
| 35 to 44 Years | 738 (89.3%) | 0 (0.0%) |
| 45 to 54 Years | 1,046 (76.4%) | 2 (0.2%) |
| 55 to 59 Years | 296 (67.7%) | 4 (1.4%) |
| 60 to 64 Years | 315 (60.8%) | 0 (0.0%) |
| 65 to 74 Years | 301 (36.7%) | 0 (0.0%) |
| 75 Years and over | 72 (12.1%) | 7 (9.7%) |
| Total | 3,747 (60.2%) | 22 (0.6%) |
Employment Status by Educational Attainment in Manhasset
According to labor force statistics for Manhasset, 77.6% of individuals (2,977) out of the total population between 25 and 64 years of age (3,836) are in the labor force, with 0.6% or 18 of them being unemployed. The group with the highest labor force participation rate are those with the educational attainment of college / associate degree, with 80.3% or 494 individuals in the labor force. Within the labor force, individuals with college / associate degree education have the highest percentage of unemployment, with 2.2% or 11 of them being unemployed.
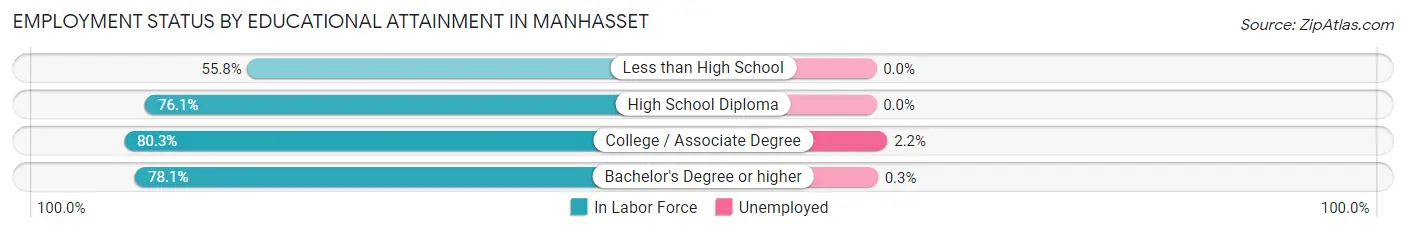
| Educational Attainment | In Labor Force | Unemployed |
| Less than High School | 53 (55.8%) | 0 (0.0%) |
| High School Diploma | 471 (76.1%) | 0 (0.0%) |
| College / Associate Degree | 494 (80.3%) | 14 (2.2%) |
| Bachelor's Degree or higher | 1,958 (78.1%) | 8 (0.3%) |
| Total | 2,977 (77.6%) | 23 (0.6%) |
Employment Occupations by Sex in Manhasset
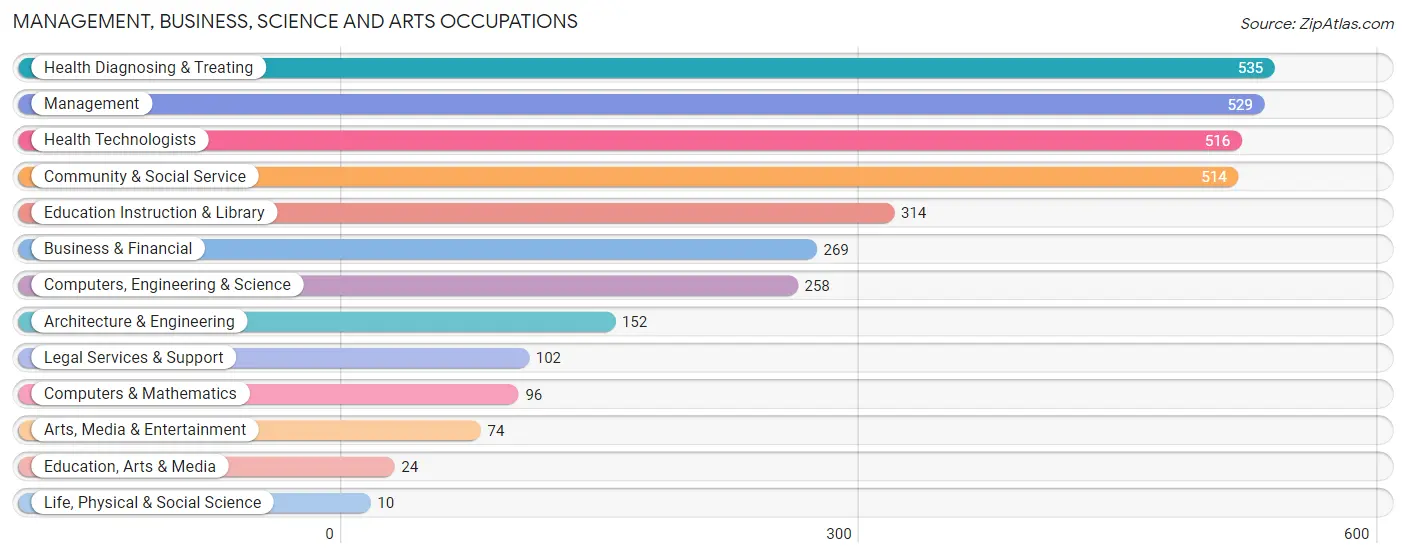
Management, Business, Science and Arts Occupations
The most common Management, Business, Science and Arts occupations in Manhasset are Health Diagnosing & Treating (535 | 14.4%), Management (529 | 14.2%), Health Technologists (516 | 13.9%), Community & Social Service (514 | 13.8%), and Education Instruction & Library (314 | 8.4%).
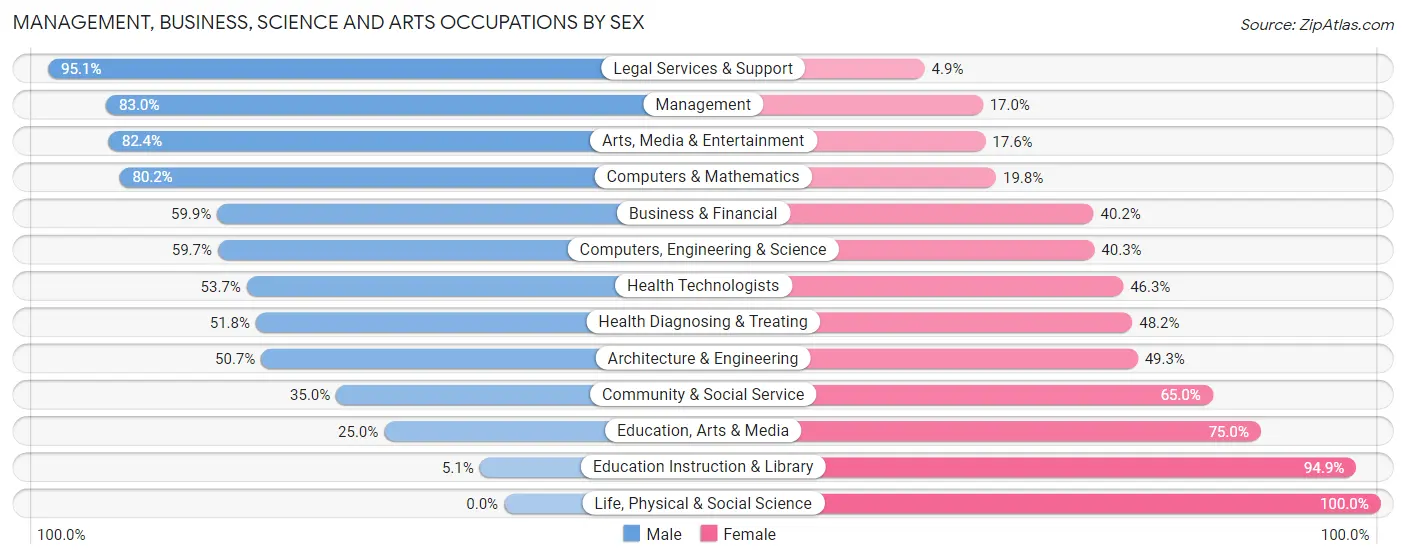
Management, Business, Science and Arts Occupations by Sex
Within the Management, Business, Science and Arts occupations in Manhasset, the most male-oriented occupations are Legal Services & Support (95.1%), Management (83.0%), and Arts, Media & Entertainment (82.4%), while the most female-oriented occupations are Life, Physical & Social Science (100.0%), Education Instruction & Library (94.9%), and Education, Arts & Media (75.0%).
| Occupation | Male | Female |
| Management | 439 (83.0%) | 90 (17.0%) |
| Business & Financial | 161 (59.9%) | 108 (40.2%) |
| Computers, Engineering & Science | 154 (59.7%) | 104 (40.3%) |
| Computers & Mathematics | 77 (80.2%) | 19 (19.8%) |
| Architecture & Engineering | 77 (50.7%) | 75 (49.3%) |
| Life, Physical & Social Science | 0 (0.0%) | 10 (100.0%) |
| Community & Social Service | 180 (35.0%) | 334 (65.0%) |
| Education, Arts & Media | 6 (25.0%) | 18 (75.0%) |
| Legal Services & Support | 97 (95.1%) | 5 (4.9%) |
| Education Instruction & Library | 16 (5.1%) | 298 (94.9%) |
| Arts, Media & Entertainment | 61 (82.4%) | 13 (17.6%) |
| Health Diagnosing & Treating | 277 (51.8%) | 258 (48.2%) |
| Health Technologists | 277 (53.7%) | 239 (46.3%) |
| Total (Category) | 1,211 (57.5%) | 894 (42.5%) |
| Total (Overall) | 2,070 (55.6%) | 1,652 (44.4%) |
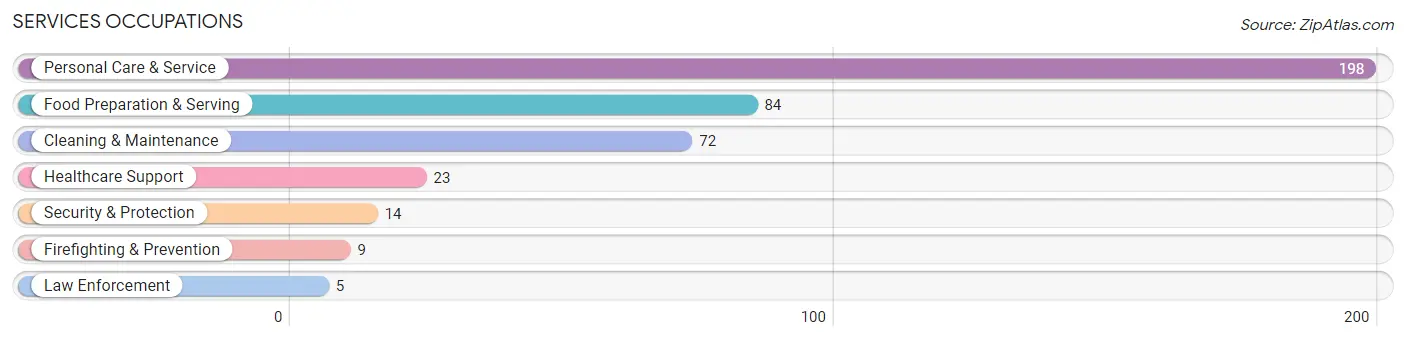
Services Occupations
The most common Services occupations in Manhasset are Personal Care & Service (198 | 5.3%), Food Preparation & Serving (84 | 2.3%), Cleaning & Maintenance (72 | 1.9%), Healthcare Support (23 | 0.6%), and Security & Protection (14 | 0.4%).
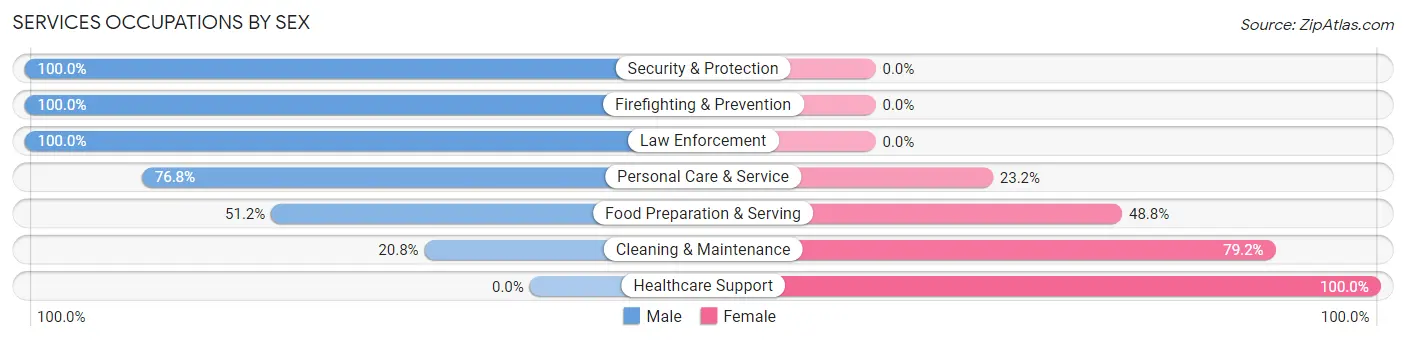
Services Occupations by Sex
Within the Services occupations in Manhasset, the most male-oriented occupations are Security & Protection (100.0%), Firefighting & Prevention (100.0%), and Law Enforcement (100.0%), while the most female-oriented occupations are Healthcare Support (100.0%), Cleaning & Maintenance (79.2%), and Food Preparation & Serving (48.8%).
| Occupation | Male | Female |
| Healthcare Support | 0 (0.0%) | 23 (100.0%) |
| Security & Protection | 14 (100.0%) | 0 (0.0%) |
| Firefighting & Prevention | 9 (100.0%) | 0 (0.0%) |
| Law Enforcement | 5 (100.0%) | 0 (0.0%) |
| Food Preparation & Serving | 43 (51.2%) | 41 (48.8%) |
| Cleaning & Maintenance | 15 (20.8%) | 57 (79.2%) |
| Personal Care & Service | 152 (76.8%) | 46 (23.2%) |
| Total (Category) | 224 (57.3%) | 167 (42.7%) |
| Total (Overall) | 2,070 (55.6%) | 1,652 (44.4%) |
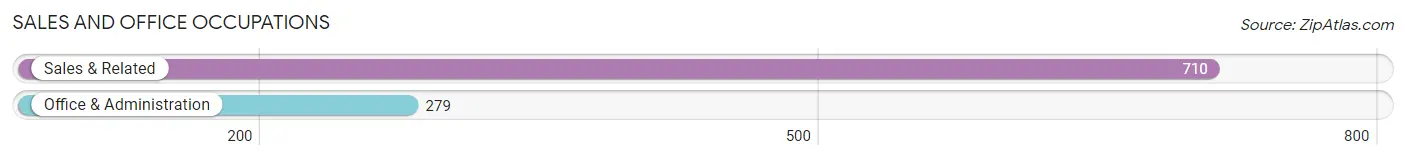
Sales and Office Occupations
The most common Sales and Office occupations in Manhasset are Sales & Related (710 | 19.1%), and Office & Administration (279 | 7.5%).
Sales and Office Occupations by Sex
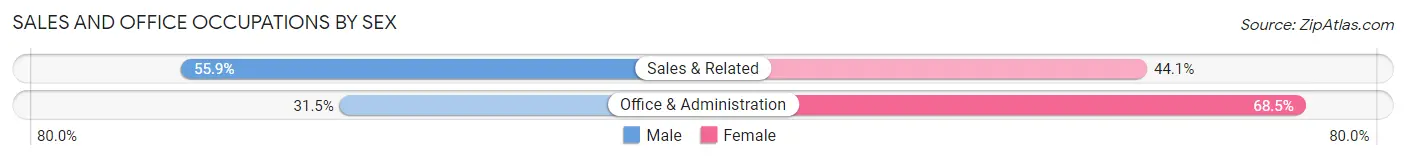
| Occupation | Male | Female |
| Sales & Related | 397 (55.9%) | 313 (44.1%) |
| Office & Administration | 88 (31.5%) | 191 (68.5%) |
| Total (Category) | 485 (49.0%) | 504 (51.0%) |
| Total (Overall) | 2,070 (55.6%) | 1,652 (44.4%) |
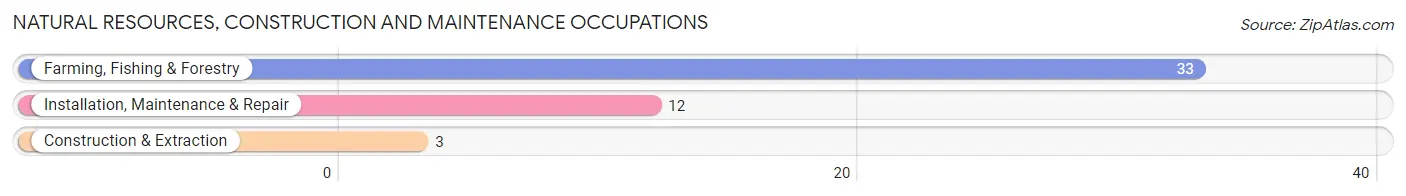
Natural Resources, Construction and Maintenance Occupations
The most common Natural Resources, Construction and Maintenance occupations in Manhasset are Farming, Fishing & Forestry (33 | 0.9%), Installation, Maintenance & Repair (12 | 0.3%), and Construction & Extraction (3 | 0.1%).
Natural Resources, Construction and Maintenance Occupations by Sex
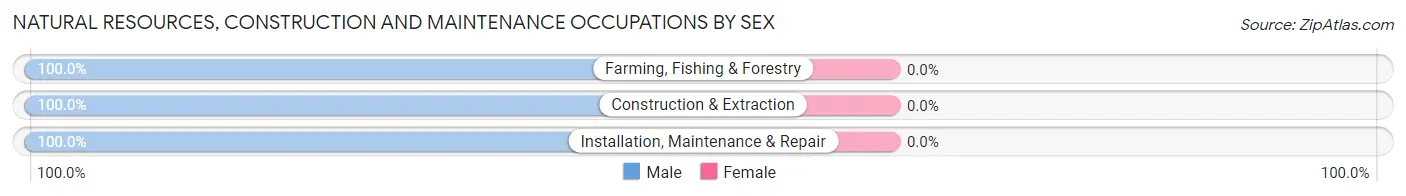
| Occupation | Male | Female |
| Farming, Fishing & Forestry | 33 (100.0%) | 0 (0.0%) |
| Construction & Extraction | 3 (100.0%) | 0 (0.0%) |
| Installation, Maintenance & Repair | 12 (100.0%) | 0 (0.0%) |
| Total (Category) | 48 (100.0%) | 0 (0.0%) |
| Total (Overall) | 2,070 (55.6%) | 1,652 (44.4%) |
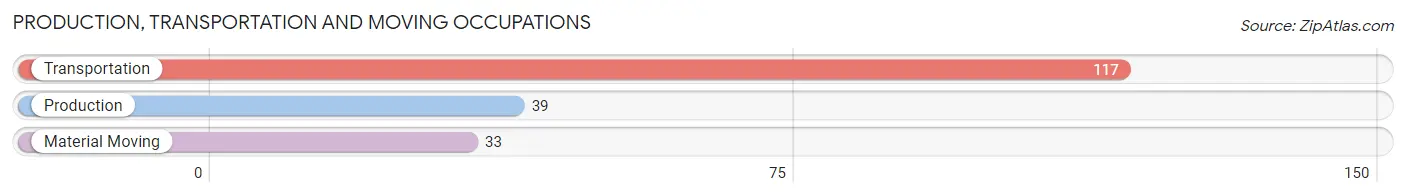
Production, Transportation and Moving Occupations
The most common Production, Transportation and Moving occupations in Manhasset are Transportation (117 | 3.1%), Production (39 | 1.1%), and Material Moving (33 | 0.9%).
Production, Transportation and Moving Occupations by Sex
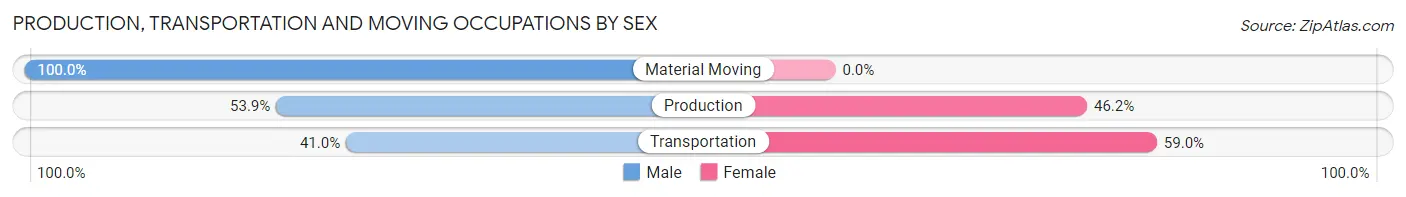
| Occupation | Male | Female |
| Production | 21 (53.8%) | 18 (46.2%) |
| Transportation | 48 (41.0%) | 69 (59.0%) |
| Material Moving | 33 (100.0%) | 0 (0.0%) |
| Total (Category) | 102 (54.0%) | 87 (46.0%) |
| Total (Overall) | 2,070 (55.6%) | 1,652 (44.4%) |
Employment Industries by Sex in Manhasset
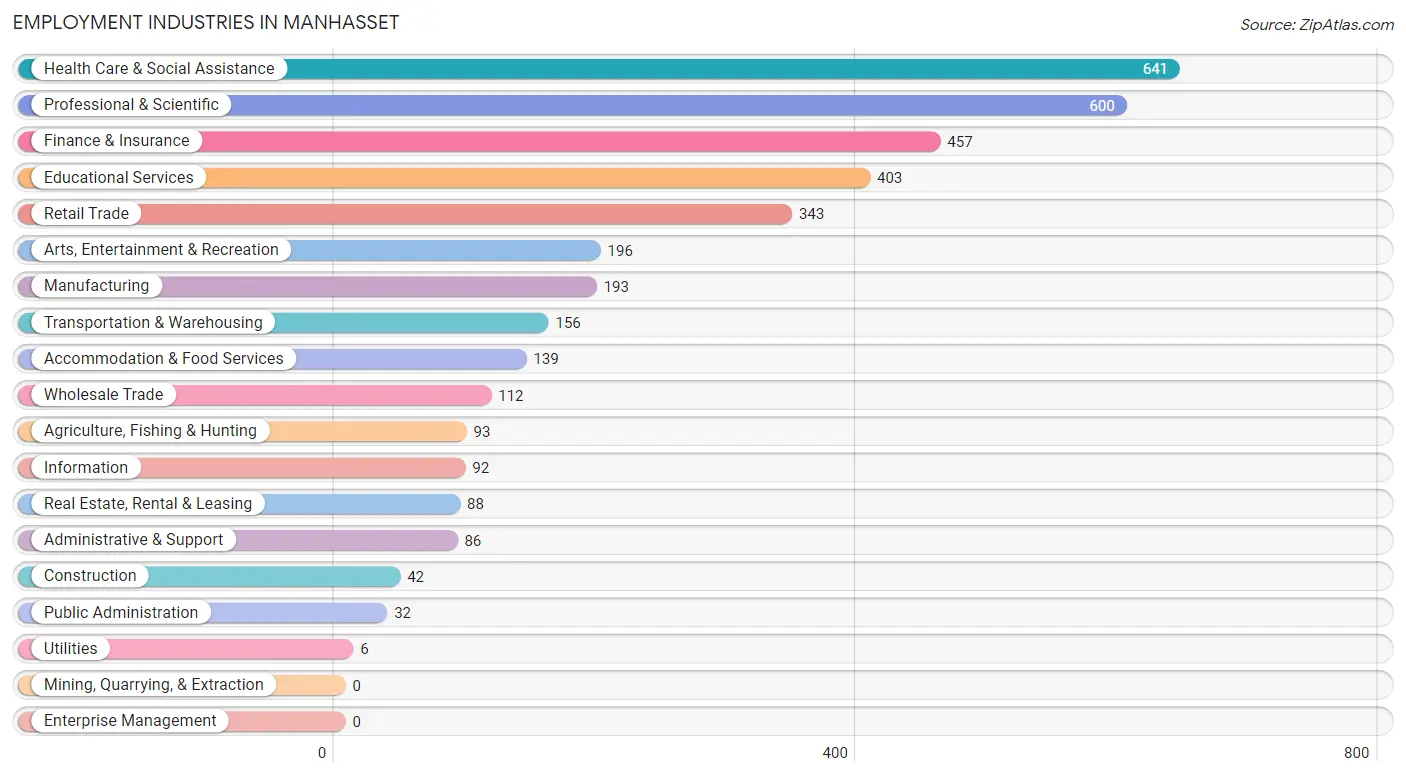
Employment Industries in Manhasset
The major employment industries in Manhasset include Health Care & Social Assistance (641 | 17.2%), Professional & Scientific (600 | 16.1%), Finance & Insurance (457 | 12.3%), Educational Services (403 | 10.8%), and Retail Trade (343 | 9.2%).
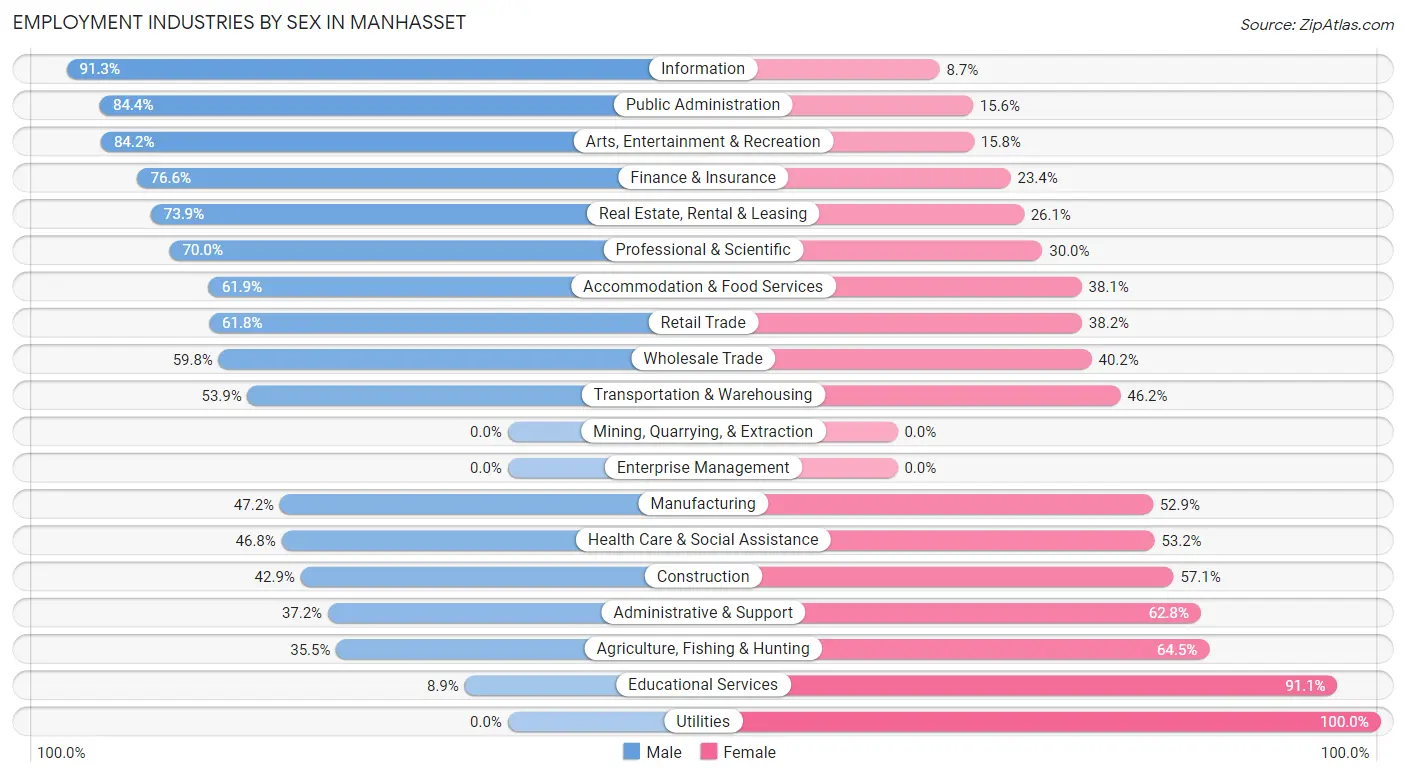
Employment Industries by Sex in Manhasset
The Manhasset industries that see more men than women are Information (91.3%), Public Administration (84.4%), and Arts, Entertainment & Recreation (84.2%), whereas the industries that tend to have a higher number of women are Utilities (100.0%), Educational Services (91.1%), and Agriculture, Fishing & Hunting (64.5%).
| Industry | Male | Female |
| Agriculture, Fishing & Hunting | 33 (35.5%) | 60 (64.5%) |
| Mining, Quarrying, & Extraction | 0 (0.0%) | 0 (0.0%) |
| Construction | 18 (42.9%) | 24 (57.1%) |
| Manufacturing | 91 (47.1%) | 102 (52.8%) |
| Wholesale Trade | 67 (59.8%) | 45 (40.2%) |
| Retail Trade | 212 (61.8%) | 131 (38.2%) |
| Transportation & Warehousing | 84 (53.8%) | 72 (46.2%) |
| Utilities | 0 (0.0%) | 6 (100.0%) |
| Information | 84 (91.3%) | 8 (8.7%) |
| Finance & Insurance | 350 (76.6%) | 107 (23.4%) |
| Real Estate, Rental & Leasing | 65 (73.9%) | 23 (26.1%) |
| Professional & Scientific | 420 (70.0%) | 180 (30.0%) |
| Enterprise Management | 0 (0.0%) | 0 (0.0%) |
| Administrative & Support | 32 (37.2%) | 54 (62.8%) |
| Educational Services | 36 (8.9%) | 367 (91.1%) |
| Health Care & Social Assistance | 300 (46.8%) | 341 (53.2%) |
| Arts, Entertainment & Recreation | 165 (84.2%) | 31 (15.8%) |
| Accommodation & Food Services | 86 (61.9%) | 53 (38.1%) |
| Public Administration | 27 (84.4%) | 5 (15.6%) |
| Total | 2,070 (55.6%) | 1,652 (44.4%) |
Education in Manhasset
School Enrollment in Manhasset
The most common levels of schooling among the 1,936 students in Manhasset are high school (577 | 29.8%), middle school (490 | 25.3%), and elementary school (360 | 18.6%).
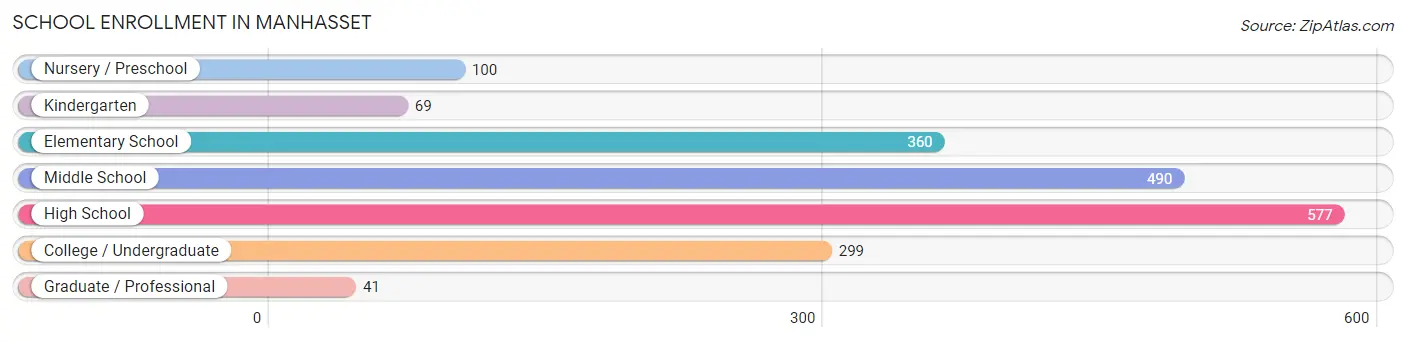
| School Level | # Students | % Students |
| Nursery / Preschool | 100 | 5.2% |
| Kindergarten | 69 | 3.6% |
| Elementary School | 360 | 18.6% |
| Middle School | 490 | 25.3% |
| High School | 577 | 29.8% |
| College / Undergraduate | 299 | 15.4% |
| Graduate / Professional | 41 | 2.1% |
| Total | 1,936 | 100.0% |
School Enrollment by Age by Funding Source in Manhasset
Out of a total of 1,936 students who are enrolled in schools in Manhasset, 188 (9.7%) attend a private institution, while the remaining 1,748 (90.3%) are enrolled in public schools. The age group of 3 to 4 year olds has the highest likelihood of being enrolled in private schools, with 51 (63.0% in the age bracket) enrolled. Conversely, the age group of 18 to 19 year olds has the lowest likelihood of being enrolled in a private school, with 86 (100.0% in the age bracket) attending a public institution.
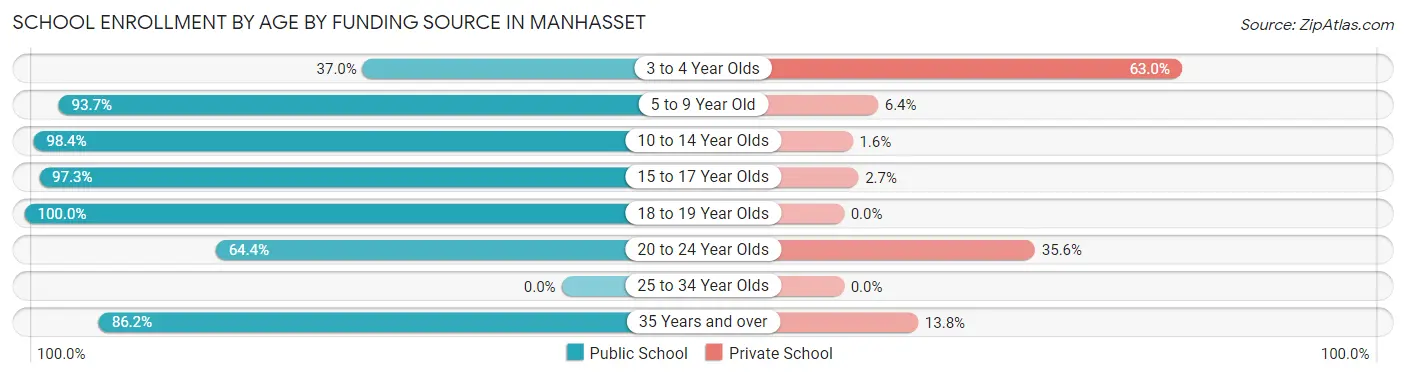
| Age Bracket | Public School | Private School |
| 3 to 4 Year Olds | 30 (37.0%) | 51 (63.0%) |
| 5 to 9 Year Old | 413 (93.6%) | 28 (6.4%) |
| 10 to 14 Year Olds | 540 (98.4%) | 9 (1.6%) |
| 15 to 17 Year Olds | 467 (97.3%) | 13 (2.7%) |
| 18 to 19 Year Olds | 86 (100.0%) | 0 (0.0%) |
| 20 to 24 Year Olds | 132 (64.4%) | 73 (35.6%) |
| 25 to 34 Year Olds | 0 (0.0%) | 0 (0.0%) |
| 35 Years and over | 81 (86.2%) | 13 (13.8%) |
| Total | 1,748 (90.3%) | 188 (9.7%) |
Educational Attainment by Field of Study in Manhasset
Business (1,014 | 29.3%), social sciences (422 | 12.2%), science & technology (285 | 8.3%), education (265 | 7.7%), and bio, nature & agricultural (254 | 7.3%) are the most common fields of study among 3,456 individuals in Manhasset who have obtained a bachelor's degree or higher.
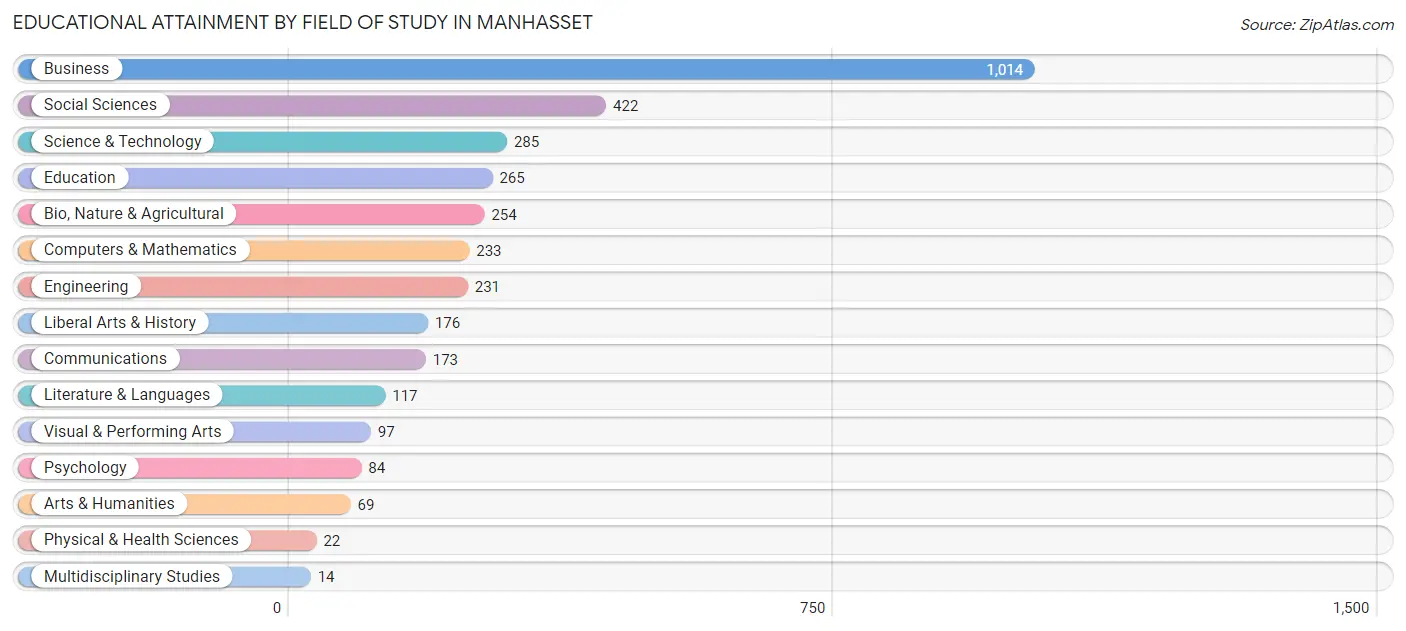
| Field of Study | # Graduates | % Graduates |
| Computers & Mathematics | 233 | 6.7% |
| Bio, Nature & Agricultural | 254 | 7.3% |
| Physical & Health Sciences | 22 | 0.6% |
| Psychology | 84 | 2.4% |
| Social Sciences | 422 | 12.2% |
| Engineering | 231 | 6.7% |
| Multidisciplinary Studies | 14 | 0.4% |
| Science & Technology | 285 | 8.3% |
| Business | 1,014 | 29.3% |
| Education | 265 | 7.7% |
| Literature & Languages | 117 | 3.4% |
| Liberal Arts & History | 176 | 5.1% |
| Visual & Performing Arts | 97 | 2.8% |
| Communications | 173 | 5.0% |
| Arts & Humanities | 69 | 2.0% |
| Total | 3,456 | 100.0% |
Transportation & Commute in Manhasset
Vehicle Availability by Sex in Manhasset
The most prevalent vehicle ownership categories in Manhasset are males with 2 vehicles (870, accounting for 42.0%) and females with 2 vehicles (840, making up 53.4%).
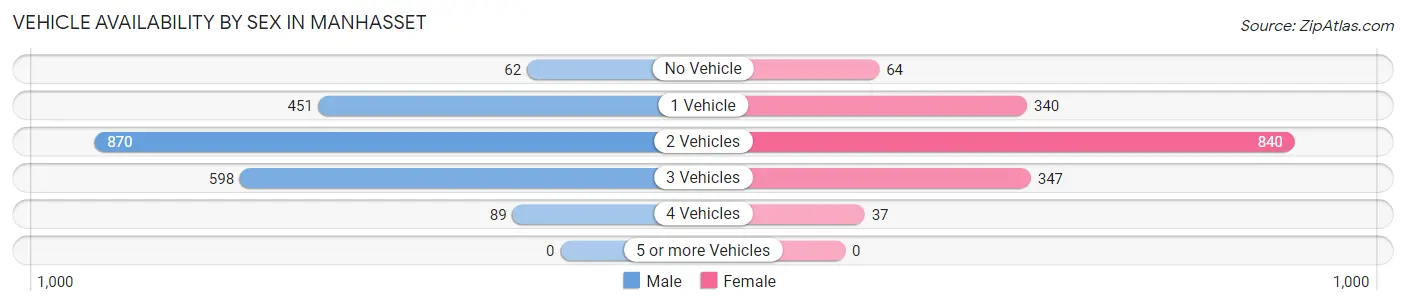
| Vehicles Available | Male | Female |
| No Vehicle | 62 (3.0%) | 64 (3.9%) |
| 1 Vehicle | 451 (21.8%) | 340 (20.9%) |
| 2 Vehicles | 870 (42.0%) | 840 (51.6%) |
| 3 Vehicles | 598 (28.9%) | 347 (21.3%) |
| 4 Vehicles | 89 (4.3%) | 37 (2.3%) |
| 5 or more Vehicles | 0 (0.0%) | 0 (0.0%) |
| Total | 2,070 (100.0%) | 1,628 (100.0%) |
Commute Time in Manhasset
The most frequently occuring commute durations in Manhasset are 60 to 89 minutes (587 commuters, 18.4%), 15 to 19 minutes (542 commuters, 17.0%), and 10 to 14 minutes (423 commuters, 13.3%).
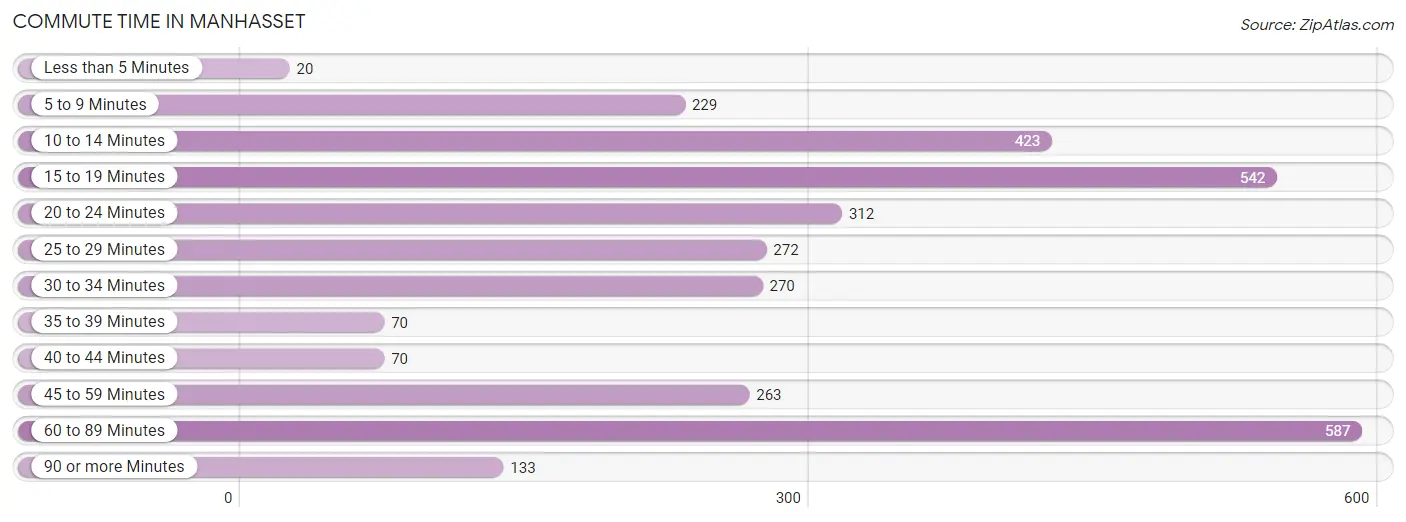
| Commute Time | # Commuters | % Commuters |
| Less than 5 Minutes | 20 | 0.6% |
| 5 to 9 Minutes | 229 | 7.2% |
| 10 to 14 Minutes | 423 | 13.3% |
| 15 to 19 Minutes | 542 | 17.0% |
| 20 to 24 Minutes | 312 | 9.8% |
| 25 to 29 Minutes | 272 | 8.5% |
| 30 to 34 Minutes | 270 | 8.5% |
| 35 to 39 Minutes | 70 | 2.2% |
| 40 to 44 Minutes | 70 | 2.2% |
| 45 to 59 Minutes | 263 | 8.2% |
| 60 to 89 Minutes | 587 | 18.4% |
| 90 or more Minutes | 133 | 4.2% |
Commute Time by Sex in Manhasset
The most common commute times in Manhasset are 15 to 19 minutes (409 commuters, 23.1%) for males and 10 to 14 minutes (322 commuters, 22.7%) for females.
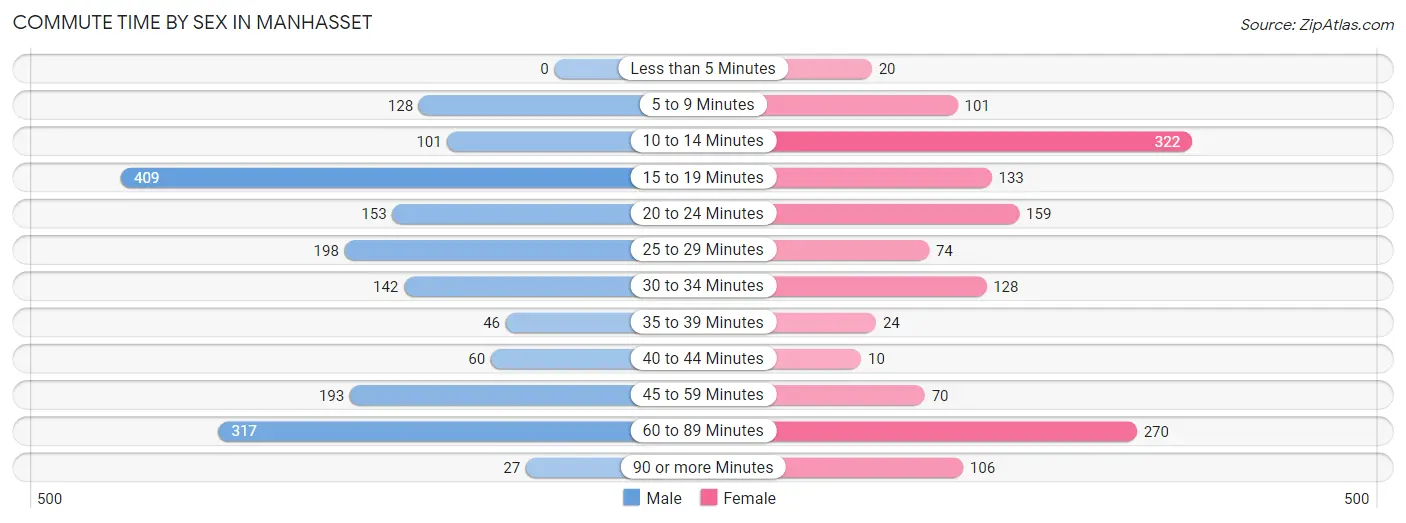
| Commute Time | Male | Female |
| Less than 5 Minutes | 0 (0.0%) | 20 (1.4%) |
| 5 to 9 Minutes | 128 (7.2%) | 101 (7.1%) |
| 10 to 14 Minutes | 101 (5.7%) | 322 (22.7%) |
| 15 to 19 Minutes | 409 (23.1%) | 133 (9.4%) |
| 20 to 24 Minutes | 153 (8.6%) | 159 (11.2%) |
| 25 to 29 Minutes | 198 (11.2%) | 74 (5.2%) |
| 30 to 34 Minutes | 142 (8.0%) | 128 (9.0%) |
| 35 to 39 Minutes | 46 (2.6%) | 24 (1.7%) |
| 40 to 44 Minutes | 60 (3.4%) | 10 (0.7%) |
| 45 to 59 Minutes | 193 (10.9%) | 70 (4.9%) |
| 60 to 89 Minutes | 317 (17.9%) | 270 (19.1%) |
| 90 or more Minutes | 27 (1.5%) | 106 (7.5%) |
Time of Departure to Work by Sex in Manhasset
The most frequent times of departure to work in Manhasset are 9:00 AM to 9:59 AM (234, 13.2%) for males and 9:00 AM to 9:59 AM (256, 18.1%) for females.
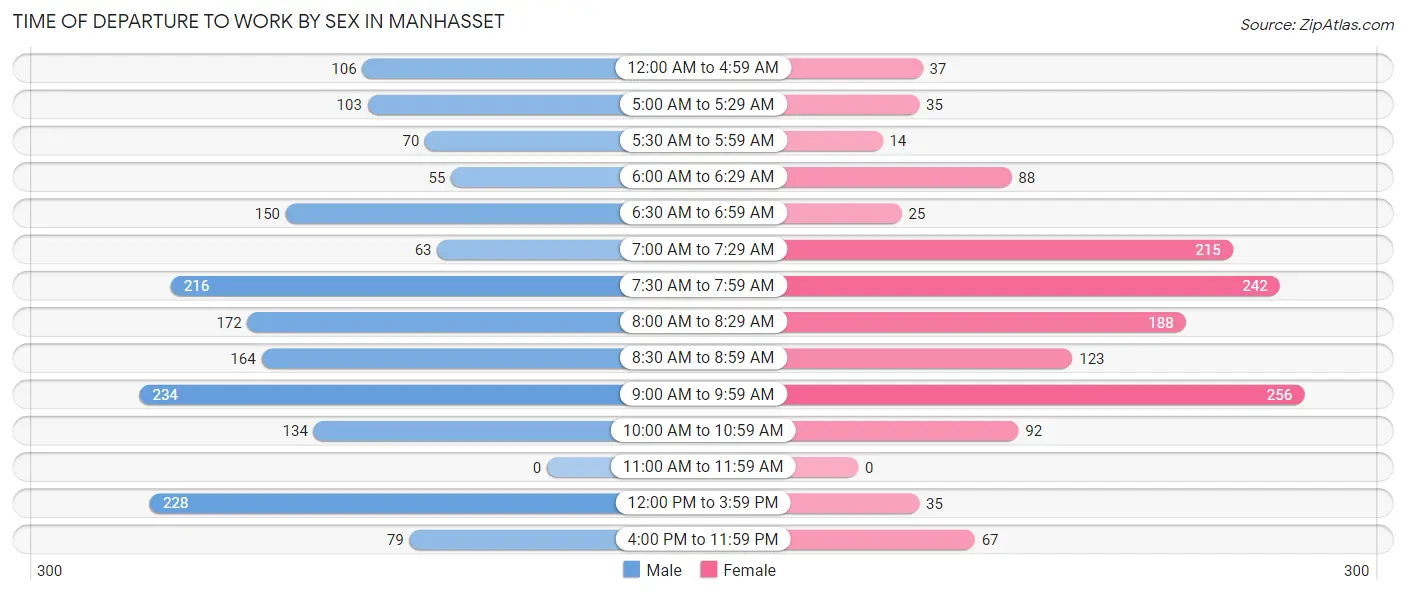
| Time of Departure | Male | Female |
| 12:00 AM to 4:59 AM | 106 (6.0%) | 37 (2.6%) |
| 5:00 AM to 5:29 AM | 103 (5.8%) | 35 (2.5%) |
| 5:30 AM to 5:59 AM | 70 (4.0%) | 14 (1.0%) |
| 6:00 AM to 6:29 AM | 55 (3.1%) | 88 (6.2%) |
| 6:30 AM to 6:59 AM | 150 (8.5%) | 25 (1.8%) |
| 7:00 AM to 7:29 AM | 63 (3.5%) | 215 (15.2%) |
| 7:30 AM to 7:59 AM | 216 (12.2%) | 242 (17.1%) |
| 8:00 AM to 8:29 AM | 172 (9.7%) | 188 (13.3%) |
| 8:30 AM to 8:59 AM | 164 (9.2%) | 123 (8.7%) |
| 9:00 AM to 9:59 AM | 234 (13.2%) | 256 (18.1%) |
| 10:00 AM to 10:59 AM | 134 (7.5%) | 92 (6.5%) |
| 11:00 AM to 11:59 AM | 0 (0.0%) | 0 (0.0%) |
| 12:00 PM to 3:59 PM | 228 (12.9%) | 35 (2.5%) |
| 4:00 PM to 11:59 PM | 79 (4.4%) | 67 (4.7%) |
| Total | 1,774 (100.0%) | 1,417 (100.0%) |
Housing Occupancy in Manhasset
Occupancy by Ownership in Manhasset
Of the total 2,537 dwellings in Manhasset, owner-occupied units account for 1,899 (74.9%), while renter-occupied units make up 638 (25.2%).
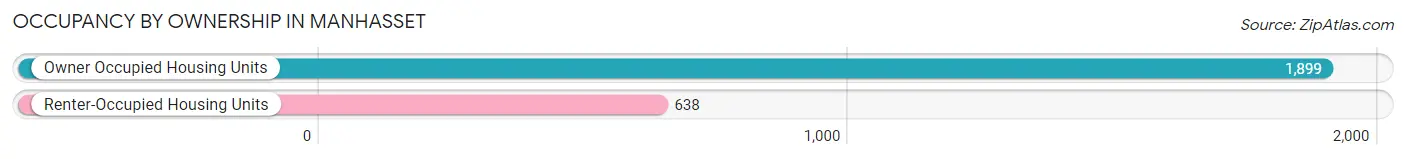
| Occupancy | # Housing Units | % Housing Units |
| Owner Occupied Housing Units | 1,899 | 74.9% |
| Renter-Occupied Housing Units | 638 | 25.2% |
| Total Occupied Housing Units | 2,537 | 100.0% |
Occupancy by Household Size in Manhasset
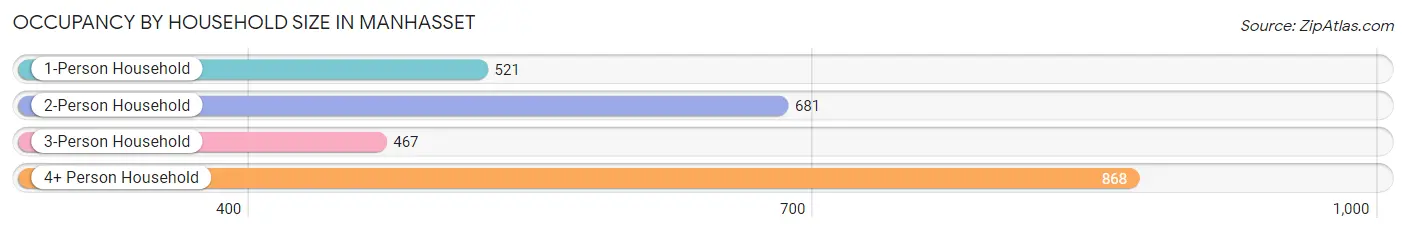
| Household Size | # Housing Units | % Housing Units |
| 1-Person Household | 521 | 20.5% |
| 2-Person Household | 681 | 26.8% |
| 3-Person Household | 467 | 18.4% |
| 4+ Person Household | 868 | 34.2% |
| Total Housing Units | 2,537 | 100.0% |
Occupancy by Ownership by Household Size in Manhasset
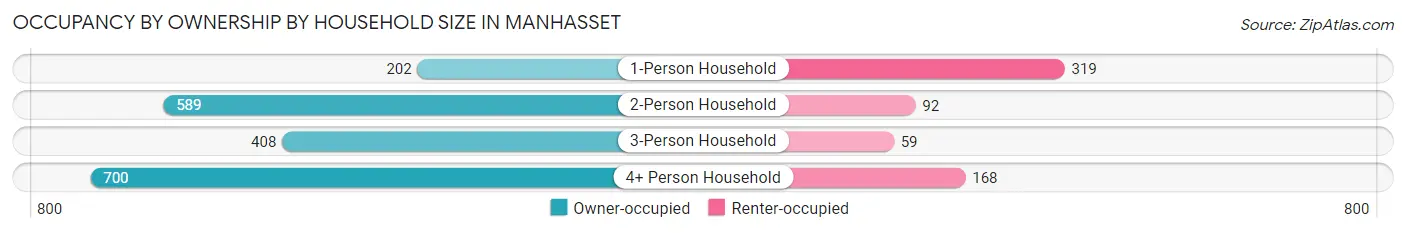
| Household Size | Owner-occupied | Renter-occupied |
| 1-Person Household | 202 (38.8%) | 319 (61.2%) |
| 2-Person Household | 589 (86.5%) | 92 (13.5%) |
| 3-Person Household | 408 (87.4%) | 59 (12.6%) |
| 4+ Person Household | 700 (80.6%) | 168 (19.4%) |
| Total Housing Units | 1,899 (74.9%) | 638 (25.2%) |
Occupancy by Educational Attainment in Manhasset
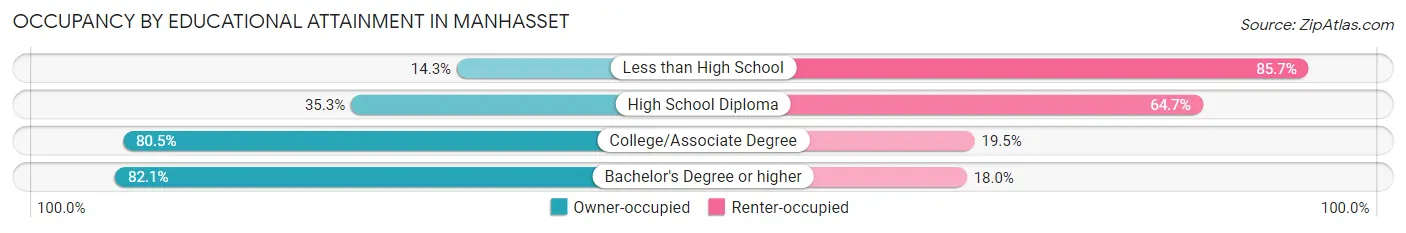
| Household Size | Owner-occupied | Renter-occupied |
| Less than High School | 12 (14.3%) | 72 (85.7%) |
| High School Diploma | 90 (35.3%) | 165 (64.7%) |
| College/Associate Degree | 330 (80.5%) | 80 (19.5%) |
| Bachelor's Degree or higher | 1,467 (82.1%) | 321 (17.9%) |
Occupancy by Age of Householder in Manhasset
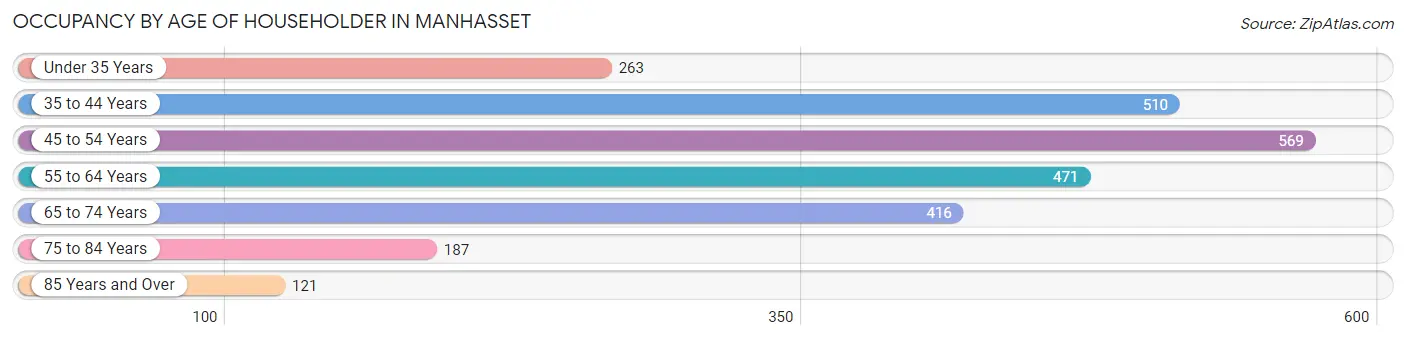
| Age Bracket | # Households | % Households |
| Under 35 Years | 263 | 10.4% |
| 35 to 44 Years | 510 | 20.1% |
| 45 to 54 Years | 569 | 22.4% |
| 55 to 64 Years | 471 | 18.6% |
| 65 to 74 Years | 416 | 16.4% |
| 75 to 84 Years | 187 | 7.4% |
| 85 Years and Over | 121 | 4.8% |
| Total | 2,537 | 100.0% |
Housing Finances in Manhasset
Median Income by Occupancy in Manhasset
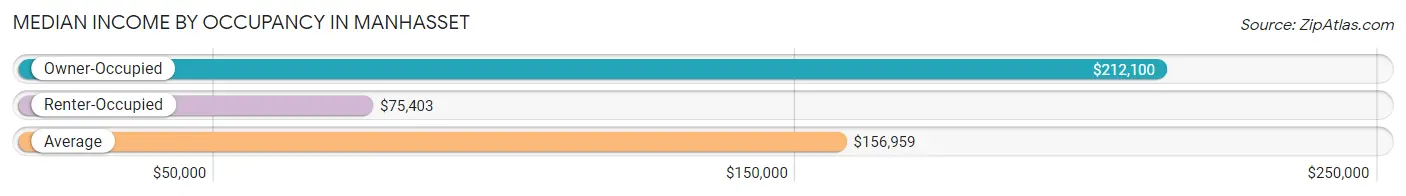
| Occupancy Type | # Households | Median Income |
| Owner-Occupied | 1,899 (74.9%) | $212,100 |
| Renter-Occupied | 638 (25.2%) | $75,403 |
| Average | 2,537 (100.0%) | $156,959 |
Occupancy by Householder Income Bracket in Manhasset
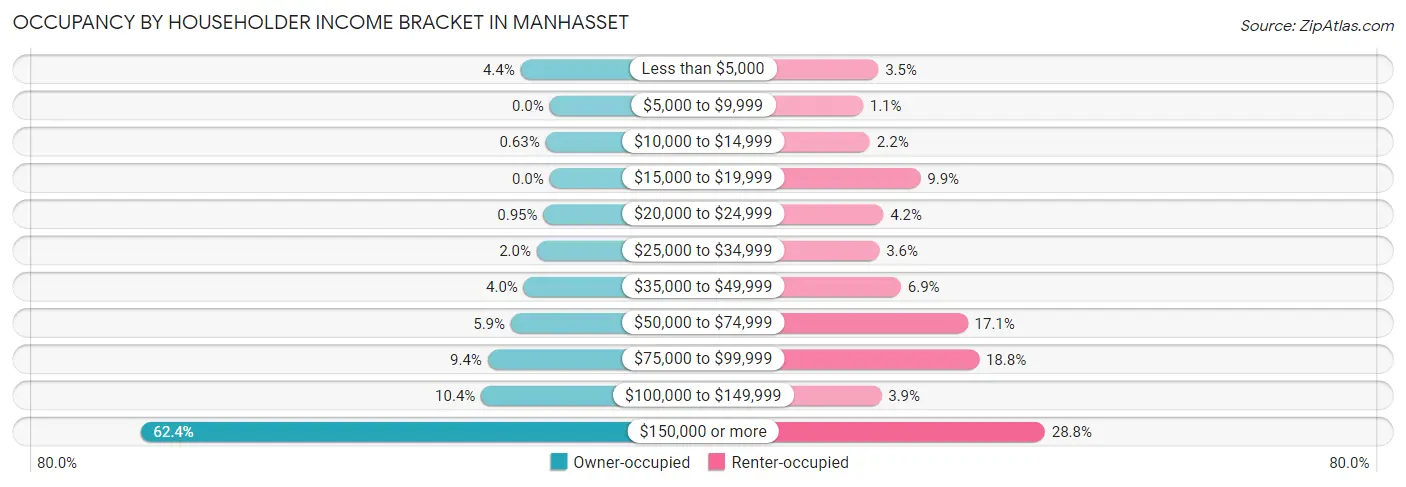
| Income Bracket | Owner-occupied | Renter-occupied |
| Less than $5,000 | 84 (4.4%) | 22 (3.5%) |
| $5,000 to $9,999 | 0 (0.0%) | 7 (1.1%) |
| $10,000 to $14,999 | 12 (0.6%) | 14 (2.2%) |
| $15,000 to $19,999 | 0 (0.0%) | 63 (9.9%) |
| $20,000 to $24,999 | 18 (0.9%) | 27 (4.2%) |
| $25,000 to $34,999 | 37 (1.9%) | 23 (3.6%) |
| $35,000 to $49,999 | 75 (4.0%) | 44 (6.9%) |
| $50,000 to $74,999 | 112 (5.9%) | 109 (17.1%) |
| $75,000 to $99,999 | 179 (9.4%) | 120 (18.8%) |
| $100,000 to $149,999 | 198 (10.4%) | 25 (3.9%) |
| $150,000 or more | 1,184 (62.4%) | 184 (28.8%) |
| Total | 1,899 (100.0%) | 638 (100.0%) |
Monthly Housing Cost Tiers in Manhasset
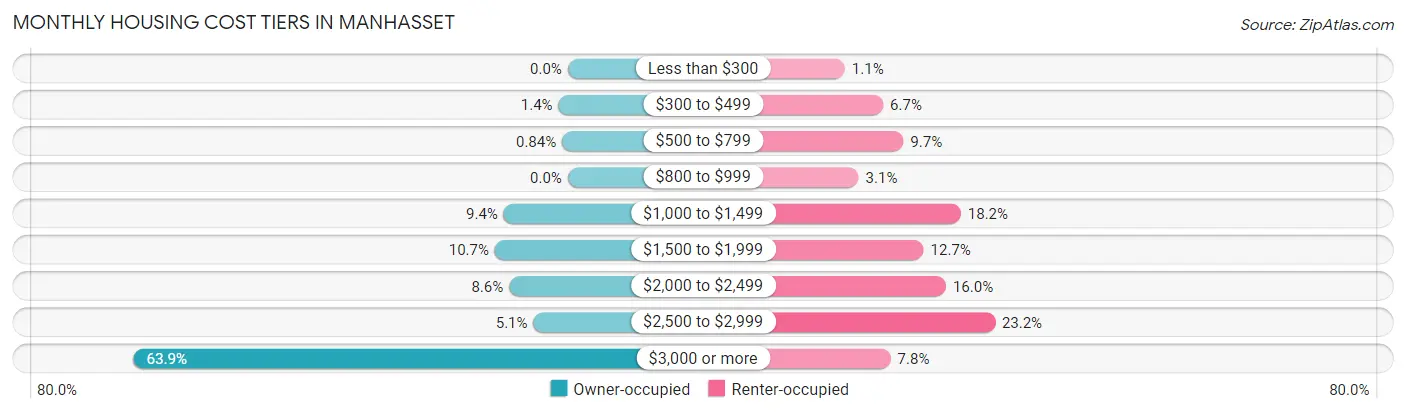
| Monthly Cost | Owner-occupied | Renter-occupied |
| Less than $300 | 0 (0.0%) | 7 (1.1%) |
| $300 to $499 | 26 (1.4%) | 43 (6.7%) |
| $500 to $799 | 16 (0.8%) | 62 (9.7%) |
| $800 to $999 | 0 (0.0%) | 20 (3.1%) |
| $1,000 to $1,499 | 179 (9.4%) | 116 (18.2%) |
| $1,500 to $1,999 | 204 (10.7%) | 81 (12.7%) |
| $2,000 to $2,499 | 164 (8.6%) | 102 (16.0%) |
| $2,500 to $2,999 | 96 (5.1%) | 148 (23.2%) |
| $3,000 or more | 1,214 (63.9%) | 50 (7.8%) |
| Total | 1,899 (100.0%) | 638 (100.0%) |
Physical Housing Characteristics in Manhasset
Housing Structures in Manhasset
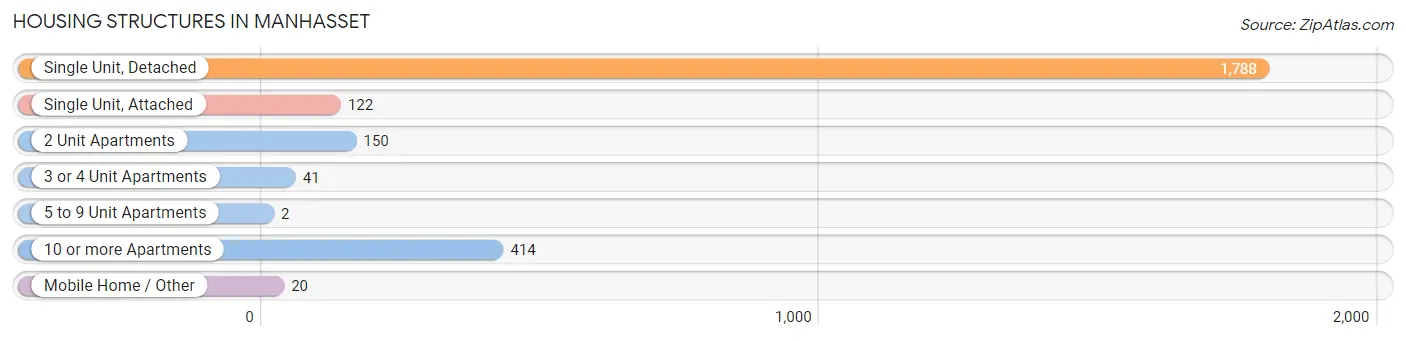
| Structure Type | # Housing Units | % Housing Units |
| Single Unit, Detached | 1,788 | 70.5% |
| Single Unit, Attached | 122 | 4.8% |
| 2 Unit Apartments | 150 | 5.9% |
| 3 or 4 Unit Apartments | 41 | 1.6% |
| 5 to 9 Unit Apartments | 2 | 0.1% |
| 10 or more Apartments | 414 | 16.3% |
| Mobile Home / Other | 20 | 0.8% |
| Total | 2,537 | 100.0% |
Housing Structures by Occupancy in Manhasset
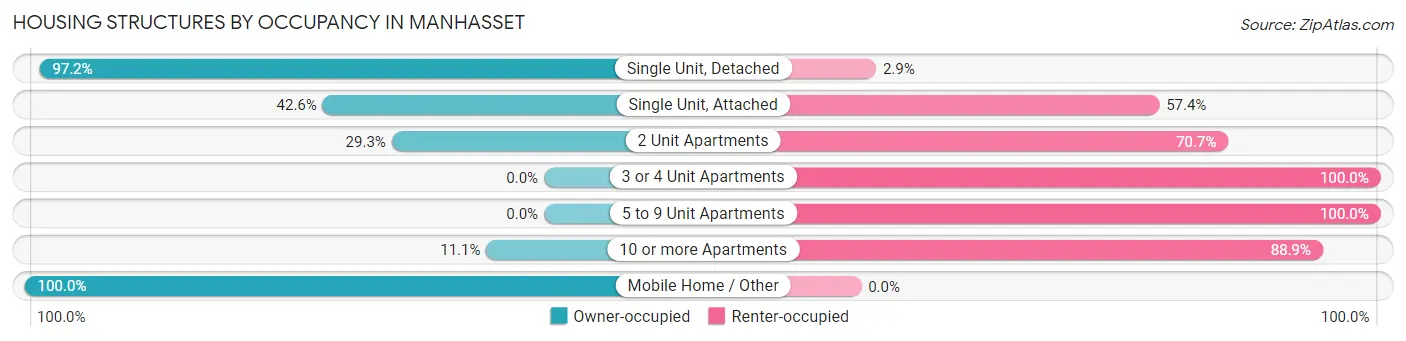
| Structure Type | Owner-occupied | Renter-occupied |
| Single Unit, Detached | 1,737 (97.2%) | 51 (2.9%) |
| Single Unit, Attached | 52 (42.6%) | 70 (57.4%) |
| 2 Unit Apartments | 44 (29.3%) | 106 (70.7%) |
| 3 or 4 Unit Apartments | 0 (0.0%) | 41 (100.0%) |
| 5 to 9 Unit Apartments | 0 (0.0%) | 2 (100.0%) |
| 10 or more Apartments | 46 (11.1%) | 368 (88.9%) |
| Mobile Home / Other | 20 (100.0%) | 0 (0.0%) |
| Total | 1,899 (74.9%) | 638 (25.2%) |
Housing Structures by Number of Rooms in Manhasset
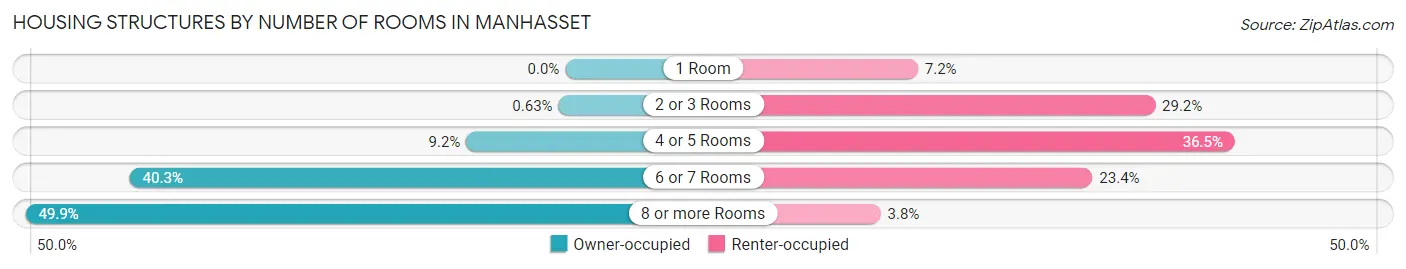
| Number of Rooms | Owner-occupied | Renter-occupied |
| 1 Room | 0 (0.0%) | 46 (7.2%) |
| 2 or 3 Rooms | 12 (0.6%) | 186 (29.1%) |
| 4 or 5 Rooms | 174 (9.2%) | 233 (36.5%) |
| 6 or 7 Rooms | 765 (40.3%) | 149 (23.4%) |
| 8 or more Rooms | 948 (49.9%) | 24 (3.8%) |
| Total | 1,899 (100.0%) | 638 (100.0%) |
Housing Structure by Heating Type in Manhasset
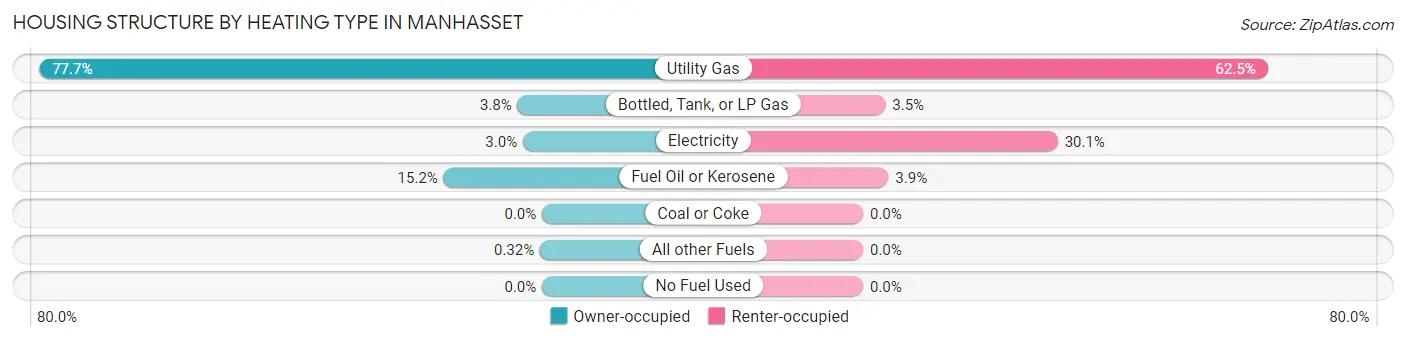
| Heating Type | Owner-occupied | Renter-occupied |
| Utility Gas | 1,476 (77.7%) | 399 (62.5%) |
| Bottled, Tank, or LP Gas | 72 (3.8%) | 22 (3.5%) |
| Electricity | 56 (2.9%) | 192 (30.1%) |
| Fuel Oil or Kerosene | 289 (15.2%) | 25 (3.9%) |
| Coal or Coke | 0 (0.0%) | 0 (0.0%) |
| All other Fuels | 6 (0.3%) | 0 (0.0%) |
| No Fuel Used | 0 (0.0%) | 0 (0.0%) |
| Total | 1,899 (100.0%) | 638 (100.0%) |
Household Vehicle Usage in Manhasset
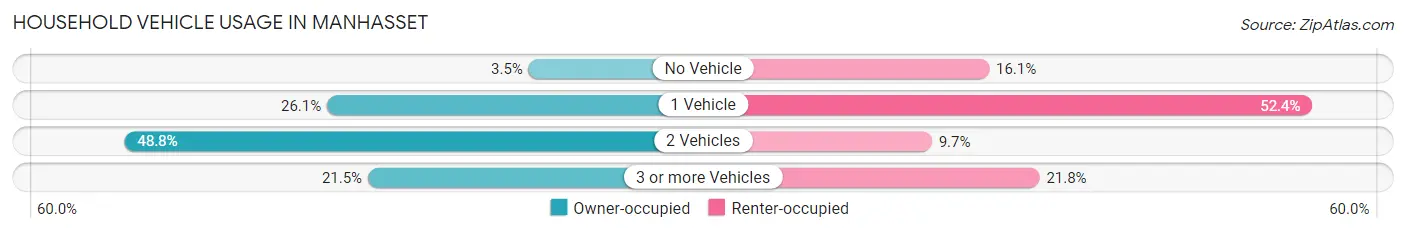
| Vehicles per Household | Owner-occupied | Renter-occupied |
| No Vehicle | 67 (3.5%) | 103 (16.1%) |
| 1 Vehicle | 496 (26.1%) | 334 (52.3%) |
| 2 Vehicles | 927 (48.8%) | 62 (9.7%) |
| 3 or more Vehicles | 409 (21.5%) | 139 (21.8%) |
| Total | 1,899 (100.0%) | 638 (100.0%) |
Real Estate & Mortgages in Manhasset
Real Estate and Mortgage Overview in Manhasset
| Characteristic | Without Mortgage | With Mortgage |
| Housing Units | 653 | 1,246 |
| Median Property Value | $1,221,400 | $1,202,100 |
| Median Household Income | $135,848 | $893 |
| Monthly Housing Costs | $1,501 | $1,110 |
| Real Estate Taxes | $10,001 | $0 |
Property Value by Mortgage Status in Manhasset
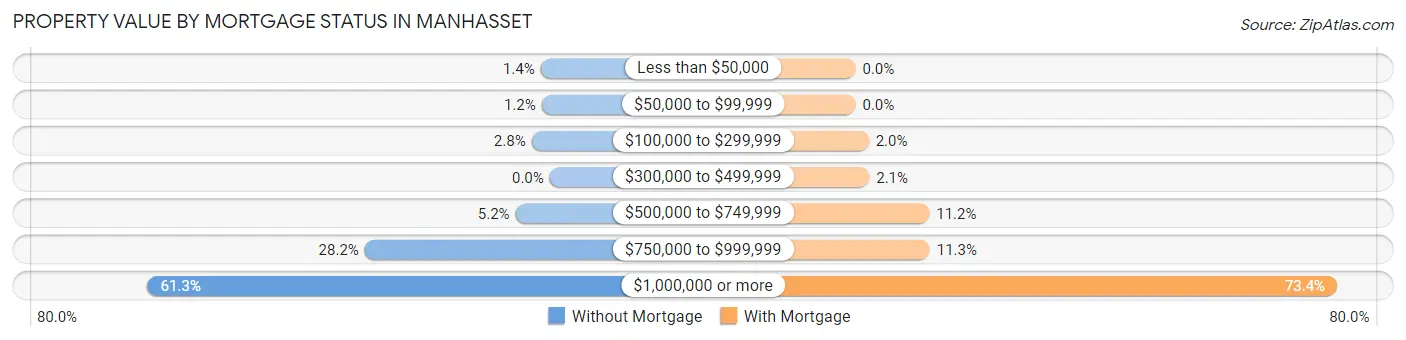
| Property Value | Without Mortgage | With Mortgage |
| Less than $50,000 | 9 (1.4%) | 0 (0.0%) |
| $50,000 to $99,999 | 8 (1.2%) | 0 (0.0%) |
| $100,000 to $299,999 | 18 (2.8%) | 25 (2.0%) |
| $300,000 to $499,999 | 0 (0.0%) | 26 (2.1%) |
| $500,000 to $749,999 | 34 (5.2%) | 140 (11.2%) |
| $750,000 to $999,999 | 184 (28.2%) | 141 (11.3%) |
| $1,000,000 or more | 400 (61.3%) | 914 (73.4%) |
| Total | 653 (100.0%) | 1,246 (100.0%) |
Household Income by Mortgage Status in Manhasset
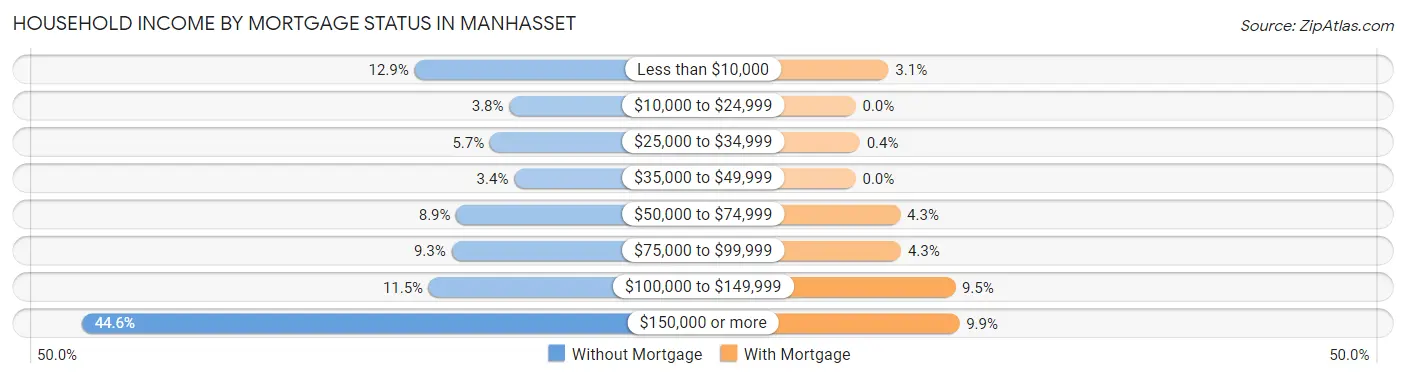
| Household Income | Without Mortgage | With Mortgage |
| Less than $10,000 | 84 (12.9%) | 39 (3.1%) |
| $10,000 to $24,999 | 25 (3.8%) | 0 (0.0%) |
| $25,000 to $34,999 | 37 (5.7%) | 5 (0.4%) |
| $35,000 to $49,999 | 22 (3.4%) | 0 (0.0%) |
| $50,000 to $74,999 | 58 (8.9%) | 53 (4.3%) |
| $75,000 to $99,999 | 61 (9.3%) | 54 (4.3%) |
| $100,000 to $149,999 | 75 (11.5%) | 118 (9.5%) |
| $150,000 or more | 291 (44.6%) | 123 (9.9%) |
| Total | 653 (100.0%) | 1,246 (100.0%) |
Property Value to Household Income Ratio in Manhasset
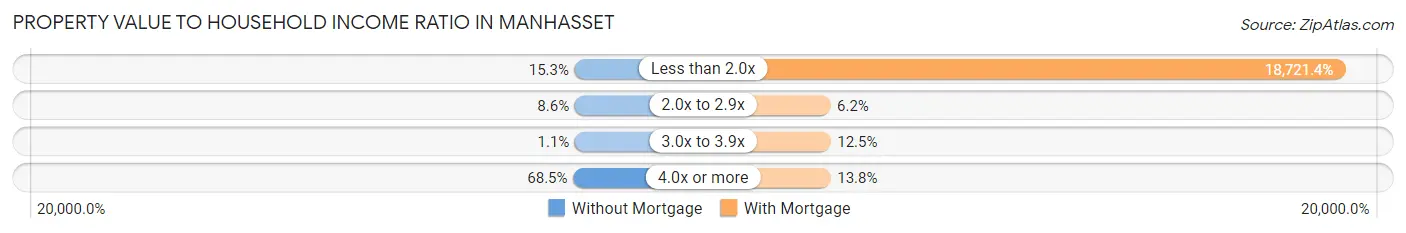
| Value-to-Income Ratio | Without Mortgage | With Mortgage |
| Less than 2.0x | 100 (15.3%) | 233,269 (18,721.4%) |
| 2.0x to 2.9x | 56 (8.6%) | 77 (6.2%) |
| 3.0x to 3.9x | 7 (1.1%) | 156 (12.5%) |
| 4.0x or more | 447 (68.4%) | 172 (13.8%) |
| Total | 653 (100.0%) | 1,246 (100.0%) |
Real Estate Taxes by Mortgage Status in Manhasset
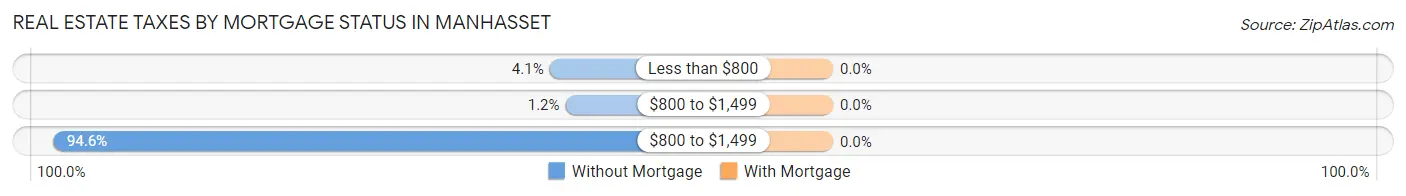
| Property Taxes | Without Mortgage | With Mortgage |
| Less than $800 | 27 (4.1%) | 0 (0.0%) |
| $800 to $1,499 | 8 (1.2%) | 0 (0.0%) |
| $800 to $1,499 | 618 (94.6%) | 0 (0.0%) |
| Total | 653 (100.0%) | 1,246 (100.0%) |
Health & Disability in Manhasset
Health Insurance Coverage by Age in Manhasset
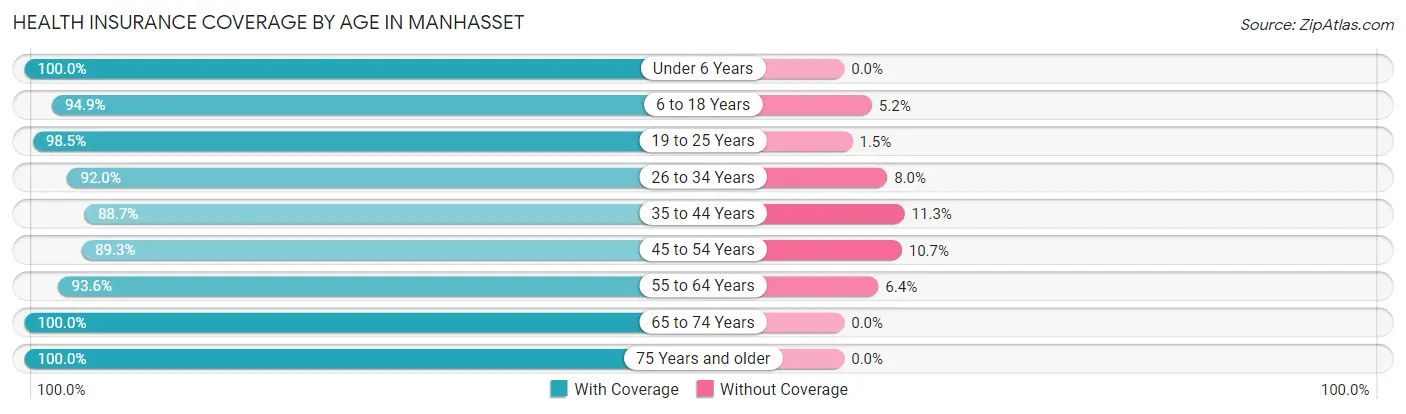
| Age Bracket | With Coverage | Without Coverage |
| Under 6 Years | 358 (100.0%) | 0 (0.0%) |
| 6 to 18 Years | 1,455 (94.9%) | 79 (5.1%) |
| 19 to 25 Years | 579 (98.5%) | 9 (1.5%) |
| 26 to 34 Years | 620 (92.0%) | 54 (8.0%) |
| 35 to 44 Years | 733 (88.7%) | 93 (11.3%) |
| 45 to 54 Years | 1,191 (89.3%) | 143 (10.7%) |
| 55 to 64 Years | 854 (93.6%) | 58 (6.4%) |
| 65 to 74 Years | 754 (100.0%) | 0 (0.0%) |
| 75 Years and older | 401 (100.0%) | 0 (0.0%) |
| Total | 6,945 (94.1%) | 436 (5.9%) |
Health Insurance Coverage by Citizenship Status in Manhasset
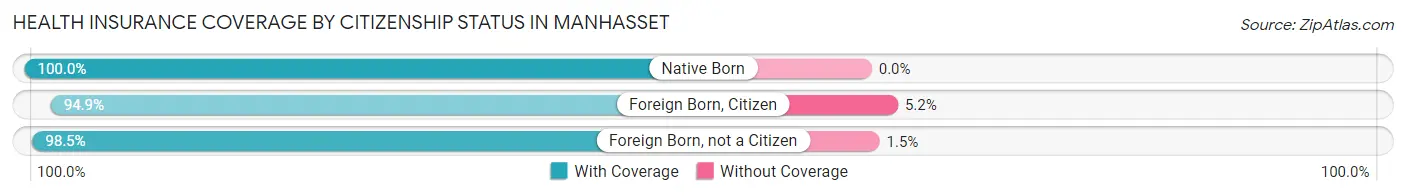
| Citizenship Status | With Coverage | Without Coverage |
| Native Born | 358 (100.0%) | 0 (0.0%) |
| Foreign Born, Citizen | 1,455 (94.9%) | 79 (5.1%) |
| Foreign Born, not a Citizen | 579 (98.5%) | 9 (1.5%) |
Health Insurance Coverage by Household Income in Manhasset
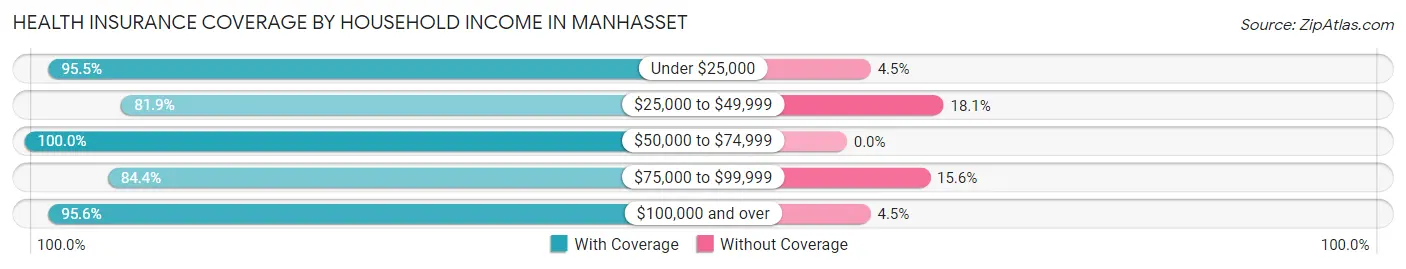
| Household Income | With Coverage | Without Coverage |
| Under $25,000 | 426 (95.5%) | 20 (4.5%) |
| $25,000 to $49,999 | 316 (81.9%) | 70 (18.1%) |
| $50,000 to $74,999 | 476 (100.0%) | 0 (0.0%) |
| $75,000 to $99,999 | 563 (84.4%) | 104 (15.6%) |
| $100,000 and over | 5,136 (95.6%) | 239 (4.4%) |
Public vs Private Health Insurance Coverage by Age in Manhasset
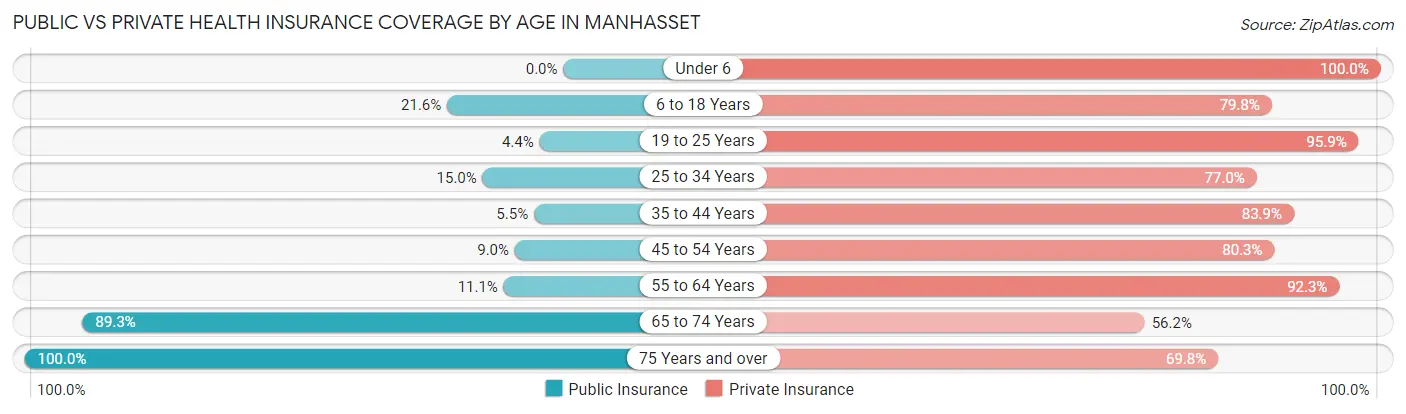
| Age Bracket | Public Insurance | Private Insurance |
| Under 6 | 0 (0.0%) | 358 (100.0%) |
| 6 to 18 Years | 331 (21.6%) | 1,224 (79.8%) |
| 19 to 25 Years | 26 (4.4%) | 564 (95.9%) |
| 25 to 34 Years | 101 (15.0%) | 519 (77.0%) |
| 35 to 44 Years | 45 (5.4%) | 693 (83.9%) |
| 45 to 54 Years | 120 (9.0%) | 1,071 (80.3%) |
| 55 to 64 Years | 101 (11.1%) | 842 (92.3%) |
| 65 to 74 Years | 673 (89.3%) | 424 (56.2%) |
| 75 Years and over | 401 (100.0%) | 280 (69.8%) |
| Total | 1,798 (24.4%) | 5,975 (80.9%) |
Disability Status by Sex by Age in Manhasset
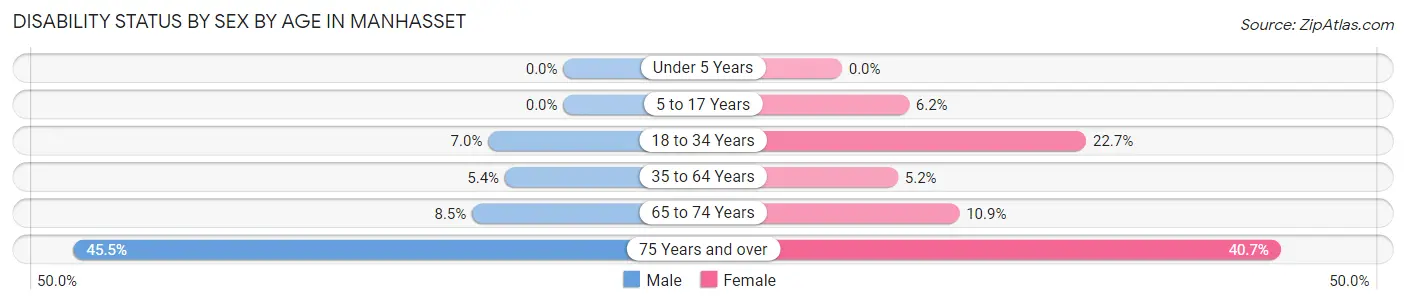
| Age Bracket | Male | Female |
| Under 5 Years | 0 (0.0%) | 0 (0.0%) |
| 5 to 17 Years | 0 (0.0%) | 52 (6.2%) |
| 18 to 34 Years | 51 (7.0%) | 134 (22.7%) |
| 35 to 64 Years | 80 (5.4%) | 83 (5.2%) |
| 65 to 74 Years | 32 (8.5%) | 41 (10.9%) |
| 75 Years and over | 45 (45.5%) | 123 (40.7%) |
Disability Class by Sex by Age in Manhasset
Disability Class: Hearing Difficulty
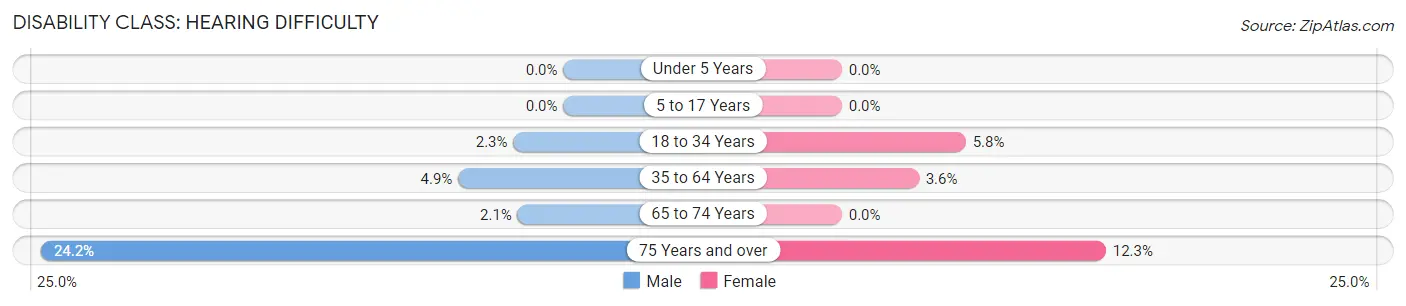
| Age Bracket | Male | Female |
| Under 5 Years | 0 (0.0%) | 0 (0.0%) |
| 5 to 17 Years | 0 (0.0%) | 0 (0.0%) |
| 18 to 34 Years | 17 (2.3%) | 34 (5.8%) |
| 35 to 64 Years | 72 (4.9%) | 57 (3.6%) |
| 65 to 74 Years | 8 (2.1%) | 0 (0.0%) |
| 75 Years and over | 24 (24.2%) | 37 (12.2%) |
Disability Class: Vision Difficulty
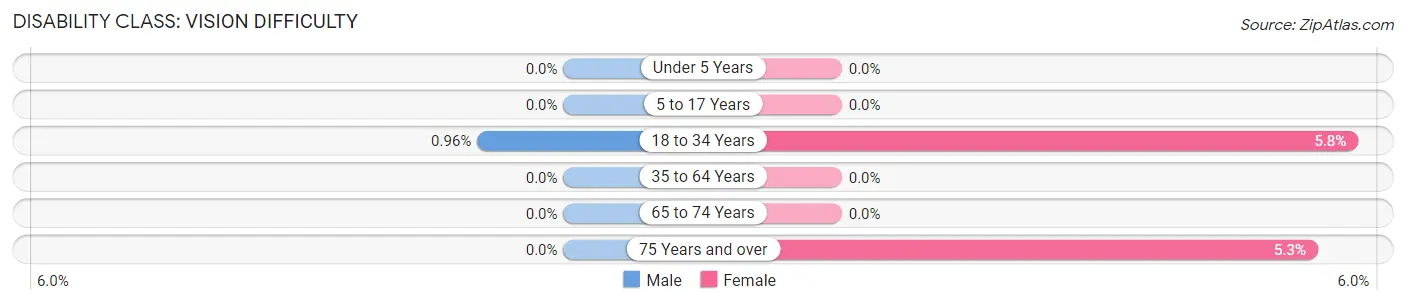
| Age Bracket | Male | Female |
| Under 5 Years | 0 (0.0%) | 0 (0.0%) |
| 5 to 17 Years | 0 (0.0%) | 0 (0.0%) |
| 18 to 34 Years | 7 (1.0%) | 34 (5.8%) |
| 35 to 64 Years | 0 (0.0%) | 0 (0.0%) |
| 65 to 74 Years | 0 (0.0%) | 0 (0.0%) |
| 75 Years and over | 0 (0.0%) | 16 (5.3%) |
Disability Class: Cognitive Difficulty
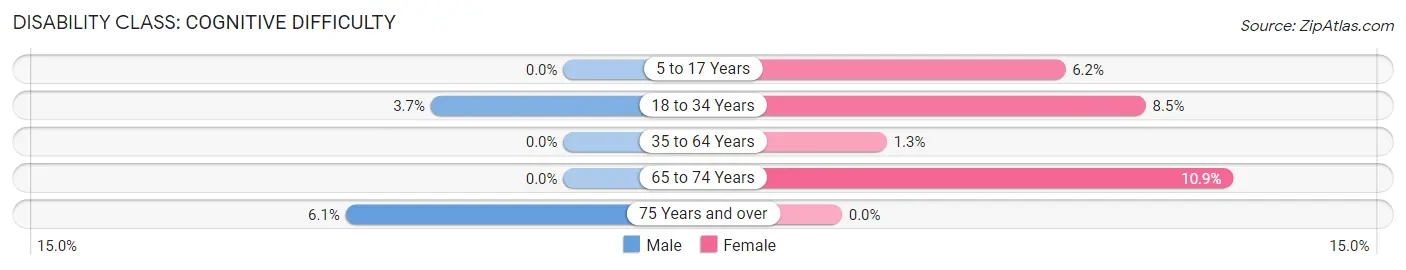
| Age Bracket | Male | Female |
| 5 to 17 Years | 0 (0.0%) | 52 (6.2%) |
| 18 to 34 Years | 27 (3.7%) | 50 (8.5%) |
| 35 to 64 Years | 0 (0.0%) | 20 (1.3%) |
| 65 to 74 Years | 0 (0.0%) | 41 (10.9%) |
| 75 Years and over | 6 (6.1%) | 0 (0.0%) |
Disability Class: Ambulatory Difficulty
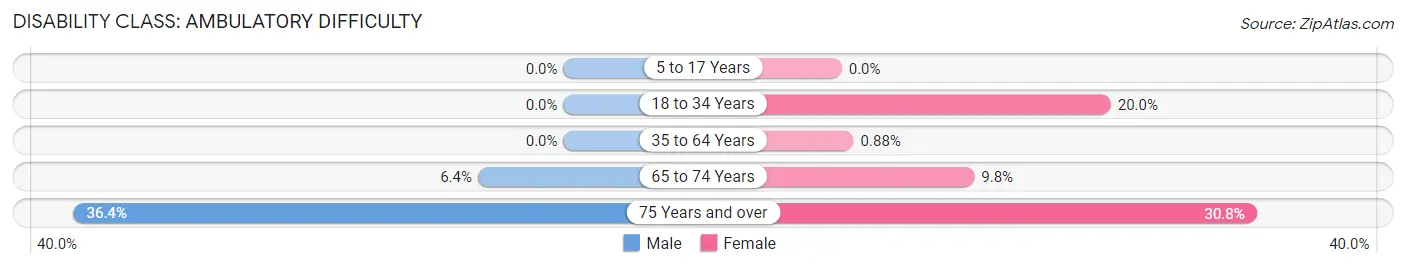
| Age Bracket | Male | Female |
| 5 to 17 Years | 0 (0.0%) | 0 (0.0%) |
| 18 to 34 Years | 0 (0.0%) | 118 (20.0%) |
| 35 to 64 Years | 0 (0.0%) | 14 (0.9%) |
| 65 to 74 Years | 24 (6.4%) | 37 (9.8%) |
| 75 Years and over | 36 (36.4%) | 93 (30.8%) |
Disability Class: Self-Care Difficulty
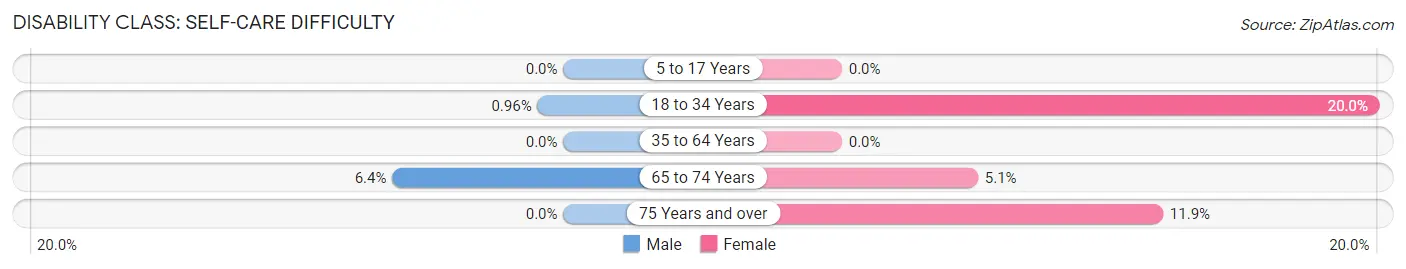
| Age Bracket | Male | Female |
| 5 to 17 Years | 0 (0.0%) | 0 (0.0%) |
| 18 to 34 Years | 7 (1.0%) | 118 (20.0%) |
| 35 to 64 Years | 0 (0.0%) | 0 (0.0%) |
| 65 to 74 Years | 24 (6.4%) | 19 (5.1%) |
| 75 Years and over | 0 (0.0%) | 36 (11.9%) |
Technology Access in Manhasset
Computing Device Access in Manhasset
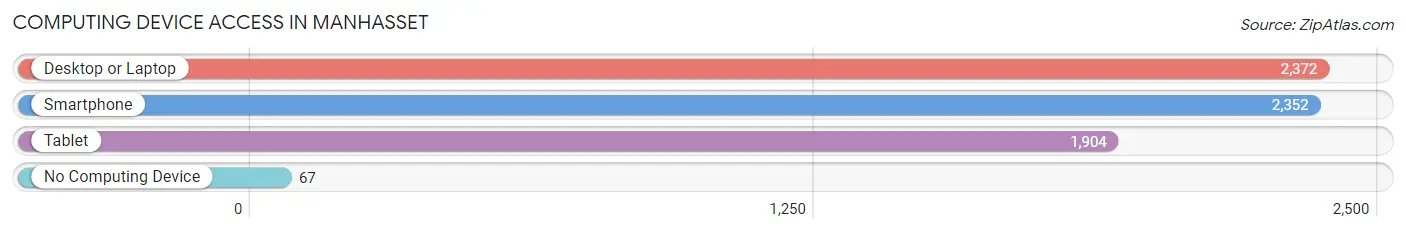
| Device Type | # Households | % Households |
| Desktop or Laptop | 2,372 | 93.5% |
| Smartphone | 2,352 | 92.7% |
| Tablet | 1,904 | 75.0% |
| No Computing Device | 67 | 2.6% |
| Total | 2,537 | 100.0% |
Internet Access in Manhasset
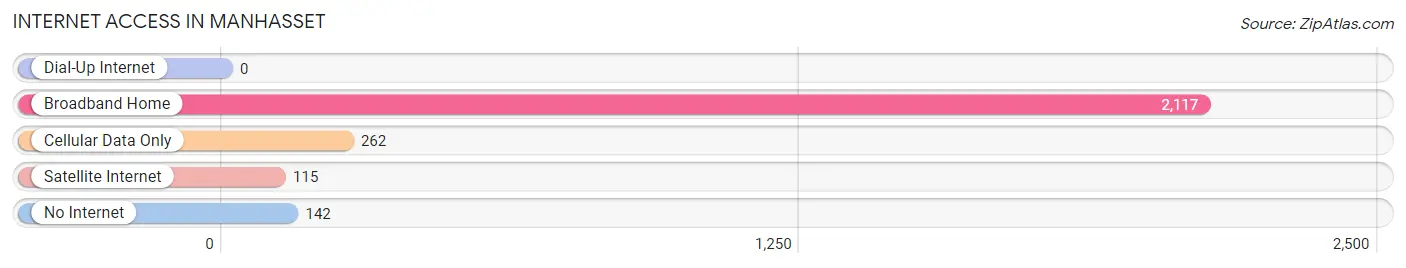
| Internet Type | # Households | % Households |
| Dial-Up Internet | 0 | 0.0% |
| Broadband Home | 2,117 | 83.5% |
| Cellular Data Only | 262 | 10.3% |
| Satellite Internet | 115 | 4.5% |
| No Internet | 142 | 5.6% |
| Total | 2,537 | 100.0% |
Manhasset Summary
Manhasset is a hamlet and census-designated place (CDP) located in Nassau County, New York, United States, on the North Shore of Long Island. As of the 2010 census, the population of Manhasset was 8,080.
History
The area that is now Manhasset was originally inhabited by the Matinecock Native American tribe. The Matinecock were part of the Algonquian peoples, a large group of Native Americans who lived in the Northeastern United States. The Matinecock were a peaceful tribe and were known for their farming and fishing skills.
The first European settlers arrived in Manhasset in 1643. The area was originally part of the Town of North Hempstead, which was established in 1784. In 1838, the area was separated from North Hempstead and became the Town of Manhasset. The town was named after the Manhasset Indians, a branch of the Matinecock tribe.
In 1898, Manhasset was incorporated as a village. The village was dissolved in 1910 and Manhasset became part of the Town of North Hempstead once again.
Geography
Manhasset is located at 40°48'N 73°41'W (40.80, -73.68). According to the United States Census Bureau, the CDP has a total area of 2.6 square miles (6.7 km2), all of it land.
Manhasset is located on the North Shore of Long Island, approximately 25 miles (40 km) east of Manhattan. It is bordered by the villages of Great Neck and Port Washington to the west, Roslyn to the south, and Plandome to the east.
Economy
Manhasset is a wealthy community with a strong economy. The median household income in Manhasset is $150,000, which is significantly higher than the national median of $50,000. The unemployment rate in Manhasset is 2.3%, which is lower than the national average of 5.2%.
The largest employers in Manhasset are North Shore University Hospital, St. Francis Hospital, and Northwell Health. Other major employers include the Manhasset School District, Manhasset Public Library, and the Manhasset Chamber of Commerce.
Demographics
As of the 2010 census, there were 8,080 people, 2,845 households, and 2,092 families residing in Manhasset. The population density was 3,093.3 people per square mile (1,193.2/km2). There were 2,945 housing units at an average density of 1,125.3 per square mile (433.3/km2). The racial makeup of the CDP was 81.2% White, 4.2% African American, 0.1% Native American, 10.3% Asian, 0.0% Pacific Islander, 1.7% from other races, and 2.5% from two or more races. Hispanic or Latino of any race were 6.2% of the population.
There were 2,845 households, out of which 37.2% had children under the age of 18 living with them, 63.2% were married couples living together, 8.2% had a female householder with no husband present, and 25.3% were non-families. 21.2% of all households were made up of individuals, and 11.2% had someone living alone who was 65 years of age or older. The average household size was 2.82 and the average family size was 3.30.
In Manhasset, the population was spread out, with 25.2% under the age of 18, 5.2% from 18 to 24, 24.2% from 25 to 44, 28.2% from 45 to 64, and 17.2% who were 65 years of age or older. The median age was 42 years. For every 100 females, there were 91.2 males. For every 100 females age 18 and over, there were 87.2 males.
The median income for a household in Manhasset was $150,000, and the median income for a family was $170,000. Males had a median income of $100,000 versus $60,000 for females. The per capita income for the CDP was $80,000. About 2.2% of families and 3.2% of the population were below the poverty line, including 3.2% of those under age 18 and 4.2% of those age 65 or over.
Common Questions
What is the Total Population of Manhasset?
Total Population of Manhasset is 7,720.
What is the Total Male Population of Manhasset?
Total Male Population of Manhasset is 3,754.
What is the Total Female Population of Manhasset?
Total Female Population of Manhasset is 3,966.
What is the Ratio of Males per 100 Females in Manhasset?
There are 94.65 Males per 100 Females in Manhasset.
What is the Ratio of Females per 100 Males in Manhasset?
There are 105.65 Females per 100 Males in Manhasset.
What is the Median Population Age in Manhasset?
Median Population Age in Manhasset is 44.2 Years.
What is the Average Family Size in Manhasset
Average Family Size in Manhasset is 3.4 People.
What is the Average Household Size in Manhasset
Average Household Size in Manhasset is 2.9 People.
What is Per Capita Income in Manhasset?
Per Capita income in Manhasset is $86,719.
What is the Median Family Income in Manhasset?
Median Family Income in Manhasset is $210,680.
What is the Median Household income in Manhasset?
Median Household Income in Manhasset is $156,959.
What is Income or Wage Gap in Manhasset?
Income or Wage Gap in Manhasset is 51.9%.
Women in Manhasset earn 48.1 cents for every dollar earned by a man.
What is Family Income Deficit in Manhasset?
Family Income Deficit in Manhasset is $20,241.
Families that are below poverty line in Manhasset earn $20,241 less on average than the poverty threshold level.
What is Inequality or Gini Index in Manhasset?
Inequality or Gini Index in Manhasset is 0.55.
How Large is the Labor Force in Manhasset?
There are 3,747 People in the Labor Forcein in Manhasset.
What is the Percentage of People in the Labor Force in Manhasset?
60.2% of People are in the Labor Force in Manhasset.
What is the Unemployment Rate in Manhasset?
Unemployment Rate in Manhasset is 0.6%.