Cities with the Most Immigrants from South Eastern Asia in Iowa
RELATED REPORTS & OPTIONS
South Eastern Asia
Iowa
Compare Cities
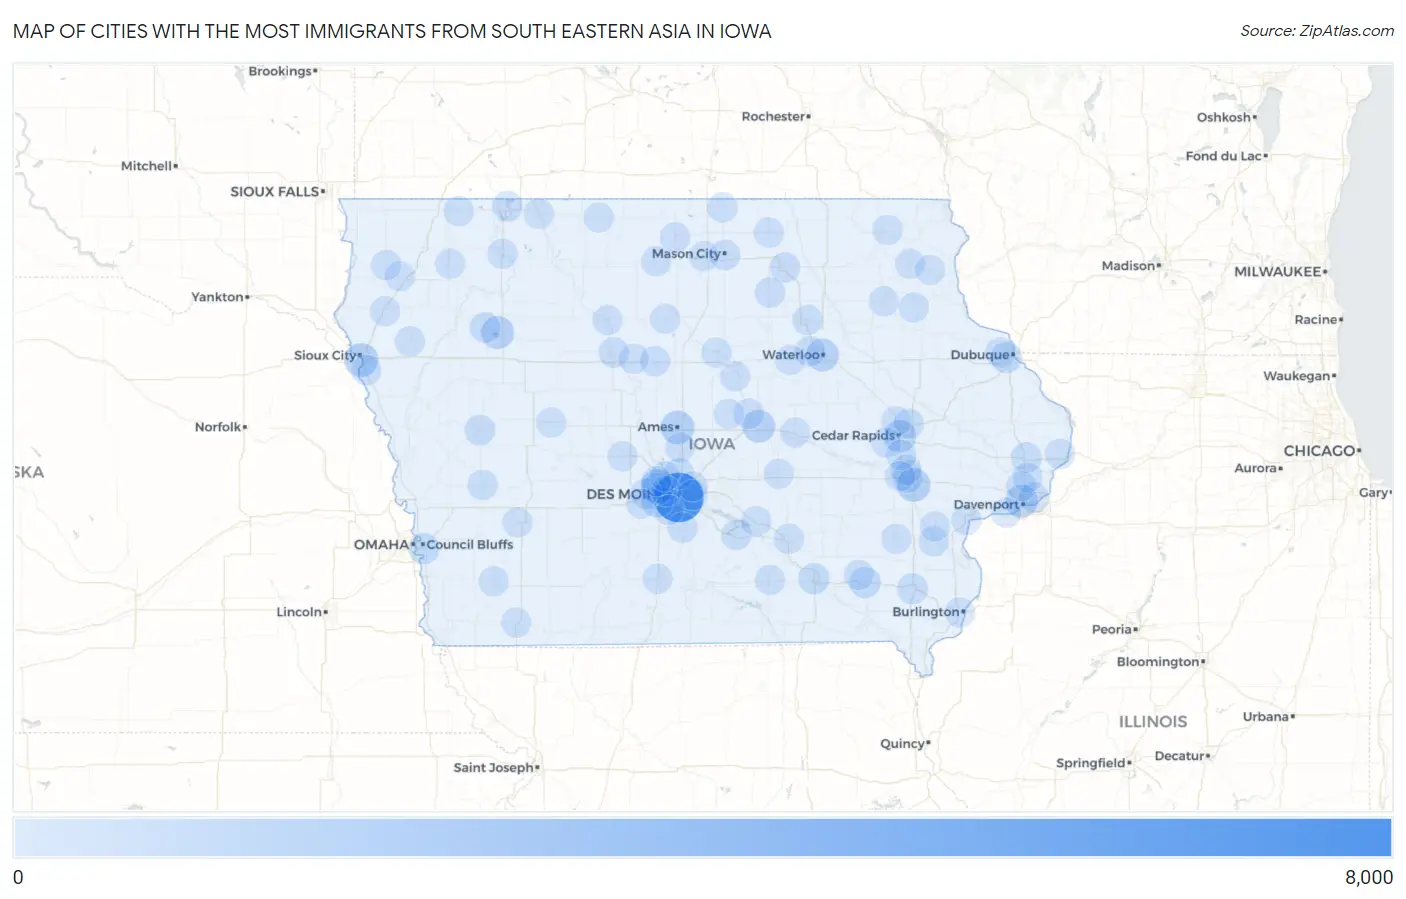
Map of Cities with the Most Immigrants from South Eastern Asia in Iowa
0
8,000
Cities with the Most Immigrants from South Eastern Asia in Iowa
| City | South Eastern Asia | vs State | vs National | |
| 1. | Des Moines | 6,930 | 25,692(26.97%)#1 | 4,292,058(0.16%)#84 |
| 2. | Sioux City | 1,251 | 25,692(4.87%)#2 | 4,292,058(0.03%)#494 |
| 3. | Ames | 1,200 | 25,692(4.67%)#3 | 4,292,058(0.03%)#508 |
| 4. | Urbandale | 1,150 | 25,692(4.48%)#4 | 4,292,058(0.03%)#524 |
| 5. | Iowa City | 1,100 | 25,692(4.28%)#5 | 4,292,058(0.03%)#549 |
| 6. | Storm Lake | 983 | 25,692(3.83%)#6 | 4,292,058(0.02%)#611 |
| 7. | Marshalltown | 934 | 25,692(3.64%)#7 | 4,292,058(0.02%)#640 |
| 8. | Waterloo | 928 | 25,692(3.61%)#8 | 4,292,058(0.02%)#642 |
| 9. | Davenport | 913 | 25,692(3.55%)#9 | 4,292,058(0.02%)#652 |
| 10. | Cedar Rapids | 827 | 25,692(3.22%)#10 | 4,292,058(0.02%)#721 |
| 11. | West Des Moines | 701 | 25,692(2.73%)#11 | 4,292,058(0.02%)#821 |
| 12. | Clive | 562 | 25,692(2.19%)#12 | 4,292,058(0.01%)#966 |
| 13. | Fairfield | 418 | 25,692(1.63%)#13 | 4,292,058(0.01%)#1,183 |
| 14. | Dubuque | 375 | 25,692(1.46%)#14 | 4,292,058(0.01%)#1,294 |
| 15. | Ottumwa | 356 | 25,692(1.39%)#15 | 4,292,058(0.01%)#1,360 |
| 16. | Ankeny | 337 | 25,692(1.31%)#16 | 4,292,058(0.01%)#1,424 |
| 17. | Council Bluffs | 330 | 25,692(1.28%)#17 | 4,292,058(0.01%)#1,439 |
| 18. | Mount Pleasant | 262 | 25,692(1.02%)#18 | 4,292,058(0.01%)#1,684 |
| 19. | Bettendorf | 230 | 25,692(0.90%)#19 | 4,292,058(0.01%)#1,836 |
| 20. | Dewitt | 218 | 25,692(0.85%)#20 | 4,292,058(0.01%)#1,915 |
| 21. | Waukee | 217 | 25,692(0.84%)#21 | 4,292,058(0.01%)#1,916 |
| 22. | Denison | 204 | 25,692(0.79%)#22 | 4,292,058(0.00%)#1,996 |
| 23. | Alta | 179 | 25,692(0.70%)#23 | 4,292,058(0.00%)#2,167 |
| 24. | Mason City | 170 | 25,692(0.66%)#24 | 4,292,058(0.00%)#2,236 |
| 25. | Albion | 170 | 25,692(0.66%)#25 | 4,292,058(0.00%)#2,242 |
| 26. | Forest City | 155 | 25,692(0.60%)#26 | 4,292,058(0.00%)#2,392 |
| 27. | Coralville | 141 | 25,692(0.55%)#27 | 4,292,058(0.00%)#2,553 |
| 28. | Indianola | 140 | 25,692(0.54%)#28 | 4,292,058(0.00%)#2,566 |
| 29. | Fort Dodge | 132 | 25,692(0.51%)#29 | 4,292,058(0.00%)#2,658 |
| 30. | Cedar Falls | 121 | 25,692(0.47%)#30 | 4,292,058(0.00%)#2,801 |
| 31. | Charles City | 117 | 25,692(0.46%)#31 | 4,292,058(0.00%)#2,868 |
| 32. | Windsor Heights | 114 | 25,692(0.44%)#32 | 4,292,058(0.00%)#2,918 |
| 33. | Orleans | 112 | 25,692(0.44%)#33 | 4,292,058(0.00%)#2,941 |
| 34. | Pleasant Hill | 108 | 25,692(0.42%)#34 | 4,292,058(0.00%)#2,990 |
| 35. | Webster City | 98 | 25,692(0.38%)#35 | 4,292,058(0.00%)#3,152 |
| 36. | North Liberty | 95 | 25,692(0.37%)#36 | 4,292,058(0.00%)#3,194 |
| 37. | Columbus Junction | 91 | 25,692(0.35%)#37 | 4,292,058(0.00%)#3,273 |
| 38. | Shueyville | 88 | 25,692(0.34%)#38 | 4,292,058(0.00%)#3,324 |
| 39. | Marion | 85 | 25,692(0.33%)#39 | 4,292,058(0.00%)#3,370 |
| 40. | Harlan | 80 | 25,692(0.31%)#40 | 4,292,058(0.00%)#3,477 |
| 41. | Knoxville | 78 | 25,692(0.30%)#41 | 4,292,058(0.00%)#3,525 |
| 42. | Greene | 74 | 25,692(0.29%)#42 | 4,292,058(0.00%)#3,611 |
| 43. | Sergeant Bluff | 66 | 25,692(0.26%)#43 | 4,292,058(0.00%)#3,790 |
| 44. | Eldridge | 60 | 25,692(0.23%)#44 | 4,292,058(0.00%)#3,939 |
| 45. | Waverly | 58 | 25,692(0.23%)#45 | 4,292,058(0.00%)#3,988 |
| 46. | Albia | 57 | 25,692(0.22%)#46 | 4,292,058(0.00%)#4,027 |
| 47. | Pella | 49 | 25,692(0.19%)#47 | 4,292,058(0.00%)#4,307 |
| 48. | Decorah | 46 | 25,692(0.18%)#48 | 4,292,058(0.00%)#4,432 |
| 49. | Eldora | 46 | 25,692(0.18%)#49 | 4,292,058(0.00%)#4,444 |
| 50. | Orange City | 44 | 25,692(0.17%)#50 | 4,292,058(0.00%)#4,522 |
| 51. | Johnston | 42 | 25,692(0.16%)#51 | 4,292,058(0.00%)#4,593 |
| 52. | Clarinda | 42 | 25,692(0.16%)#52 | 4,292,058(0.00%)#4,617 |
| 53. | Tiffin | 42 | 25,692(0.16%)#53 | 4,292,058(0.00%)#4,620 |
| 54. | Asbury | 41 | 25,692(0.16%)#54 | 4,292,058(0.00%)#4,666 |
| 55. | Oskaloosa | 40 | 25,692(0.16%)#55 | 4,292,058(0.00%)#4,717 |
| 56. | Osceola | 38 | 25,692(0.15%)#56 | 4,292,058(0.00%)#4,847 |
| 57. | Sioux Center | 37 | 25,692(0.14%)#57 | 4,292,058(0.00%)#4,877 |
| 58. | Muscatine | 35 | 25,692(0.14%)#58 | 4,292,058(0.00%)#4,948 |
| 59. | Clear Lake | 33 | 25,692(0.13%)#59 | 4,292,058(0.00%)#5,084 |
| 60. | Osage | 33 | 25,692(0.13%)#60 | 4,292,058(0.00%)#5,100 |
| 61. | Burlington | 30 | 25,692(0.12%)#61 | 4,292,058(0.00%)#5,250 |
| 62. | Grimes | 29 | 25,692(0.11%)#62 | 4,292,058(0.00%)#5,332 |
| 63. | Iowa Falls | 29 | 25,692(0.11%)#63 | 4,292,058(0.00%)#5,362 |
| 64. | Clinton | 27 | 25,692(0.11%)#64 | 4,292,058(0.00%)#5,473 |
| 65. | Norwalk | 26 | 25,692(0.10%)#65 | 4,292,058(0.00%)#5,549 |
| 66. | Postville | 25 | 25,692(0.10%)#66 | 4,292,058(0.00%)#5,676 |
| 67. | Washington | 22 | 25,692(0.09%)#67 | 4,292,058(0.00%)#5,882 |
| 68. | Clarion | 21 | 25,692(0.08%)#68 | 4,292,058(0.00%)#6,013 |
| 69. | Glidden | 21 | 25,692(0.08%)#69 | 4,292,058(0.00%)#6,032 |
| 70. | Altoona | 20 | 25,692(0.08%)#70 | 4,292,058(0.00%)#6,046 |
| 71. | Le Mars | 20 | 25,692(0.08%)#71 | 4,292,058(0.00%)#6,055 |
| 72. | Red Oak | 19 | 25,692(0.07%)#72 | 4,292,058(0.00%)#6,157 |
| 73. | Primghar | 19 | 25,692(0.07%)#73 | 4,292,058(0.00%)#6,225 |
| 74. | Ocheyedan | 19 | 25,692(0.07%)#74 | 4,292,058(0.00%)#6,228 |
| 75. | Conesville | 18 | 25,692(0.07%)#75 | 4,292,058(0.00%)#6,320 |
| 76. | Grinnell | 17 | 25,692(0.07%)#76 | 4,292,058(0.00%)#6,347 |
| 77. | Volga | 17 | 25,692(0.07%)#77 | 4,292,058(0.00%)#6,431 |
| 78. | Spencer | 16 | 25,692(0.06%)#78 | 4,292,058(0.00%)#6,454 |
| 79. | Northwood | 16 | 25,692(0.06%)#79 | 4,292,058(0.00%)#6,526 |
| 80. | Monona | 16 | 25,692(0.06%)#80 | 4,292,058(0.00%)#6,541 |
| 81. | Atlantic | 15 | 25,692(0.06%)#81 | 4,292,058(0.00%)#6,591 |
| 82. | Humboldt | 14 | 25,692(0.05%)#82 | 4,292,058(0.00%)#6,709 |
| 83. | Park View | 14 | 25,692(0.05%)#83 | 4,292,058(0.00%)#6,744 |
| 84. | Britt | 14 | 25,692(0.05%)#84 | 4,292,058(0.00%)#6,765 |
| 85. | Duncombe | 14 | 25,692(0.05%)#85 | 4,292,058(0.00%)#6,800 |
| 86. | Toledo | 13 | 25,692(0.05%)#86 | 4,292,058(0.00%)#6,912 |
| 87. | Kingsley | 13 | 25,692(0.05%)#87 | 4,292,058(0.00%)#6,930 |
| 88. | Buffalo | 12 | 25,692(0.05%)#88 | 4,292,058(0.00%)#7,085 |
| 89. | Swea City | 12 | 25,692(0.05%)#89 | 4,292,058(0.00%)#7,095 |
| 90. | Maharishi Vedic City | 12 | 25,692(0.05%)#90 | 4,292,058(0.00%)#7,111 |
| 91. | Hiawatha | 11 | 25,692(0.04%)#91 | 4,292,058(0.00%)#7,143 |
| 92. | Van Meter | 11 | 25,692(0.04%)#92 | 4,292,058(0.00%)#7,244 |
| 93. | Dike | 11 | 25,692(0.04%)#93 | 4,292,058(0.00%)#7,254 |
| 94. | Fayette | 11 | 25,692(0.04%)#94 | 4,292,058(0.00%)#7,261 |
| 95. | Clemons | 11 | 25,692(0.04%)#95 | 4,292,058(0.00%)#7,295 |
| 96. | Perry | 10 | 25,692(0.04%)#96 | 4,292,058(0.00%)#7,326 |
| 97. | Estherville | 10 | 25,692(0.04%)#97 | 4,292,058(0.00%)#7,346 |
| 98. | Huxley | 10 | 25,692(0.04%)#98 | 4,292,058(0.00%)#7,356 |
| 99. | Fairfax | 10 | 25,692(0.04%)#99 | 4,292,058(0.00%)#7,384 |
| 100. | Kent Estates | 10 | 25,692(0.04%)#100 | 4,292,058(0.00%)#7,401 |
Common Questions
What are the Top 10 Cities with the Most Immigrants from South Eastern Asia in Iowa?
Top 10 Cities with the Most Immigrants from South Eastern Asia in Iowa are:
#1
6,930
#2
1,251
#3
1,200
#4
1,150
#5
1,100
#6
983
#7
934
#8
928
#9
913
#10
827
What city has the Most Immigrants from South Eastern Asia in Iowa?
Des Moines has the Most Immigrants from South Eastern Asia in Iowa with 6,930.
What is the Total Immigrants from South Eastern Asia in the State of Iowa?
Total Immigrants from South Eastern Asia in Iowa is 25,692.
What is the Total Immigrants from South Eastern Asia in the United States?
Total Immigrants from South Eastern Asia in the United States is 4,292,058.