Cities with the Most Immigrants from South Eastern Asia in Pennsylvania
RELATED REPORTS & OPTIONS
South Eastern Asia
Pennsylvania
Compare Cities
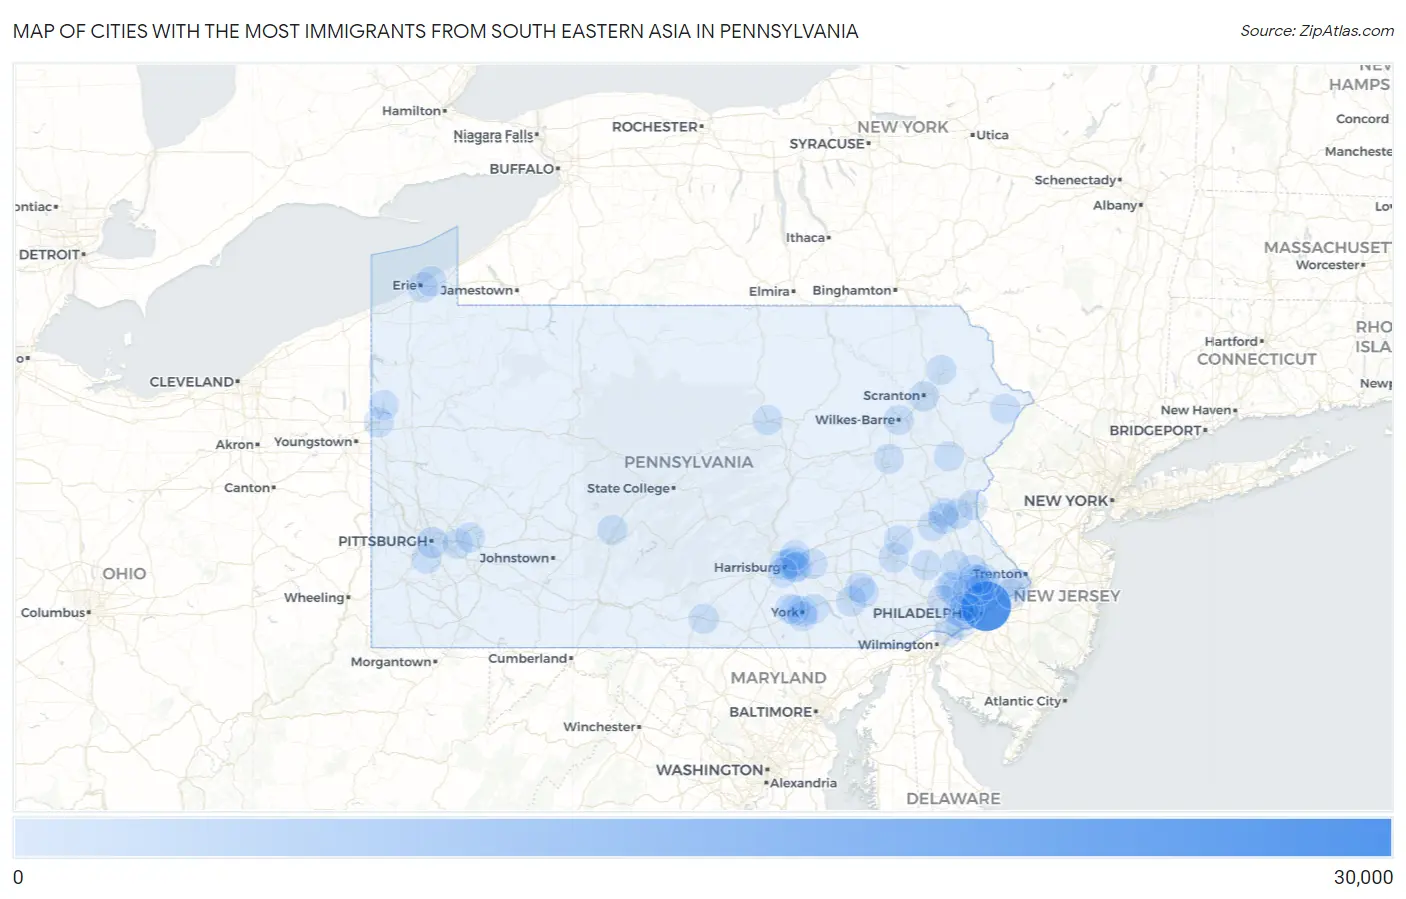
Map of Cities with the Most Immigrants from South Eastern Asia in Pennsylvania
0
30,000
Cities with the Most Immigrants from South Eastern Asia in Pennsylvania
| City | South Eastern Asia | vs State | vs National | |
| 1. | Philadelphia | 27,498 | 76,772(35.82%)#1 | 4,292,058(0.64%)#11 |
| 2. | Pittsburgh | 1,632 | 76,772(2.13%)#2 | 4,292,058(0.04%)#379 |
| 3. | Allentown | 743 | 76,772(0.97%)#3 | 4,292,058(0.02%)#780 |
| 4. | King Of Prussia | 649 | 76,772(0.85%)#4 | 4,292,058(0.02%)#876 |
| 5. | Scranton | 581 | 76,772(0.76%)#5 | 4,292,058(0.01%)#945 |
| 6. | Lancaster | 574 | 76,772(0.75%)#6 | 4,292,058(0.01%)#951 |
| 7. | Lansdale Borough | 551 | 76,772(0.72%)#7 | 4,292,058(0.01%)#977 |
| 8. | Colonial Park | 527 | 76,772(0.69%)#8 | 4,292,058(0.01%)#1,004 |
| 9. | Harrisburg | 449 | 76,772(0.58%)#9 | 4,292,058(0.01%)#1,115 |
| 10. | Drexel Hill | 426 | 76,772(0.55%)#10 | 4,292,058(0.01%)#1,162 |
| 11. | York | 394 | 76,772(0.51%)#11 | 4,292,058(0.01%)#1,249 |
| 12. | Levittown | 382 | 76,772(0.50%)#12 | 4,292,058(0.01%)#1,279 |
| 13. | Wilkes Barre | 369 | 76,772(0.48%)#13 | 4,292,058(0.01%)#1,316 |
| 14. | Bethlehem | 360 | 76,772(0.47%)#14 | 4,292,058(0.01%)#1,345 |
| 15. | Monroeville | 359 | 76,772(0.47%)#15 | 4,292,058(0.01%)#1,351 |
| 16. | Horsham | 345 | 76,772(0.45%)#16 | 4,292,058(0.01%)#1,395 |
| 17. | Progress | 307 | 76,772(0.40%)#17 | 4,292,058(0.01%)#1,519 |
| 18. | Erie | 259 | 76,772(0.34%)#18 | 4,292,058(0.01%)#1,693 |
| 19. | Montgomeryville | 248 | 76,772(0.32%)#19 | 4,292,058(0.01%)#1,750 |
| 20. | Villanova | 248 | 76,772(0.32%)#20 | 4,292,058(0.01%)#1,751 |
| 21. | Northwest Harborcreek | 241 | 76,772(0.31%)#21 | 4,292,058(0.01%)#1,790 |
| 22. | Shiloh | 228 | 76,772(0.30%)#22 | 4,292,058(0.01%)#1,853 |
| 23. | Boothwyn | 214 | 76,772(0.28%)#23 | 4,292,058(0.00%)#1,937 |
| 24. | South Williamsport Borough | 210 | 76,772(0.27%)#24 | 4,292,058(0.00%)#1,958 |
| 25. | Norristown Borough | 199 | 76,772(0.26%)#25 | 4,292,058(0.00%)#2,027 |
| 26. | Rutherford | 192 | 76,772(0.25%)#26 | 4,292,058(0.00%)#2,080 |
| 27. | Lititz Borough | 186 | 76,772(0.24%)#27 | 4,292,058(0.00%)#2,132 |
| 28. | Sierra View | 179 | 76,772(0.23%)#28 | 4,292,058(0.00%)#2,166 |
| 29. | Reading | 166 | 76,772(0.22%)#29 | 4,292,058(0.00%)#2,270 |
| 30. | Hershey | 161 | 76,772(0.21%)#30 | 4,292,058(0.00%)#2,327 |
| 31. | State College Borough | 155 | 76,772(0.20%)#31 | 4,292,058(0.00%)#2,385 |
| 32. | Prospect Park Borough | 152 | 76,772(0.20%)#32 | 4,292,058(0.00%)#2,427 |
| 33. | Fullerton | 150 | 76,772(0.20%)#33 | 4,292,058(0.00%)#2,440 |
| 34. | Bethel Park | 147 | 76,772(0.19%)#34 | 4,292,058(0.00%)#2,474 |
| 35. | Phoenixville Borough | 147 | 76,772(0.19%)#35 | 4,292,058(0.00%)#2,477 |
| 36. | Dunmore Borough | 147 | 76,772(0.19%)#36 | 4,292,058(0.00%)#2,479 |
| 37. | Willow Grove | 144 | 76,772(0.19%)#37 | 4,292,058(0.00%)#2,521 |
| 38. | Gettysburg Borough | 142 | 76,772(0.18%)#38 | 4,292,058(0.00%)#2,545 |
| 39. | Leola | 140 | 76,772(0.18%)#39 | 4,292,058(0.00%)#2,568 |
| 40. | Merion Station | 139 | 76,772(0.18%)#40 | 4,292,058(0.00%)#2,582 |
| 41. | Downingtown Borough | 138 | 76,772(0.18%)#41 | 4,292,058(0.00%)#2,596 |
| 42. | Quarryville Borough | 135 | 76,772(0.18%)#42 | 4,292,058(0.00%)#2,626 |
| 43. | Brownstown | 134 | 76,772(0.17%)#43 | 4,292,058(0.00%)#2,638 |
| 44. | Aldan Borough | 133 | 76,772(0.17%)#44 | 4,292,058(0.00%)#2,654 |
| 45. | Carlisle Borough | 129 | 76,772(0.17%)#45 | 4,292,058(0.00%)#2,699 |
| 46. | Trooper | 129 | 76,772(0.17%)#46 | 4,292,058(0.00%)#2,707 |
| 47. | Pottstown Borough | 127 | 76,772(0.17%)#47 | 4,292,058(0.00%)#2,729 |
| 48. | Hermitage | 120 | 76,772(0.16%)#48 | 4,292,058(0.00%)#2,819 |
| 49. | Souderton Borough | 120 | 76,772(0.16%)#49 | 4,292,058(0.00%)#2,824 |
| 50. | Blandon | 118 | 76,772(0.15%)#50 | 4,292,058(0.00%)#2,852 |
| 51. | Gold Key Lake | 116 | 76,772(0.15%)#51 | 4,292,058(0.00%)#2,888 |
| 52. | Ancient Oaks | 112 | 76,772(0.15%)#52 | 4,292,058(0.00%)#2,937 |
| 53. | Audubon | 108 | 76,772(0.14%)#53 | 4,292,058(0.00%)#2,994 |
| 54. | Broomall | 104 | 76,772(0.14%)#54 | 4,292,058(0.00%)#3,052 |
| 55. | Whitehall Borough | 103 | 76,772(0.13%)#55 | 4,292,058(0.00%)#3,062 |
| 56. | Williamsport | 101 | 76,772(0.13%)#56 | 4,292,058(0.00%)#3,097 |
| 57. | Penn Wynne | 101 | 76,772(0.13%)#57 | 4,292,058(0.00%)#3,104 |
| 58. | Guilford | 101 | 76,772(0.13%)#58 | 4,292,058(0.00%)#3,106 |
| 59. | Wayne | 100 | 76,772(0.13%)#59 | 4,292,058(0.00%)#3,123 |
| 60. | Bala Cynwyd | 99 | 76,772(0.13%)#60 | 4,292,058(0.00%)#3,139 |
| 61. | Altoona | 98 | 76,772(0.13%)#61 | 4,292,058(0.00%)#3,146 |
| 62. | Collingdale Borough | 91 | 76,772(0.12%)#62 | 4,292,058(0.00%)#3,269 |
| 63. | Woodlyn | 89 | 76,772(0.12%)#63 | 4,292,058(0.00%)#3,306 |
| 64. | Freemansburg Borough | 89 | 76,772(0.12%)#64 | 4,292,058(0.00%)#3,311 |
| 65. | Lawnton | 88 | 76,772(0.11%)#65 | 4,292,058(0.00%)#3,322 |
| 66. | Linglestown | 85 | 76,772(0.11%)#66 | 4,292,058(0.00%)#3,390 |
| 67. | Ambler Borough | 84 | 76,772(0.11%)#67 | 4,292,058(0.00%)#3,406 |
| 68. | Paxtang Borough | 84 | 76,772(0.11%)#68 | 4,292,058(0.00%)#3,409 |
| 69. | Quakertown Borough | 83 | 76,772(0.11%)#69 | 4,292,058(0.00%)#3,419 |
| 70. | Carbondale | 82 | 76,772(0.11%)#70 | 4,292,058(0.00%)#3,436 |
| 71. | Lower Allen | 82 | 76,772(0.11%)#71 | 4,292,058(0.00%)#3,437 |
| 72. | Mckees Rocks Borough | 82 | 76,772(0.11%)#72 | 4,292,058(0.00%)#3,438 |
| 73. | Hanover Borough | 81 | 76,772(0.11%)#73 | 4,292,058(0.00%)#3,446 |
| 74. | Lansdowne Borough | 81 | 76,772(0.11%)#74 | 4,292,058(0.00%)#3,452 |
| 75. | Harleysville | 79 | 76,772(0.10%)#75 | 4,292,058(0.00%)#3,508 |
| 76. | West Reading Borough | 79 | 76,772(0.10%)#76 | 4,292,058(0.00%)#3,516 |
| 77. | Norwood Borough | 76 | 76,772(0.10%)#77 | 4,292,058(0.00%)#3,562 |
| 78. | Murrysville | 74 | 76,772(0.10%)#78 | 4,292,058(0.00%)#3,595 |
| 79. | Telford Borough | 71 | 76,772(0.09%)#79 | 4,292,058(0.00%)#3,683 |
| 80. | West Chester Borough | 70 | 76,772(0.09%)#80 | 4,292,058(0.00%)#3,691 |
| 81. | Spring House | 70 | 76,772(0.09%)#81 | 4,292,058(0.00%)#3,705 |
| 82. | Stonybrook | 69 | 76,772(0.09%)#82 | 4,292,058(0.00%)#3,721 |
| 83. | Croydon | 67 | 76,772(0.09%)#83 | 4,292,058(0.00%)#3,759 |
| 84. | Grantley | 67 | 76,772(0.09%)#84 | 4,292,058(0.00%)#3,771 |
| 85. | Reynolds Heights | 66 | 76,772(0.09%)#85 | 4,292,058(0.00%)#3,795 |
| 86. | Harleigh | 66 | 76,772(0.09%)#86 | 4,292,058(0.00%)#3,797 |
| 87. | Paoli | 64 | 76,772(0.08%)#87 | 4,292,058(0.00%)#3,833 |
| 88. | Southmont Borough | 64 | 76,772(0.08%)#88 | 4,292,058(0.00%)#3,841 |
| 89. | Parkside Borough | 64 | 76,772(0.08%)#89 | 4,292,058(0.00%)#3,842 |
| 90. | Easton | 62 | 76,772(0.08%)#90 | 4,292,058(0.00%)#3,879 |
| 91. | Ardmore | 62 | 76,772(0.08%)#91 | 4,292,058(0.00%)#3,886 |
| 92. | Plymouth Meeting | 61 | 76,772(0.08%)#92 | 4,292,058(0.00%)#3,914 |
| 93. | Oreland | 61 | 76,772(0.08%)#93 | 4,292,058(0.00%)#3,916 |
| 94. | Weigelstown | 60 | 76,772(0.08%)#94 | 4,292,058(0.00%)#3,932 |
| 95. | Palmyra Borough | 60 | 76,772(0.08%)#95 | 4,292,058(0.00%)#3,938 |
| 96. | Maple Glen | 60 | 76,772(0.08%)#96 | 4,292,058(0.00%)#3,940 |
| 97. | Halfway House | 60 | 76,772(0.08%)#97 | 4,292,058(0.00%)#3,950 |
| 98. | Dover Borough | 59 | 76,772(0.08%)#98 | 4,292,058(0.00%)#3,975 |
| 99. | Boswell Borough | 59 | 76,772(0.08%)#99 | 4,292,058(0.00%)#3,977 |
| 100. | Scottdale Borough | 58 | 76,772(0.08%)#100 | 4,292,058(0.00%)#3,995 |
Common Questions
What are the Top 10 Cities with the Most Immigrants from South Eastern Asia in Pennsylvania?
Top 10 Cities with the Most Immigrants from South Eastern Asia in Pennsylvania are:
#1
27,498
#2
1,632
#3
743
#4
649
#5
581
#6
574
#7
527
#8
449
#9
426
#10
394
What city has the Most Immigrants from South Eastern Asia in Pennsylvania?
Philadelphia has the Most Immigrants from South Eastern Asia in Pennsylvania with 27,498.
What is the Total Immigrants from South Eastern Asia in the State of Pennsylvania?
Total Immigrants from South Eastern Asia in Pennsylvania is 76,772.
What is the Total Immigrants from South Eastern Asia in the United States?
Total Immigrants from South Eastern Asia in the United States is 4,292,058.