Cities with the Most Immigrants from South Eastern Asia in South Carolina
RELATED REPORTS & OPTIONS
South Eastern Asia
South Carolina
Compare Cities
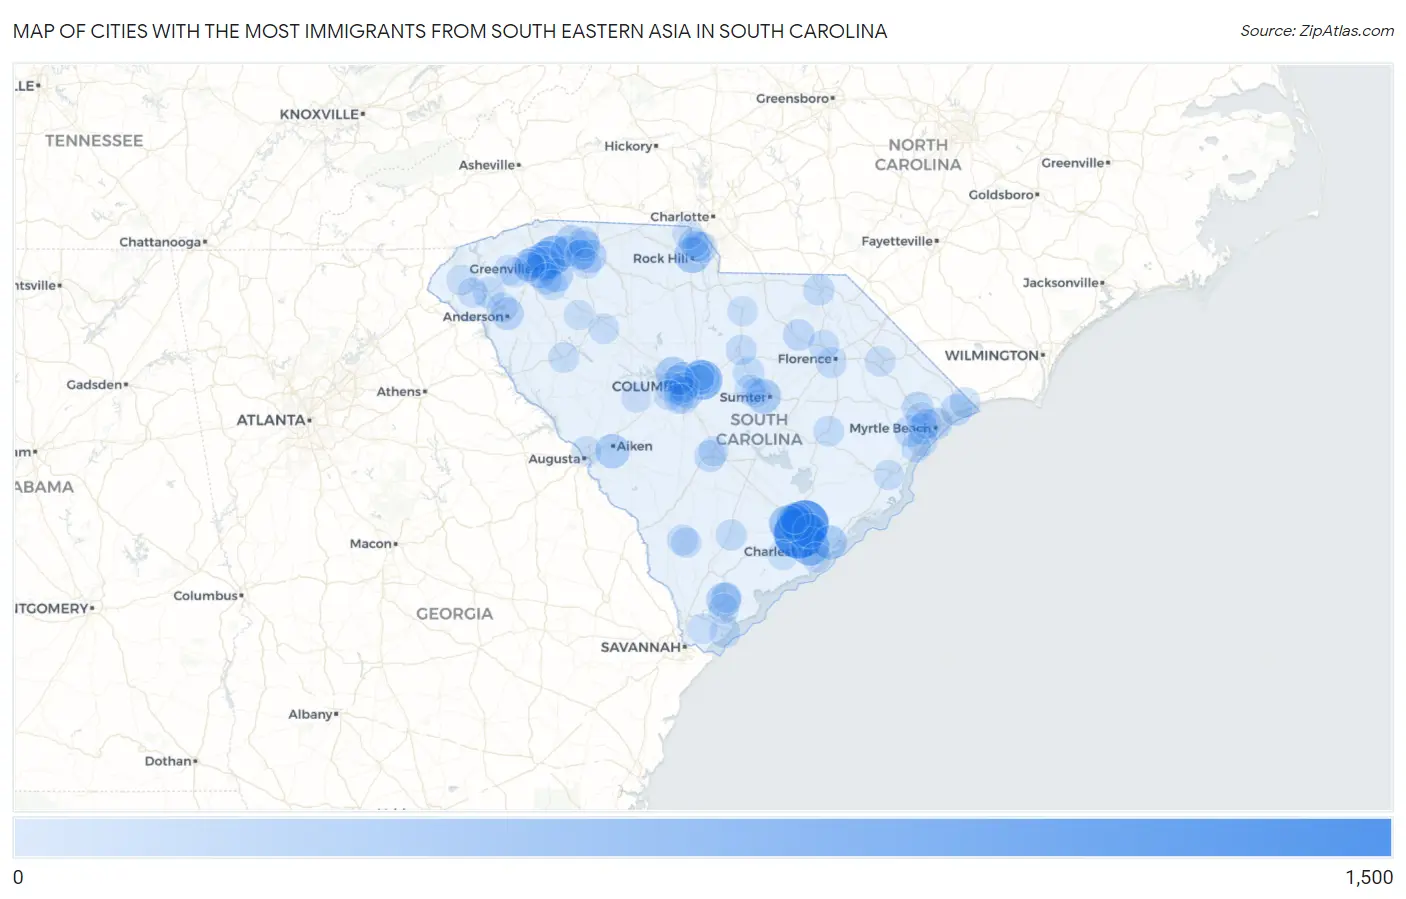
Map of Cities with the Most Immigrants from South Eastern Asia in South Carolina
0
1,500
Cities with the Most Immigrants from South Eastern Asia in South Carolina
| City | South Eastern Asia | vs State | vs National | |
| 1. | North Charleston | 1,143 | 22,253(5.14%)#1 | 4,292,058(0.03%)#529 |
| 2. | Goose Creek | 1,004 | 22,253(4.51%)#2 | 4,292,058(0.02%)#600 |
| 3. | Columbia | 555 | 22,253(2.49%)#3 | 4,292,058(0.01%)#972 |
| 4. | Greer | 513 | 22,253(2.31%)#4 | 4,292,058(0.01%)#1,022 |
| 5. | Charleston | 504 | 22,253(2.26%)#5 | 4,292,058(0.01%)#1,030 |
| 6. | Taylors | 484 | 22,253(2.17%)#6 | 4,292,058(0.01%)#1,054 |
| 7. | Ladson | 457 | 22,253(2.05%)#7 | 4,292,058(0.01%)#1,098 |
| 8. | Summerville | 384 | 22,253(1.73%)#8 | 4,292,058(0.01%)#1,275 |
| 9. | Rock Hill | 350 | 22,253(1.57%)#9 | 4,292,058(0.01%)#1,378 |
| 10. | Burton | 269 | 22,253(1.21%)#10 | 4,292,058(0.01%)#1,659 |
| 11. | Sumter | 262 | 22,253(1.18%)#11 | 4,292,058(0.01%)#1,681 |
| 12. | Hanahan | 253 | 22,253(1.14%)#12 | 4,292,058(0.01%)#1,727 |
| 13. | Aiken | 247 | 22,253(1.11%)#13 | 4,292,058(0.01%)#1,754 |
| 14. | Mount Pleasant | 241 | 22,253(1.08%)#14 | 4,292,058(0.01%)#1,784 |
| 15. | Irmo | 238 | 22,253(1.07%)#15 | 4,292,058(0.01%)#1,800 |
| 16. | Carolina Forest | 229 | 22,253(1.03%)#16 | 4,292,058(0.01%)#1,846 |
| 17. | Wade Hampton | 225 | 22,253(1.01%)#17 | 4,292,058(0.01%)#1,868 |
| 18. | Greenville | 223 | 22,253(1.00%)#18 | 4,292,058(0.01%)#1,877 |
| 19. | St Andrews | 220 | 22,253(0.99%)#19 | 4,292,058(0.01%)#1,901 |
| 20. | Five Forks | 215 | 22,253(0.97%)#20 | 4,292,058(0.01%)#1,929 |
| 21. | Spartanburg | 194 | 22,253(0.87%)#21 | 4,292,058(0.00%)#2,058 |
| 22. | Inman | 161 | 22,253(0.72%)#22 | 4,292,058(0.00%)#2,334 |
| 23. | Anderson | 156 | 22,253(0.70%)#23 | 4,292,058(0.00%)#2,373 |
| 24. | Sans Souci | 155 | 22,253(0.70%)#24 | 4,292,058(0.00%)#2,390 |
| 25. | Camp Croft | 149 | 22,253(0.67%)#25 | 4,292,058(0.00%)#2,463 |
| 26. | Berea | 135 | 22,253(0.61%)#26 | 4,292,058(0.00%)#2,620 |
| 27. | Cayce | 130 | 22,253(0.58%)#27 | 4,292,058(0.00%)#2,683 |
| 28. | Myrtle Beach | 118 | 22,253(0.53%)#28 | 4,292,058(0.00%)#2,843 |
| 29. | Woodfield | 105 | 22,253(0.47%)#29 | 4,292,058(0.00%)#3,034 |
| 30. | Hartsville | 102 | 22,253(0.46%)#30 | 4,292,058(0.00%)#3,086 |
| 31. | Fort Mill | 100 | 22,253(0.45%)#31 | 4,292,058(0.00%)#3,113 |
| 32. | Orangeburg | 97 | 22,253(0.44%)#32 | 4,292,058(0.00%)#3,169 |
| 33. | Bucksport | 94 | 22,253(0.42%)#33 | 4,292,058(0.00%)#3,225 |
| 34. | Conway | 93 | 22,253(0.42%)#34 | 4,292,058(0.00%)#3,229 |
| 35. | Socastee | 93 | 22,253(0.42%)#35 | 4,292,058(0.00%)#3,230 |
| 36. | Mauldin | 89 | 22,253(0.40%)#36 | 4,292,058(0.00%)#3,292 |
| 37. | North Myrtle Beach | 86 | 22,253(0.39%)#37 | 4,292,058(0.00%)#3,354 |
| 38. | Lyman | 86 | 22,253(0.39%)#38 | 4,292,058(0.00%)#3,364 |
| 39. | Clemson | 80 | 22,253(0.36%)#39 | 4,292,058(0.00%)#3,465 |
| 40. | Cheraw | 79 | 22,253(0.36%)#40 | 4,292,058(0.00%)#3,514 |
| 41. | Arcadia | 77 | 22,253(0.35%)#41 | 4,292,058(0.00%)#3,547 |
| 42. | Rembert | 75 | 22,253(0.34%)#42 | 4,292,058(0.00%)#3,591 |
| 43. | Oak Grove | 74 | 22,253(0.33%)#43 | 4,292,058(0.00%)#3,602 |
| 44. | Valley Falls | 74 | 22,253(0.33%)#44 | 4,292,058(0.00%)#3,605 |
| 45. | Arkwright | 74 | 22,253(0.33%)#45 | 4,292,058(0.00%)#3,610 |
| 46. | Dentsville | 71 | 22,253(0.32%)#46 | 4,292,058(0.00%)#3,671 |
| 47. | Walterboro | 71 | 22,253(0.32%)#47 | 4,292,058(0.00%)#3,682 |
| 48. | Boiling Springs | 70 | 22,253(0.31%)#48 | 4,292,058(0.00%)#3,698 |
| 49. | Hilton Head Island | 59 | 22,253(0.27%)#49 | 4,292,058(0.00%)#3,953 |
| 50. | Florence | 57 | 22,253(0.26%)#50 | 4,292,058(0.00%)#4,001 |
| 51. | Kingstree | 54 | 22,253(0.24%)#51 | 4,292,058(0.00%)#4,128 |
| 52. | Forest Acres | 53 | 22,253(0.24%)#52 | 4,292,058(0.00%)#4,153 |
| 53. | Camden | 52 | 22,253(0.23%)#53 | 4,292,058(0.00%)#4,201 |
| 54. | Hampton | 51 | 22,253(0.23%)#54 | 4,292,058(0.00%)#4,249 |
| 55. | Little River | 49 | 22,253(0.22%)#55 | 4,292,058(0.00%)#4,310 |
| 56. | Stateburg | 49 | 22,253(0.22%)#56 | 4,292,058(0.00%)#4,332 |
| 57. | Red Hill | 47 | 22,253(0.21%)#57 | 4,292,058(0.00%)#4,379 |
| 58. | Fairforest | 47 | 22,253(0.21%)#58 | 4,292,058(0.00%)#4,408 |
| 59. | Parker | 46 | 22,253(0.21%)#59 | 4,292,058(0.00%)#4,417 |
| 60. | Riverview | 45 | 22,253(0.20%)#60 | 4,292,058(0.00%)#4,491 |
| 61. | Lexington | 44 | 22,253(0.20%)#61 | 4,292,058(0.00%)#4,496 |
| 62. | Marion | 43 | 22,253(0.19%)#62 | 4,292,058(0.00%)#4,568 |
| 63. | Northlake | 43 | 22,253(0.19%)#63 | 4,292,058(0.00%)#4,578 |
| 64. | Darlington | 42 | 22,253(0.19%)#64 | 4,292,058(0.00%)#4,613 |
| 65. | Lake Wylie | 41 | 22,253(0.18%)#65 | 4,292,058(0.00%)#4,647 |
| 66. | Springdale | 41 | 22,253(0.18%)#66 | 4,292,058(0.00%)#4,678 |
| 67. | Greenwood | 40 | 22,253(0.18%)#67 | 4,292,058(0.00%)#4,707 |
| 68. | Varnville | 40 | 22,253(0.18%)#68 | 4,292,058(0.00%)#4,750 |
| 69. | Simpsonville | 39 | 22,253(0.18%)#69 | 4,292,058(0.00%)#4,765 |
| 70. | Capitol View | 38 | 22,253(0.17%)#70 | 4,292,058(0.00%)#4,858 |
| 71. | Pine Ridge | 37 | 22,253(0.17%)#71 | 4,292,058(0.00%)#4,896 |
| 72. | West Columbia | 35 | 22,253(0.16%)#72 | 4,292,058(0.00%)#4,950 |
| 73. | Beaufort | 35 | 22,253(0.16%)#73 | 4,292,058(0.00%)#4,955 |
| 74. | Garden City | 35 | 22,253(0.16%)#74 | 4,292,058(0.00%)#4,958 |
| 75. | Whitney | 35 | 22,253(0.16%)#75 | 4,292,058(0.00%)#4,990 |
| 76. | Joanna | 34 | 22,253(0.15%)#76 | 4,292,058(0.00%)#5,056 |
| 77. | Seven Oaks | 31 | 22,253(0.14%)#77 | 4,292,058(0.00%)#5,188 |
| 78. | Red Bank | 31 | 22,253(0.14%)#78 | 4,292,058(0.00%)#5,197 |
| 79. | Georgetown | 31 | 22,253(0.14%)#79 | 4,292,058(0.00%)#5,206 |
| 80. | Tega Cay | 28 | 22,253(0.13%)#80 | 4,292,058(0.00%)#5,407 |
| 81. | Arial | 28 | 22,253(0.13%)#81 | 4,292,058(0.00%)#5,457 |
| 82. | Bluffton | 27 | 22,253(0.12%)#82 | 4,292,058(0.00%)#5,471 |
| 83. | Walhalla | 27 | 22,253(0.12%)#83 | 4,292,058(0.00%)#5,506 |
| 84. | Wyboo | 27 | 22,253(0.12%)#84 | 4,292,058(0.00%)#5,510 |
| 85. | Port Royal | 26 | 22,253(0.12%)#85 | 4,292,058(0.00%)#5,548 |
| 86. | Forestbrook | 26 | 22,253(0.12%)#86 | 4,292,058(0.00%)#5,565 |
| 87. | Kershaw | 26 | 22,253(0.12%)#87 | 4,292,058(0.00%)#5,603 |
| 88. | South Congaree | 26 | 22,253(0.12%)#88 | 4,292,058(0.00%)#5,605 |
| 89. | Hollywood | 23 | 22,253(0.10%)#89 | 4,292,058(0.00%)#5,816 |
| 90. | Easley | 22 | 22,253(0.10%)#90 | 4,292,058(0.00%)#5,852 |
| 91. | James Island | 22 | 22,253(0.10%)#91 | 4,292,058(0.00%)#5,863 |
| 92. | Brookdale | 21 | 22,253(0.09%)#92 | 4,292,058(0.00%)#5,995 |
| 93. | North Augusta | 19 | 22,253(0.09%)#93 | 4,292,058(0.00%)#6,126 |
| 94. | Seneca | 17 | 22,253(0.08%)#94 | 4,292,058(0.00%)#6,348 |
| 95. | Murrells Inlet | 16 | 22,253(0.07%)#95 | 4,292,058(0.00%)#6,455 |
| 96. | Batesburg Leesville | 14 | 22,253(0.06%)#96 | 4,292,058(0.00%)#6,708 |
| 97. | Roebuck | 14 | 22,253(0.06%)#97 | 4,292,058(0.00%)#6,723 |
| 98. | Laurens | 13 | 22,253(0.06%)#98 | 4,292,058(0.00%)#6,830 |
| 99. | Sangaree | 13 | 22,253(0.06%)#99 | 4,292,058(0.00%)#6,831 |
| 100. | Cherryvale | 13 | 22,253(0.06%)#100 | 4,292,058(0.00%)#6,896 |
Common Questions
What are the Top 10 Cities with the Most Immigrants from South Eastern Asia in South Carolina?
Top 10 Cities with the Most Immigrants from South Eastern Asia in South Carolina are:
#1
1,143
#2
1,004
#3
555
#4
513
#5
504
#6
484
#7
457
#8
384
#9
350
#10
269
What city has the Most Immigrants from South Eastern Asia in South Carolina?
North Charleston has the Most Immigrants from South Eastern Asia in South Carolina with 1,143.
What is the Total Immigrants from South Eastern Asia in the State of South Carolina?
Total Immigrants from South Eastern Asia in South Carolina is 22,253.
What is the Total Immigrants from South Eastern Asia in the United States?
Total Immigrants from South Eastern Asia in the United States is 4,292,058.