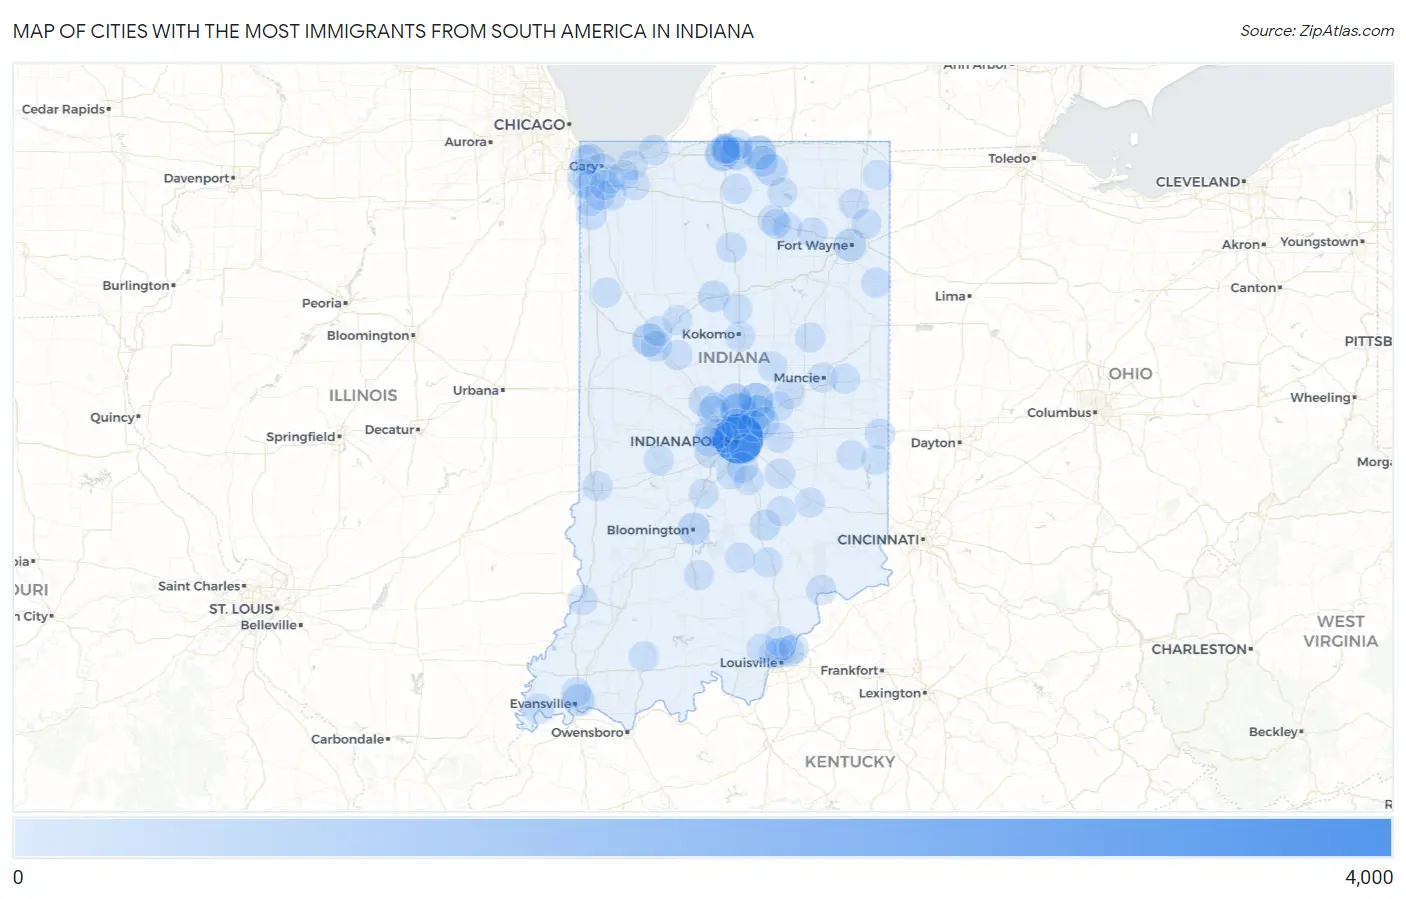
Cities with the Most Immigrants from South America in Indiana
RELATED REPORTS & OPTIONS
South America
Indiana
Compare Cities
Map of Cities with the Most Immigrants from South America in Indiana
0
4,000
Cities with the Most Immigrants from South America in Indiana
| City | South America | vs State | vs National | |
| 1. | Indianapolis | 3,436 | 17,275(19.89%)#1 | 3,636,375(0.09%)#129 |
| 2. | Carmel | 1,030 | 17,275(5.96%)#2 | 3,636,375(0.03%)#474 |
| 3. | South Bend | 822 | 17,275(4.76%)#3 | 3,636,375(0.02%)#587 |
| 4. | Fishers | 766 | 17,275(4.43%)#4 | 3,636,375(0.02%)#627 |
| 5. | Noblesville | 720 | 17,275(4.17%)#5 | 3,636,375(0.02%)#674 |
| 6. | Elkhart | 676 | 17,275(3.91%)#6 | 3,636,375(0.02%)#714 |
| 7. | West Lafayette | 552 | 17,275(3.20%)#7 | 3,636,375(0.02%)#831 |
| 8. | Westfield | 538 | 17,275(3.11%)#8 | 3,636,375(0.01%)#847 |
| 9. | Mishawaka | 462 | 17,275(2.67%)#9 | 3,636,375(0.01%)#966 |
| 10. | Fort Wayne | 429 | 17,275(2.48%)#10 | 3,636,375(0.01%)#1,018 |
| 11. | Bloomington | 372 | 17,275(2.15%)#11 | 3,636,375(0.01%)#1,140 |
| 12. | Evansville | 350 | 17,275(2.03%)#12 | 3,636,375(0.01%)#1,196 |
| 13. | Goshen | 332 | 17,275(1.92%)#13 | 3,636,375(0.01%)#1,251 |
| 14. | Logansport | 235 | 17,275(1.36%)#14 | 3,636,375(0.01%)#1,593 |
| 15. | Lawrence | 198 | 17,275(1.15%)#15 | 3,636,375(0.01%)#1,778 |
| 16. | Mccordsville | 176 | 17,275(1.02%)#16 | 3,636,375(0.00%)#1,907 |
| 17. | Lafayette | 165 | 17,275(0.96%)#17 | 3,636,375(0.00%)#1,978 |
| 18. | Dunlap | 165 | 17,275(0.96%)#18 | 3,636,375(0.00%)#1,986 |
| 19. | Columbus | 159 | 17,275(0.92%)#19 | 3,636,375(0.00%)#2,022 |
| 20. | Greenwood | 150 | 17,275(0.87%)#20 | 3,636,375(0.00%)#2,069 |
| 21. | Lebanon | 131 | 17,275(0.76%)#21 | 3,636,375(0.00%)#2,262 |
| 22. | Plainfield | 126 | 17,275(0.73%)#22 | 3,636,375(0.00%)#2,314 |
| 23. | Speedway | 120 | 17,275(0.69%)#23 | 3,636,375(0.00%)#2,385 |
| 24. | Notre Dame | 115 | 17,275(0.67%)#24 | 3,636,375(0.00%)#2,431 |
| 25. | Brownsburg | 113 | 17,275(0.65%)#25 | 3,636,375(0.00%)#2,446 |
| 26. | Jeffersonville | 109 | 17,275(0.63%)#26 | 3,636,375(0.00%)#2,504 |
| 27. | Avon | 109 | 17,275(0.63%)#27 | 3,636,375(0.00%)#2,508 |
| 28. | Whitestown | 104 | 17,275(0.60%)#28 | 3,636,375(0.00%)#2,576 |
| 29. | Winfield | 92 | 17,275(0.53%)#29 | 3,636,375(0.00%)#2,744 |
| 30. | Lowell | 78 | 17,275(0.45%)#30 | 3,636,375(0.00%)#2,956 |
| 31. | Gary | 74 | 17,275(0.43%)#31 | 3,636,375(0.00%)#3,032 |
| 32. | Bremen | 69 | 17,275(0.40%)#32 | 3,636,375(0.00%)#3,176 |
| 33. | Kokomo | 68 | 17,275(0.39%)#33 | 3,636,375(0.00%)#3,181 |
| 34. | Shelbyville | 68 | 17,275(0.39%)#34 | 3,636,375(0.00%)#3,186 |
| 35. | Beech Grove | 65 | 17,275(0.38%)#35 | 3,636,375(0.00%)#3,262 |
| 36. | Mount Vernon | 62 | 17,275(0.36%)#36 | 3,636,375(0.00%)#3,342 |
| 37. | Garrett | 62 | 17,275(0.36%)#37 | 3,636,375(0.00%)#3,343 |
| 38. | Rochester | 62 | 17,275(0.36%)#38 | 3,636,375(0.00%)#3,344 |
| 39. | Hammond | 61 | 17,275(0.35%)#39 | 3,636,375(0.00%)#3,353 |
| 40. | Madison | 57 | 17,275(0.33%)#40 | 3,636,375(0.00%)#3,467 |
| 41. | East Chicago | 54 | 17,275(0.31%)#41 | 3,636,375(0.00%)#3,551 |
| 42. | Crown Point | 47 | 17,275(0.27%)#42 | 3,636,375(0.00%)#3,786 |
| 43. | Bargersville | 47 | 17,275(0.27%)#43 | 3,636,375(0.00%)#3,801 |
| 44. | Granger | 44 | 17,275(0.25%)#44 | 3,636,375(0.00%)#3,900 |
| 45. | Michigan City | 42 | 17,275(0.24%)#45 | 3,636,375(0.00%)#3,979 |
| 46. | Columbia City | 42 | 17,275(0.24%)#46 | 3,636,375(0.00%)#3,991 |
| 47. | Richmond | 40 | 17,275(0.23%)#47 | 3,636,375(0.00%)#4,046 |
| 48. | Greenfield | 38 | 17,275(0.22%)#48 | 3,636,375(0.00%)#4,137 |
| 49. | Greencastle | 37 | 17,275(0.21%)#49 | 3,636,375(0.00%)#4,190 |
| 50. | Leo Cedarville | 34 | 17,275(0.20%)#50 | 3,636,375(0.00%)#4,349 |
| 51. | Warsaw | 32 | 17,275(0.19%)#51 | 3,636,375(0.00%)#4,424 |
| 52. | Decatur | 31 | 17,275(0.18%)#52 | 3,636,375(0.00%)#4,491 |
| 53. | Syracuse | 28 | 17,275(0.16%)#53 | 3,636,375(0.00%)#4,694 |
| 54. | Anderson | 27 | 17,275(0.16%)#54 | 3,636,375(0.00%)#4,714 |
| 55. | Zionsville | 27 | 17,275(0.16%)#55 | 3,636,375(0.00%)#4,719 |
| 56. | Upland | 27 | 17,275(0.16%)#56 | 3,636,375(0.00%)#4,764 |
| 57. | Hobart | 26 | 17,275(0.15%)#57 | 3,636,375(0.00%)#4,791 |
| 58. | Franklin | 26 | 17,275(0.15%)#58 | 3,636,375(0.00%)#4,792 |
| 59. | Bedford | 25 | 17,275(0.14%)#59 | 3,636,375(0.00%)#4,851 |
| 60. | Clermont | 23 | 17,275(0.13%)#60 | 3,636,375(0.00%)#5,050 |
| 61. | Pierceton | 23 | 17,275(0.13%)#61 | 3,636,375(0.00%)#5,053 |
| 62. | Munster | 22 | 17,275(0.13%)#62 | 3,636,375(0.00%)#5,070 |
| 63. | Chesterton | 22 | 17,275(0.13%)#63 | 3,636,375(0.00%)#5,077 |
| 64. | Mulberry | 22 | 17,275(0.13%)#64 | 3,636,375(0.00%)#5,127 |
| 65. | Indian Village | 22 | 17,275(0.13%)#65 | 3,636,375(0.00%)#5,140 |
| 66. | Valparaiso | 21 | 17,275(0.12%)#66 | 3,636,375(0.00%)#5,144 |
| 67. | New Albany | 19 | 17,275(0.11%)#67 | 3,636,375(0.00%)#5,278 |
| 68. | Roseland | 19 | 17,275(0.11%)#68 | 3,636,375(0.00%)#5,353 |
| 69. | Greensburg | 18 | 17,275(0.10%)#69 | 3,636,375(0.00%)#5,383 |
| 70. | Galena | 18 | 17,275(0.10%)#70 | 3,636,375(0.00%)#5,436 |
| 71. | Muncie | 17 | 17,275(0.10%)#71 | 3,636,375(0.00%)#5,461 |
| 72. | Dyer | 17 | 17,275(0.10%)#72 | 3,636,375(0.00%)#5,472 |
| 73. | Winona Lake | 17 | 17,275(0.10%)#73 | 3,636,375(0.00%)#5,503 |
| 74. | Grissom Afb | 17 | 17,275(0.10%)#74 | 3,636,375(0.00%)#5,521 |
| 75. | Terre Haute | 16 | 17,275(0.09%)#75 | 3,636,375(0.00%)#5,546 |
| 76. | Schererville | 16 | 17,275(0.09%)#76 | 3,636,375(0.00%)#5,549 |
| 77. | Battle Ground | 16 | 17,275(0.09%)#77 | 3,636,375(0.00%)#5,612 |
| 78. | Highland | 15 | 17,275(0.09%)#78 | 3,636,375(0.00%)#5,667 |
| 79. | Huntingburg | 14 | 17,275(0.08%)#79 | 3,636,375(0.00%)#5,766 |
| 80. | Liberty | 14 | 17,275(0.08%)#80 | 3,636,375(0.00%)#5,805 |
| 81. | Merrillville | 12 | 17,275(0.07%)#81 | 3,636,375(0.00%)#5,934 |
| 82. | Cedar Lake | 12 | 17,275(0.07%)#82 | 3,636,375(0.00%)#5,953 |
| 83. | Sellersburg | 12 | 17,275(0.07%)#83 | 3,636,375(0.00%)#5,964 |
| 84. | Pendleton | 12 | 17,275(0.07%)#84 | 3,636,375(0.00%)#5,993 |
| 85. | Freetown | 12 | 17,275(0.07%)#85 | 3,636,375(0.00%)#6,076 |
| 86. | Clarksville | 11 | 17,275(0.06%)#86 | 3,636,375(0.00%)#6,081 |
| 87. | Seymour | 11 | 17,275(0.06%)#87 | 3,636,375(0.00%)#6,082 |
| 88. | South Haven | 11 | 17,275(0.06%)#88 | 3,636,375(0.00%)#6,112 |
| 89. | Meridian Hills | 11 | 17,275(0.06%)#89 | 3,636,375(0.00%)#6,161 |
| 90. | Parker City | 11 | 17,275(0.06%)#90 | 3,636,375(0.00%)#6,173 |
| 91. | Utica | 11 | 17,275(0.06%)#91 | 3,636,375(0.00%)#6,178 |
| 92. | Connersville | 10 | 17,275(0.06%)#92 | 3,636,375(0.00%)#6,212 |
| 93. | Goodland | 10 | 17,275(0.06%)#93 | 3,636,375(0.00%)#6,339 |
| 94. | Hope | 9 | 17,275(0.05%)#94 | 3,636,375(0.00%)#6,463 |
| 95. | Gilmer Park | 9 | 17,275(0.05%)#95 | 3,636,375(0.00%)#6,495 |
| 96. | Elwood | 8 | 17,275(0.05%)#96 | 3,636,375(0.00%)#6,529 |
| 97. | Vincennes | 7 | 17,275(0.04%)#97 | 3,636,375(0.00%)#6,666 |
| 98. | Martinsville | 7 | 17,275(0.04%)#98 | 3,636,375(0.00%)#6,682 |
| 99. | Delphi | 7 | 17,275(0.04%)#99 | 3,636,375(0.00%)#6,733 |
| 100. | Hamilton | 7 | 17,275(0.04%)#100 | 3,636,375(0.00%)#6,772 |
Common Questions
What are the Top 10 Cities with the Most Immigrants from South America in Indiana?
Top 10 Cities with the Most Immigrants from South America in Indiana are:
#1
3,436
#2
1,030
#3
822
#4
766
#5
720
#6
676
#7
552
#8
538
#9
462
#10
429
What city has the Most Immigrants from South America in Indiana?
Indianapolis has the Most Immigrants from South America in Indiana with 3,436.
What is the Total Immigrants from South America in the State of Indiana?
Total Immigrants from South America in Indiana is 17,275.
What is the Total Immigrants from South America in the United States?
Total Immigrants from South America in the United States is 3,636,375.