Cities with the Most Immigrants from South America in North Carolina
RELATED REPORTS & OPTIONS
South America
North Carolina
Compare Cities
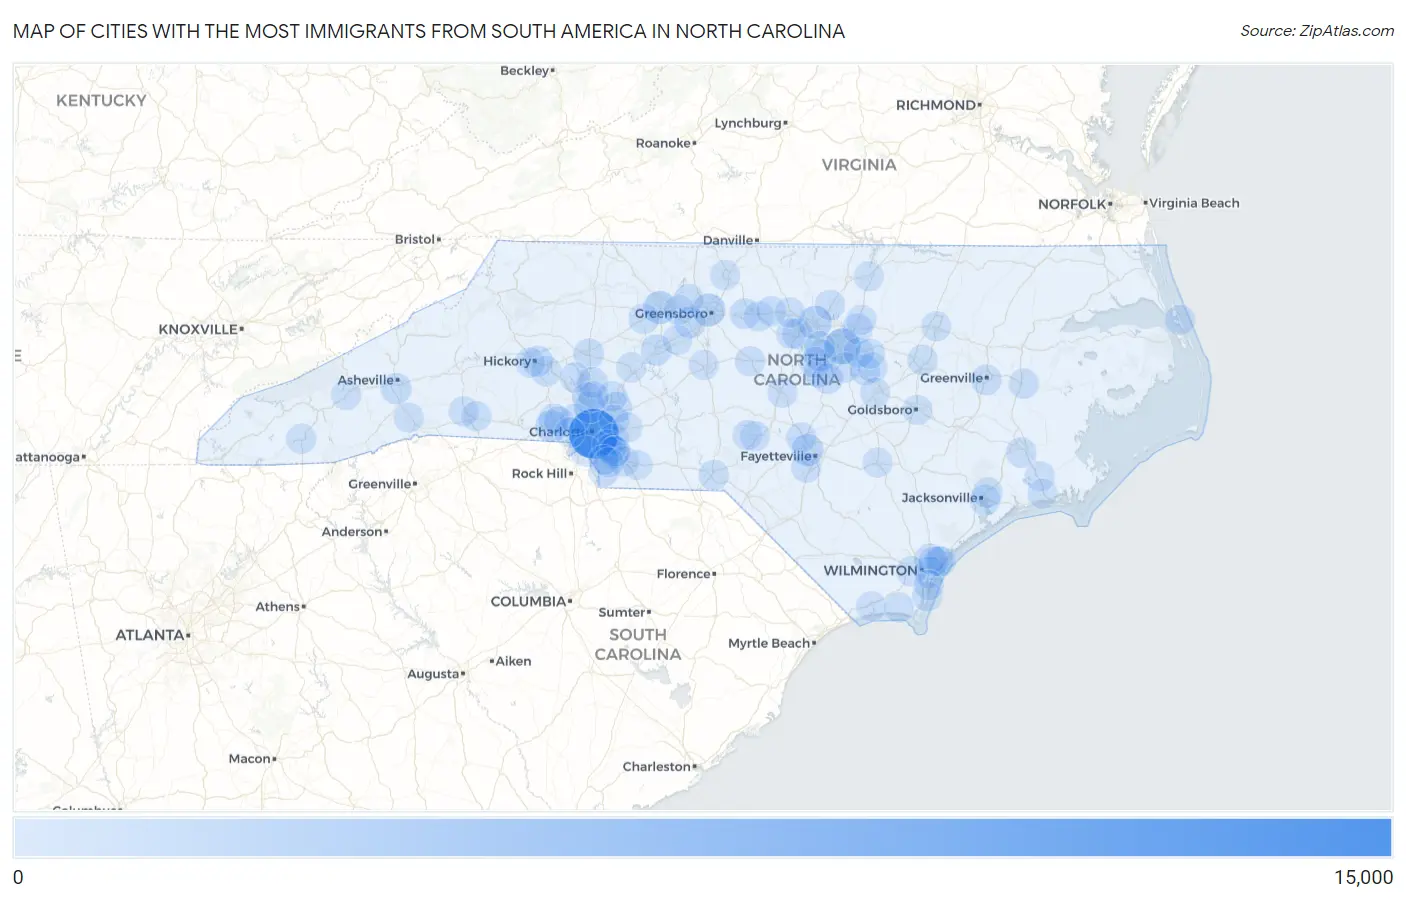
Map of Cities with the Most Immigrants from South America in North Carolina
0
15,000
Cities with the Most Immigrants from South America in North Carolina
| City | South America | vs State | vs National | |
| 1. | Charlotte | 13,429 | 61,315(21.90%)#1 | 3,636,375(0.37%)#20 |
| 2. | Raleigh | 3,831 | 61,315(6.25%)#2 | 3,636,375(0.11%)#117 |
| 3. | Greensboro | 2,001 | 61,315(3.26%)#3 | 3,636,375(0.06%)#246 |
| 4. | Durham | 1,996 | 61,315(3.26%)#4 | 3,636,375(0.05%)#247 |
| 5. | Winston Salem | 1,993 | 61,315(3.25%)#5 | 3,636,375(0.05%)#248 |
| 6. | Cary | 1,459 | 61,315(2.38%)#6 | 3,636,375(0.04%)#337 |
| 7. | Gastonia | 1,259 | 61,315(2.05%)#7 | 3,636,375(0.03%)#379 |
| 8. | Fayetteville | 1,245 | 61,315(2.03%)#8 | 3,636,375(0.03%)#386 |
| 9. | Indian Trail | 1,061 | 61,315(1.73%)#9 | 3,636,375(0.03%)#458 |
| 10. | Concord | 951 | 61,315(1.55%)#10 | 3,636,375(0.03%)#503 |
| 11. | High Point | 926 | 61,315(1.51%)#11 | 3,636,375(0.03%)#521 |
| 12. | Huntersville | 725 | 61,315(1.18%)#12 | 3,636,375(0.02%)#668 |
| 13. | Wilmington | 657 | 61,315(1.07%)#13 | 3,636,375(0.02%)#733 |
| 14. | Lexington | 634 | 61,315(1.03%)#14 | 3,636,375(0.02%)#757 |
| 15. | Pineville | 595 | 61,315(0.97%)#15 | 3,636,375(0.02%)#799 |
| 16. | Asheville | 591 | 61,315(0.96%)#16 | 3,636,375(0.02%)#803 |
| 17. | Apex | 482 | 61,315(0.79%)#17 | 3,636,375(0.01%)#929 |
| 18. | Waxhaw | 464 | 61,315(0.76%)#18 | 3,636,375(0.01%)#962 |
| 19. | Greenville | 449 | 61,315(0.73%)#19 | 3,636,375(0.01%)#983 |
| 20. | Burlington | 442 | 61,315(0.72%)#20 | 3,636,375(0.01%)#993 |
| 21. | Hickory | 436 | 61,315(0.71%)#21 | 3,636,375(0.01%)#1,007 |
| 22. | Statesville | 419 | 61,315(0.68%)#22 | 3,636,375(0.01%)#1,042 |
| 23. | Jacksonville | 397 | 61,315(0.65%)#23 | 3,636,375(0.01%)#1,087 |
| 24. | Mooresville | 397 | 61,315(0.65%)#24 | 3,636,375(0.01%)#1,088 |
| 25. | Mint Hill | 397 | 61,315(0.65%)#25 | 3,636,375(0.01%)#1,089 |
| 26. | Matthews | 391 | 61,315(0.64%)#26 | 3,636,375(0.01%)#1,103 |
| 27. | Chapel Hill | 374 | 61,315(0.61%)#27 | 3,636,375(0.01%)#1,138 |
| 28. | Fuquay Varina | 358 | 61,315(0.58%)#28 | 3,636,375(0.01%)#1,172 |
| 29. | Northchase | 347 | 61,315(0.57%)#29 | 3,636,375(0.01%)#1,212 |
| 30. | Stallings | 328 | 61,315(0.53%)#30 | 3,636,375(0.01%)#1,270 |
| 31. | Holly Springs | 287 | 61,315(0.47%)#31 | 3,636,375(0.01%)#1,381 |
| 32. | Wake Forest | 286 | 61,315(0.47%)#32 | 3,636,375(0.01%)#1,386 |
| 33. | Kannapolis | 272 | 61,315(0.44%)#33 | 3,636,375(0.01%)#1,445 |
| 34. | Cornelius | 252 | 61,315(0.41%)#34 | 3,636,375(0.01%)#1,520 |
| 35. | Monroe | 224 | 61,315(0.37%)#35 | 3,636,375(0.01%)#1,646 |
| 36. | Garner | 218 | 61,315(0.36%)#36 | 3,636,375(0.01%)#1,675 |
| 37. | Graham | 218 | 61,315(0.36%)#37 | 3,636,375(0.01%)#1,680 |
| 38. | Newton | 216 | 61,315(0.35%)#38 | 3,636,375(0.01%)#1,688 |
| 39. | Clemmons | 215 | 61,315(0.35%)#39 | 3,636,375(0.01%)#1,691 |
| 40. | Clayton | 208 | 61,315(0.34%)#40 | 3,636,375(0.01%)#1,729 |
| 41. | Wilson | 199 | 61,315(0.32%)#41 | 3,636,375(0.01%)#1,768 |
| 42. | Carrboro | 192 | 61,315(0.31%)#42 | 3,636,375(0.01%)#1,809 |
| 43. | East Rockingham | 177 | 61,315(0.29%)#43 | 3,636,375(0.00%)#1,899 |
| 44. | Knightdale | 175 | 61,315(0.29%)#44 | 3,636,375(0.00%)#1,914 |
| 45. | Lake Norman Of Catawba | 168 | 61,315(0.27%)#45 | 3,636,375(0.00%)#1,957 |
| 46. | Lake Park | 165 | 61,315(0.27%)#46 | 3,636,375(0.00%)#1,987 |
| 47. | Sanford | 152 | 61,315(0.25%)#47 | 3,636,375(0.00%)#2,064 |
| 48. | New Bern | 145 | 61,315(0.24%)#48 | 3,636,375(0.00%)#2,117 |
| 49. | Weddington | 137 | 61,315(0.22%)#49 | 3,636,375(0.00%)#2,199 |
| 50. | Washington | 135 | 61,315(0.22%)#50 | 3,636,375(0.00%)#2,221 |
| 51. | Hope Mills | 134 | 61,315(0.22%)#51 | 3,636,375(0.00%)#2,228 |
| 52. | Butner | 126 | 61,315(0.21%)#52 | 3,636,375(0.00%)#2,325 |
| 53. | Davidson | 125 | 61,315(0.20%)#53 | 3,636,375(0.00%)#2,332 |
| 54. | Dallas | 118 | 61,315(0.19%)#54 | 3,636,375(0.00%)#2,404 |
| 55. | Kill Devil Hills | 117 | 61,315(0.19%)#55 | 3,636,375(0.00%)#2,413 |
| 56. | Mount Holly | 116 | 61,315(0.19%)#56 | 3,636,375(0.00%)#2,422 |
| 57. | Spring Lake | 113 | 61,315(0.18%)#57 | 3,636,375(0.00%)#2,457 |
| 58. | Siler City | 113 | 61,315(0.18%)#58 | 3,636,375(0.00%)#2,463 |
| 59. | Asheboro | 105 | 61,315(0.17%)#59 | 3,636,375(0.00%)#2,560 |
| 60. | Salisbury | 102 | 61,315(0.17%)#60 | 3,636,375(0.00%)#2,597 |
| 61. | Goldsboro | 102 | 61,315(0.17%)#61 | 3,636,375(0.00%)#2,599 |
| 62. | Wesley Chapel | 99 | 61,315(0.16%)#62 | 3,636,375(0.00%)#2,637 |
| 63. | Shallotte | 97 | 61,315(0.16%)#63 | 3,636,375(0.00%)#2,665 |
| 64. | Thomasville | 93 | 61,315(0.15%)#64 | 3,636,375(0.00%)#2,721 |
| 65. | Havelock | 93 | 61,315(0.15%)#65 | 3,636,375(0.00%)#2,722 |
| 66. | Archer Lodge | 92 | 61,315(0.15%)#66 | 3,636,375(0.00%)#2,746 |
| 67. | Clinton | 91 | 61,315(0.15%)#67 | 3,636,375(0.00%)#2,758 |
| 68. | Rutherfordton | 91 | 61,315(0.15%)#68 | 3,636,375(0.00%)#2,764 |
| 69. | Hillsborough | 89 | 61,315(0.15%)#69 | 3,636,375(0.00%)#2,789 |
| 70. | Forest City | 87 | 61,315(0.14%)#70 | 3,636,375(0.00%)#2,813 |
| 71. | Hendersonville | 84 | 61,315(0.14%)#71 | 3,636,375(0.00%)#2,866 |
| 72. | Franklin | 84 | 61,315(0.14%)#72 | 3,636,375(0.00%)#2,875 |
| 73. | Leland | 82 | 61,315(0.13%)#73 | 3,636,375(0.00%)#2,902 |
| 74. | Carolina Beach | 81 | 61,315(0.13%)#74 | 3,636,375(0.00%)#2,916 |
| 75. | Harrisburg | 80 | 61,315(0.13%)#75 | 3,636,375(0.00%)#2,931 |
| 76. | Newport | 80 | 61,315(0.13%)#76 | 3,636,375(0.00%)#2,940 |
| 77. | Southern Pines | 76 | 61,315(0.12%)#77 | 3,636,375(0.00%)#2,989 |
| 78. | Midland | 75 | 61,315(0.12%)#78 | 3,636,375(0.00%)#3,026 |
| 79. | Pumpkin Center | 75 | 61,315(0.12%)#79 | 3,636,375(0.00%)#3,030 |
| 80. | Kernersville | 74 | 61,315(0.12%)#80 | 3,636,375(0.00%)#3,034 |
| 81. | Rocky Mount | 72 | 61,315(0.12%)#81 | 3,636,375(0.00%)#3,079 |
| 82. | Pinehurst | 72 | 61,315(0.12%)#82 | 3,636,375(0.00%)#3,093 |
| 83. | Porters Neck | 70 | 61,315(0.11%)#83 | 3,636,375(0.00%)#3,141 |
| 84. | Murraysville | 67 | 61,315(0.11%)#84 | 3,636,375(0.00%)#3,206 |
| 85. | Reidsville | 65 | 61,315(0.11%)#85 | 3,636,375(0.00%)#3,263 |
| 86. | Wendell | 65 | 61,315(0.11%)#86 | 3,636,375(0.00%)#3,264 |
| 87. | Waynesville | 65 | 61,315(0.11%)#87 | 3,636,375(0.00%)#3,265 |
| 88. | Oak Ridge | 65 | 61,315(0.11%)#88 | 3,636,375(0.00%)#3,268 |
| 89. | Ranlo | 65 | 61,315(0.11%)#89 | 3,636,375(0.00%)#3,274 |
| 90. | Youngsville | 59 | 61,315(0.10%)#90 | 3,636,375(0.00%)#3,425 |
| 91. | Belmont | 58 | 61,315(0.09%)#91 | 3,636,375(0.00%)#3,441 |
| 92. | Bayshore | 58 | 61,315(0.09%)#92 | 3,636,375(0.00%)#3,456 |
| 93. | Mebane | 54 | 61,315(0.09%)#93 | 3,636,375(0.00%)#3,554 |
| 94. | Oak Island | 54 | 61,315(0.09%)#94 | 3,636,375(0.00%)#3,561 |
| 95. | Myrtle Grove | 52 | 61,315(0.08%)#95 | 3,636,375(0.00%)#3,629 |
| 96. | Morrisville | 49 | 61,315(0.08%)#96 | 3,636,375(0.00%)#3,725 |
| 97. | Wingate | 49 | 61,315(0.08%)#97 | 3,636,375(0.00%)#3,745 |
| 98. | Henderson | 48 | 61,315(0.08%)#98 | 3,636,375(0.00%)#3,768 |
| 99. | Smithfield | 48 | 61,315(0.08%)#99 | 3,636,375(0.00%)#3,771 |
| 100. | Long View | 48 | 61,315(0.08%)#100 | 3,636,375(0.00%)#3,780 |
Common Questions
What are the Top 10 Cities with the Most Immigrants from South America in North Carolina?
Top 10 Cities with the Most Immigrants from South America in North Carolina are:
#1
13,429
#2
3,831
#3
2,001
#4
1,996
#5
1,993
#6
1,459
#7
1,259
#8
1,245
#9
1,061
#10
951
What city has the Most Immigrants from South America in North Carolina?
Charlotte has the Most Immigrants from South America in North Carolina with 13,429.
What is the Total Immigrants from South America in the State of North Carolina?
Total Immigrants from South America in North Carolina is 61,315.
What is the Total Immigrants from South America in the United States?
Total Immigrants from South America in the United States is 3,636,375.