Cities with the Most Immigrants from South America in Louisiana
RELATED REPORTS & OPTIONS
South America
Louisiana
Compare Cities
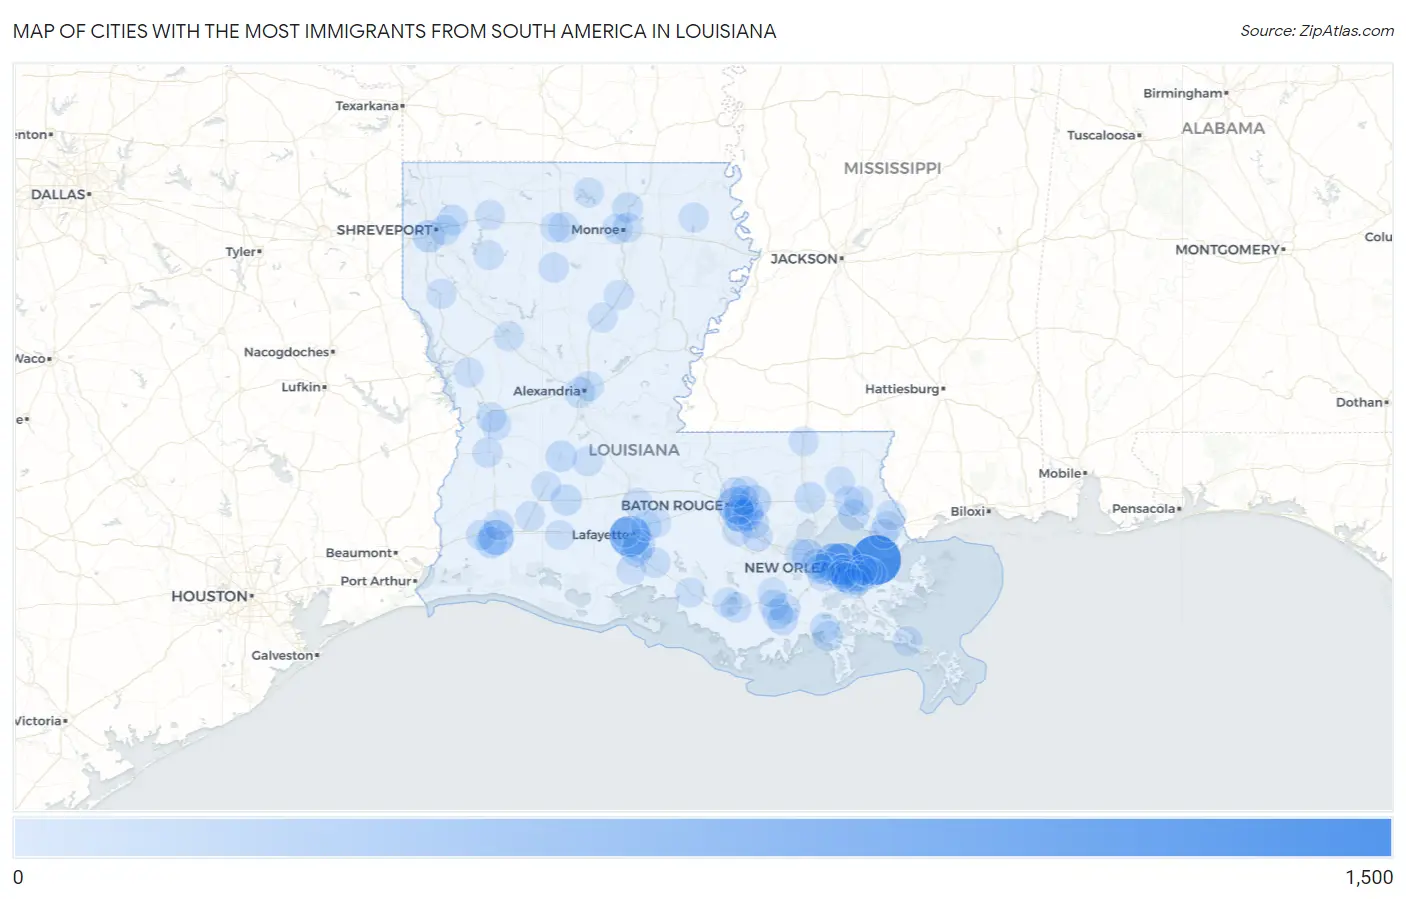
Map of Cities with the Most Immigrants from South America in Louisiana
0
1,500
Cities with the Most Immigrants from South America in Louisiana
| City | South America | vs State | vs National | |
| 1. | New Orleans | 1,451 | 10,085(14.39%)#1 | 3,636,375(0.04%)#339 |
| 2. | Metairie | 833 | 10,085(8.26%)#2 | 3,636,375(0.02%)#577 |
| 3. | Lafayette | 801 | 10,085(7.94%)#3 | 3,636,375(0.02%)#596 |
| 4. | Kenner | 595 | 10,085(5.90%)#4 | 3,636,375(0.02%)#797 |
| 5. | Baton Rouge | 393 | 10,085(3.90%)#5 | 3,636,375(0.01%)#1,095 |
| 6. | Lake Charles | 378 | 10,085(3.75%)#6 | 3,636,375(0.01%)#1,131 |
| 7. | Village St George | 205 | 10,085(2.03%)#7 | 3,636,375(0.01%)#1,741 |
| 8. | St Rose | 191 | 10,085(1.89%)#8 | 3,636,375(0.01%)#1,819 |
| 9. | Oak Hills Place | 190 | 10,085(1.88%)#9 | 3,636,375(0.01%)#1,823 |
| 10. | Broussard | 173 | 10,085(1.72%)#10 | 3,636,375(0.00%)#1,920 |
| 11. | Denham Springs | 170 | 10,085(1.69%)#11 | 3,636,375(0.00%)#1,939 |
| 12. | Shreveport | 165 | 10,085(1.64%)#12 | 3,636,375(0.00%)#1,977 |
| 13. | Laplace | 145 | 10,085(1.44%)#13 | 3,636,375(0.00%)#2,119 |
| 14. | Prien | 125 | 10,085(1.24%)#14 | 3,636,375(0.00%)#2,335 |
| 15. | Old Jefferson | 113 | 10,085(1.12%)#15 | 3,636,375(0.00%)#2,461 |
| 16. | Jefferson | 111 | 10,085(1.10%)#16 | 3,636,375(0.00%)#2,488 |
| 17. | Oakdale | 102 | 10,085(1.01%)#17 | 3,636,375(0.00%)#2,608 |
| 18. | Marrero | 88 | 10,085(0.87%)#18 | 3,636,375(0.00%)#2,798 |
| 19. | Basile | 86 | 10,085(0.85%)#19 | 3,636,375(0.00%)#2,840 |
| 20. | Mandeville | 74 | 10,085(0.73%)#20 | 3,636,375(0.00%)#3,043 |
| 21. | Hammond | 73 | 10,085(0.72%)#21 | 3,636,375(0.00%)#3,063 |
| 22. | Terrytown | 71 | 10,085(0.70%)#22 | 3,636,375(0.00%)#3,109 |
| 23. | Youngsville | 71 | 10,085(0.70%)#23 | 3,636,375(0.00%)#3,114 |
| 24. | Bayou Blue | 66 | 10,085(0.65%)#24 | 3,636,375(0.00%)#3,238 |
| 25. | Red Chute | 62 | 10,085(0.61%)#25 | 3,636,375(0.00%)#3,339 |
| 26. | Alexandria | 56 | 10,085(0.56%)#26 | 3,636,375(0.00%)#3,482 |
| 27. | Sulphur | 53 | 10,085(0.53%)#27 | 3,636,375(0.00%)#3,581 |
| 28. | Gretna | 51 | 10,085(0.51%)#28 | 3,636,375(0.00%)#3,659 |
| 29. | Gray | 49 | 10,085(0.49%)#29 | 3,636,375(0.00%)#3,740 |
| 30. | Bayou Cane | 48 | 10,085(0.48%)#30 | 3,636,375(0.00%)#3,766 |
| 31. | Houma | 46 | 10,085(0.46%)#31 | 3,636,375(0.00%)#3,822 |
| 32. | Bossier City | 45 | 10,085(0.45%)#32 | 3,636,375(0.00%)#3,859 |
| 33. | Amelia | 43 | 10,085(0.43%)#33 | 3,636,375(0.00%)#3,970 |
| 34. | Slidell | 42 | 10,085(0.42%)#34 | 3,636,375(0.00%)#3,980 |
| 35. | Sterlington | 41 | 10,085(0.41%)#35 | 3,636,375(0.00%)#4,037 |
| 36. | Ruston | 40 | 10,085(0.40%)#36 | 3,636,375(0.00%)#4,050 |
| 37. | New Iberia | 37 | 10,085(0.37%)#37 | 3,636,375(0.00%)#4,179 |
| 38. | Moss Bluff | 35 | 10,085(0.35%)#38 | 3,636,375(0.00%)#4,280 |
| 39. | West Monroe | 34 | 10,085(0.34%)#39 | 3,636,375(0.00%)#4,332 |
| 40. | Prairieville | 33 | 10,085(0.33%)#40 | 3,636,375(0.00%)#4,358 |
| 41. | Shenandoah | 33 | 10,085(0.33%)#41 | 3,636,375(0.00%)#4,364 |
| 42. | Gonzales | 32 | 10,085(0.32%)#42 | 3,636,375(0.00%)#4,430 |
| 43. | Elmwood | 31 | 10,085(0.31%)#43 | 3,636,375(0.00%)#4,504 |
| 44. | Deridder | 22 | 10,085(0.22%)#44 | 3,636,375(0.00%)#5,089 |
| 45. | Fort Polk South | 21 | 10,085(0.21%)#45 | 3,636,375(0.00%)#5,162 |
| 46. | Norco | 21 | 10,085(0.21%)#46 | 3,636,375(0.00%)#5,188 |
| 47. | Central | 19 | 10,085(0.19%)#47 | 3,636,375(0.00%)#5,280 |
| 48. | Timberlane | 18 | 10,085(0.18%)#48 | 3,636,375(0.00%)#5,384 |
| 49. | Meraux | 18 | 10,085(0.18%)#49 | 3,636,375(0.00%)#5,399 |
| 50. | Jonesboro | 18 | 10,085(0.18%)#50 | 3,636,375(0.00%)#5,411 |
| 51. | Scott | 16 | 10,085(0.16%)#51 | 3,636,375(0.00%)#5,568 |
| 52. | Woodmere | 14 | 10,085(0.14%)#52 | 3,636,375(0.00%)#5,748 |
| 53. | Covington | 14 | 10,085(0.14%)#53 | 3,636,375(0.00%)#5,749 |
| 54. | Monticello | 14 | 10,085(0.14%)#54 | 3,636,375(0.00%)#5,779 |
| 55. | Westminster | 14 | 10,085(0.14%)#55 | 3,636,375(0.00%)#5,795 |
| 56. | Pineville | 13 | 10,085(0.13%)#56 | 3,636,375(0.00%)#5,848 |
| 57. | Galliano | 13 | 10,085(0.13%)#57 | 3,636,375(0.00%)#5,868 |
| 58. | Eden Isle | 12 | 10,085(0.12%)#58 | 3,636,375(0.00%)#5,966 |
| 59. | Brownfields | 12 | 10,085(0.12%)#59 | 3,636,375(0.00%)#5,992 |
| 60. | Epps | 12 | 10,085(0.12%)#60 | 3,636,375(0.00%)#6,070 |
| 61. | Luling | 11 | 10,085(0.11%)#61 | 3,636,375(0.00%)#6,093 |
| 62. | St Gabriel | 11 | 10,085(0.11%)#62 | 3,636,375(0.00%)#6,115 |
| 63. | Avondale | 11 | 10,085(0.11%)#63 | 3,636,375(0.00%)#6,126 |
| 64. | Leesville | 10 | 10,085(0.10%)#64 | 3,636,375(0.00%)#6,252 |
| 65. | Farmerville | 10 | 10,085(0.10%)#65 | 3,636,375(0.00%)#6,279 |
| 66. | Abita Springs | 10 | 10,085(0.10%)#66 | 3,636,375(0.00%)#6,296 |
| 67. | Minden | 9 | 10,085(0.09%)#67 | 3,636,375(0.00%)#6,383 |
| 68. | Reserve | 9 | 10,085(0.09%)#68 | 3,636,375(0.00%)#6,399 |
| 69. | Breaux Bridge | 9 | 10,085(0.09%)#69 | 3,636,375(0.00%)#6,405 |
| 70. | Bridge City | 9 | 10,085(0.09%)#70 | 3,636,375(0.00%)#6,408 |
| 71. | Mansfield | 9 | 10,085(0.09%)#71 | 3,636,375(0.00%)#6,424 |
| 72. | Henderson | 9 | 10,085(0.09%)#72 | 3,636,375(0.00%)#6,467 |
| 73. | Bayou Country Club | 9 | 10,085(0.09%)#73 | 3,636,375(0.00%)#6,478 |
| 74. | Empire | 9 | 10,085(0.09%)#74 | 3,636,375(0.00%)#6,485 |
| 75. | Clarks | 9 | 10,085(0.09%)#75 | 3,636,375(0.00%)#6,500 |
| 76. | Franklin | 8 | 10,085(0.08%)#76 | 3,636,375(0.00%)#6,541 |
| 77. | Erath | 8 | 10,085(0.08%)#77 | 3,636,375(0.00%)#6,590 |
| 78. | Natchitoches | 7 | 10,085(0.07%)#78 | 3,636,375(0.00%)#6,664 |
| 79. | Monroe | 6 | 10,085(0.06%)#79 | 3,636,375(0.00%)#6,826 |
| 80. | Morgan City | 6 | 10,085(0.06%)#80 | 3,636,375(0.00%)#6,840 |
| 81. | Jennings | 6 | 10,085(0.06%)#81 | 3,636,375(0.00%)#6,845 |
| 82. | Grambling | 6 | 10,085(0.06%)#82 | 3,636,375(0.00%)#6,873 |
| 83. | Pine Prairie | 6 | 10,085(0.06%)#83 | 3,636,375(0.00%)#6,943 |
| 84. | Cut Off | 5 | 10,085(0.05%)#84 | 3,636,375(0.00%)#7,031 |
| 85. | Pearl River | 5 | 10,085(0.05%)#85 | 3,636,375(0.00%)#7,065 |
| 86. | Kentwood | 5 | 10,085(0.05%)#86 | 3,636,375(0.00%)#7,089 |
| 87. | Ringgold | 5 | 10,085(0.05%)#87 | 3,636,375(0.00%)#7,102 |
| 88. | Chalmette | 4 | 10,085(0.04%)#88 | 3,636,375(0.00%)#7,181 |
| 89. | Arabi | 4 | 10,085(0.04%)#89 | 3,636,375(0.00%)#7,214 |
| 90. | Destrehan | 2 | 10,085(0.02%)#90 | 3,636,375(0.00%)#7,615 |
| 91. | Urania | 2 | 10,085(0.02%)#91 | 3,636,375(0.00%)#7,697 |
| 92. | Folsom | 2 | 10,085(0.02%)#92 | 3,636,375(0.00%)#7,736 |
| 93. | Westwego | 1 | 10,085(0.01%)#93 | 3,636,375(0.00%)#7,863 |
| 94. | Oberlin | 1 | 10,085(0.01%)#94 | 3,636,375(0.00%)#7,889 |
| 95. | Leonville | 1 | 10,085(0.01%)#95 | 3,636,375(0.00%)#7,895 |
| 96. | Florien | 1 | 10,085(0.01%)#96 | 3,636,375(0.00%)#7,931 |
| 97. | Fenton | 1 | 10,085(0.01%)#97 | 3,636,375(0.00%)#7,993 |
Common Questions
What are the Top 10 Cities with the Most Immigrants from South America in Louisiana?
Top 10 Cities with the Most Immigrants from South America in Louisiana are:
#1
1,451
#2
833
#3
801
#4
595
#5
393
#6
378
#7
205
#8
191
#9
190
#10
173
What city has the Most Immigrants from South America in Louisiana?
New Orleans has the Most Immigrants from South America in Louisiana with 1,451.
What is the Total Immigrants from South America in the State of Louisiana?
Total Immigrants from South America in Louisiana is 10,085.
What is the Total Immigrants from South America in the United States?
Total Immigrants from South America in the United States is 3,636,375.