Cities with the Most Immigrants from South America in Tennessee
RELATED REPORTS & OPTIONS
South America
Tennessee
Compare Cities
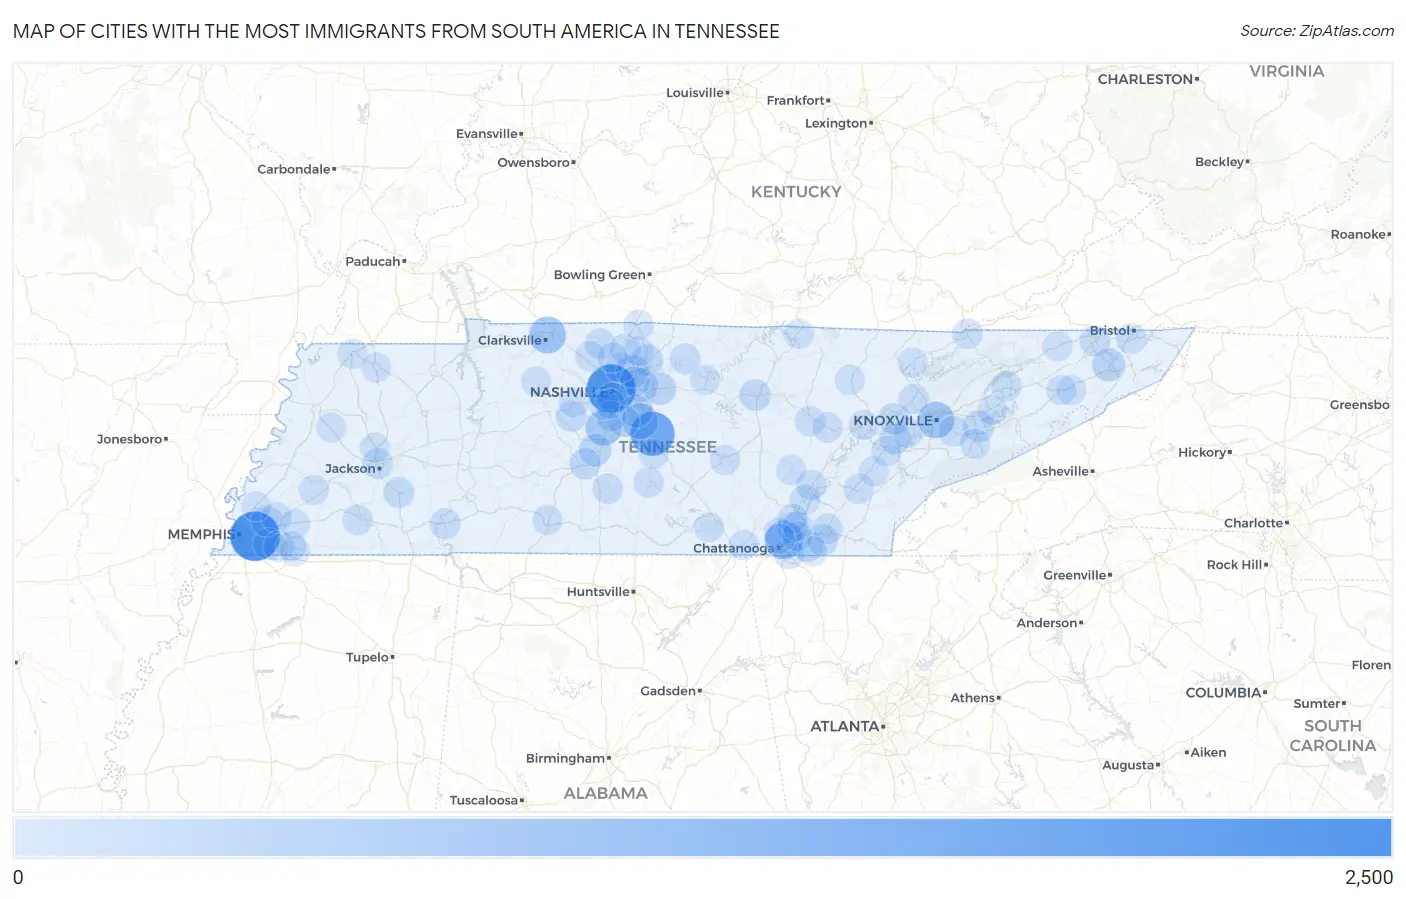
Map of Cities with the Most Immigrants from South America in Tennessee
0
2,500
Cities with the Most Immigrants from South America in Tennessee
| City | South America | vs State | vs National | |
| 1. | Memphis | 2,301 | 19,271(11.94%)#1 | 3,636,375(0.06%)#217 |
| 2. | Nashville | 2,220 | 19,271(11.52%)#2 | 3,636,375(0.06%)#229 |
| 3. | Murfreesboro | 1,644 | 19,271(8.53%)#3 | 3,636,375(0.05%)#304 |
| 4. | Chattanooga | 943 | 19,271(4.89%)#4 | 3,636,375(0.03%)#514 |
| 5. | Clarksville | 785 | 19,271(4.07%)#5 | 3,636,375(0.02%)#609 |
| 6. | Knoxville | 723 | 19,271(3.75%)#6 | 3,636,375(0.02%)#671 |
| 7. | Franklin | 704 | 19,271(3.65%)#7 | 3,636,375(0.02%)#683 |
| 8. | Smyrna | 667 | 19,271(3.46%)#8 | 3,636,375(0.02%)#726 |
| 9. | Mount Juliet | 347 | 19,271(1.80%)#9 | 3,636,375(0.01%)#1,208 |
| 10. | Johnson City | 325 | 19,271(1.69%)#10 | 3,636,375(0.01%)#1,280 |
| 11. | Hendersonville | 316 | 19,271(1.64%)#11 | 3,636,375(0.01%)#1,297 |
| 12. | La Vergne | 296 | 19,271(1.54%)#12 | 3,636,375(0.01%)#1,350 |
| 13. | Spring Hill | 266 | 19,271(1.38%)#13 | 3,636,375(0.01%)#1,462 |
| 14. | Lebanon | 263 | 19,271(1.36%)#14 | 3,636,375(0.01%)#1,469 |
| 15. | Cookeville | 193 | 19,271(1.00%)#15 | 3,636,375(0.01%)#1,805 |
| 16. | Sevierville | 189 | 19,271(0.98%)#16 | 3,636,375(0.01%)#1,827 |
| 17. | Germantown | 164 | 19,271(0.85%)#17 | 3,636,375(0.00%)#1,989 |
| 18. | Collegedale | 162 | 19,271(0.84%)#18 | 3,636,375(0.00%)#2,003 |
| 19. | South Cleveland | 160 | 19,271(0.83%)#19 | 3,636,375(0.00%)#2,018 |
| 20. | Nolensville | 158 | 19,271(0.82%)#20 | 3,636,375(0.00%)#2,029 |
| 21. | Gallatin | 148 | 19,271(0.77%)#21 | 3,636,375(0.00%)#2,087 |
| 22. | Columbia | 142 | 19,271(0.74%)#22 | 3,636,375(0.00%)#2,149 |
| 23. | Oak Ridge | 137 | 19,271(0.71%)#23 | 3,636,375(0.00%)#2,194 |
| 24. | Fairview | 121 | 19,271(0.63%)#24 | 3,636,375(0.00%)#2,373 |
| 25. | Lenoir City | 107 | 19,271(0.56%)#25 | 3,636,375(0.00%)#2,537 |
| 26. | Middle Valley | 106 | 19,271(0.55%)#26 | 3,636,375(0.00%)#2,552 |
| 27. | Jackson | 100 | 19,271(0.52%)#27 | 3,636,375(0.00%)#2,624 |
| 28. | Bartlett | 100 | 19,271(0.52%)#28 | 3,636,375(0.00%)#2,625 |
| 29. | Henderson | 100 | 19,271(0.52%)#29 | 3,636,375(0.00%)#2,629 |
| 30. | Collierville | 94 | 19,271(0.49%)#30 | 3,636,375(0.00%)#2,697 |
| 31. | Dayton | 85 | 19,271(0.44%)#31 | 3,636,375(0.00%)#2,852 |
| 32. | Savannah | 80 | 19,271(0.42%)#32 | 3,636,375(0.00%)#2,935 |
| 33. | Brentwood | 76 | 19,271(0.39%)#33 | 3,636,375(0.00%)#2,984 |
| 34. | Kingsport | 72 | 19,271(0.37%)#34 | 3,636,375(0.00%)#3,078 |
| 35. | Cleveland | 69 | 19,271(0.36%)#35 | 3,636,375(0.00%)#3,148 |
| 36. | Seymour | 64 | 19,271(0.33%)#36 | 3,636,375(0.00%)#3,283 |
| 37. | Lewisburg | 63 | 19,271(0.33%)#37 | 3,636,375(0.00%)#3,309 |
| 38. | Hartsville Trousdale County | 62 | 19,271(0.32%)#38 | 3,636,375(0.00%)#3,334 |
| 39. | Springfield | 60 | 19,271(0.31%)#39 | 3,636,375(0.00%)#3,375 |
| 40. | East Ridge | 56 | 19,271(0.29%)#40 | 3,636,375(0.00%)#3,485 |
| 41. | Pigeon Forge | 53 | 19,271(0.28%)#41 | 3,636,375(0.00%)#3,601 |
| 42. | White House | 50 | 19,271(0.26%)#42 | 3,636,375(0.00%)#3,695 |
| 43. | Farragut | 46 | 19,271(0.24%)#43 | 3,636,375(0.00%)#3,825 |
| 44. | Crossville | 46 | 19,271(0.24%)#44 | 3,636,375(0.00%)#3,836 |
| 45. | Sale Creek | 46 | 19,271(0.24%)#45 | 3,636,375(0.00%)#3,853 |
| 46. | Athens | 45 | 19,271(0.23%)#46 | 3,636,375(0.00%)#3,866 |
| 47. | Shelbyville | 39 | 19,271(0.20%)#47 | 3,636,375(0.00%)#4,096 |
| 48. | Coopertown | 37 | 19,271(0.19%)#48 | 3,636,375(0.00%)#4,201 |
| 49. | Goodlettsville | 36 | 19,271(0.19%)#49 | 3,636,375(0.00%)#4,231 |
| 50. | Clinton | 33 | 19,271(0.17%)#50 | 3,636,375(0.00%)#4,377 |
| 51. | Bristol | 32 | 19,271(0.17%)#51 | 3,636,375(0.00%)#4,419 |
| 52. | Powell | 31 | 19,271(0.16%)#52 | 3,636,375(0.00%)#4,488 |
| 53. | Lakeland | 29 | 19,271(0.15%)#53 | 3,636,375(0.00%)#4,602 |
| 54. | Mcminnville | 26 | 19,271(0.13%)#54 | 3,636,375(0.00%)#4,797 |
| 55. | Morristown | 24 | 19,271(0.12%)#55 | 3,636,375(0.00%)#4,915 |
| 56. | Lawrenceburg | 23 | 19,271(0.12%)#56 | 3,636,375(0.00%)#5,005 |
| 57. | Bolivar | 23 | 19,271(0.12%)#57 | 3,636,375(0.00%)#5,031 |
| 58. | Harrogate | 23 | 19,271(0.12%)#58 | 3,636,375(0.00%)#5,036 |
| 59. | Soddy Daisy | 22 | 19,271(0.11%)#59 | 3,636,375(0.00%)#5,080 |
| 60. | Walden | 21 | 19,271(0.11%)#60 | 3,636,375(0.00%)#5,197 |
| 61. | Crab Orchard | 21 | 19,271(0.11%)#61 | 3,636,375(0.00%)#5,202 |
| 62. | Union City | 17 | 19,271(0.09%)#62 | 3,636,375(0.00%)#5,480 |
| 63. | Green Hill | 17 | 19,271(0.09%)#63 | 3,636,375(0.00%)#5,492 |
| 64. | Cottontown | 17 | 19,271(0.09%)#64 | 3,636,375(0.00%)#5,543 |
| 65. | Martin | 16 | 19,271(0.08%)#65 | 3,636,375(0.00%)#5,564 |
| 66. | Sweetwater | 15 | 19,271(0.08%)#66 | 3,636,375(0.00%)#5,665 |
| 67. | Christiana | 15 | 19,271(0.08%)#67 | 3,636,375(0.00%)#5,670 |
| 68. | Sewanee | 15 | 19,271(0.08%)#68 | 3,636,375(0.00%)#5,685 |
| 69. | Harrison | 14 | 19,271(0.07%)#69 | 3,636,375(0.00%)#5,758 |
| 70. | Ridgetop | 13 | 19,271(0.07%)#70 | 3,636,375(0.00%)#5,903 |
| 71. | Berry Hill | 10 | 19,271(0.05%)#71 | 3,636,375(0.00%)#6,318 |
| 72. | Apison | 8 | 19,271(0.04%)#72 | 3,636,375(0.00%)#6,558 |
| 73. | Lakesite | 8 | 19,271(0.04%)#73 | 3,636,375(0.00%)#6,594 |
| 74. | Friendship | 8 | 19,271(0.04%)#74 | 3,636,375(0.00%)#6,638 |
| 75. | Loudon | 7 | 19,271(0.04%)#75 | 3,636,375(0.00%)#6,709 |
| 76. | Harriman | 7 | 19,271(0.04%)#76 | 3,636,375(0.00%)#6,710 |
| 77. | Forest Hills | 7 | 19,271(0.04%)#77 | 3,636,375(0.00%)#6,717 |
| 78. | Three Way | 7 | 19,271(0.04%)#78 | 3,636,375(0.00%)#6,766 |
| 79. | Kahite | 7 | 19,271(0.04%)#79 | 3,636,375(0.00%)#6,816 |
| 80. | Oak Hill | 6 | 19,271(0.03%)#80 | 3,636,375(0.00%)#6,878 |
| 81. | La Follette | 5 | 19,271(0.03%)#81 | 3,636,375(0.00%)#7,025 |
| 82. | Dandridge | 5 | 19,271(0.03%)#82 | 3,636,375(0.00%)#7,048 |
| 83. | Pikeville | 5 | 19,271(0.03%)#83 | 3,636,375(0.00%)#7,067 |
| 84. | Sunbright | 5 | 19,271(0.03%)#84 | 3,636,375(0.00%)#7,137 |
| 85. | Mitchellville | 5 | 19,271(0.03%)#85 | 3,636,375(0.00%)#7,175 |
| 86. | Greeneville | 4 | 19,271(0.02%)#86 | 3,636,375(0.00%)#7,189 |
| 87. | Jasper | 4 | 19,271(0.02%)#87 | 3,636,375(0.00%)#7,221 |
| 88. | Surgoinsville | 4 | 19,271(0.02%)#88 | 3,636,375(0.00%)#7,254 |
| 89. | Biltmore | 4 | 19,271(0.02%)#89 | 3,636,375(0.00%)#7,280 |
| 90. | Rossville | 4 | 19,271(0.02%)#90 | 3,636,375(0.00%)#7,321 |
| 91. | Vanleer | 4 | 19,271(0.02%)#91 | 3,636,375(0.00%)#7,364 |
| 92. | Stanton | 4 | 19,271(0.02%)#92 | 3,636,375(0.00%)#7,367 |
| 93. | Red Bank | 3 | 19,271(0.02%)#93 | 3,636,375(0.00%)#7,409 |
| 94. | Millington | 3 | 19,271(0.02%)#94 | 3,636,375(0.00%)#7,413 |
| 95. | Oakland | 3 | 19,271(0.02%)#95 | 3,636,375(0.00%)#7,414 |
| 96. | Tusculum | 3 | 19,271(0.02%)#96 | 3,636,375(0.00%)#7,430 |
| 97. | Kingston Springs | 3 | 19,271(0.02%)#97 | 3,636,375(0.00%)#7,438 |
| 98. | Piperton | 3 | 19,271(0.02%)#98 | 3,636,375(0.00%)#7,444 |
| 99. | South Carthage | 3 | 19,271(0.02%)#99 | 3,636,375(0.00%)#7,470 |
| 100. | Byrdstown | 3 | 19,271(0.02%)#100 | 3,636,375(0.00%)#7,504 |
Common Questions
What are the Top 10 Cities with the Most Immigrants from South America in Tennessee?
Top 10 Cities with the Most Immigrants from South America in Tennessee are:
#1
2,301
#2
2,220
#3
1,644
#4
943
#5
785
#6
723
#7
704
#8
667
#9
347
#10
325
What city has the Most Immigrants from South America in Tennessee?
Memphis has the Most Immigrants from South America in Tennessee with 2,301.
What is the Total Immigrants from South America in the State of Tennessee?
Total Immigrants from South America in Tennessee is 19,271.
What is the Total Immigrants from South America in the United States?
Total Immigrants from South America in the United States is 3,636,375.