Cities with the Most Immigrants from Middle Africa in Ohio
RELATED REPORTS & OPTIONS
Middle Africa
Ohio
Compare Cities
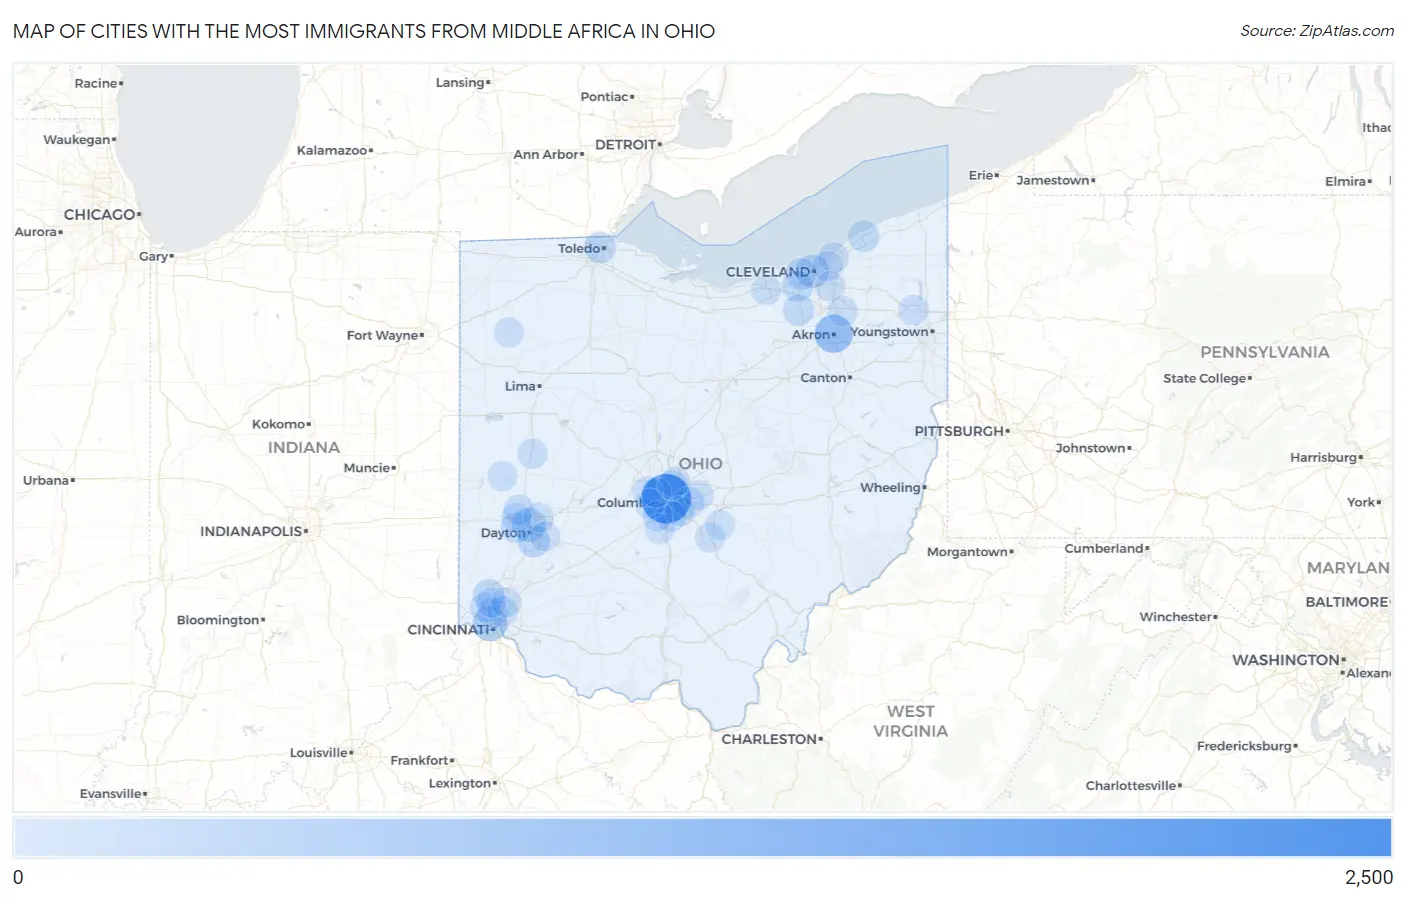
Map of Cities with the Most Immigrants from Middle Africa in Ohio
0
2,500
Cities with the Most Immigrants from Middle Africa in Ohio
| City | Middle Africa | vs State | vs National | |
| 1. | Columbus | 2,254 | 7,017(32.12%)#1 | 193,874(1.16%)#7 |
| 2. | Akron | 915 | 7,017(13.04%)#2 | 193,874(0.47%)#34 |
| 3. | Cincinnati | 529 | 7,017(7.54%)#3 | 193,874(0.27%)#65 |
| 4. | Dayton | 422 | 7,017(6.01%)#4 | 193,874(0.22%)#81 |
| 5. | Cleveland | 347 | 7,017(4.95%)#5 | 193,874(0.18%)#114 |
| 6. | Kettering | 246 | 7,017(3.51%)#6 | 193,874(0.13%)#167 |
| 7. | Fairfield | 195 | 7,017(2.78%)#7 | 193,874(0.10%)#209 |
| 8. | Toledo | 180 | 7,017(2.57%)#8 | 193,874(0.09%)#222 |
| 9. | Painesville | 162 | 7,017(2.31%)#9 | 193,874(0.08%)#241 |
| 10. | Lakewood | 156 | 7,017(2.22%)#10 | 193,874(0.08%)#245 |
| 11. | Brunswick | 145 | 7,017(2.07%)#11 | 193,874(0.07%)#263 |
| 12. | Brook Park | 137 | 7,017(1.95%)#12 | 193,874(0.07%)#275 |
| 13. | Reynoldsburg | 135 | 7,017(1.92%)#13 | 193,874(0.07%)#279 |
| 14. | Trotwood | 120 | 7,017(1.71%)#14 | 193,874(0.06%)#300 |
| 15. | Obetz | 91 | 7,017(1.30%)#15 | 193,874(0.05%)#371 |
| 16. | Union | 63 | 7,017(0.90%)#16 | 193,874(0.03%)#498 |
| 17. | Euclid | 53 | 7,017(0.76%)#17 | 193,874(0.03%)#549 |
| 18. | Huber Ridge | 46 | 7,017(0.66%)#18 | 193,874(0.02%)#600 |
| 19. | Finneytown | 41 | 7,017(0.58%)#19 | 193,874(0.02%)#641 |
| 20. | Hilliard | 39 | 7,017(0.56%)#20 | 193,874(0.02%)#659 |
| 21. | Commercial Point | 38 | 7,017(0.54%)#21 | 193,874(0.02%)#673 |
| 22. | Northbrook | 37 | 7,017(0.53%)#22 | 193,874(0.02%)#680 |
| 23. | Warren | 32 | 7,017(0.46%)#23 | 193,874(0.02%)#726 |
| 24. | Elyria | 28 | 7,017(0.40%)#24 | 193,874(0.01%)#771 |
| 25. | East Cleveland | 28 | 7,017(0.40%)#25 | 193,874(0.01%)#778 |
| 26. | Blacklick Estates | 28 | 7,017(0.40%)#26 | 193,874(0.01%)#780 |
| 27. | Sidney | 23 | 7,017(0.33%)#27 | 193,874(0.01%)#831 |
| 28. | Reading | 23 | 7,017(0.33%)#28 | 193,874(0.01%)#835 |
| 29. | Lincoln Village | 23 | 7,017(0.33%)#29 | 193,874(0.01%)#836 |
| 30. | Pataskala | 18 | 7,017(0.26%)#30 | 193,874(0.01%)#929 |
| 31. | Maple Heights | 17 | 7,017(0.24%)#31 | 193,874(0.01%)#948 |
| 32. | Grove City | 16 | 7,017(0.23%)#32 | 193,874(0.01%)#964 |
| 33. | Forest Park | 15 | 7,017(0.21%)#33 | 193,874(0.01%)#996 |
| 34. | Sharonville | 11 | 7,017(0.16%)#34 | 193,874(0.01%)#1,108 |
| 35. | Huber Heights | 10 | 7,017(0.14%)#35 | 193,874(0.01%)#1,129 |
| 36. | Hudson | 9 | 7,017(0.13%)#36 | 193,874(0.00%)#1,165 |
| 37. | Oakwood | 9 | 7,017(0.13%)#37 | 193,874(0.00%)#1,175 |
| 38. | Upper Arlington | 7 | 7,017(0.10%)#38 | 193,874(0.00%)#1,218 |
| 39. | Bradford | 7 | 7,017(0.10%)#39 | 193,874(0.00%)#1,233 |
| 40. | Lancaster | 6 | 7,017(0.09%)#40 | 193,874(0.00%)#1,243 |
| 41. | Minerva Park | 5 | 7,017(0.07%)#41 | 193,874(0.00%)#1,279 |
| 42. | Pleasantville | 3 | 7,017(0.04%)#42 | 193,874(0.00%)#1,333 |
| 43. | Beavercreek | 1 | 7,017(0.01%)#43 | 193,874(0.00%)#1,369 |
| 44. | Englewood | 1 | 7,017(0.01%)#44 | 193,874(0.00%)#1,377 |
Common Questions
What are the Top 10 Cities with the Most Immigrants from Middle Africa in Ohio?
Top 10 Cities with the Most Immigrants from Middle Africa in Ohio are:
#1
2,254
#2
915
#3
529
#4
422
#5
347
#6
246
#7
195
#8
180
#9
162
#10
156
What city has the Most Immigrants from Middle Africa in Ohio?
Columbus has the Most Immigrants from Middle Africa in Ohio with 2,254.
What is the Total Immigrants from Middle Africa in the State of Ohio?
Total Immigrants from Middle Africa in Ohio is 7,017.
What is the Total Immigrants from Middle Africa in the United States?
Total Immigrants from Middle Africa in the United States is 193,874.