Cities with the Most Immigrants from Middle Africa in Iowa
RELATED REPORTS & OPTIONS
Middle Africa
Iowa
Compare Cities
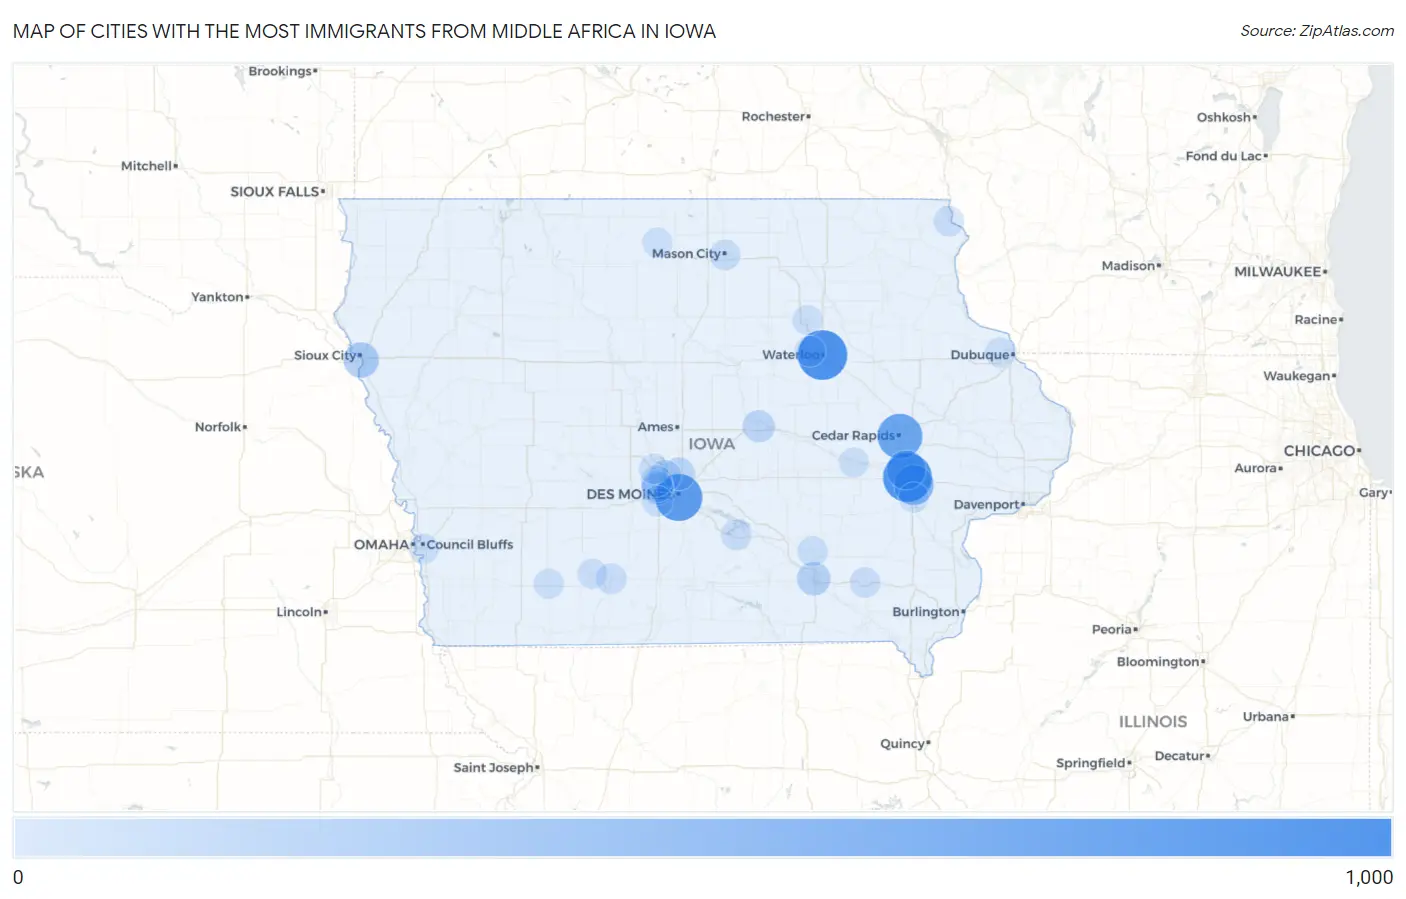
Map of Cities with the Most Immigrants from Middle Africa in Iowa
0
1,000
Cities with the Most Immigrants from Middle Africa in Iowa
| City | Middle Africa | vs State | vs National | |
| 1. | Waterloo | 976 | 5,594(17.45%)#1 | 193,874(0.50%)#29 |
| 2. | Coralville | 942 | 5,594(16.84%)#2 | 193,874(0.49%)#33 |
| 3. | Des Moines | 852 | 5,594(15.23%)#3 | 193,874(0.44%)#38 |
| 4. | Cedar Rapids | 735 | 5,594(13.14%)#4 | 193,874(0.38%)#45 |
| 5. | Iowa City | 483 | 5,594(8.63%)#5 | 193,874(0.25%)#72 |
| 6. | North Liberty | 435 | 5,594(7.78%)#6 | 193,874(0.22%)#80 |
| 7. | Sioux City | 254 | 5,594(4.54%)#7 | 193,874(0.13%)#159 |
| 8. | Ottumwa | 156 | 5,594(2.79%)#8 | 193,874(0.08%)#247 |
| 9. | Ankeny | 119 | 5,594(2.13%)#9 | 193,874(0.06%)#302 |
| 10. | Johnston | 104 | 5,594(1.86%)#10 | 193,874(0.05%)#333 |
| 11. | Marshalltown | 99 | 5,594(1.77%)#11 | 193,874(0.05%)#347 |
| 12. | Clive | 83 | 5,594(1.48%)#12 | 193,874(0.04%)#402 |
| 13. | Urbandale | 71 | 5,594(1.27%)#13 | 193,874(0.04%)#452 |
| 14. | Grimes | 59 | 5,594(1.05%)#14 | 193,874(0.03%)#515 |
| 15. | West Des Moines | 32 | 5,594(0.57%)#15 | 193,874(0.02%)#724 |
| 16. | Mason City | 31 | 5,594(0.55%)#16 | 193,874(0.02%)#736 |
| 17. | Cedar Falls | 28 | 5,594(0.50%)#17 | 193,874(0.01%)#772 |
| 18. | Knoxville | 25 | 5,594(0.45%)#18 | 193,874(0.01%)#812 |
| 19. | Afton | 21 | 5,594(0.38%)#19 | 193,874(0.01%)#878 |
| 20. | Lansing | 15 | 5,594(0.27%)#20 | 193,874(0.01%)#1,003 |
| 21. | Fremont | 12 | 5,594(0.21%)#21 | 193,874(0.01%)#1,086 |
| 22. | Fairfield | 11 | 5,594(0.20%)#22 | 193,874(0.01%)#1,109 |
| 23. | Waverly | 7 | 5,594(0.13%)#23 | 193,874(0.00%)#1,227 |
| 24. | Granger | 7 | 5,594(0.13%)#24 | 193,874(0.00%)#1,231 |
| 25. | Council Bluffs | 6 | 5,594(0.11%)#25 | 193,874(0.00%)#1,241 |
| 26. | Asbury | 5 | 5,594(0.09%)#26 | 193,874(0.00%)#1,272 |
| 27. | Marengo | 5 | 5,594(0.09%)#27 | 193,874(0.00%)#1,276 |
| 28. | Corning | 4 | 5,594(0.07%)#28 | 193,874(0.00%)#1,294 |
| 29. | Creston | 3 | 5,594(0.05%)#29 | 193,874(0.00%)#1,318 |
| 30. | Hills | 3 | 5,594(0.05%)#30 | 193,874(0.00%)#1,332 |
| 31. | Crystal Lake | 2 | 5,594(0.04%)#31 | 193,874(0.00%)#1,364 |
Common Questions
What are the Top 10 Cities with the Most Immigrants from Middle Africa in Iowa?
Top 10 Cities with the Most Immigrants from Middle Africa in Iowa are:
#1
976
#2
942
#3
852
#4
735
#5
483
#6
435
#7
254
#8
156
#9
119
#10
104
What city has the Most Immigrants from Middle Africa in Iowa?
Waterloo has the Most Immigrants from Middle Africa in Iowa with 976.
What is the Total Immigrants from Middle Africa in the State of Iowa?
Total Immigrants from Middle Africa in Iowa is 5,594.
What is the Total Immigrants from Middle Africa in the United States?
Total Immigrants from Middle Africa in the United States is 193,874.