Cities with the Most Immigrants from Middle Africa in Minnesota
RELATED REPORTS & OPTIONS
Middle Africa
Minnesota
Compare Cities
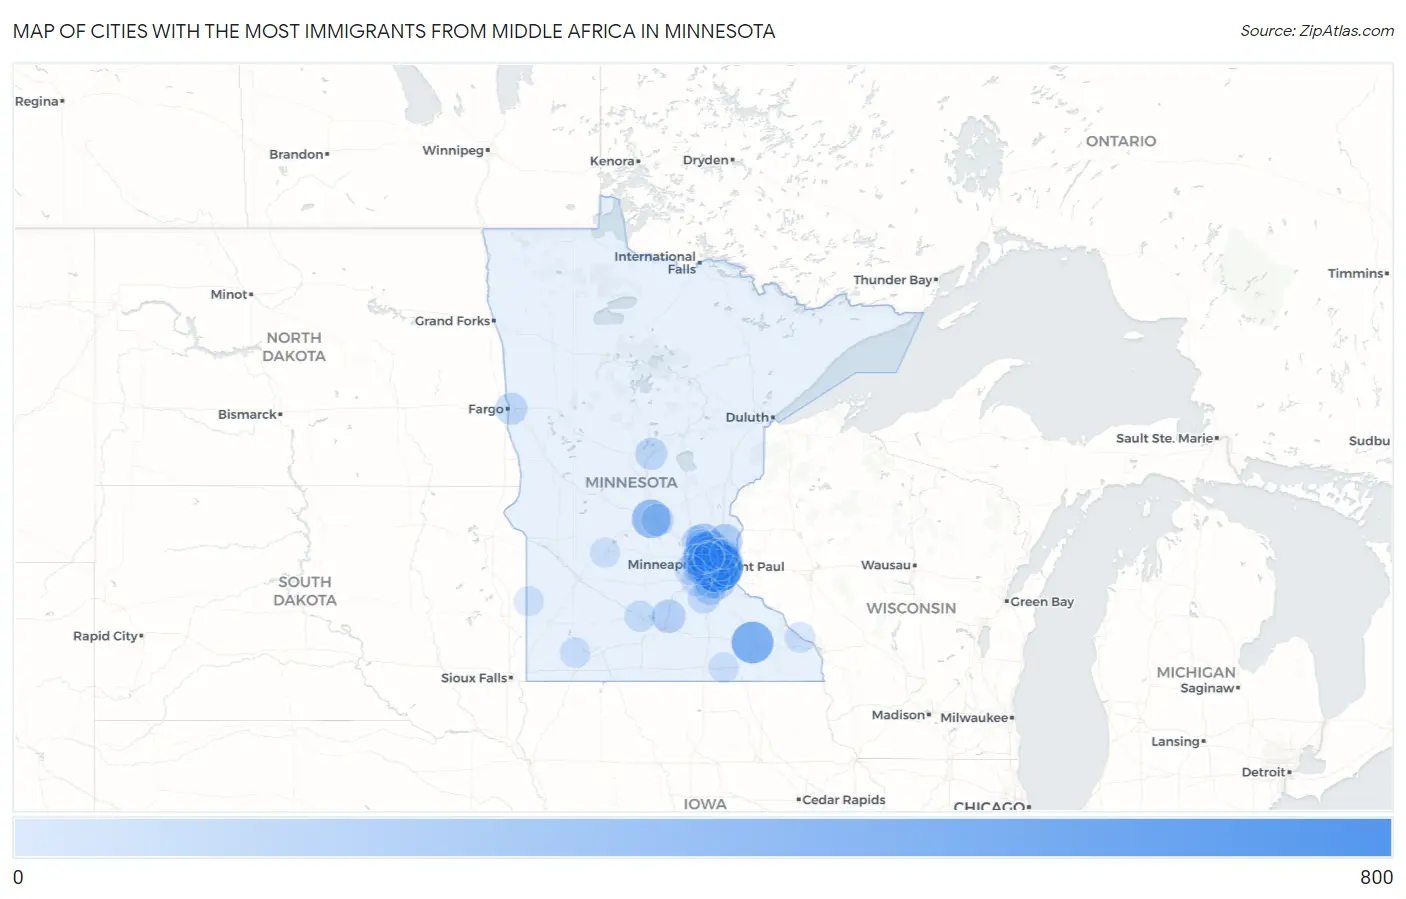
Map of Cities with the Most Immigrants from Middle Africa in Minnesota
0
800
Cities with the Most Immigrants from Middle Africa in Minnesota
| City | Middle Africa | vs State | vs National | |
| 1. | St Paul | 690 | 4,581(15.06%)#1 | 193,874(0.36%)#49 |
| 2. | Rochester | 410 | 4,581(8.95%)#2 | 193,874(0.21%)#86 |
| 3. | Brooklyn Park | 296 | 4,581(6.46%)#3 | 193,874(0.15%)#133 |
| 4. | Waite Park | 292 | 4,581(6.37%)#4 | 193,874(0.15%)#135 |
| 5. | New Hope | 218 | 4,581(4.76%)#5 | 193,874(0.11%)#192 |
| 6. | Blaine | 207 | 4,581(4.52%)#6 | 193,874(0.11%)#198 |
| 7. | Oakdale | 196 | 4,581(4.28%)#7 | 193,874(0.10%)#206 |
| 8. | Andover | 188 | 4,581(4.10%)#8 | 193,874(0.10%)#218 |
| 9. | Forest Lake | 156 | 4,581(3.41%)#9 | 193,874(0.08%)#248 |
| 10. | Minneapolis | 143 | 4,581(3.12%)#10 | 193,874(0.07%)#264 |
| 11. | Coon Rapids | 124 | 4,581(2.71%)#11 | 193,874(0.06%)#292 |
| 12. | St Peter | 120 | 4,581(2.62%)#12 | 193,874(0.06%)#301 |
| 13. | Hopkins | 107 | 4,581(2.34%)#13 | 193,874(0.06%)#329 |
| 14. | Brooklyn Center | 100 | 4,581(2.18%)#14 | 193,874(0.05%)#341 |
| 15. | Rosemount | 89 | 4,581(1.94%)#15 | 193,874(0.05%)#380 |
| 16. | St Cloud | 81 | 4,581(1.77%)#16 | 193,874(0.04%)#409 |
| 17. | Lakeville | 80 | 4,581(1.75%)#17 | 193,874(0.04%)#415 |
| 18. | Apple Valley | 76 | 4,581(1.66%)#18 | 193,874(0.04%)#424 |
| 19. | St Louis Park | 74 | 4,581(1.62%)#19 | 193,874(0.04%)#431 |
| 20. | South St Paul | 71 | 4,581(1.55%)#20 | 193,874(0.04%)#454 |
| 21. | Moorhead | 70 | 4,581(1.53%)#21 | 193,874(0.04%)#458 |
| 22. | White Bear Lake | 68 | 4,581(1.48%)#22 | 193,874(0.04%)#467 |
| 23. | Roseville | 64 | 4,581(1.40%)#23 | 193,874(0.03%)#489 |
| 24. | Baxter | 64 | 4,581(1.40%)#24 | 193,874(0.03%)#491 |
| 25. | Elko New Market | 63 | 4,581(1.38%)#25 | 193,874(0.03%)#499 |
| 26. | Columbia Heights | 61 | 4,581(1.33%)#26 | 193,874(0.03%)#506 |
| 27. | Spring Lake Park | 55 | 4,581(1.20%)#27 | 193,874(0.03%)#539 |
| 28. | Ramsey | 51 | 4,581(1.11%)#28 | 193,874(0.03%)#563 |
| 29. | St Paul Park | 44 | 4,581(0.96%)#29 | 193,874(0.02%)#613 |
| 30. | Eagan | 42 | 4,581(0.92%)#30 | 193,874(0.02%)#629 |
| 31. | New Ulm | 37 | 4,581(0.81%)#31 | 193,874(0.02%)#679 |
| 32. | Anoka | 33 | 4,581(0.72%)#32 | 193,874(0.02%)#717 |
| 33. | Golden Valley | 30 | 4,581(0.65%)#33 | 193,874(0.02%)#746 |
| 34. | Woodbury | 22 | 4,581(0.48%)#34 | 193,874(0.01%)#845 |
| 35. | Plymouth | 20 | 4,581(0.44%)#35 | 193,874(0.01%)#880 |
| 36. | Winona | 17 | 4,581(0.37%)#36 | 193,874(0.01%)#947 |
| 37. | Maplewood | 16 | 4,581(0.35%)#37 | 193,874(0.01%)#965 |
| 38. | Fulda | 15 | 4,581(0.33%)#38 | 193,874(0.01%)#1,002 |
| 39. | Edina | 13 | 4,581(0.28%)#39 | 193,874(0.01%)#1,029 |
| 40. | Crystal | 12 | 4,581(0.26%)#40 | 193,874(0.01%)#1,067 |
| 41. | Shakopee | 11 | 4,581(0.24%)#41 | 193,874(0.01%)#1,099 |
| 42. | Fridley | 11 | 4,581(0.24%)#42 | 193,874(0.01%)#1,102 |
| 43. | North Oaks | 11 | 4,581(0.24%)#43 | 193,874(0.01%)#1,113 |
| 44. | Austin | 10 | 4,581(0.22%)#44 | 193,874(0.01%)#1,134 |
| 45. | Shorewood | 6 | 4,581(0.13%)#45 | 193,874(0.00%)#1,253 |
| 46. | Hendricks | 4 | 4,581(0.09%)#46 | 193,874(0.00%)#1,302 |
| 47. | Willmar | 3 | 4,581(0.07%)#47 | 193,874(0.00%)#1,312 |
| 48. | Dellwood | 2 | 4,581(0.04%)#48 | 193,874(0.00%)#1,357 |
| 49. | Hilltop | 1 | 4,581(0.02%)#49 | 193,874(0.00%)#1,394 |
Common Questions
What are the Top 10 Cities with the Most Immigrants from Middle Africa in Minnesota?
Top 10 Cities with the Most Immigrants from Middle Africa in Minnesota are:
#1
690
#2
410
#3
296
#4
292
#5
218
#6
207
#7
196
#8
188
#9
156
#10
143
What city has the Most Immigrants from Middle Africa in Minnesota?
St Paul has the Most Immigrants from Middle Africa in Minnesota with 690.
What is the Total Immigrants from Middle Africa in the State of Minnesota?
Total Immigrants from Middle Africa in Minnesota is 4,581.
What is the Total Immigrants from Middle Africa in the United States?
Total Immigrants from Middle Africa in the United States is 193,874.