Manistee Lake, MI
Manistee Lake Map
Manistee Lake Overview
366
TOTAL POPULATION
221
MALE POPULATION
145
FEMALE POPULATION
152.41
MALES / 100 FEMALES
65.61
FEMALES / 100 MALES
53.7
MEDIAN AGE
2.7
AVG FAMILY SIZE
2.1
AVG HOUSEHOLD SIZE
$30,517
PER CAPITA INCOME
$57,708
AVG FAMILY INCOME
$51,477
AVG HOUSEHOLD INCOME
54.1%
WAGE / INCOME GAP [ % ]
45.9¢/ $1
WAGE / INCOME GAP [ $ ]
0.39
INEQUALITY / GINI INDEX
130
LABOR FORCE [ PEOPLE ]
39.3%
PERCENT IN LABOR FORCE
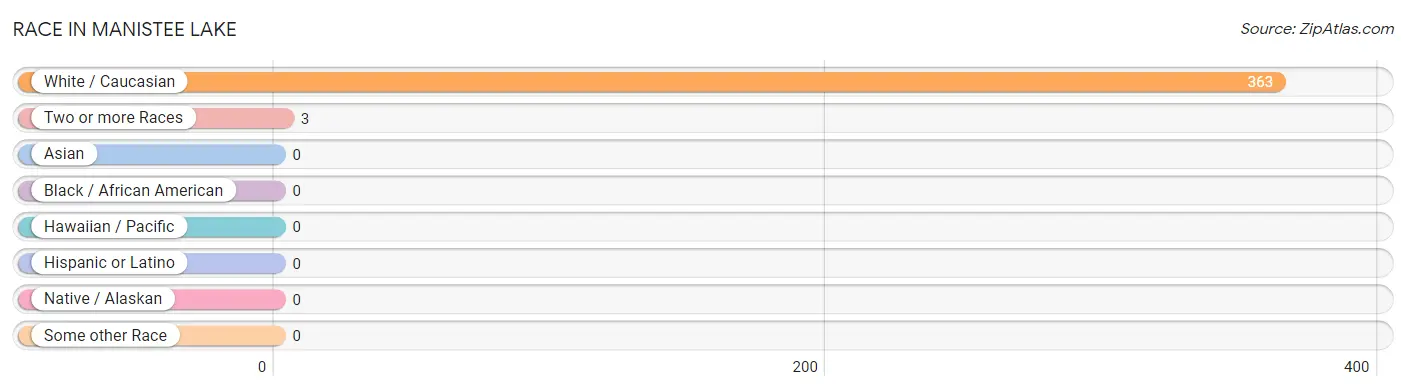
Race in Manistee Lake
The most populous races in Manistee Lake are White / Caucasian (363 | 99.2%), and Two or more Races (3 | 0.8%).
| Race | # Population | % Population |
| Asian | 0 | 0.0% |
| Black / African American | 0 | 0.0% |
| Hawaiian / Pacific | 0 | 0.0% |
| Hispanic or Latino | 0 | 0.0% |
| Native / Alaskan | 0 | 0.0% |
| White / Caucasian | 363 | 99.2% |
| Two or more Races | 3 | 0.8% |
| Some other Race | 0 | 0.0% |
| Total | 366 | 100.0% |
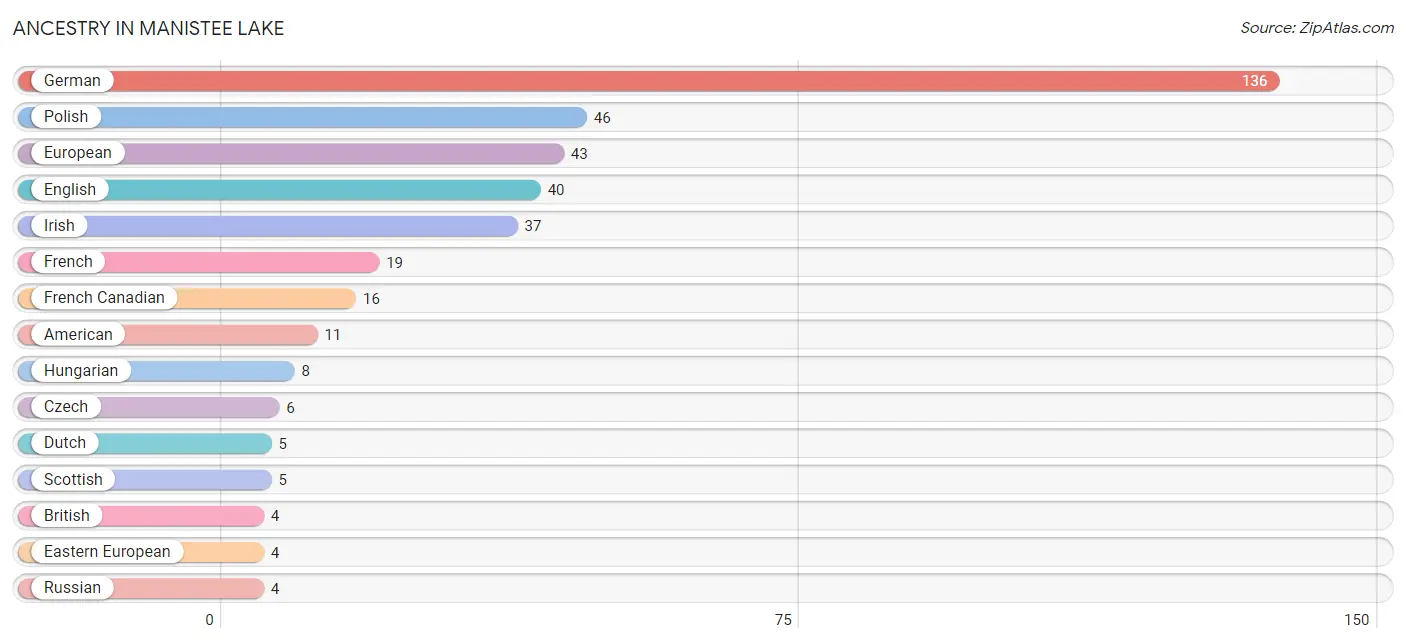
Ancestry in Manistee Lake
The most populous ancestries reported in Manistee Lake are German (136 | 37.2%), Polish (46 | 12.6%), European (43 | 11.7%), English (40 | 10.9%), and Irish (37 | 10.1%), together accounting for 82.5% of all Manistee Lake residents.
| Ancestry | # Population | % Population |
| American | 11 | 3.0% |
| British | 4 | 1.1% |
| Czech | 6 | 1.6% |
| Dutch | 5 | 1.4% |
| Eastern European | 4 | 1.1% |
| English | 40 | 10.9% |
| European | 43 | 11.7% |
| French | 19 | 5.2% |
| French Canadian | 16 | 4.4% |
| German | 136 | 37.2% |
| Hungarian | 8 | 2.2% |
| Irish | 37 | 10.1% |
| Italian | 2 | 0.5% |
| Maltese | 3 | 0.8% |
| Polish | 46 | 12.6% |
| Russian | 4 | 1.1% |
| Scandinavian | 4 | 1.1% |
| Scotch-Irish | 3 | 0.8% |
| Scottish | 5 | 1.4% |
| Swedish | 2 | 0.5% |
| Swiss | 3 | 0.8% |
| Ukrainian | 2 | 0.5% | View All 22 Rows |
Immigrants in Manistee Lake

| Immigration Origin | # Population | % Population | View All 0 Rows |
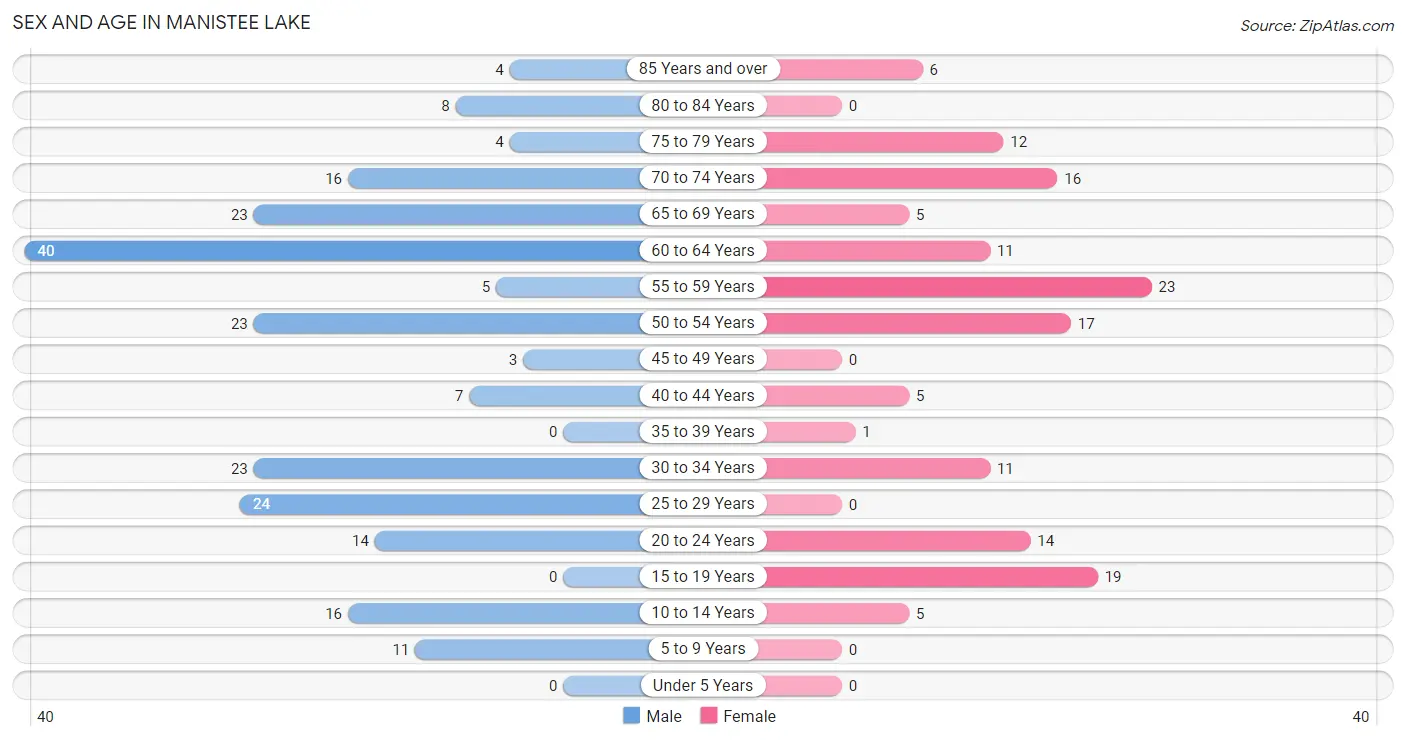
Sex and Age in Manistee Lake
Sex and Age in Manistee Lake
The most populous age groups in Manistee Lake are 60 to 64 Years (40 | 18.1%) for men and 55 to 59 Years (23 | 15.9%) for women.
| Age Bracket | Male | Female |
| Under 5 Years | 0 (0.0%) | 0 (0.0%) |
| 5 to 9 Years | 11 (5.0%) | 0 (0.0%) |
| 10 to 14 Years | 16 (7.2%) | 5 (3.5%) |
| 15 to 19 Years | 0 (0.0%) | 19 (13.1%) |
| 20 to 24 Years | 14 (6.3%) | 14 (9.7%) |
| 25 to 29 Years | 24 (10.9%) | 0 (0.0%) |
| 30 to 34 Years | 23 (10.4%) | 11 (7.6%) |
| 35 to 39 Years | 0 (0.0%) | 1 (0.7%) |
| 40 to 44 Years | 7 (3.2%) | 5 (3.5%) |
| 45 to 49 Years | 3 (1.4%) | 0 (0.0%) |
| 50 to 54 Years | 23 (10.4%) | 17 (11.7%) |
| 55 to 59 Years | 5 (2.3%) | 23 (15.9%) |
| 60 to 64 Years | 40 (18.1%) | 11 (7.6%) |
| 65 to 69 Years | 23 (10.4%) | 5 (3.5%) |
| 70 to 74 Years | 16 (7.2%) | 16 (11.0%) |
| 75 to 79 Years | 4 (1.8%) | 12 (8.3%) |
| 80 to 84 Years | 8 (3.6%) | 0 (0.0%) |
| 85 Years and over | 4 (1.8%) | 6 (4.1%) |
| Total | 221 (100.0%) | 145 (100.0%) |
Families and Households in Manistee Lake
Median Family Size in Manistee Lake
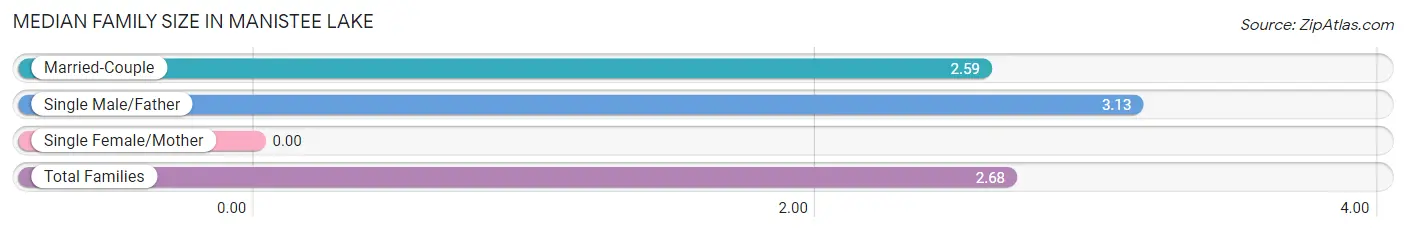
| Family Type | # Families | Family Size |
| Married-Couple | 83 (83.8%) | 2.59 |
| Single Male/Father | 16 (16.2%) | 3.13 |
| Single Female/Mother | 0 (0.0%) | - |
| Total Families | 99 (100.0%) | 2.68 |
Median Household Size in Manistee Lake
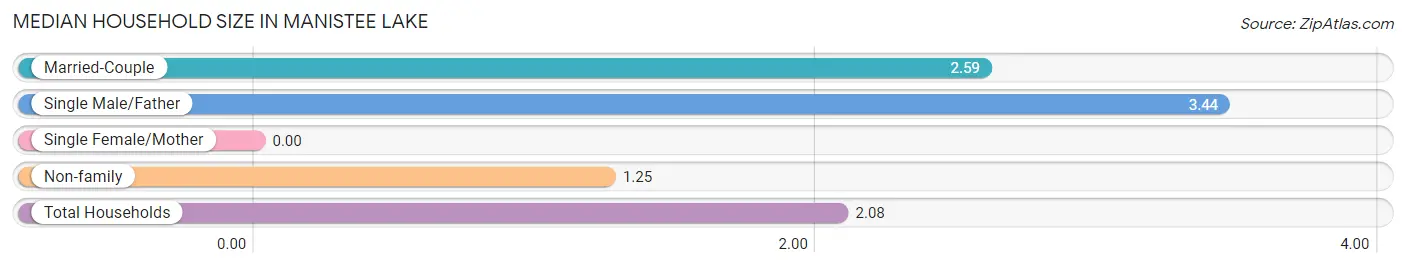
| Household Type | # Households | Household Size |
| Married-Couple | 83 (47.2%) | 2.59 |
| Single Male/Father | 16 (9.1%) | 3.44 |
| Single Female/Mother | 0 (0.0%) | - |
| Non-family | 77 (43.8%) | 1.25 |
| Total Households | 176 (100.0%) | 2.08 |
Household Size by Marriage Status in Manistee Lake
Out of a total of 176 households in Manistee Lake, 99 (56.2%) are family households, while 77 (43.8%) are nonfamily households. The most numerous type of family households are 2-person households, comprising 66, and the most common type of nonfamily households are 1-person households, comprising 57.
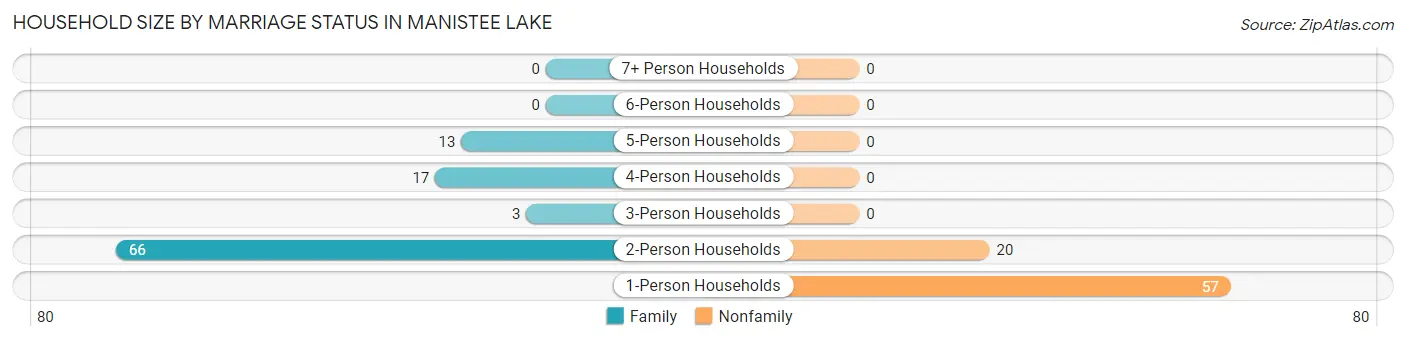
| Household Size | Family Households | Nonfamily Households |
| 1-Person Households | - | 57 (32.4%) |
| 2-Person Households | 66 (37.5%) | 20 (11.4%) |
| 3-Person Households | 3 (1.7%) | 0 (0.0%) |
| 4-Person Households | 17 (9.7%) | 0 (0.0%) |
| 5-Person Households | 13 (7.4%) | 0 (0.0%) |
| 6-Person Households | 0 (0.0%) | 0 (0.0%) |
| 7+ Person Households | 0 (0.0%) | 0 (0.0%) |
| Total | 99 (56.2%) | 77 (43.8%) |
Female Fertility in Manistee Lake
Fertility by Age in Manistee Lake
Average fertility rate in Manistee Lake is 56.0 births per 1,000 women. Women in the age bracket of 20 to 34 years have the highest fertility rate with 120.0 births per 1,000 women. Women in the age bracket of 20 to 34 years acount for 100.0% of all women with births.
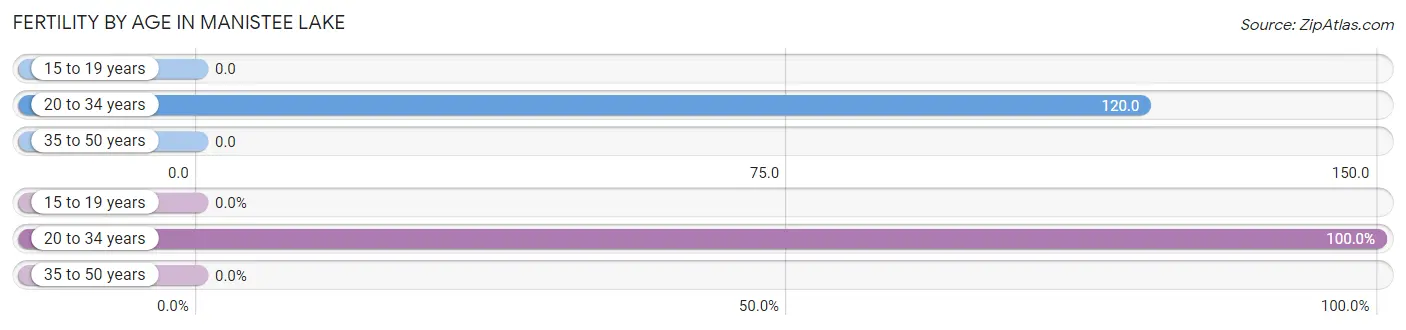
| Age Bracket | Women with Births | Births / 1,000 Women |
| 15 to 19 years | 0 (0.0%) | 0.0 |
| 20 to 34 years | 3 (100.0%) | 120.0 |
| 35 to 50 years | 0 (0.0%) | 0.0 |
| Total | 3 (100.0%) | 56.0 |
Fertility by Age by Marriage Status in Manistee Lake
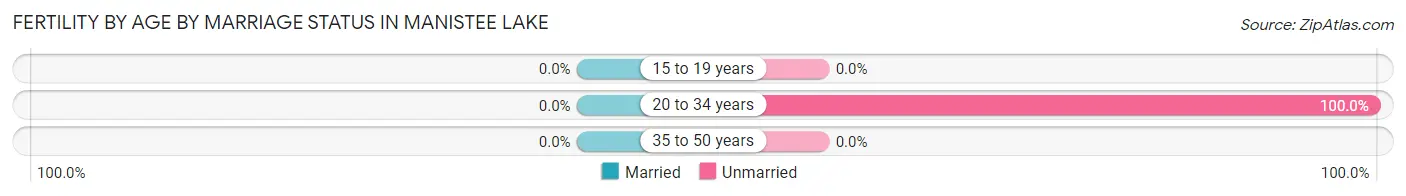
| Age Bracket | Married | Unmarried |
| 15 to 19 years | 0 (0.0%) | 0 (0.0%) |
| 20 to 34 years | 0 (0.0%) | 3 (100.0%) |
| 35 to 50 years | 0 (0.0%) | 0 (0.0%) |
| Total | 0 (0.0%) | 3 (100.0%) |
Fertility by Education in Manistee Lake
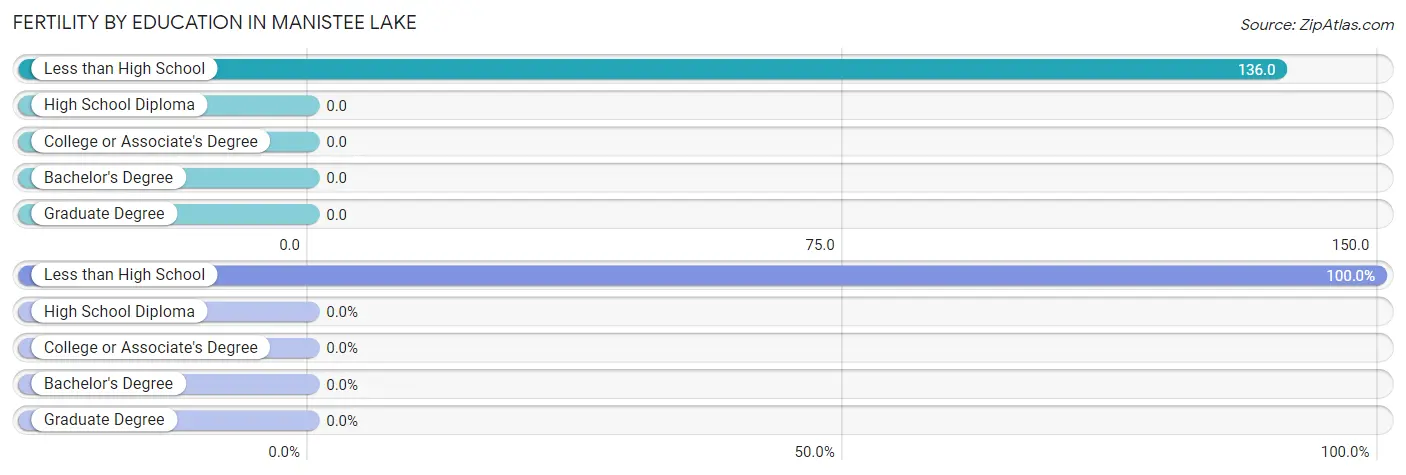
| Educational Attainment | Women with Births | Births / 1,000 Women |
| Less than High School | 3 (100.0%) | 136.0 |
| High School Diploma | 0 (0.0%) | 0.0 |
| College or Associate's Degree | 0 (0.0%) | 0.0 |
| Bachelor's Degree | 0 (0.0%) | 0.0 |
| Graduate Degree | 0 (0.0%) | 0.0 |
| Total | 3 (100.0%) | 56.0 |
Fertility by Education by Marriage Status in Manistee Lake
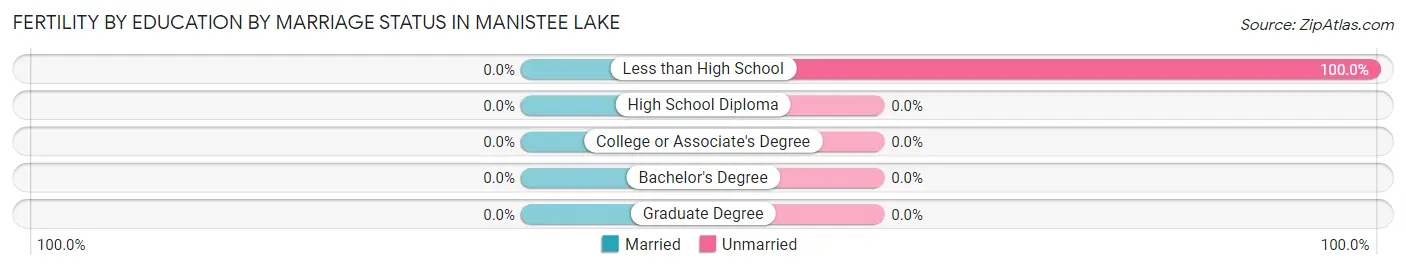
| Educational Attainment | Married | Unmarried |
| Less than High School | 0 (0.0%) | 3 (100.0%) |
| High School Diploma | 0 (0.0%) | 0 (0.0%) |
| College or Associate's Degree | 0 (0.0%) | 0 (0.0%) |
| Bachelor's Degree | 0 (0.0%) | 0 (0.0%) |
| Graduate Degree | 0 (0.0%) | 0 (0.0%) |
| Total | 0 (0.0%) | 3 (100.0%) |
Income in Manistee Lake
Income Overview in Manistee Lake
Per Capita Income in Manistee Lake is $30,517, while median incomes of families and households are $57,708 and $51,477 respectively.
| Characteristic | Number | Measure |
| Per Capita Income | 366 | $30,517 |
| Median Family Income | 99 | $57,708 |
| Mean Family Income | 99 | $78,851 |
| Median Household Income | 176 | $51,477 |
| Mean Household Income | 176 | $63,978 |
| Income Deficit | 99 | $0 |
| Wage / Income Gap (%) | 366 | 54.09% |
| Wage / Income Gap ($) | 366 | 45.91¢ per $1 |
| Gini / Inequality Index | 366 | 0.39 |
Earnings by Sex in Manistee Lake
Average Earnings in Manistee Lake are $28,698, $36,250 for men and $16,641 for women, a difference of 54.1%.
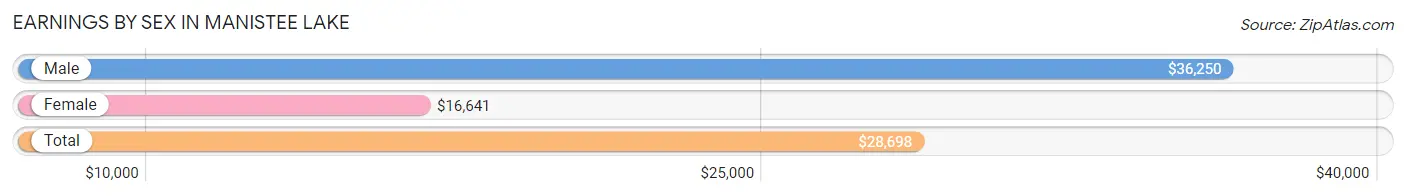
| Sex | Number | Average Earnings |
| Male | 94 (66.7%) | $36,250 |
| Female | 47 (33.3%) | $16,641 |
| Total | 141 (100.0%) | $28,698 |
Earnings by Sex by Income Bracket in Manistee Lake
The most common earnings brackets in Manistee Lake are $25,000 to $29,999 for men (18 | 19.2%) and $15,000 to $17,499 for women (16 | 34.0%).

| Income | Male | Female |
| $2,499 or less | 3 (3.2%) | 3 (6.4%) |
| $2,500 to $4,999 | 0 (0.0%) | 5 (10.6%) |
| $5,000 to $7,499 | 6 (6.4%) | 0 (0.0%) |
| $7,500 to $9,999 | 0 (0.0%) | 0 (0.0%) |
| $10,000 to $12,499 | 0 (0.0%) | 0 (0.0%) |
| $12,500 to $14,999 | 0 (0.0%) | 5 (10.6%) |
| $15,000 to $17,499 | 0 (0.0%) | 16 (34.0%) |
| $17,500 to $19,999 | 0 (0.0%) | 0 (0.0%) |
| $20,000 to $22,499 | 14 (14.9%) | 0 (0.0%) |
| $22,500 to $24,999 | 3 (3.2%) | 4 (8.5%) |
| $25,000 to $29,999 | 18 (19.2%) | 6 (12.8%) |
| $30,000 to $34,999 | 0 (0.0%) | 0 (0.0%) |
| $35,000 to $39,999 | 13 (13.8%) | 0 (0.0%) |
| $40,000 to $44,999 | 16 (17.0%) | 1 (2.1%) |
| $45,000 to $49,999 | 2 (2.1%) | 4 (8.5%) |
| $50,000 to $54,999 | 0 (0.0%) | 0 (0.0%) |
| $55,000 to $64,999 | 0 (0.0%) | 0 (0.0%) |
| $65,000 to $74,999 | 3 (3.2%) | 3 (6.4%) |
| $75,000 to $99,999 | 11 (11.7%) | 0 (0.0%) |
| $100,000+ | 5 (5.3%) | 0 (0.0%) |
| Total | 94 (100.0%) | 47 (100.0%) |
Earnings by Sex by Educational Attainment in Manistee Lake
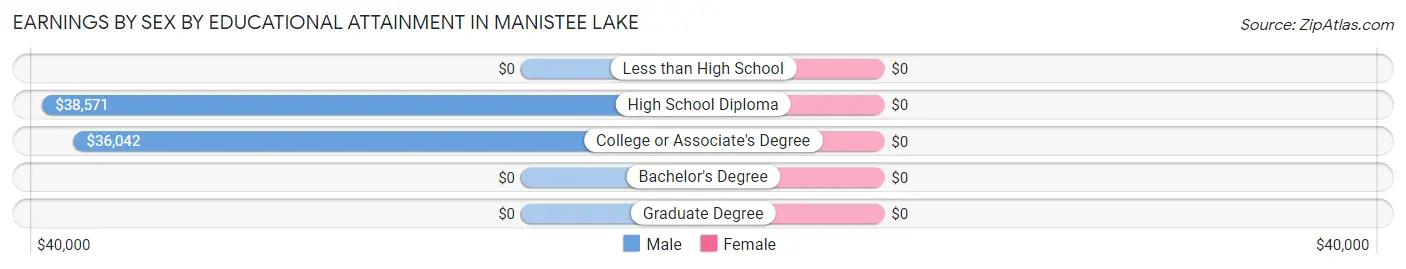
| Educational Attainment | Male Income | Female Income |
| Less than High School | - | - |
| High School Diploma | $38,571 | $0 |
| College or Associate's Degree | $36,042 | $0 |
| Bachelor's Degree | - | - |
| Graduate Degree | - | - |
| Total | $38,929 | $23,750 |
Family Income in Manistee Lake
Family Income Brackets in Manistee Lake
According to the Manistee Lake family income data, there are 35 families falling into the $50,000 to $74,999 income range, which is the most common income bracket and makes up 35.3% of all families.
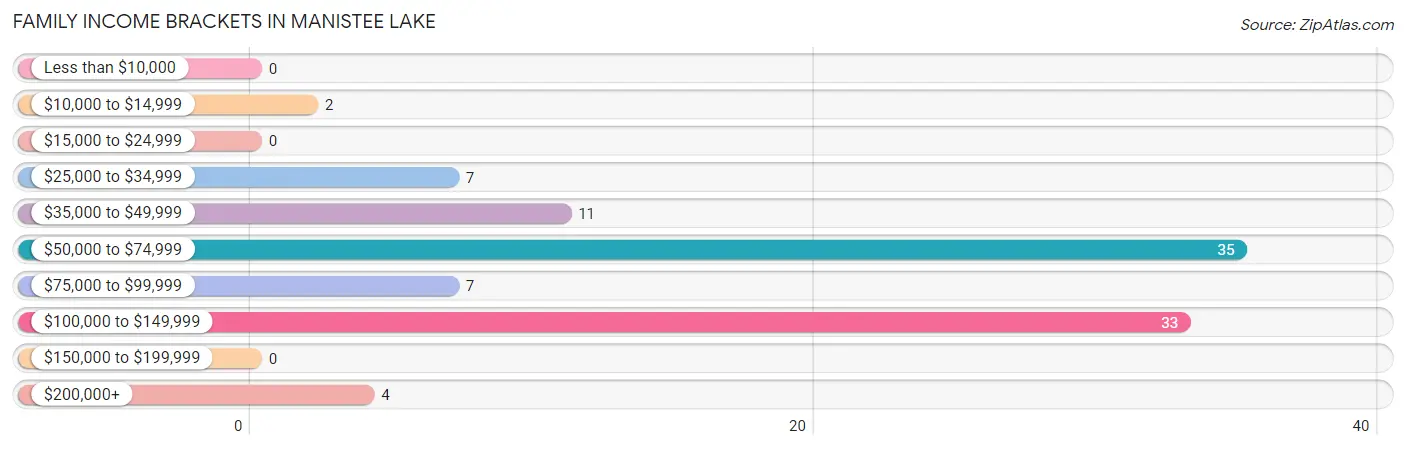
| Income Bracket | # Families | % Families |
| Less than $10,000 | 0 | 0.0% |
| $10,000 to $14,999 | 2 | 2.0% |
| $15,000 to $24,999 | 0 | 0.0% |
| $25,000 to $34,999 | 7 | 7.1% |
| $35,000 to $49,999 | 11 | 11.1% |
| $50,000 to $74,999 | 35 | 35.4% |
| $75,000 to $99,999 | 7 | 7.1% |
| $100,000 to $149,999 | 33 | 33.3% |
| $150,000 to $199,999 | 0 | 0.0% |
| $200,000+ | 4 | 4.0% |
Family Income by Famaliy Size in Manistee Lake
2-person families (66 | 66.7%) account for the highest median family income in Manistee Lake with $51,818 per family, while 2-person families (66 | 66.7%) have the highest median income of $25,909 per family member.
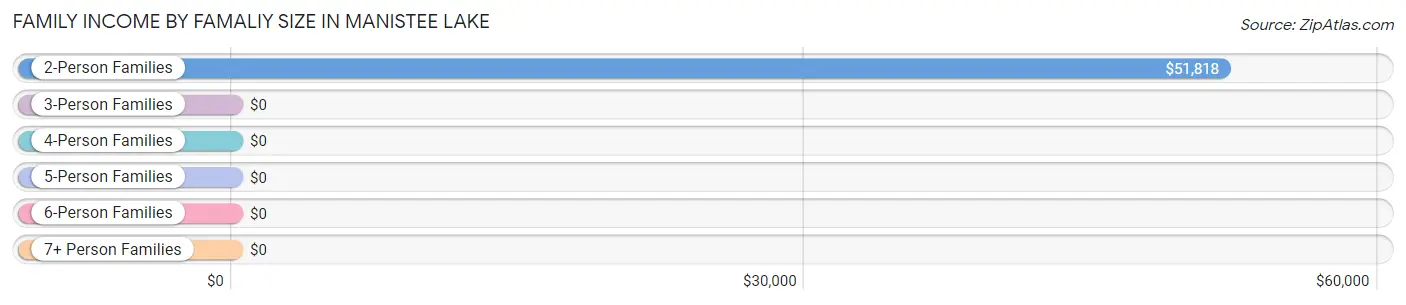
| Income Bracket | # Families | Median Income |
| 2-Person Families | 66 (66.7%) | $51,818 |
| 3-Person Families | 14 (14.1%) | $0 |
| 4-Person Families | 6 (6.1%) | $0 |
| 5-Person Families | 13 (13.1%) | $0 |
| 6-Person Families | 0 (0.0%) | $0 |
| 7+ Person Families | 0 (0.0%) | $0 |
| Total | 99 (100.0%) | $57,708 |
Family Income by Number of Earners in Manistee Lake
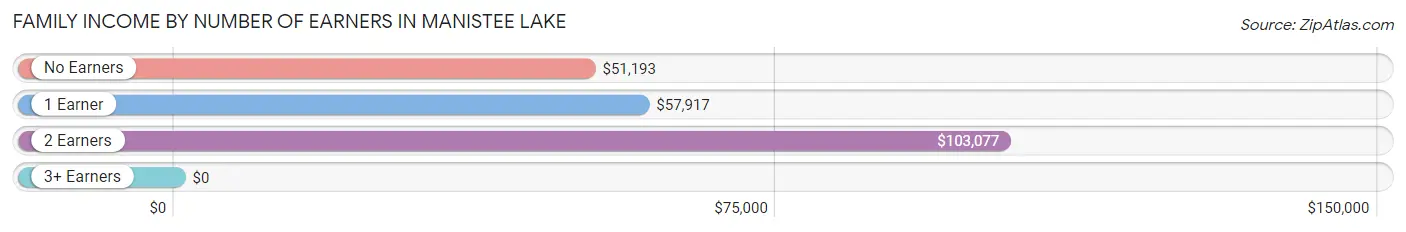
| Number of Earners | # Families | Median Income |
| No Earners | 51 (51.5%) | $51,193 |
| 1 Earner | 11 (11.1%) | $57,917 |
| 2 Earners | 26 (26.3%) | $103,077 |
| 3+ Earners | 11 (11.1%) | $0 |
| Total | 99 (100.0%) | $57,708 |
Household Income in Manistee Lake
Household Income Brackets in Manistee Lake
With 48 households falling in the category, the $50,000 to $74,999 income range is the most frequent in Manistee Lake, accounting for 27.3% of all households. In contrast, only 4 households (2.3%) fall into the $200,000+ income bracket, making it the least populous group.
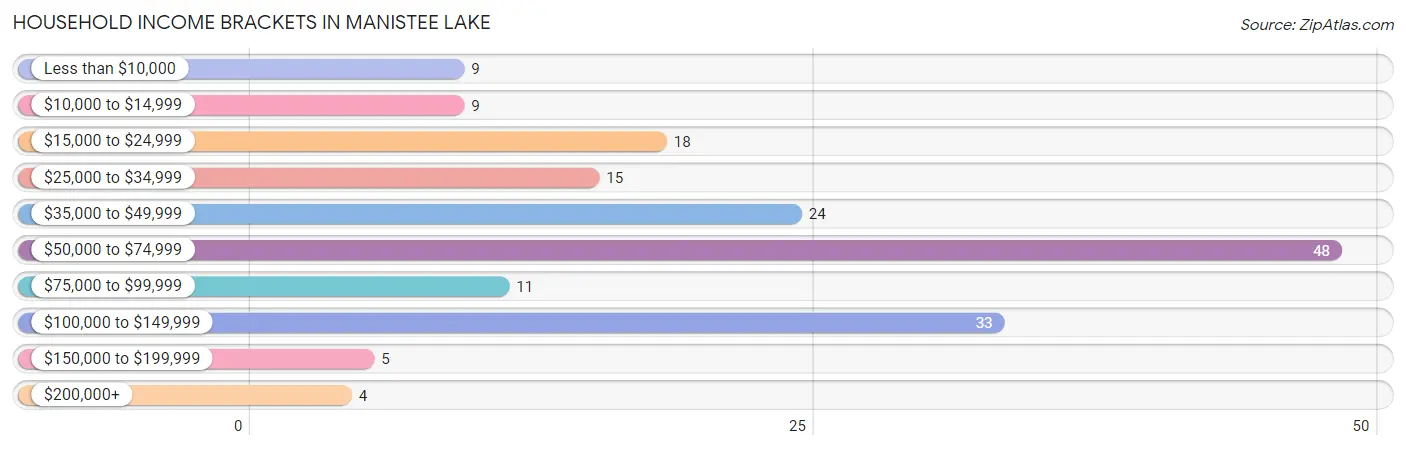
| Income Bracket | # Households | % Households |
| Less than $10,000 | 9 | 5.1% |
| $10,000 to $14,999 | 9 | 5.1% |
| $15,000 to $24,999 | 18 | 10.2% |
| $25,000 to $34,999 | 15 | 8.5% |
| $35,000 to $49,999 | 24 | 13.6% |
| $50,000 to $74,999 | 48 | 27.3% |
| $75,000 to $99,999 | 11 | 6.3% |
| $100,000 to $149,999 | 33 | 18.8% |
| $150,000 to $199,999 | 5 | 2.8% |
| $200,000+ | 4 | 2.3% |
Household Income by Householder Age in Manistee Lake
The median household income in Manistee Lake is $51,477, with the highest median household income of $103,654 found in the 25 to 44 years age bracket for the primary householder. A total of 30 households (17.1%) fall into this category. Meanwhile, the 15 to 24 years age bracket for the primary householder has the lowest median household income of $0, with 11 households (6.2%) in this group.
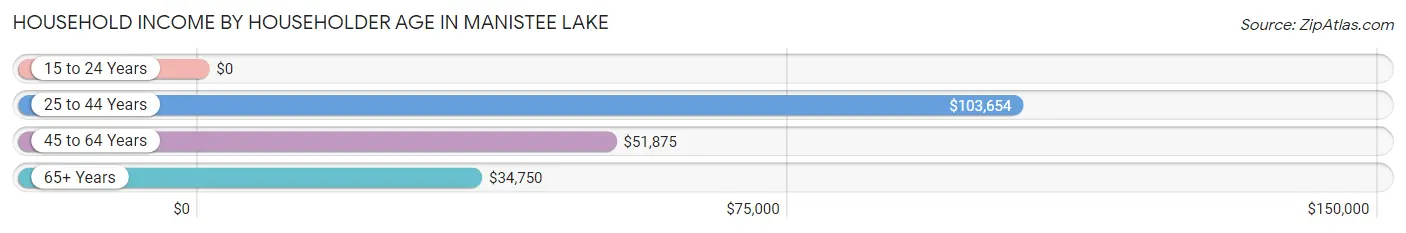
| Income Bracket | # Households | Median Income |
| 15 to 24 Years | 11 (6.2%) | $0 |
| 25 to 44 Years | 30 (17.1%) | $103,654 |
| 45 to 64 Years | 72 (40.9%) | $51,875 |
| 65+ Years | 63 (35.8%) | $34,750 |
| Total | 176 (100.0%) | $51,477 |
Poverty in Manistee Lake
Income Below Poverty by Sex and Age in Manistee Lake
With 8.6% poverty level for males and 14.5% for females among the residents of Manistee Lake, 65 to 74 year old males and 35 to 44 year old females are the most vulnerable to poverty, with 10 males (25.6%) and 5 females (83.3%) in their respective age groups living below the poverty level.
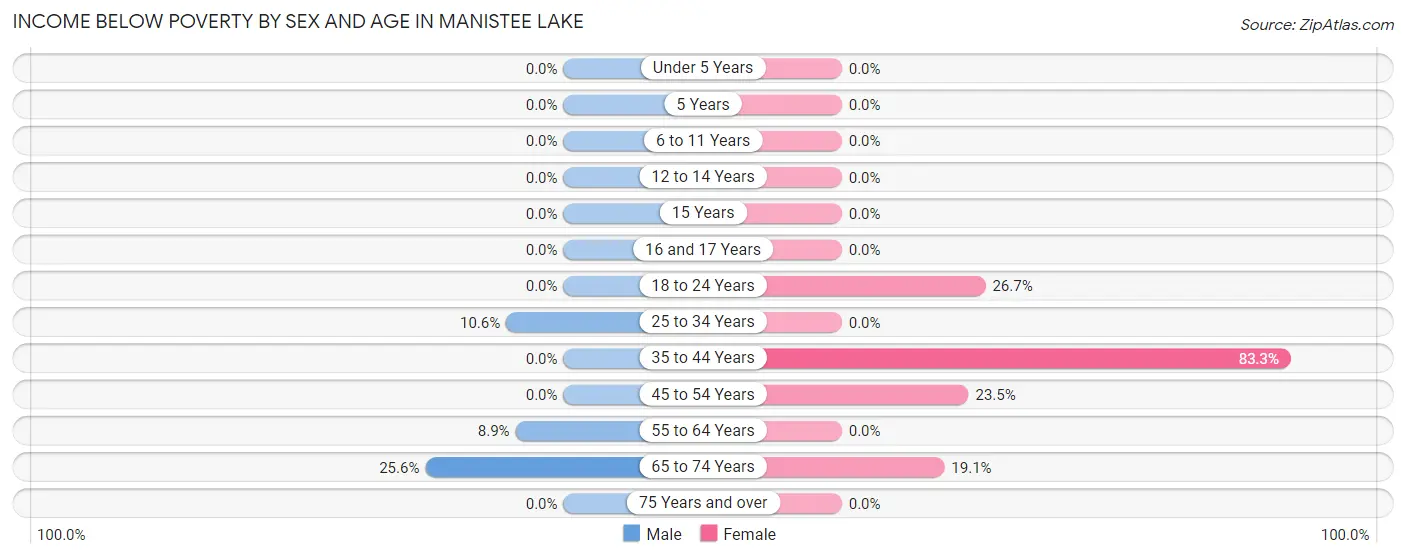
| Age Bracket | Male | Female |
| Under 5 Years | 0 (0.0%) | 0 (0.0%) |
| 5 Years | 0 (0.0%) | 0 (0.0%) |
| 6 to 11 Years | 0 (0.0%) | 0 (0.0%) |
| 12 to 14 Years | 0 (0.0%) | 0 (0.0%) |
| 15 Years | 0 (0.0%) | 0 (0.0%) |
| 16 and 17 Years | 0 (0.0%) | 0 (0.0%) |
| 18 to 24 Years | 0 (0.0%) | 8 (26.7%) |
| 25 to 34 Years | 5 (10.6%) | 0 (0.0%) |
| 35 to 44 Years | 0 (0.0%) | 5 (83.3%) |
| 45 to 54 Years | 0 (0.0%) | 4 (23.5%) |
| 55 to 64 Years | 4 (8.9%) | 0 (0.0%) |
| 65 to 74 Years | 10 (25.6%) | 4 (19.1%) |
| 75 Years and over | 0 (0.0%) | 0 (0.0%) |
| Total | 19 (8.6%) | 21 (14.5%) |
Income Above Poverty by Sex and Age in Manistee Lake
According to the poverty statistics in Manistee Lake, males aged 6 to 11 years and females aged 12 to 14 years are the age groups that are most secure financially, with 100.0% of males and 100.0% of females in these age groups living above the poverty line.
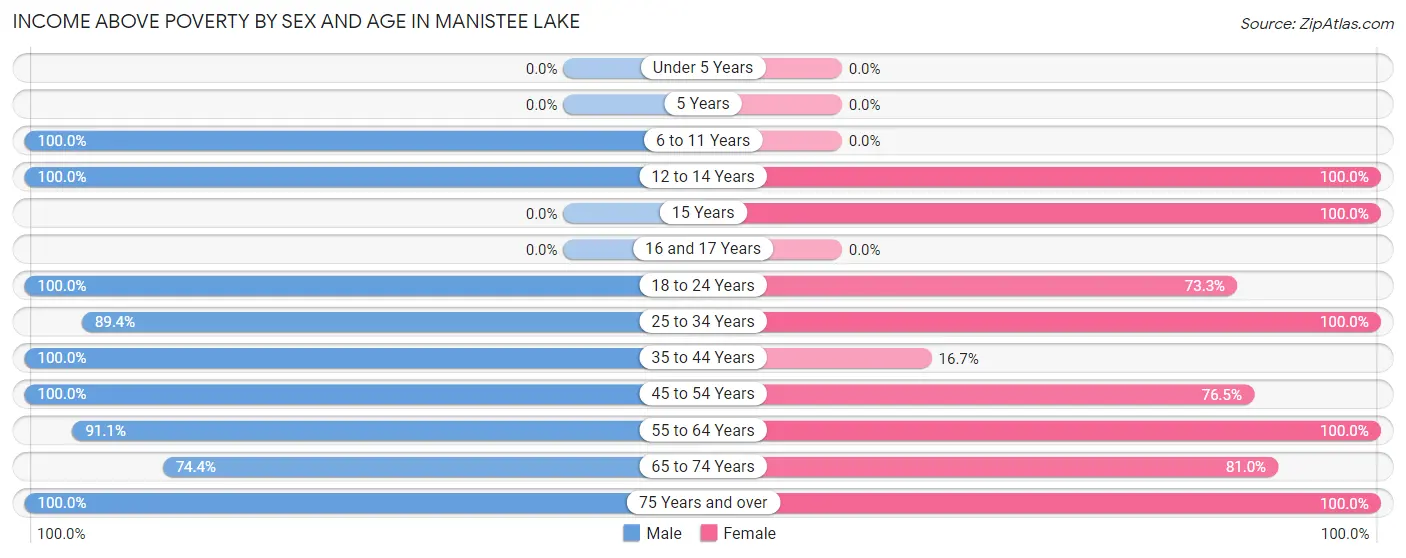
| Age Bracket | Male | Female |
| Under 5 Years | 0 (0.0%) | 0 (0.0%) |
| 5 Years | 0 (0.0%) | 0 (0.0%) |
| 6 to 11 Years | 11 (100.0%) | 0 (0.0%) |
| 12 to 14 Years | 16 (100.0%) | 5 (100.0%) |
| 15 Years | 0 (0.0%) | 3 (100.0%) |
| 16 and 17 Years | 0 (0.0%) | 0 (0.0%) |
| 18 to 24 Years | 14 (100.0%) | 22 (73.3%) |
| 25 to 34 Years | 42 (89.4%) | 11 (100.0%) |
| 35 to 44 Years | 7 (100.0%) | 1 (16.7%) |
| 45 to 54 Years | 26 (100.0%) | 13 (76.5%) |
| 55 to 64 Years | 41 (91.1%) | 34 (100.0%) |
| 65 to 74 Years | 29 (74.4%) | 17 (80.9%) |
| 75 Years and over | 16 (100.0%) | 18 (100.0%) |
| Total | 202 (91.4%) | 124 (85.5%) |
Income Below Poverty Among Married-Couple Families in Manistee Lake
The poverty statistics for married-couple families in Manistee Lake show that 2.4% or 2 of the total 83 families live below the poverty line. Families with no children have the highest poverty rate of 3.1%, comprising of 2 families. On the other hand, families with 1 or 2 children have the lowest poverty rate of 0.0%, which includes 0 families.
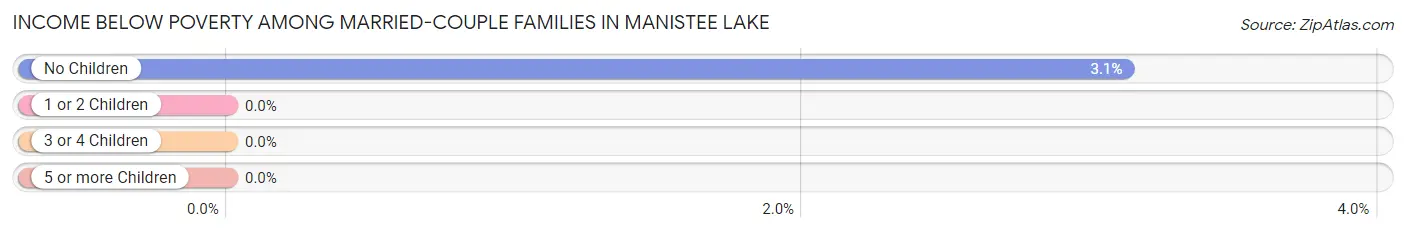
| Children | Above Poverty | Below Poverty |
| No Children | 62 (96.9%) | 2 (3.1%) |
| 1 or 2 Children | 19 (100.0%) | 0 (0.0%) |
| 3 or 4 Children | 0 (0.0%) | 0 (0.0%) |
| 5 or more Children | 0 (0.0%) | 0 (0.0%) |
| Total | 81 (97.6%) | 2 (2.4%) |
Income Below Poverty Among Single-Parent Households in Manistee Lake
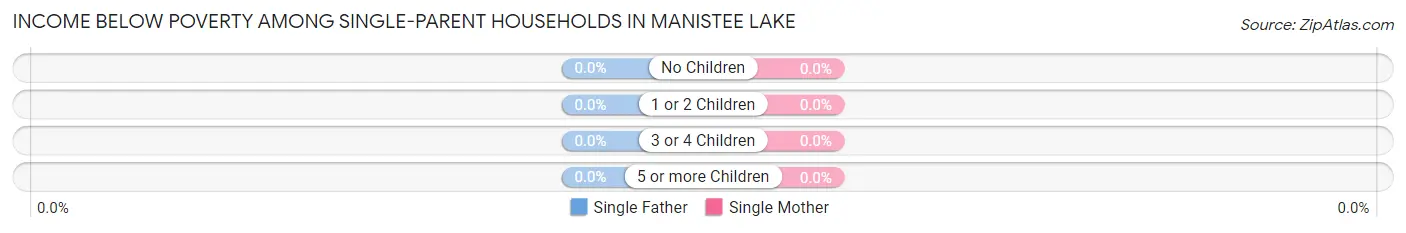
| Children | Single Father | Single Mother |
| No Children | 0 (0.0%) | 0 (0.0%) |
| 1 or 2 Children | 0 (0.0%) | 0 (0.0%) |
| 3 or 4 Children | 0 (0.0%) | 0 (0.0%) |
| 5 or more Children | 0 (0.0%) | 0 (0.0%) |
| Total | 0 (0.0%) | 0 (0.0%) |
Income Below Poverty Among Married-Couple vs Single-Parent Households in Manistee Lake
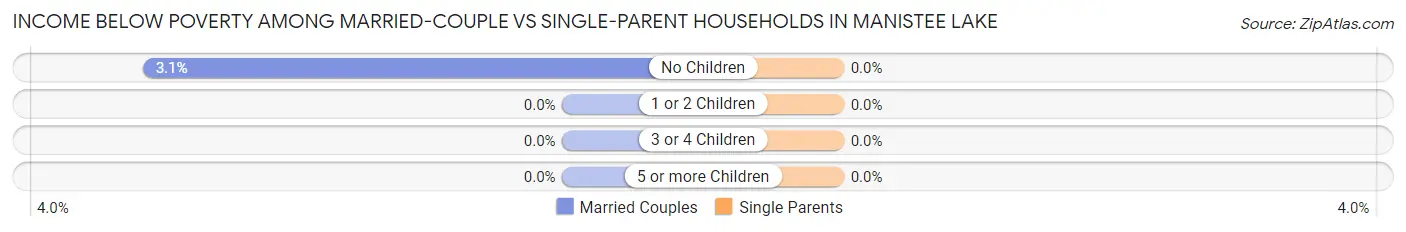
| Children | Married-Couple Families | Single-Parent Households |
| No Children | 2 (3.1%) | 0 (0.0%) |
| 1 or 2 Children | 0 (0.0%) | 0 (0.0%) |
| 3 or 4 Children | 0 (0.0%) | 0 (0.0%) |
| 5 or more Children | 0 (0.0%) | 0 (0.0%) |
| Total | 2 (2.4%) | 0 (0.0%) |
Employment Characteristics in Manistee Lake
Employment by Class of Employer in Manistee Lake
Among the 128 employed individuals in Manistee Lake, private company employees (112 | 87.5%), not-for-profit organizations (7 | 5.5%), and self-employed (incorporated) (5 | 3.9%) make up the most common classes of employment.
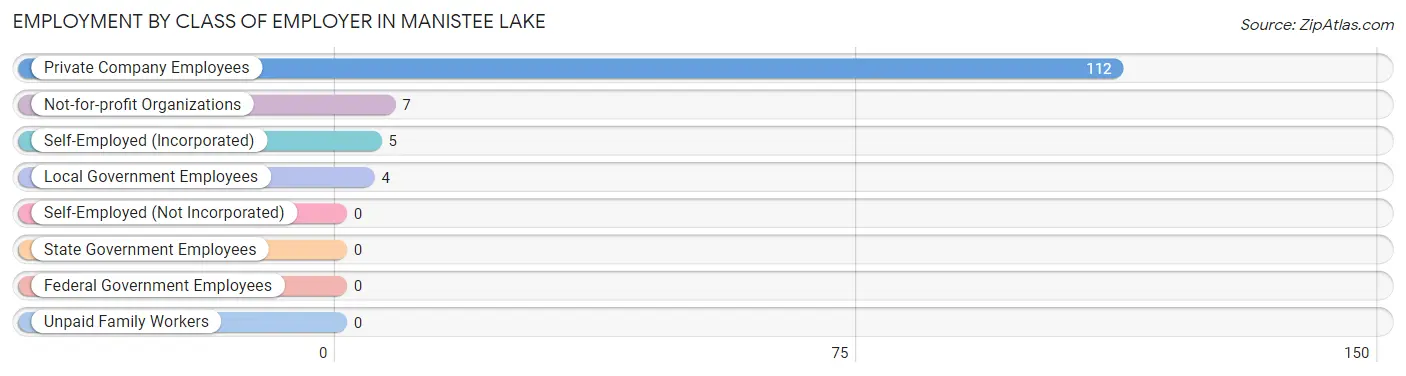
| Employer Class | # Employees | % Employees |
| Private Company Employees | 112 | 87.5% |
| Self-Employed (Incorporated) | 5 | 3.9% |
| Self-Employed (Not Incorporated) | 0 | 0.0% |
| Not-for-profit Organizations | 7 | 5.5% |
| Local Government Employees | 4 | 3.1% |
| State Government Employees | 0 | 0.0% |
| Federal Government Employees | 0 | 0.0% |
| Unpaid Family Workers | 0 | 0.0% |
| Total | 128 | 100.0% |
Employment Status by Age in Manistee Lake
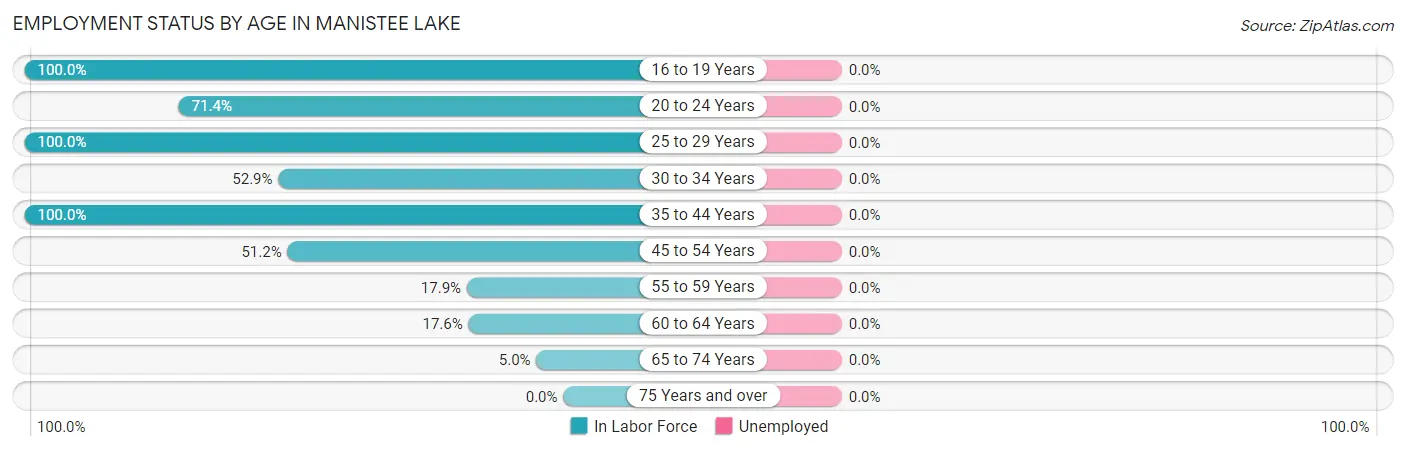
| Age Bracket | In Labor Force | Unemployed |
| 16 to 19 Years | 16 (100.0%) | 0 (0.0%) |
| 20 to 24 Years | 20 (71.4%) | 0 (0.0%) |
| 25 to 29 Years | 24 (100.0%) | 0 (0.0%) |
| 30 to 34 Years | 18 (52.9%) | 0 (0.0%) |
| 35 to 44 Years | 13 (100.0%) | 0 (0.0%) |
| 45 to 54 Years | 22 (51.2%) | 0 (0.0%) |
| 55 to 59 Years | 5 (17.9%) | 0 (0.0%) |
| 60 to 64 Years | 9 (17.6%) | 0 (0.0%) |
| 65 to 74 Years | 3 (5.0%) | 0 (0.0%) |
| 75 Years and over | 0 (0.0%) | 0 (0.0%) |
| Total | 130 (39.3%) | 0 (0.0%) |
Employment Status by Educational Attainment in Manistee Lake
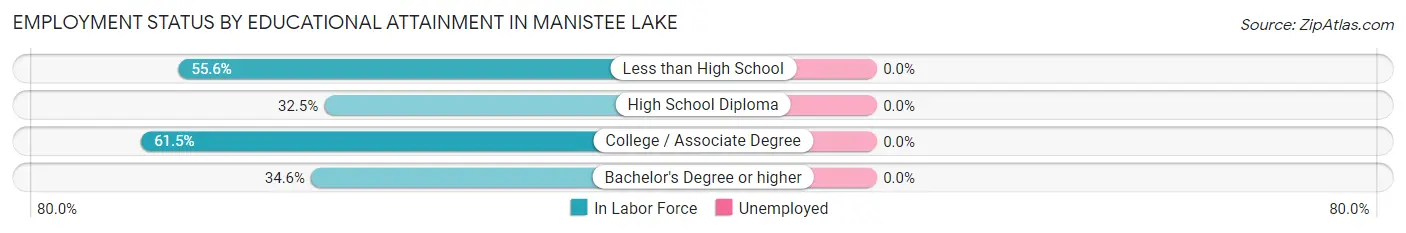
| Educational Attainment | In Labor Force | Unemployed |
| Less than High School | 20 (55.6%) | 0 (0.0%) |
| High School Diploma | 13 (32.5%) | 0 (0.0%) |
| College / Associate Degree | 40 (61.5%) | 0 (0.0%) |
| Bachelor's Degree or higher | 18 (34.6%) | 0 (0.0%) |
| Total | 91 (47.2%) | 0 (0.0%) |
Employment Occupations by Sex in Manistee Lake
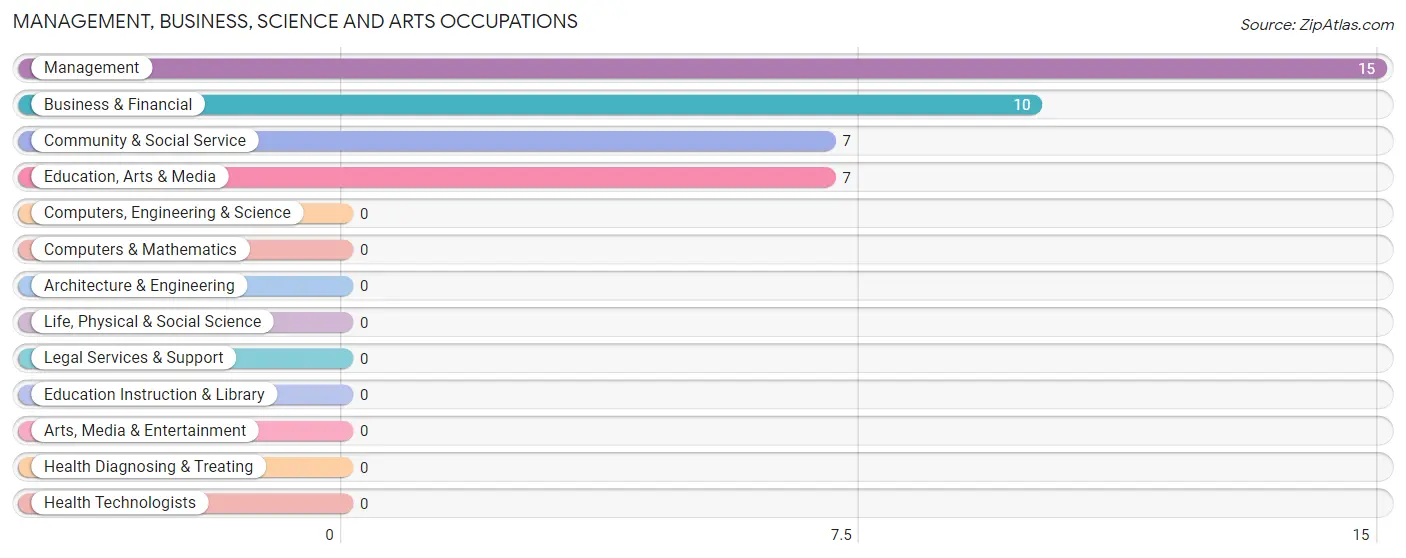
Management, Business, Science and Arts Occupations
The most common Management, Business, Science and Arts occupations in Manistee Lake are Management (15 | 11.5%), Business & Financial (10 | 7.7%), Community & Social Service (7 | 5.4%), and Education, Arts & Media (7 | 5.4%).
Management, Business, Science and Arts Occupations by Sex
Within the Management, Business, Science and Arts occupations in Manistee Lake, the most male-oriented occupations are Management (73.3%), Business & Financial (60.0%), and Community & Social Service (42.9%), while the most female-oriented occupations are Community & Social Service (57.1%), Education, Arts & Media (57.1%), and Business & Financial (40.0%).
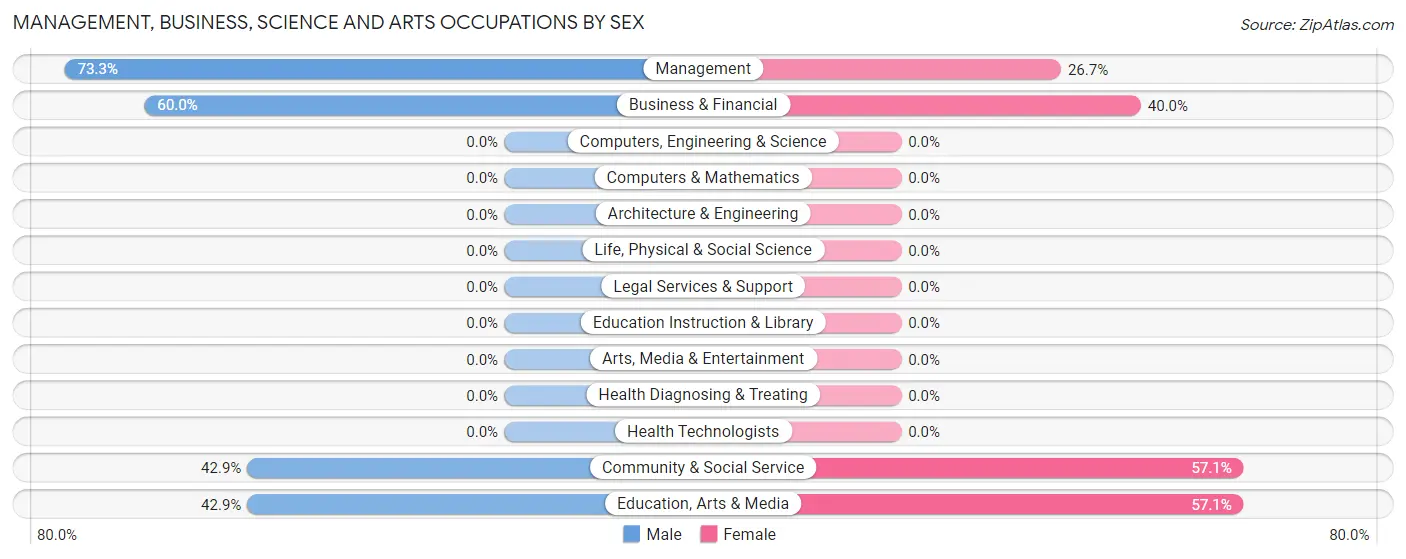
| Occupation | Male | Female |
| Management | 11 (73.3%) | 4 (26.7%) |
| Business & Financial | 6 (60.0%) | 4 (40.0%) |
| Computers, Engineering & Science | 0 (0.0%) | 0 (0.0%) |
| Computers & Mathematics | 0 (0.0%) | 0 (0.0%) |
| Architecture & Engineering | 0 (0.0%) | 0 (0.0%) |
| Life, Physical & Social Science | 0 (0.0%) | 0 (0.0%) |
| Community & Social Service | 3 (42.9%) | 4 (57.1%) |
| Education, Arts & Media | 3 (42.9%) | 4 (57.1%) |
| Legal Services & Support | 0 (0.0%) | 0 (0.0%) |
| Education Instruction & Library | 0 (0.0%) | 0 (0.0%) |
| Arts, Media & Entertainment | 0 (0.0%) | 0 (0.0%) |
| Health Diagnosing & Treating | 0 (0.0%) | 0 (0.0%) |
| Health Technologists | 0 (0.0%) | 0 (0.0%) |
| Total (Category) | 20 (62.5%) | 12 (37.5%) |
| Total (Overall) | 91 (70.0%) | 39 (30.0%) |
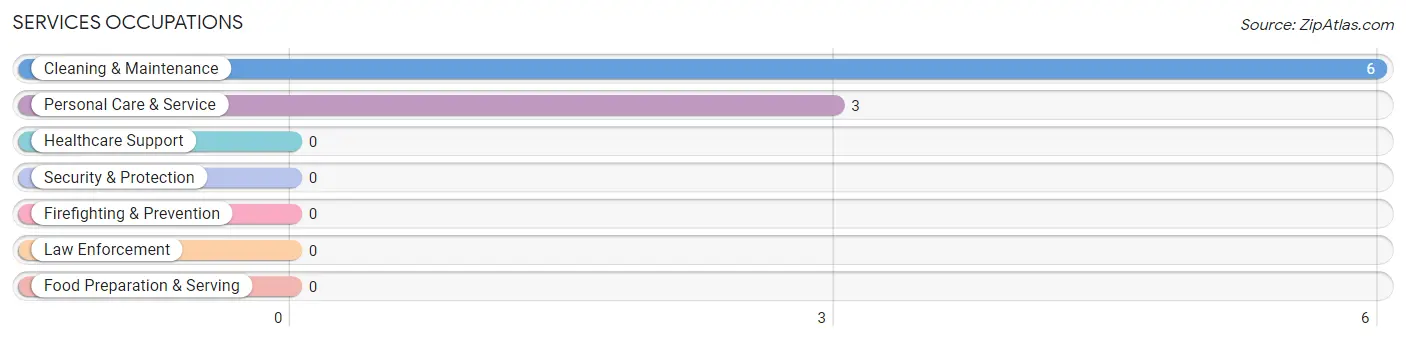
Services Occupations
The most common Services occupations in Manistee Lake are Cleaning & Maintenance (6 | 4.6%), and Personal Care & Service (3 | 2.3%).
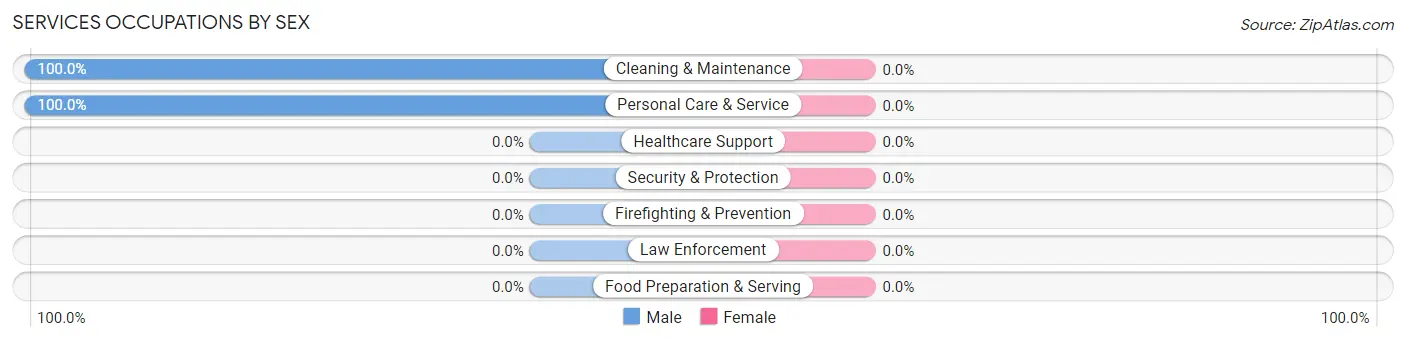
Services Occupations by Sex
| Occupation | Male | Female |
| Healthcare Support | 0 (0.0%) | 0 (0.0%) |
| Security & Protection | 0 (0.0%) | 0 (0.0%) |
| Firefighting & Prevention | 0 (0.0%) | 0 (0.0%) |
| Law Enforcement | 0 (0.0%) | 0 (0.0%) |
| Food Preparation & Serving | 0 (0.0%) | 0 (0.0%) |
| Cleaning & Maintenance | 6 (100.0%) | 0 (0.0%) |
| Personal Care & Service | 3 (100.0%) | 0 (0.0%) |
| Total (Category) | 9 (100.0%) | 0 (0.0%) |
| Total (Overall) | 91 (70.0%) | 39 (30.0%) |
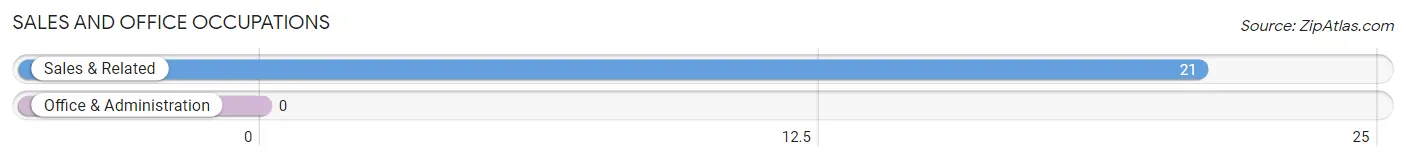
Sales and Office Occupations
The most common Sales and Office occupations in Manistee Lake are , and Sales & Related (21 | 16.2%).
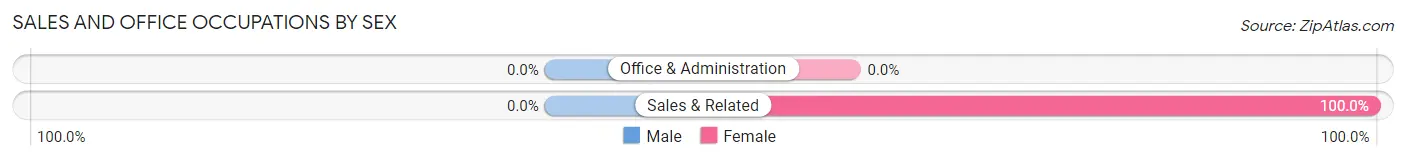
Sales and Office Occupations by Sex
| Occupation | Male | Female |
| Sales & Related | 0 (0.0%) | 21 (100.0%) |
| Office & Administration | 0 (0.0%) | 0 (0.0%) |
| Total (Category) | 0 (0.0%) | 21 (100.0%) |
| Total (Overall) | 91 (70.0%) | 39 (30.0%) |
Natural Resources, Construction and Maintenance Occupations
The most common Natural Resources, Construction and Maintenance occupations in Manistee Lake are Construction & Extraction (27 | 20.8%), and Installation, Maintenance & Repair (17 | 13.1%).
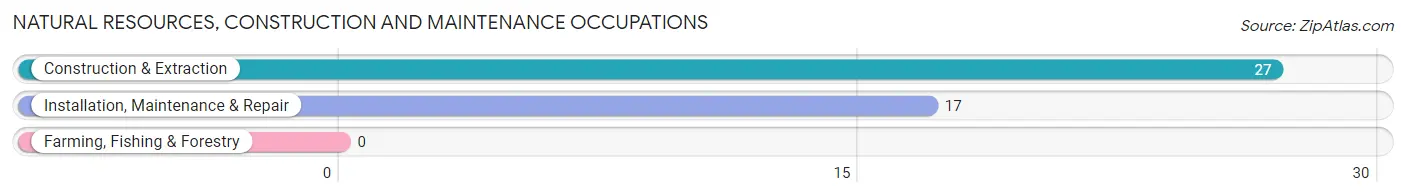
Natural Resources, Construction and Maintenance Occupations by Sex
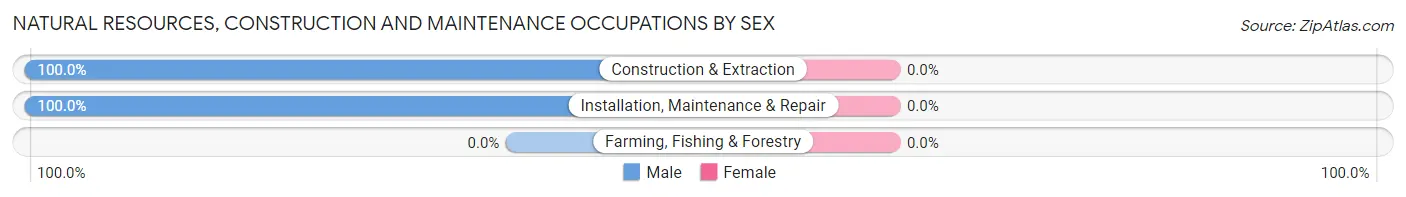
| Occupation | Male | Female |
| Farming, Fishing & Forestry | 0 (0.0%) | 0 (0.0%) |
| Construction & Extraction | 27 (100.0%) | 0 (0.0%) |
| Installation, Maintenance & Repair | 17 (100.0%) | 0 (0.0%) |
| Total (Category) | 44 (100.0%) | 0 (0.0%) |
| Total (Overall) | 91 (70.0%) | 39 (30.0%) |
Production, Transportation and Moving Occupations
The most common Production, Transportation and Moving occupations in Manistee Lake are Production (21 | 16.2%), and Transportation (3 | 2.3%).
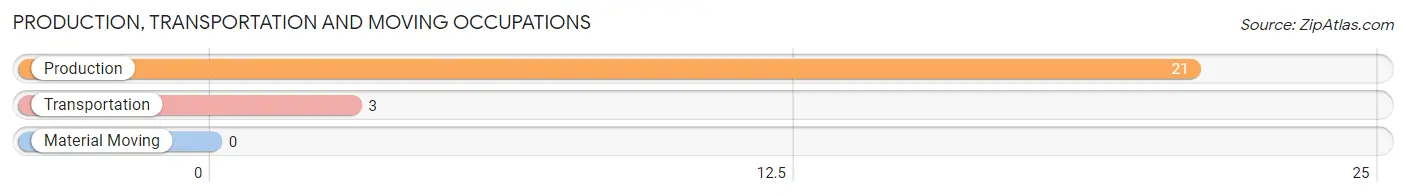
Production, Transportation and Moving Occupations by Sex
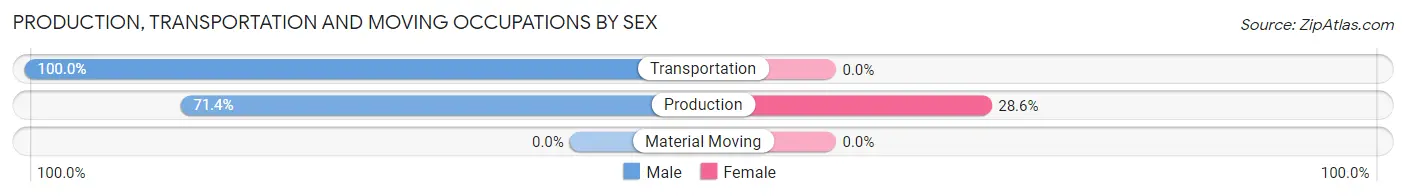
| Occupation | Male | Female |
| Production | 15 (71.4%) | 6 (28.6%) |
| Transportation | 3 (100.0%) | 0 (0.0%) |
| Material Moving | 0 (0.0%) | 0 (0.0%) |
| Total (Category) | 18 (75.0%) | 6 (25.0%) |
| Total (Overall) | 91 (70.0%) | 39 (30.0%) |
Employment Industries by Sex in Manistee Lake
Employment Industries in Manistee Lake
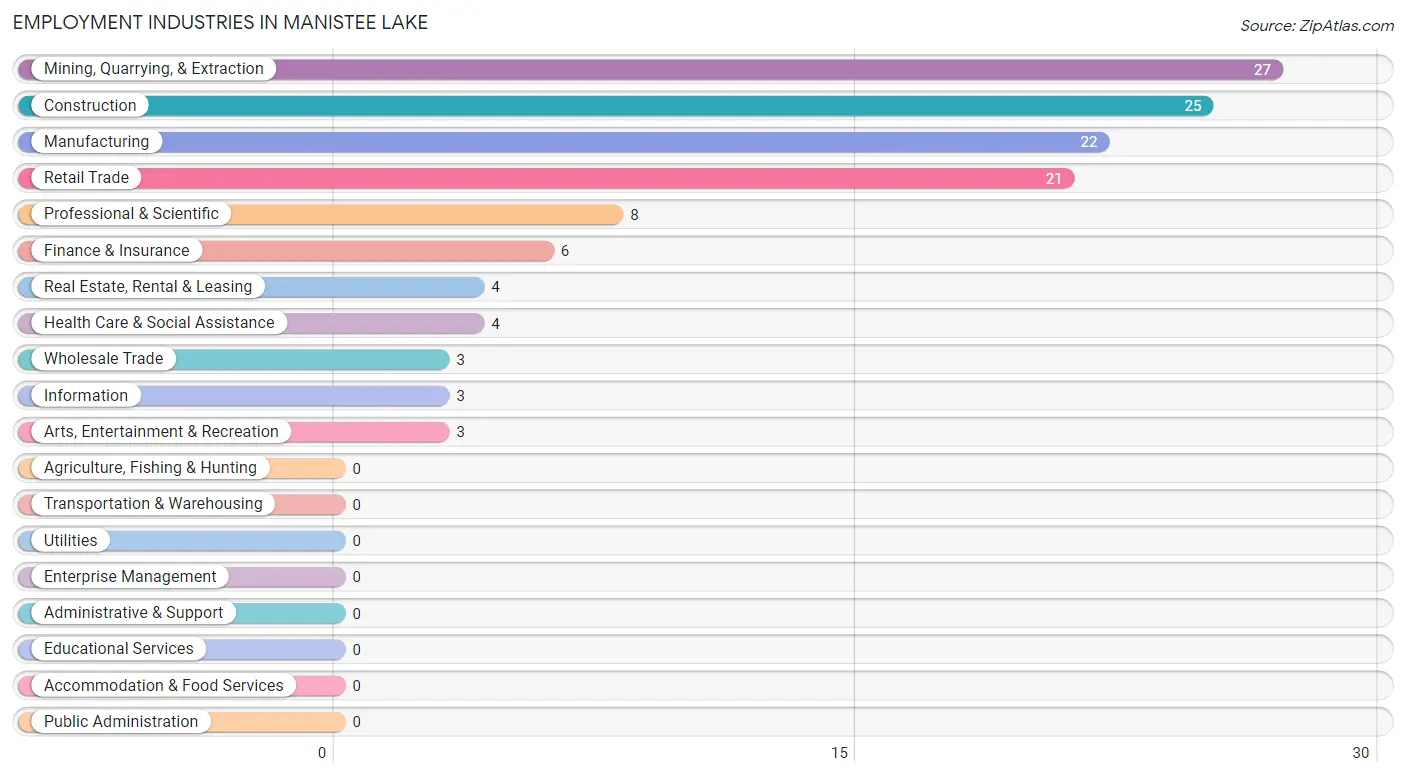
The major employment industries in Manistee Lake include Mining, Quarrying, & Extraction (27 | 20.8%), Construction (25 | 19.2%), Manufacturing (22 | 16.9%), Retail Trade (21 | 16.2%), and Professional & Scientific (8 | 6.1%).
Employment Industries by Sex in Manistee Lake
The Manistee Lake industries that see more men than women are Mining, Quarrying, & Extraction (100.0%), Construction (100.0%), and Wholesale Trade (100.0%), whereas the industries that tend to have a higher number of women are Retail Trade (100.0%), Real Estate, Rental & Leasing (100.0%), and Health Care & Social Assistance (100.0%).
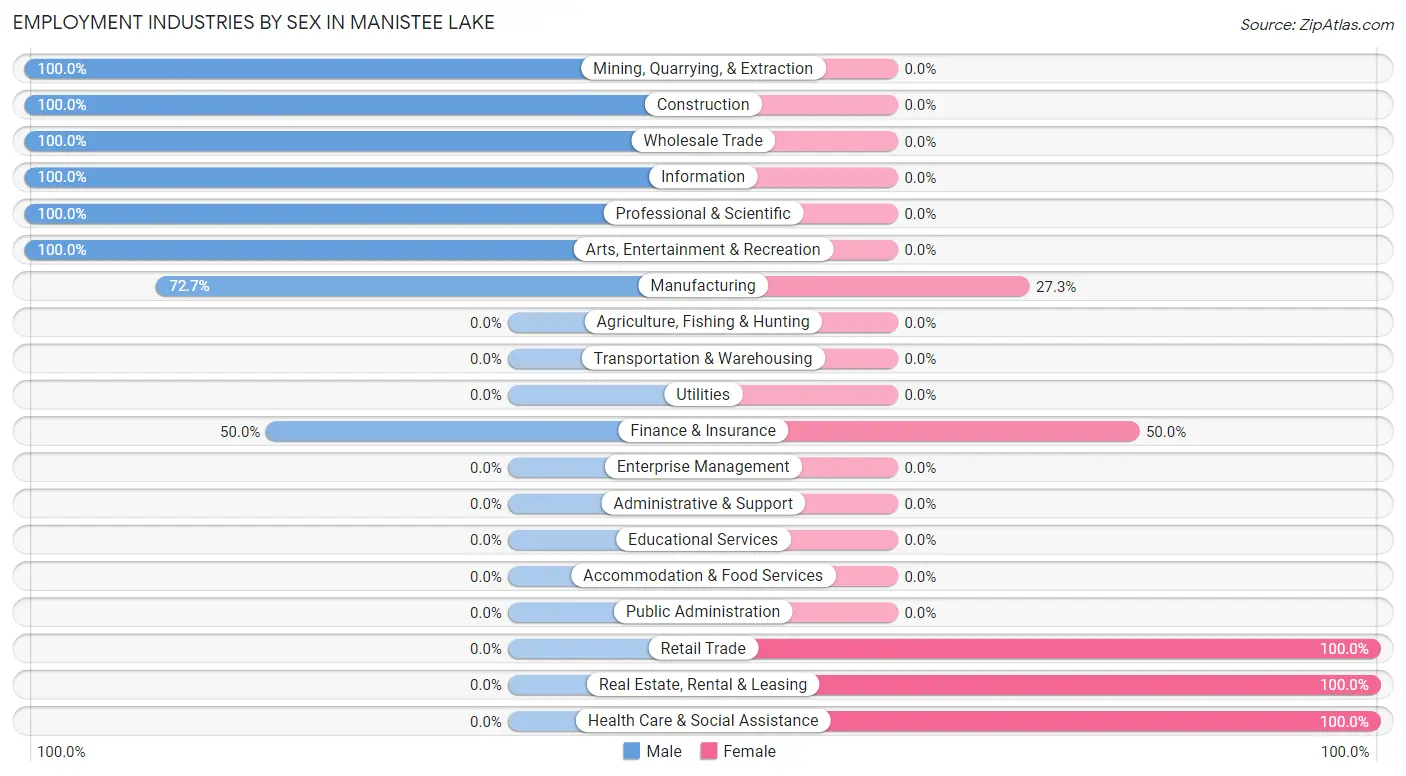
| Industry | Male | Female |
| Agriculture, Fishing & Hunting | 0 (0.0%) | 0 (0.0%) |
| Mining, Quarrying, & Extraction | 27 (100.0%) | 0 (0.0%) |
| Construction | 25 (100.0%) | 0 (0.0%) |
| Manufacturing | 16 (72.7%) | 6 (27.3%) |
| Wholesale Trade | 3 (100.0%) | 0 (0.0%) |
| Retail Trade | 0 (0.0%) | 21 (100.0%) |
| Transportation & Warehousing | 0 (0.0%) | 0 (0.0%) |
| Utilities | 0 (0.0%) | 0 (0.0%) |
| Information | 3 (100.0%) | 0 (0.0%) |
| Finance & Insurance | 3 (50.0%) | 3 (50.0%) |
| Real Estate, Rental & Leasing | 0 (0.0%) | 4 (100.0%) |
| Professional & Scientific | 8 (100.0%) | 0 (0.0%) |
| Enterprise Management | 0 (0.0%) | 0 (0.0%) |
| Administrative & Support | 0 (0.0%) | 0 (0.0%) |
| Educational Services | 0 (0.0%) | 0 (0.0%) |
| Health Care & Social Assistance | 0 (0.0%) | 4 (100.0%) |
| Arts, Entertainment & Recreation | 3 (100.0%) | 0 (0.0%) |
| Accommodation & Food Services | 0 (0.0%) | 0 (0.0%) |
| Public Administration | 0 (0.0%) | 0 (0.0%) |
| Total | 91 (70.0%) | 39 (30.0%) |
Education in Manistee Lake
School Enrollment in Manistee Lake
The most common levels of schooling among the 51 students in Manistee Lake are middle school (21 | 41.2%), college / undergraduate (16 | 31.4%), and elementary school (11 | 21.6%).
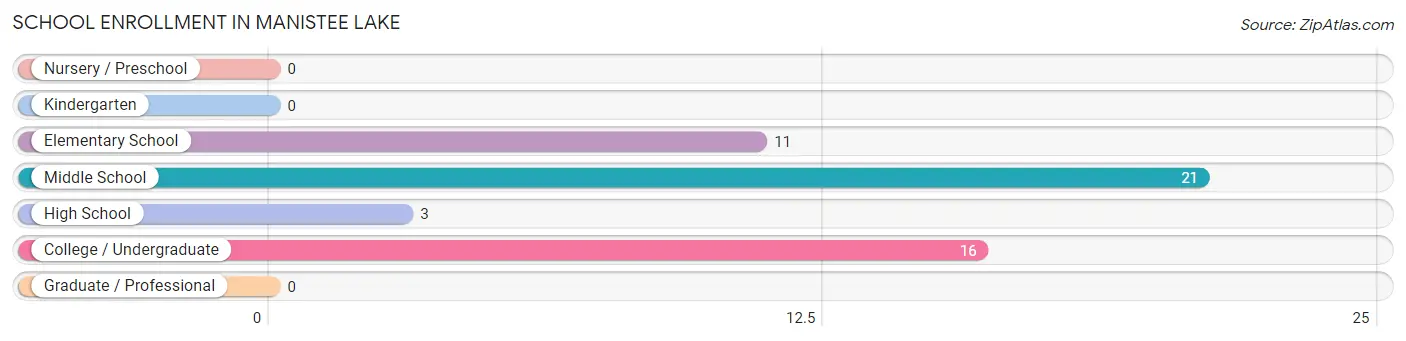
| School Level | # Students | % Students |
| Nursery / Preschool | 0 | 0.0% |
| Kindergarten | 0 | 0.0% |
| Elementary School | 11 | 21.6% |
| Middle School | 21 | 41.2% |
| High School | 3 | 5.9% |
| College / Undergraduate | 16 | 31.4% |
| Graduate / Professional | 0 | 0.0% |
| Total | 51 | 100.0% |
School Enrollment by Age by Funding Source in Manistee Lake
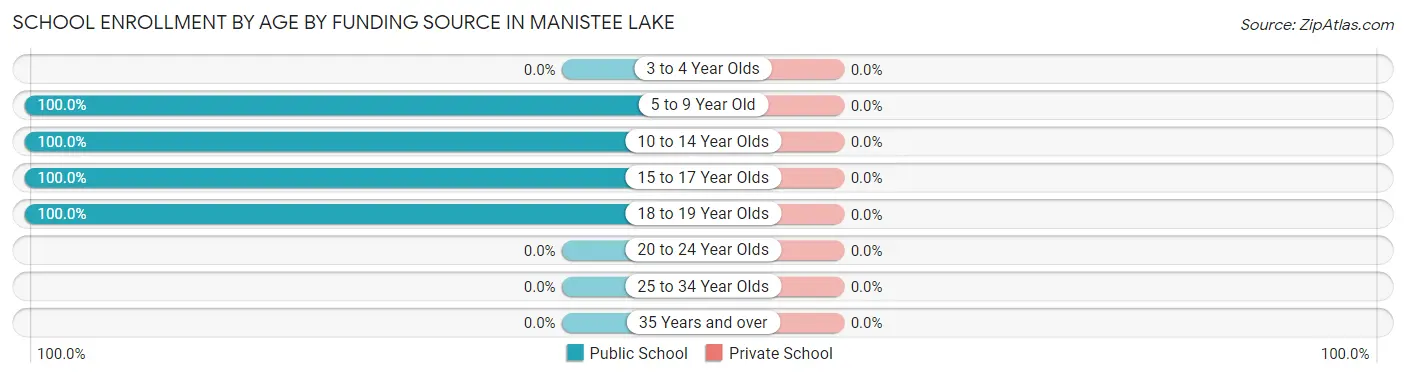
| Age Bracket | Public School | Private School |
| 3 to 4 Year Olds | 0 (0.0%) | 0 (0.0%) |
| 5 to 9 Year Old | 11 (100.0%) | 0 (0.0%) |
| 10 to 14 Year Olds | 21 (100.0%) | 0 (0.0%) |
| 15 to 17 Year Olds | 3 (100.0%) | 0 (0.0%) |
| 18 to 19 Year Olds | 16 (100.0%) | 0 (0.0%) |
| 20 to 24 Year Olds | 0 (0.0%) | 0 (0.0%) |
| 25 to 34 Year Olds | 0 (0.0%) | 0 (0.0%) |
| 35 Years and over | 0 (0.0%) | 0 (0.0%) |
| Total | 51 (100.0%) | 0 (0.0%) |
Educational Attainment by Field of Study in Manistee Lake
Social sciences (25 | 33.8%), business (19 | 25.7%), education (11 | 14.9%), physical & health sciences (5 | 6.8%), and engineering (5 | 6.8%) are the most common fields of study among 74 individuals in Manistee Lake who have obtained a bachelor's degree or higher.
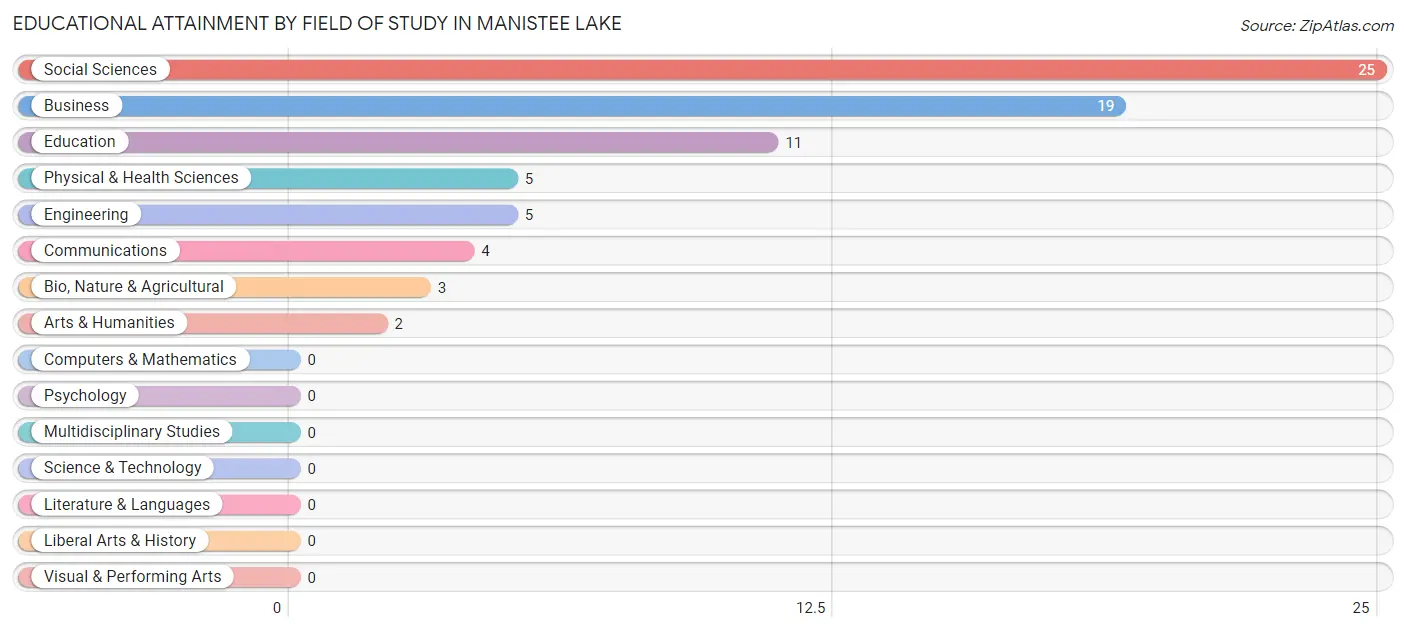
| Field of Study | # Graduates | % Graduates |
| Computers & Mathematics | 0 | 0.0% |
| Bio, Nature & Agricultural | 3 | 4.1% |
| Physical & Health Sciences | 5 | 6.8% |
| Psychology | 0 | 0.0% |
| Social Sciences | 25 | 33.8% |
| Engineering | 5 | 6.8% |
| Multidisciplinary Studies | 0 | 0.0% |
| Science & Technology | 0 | 0.0% |
| Business | 19 | 25.7% |
| Education | 11 | 14.9% |
| Literature & Languages | 0 | 0.0% |
| Liberal Arts & History | 0 | 0.0% |
| Visual & Performing Arts | 0 | 0.0% |
| Communications | 4 | 5.4% |
| Arts & Humanities | 2 | 2.7% |
| Total | 74 | 100.0% |
Transportation & Commute in Manistee Lake
Vehicle Availability by Sex in Manistee Lake
The most prevalent vehicle ownership categories in Manistee Lake are males with 4 vehicles (52, accounting for 58.4%) and females with 4 vehicles (21, making up 133.3%).
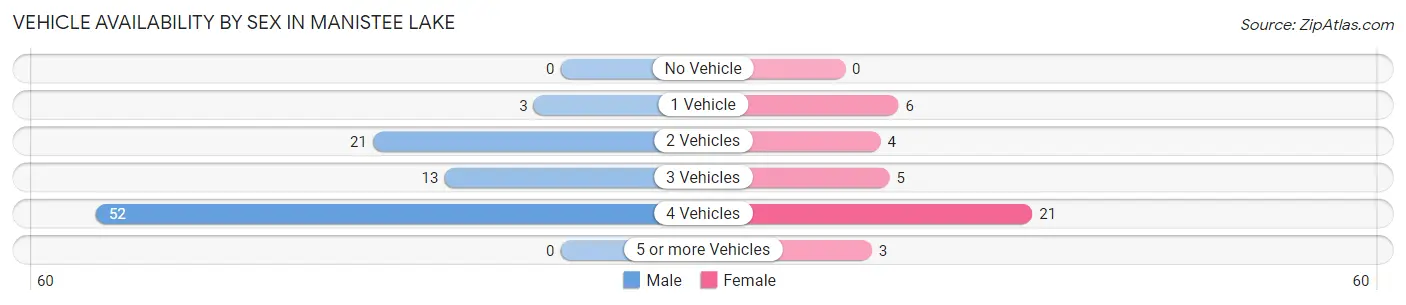
| Vehicles Available | Male | Female |
| No Vehicle | 0 (0.0%) | 0 (0.0%) |
| 1 Vehicle | 3 (3.4%) | 6 (15.4%) |
| 2 Vehicles | 21 (23.6%) | 4 (10.3%) |
| 3 Vehicles | 13 (14.6%) | 5 (12.8%) |
| 4 Vehicles | 52 (58.4%) | 21 (53.8%) |
| 5 or more Vehicles | 0 (0.0%) | 3 (7.7%) |
| Total | 89 (100.0%) | 39 (100.0%) |
Commute Time in Manistee Lake
The most frequently occuring commute durations in Manistee Lake are 60 to 89 minutes (37 commuters, 28.9%), 15 to 19 minutes (28 commuters, 21.9%), and 20 to 24 minutes (27 commuters, 21.1%).
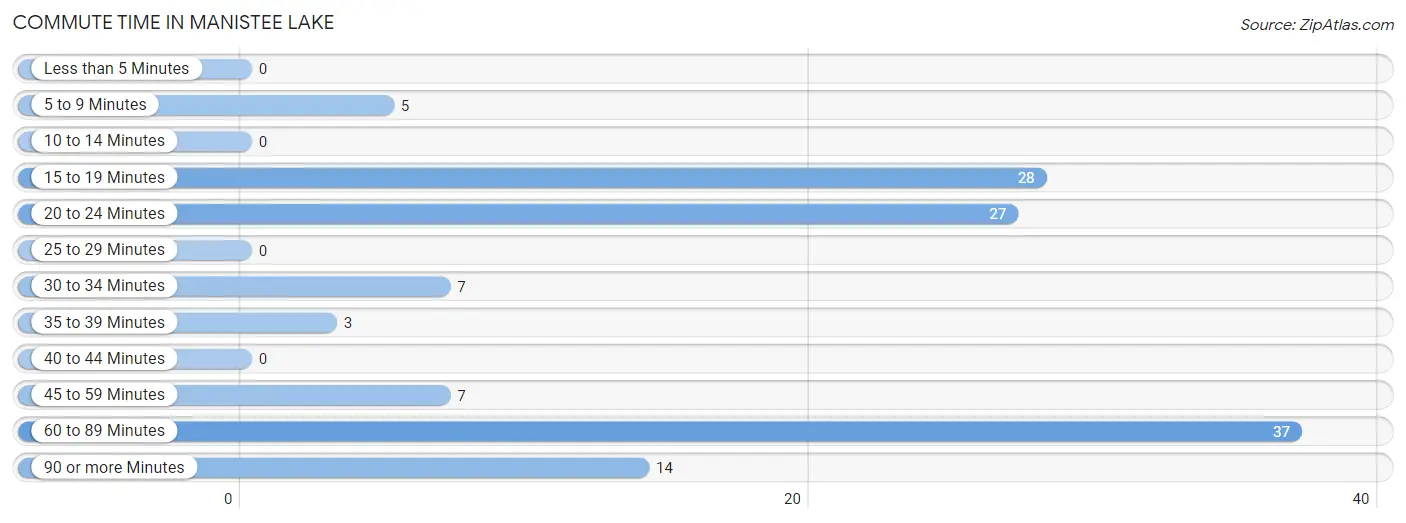
| Commute Time | # Commuters | % Commuters |
| Less than 5 Minutes | 0 | 0.0% |
| 5 to 9 Minutes | 5 | 3.9% |
| 10 to 14 Minutes | 0 | 0.0% |
| 15 to 19 Minutes | 28 | 21.9% |
| 20 to 24 Minutes | 27 | 21.1% |
| 25 to 29 Minutes | 0 | 0.0% |
| 30 to 34 Minutes | 7 | 5.5% |
| 35 to 39 Minutes | 3 | 2.3% |
| 40 to 44 Minutes | 0 | 0.0% |
| 45 to 59 Minutes | 7 | 5.5% |
| 60 to 89 Minutes | 37 | 28.9% |
| 90 or more Minutes | 14 | 10.9% |
Commute Time by Sex in Manistee Lake
The most common commute times in Manistee Lake are 20 to 24 minutes (27 commuters, 30.3%) for males and 60 to 89 minutes (17 commuters, 43.6%) for females.
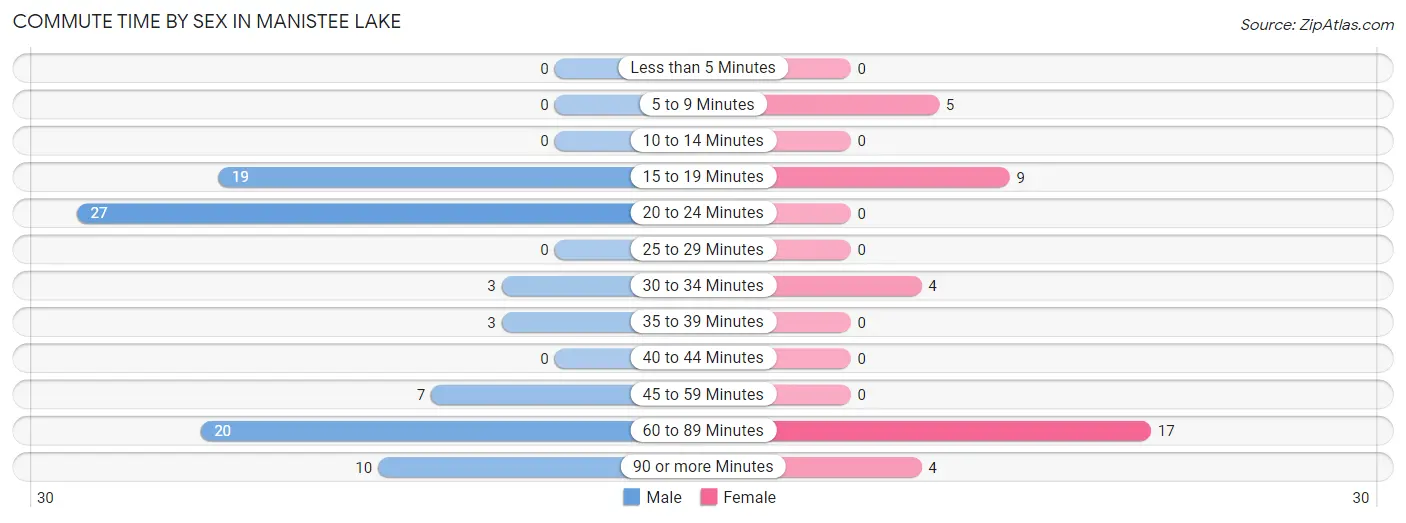
| Commute Time | Male | Female |
| Less than 5 Minutes | 0 (0.0%) | 0 (0.0%) |
| 5 to 9 Minutes | 0 (0.0%) | 5 (12.8%) |
| 10 to 14 Minutes | 0 (0.0%) | 0 (0.0%) |
| 15 to 19 Minutes | 19 (21.3%) | 9 (23.1%) |
| 20 to 24 Minutes | 27 (30.3%) | 0 (0.0%) |
| 25 to 29 Minutes | 0 (0.0%) | 0 (0.0%) |
| 30 to 34 Minutes | 3 (3.4%) | 4 (10.3%) |
| 35 to 39 Minutes | 3 (3.4%) | 0 (0.0%) |
| 40 to 44 Minutes | 0 (0.0%) | 0 (0.0%) |
| 45 to 59 Minutes | 7 (7.9%) | 0 (0.0%) |
| 60 to 89 Minutes | 20 (22.5%) | 17 (43.6%) |
| 90 or more Minutes | 10 (11.2%) | 4 (10.3%) |
Time of Departure to Work by Sex in Manistee Lake
The most frequent times of departure to work in Manistee Lake are 5:30 AM to 5:59 AM (31, 34.8%) for males and 4:00 PM to 11:59 PM (16, 41.0%) for females.
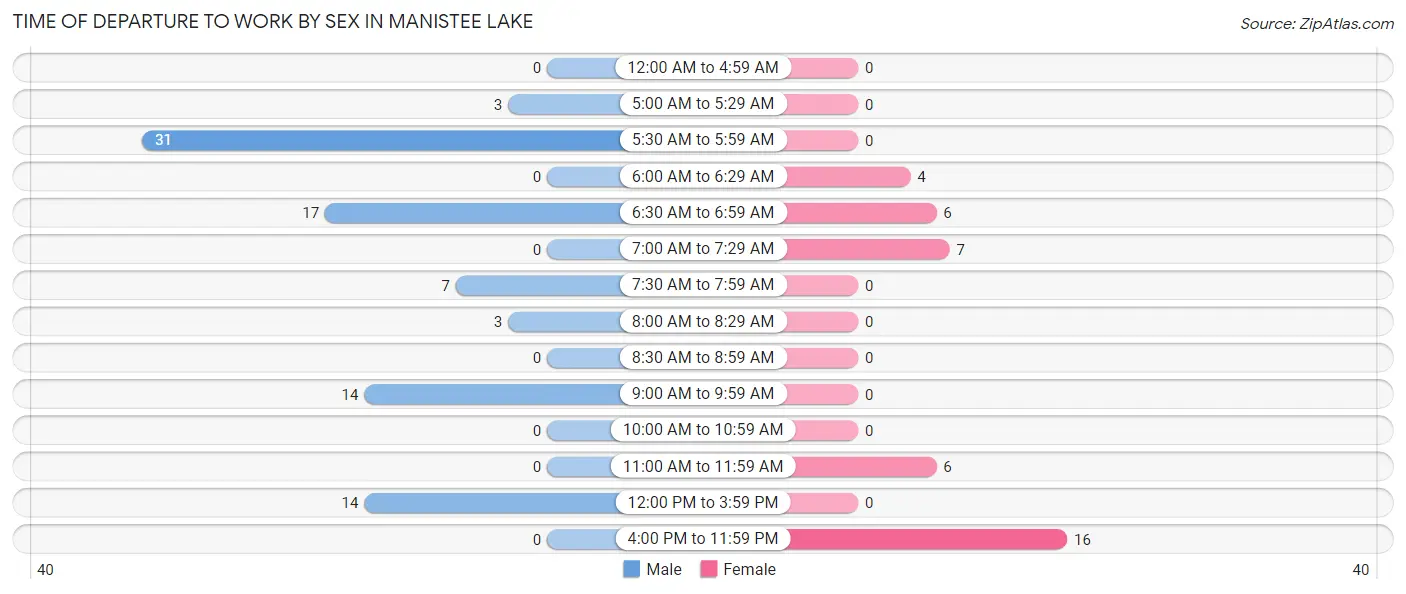
| Time of Departure | Male | Female |
| 12:00 AM to 4:59 AM | 0 (0.0%) | 0 (0.0%) |
| 5:00 AM to 5:29 AM | 3 (3.4%) | 0 (0.0%) |
| 5:30 AM to 5:59 AM | 31 (34.8%) | 0 (0.0%) |
| 6:00 AM to 6:29 AM | 0 (0.0%) | 4 (10.3%) |
| 6:30 AM to 6:59 AM | 17 (19.1%) | 6 (15.4%) |
| 7:00 AM to 7:29 AM | 0 (0.0%) | 7 (17.9%) |
| 7:30 AM to 7:59 AM | 7 (7.9%) | 0 (0.0%) |
| 8:00 AM to 8:29 AM | 3 (3.4%) | 0 (0.0%) |
| 8:30 AM to 8:59 AM | 0 (0.0%) | 0 (0.0%) |
| 9:00 AM to 9:59 AM | 14 (15.7%) | 0 (0.0%) |
| 10:00 AM to 10:59 AM | 0 (0.0%) | 0 (0.0%) |
| 11:00 AM to 11:59 AM | 0 (0.0%) | 6 (15.4%) |
| 12:00 PM to 3:59 PM | 14 (15.7%) | 0 (0.0%) |
| 4:00 PM to 11:59 PM | 0 (0.0%) | 16 (41.0%) |
| Total | 89 (100.0%) | 39 (100.0%) |
Housing Occupancy in Manistee Lake
Occupancy by Ownership in Manistee Lake
Of the total 176 dwellings in Manistee Lake, owner-occupied units account for 150 (85.2%), while renter-occupied units make up 26 (14.8%).

| Occupancy | # Housing Units | % Housing Units |
| Owner Occupied Housing Units | 150 | 85.2% |
| Renter-Occupied Housing Units | 26 | 14.8% |
| Total Occupied Housing Units | 176 | 100.0% |
Occupancy by Household Size in Manistee Lake
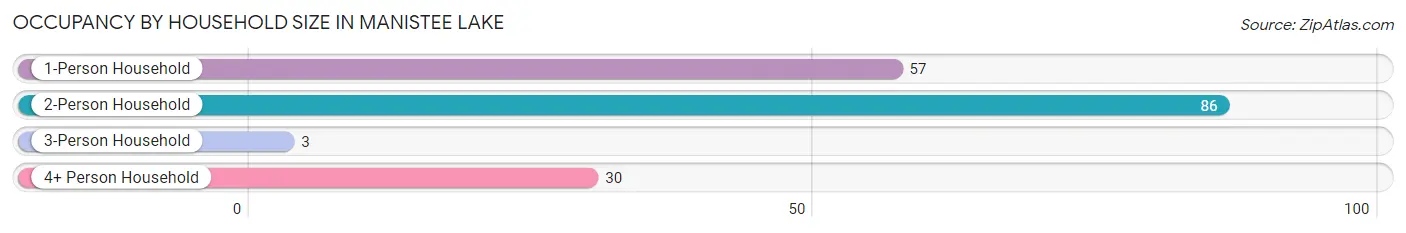
| Household Size | # Housing Units | % Housing Units |
| 1-Person Household | 57 | 32.4% |
| 2-Person Household | 86 | 48.9% |
| 3-Person Household | 3 | 1.7% |
| 4+ Person Household | 30 | 17.1% |
| Total Housing Units | 176 | 100.0% |
Occupancy by Ownership by Household Size in Manistee Lake
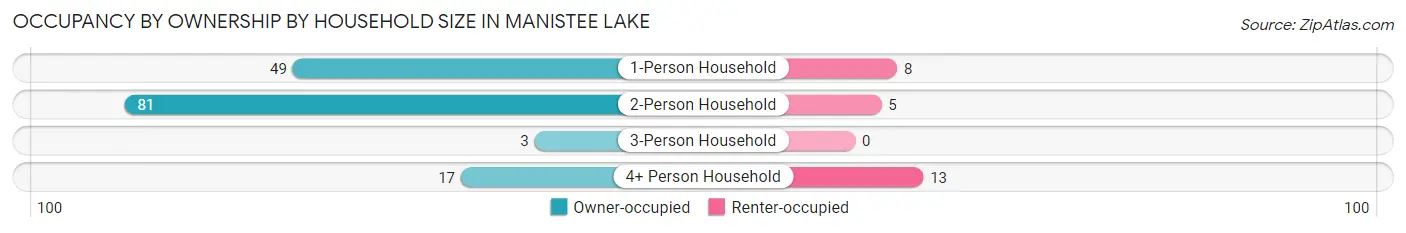
| Household Size | Owner-occupied | Renter-occupied |
| 1-Person Household | 49 (86.0%) | 8 (14.0%) |
| 2-Person Household | 81 (94.2%) | 5 (5.8%) |
| 3-Person Household | 3 (100.0%) | 0 (0.0%) |
| 4+ Person Household | 17 (56.7%) | 13 (43.3%) |
| Total Housing Units | 150 (85.2%) | 26 (14.8%) |
Occupancy by Educational Attainment in Manistee Lake
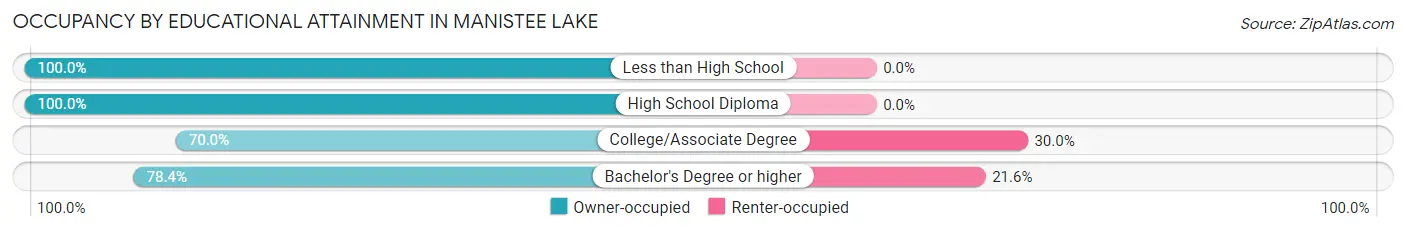
| Household Size | Owner-occupied | Renter-occupied |
| Less than High School | 38 (100.0%) | 0 (0.0%) |
| High School Diploma | 41 (100.0%) | 0 (0.0%) |
| College/Associate Degree | 42 (70.0%) | 18 (30.0%) |
| Bachelor's Degree or higher | 29 (78.4%) | 8 (21.6%) |
Occupancy by Age of Householder in Manistee Lake
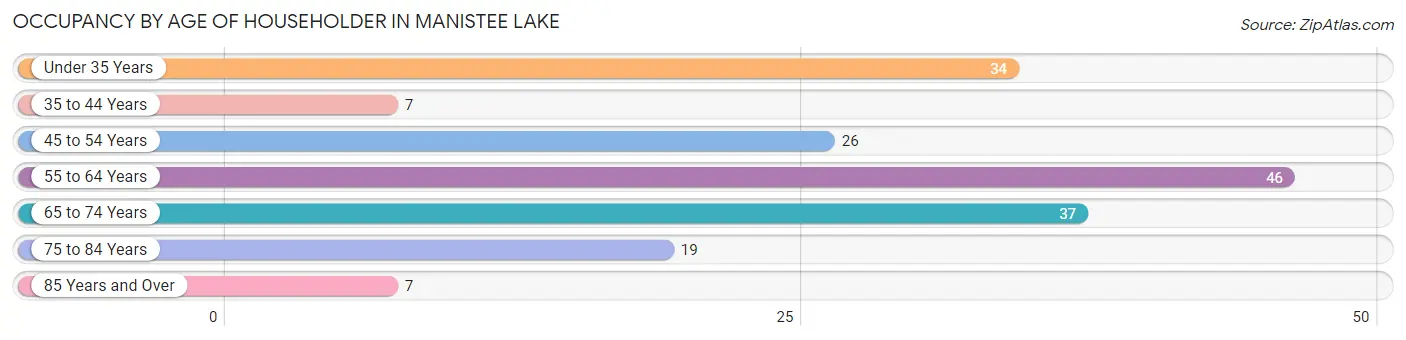
| Age Bracket | # Households | % Households |
| Under 35 Years | 34 | 19.3% |
| 35 to 44 Years | 7 | 4.0% |
| 45 to 54 Years | 26 | 14.8% |
| 55 to 64 Years | 46 | 26.1% |
| 65 to 74 Years | 37 | 21.0% |
| 75 to 84 Years | 19 | 10.8% |
| 85 Years and Over | 7 | 4.0% |
| Total | 176 | 100.0% |
Housing Finances in Manistee Lake
Median Income by Occupancy in Manistee Lake
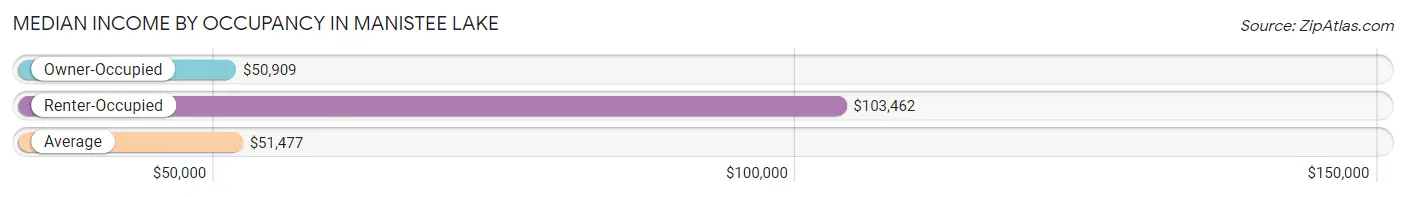
| Occupancy Type | # Households | Median Income |
| Owner-Occupied | 150 (85.2%) | $50,909 |
| Renter-Occupied | 26 (14.8%) | $103,462 |
| Average | 176 (100.0%) | $51,477 |
Occupancy by Householder Income Bracket in Manistee Lake
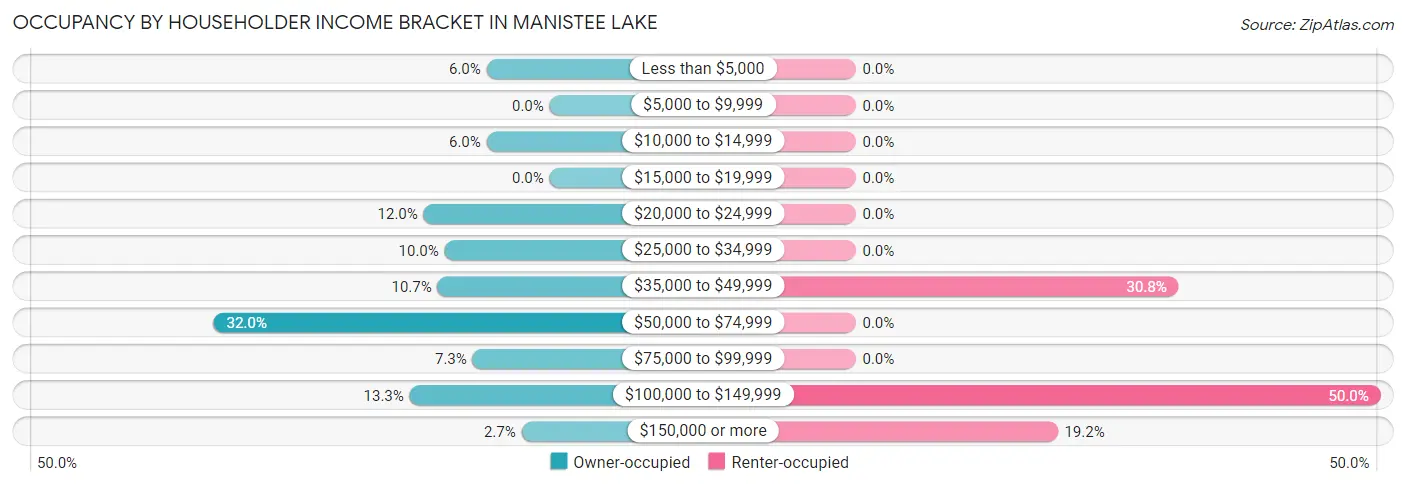
| Income Bracket | Owner-occupied | Renter-occupied |
| Less than $5,000 | 9 (6.0%) | 0 (0.0%) |
| $5,000 to $9,999 | 0 (0.0%) | 0 (0.0%) |
| $10,000 to $14,999 | 9 (6.0%) | 0 (0.0%) |
| $15,000 to $19,999 | 0 (0.0%) | 0 (0.0%) |
| $20,000 to $24,999 | 18 (12.0%) | 0 (0.0%) |
| $25,000 to $34,999 | 15 (10.0%) | 0 (0.0%) |
| $35,000 to $49,999 | 16 (10.7%) | 8 (30.8%) |
| $50,000 to $74,999 | 48 (32.0%) | 0 (0.0%) |
| $75,000 to $99,999 | 11 (7.3%) | 0 (0.0%) |
| $100,000 to $149,999 | 20 (13.3%) | 13 (50.0%) |
| $150,000 or more | 4 (2.7%) | 5 (19.2%) |
| Total | 150 (100.0%) | 26 (100.0%) |
Monthly Housing Cost Tiers in Manistee Lake
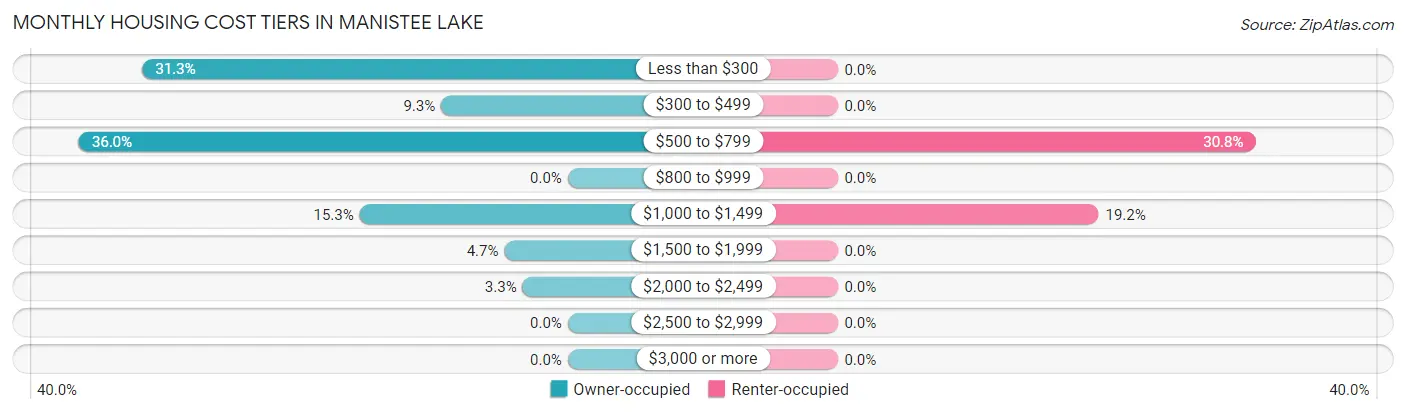
| Monthly Cost | Owner-occupied | Renter-occupied |
| Less than $300 | 47 (31.3%) | 0 (0.0%) |
| $300 to $499 | 14 (9.3%) | 0 (0.0%) |
| $500 to $799 | 54 (36.0%) | 8 (30.8%) |
| $800 to $999 | 0 (0.0%) | 0 (0.0%) |
| $1,000 to $1,499 | 23 (15.3%) | 5 (19.2%) |
| $1,500 to $1,999 | 7 (4.7%) | 0 (0.0%) |
| $2,000 to $2,499 | 5 (3.3%) | 0 (0.0%) |
| $2,500 to $2,999 | 0 (0.0%) | 0 (0.0%) |
| $3,000 or more | 0 (0.0%) | 0 (0.0%) |
| Total | 150 (100.0%) | 26 (100.0%) |
Physical Housing Characteristics in Manistee Lake
Housing Structures in Manistee Lake
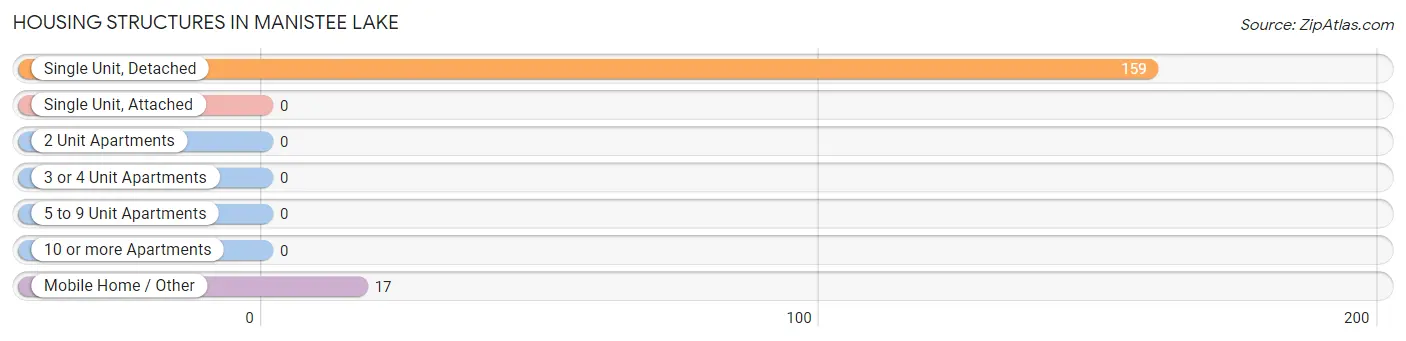
| Structure Type | # Housing Units | % Housing Units |
| Single Unit, Detached | 159 | 90.3% |
| Single Unit, Attached | 0 | 0.0% |
| 2 Unit Apartments | 0 | 0.0% |
| 3 or 4 Unit Apartments | 0 | 0.0% |
| 5 to 9 Unit Apartments | 0 | 0.0% |
| 10 or more Apartments | 0 | 0.0% |
| Mobile Home / Other | 17 | 9.7% |
| Total | 176 | 100.0% |
Housing Structures by Occupancy in Manistee Lake
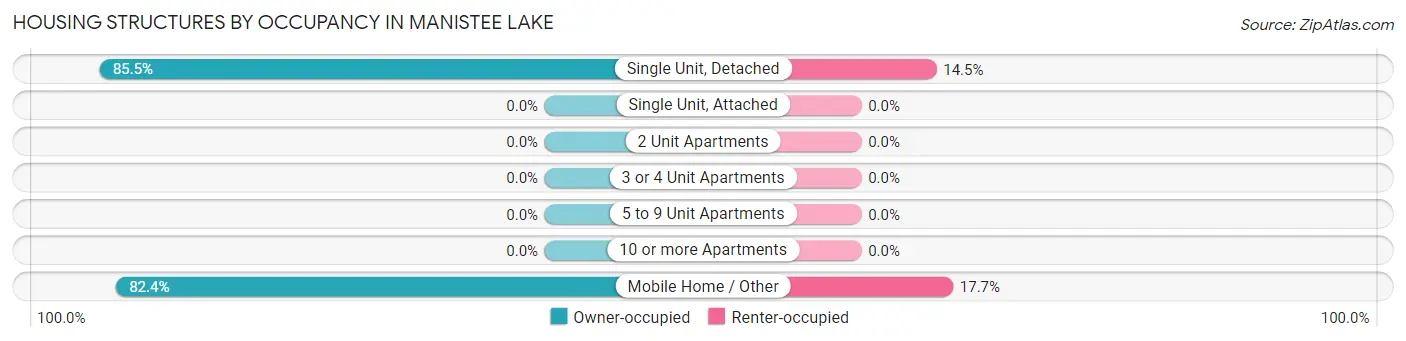
| Structure Type | Owner-occupied | Renter-occupied |
| Single Unit, Detached | 136 (85.5%) | 23 (14.5%) |
| Single Unit, Attached | 0 (0.0%) | 0 (0.0%) |
| 2 Unit Apartments | 0 (0.0%) | 0 (0.0%) |
| 3 or 4 Unit Apartments | 0 (0.0%) | 0 (0.0%) |
| 5 to 9 Unit Apartments | 0 (0.0%) | 0 (0.0%) |
| 10 or more Apartments | 0 (0.0%) | 0 (0.0%) |
| Mobile Home / Other | 14 (82.4%) | 3 (17.6%) |
| Total | 150 (85.2%) | 26 (14.8%) |
Housing Structures by Number of Rooms in Manistee Lake
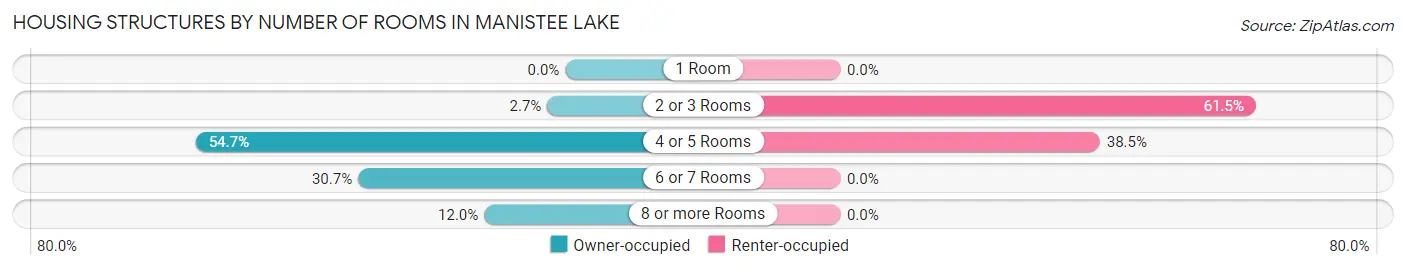
| Number of Rooms | Owner-occupied | Renter-occupied |
| 1 Room | 0 (0.0%) | 0 (0.0%) |
| 2 or 3 Rooms | 4 (2.7%) | 16 (61.5%) |
| 4 or 5 Rooms | 82 (54.7%) | 10 (38.5%) |
| 6 or 7 Rooms | 46 (30.7%) | 0 (0.0%) |
| 8 or more Rooms | 18 (12.0%) | 0 (0.0%) |
| Total | 150 (100.0%) | 26 (100.0%) |
Housing Structure by Heating Type in Manistee Lake
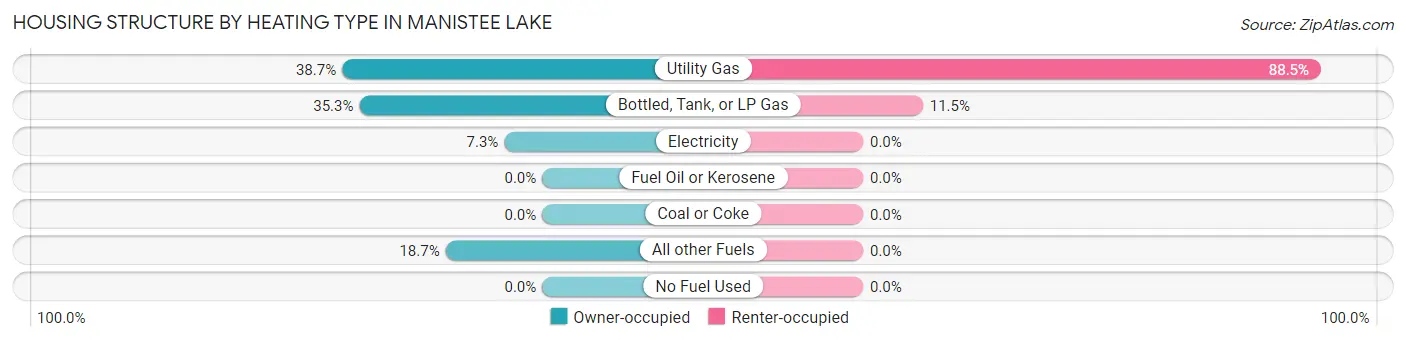
| Heating Type | Owner-occupied | Renter-occupied |
| Utility Gas | 58 (38.7%) | 23 (88.5%) |
| Bottled, Tank, or LP Gas | 53 (35.3%) | 3 (11.5%) |
| Electricity | 11 (7.3%) | 0 (0.0%) |
| Fuel Oil or Kerosene | 0 (0.0%) | 0 (0.0%) |
| Coal or Coke | 0 (0.0%) | 0 (0.0%) |
| All other Fuels | 28 (18.7%) | 0 (0.0%) |
| No Fuel Used | 0 (0.0%) | 0 (0.0%) |
| Total | 150 (100.0%) | 26 (100.0%) |
Household Vehicle Usage in Manistee Lake
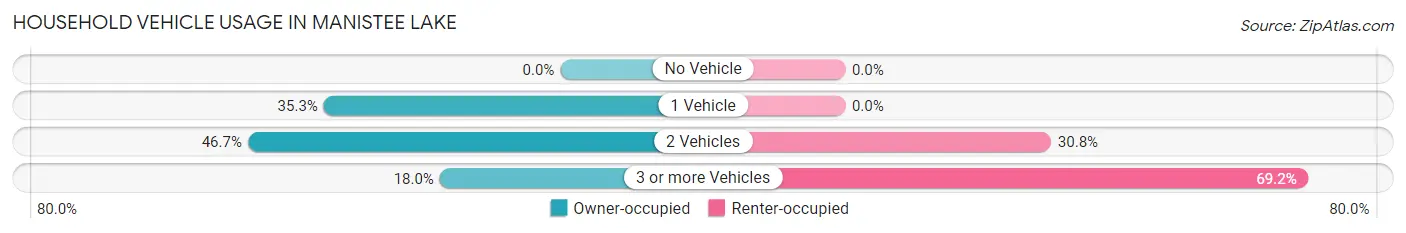
| Vehicles per Household | Owner-occupied | Renter-occupied |
| No Vehicle | 0 (0.0%) | 0 (0.0%) |
| 1 Vehicle | 53 (35.3%) | 0 (0.0%) |
| 2 Vehicles | 70 (46.7%) | 8 (30.8%) |
| 3 or more Vehicles | 27 (18.0%) | 18 (69.2%) |
| Total | 150 (100.0%) | 26 (100.0%) |
Real Estate & Mortgages in Manistee Lake
Real Estate and Mortgage Overview in Manistee Lake
| Characteristic | Without Mortgage | With Mortgage |
| Housing Units | 105 | 45 |
| Median Property Value | $100,900 | $152,700 |
| Median Household Income | $50,063 | $0 |
| Monthly Housing Costs | $379 | $0 |
| Real Estate Taxes | $1,375 | $0 |
Property Value by Mortgage Status in Manistee Lake
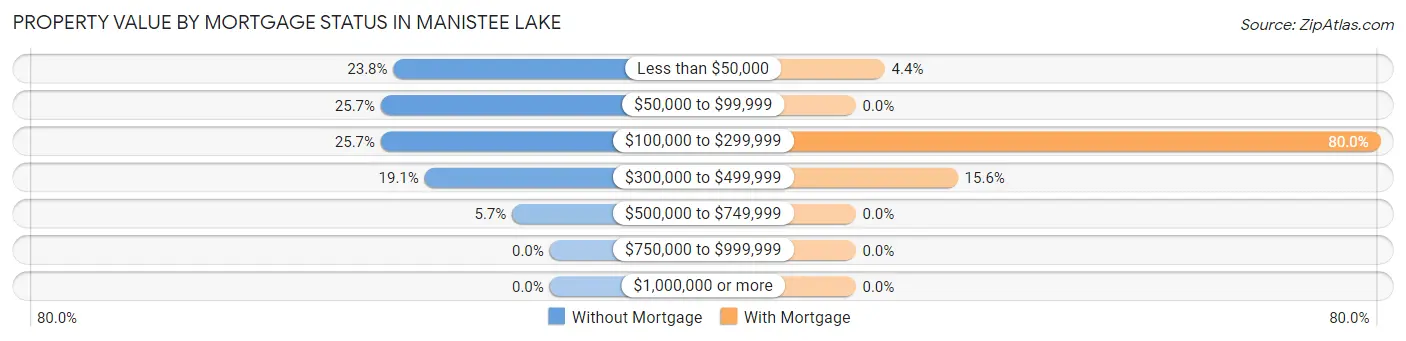
| Property Value | Without Mortgage | With Mortgage |
| Less than $50,000 | 25 (23.8%) | 2 (4.4%) |
| $50,000 to $99,999 | 27 (25.7%) | 0 (0.0%) |
| $100,000 to $299,999 | 27 (25.7%) | 36 (80.0%) |
| $300,000 to $499,999 | 20 (19.1%) | 7 (15.6%) |
| $500,000 to $749,999 | 6 (5.7%) | 0 (0.0%) |
| $750,000 to $999,999 | 0 (0.0%) | 0 (0.0%) |
| $1,000,000 or more | 0 (0.0%) | 0 (0.0%) |
| Total | 105 (100.0%) | 45 (100.0%) |
Household Income by Mortgage Status in Manistee Lake
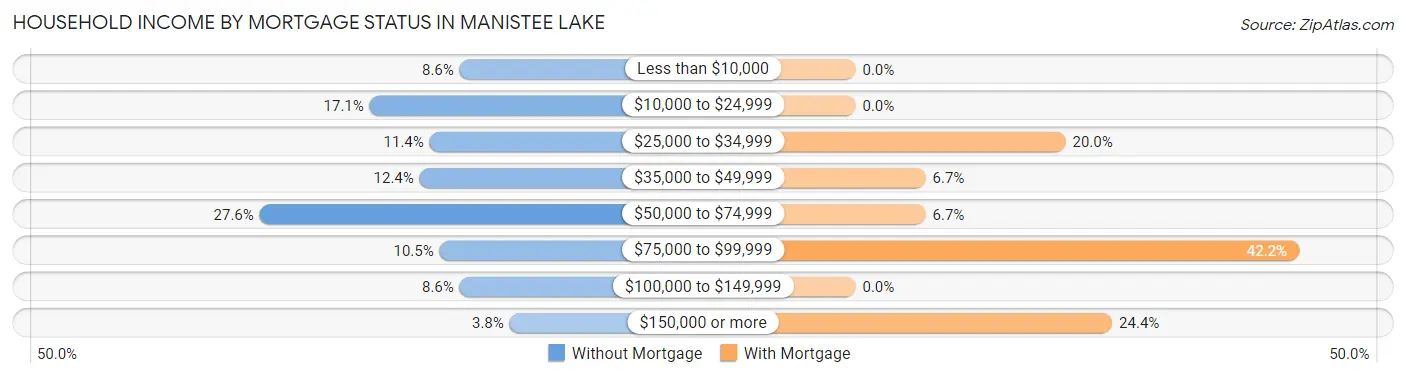
| Household Income | Without Mortgage | With Mortgage |
| Less than $10,000 | 9 (8.6%) | 0 (0.0%) |
| $10,000 to $24,999 | 18 (17.1%) | 0 (0.0%) |
| $25,000 to $34,999 | 12 (11.4%) | 9 (20.0%) |
| $35,000 to $49,999 | 13 (12.4%) | 3 (6.7%) |
| $50,000 to $74,999 | 29 (27.6%) | 3 (6.7%) |
| $75,000 to $99,999 | 11 (10.5%) | 19 (42.2%) |
| $100,000 to $149,999 | 9 (8.6%) | 0 (0.0%) |
| $150,000 or more | 4 (3.8%) | 11 (24.4%) |
| Total | 105 (100.0%) | 45 (100.0%) |
Property Value to Household Income Ratio in Manistee Lake
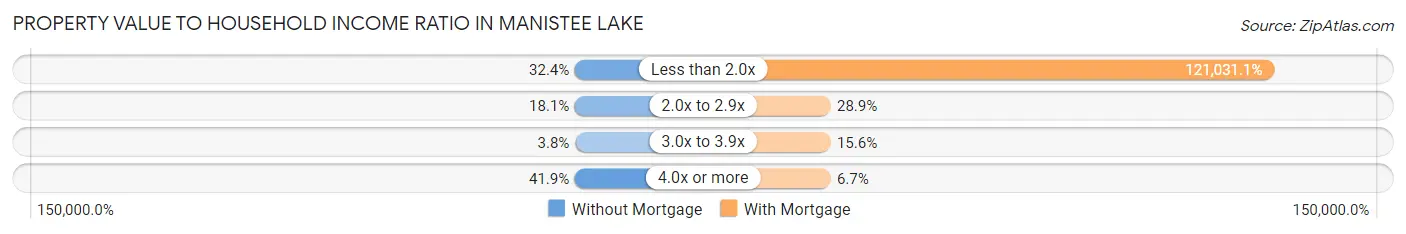
| Value-to-Income Ratio | Without Mortgage | With Mortgage |
| Less than 2.0x | 34 (32.4%) | 54,464 (121,031.1%) |
| 2.0x to 2.9x | 19 (18.1%) | 13 (28.9%) |
| 3.0x to 3.9x | 4 (3.8%) | 7 (15.6%) |
| 4.0x or more | 44 (41.9%) | 3 (6.7%) |
| Total | 105 (100.0%) | 45 (100.0%) |
Real Estate Taxes by Mortgage Status in Manistee Lake
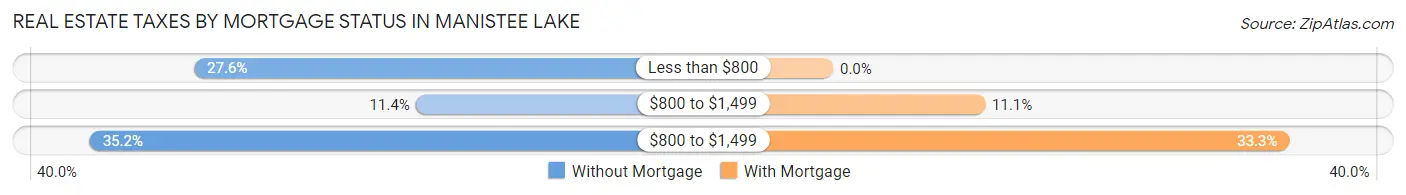
| Property Taxes | Without Mortgage | With Mortgage |
| Less than $800 | 29 (27.6%) | 0 (0.0%) |
| $800 to $1,499 | 12 (11.4%) | 5 (11.1%) |
| $800 to $1,499 | 37 (35.2%) | 15 (33.3%) |
| Total | 105 (100.0%) | 45 (100.0%) |
Health & Disability in Manistee Lake
Health Insurance Coverage by Age in Manistee Lake
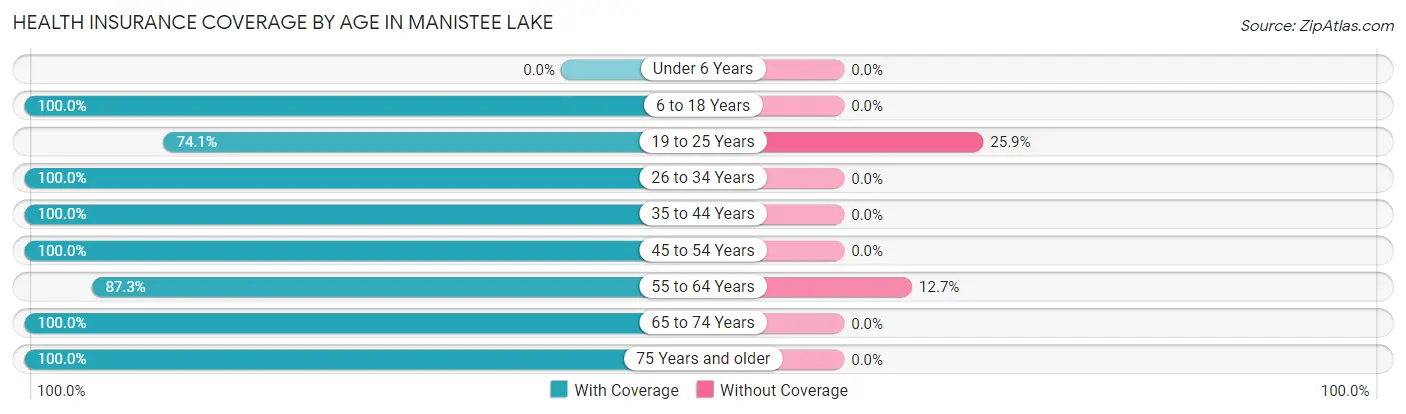
| Age Bracket | With Coverage | Without Coverage |
| Under 6 Years | 0 (0.0%) | 0 (0.0%) |
| 6 to 18 Years | 35 (100.0%) | 0 (0.0%) |
| 19 to 25 Years | 40 (74.1%) | 14 (25.9%) |
| 26 to 34 Years | 48 (100.0%) | 0 (0.0%) |
| 35 to 44 Years | 13 (100.0%) | 0 (0.0%) |
| 45 to 54 Years | 43 (100.0%) | 0 (0.0%) |
| 55 to 64 Years | 69 (87.3%) | 10 (12.7%) |
| 65 to 74 Years | 60 (100.0%) | 0 (0.0%) |
| 75 Years and older | 34 (100.0%) | 0 (0.0%) |
| Total | 342 (93.4%) | 24 (6.6%) |
Health Insurance Coverage by Citizenship Status in Manistee Lake
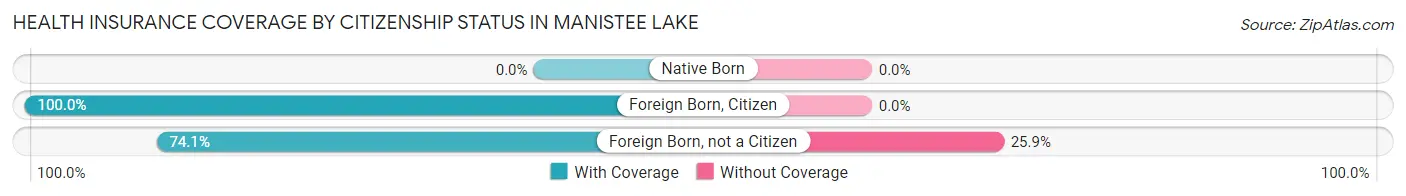
| Citizenship Status | With Coverage | Without Coverage |
| Native Born | 0 (0.0%) | 0 (0.0%) |
| Foreign Born, Citizen | 35 (100.0%) | 0 (0.0%) |
| Foreign Born, not a Citizen | 40 (74.1%) | 14 (25.9%) |
Health Insurance Coverage by Household Income in Manistee Lake
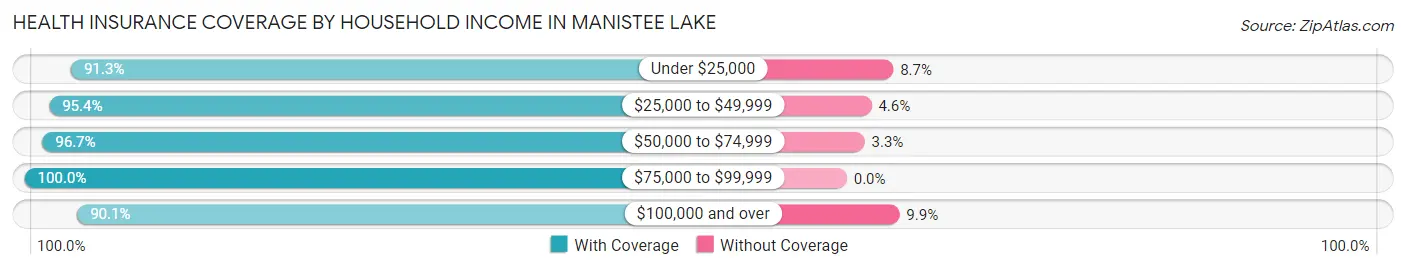
| Household Income | With Coverage | Without Coverage |
| Under $25,000 | 42 (91.3%) | 4 (8.7%) |
| $25,000 to $49,999 | 62 (95.4%) | 3 (4.6%) |
| $50,000 to $74,999 | 87 (96.7%) | 3 (3.3%) |
| $75,000 to $99,999 | 23 (100.0%) | 0 (0.0%) |
| $100,000 and over | 128 (90.1%) | 14 (9.9%) |
Public vs Private Health Insurance Coverage by Age in Manistee Lake
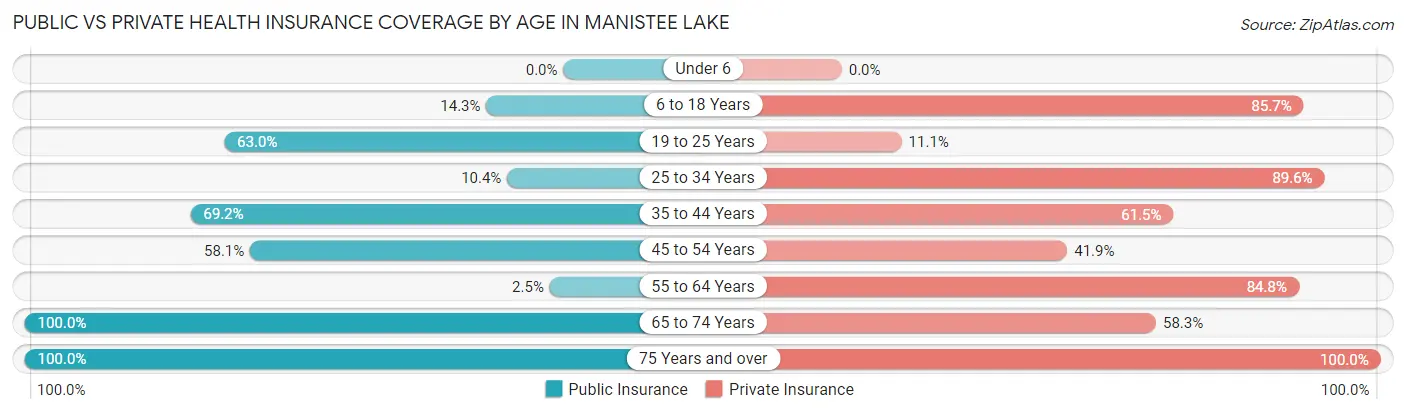
| Age Bracket | Public Insurance | Private Insurance |
| Under 6 | 0 (0.0%) | 0 (0.0%) |
| 6 to 18 Years | 5 (14.3%) | 30 (85.7%) |
| 19 to 25 Years | 34 (63.0%) | 6 (11.1%) |
| 25 to 34 Years | 5 (10.4%) | 43 (89.6%) |
| 35 to 44 Years | 9 (69.2%) | 8 (61.5%) |
| 45 to 54 Years | 25 (58.1%) | 18 (41.9%) |
| 55 to 64 Years | 2 (2.5%) | 67 (84.8%) |
| 65 to 74 Years | 60 (100.0%) | 35 (58.3%) |
| 75 Years and over | 34 (100.0%) | 34 (100.0%) |
| Total | 174 (47.5%) | 241 (65.8%) |
Disability Status by Sex by Age in Manistee Lake
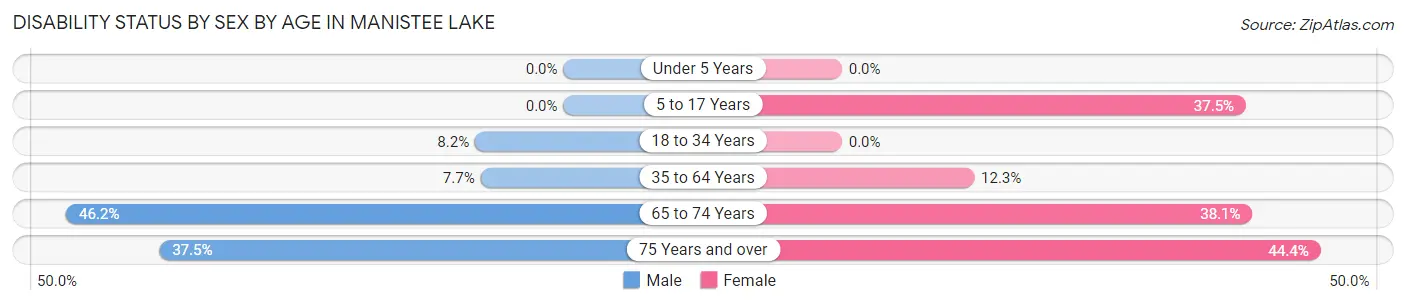
| Age Bracket | Male | Female |
| Under 5 Years | 0 (0.0%) | 0 (0.0%) |
| 5 to 17 Years | 0 (0.0%) | 3 (37.5%) |
| 18 to 34 Years | 5 (8.2%) | 0 (0.0%) |
| 35 to 64 Years | 6 (7.7%) | 7 (12.3%) |
| 65 to 74 Years | 18 (46.2%) | 8 (38.1%) |
| 75 Years and over | 6 (37.5%) | 8 (44.4%) |
Disability Class by Sex by Age in Manistee Lake
Disability Class: Hearing Difficulty
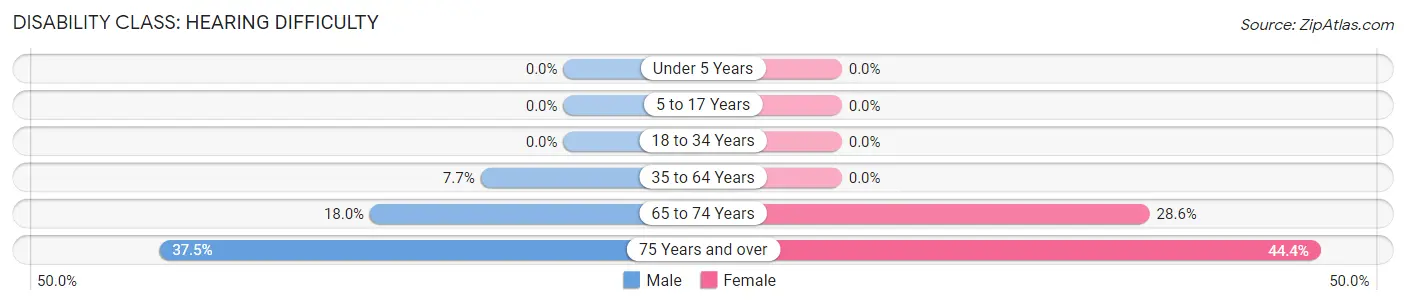
| Age Bracket | Male | Female |
| Under 5 Years | 0 (0.0%) | 0 (0.0%) |
| 5 to 17 Years | 0 (0.0%) | 0 (0.0%) |
| 18 to 34 Years | 0 (0.0%) | 0 (0.0%) |
| 35 to 64 Years | 6 (7.7%) | 0 (0.0%) |
| 65 to 74 Years | 7 (17.9%) | 6 (28.6%) |
| 75 Years and over | 6 (37.5%) | 8 (44.4%) |
Disability Class: Vision Difficulty
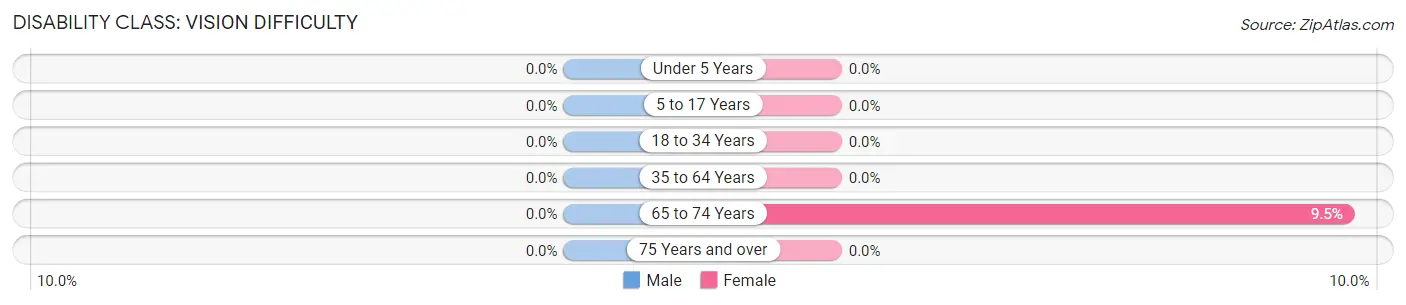
| Age Bracket | Male | Female |
| Under 5 Years | 0 (0.0%) | 0 (0.0%) |
| 5 to 17 Years | 0 (0.0%) | 0 (0.0%) |
| 18 to 34 Years | 0 (0.0%) | 0 (0.0%) |
| 35 to 64 Years | 0 (0.0%) | 0 (0.0%) |
| 65 to 74 Years | 0 (0.0%) | 2 (9.5%) |
| 75 Years and over | 0 (0.0%) | 0 (0.0%) |
Disability Class: Cognitive Difficulty
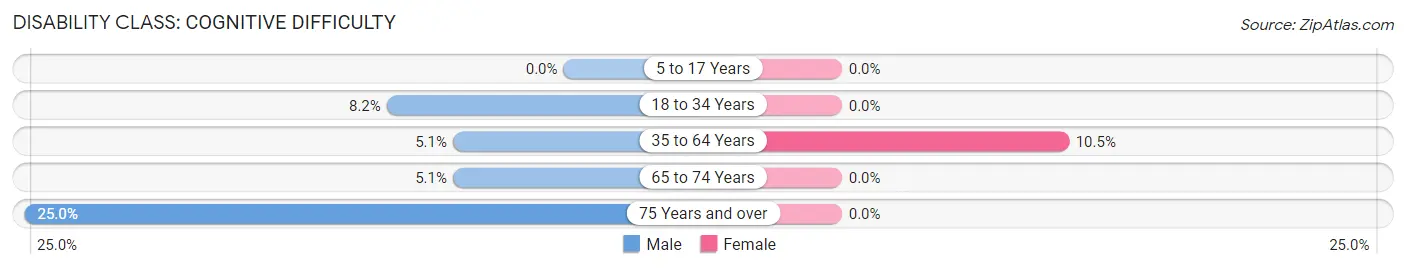
| Age Bracket | Male | Female |
| 5 to 17 Years | 0 (0.0%) | 0 (0.0%) |
| 18 to 34 Years | 5 (8.2%) | 0 (0.0%) |
| 35 to 64 Years | 4 (5.1%) | 6 (10.5%) |
| 65 to 74 Years | 2 (5.1%) | 0 (0.0%) |
| 75 Years and over | 4 (25.0%) | 0 (0.0%) |
Disability Class: Ambulatory Difficulty
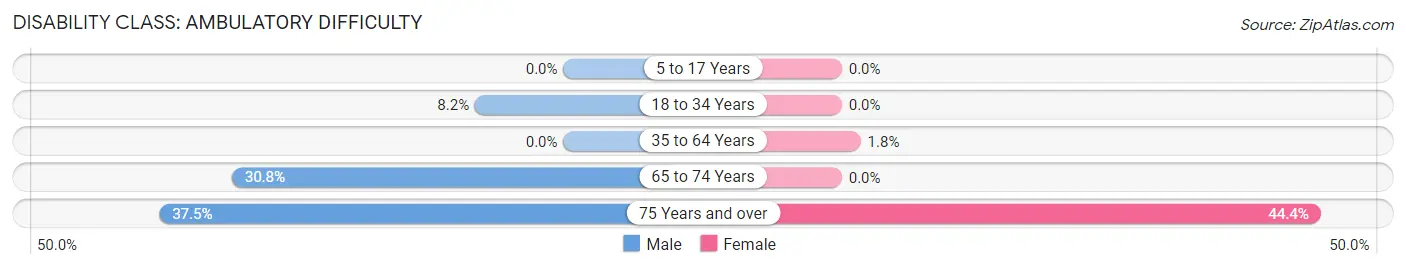
| Age Bracket | Male | Female |
| 5 to 17 Years | 0 (0.0%) | 0 (0.0%) |
| 18 to 34 Years | 5 (8.2%) | 0 (0.0%) |
| 35 to 64 Years | 0 (0.0%) | 1 (1.8%) |
| 65 to 74 Years | 12 (30.8%) | 0 (0.0%) |
| 75 Years and over | 6 (37.5%) | 8 (44.4%) |
Disability Class: Self-Care Difficulty
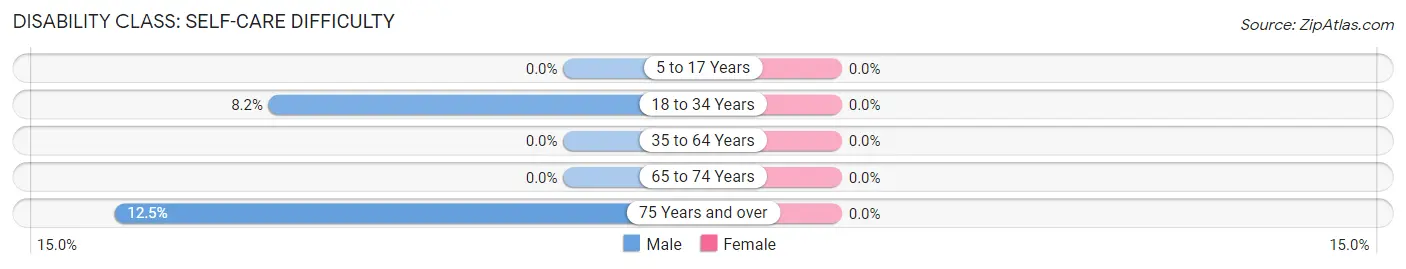
| Age Bracket | Male | Female |
| 5 to 17 Years | 0 (0.0%) | 0 (0.0%) |
| 18 to 34 Years | 5 (8.2%) | 0 (0.0%) |
| 35 to 64 Years | 0 (0.0%) | 0 (0.0%) |
| 65 to 74 Years | 0 (0.0%) | 0 (0.0%) |
| 75 Years and over | 2 (12.5%) | 0 (0.0%) |
Technology Access in Manistee Lake
Computing Device Access in Manistee Lake
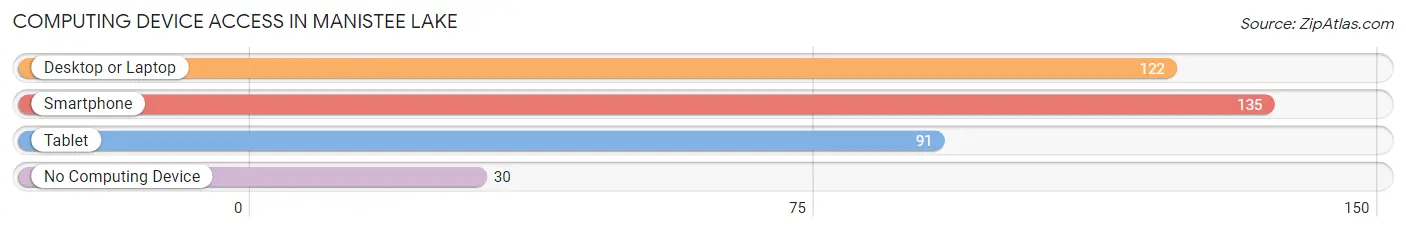
| Device Type | # Households | % Households |
| Desktop or Laptop | 122 | 69.3% |
| Smartphone | 135 | 76.7% |
| Tablet | 91 | 51.7% |
| No Computing Device | 30 | 17.1% |
| Total | 176 | 100.0% |
Internet Access in Manistee Lake
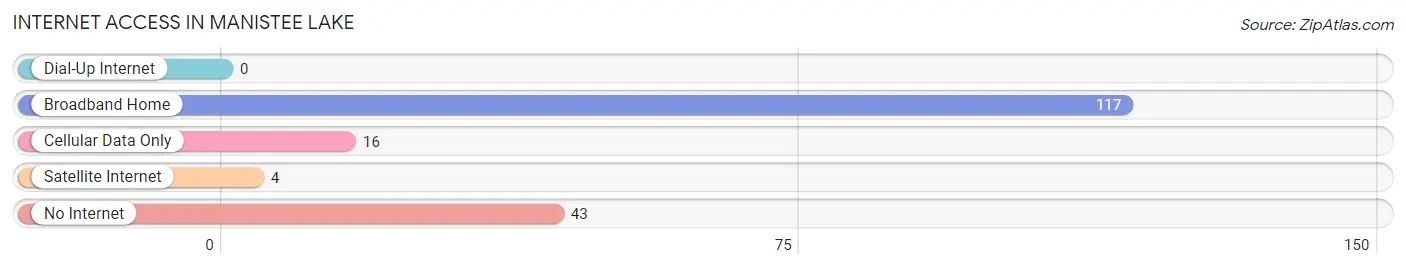
| Internet Type | # Households | % Households |
| Dial-Up Internet | 0 | 0.0% |
| Broadband Home | 117 | 66.5% |
| Cellular Data Only | 16 | 9.1% |
| Satellite Internet | 4 | 2.3% |
| No Internet | 43 | 24.4% |
| Total | 176 | 100.0% |
Manistee Lake Summary
Manistee Lake is a small lake located in Manistee County, Michigan. It is located in the northwest corner of the state, just south of Lake Michigan. The lake is approximately 1,000 acres in size and is surrounded by the Manistee National Forest. The lake is a popular destination for fishing, boating, and swimming.
History
Manistee Lake was originally inhabited by the Anishinaabe people, who were part of the Ojibwe Nation. The lake was a popular fishing spot for the Anishinaabe, and they used the lake for transportation and trade. The lake was also used for spiritual ceremonies and gatherings.
In the late 1800s, the lake was settled by European settlers. The settlers built a sawmill on the lake, which was used to harvest the abundant timber in the area. The sawmill was eventually replaced by a paper mill, which operated until the early 1900s.
The lake was also a popular destination for recreational activities. In the early 1900s, the lake was a popular spot for swimming, fishing, and boating. The lake was also used for ice fishing in the winter months.
Geography
Manistee Lake is located in the northwest corner of Michigan, just south of Lake Michigan. The lake is approximately 1,000 acres in size and is surrounded by the Manistee National Forest. The lake is fed by several small streams and is drained by the Manistee River. The lake is relatively shallow, with an average depth of only 10 feet.
The lake is surrounded by a variety of habitats, including wetlands, hardwood forests, and coniferous forests. The lake is home to a variety of wildlife, including bald eagles, ospreys, loons, and beavers.
Economy
Manistee Lake is a popular destination for recreational activities, such as fishing, boating, and swimming. The lake is also a popular destination for camping, hiking, and bird watching. The lake is also home to several marinas, which offer boat rentals and other services.
The lake is also home to several businesses, including restaurants, hotels, and resorts. The lake is also home to several charter fishing companies, which offer guided fishing trips.
Demographics
Manistee Lake is located in Manistee County, Michigan. As of the 2010 census, the population of Manistee County was 24,733. The population of Manistee Lake is not available, as the lake is not an incorporated municipality.
The population of Manistee County is predominantly white, with a small minority population. The median household income in Manistee County is $41,945, and the median home value is $117,400. The unemployment rate in Manistee County is 8.2%, which is slightly higher than the national average.
Common Questions
What is the Total Population of Manistee Lake?
Total Population of Manistee Lake is 366.
What is the Total Male Population of Manistee Lake?
Total Male Population of Manistee Lake is 221.
What is the Total Female Population of Manistee Lake?
Total Female Population of Manistee Lake is 145.
What is the Ratio of Males per 100 Females in Manistee Lake?
There are 152.41 Males per 100 Females in Manistee Lake.
What is the Ratio of Females per 100 Males in Manistee Lake?
There are 65.61 Females per 100 Males in Manistee Lake.
What is the Median Population Age in Manistee Lake?
Median Population Age in Manistee Lake is 53.7 Years.
What is the Average Family Size in Manistee Lake
Average Family Size in Manistee Lake is 2.7 People.
What is the Average Household Size in Manistee Lake
Average Household Size in Manistee Lake is 2.1 People.
What is Per Capita Income in Manistee Lake?
Per Capita income in Manistee Lake is $30,517.
What is the Median Family Income in Manistee Lake?
Median Family Income in Manistee Lake is $57,708.
What is the Median Household income in Manistee Lake?
Median Household Income in Manistee Lake is $51,477.
What is Income or Wage Gap in Manistee Lake?
Income or Wage Gap in Manistee Lake is 54.1%.
Women in Manistee Lake earn 45.9 cents for every dollar earned by a man.
What is Inequality or Gini Index in Manistee Lake?
Inequality or Gini Index in Manistee Lake is 0.39.
How Large is the Labor Force in Manistee Lake?
There are 130 People in the Labor Forcein in Manistee Lake.
What is the Percentage of People in the Labor Force in Manistee Lake?
39.3% of People are in the Labor Force in Manistee Lake.