Cities with the Highest Percentage of Population Employed in Mining, Quarrying, & Extraction in Pennsylvania
RELATED REPORTS & OPTIONS
Mining, Quarrying, & Extraction
Pennsylvania
Compare Cities
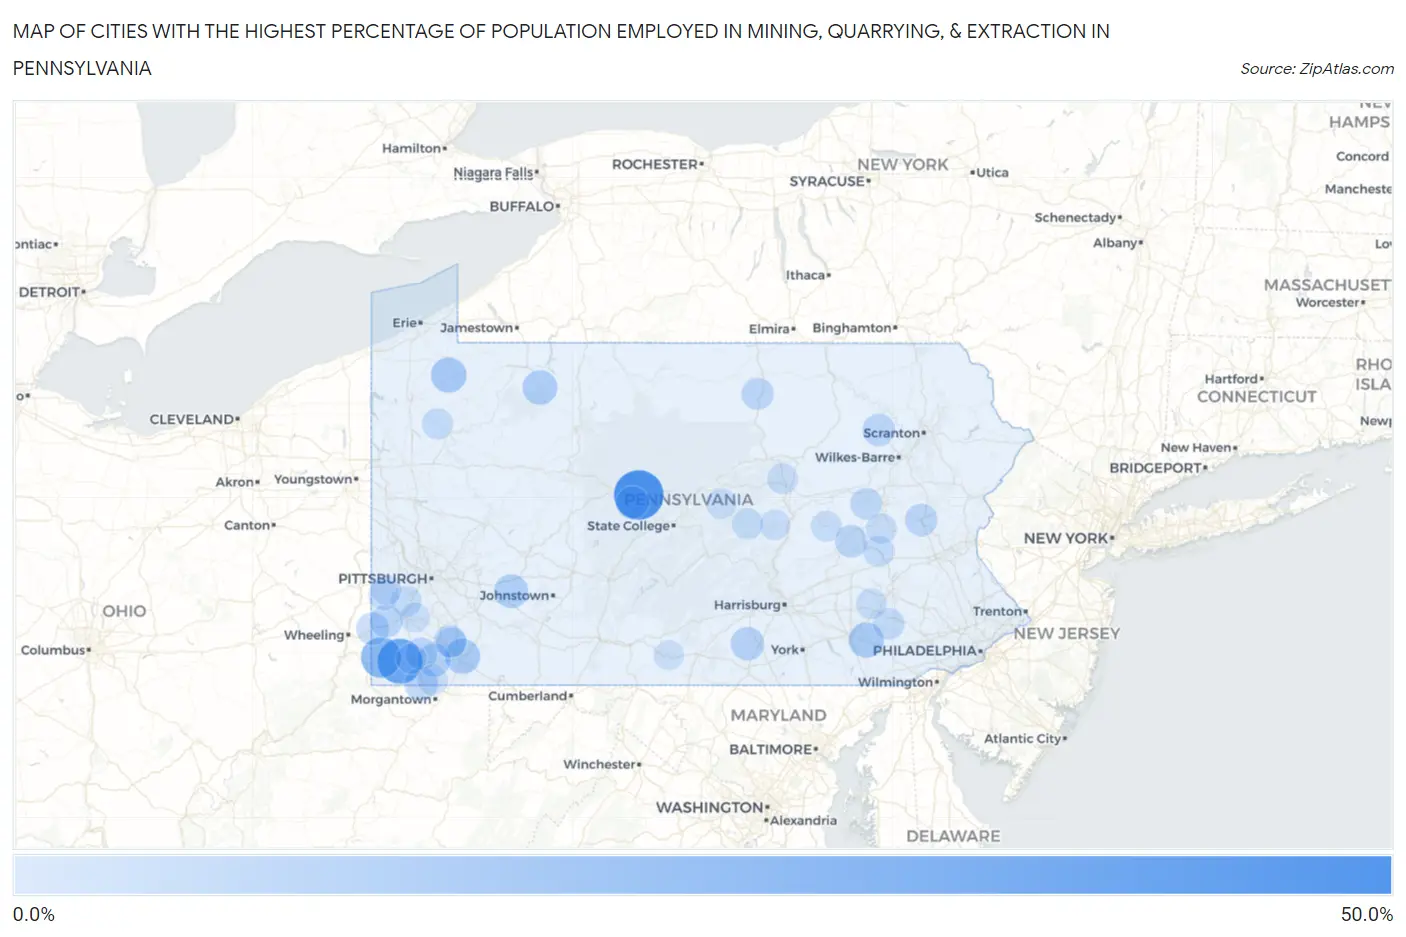
Map of Cities with the Highest Percentage of Population Employed in Mining, Quarrying, & Extraction in Pennsylvania
0.0%
50.0%
Cities with the Highest Percentage of Population Employed in Mining, Quarrying, & Extraction in Pennsylvania
| City | % Employed | vs State | vs National | |
| 1. | Kylertown | 48.7% | 0.36%(+48.4)#1 | 0.44%(+48.3)#44 |
| 2. | Rogersville | 37.6% | 0.36%(+37.2)#2 | 0.44%(+37.1)#79 |
| 3. | Wind Ridge | 26.9% | 0.36%(+26.5)#3 | 0.44%(+26.4)#147 |
| 4. | Fayette City Borough | 16.2% | 0.36%(+15.9)#4 | 0.44%(+15.8)#362 |
| 5. | Lincolnville | 15.4% | 0.36%(+15.0)#5 | 0.44%(+14.9)#390 |
| 6. | Ronks | 15.0% | 0.36%(+14.6)#6 | 0.44%(+14.5)#411 |
| 7. | Oliver | 14.7% | 0.36%(+14.3)#7 | 0.44%(+14.3)#429 |
| 8. | Alba Borough | 14.5% | 0.36%(+14.1)#8 | 0.44%(+14.0)#446 |
| 9. | Elderton Borough | 14.4% | 0.36%(+14.1)#9 | 0.44%(+14.0)#448 |
| 10. | New Albany Borough | 14.3% | 0.36%(+13.9)#10 | 0.44%(+13.8)#455 |
| 11. | Troutville Borough | 13.7% | 0.36%(+13.3)#11 | 0.44%(+13.3)#480 |
| 12. | Sheffield | 13.6% | 0.36%(+13.3)#12 | 0.44%(+13.2)#484 |
| 13. | Millwood | 12.3% | 0.36%(+11.9)#13 | 0.44%(+11.8)#579 |
| 14. | Marianna Borough | 12.3% | 0.36%(+11.9)#14 | 0.44%(+11.8)#580 |
| 15. | Newburg Borough Clearfield County | 12.0% | 0.36%(+11.6)#15 | 0.44%(+11.6)#595 |
| 16. | Mount Morris | 11.3% | 0.36%(+11.0)#16 | 0.44%(+10.9)#647 |
| 17. | Fairdale | 11.2% | 0.36%(+10.8)#17 | 0.44%(+10.7)#662 |
| 18. | Gardners | 11.1% | 0.36%(+10.8)#18 | 0.44%(+10.7)#669 |
| 19. | Friendsville Borough | 10.4% | 0.36%(+10.1)#19 | 0.44%(+9.98)#723 |
| 20. | Smithfield Borough | 10.3% | 0.36%(+9.96)#20 | 0.44%(+9.88)#729 |
| 21. | Jefferson Borough Greene County | 10.1% | 0.36%(+9.73)#21 | 0.44%(+9.64)#751 |
| 22. | Morrisdale | 9.8% | 0.36%(+9.44)#22 | 0.44%(+9.35)#780 |
| 23. | Frisco | 9.2% | 0.36%(+8.89)#23 | 0.44%(+8.81)#829 |
| 24. | Salona | 9.2% | 0.36%(+8.87)#24 | 0.44%(+8.79)#835 |
| 25. | West Alexander | 9.2% | 0.36%(+8.84)#25 | 0.44%(+8.76)#838 |
| 26. | Taylorstown | 9.1% | 0.36%(+8.73)#26 | 0.44%(+8.65)#847 |
| 27. | Grindstone | 8.9% | 0.36%(+8.59)#27 | 0.44%(+8.50)#872 |
| 28. | Armagh Borough | 8.9% | 0.36%(+8.53)#28 | 0.44%(+8.45)#879 |
| 29. | Noxen | 8.7% | 0.36%(+8.38)#29 | 0.44%(+8.29)#896 |
| 30. | Greensboro Borough | 8.7% | 0.36%(+8.36)#30 | 0.44%(+8.28)#898 |
| 31. | Mather | 8.7% | 0.36%(+8.34)#31 | 0.44%(+8.26)#902 |
| 32. | Forestville | 8.6% | 0.36%(+8.20)#32 | 0.44%(+8.12)#931 |
| 33. | Weissport East | 8.6% | 0.36%(+8.20)#33 | 0.44%(+8.12)#932 |
| 34. | Arnot | 8.4% | 0.36%(+8.08)#34 | 0.44%(+8.00)#939 |
| 35. | Liberty Borough Tioga County | 8.4% | 0.36%(+8.06)#35 | 0.44%(+7.98)#942 |
| 36. | Oswayo Borough | 8.0% | 0.36%(+7.64)#36 | 0.44%(+7.56)#1,001 |
| 37. | Jennerstown Borough | 7.9% | 0.36%(+7.57)#37 | 0.44%(+7.48)#1,013 |
| 38. | Brownsville Borough | 7.9% | 0.36%(+7.55)#38 | 0.44%(+7.46)#1,015 |
| 39. | Lewis Run Borough | 7.8% | 0.36%(+7.47)#39 | 0.44%(+7.39)#1,023 |
| 40. | Rices Landing Borough | 7.1% | 0.36%(+6.79)#40 | 0.44%(+6.70)#1,122 |
| 41. | Nuremberg | 7.1% | 0.36%(+6.79)#41 | 0.44%(+6.70)#1,127 |
| 42. | Atwood Borough | 6.9% | 0.36%(+6.59)#42 | 0.44%(+6.50)#1,165 |
| 43. | Churchtown | 6.8% | 0.36%(+6.42)#43 | 0.44%(+6.34)#1,193 |
| 44. | Mill Creek Borough | 6.7% | 0.36%(+6.31)#44 | 0.44%(+6.23)#1,216 |
| 45. | Volant Borough | 6.7% | 0.36%(+6.31)#45 | 0.44%(+6.23)#1,219 |
| 46. | Tioga Borough | 6.6% | 0.36%(+6.28)#46 | 0.44%(+6.20)#1,225 |
| 47. | Oreminea | 6.4% | 0.36%(+6.03)#47 | 0.44%(+5.94)#1,275 |
| 48. | Le Raysville Borough | 6.2% | 0.36%(+5.85)#48 | 0.44%(+5.77)#1,310 |
| 49. | South Renovo Borough | 6.0% | 0.36%(+5.67)#49 | 0.44%(+5.58)#1,352 |
| 50. | Garrett Borough | 6.0% | 0.36%(+5.64)#50 | 0.44%(+5.56)#1,356 |
| 51. | Deer Lake | 6.0% | 0.36%(+5.61)#51 | 0.44%(+5.53)#1,363 |
| 52. | Hannasville | 6.0% | 0.36%(+5.61)#52 | 0.44%(+5.53)#1,365 |
| 53. | Wallaceton Borough | 5.9% | 0.36%(+5.57)#53 | 0.44%(+5.49)#1,369 |
| 54. | Muse | 5.6% | 0.36%(+5.21)#54 | 0.44%(+5.12)#1,451 |
| 55. | Hallstead Borough | 5.5% | 0.36%(+5.17)#55 | 0.44%(+5.08)#1,460 |
| 56. | Troxelville | 5.5% | 0.36%(+5.14)#56 | 0.44%(+5.05)#1,477 |
| 57. | Montrose Borough | 5.3% | 0.36%(+4.96)#57 | 0.44%(+4.87)#1,518 |
| 58. | Reinholds | 5.3% | 0.36%(+4.93)#58 | 0.44%(+4.85)#1,523 |
| 59. | Tuscarora | 5.3% | 0.36%(+4.91)#59 | 0.44%(+4.82)#1,527 |
| 60. | Ranshaw | 5.2% | 0.36%(+4.87)#60 | 0.44%(+4.79)#1,537 |
| 61. | Cokeburg Borough | 5.2% | 0.36%(+4.83)#61 | 0.44%(+4.75)#1,552 |
| 62. | Tunnelhill Borough | 5.2% | 0.36%(+4.81)#62 | 0.44%(+4.73)#1,561 |
| 63. | Rowes Run | 5.1% | 0.36%(+4.74)#63 | 0.44%(+4.66)#1,580 |
| 64. | Rockhill Borough | 5.0% | 0.36%(+4.67)#64 | 0.44%(+4.59)#1,597 |
| 65. | Worthville Borough | 5.0% | 0.36%(+4.64)#65 | 0.44%(+4.56)#1,605 |
| 66. | Irvona Borough | 5.0% | 0.36%(+4.62)#66 | 0.44%(+4.54)#1,609 |
| 67. | Houtzdale Borough | 4.9% | 0.36%(+4.58)#67 | 0.44%(+4.50)#1,621 |
| 68. | Orbisonia Borough | 4.9% | 0.36%(+4.58)#68 | 0.44%(+4.50)#1,623 |
| 69. | Allenwood | 4.9% | 0.36%(+4.57)#69 | 0.44%(+4.49)#1,626 |
| 70. | New Centerville Borough | 4.9% | 0.36%(+4.56)#70 | 0.44%(+4.48)#1,628 |
| 71. | Karns City Borough | 4.9% | 0.36%(+4.52)#71 | 0.44%(+4.44)#1,638 |
| 72. | Bobtown | 4.8% | 0.36%(+4.46)#72 | 0.44%(+4.38)#1,655 |
| 73. | Boswell Borough | 4.8% | 0.36%(+4.40)#73 | 0.44%(+4.31)#1,679 |
| 74. | Dunbar Borough | 4.7% | 0.36%(+4.37)#74 | 0.44%(+4.29)#1,685 |
| 75. | Bentleyville Borough | 4.6% | 0.36%(+4.25)#75 | 0.44%(+4.17)#1,725 |
| 76. | Sylvania Borough | 4.6% | 0.36%(+4.24)#76 | 0.44%(+4.16)#1,729 |
| 77. | Schuylkill Haven Borough | 4.5% | 0.36%(+4.12)#77 | 0.44%(+4.03)#1,773 |
| 78. | Rebersburg | 4.5% | 0.36%(+4.11)#78 | 0.44%(+4.03)#1,774 |
| 79. | Corsica Borough | 4.4% | 0.36%(+4.09)#79 | 0.44%(+4.00)#1,783 |
| 80. | Cross Creek | 4.3% | 0.36%(+3.99)#80 | 0.44%(+3.91)#1,820 |
| 81. | Burlington Borough | 4.3% | 0.36%(+3.99)#81 | 0.44%(+3.91)#1,822 |
| 82. | Long Branch Borough | 4.3% | 0.36%(+3.97)#82 | 0.44%(+3.89)#1,824 |
| 83. | Roscoe Borough | 4.3% | 0.36%(+3.92)#83 | 0.44%(+3.84)#1,832 |
| 84. | Kreamer | 4.2% | 0.36%(+3.88)#84 | 0.44%(+3.80)#1,846 |
| 85. | Slovan | 4.2% | 0.36%(+3.87)#85 | 0.44%(+3.79)#1,851 |
| 86. | Morrisville | 4.2% | 0.36%(+3.83)#86 | 0.44%(+3.75)#1,870 |
| 87. | Mount Pocono Borough | 4.1% | 0.36%(+3.75)#87 | 0.44%(+3.67)#1,897 |
| 88. | Glasgow Borough | 4.1% | 0.36%(+3.72)#88 | 0.44%(+3.64)#1,914 |
| 89. | Susquehanna Depot Borough | 4.1% | 0.36%(+3.71)#89 | 0.44%(+3.62)#1,918 |
| 90. | Waymart Borough | 4.0% | 0.36%(+3.64)#90 | 0.44%(+3.56)#1,938 |
| 91. | New Milford Borough | 4.0% | 0.36%(+3.64)#91 | 0.44%(+3.56)#1,939 |
| 92. | West Brownsville Borough | 3.9% | 0.36%(+3.55)#92 | 0.44%(+3.47)#1,985 |
| 93. | Salisbury Borough | 3.9% | 0.36%(+3.51)#93 | 0.44%(+3.43)#2,005 |
| 94. | Fort Loudon | 3.8% | 0.36%(+3.40)#94 | 0.44%(+3.32)#2,051 |
| 95. | Canonsburg Borough | 3.7% | 0.36%(+3.37)#95 | 0.44%(+3.28)#2,069 |
| 96. | Eighty Four | 3.7% | 0.36%(+3.36)#96 | 0.44%(+3.28)#2,071 |
| 97. | Rome Borough | 3.7% | 0.36%(+3.31)#97 | 0.44%(+3.22)#2,090 |
| 98. | Spartansburg Borough | 3.6% | 0.36%(+3.28)#98 | 0.44%(+3.20)#2,101 |
| 99. | Pennsburg Borough | 3.6% | 0.36%(+3.22)#99 | 0.44%(+3.14)#2,132 |
| 100. | Blossburg Borough | 3.6% | 0.36%(+3.21)#100 | 0.44%(+3.12)#2,145 |
Common Questions
What are the Top 10 Cities with the Highest Percentage of Population Employed in Mining, Quarrying, & Extraction in Pennsylvania?
Top 10 Cities with the Highest Percentage of Population Employed in Mining, Quarrying, & Extraction in Pennsylvania are:
#1
48.7%
#2
37.6%
#3
26.9%
#4
15.4%
#5
15.0%
#6
14.7%
#7
13.6%
#8
12.3%
#9
11.3%
#10
11.2%
What city has the Highest Percentage of Population Employed in Mining, Quarrying, & Extraction in Pennsylvania?
Kylertown has the Highest Percentage of Population Employed in Mining, Quarrying, & Extraction in Pennsylvania with 48.7%.
What is the Percentage of Population Employed in Mining, Quarrying, & Extraction in the State of Pennsylvania?
Percentage of Population Employed in Mining, Quarrying, & Extraction in Pennsylvania is 0.36%.
What is the Percentage of Population Employed in Mining, Quarrying, & Extraction in the United States?
Percentage of Population Employed in Mining, Quarrying, & Extraction in the United States is 0.44%.