Beulah, MI
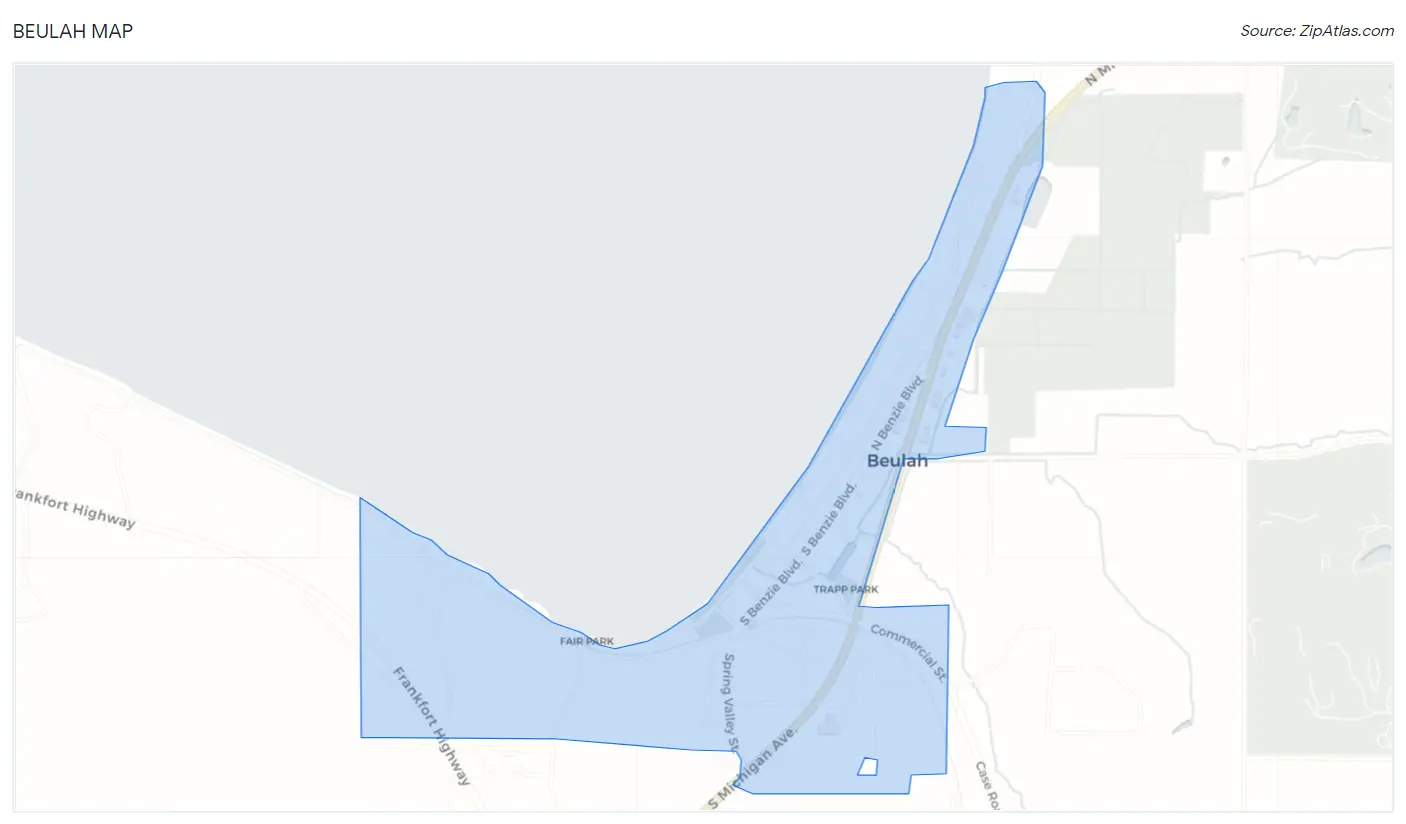
Beulah Map
Beulah Overview
200
TOTAL POPULATION
100
MALE POPULATION
100
FEMALE POPULATION
100.00
MALES / 100 FEMALES
100.00
FEMALES / 100 MALES
61.5
MEDIAN AGE
2.4
AVG FAMILY SIZE
1.8
AVG HOUSEHOLD SIZE
$38,872
PER CAPITA INCOME
$103,750
AVG FAMILY INCOME
$70,750
AVG HOUSEHOLD INCOME
0.52
INEQUALITY / GINI INDEX
52
LABOR FORCE [ PEOPLE ]
27.2%
PERCENT IN LABOR FORCE
5.8%
UNEMPLOYMENT RATE
Beulah Zip Codes
Beulah Area Codes
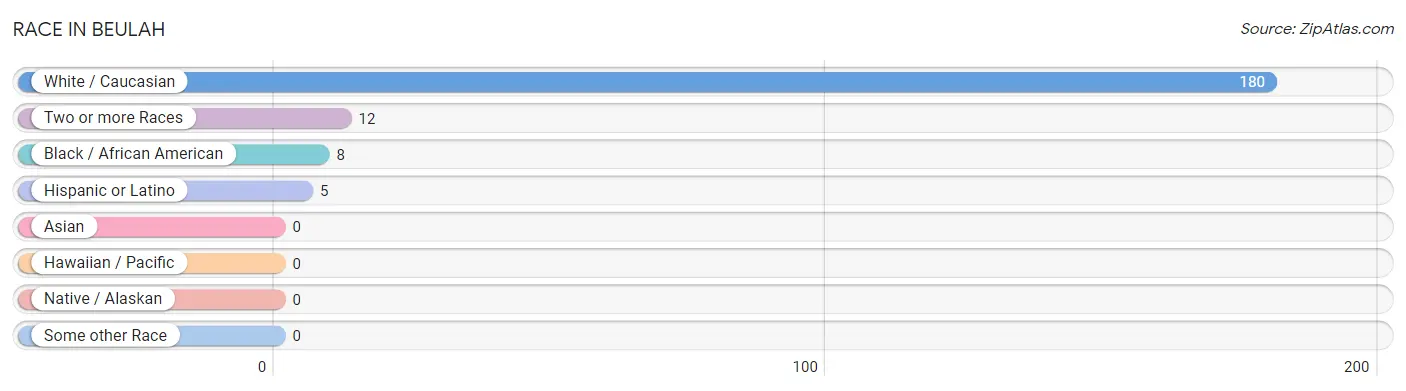
Race in Beulah
The most populous races in Beulah are White / Caucasian (180 | 90.0%), Two or more Races (12 | 6.0%), and Black / African American (8 | 4.0%).
| Race | # Population | % Population |
| Asian | 0 | 0.0% |
| Black / African American | 8 | 4.0% |
| Hawaiian / Pacific | 0 | 0.0% |
| Hispanic or Latino | 5 | 2.5% |
| Native / Alaskan | 0 | 0.0% |
| White / Caucasian | 180 | 90.0% |
| Two or more Races | 12 | 6.0% |
| Some other Race | 0 | 0.0% |
| Total | 200 | 100.0% |
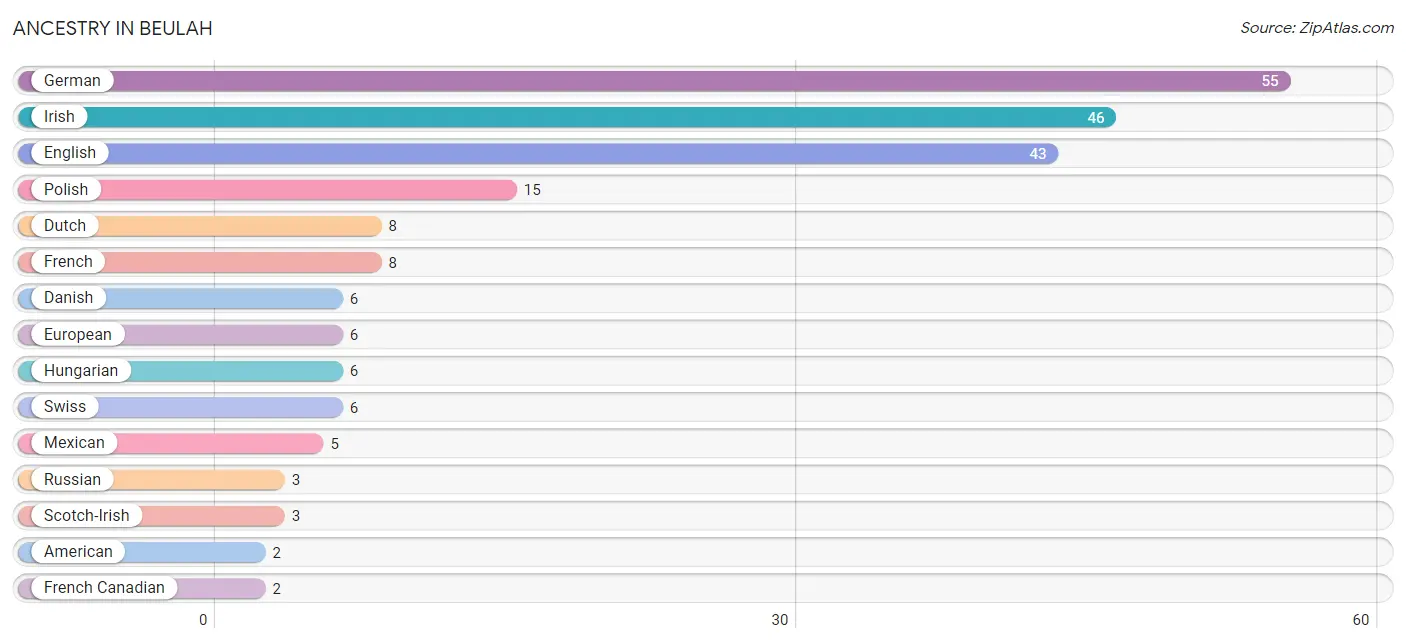
Ancestry in Beulah
The most populous ancestries reported in Beulah are German (55 | 27.5%), Irish (46 | 23.0%), English (43 | 21.5%), Polish (15 | 7.5%), and Dutch (8 | 4.0%), together accounting for 83.5% of all Beulah residents.
| Ancestry | # Population | % Population |
| American | 2 | 1.0% |
| Danish | 6 | 3.0% |
| Dutch | 8 | 4.0% |
| English | 43 | 21.5% |
| European | 6 | 3.0% |
| French | 8 | 4.0% |
| French Canadian | 2 | 1.0% |
| German | 55 | 27.5% |
| Hungarian | 6 | 3.0% |
| Irish | 46 | 23.0% |
| Lithuanian | 2 | 1.0% |
| Mexican | 5 | 2.5% |
| Norwegian | 2 | 1.0% |
| Polish | 15 | 7.5% |
| Russian | 3 | 1.5% |
| Scandinavian | 2 | 1.0% |
| Scotch-Irish | 3 | 1.5% |
| Scottish | 2 | 1.0% |
| Swedish | 2 | 1.0% |
| Swiss | 6 | 3.0% |
| Welsh | 2 | 1.0% | View All 21 Rows |
Immigrants in Beulah

| Immigration Origin | # Population | % Population | View All 0 Rows |
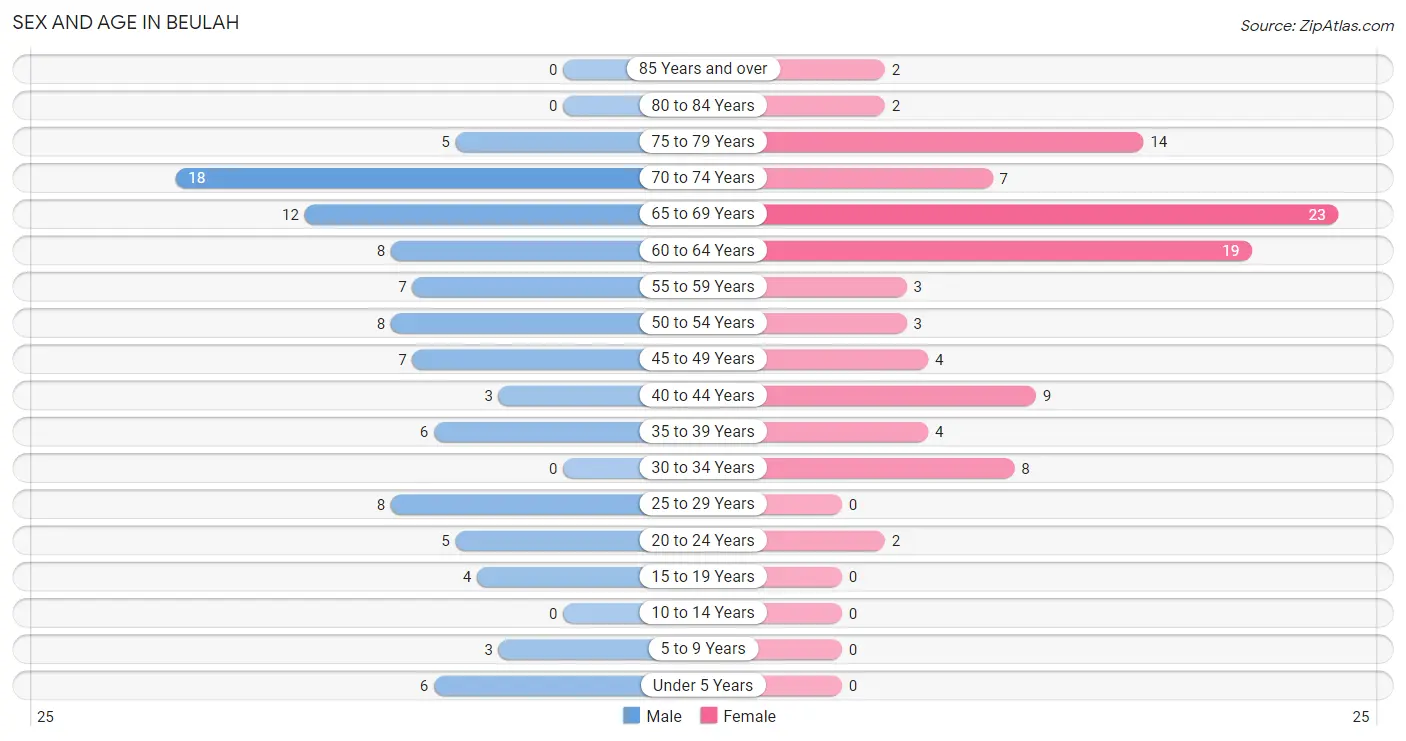
Sex and Age in Beulah
Sex and Age in Beulah
The most populous age groups in Beulah are 70 to 74 Years (18 | 18.0%) for men and 65 to 69 Years (23 | 23.0%) for women.
| Age Bracket | Male | Female |
| Under 5 Years | 6 (6.0%) | 0 (0.0%) |
| 5 to 9 Years | 3 (3.0%) | 0 (0.0%) |
| 10 to 14 Years | 0 (0.0%) | 0 (0.0%) |
| 15 to 19 Years | 4 (4.0%) | 0 (0.0%) |
| 20 to 24 Years | 5 (5.0%) | 2 (2.0%) |
| 25 to 29 Years | 8 (8.0%) | 0 (0.0%) |
| 30 to 34 Years | 0 (0.0%) | 8 (8.0%) |
| 35 to 39 Years | 6 (6.0%) | 4 (4.0%) |
| 40 to 44 Years | 3 (3.0%) | 9 (9.0%) |
| 45 to 49 Years | 7 (7.0%) | 4 (4.0%) |
| 50 to 54 Years | 8 (8.0%) | 3 (3.0%) |
| 55 to 59 Years | 7 (7.0%) | 3 (3.0%) |
| 60 to 64 Years | 8 (8.0%) | 19 (19.0%) |
| 65 to 69 Years | 12 (12.0%) | 23 (23.0%) |
| 70 to 74 Years | 18 (18.0%) | 7 (7.0%) |
| 75 to 79 Years | 5 (5.0%) | 14 (14.0%) |
| 80 to 84 Years | 0 (0.0%) | 2 (2.0%) |
| 85 Years and over | 0 (0.0%) | 2 (2.0%) |
| Total | 100 (100.0%) | 100 (100.0%) |
Families and Households in Beulah
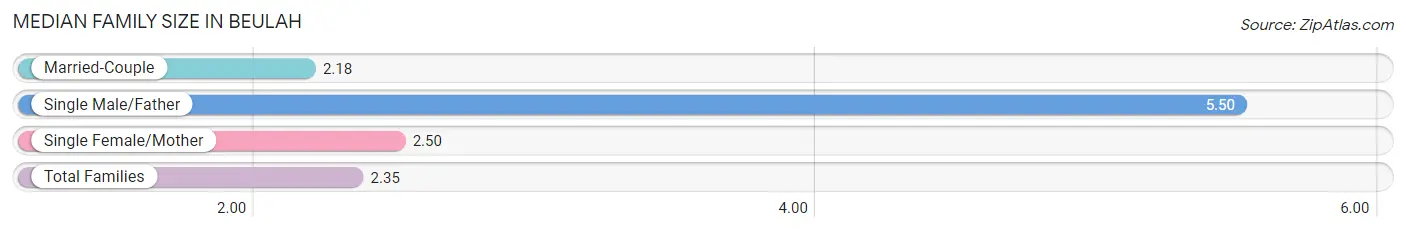
Median Family Size in Beulah
The median family size in Beulah is 2.35 persons per family, with single male/father families (2 | 4.6%) accounting for the largest median family size of 5.5 persons per family. On the other hand, married-couple families (39 | 90.7%) represent the smallest median family size with 2.18 persons per family.
| Family Type | # Families | Family Size |
| Married-Couple | 39 (90.7%) | 2.18 |
| Single Male/Father | 2 (4.6%) | 5.50 |
| Single Female/Mother | 2 (4.6%) | 2.50 |
| Total Families | 43 (100.0%) | 2.35 |
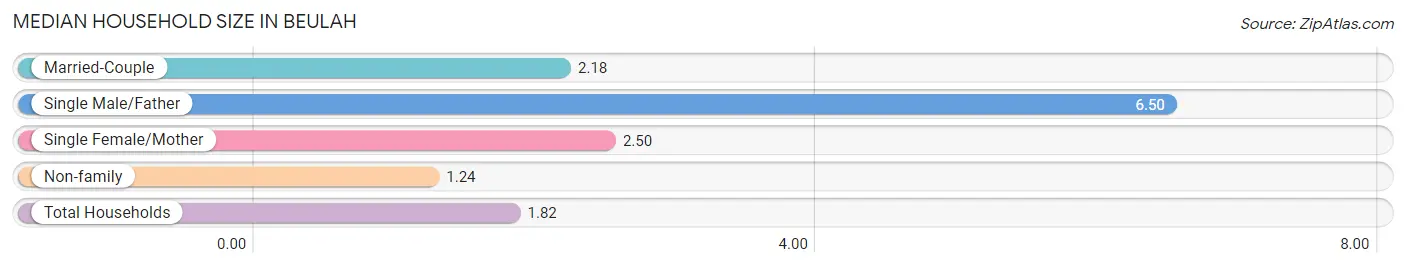
Median Household Size in Beulah
The median household size in Beulah is 1.82 persons per household, with single male/father households (2 | 2.4%) accounting for the largest median household size of 6.5 persons per household. non-family households (42 | 49.4%) represent the smallest median household size with 1.24 persons per household.
| Household Type | # Households | Household Size |
| Married-Couple | 39 (45.9%) | 2.18 |
| Single Male/Father | 2 (2.4%) | 6.50 |
| Single Female/Mother | 2 (2.4%) | 2.50 |
| Non-family | 42 (49.4%) | 1.24 |
| Total Households | 85 (100.0%) | 1.82 |
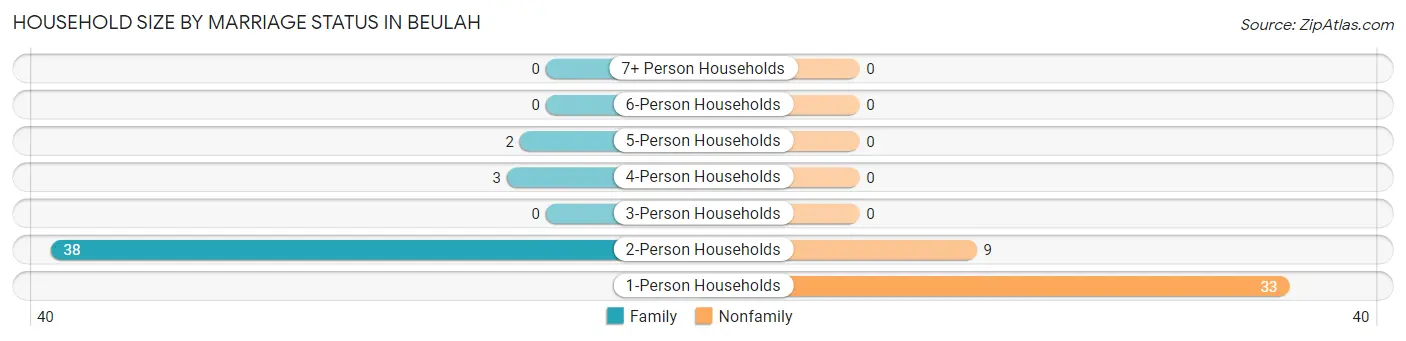
Household Size by Marriage Status in Beulah
Out of a total of 85 households in Beulah, 43 (50.6%) are family households, while 42 (49.4%) are nonfamily households. The most numerous type of family households are 2-person households, comprising 38, and the most common type of nonfamily households are 1-person households, comprising 33.
| Household Size | Family Households | Nonfamily Households |
| 1-Person Households | - | 33 (38.8%) |
| 2-Person Households | 38 (44.7%) | 9 (10.6%) |
| 3-Person Households | 0 (0.0%) | 0 (0.0%) |
| 4-Person Households | 3 (3.5%) | 0 (0.0%) |
| 5-Person Households | 2 (2.4%) | 0 (0.0%) |
| 6-Person Households | 0 (0.0%) | 0 (0.0%) |
| 7+ Person Households | 0 (0.0%) | 0 (0.0%) |
| Total | 43 (50.6%) | 42 (49.4%) |
Female Fertility in Beulah
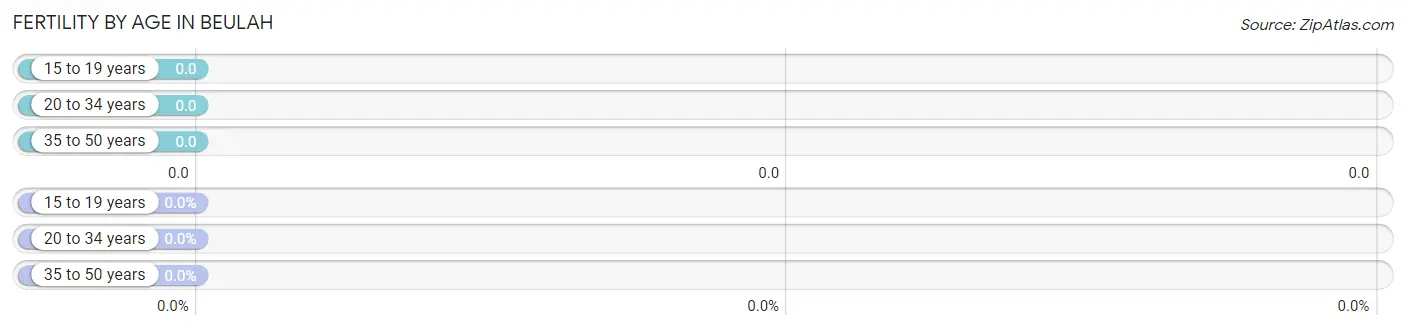
Fertility by Age in Beulah
| Age Bracket | Women with Births | Births / 1,000 Women |
| 15 to 19 years | 0 (0.0%) | 0.0 |
| 20 to 34 years | 0 (0.0%) | 0.0 |
| 35 to 50 years | 0 (0.0%) | 0.0 |
| Total | 0 (0.0%) | 0.0 |
Fertility by Age by Marriage Status in Beulah
| Age Bracket | Married | Unmarried |
| 15 to 19 years | 0 (0.0%) | 0 (0.0%) |
| 20 to 34 years | 0 (0.0%) | 0 (0.0%) |
| 35 to 50 years | 0 (0.0%) | 0 (0.0%) |
| Total | 0 (0.0%) | 0 (0.0%) |
Fertility by Education in Beulah
| Educational Attainment | Women with Births | Births / 1,000 Women |
| Less than High School | 0 (0.0%) | 0.0 |
| High School Diploma | 0 (0.0%) | 0.0 |
| College or Associate's Degree | 0 (0.0%) | 0.0 |
| Bachelor's Degree | 0 (0.0%) | 0.0 |
| Graduate Degree | 0 (0.0%) | 0.0 |
| Total | 0 (0.0%) | 0.0 |
Fertility by Education by Marriage Status in Beulah
| Educational Attainment | Married | Unmarried |
| Less than High School | 0 (0.0%) | 0 (0.0%) |
| High School Diploma | 0 (0.0%) | 0 (0.0%) |
| College or Associate's Degree | 0 (0.0%) | 0 (0.0%) |
| Bachelor's Degree | 0 (0.0%) | 0 (0.0%) |
| Graduate Degree | 0 (0.0%) | 0 (0.0%) |
| Total | 0 (0.0%) | 0 (0.0%) |
Income in Beulah
Income Overview in Beulah
Per Capita Income in Beulah is $38,872, while median incomes of families and households are $103,750 and $70,750 respectively.
| Characteristic | Number | Measure |
| Per Capita Income | 200 | $38,872 |
| Median Family Income | 43 | $103,750 |
| Mean Family Income | 43 | $140,928 |
| Median Household Income | 85 | $70,750 |
| Mean Household Income | 85 | $90,327 |
| Income Deficit | 43 | $0 |
| Wage / Income Gap (%) | 200 | 0.00% |
| Wage / Income Gap ($) | 200 | 100.00¢ per $1 |
| Gini / Inequality Index | 200 | 0.52 |
Earnings by Sex in Beulah
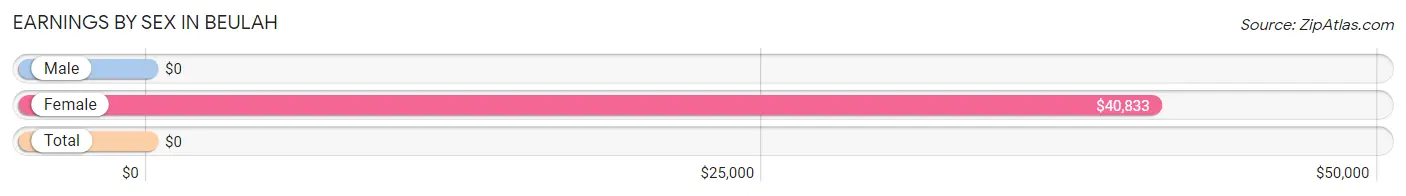
| Sex | Number | Average Earnings |
| Male | 42 (58.3%) | $0 |
| Female | 30 (41.7%) | $40,833 |
| Total | 72 (100.0%) | $0 |
Earnings by Sex by Income Bracket in Beulah
The most common earnings brackets in Beulah are $2,499 or less for men (9 | 21.4%) and $55,000 to $64,999 for women (6 | 20.0%).
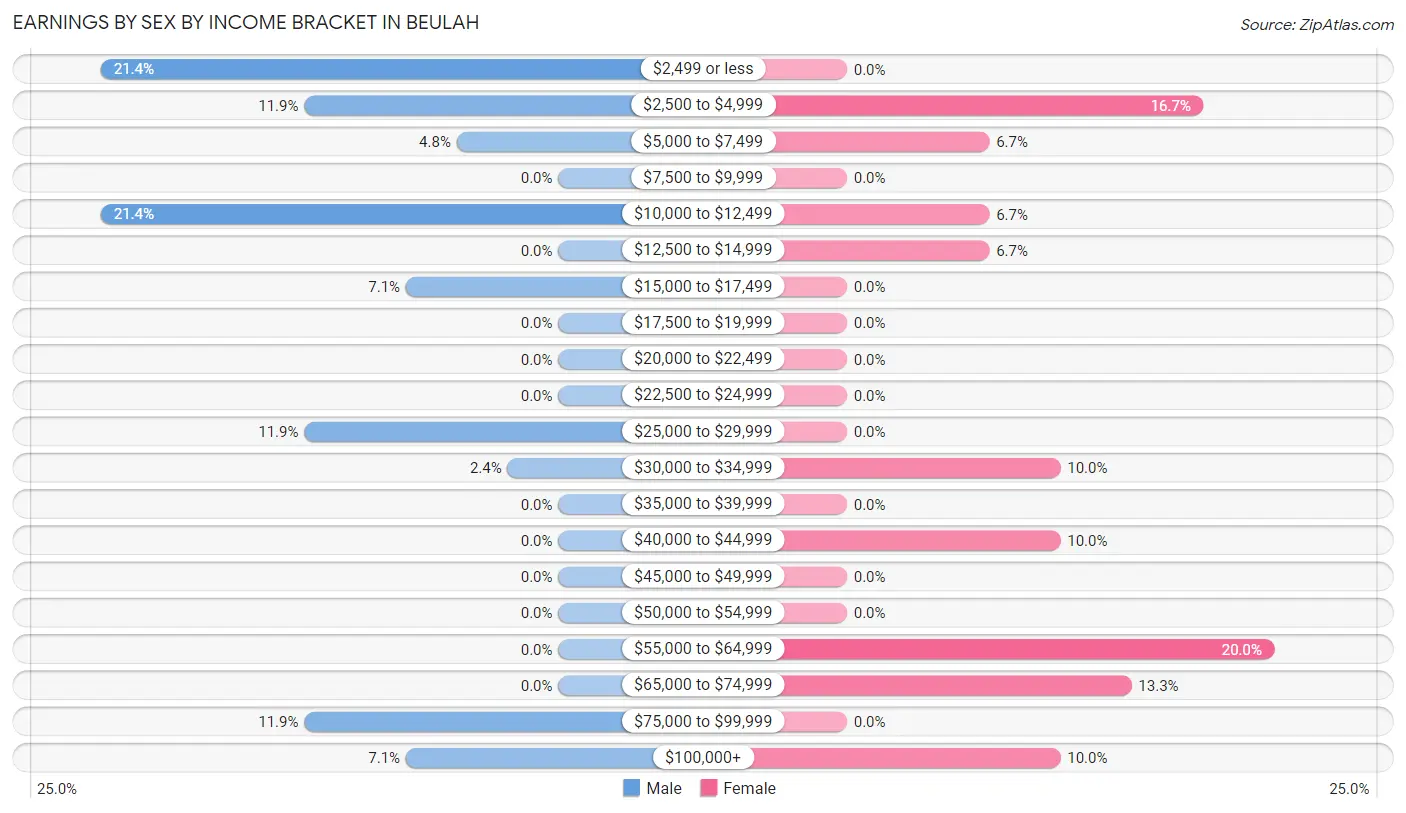
| Income | Male | Female |
| $2,499 or less | 9 (21.4%) | 0 (0.0%) |
| $2,500 to $4,999 | 5 (11.9%) | 5 (16.7%) |
| $5,000 to $7,499 | 2 (4.8%) | 2 (6.7%) |
| $7,500 to $9,999 | 0 (0.0%) | 0 (0.0%) |
| $10,000 to $12,499 | 9 (21.4%) | 2 (6.7%) |
| $12,500 to $14,999 | 0 (0.0%) | 2 (6.7%) |
| $15,000 to $17,499 | 3 (7.1%) | 0 (0.0%) |
| $17,500 to $19,999 | 0 (0.0%) | 0 (0.0%) |
| $20,000 to $22,499 | 0 (0.0%) | 0 (0.0%) |
| $22,500 to $24,999 | 0 (0.0%) | 0 (0.0%) |
| $25,000 to $29,999 | 5 (11.9%) | 0 (0.0%) |
| $30,000 to $34,999 | 1 (2.4%) | 3 (10.0%) |
| $35,000 to $39,999 | 0 (0.0%) | 0 (0.0%) |
| $40,000 to $44,999 | 0 (0.0%) | 3 (10.0%) |
| $45,000 to $49,999 | 0 (0.0%) | 0 (0.0%) |
| $50,000 to $54,999 | 0 (0.0%) | 0 (0.0%) |
| $55,000 to $64,999 | 0 (0.0%) | 6 (20.0%) |
| $65,000 to $74,999 | 0 (0.0%) | 4 (13.3%) |
| $75,000 to $99,999 | 5 (11.9%) | 0 (0.0%) |
| $100,000+ | 3 (7.1%) | 3 (10.0%) |
| Total | 42 (100.0%) | 30 (100.0%) |
Earnings by Sex by Educational Attainment in Beulah
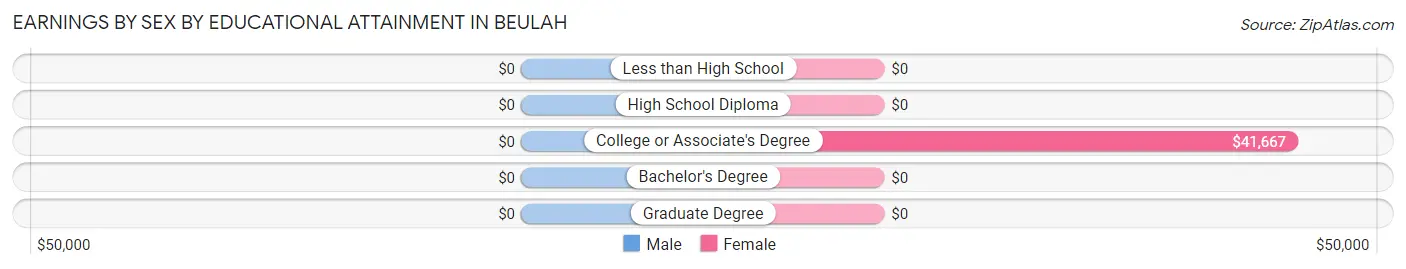
| Educational Attainment | Male Income | Female Income |
| Less than High School | - | - |
| High School Diploma | - | - |
| College or Associate's Degree | - | - |
| Bachelor's Degree | - | - |
| Graduate Degree | - | - |
| Total | - | - |
Family Income in Beulah
Family Income Brackets in Beulah
According to the Beulah family income data, there are 13 families falling into the $100,000 to $149,999 income range, which is the most common income bracket and makes up 30.2% of all families.
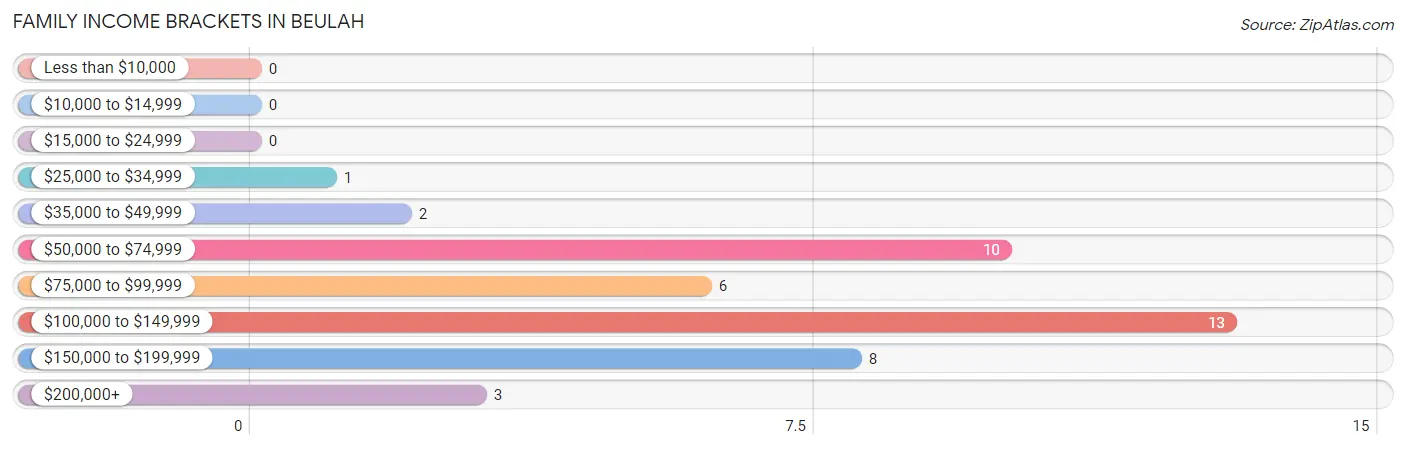
| Income Bracket | # Families | % Families |
| Less than $10,000 | 0 | 0.0% |
| $10,000 to $14,999 | 0 | 0.0% |
| $15,000 to $24,999 | 0 | 0.0% |
| $25,000 to $34,999 | 1 | 2.3% |
| $35,000 to $49,999 | 2 | 4.7% |
| $50,000 to $74,999 | 10 | 23.3% |
| $75,000 to $99,999 | 6 | 14.0% |
| $100,000 to $149,999 | 13 | 30.2% |
| $150,000 to $199,999 | 8 | 18.6% |
| $200,000+ | 3 | 7.0% |
Family Income by Famaliy Size in Beulah
2-person families (38 | 88.4%) account for the highest median family income in Beulah with $103,500 per family, while 2-person families (38 | 88.4%) have the highest median income of $51,750 per family member.
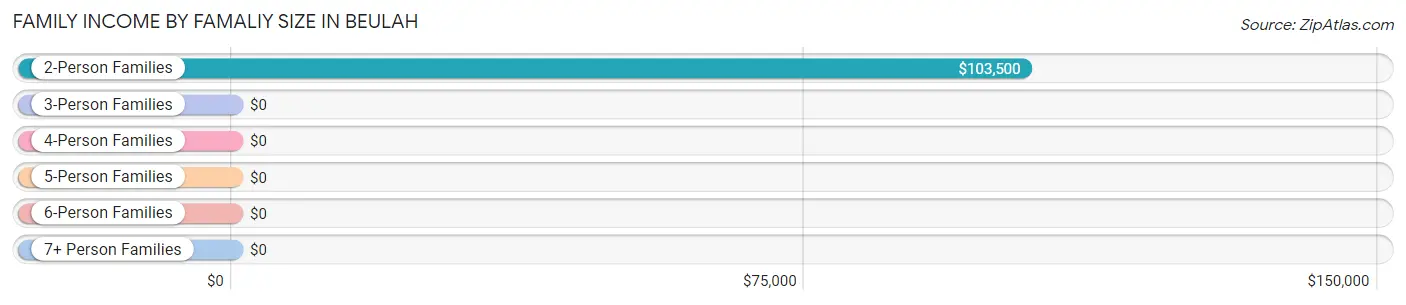
| Income Bracket | # Families | Median Income |
| 2-Person Families | 38 (88.4%) | $103,500 |
| 3-Person Families | 0 (0.0%) | $0 |
| 4-Person Families | 5 (11.6%) | $0 |
| 5-Person Families | 0 (0.0%) | $0 |
| 6-Person Families | 0 (0.0%) | $0 |
| 7+ Person Families | 0 (0.0%) | $0 |
| Total | 43 (100.0%) | $103,750 |
Family Income by Number of Earners in Beulah
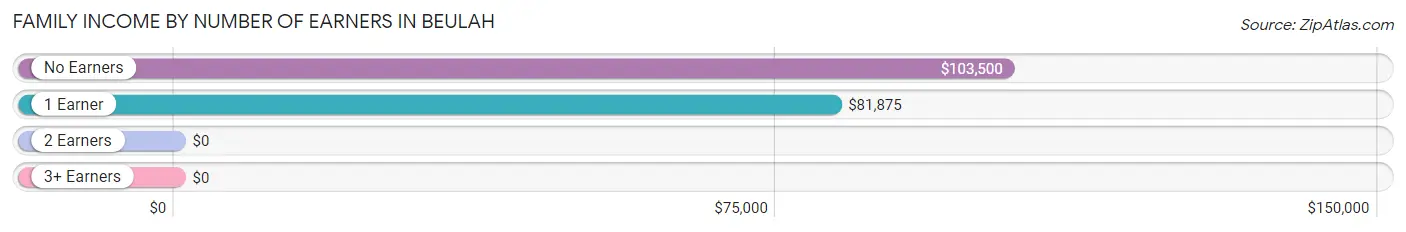
| Number of Earners | # Families | Median Income |
| No Earners | 18 (41.9%) | $103,500 |
| 1 Earner | 15 (34.9%) | $81,875 |
| 2 Earners | 7 (16.3%) | $0 |
| 3+ Earners | 3 (7.0%) | $0 |
| Total | 43 (100.0%) | $103,750 |
Household Income in Beulah
Household Income Brackets in Beulah
With 21 households falling in the category, the $100,000 to $149,999 income range is the most frequent in Beulah, accounting for 24.7% of all households. In contrast, only 2 households (2.4%) fall into the $35,000 to $49,999 income bracket, making it the least populous group.
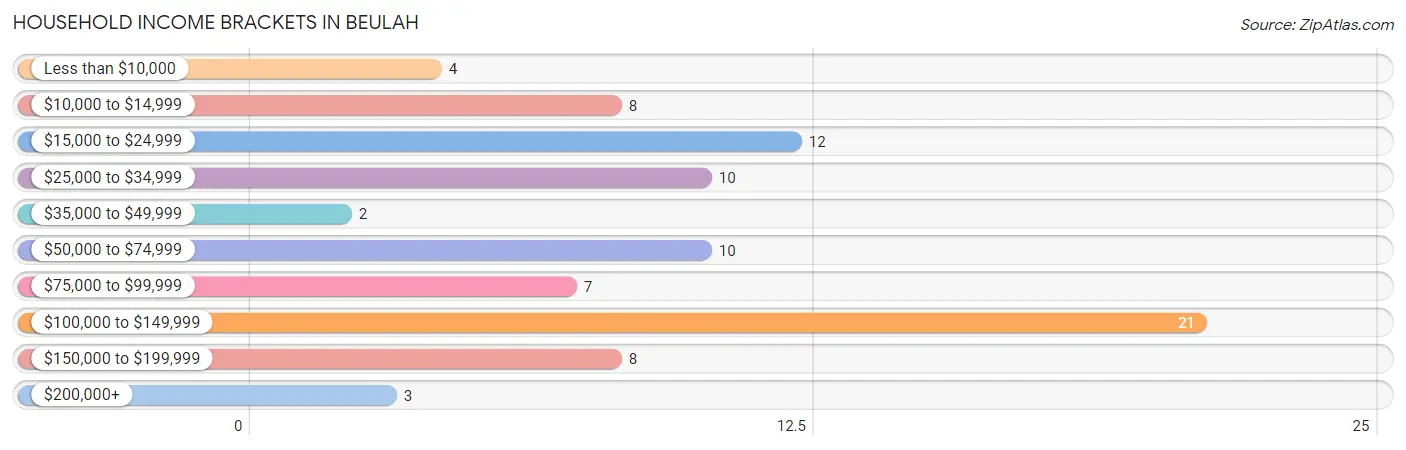
| Income Bracket | # Households | % Households |
| Less than $10,000 | 4 | 4.7% |
| $10,000 to $14,999 | 8 | 9.4% |
| $15,000 to $24,999 | 12 | 14.1% |
| $25,000 to $34,999 | 10 | 11.8% |
| $35,000 to $49,999 | 2 | 2.4% |
| $50,000 to $74,999 | 10 | 11.8% |
| $75,000 to $99,999 | 7 | 8.2% |
| $100,000 to $149,999 | 21 | 24.7% |
| $150,000 to $199,999 | 8 | 9.4% |
| $200,000+ | 3 | 3.5% |
Household Income by Householder Age in Beulah
The median household income in Beulah is $70,750, with the highest median household income of $113,750 found in the 45 to 64 years age bracket for the primary householder. A total of 28 households (32.9%) fall into this category.
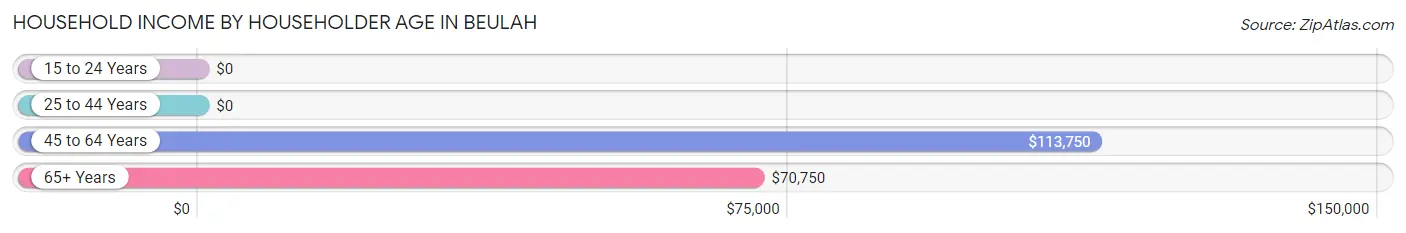
| Income Bracket | # Households | Median Income |
| 15 to 24 Years | 0 (0.0%) | $0 |
| 25 to 44 Years | 4 (4.7%) | $0 |
| 45 to 64 Years | 28 (32.9%) | $113,750 |
| 65+ Years | 53 (62.4%) | $70,750 |
| Total | 85 (100.0%) | $70,750 |
Poverty in Beulah
Income Below Poverty by Sex and Age in Beulah
With 12.0% poverty level for males and 22.5% for females among the residents of Beulah, 35 to 44 year old males and 35 to 44 year old females are the most vulnerable to poverty, with 2 males (40.0%) and 4 females (100.0%) in their respective age groups living below the poverty level.
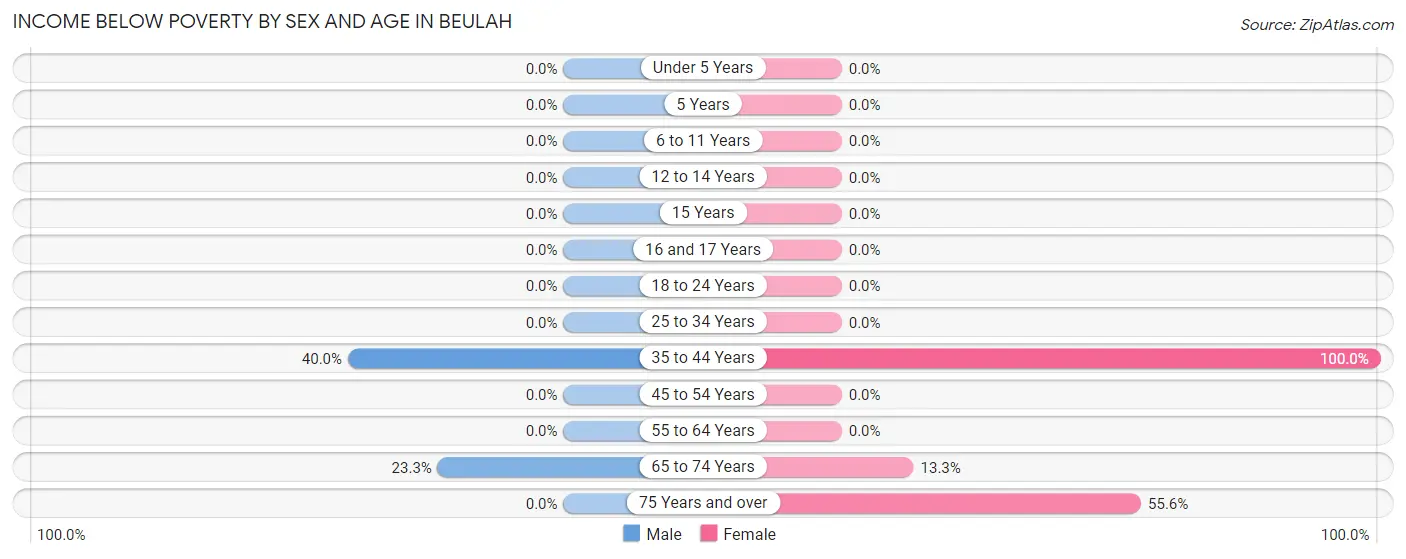
| Age Bracket | Male | Female |
| Under 5 Years | 0 (0.0%) | 0 (0.0%) |
| 5 Years | 0 (0.0%) | 0 (0.0%) |
| 6 to 11 Years | 0 (0.0%) | 0 (0.0%) |
| 12 to 14 Years | 0 (0.0%) | 0 (0.0%) |
| 15 Years | 0 (0.0%) | 0 (0.0%) |
| 16 and 17 Years | 0 (0.0%) | 0 (0.0%) |
| 18 to 24 Years | 0 (0.0%) | 0 (0.0%) |
| 25 to 34 Years | 0 (0.0%) | 0 (0.0%) |
| 35 to 44 Years | 2 (40.0%) | 4 (100.0%) |
| 45 to 54 Years | 0 (0.0%) | 0 (0.0%) |
| 55 to 64 Years | 0 (0.0%) | 0 (0.0%) |
| 65 to 74 Years | 7 (23.3%) | 4 (13.3%) |
| 75 Years and over | 0 (0.0%) | 10 (55.6%) |
| Total | 9 (12.0%) | 18 (22.5%) |
Income Above Poverty by Sex and Age in Beulah
According to the poverty statistics in Beulah, males aged under 5 years and females aged 25 to 34 years are the age groups that are most secure financially, with 100.0% of males and 100.0% of females in these age groups living above the poverty line.

| Age Bracket | Male | Female |
| Under 5 Years | 6 (100.0%) | 0 (0.0%) |
| 5 Years | 0 (0.0%) | 0 (0.0%) |
| 6 to 11 Years | 3 (100.0%) | 0 (0.0%) |
| 12 to 14 Years | 0 (0.0%) | 0 (0.0%) |
| 15 Years | 0 (0.0%) | 0 (0.0%) |
| 16 and 17 Years | 0 (0.0%) | 0 (0.0%) |
| 18 to 24 Years | 9 (100.0%) | 0 (0.0%) |
| 25 to 34 Years | 0 (0.0%) | 2 (100.0%) |
| 35 to 44 Years | 3 (60.0%) | 0 (0.0%) |
| 45 to 54 Years | 9 (100.0%) | 7 (100.0%) |
| 55 to 64 Years | 8 (100.0%) | 19 (100.0%) |
| 65 to 74 Years | 23 (76.7%) | 26 (86.7%) |
| 75 Years and over | 5 (100.0%) | 8 (44.4%) |
| Total | 66 (88.0%) | 62 (77.5%) |
Income Below Poverty Among Married-Couple Families in Beulah
| Children | Above Poverty | Below Poverty |
| No Children | 39 (100.0%) | 0 (0.0%) |
| 1 or 2 Children | 0 (0.0%) | 0 (0.0%) |
| 3 or 4 Children | 0 (0.0%) | 0 (0.0%) |
| 5 or more Children | 0 (0.0%) | 0 (0.0%) |
| Total | 39 (100.0%) | 0 (0.0%) |
Income Below Poverty Among Single-Parent Households in Beulah
| Children | Single Father | Single Mother |
| No Children | 0 (0.0%) | 0 (0.0%) |
| 1 or 2 Children | 0 (0.0%) | 0 (0.0%) |
| 3 or 4 Children | 0 (0.0%) | 0 (0.0%) |
| 5 or more Children | 0 (0.0%) | 0 (0.0%) |
| Total | 0 (0.0%) | 0 (0.0%) |
Income Below Poverty Among Married-Couple vs Single-Parent Households in Beulah
| Children | Married-Couple Families | Single-Parent Households |
| No Children | 0 (0.0%) | 0 (0.0%) |
| 1 or 2 Children | 0 (0.0%) | 0 (0.0%) |
| 3 or 4 Children | 0 (0.0%) | 0 (0.0%) |
| 5 or more Children | 0 (0.0%) | 0 (0.0%) |
| Total | 0 (0.0%) | 0 (0.0%) |
Employment Characteristics in Beulah
Employment by Class of Employer in Beulah
Among the 45 employed individuals in Beulah, private company employees (30 | 66.7%), local government employees (7 | 15.6%), and self-employed (incorporated) (3 | 6.7%) make up the most common classes of employment.
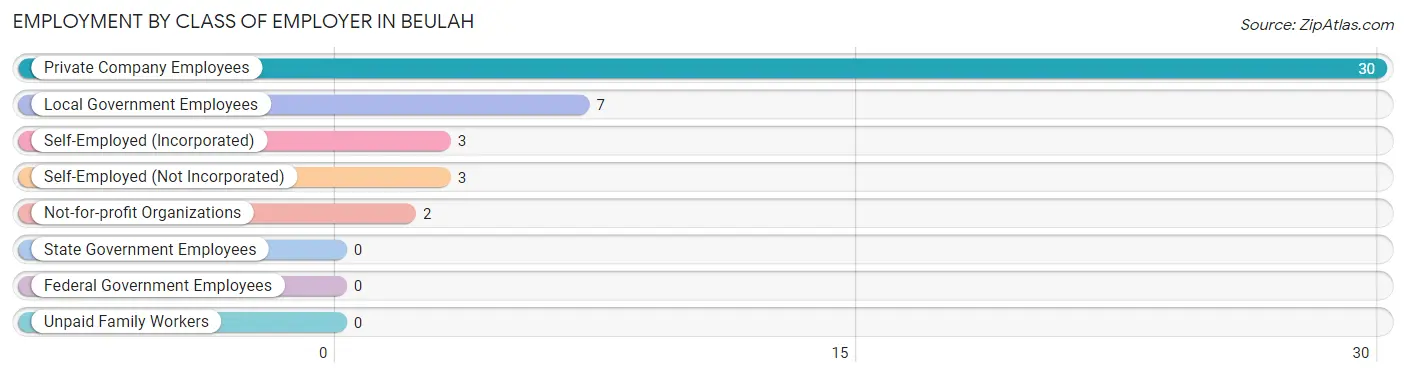
| Employer Class | # Employees | % Employees |
| Private Company Employees | 30 | 66.7% |
| Self-Employed (Incorporated) | 3 | 6.7% |
| Self-Employed (Not Incorporated) | 3 | 6.7% |
| Not-for-profit Organizations | 2 | 4.4% |
| Local Government Employees | 7 | 15.6% |
| State Government Employees | 0 | 0.0% |
| Federal Government Employees | 0 | 0.0% |
| Unpaid Family Workers | 0 | 0.0% |
| Total | 45 | 100.0% |
Employment Status by Age in Beulah
According to the labor force statistics for Beulah, out of the total population over 16 years of age (191), 27.2% or 52 individuals are in the labor force, with 5.8% or 3 of them unemployed. The age group with the highest labor force participation rate is 16 to 19 years, with 100.0% or 4 individuals in the labor force. Within the labor force, the 35 to 44 years age range has the highest percentage of unemployed individuals, with 100.0% or 3 of them being unemployed.
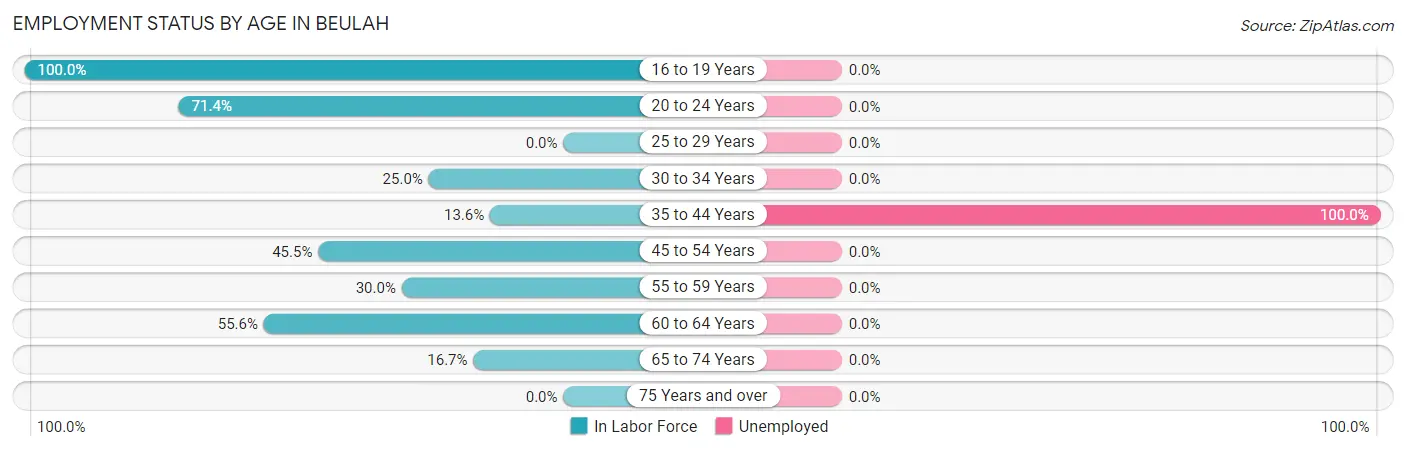
| Age Bracket | In Labor Force | Unemployed |
| 16 to 19 Years | 4 (100.0%) | 0 (0.0%) |
| 20 to 24 Years | 5 (71.4%) | 0 (0.0%) |
| 25 to 29 Years | 0 (0.0%) | 0 (0.0%) |
| 30 to 34 Years | 2 (25.0%) | 0 (0.0%) |
| 35 to 44 Years | 3 (13.6%) | 3 (100.0%) |
| 45 to 54 Years | 10 (45.5%) | 0 (0.0%) |
| 55 to 59 Years | 3 (30.0%) | 0 (0.0%) |
| 60 to 64 Years | 15 (55.6%) | 0 (0.0%) |
| 65 to 74 Years | 10 (16.7%) | 0 (0.0%) |
| 75 Years and over | 0 (0.0%) | 0 (0.0%) |
| Total | 52 (27.2%) | 3 (5.8%) |
Employment Status by Educational Attainment in Beulah
According to labor force statistics for Beulah, 34.0% of individuals (33) out of the total population between 25 and 64 years of age (97) are in the labor force, with 9.1% or 3 of them being unemployed. The group with the highest labor force participation rate are those with the educational attainment of bachelor's degree or higher, with 46.2% or 12 individuals in the labor force. Within the labor force, individuals with college / associate degree education have the highest percentage of unemployment, with 23.1% or 3 of them being unemployed.
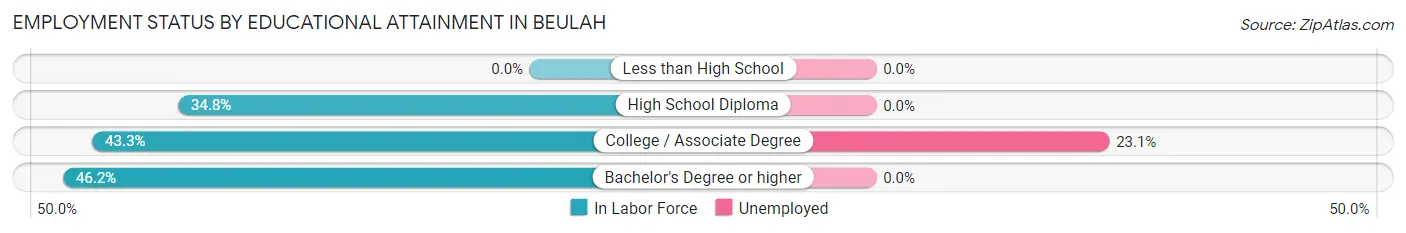
| Educational Attainment | In Labor Force | Unemployed |
| Less than High School | 0 (0.0%) | 0 (0.0%) |
| High School Diploma | 8 (34.8%) | 0 (0.0%) |
| College / Associate Degree | 13 (43.3%) | 7 (23.1%) |
| Bachelor's Degree or higher | 12 (46.2%) | 0 (0.0%) |
| Total | 33 (34.0%) | 9 (9.1%) |
Employment Occupations by Sex in Beulah
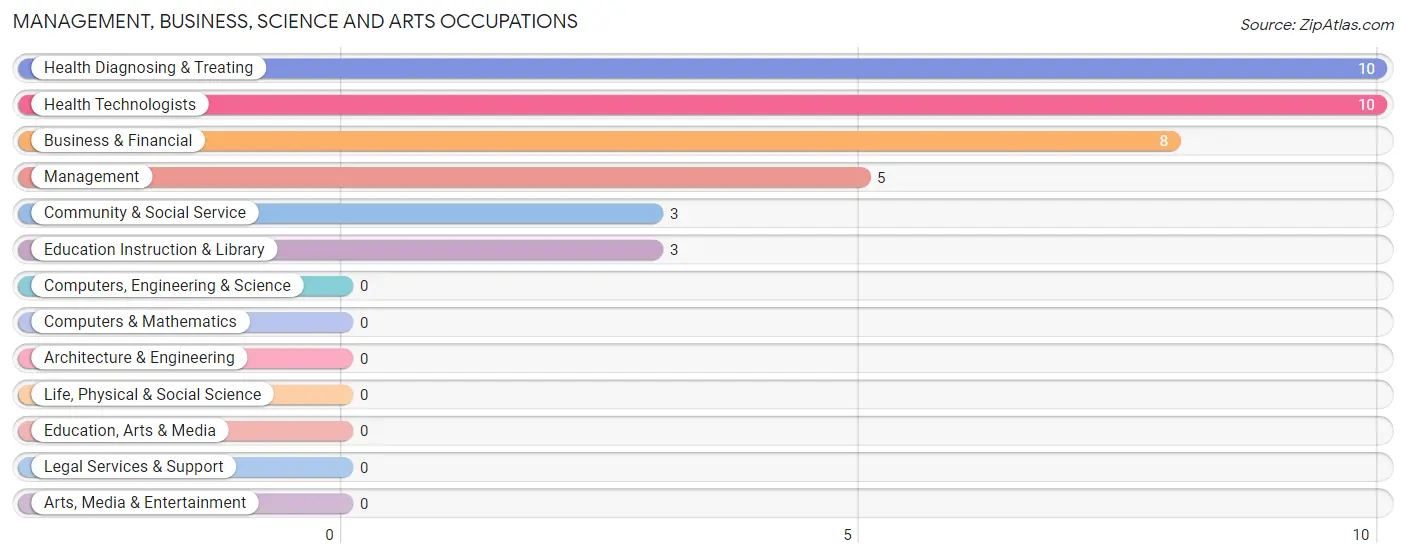
Management, Business, Science and Arts Occupations
The most common Management, Business, Science and Arts occupations in Beulah are Health Diagnosing & Treating (10 | 20.4%), Health Technologists (10 | 20.4%), Business & Financial (8 | 16.3%), Management (5 | 10.2%), and Community & Social Service (3 | 6.1%).
Management, Business, Science and Arts Occupations by Sex
Within the Management, Business, Science and Arts occupations in Beulah, the most male-oriented occupations are Community & Social Service (100.0%), Education Instruction & Library (100.0%), and Management (60.0%), while the most female-oriented occupations are Business & Financial (100.0%), Health Diagnosing & Treating (100.0%), and Health Technologists (100.0%).
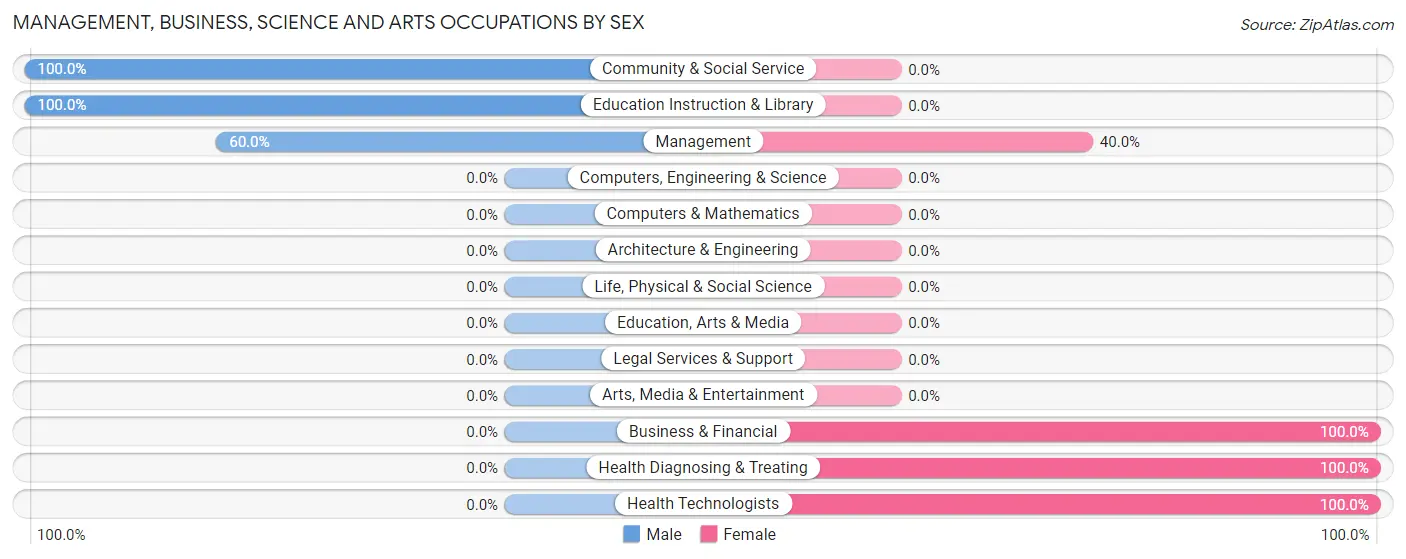
| Occupation | Male | Female |
| Management | 3 (60.0%) | 2 (40.0%) |
| Business & Financial | 0 (0.0%) | 8 (100.0%) |
| Computers, Engineering & Science | 0 (0.0%) | 0 (0.0%) |
| Computers & Mathematics | 0 (0.0%) | 0 (0.0%) |
| Architecture & Engineering | 0 (0.0%) | 0 (0.0%) |
| Life, Physical & Social Science | 0 (0.0%) | 0 (0.0%) |
| Community & Social Service | 3 (100.0%) | 0 (0.0%) |
| Education, Arts & Media | 0 (0.0%) | 0 (0.0%) |
| Legal Services & Support | 0 (0.0%) | 0 (0.0%) |
| Education Instruction & Library | 3 (100.0%) | 0 (0.0%) |
| Arts, Media & Entertainment | 0 (0.0%) | 0 (0.0%) |
| Health Diagnosing & Treating | 0 (0.0%) | 10 (100.0%) |
| Health Technologists | 0 (0.0%) | 10 (100.0%) |
| Total (Category) | 6 (23.1%) | 20 (76.9%) |
| Total (Overall) | 21 (42.9%) | 28 (57.1%) |
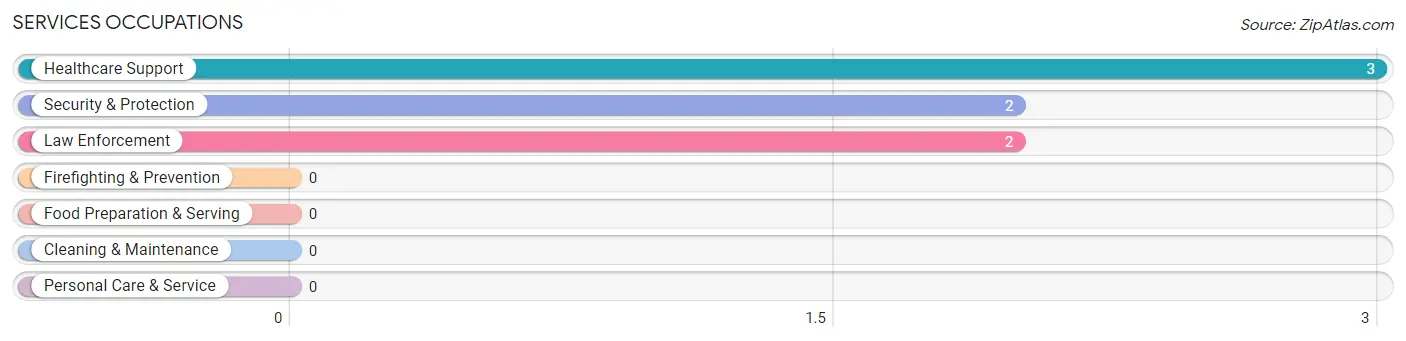
Services Occupations
The most common Services occupations in Beulah are Healthcare Support (3 | 6.1%), Security & Protection (2 | 4.1%), and Law Enforcement (2 | 4.1%).
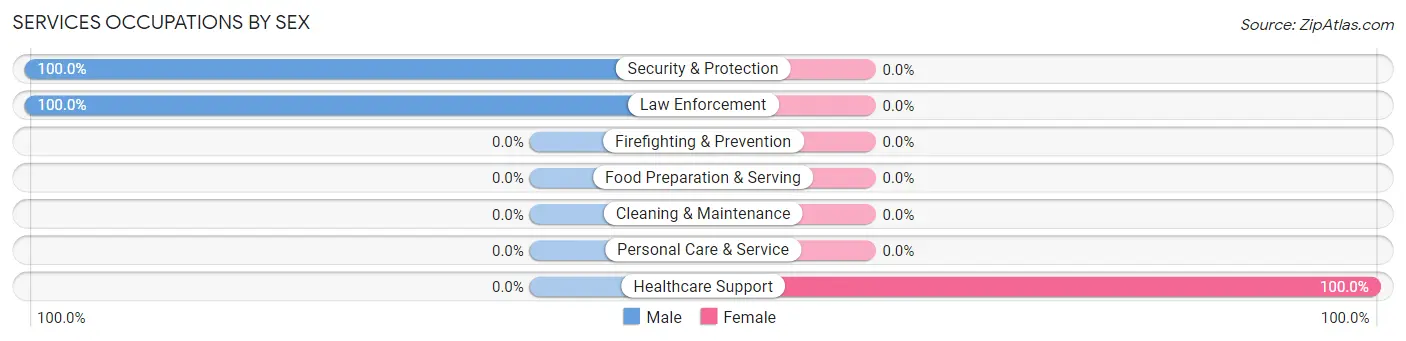
Services Occupations by Sex
| Occupation | Male | Female |
| Healthcare Support | 0 (0.0%) | 3 (100.0%) |
| Security & Protection | 2 (100.0%) | 0 (0.0%) |
| Firefighting & Prevention | 0 (0.0%) | 0 (0.0%) |
| Law Enforcement | 2 (100.0%) | 0 (0.0%) |
| Food Preparation & Serving | 0 (0.0%) | 0 (0.0%) |
| Cleaning & Maintenance | 0 (0.0%) | 0 (0.0%) |
| Personal Care & Service | 0 (0.0%) | 0 (0.0%) |
| Total (Category) | 2 (40.0%) | 3 (60.0%) |
| Total (Overall) | 21 (42.9%) | 28 (57.1%) |
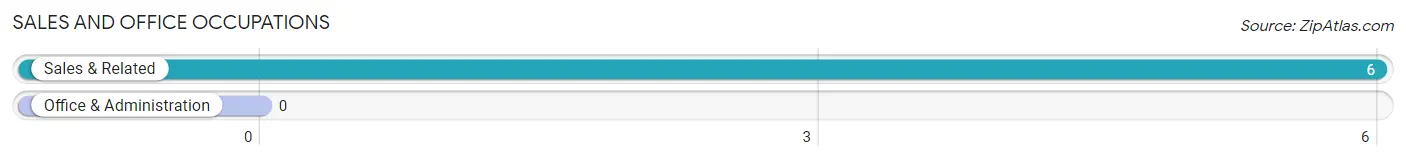
Sales and Office Occupations
The most common Sales and Office occupations in Beulah are , and Sales & Related (6 | 12.2%).
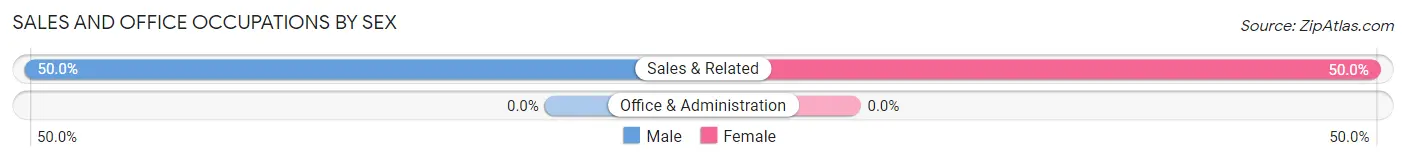
Sales and Office Occupations by Sex
| Occupation | Male | Female |
| Sales & Related | 3 (50.0%) | 3 (50.0%) |
| Office & Administration | 0 (0.0%) | 0 (0.0%) |
| Total (Category) | 3 (50.0%) | 3 (50.0%) |
| Total (Overall) | 21 (42.9%) | 28 (57.1%) |
Natural Resources, Construction and Maintenance Occupations
The most common Natural Resources, Construction and Maintenance occupations in Beulah are , and Construction & Extraction (5 | 10.2%).
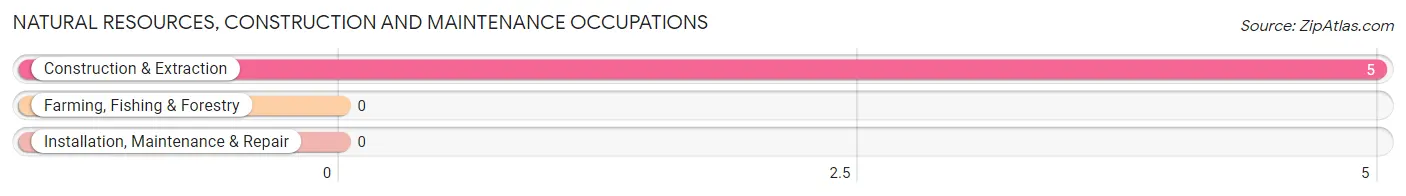
Natural Resources, Construction and Maintenance Occupations by Sex
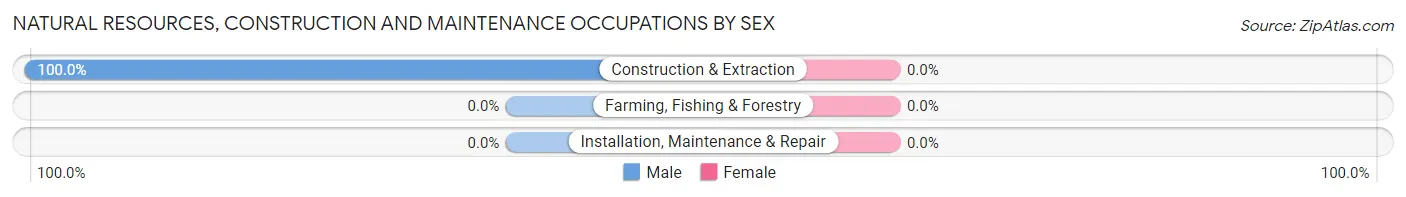
| Occupation | Male | Female |
| Farming, Fishing & Forestry | 0 (0.0%) | 0 (0.0%) |
| Construction & Extraction | 5 (100.0%) | 0 (0.0%) |
| Installation, Maintenance & Repair | 0 (0.0%) | 0 (0.0%) |
| Total (Category) | 5 (100.0%) | 0 (0.0%) |
| Total (Overall) | 21 (42.9%) | 28 (57.1%) |
Production, Transportation and Moving Occupations
The most common Production, Transportation and Moving occupations in Beulah are , and Material Moving (7 | 14.3%).
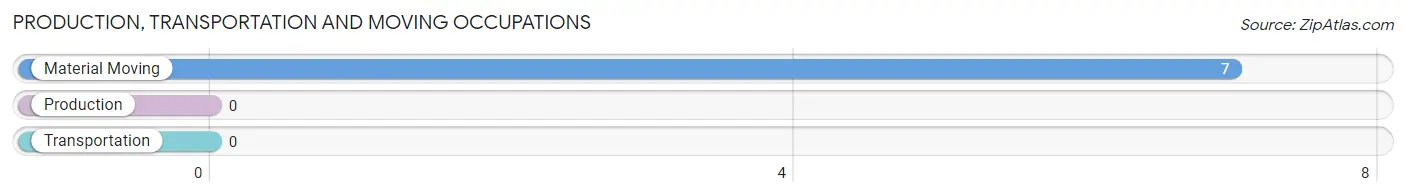
Production, Transportation and Moving Occupations by Sex
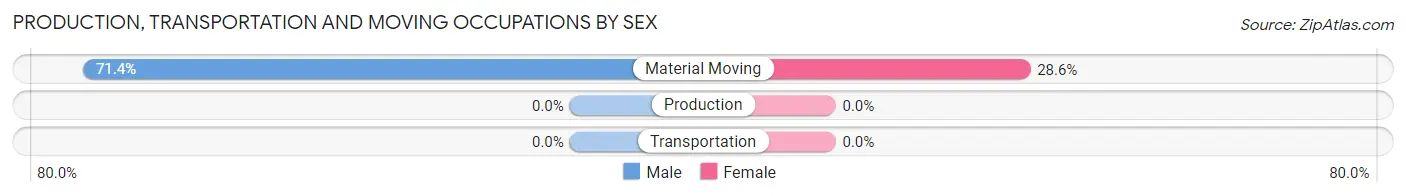
| Occupation | Male | Female |
| Production | 0 (0.0%) | 0 (0.0%) |
| Transportation | 0 (0.0%) | 0 (0.0%) |
| Material Moving | 5 (71.4%) | 2 (28.6%) |
| Total (Category) | 5 (71.4%) | 2 (28.6%) |
| Total (Overall) | 21 (42.9%) | 28 (57.1%) |
Employment Industries by Sex in Beulah
Employment Industries in Beulah
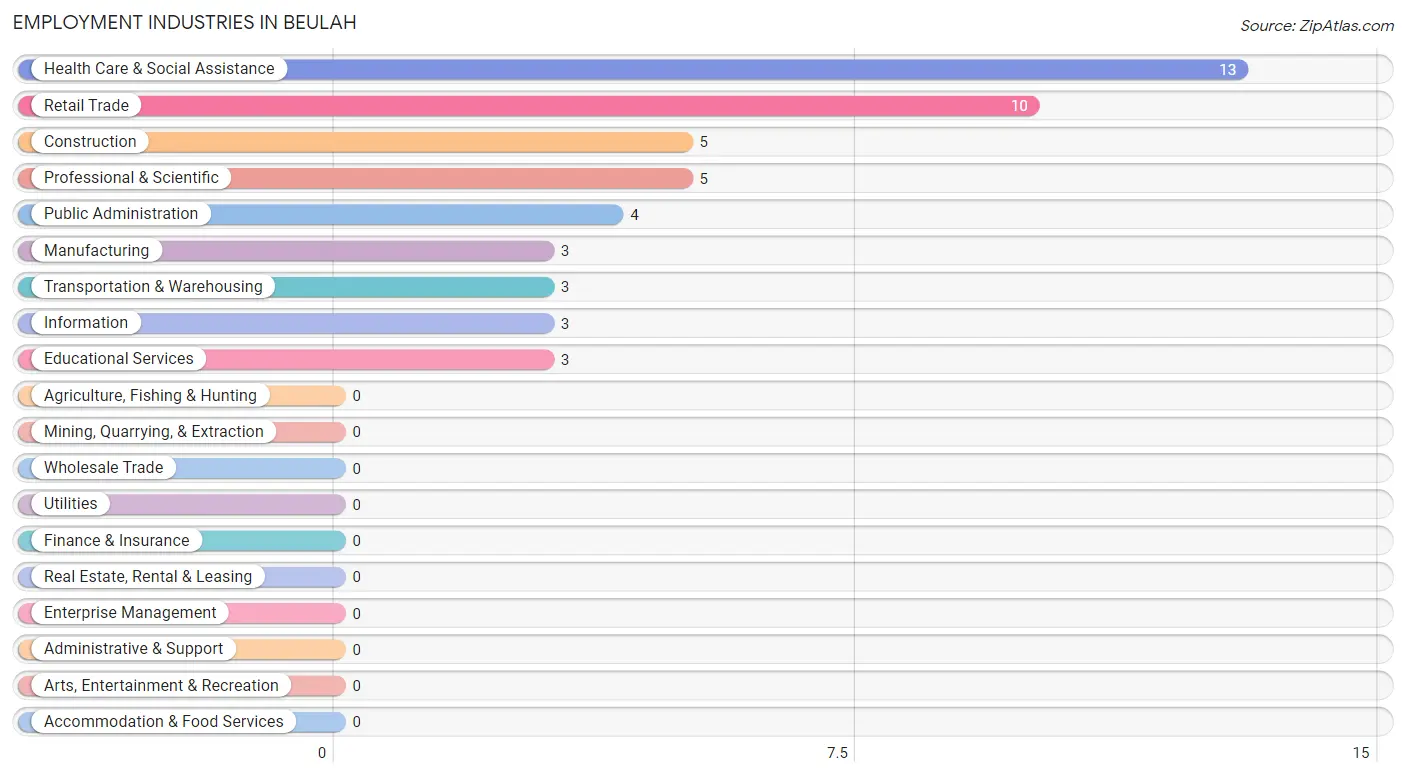
The major employment industries in Beulah include Health Care & Social Assistance (13 | 26.5%), Retail Trade (10 | 20.4%), Construction (5 | 10.2%), Professional & Scientific (5 | 10.2%), and Public Administration (4 | 8.2%).
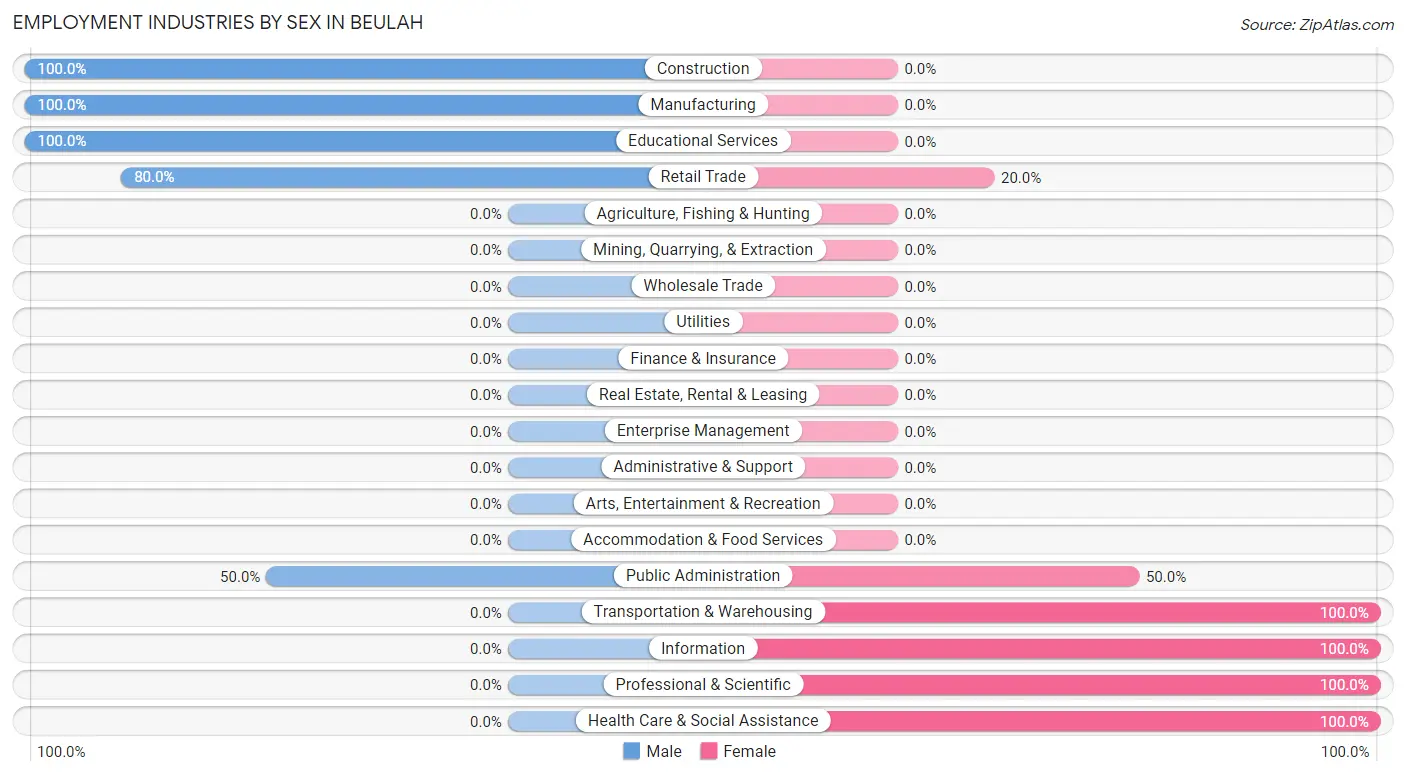
Employment Industries by Sex in Beulah
The Beulah industries that see more men than women are Construction (100.0%), Manufacturing (100.0%), and Educational Services (100.0%), whereas the industries that tend to have a higher number of women are Transportation & Warehousing (100.0%), Information (100.0%), and Professional & Scientific (100.0%).
| Industry | Male | Female |
| Agriculture, Fishing & Hunting | 0 (0.0%) | 0 (0.0%) |
| Mining, Quarrying, & Extraction | 0 (0.0%) | 0 (0.0%) |
| Construction | 5 (100.0%) | 0 (0.0%) |
| Manufacturing | 3 (100.0%) | 0 (0.0%) |
| Wholesale Trade | 0 (0.0%) | 0 (0.0%) |
| Retail Trade | 8 (80.0%) | 2 (20.0%) |
| Transportation & Warehousing | 0 (0.0%) | 3 (100.0%) |
| Utilities | 0 (0.0%) | 0 (0.0%) |
| Information | 0 (0.0%) | 3 (100.0%) |
| Finance & Insurance | 0 (0.0%) | 0 (0.0%) |
| Real Estate, Rental & Leasing | 0 (0.0%) | 0 (0.0%) |
| Professional & Scientific | 0 (0.0%) | 5 (100.0%) |
| Enterprise Management | 0 (0.0%) | 0 (0.0%) |
| Administrative & Support | 0 (0.0%) | 0 (0.0%) |
| Educational Services | 3 (100.0%) | 0 (0.0%) |
| Health Care & Social Assistance | 0 (0.0%) | 13 (100.0%) |
| Arts, Entertainment & Recreation | 0 (0.0%) | 0 (0.0%) |
| Accommodation & Food Services | 0 (0.0%) | 0 (0.0%) |
| Public Administration | 2 (50.0%) | 2 (50.0%) |
| Total | 21 (42.9%) | 28 (57.1%) |
Education in Beulah
School Enrollment in Beulah
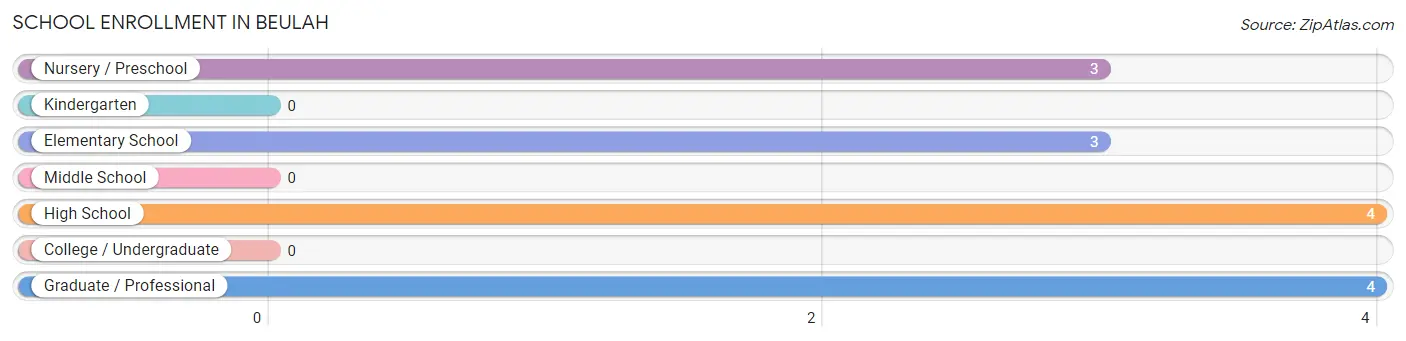
The most common levels of schooling among the 14 students in Beulah are high school (4 | 28.6%), graduate / professional (4 | 28.6%), and nursery / preschool (3 | 21.4%).
| School Level | # Students | % Students |
| Nursery / Preschool | 3 | 21.4% |
| Kindergarten | 0 | 0.0% |
| Elementary School | 3 | 21.4% |
| Middle School | 0 | 0.0% |
| High School | 4 | 28.6% |
| College / Undergraduate | 0 | 0.0% |
| Graduate / Professional | 4 | 28.6% |
| Total | 14 | 100.0% |
School Enrollment by Age by Funding Source in Beulah
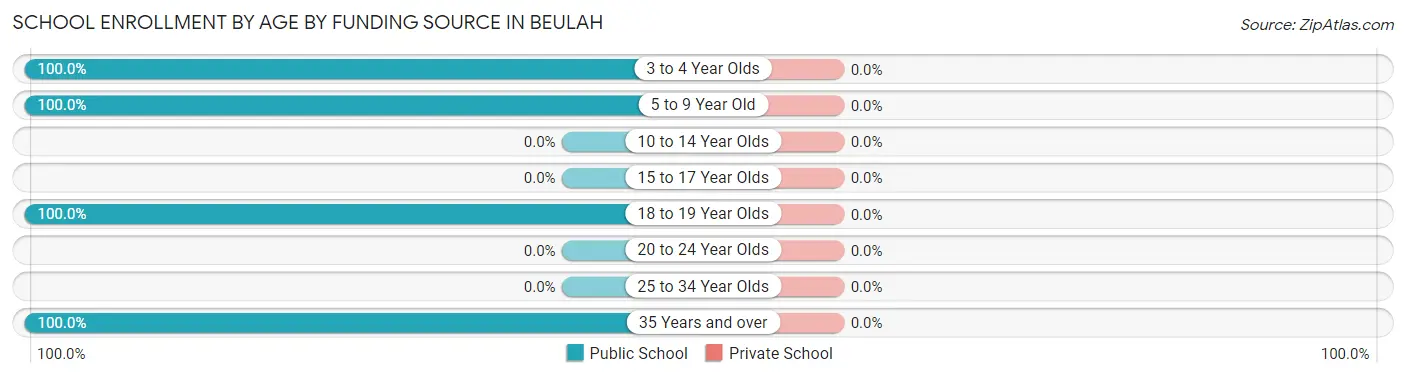
| Age Bracket | Public School | Private School |
| 3 to 4 Year Olds | 3 (100.0%) | 0 (0.0%) |
| 5 to 9 Year Old | 3 (100.0%) | 0 (0.0%) |
| 10 to 14 Year Olds | 0 (0.0%) | 0 (0.0%) |
| 15 to 17 Year Olds | 0 (0.0%) | 0 (0.0%) |
| 18 to 19 Year Olds | 4 (100.0%) | 0 (0.0%) |
| 20 to 24 Year Olds | 0 (0.0%) | 0 (0.0%) |
| 25 to 34 Year Olds | 0 (0.0%) | 0 (0.0%) |
| 35 Years and over | 4 (100.0%) | 0 (0.0%) |
| Total | 14 (100.0%) | 0 (0.0%) |
Educational Attainment by Field of Study in Beulah
Education (22 | 33.9%), social sciences (16 | 24.6%), business (7 | 10.8%), science & technology (4 | 6.1%), and literature & languages (4 | 6.1%) are the most common fields of study among 65 individuals in Beulah who have obtained a bachelor's degree or higher.
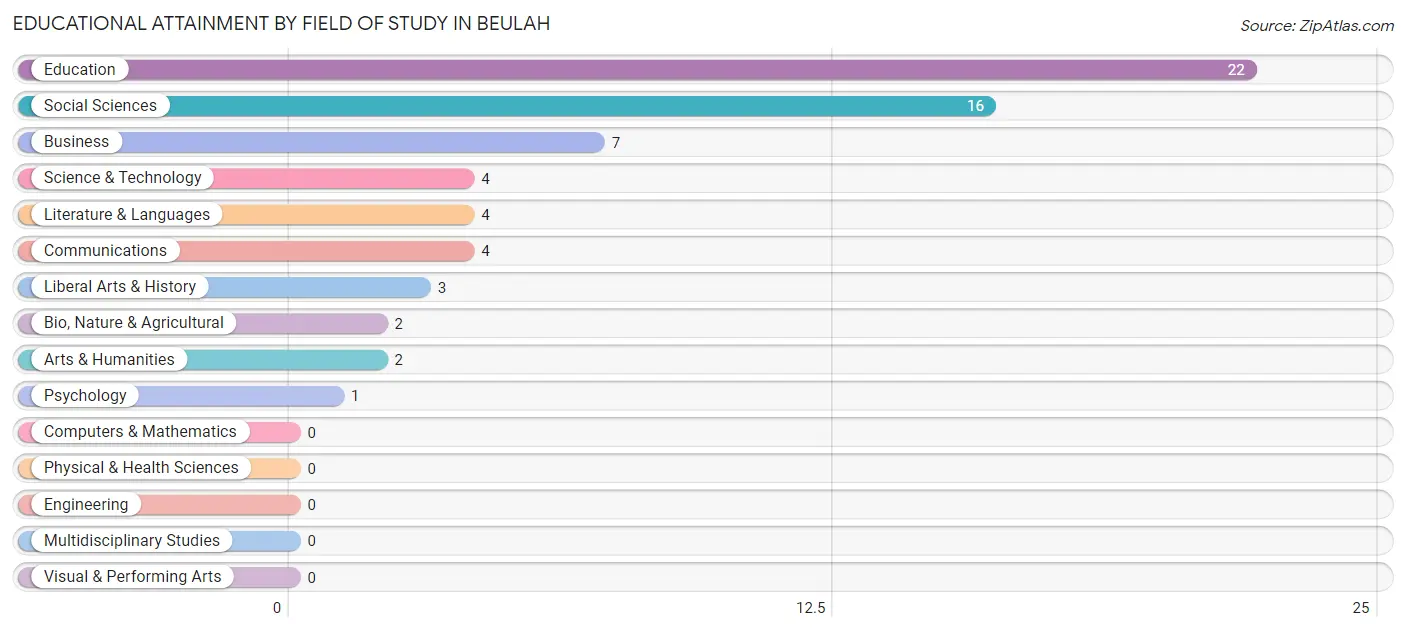
| Field of Study | # Graduates | % Graduates |
| Computers & Mathematics | 0 | 0.0% |
| Bio, Nature & Agricultural | 2 | 3.1% |
| Physical & Health Sciences | 0 | 0.0% |
| Psychology | 1 | 1.5% |
| Social Sciences | 16 | 24.6% |
| Engineering | 0 | 0.0% |
| Multidisciplinary Studies | 0 | 0.0% |
| Science & Technology | 4 | 6.1% |
| Business | 7 | 10.8% |
| Education | 22 | 33.9% |
| Literature & Languages | 4 | 6.1% |
| Liberal Arts & History | 3 | 4.6% |
| Visual & Performing Arts | 0 | 0.0% |
| Communications | 4 | 6.1% |
| Arts & Humanities | 2 | 3.1% |
| Total | 65 | 100.0% |
Transportation & Commute in Beulah
Vehicle Availability by Sex in Beulah
The most prevalent vehicle ownership categories in Beulah are males with 4 vehicles (12, accounting for 57.1%) and females with 4 vehicles (4, making up 50.0%).
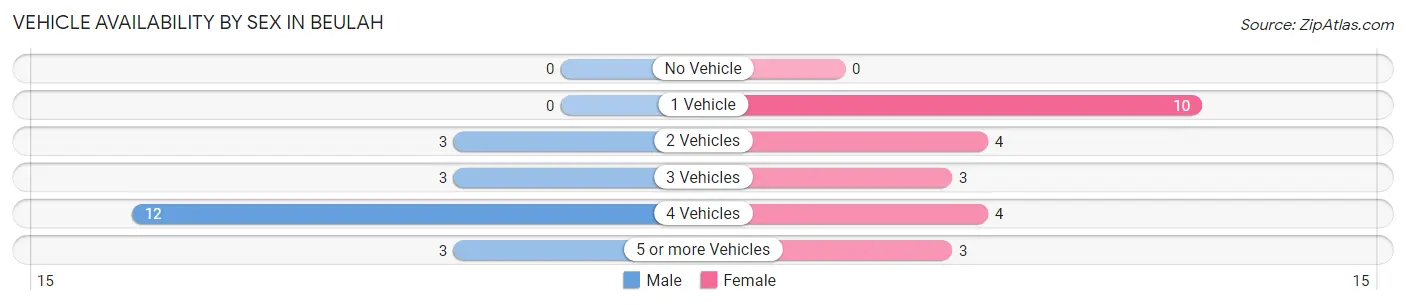
| Vehicles Available | Male | Female |
| No Vehicle | 0 (0.0%) | 0 (0.0%) |
| 1 Vehicle | 0 (0.0%) | 10 (41.7%) |
| 2 Vehicles | 3 (14.3%) | 4 (16.7%) |
| 3 Vehicles | 3 (14.3%) | 3 (12.5%) |
| 4 Vehicles | 12 (57.1%) | 4 (16.7%) |
| 5 or more Vehicles | 3 (14.3%) | 3 (12.5%) |
| Total | 21 (100.0%) | 24 (100.0%) |
Commute Time in Beulah
The most frequently occuring commute durations in Beulah are 5 to 9 minutes (20 commuters, 54.0%), 10 to 14 minutes (8 commuters, 21.6%), and 35 to 39 minutes (4 commuters, 10.8%).
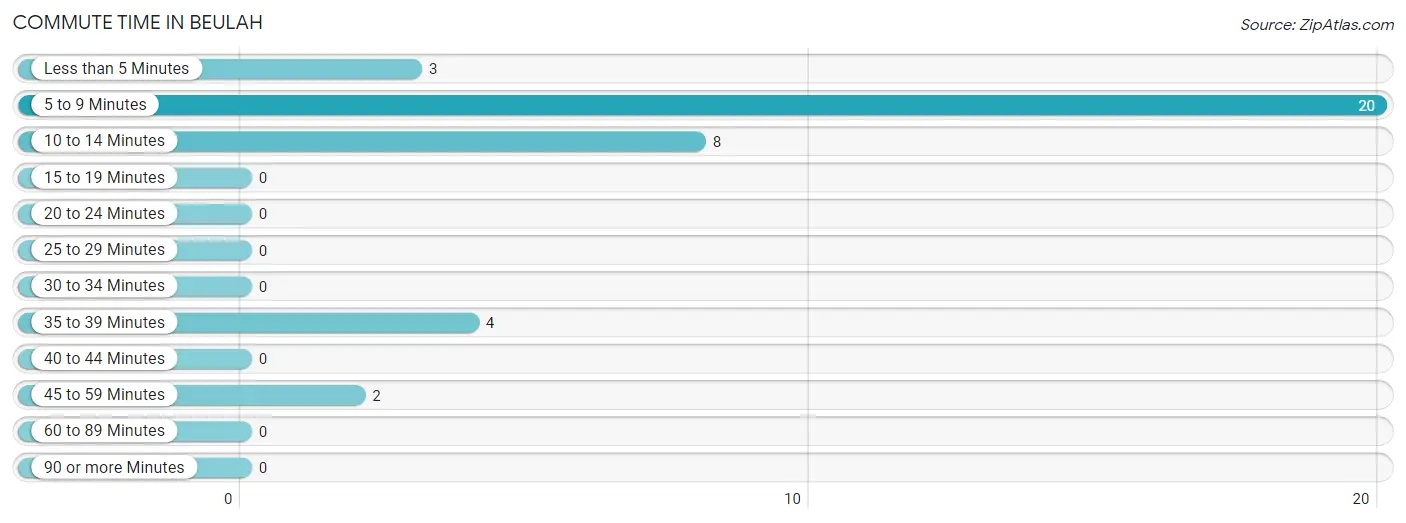
| Commute Time | # Commuters | % Commuters |
| Less than 5 Minutes | 3 | 8.1% |
| 5 to 9 Minutes | 20 | 54.0% |
| 10 to 14 Minutes | 8 | 21.6% |
| 15 to 19 Minutes | 0 | 0.0% |
| 20 to 24 Minutes | 0 | 0.0% |
| 25 to 29 Minutes | 0 | 0.0% |
| 30 to 34 Minutes | 0 | 0.0% |
| 35 to 39 Minutes | 4 | 10.8% |
| 40 to 44 Minutes | 0 | 0.0% |
| 45 to 59 Minutes | 2 | 5.4% |
| 60 to 89 Minutes | 0 | 0.0% |
| 90 or more Minutes | 0 | 0.0% |
Commute Time by Sex in Beulah
The most common commute times in Beulah are 5 to 9 minutes (8 commuters, 44.4%) for males and 5 to 9 minutes (12 commuters, 63.2%) for females.
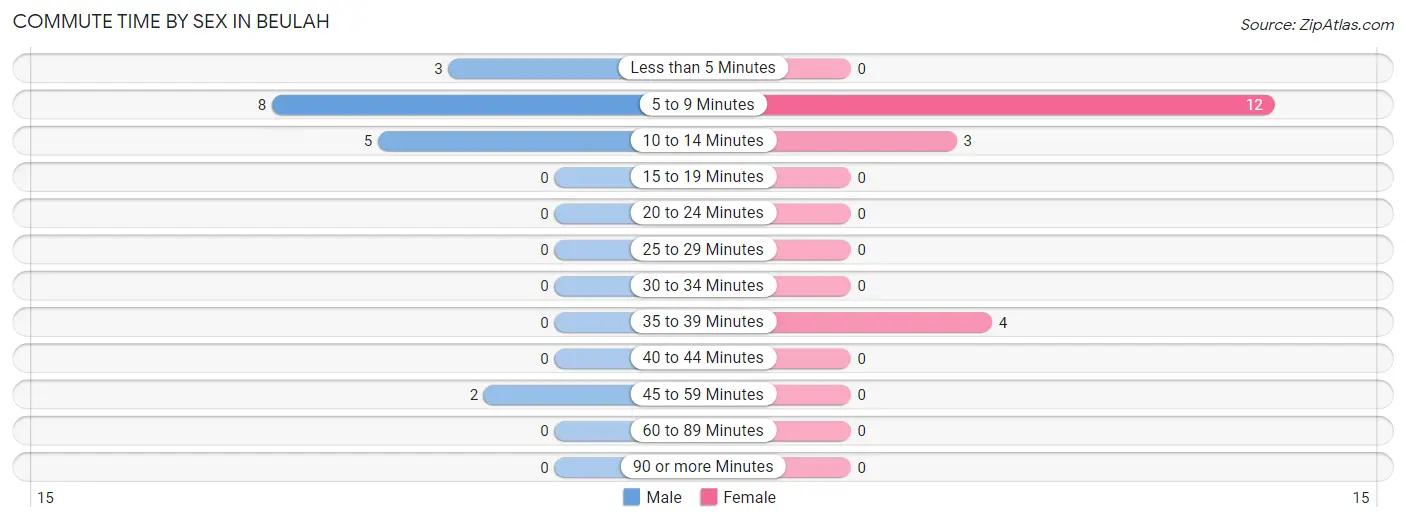
| Commute Time | Male | Female |
| Less than 5 Minutes | 3 (16.7%) | 0 (0.0%) |
| 5 to 9 Minutes | 8 (44.4%) | 12 (63.2%) |
| 10 to 14 Minutes | 5 (27.8%) | 3 (15.8%) |
| 15 to 19 Minutes | 0 (0.0%) | 0 (0.0%) |
| 20 to 24 Minutes | 0 (0.0%) | 0 (0.0%) |
| 25 to 29 Minutes | 0 (0.0%) | 0 (0.0%) |
| 30 to 34 Minutes | 0 (0.0%) | 0 (0.0%) |
| 35 to 39 Minutes | 0 (0.0%) | 4 (21.0%) |
| 40 to 44 Minutes | 0 (0.0%) | 0 (0.0%) |
| 45 to 59 Minutes | 2 (11.1%) | 0 (0.0%) |
| 60 to 89 Minutes | 0 (0.0%) | 0 (0.0%) |
| 90 or more Minutes | 0 (0.0%) | 0 (0.0%) |
Time of Departure to Work by Sex in Beulah
The most frequent times of departure to work in Beulah are 7:30 AM to 7:59 AM (8, 44.4%) for males and 12:00 PM to 3:59 PM (8, 42.1%) for females.
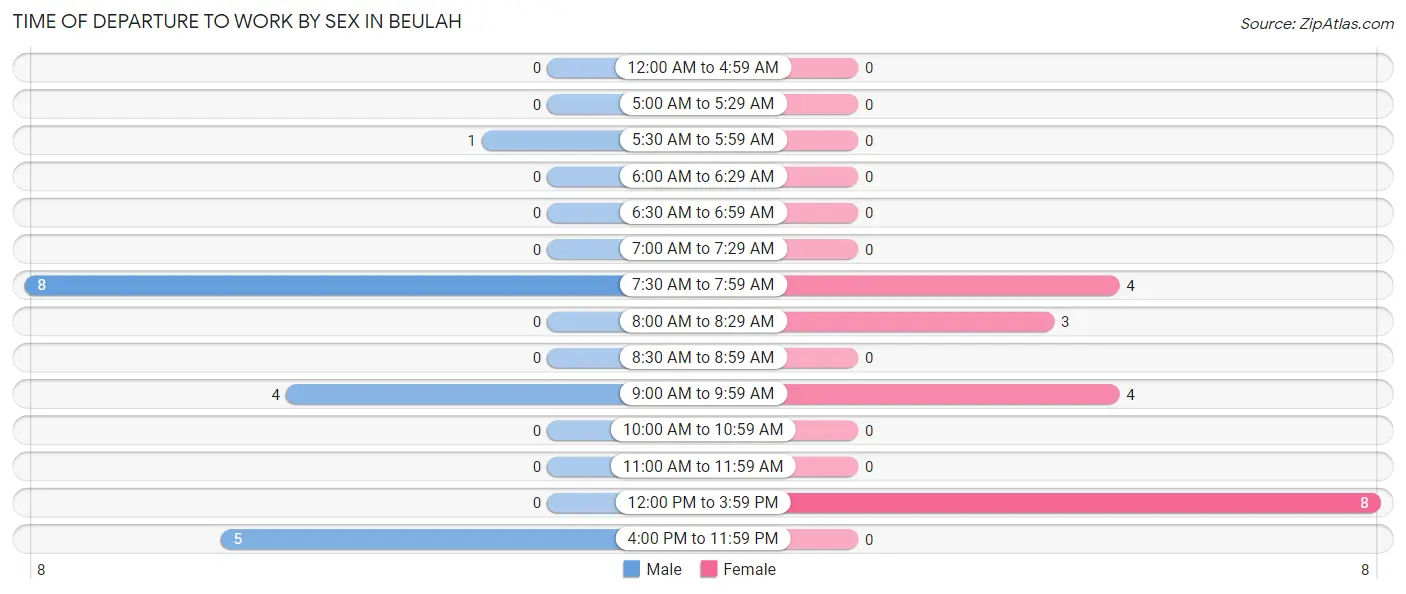
| Time of Departure | Male | Female |
| 12:00 AM to 4:59 AM | 0 (0.0%) | 0 (0.0%) |
| 5:00 AM to 5:29 AM | 0 (0.0%) | 0 (0.0%) |
| 5:30 AM to 5:59 AM | 1 (5.6%) | 0 (0.0%) |
| 6:00 AM to 6:29 AM | 0 (0.0%) | 0 (0.0%) |
| 6:30 AM to 6:59 AM | 0 (0.0%) | 0 (0.0%) |
| 7:00 AM to 7:29 AM | 0 (0.0%) | 0 (0.0%) |
| 7:30 AM to 7:59 AM | 8 (44.4%) | 4 (21.0%) |
| 8:00 AM to 8:29 AM | 0 (0.0%) | 3 (15.8%) |
| 8:30 AM to 8:59 AM | 0 (0.0%) | 0 (0.0%) |
| 9:00 AM to 9:59 AM | 4 (22.2%) | 4 (21.0%) |
| 10:00 AM to 10:59 AM | 0 (0.0%) | 0 (0.0%) |
| 11:00 AM to 11:59 AM | 0 (0.0%) | 0 (0.0%) |
| 12:00 PM to 3:59 PM | 0 (0.0%) | 8 (42.1%) |
| 4:00 PM to 11:59 PM | 5 (27.8%) | 0 (0.0%) |
| Total | 18 (100.0%) | 19 (100.0%) |
Housing Occupancy in Beulah
Occupancy by Ownership in Beulah
Of the total 85 dwellings in Beulah, owner-occupied units account for 64 (75.3%), while renter-occupied units make up 21 (24.7%).
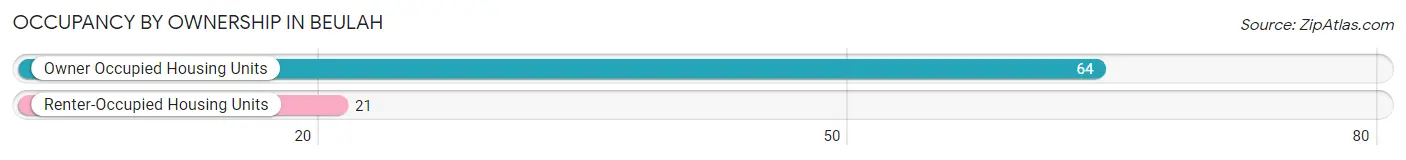
| Occupancy | # Housing Units | % Housing Units |
| Owner Occupied Housing Units | 64 | 75.3% |
| Renter-Occupied Housing Units | 21 | 24.7% |
| Total Occupied Housing Units | 85 | 100.0% |
Occupancy by Household Size in Beulah
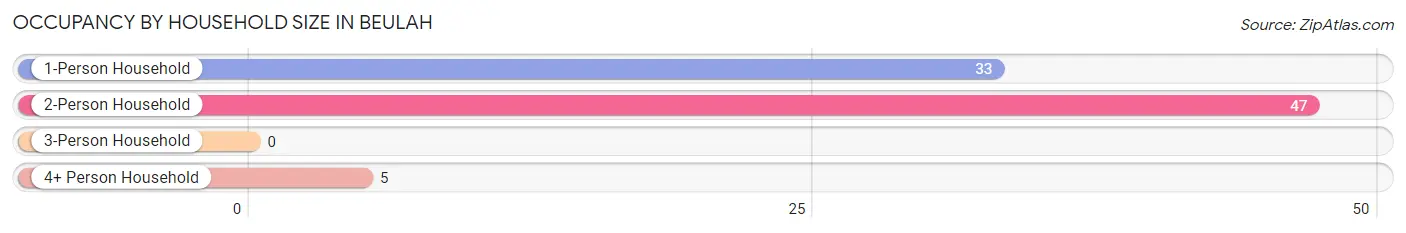
| Household Size | # Housing Units | % Housing Units |
| 1-Person Household | 33 | 38.8% |
| 2-Person Household | 47 | 55.3% |
| 3-Person Household | 0 | 0.0% |
| 4+ Person Household | 5 | 5.9% |
| Total Housing Units | 85 | 100.0% |
Occupancy by Ownership by Household Size in Beulah
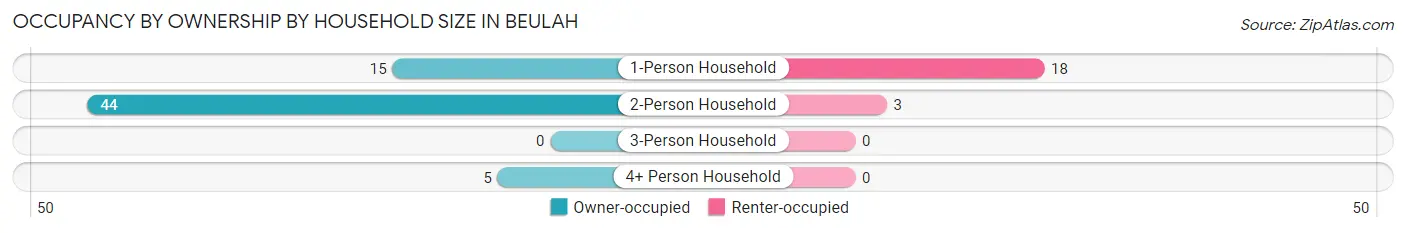
| Household Size | Owner-occupied | Renter-occupied |
| 1-Person Household | 15 (45.5%) | 18 (54.5%) |
| 2-Person Household | 44 (93.6%) | 3 (6.4%) |
| 3-Person Household | 0 (0.0%) | 0 (0.0%) |
| 4+ Person Household | 5 (100.0%) | 0 (0.0%) |
| Total Housing Units | 64 (75.3%) | 21 (24.7%) |
Occupancy by Educational Attainment in Beulah
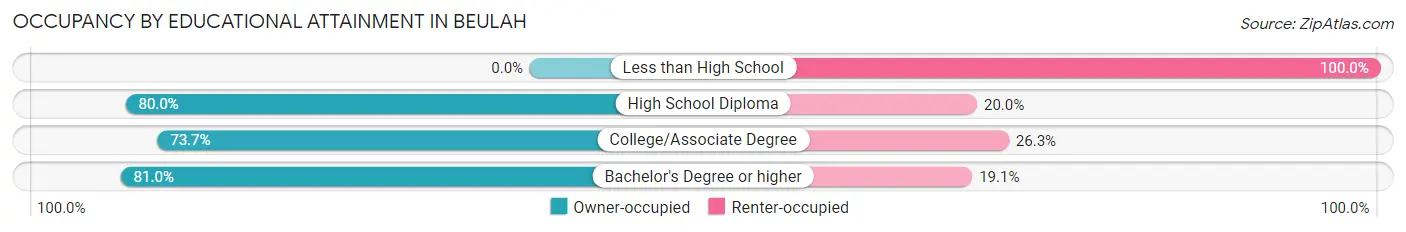
| Household Size | Owner-occupied | Renter-occupied |
| Less than High School | 0 (0.0%) | 4 (100.0%) |
| High School Diploma | 16 (80.0%) | 4 (20.0%) |
| College/Associate Degree | 14 (73.7%) | 5 (26.3%) |
| Bachelor's Degree or higher | 34 (80.9%) | 8 (19.1%) |
Occupancy by Age of Householder in Beulah
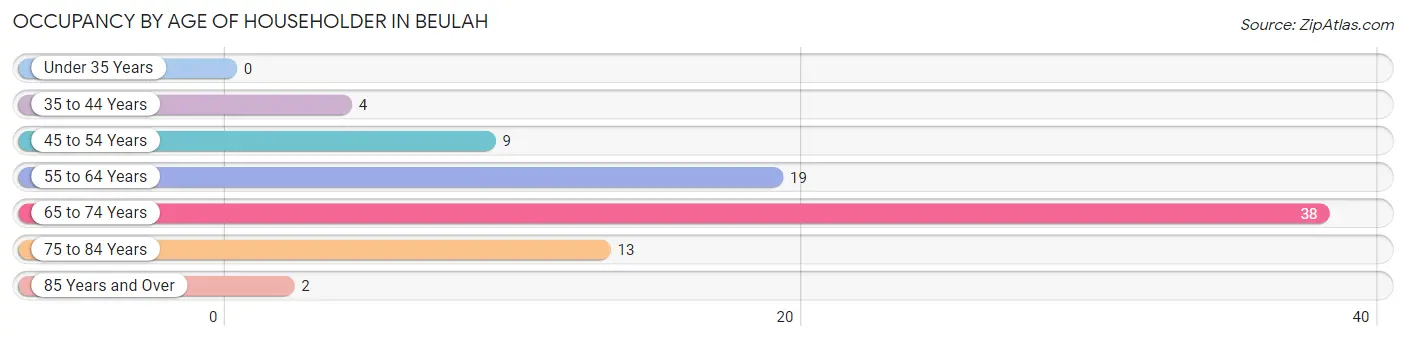
| Age Bracket | # Households | % Households |
| Under 35 Years | 0 | 0.0% |
| 35 to 44 Years | 4 | 4.7% |
| 45 to 54 Years | 9 | 10.6% |
| 55 to 64 Years | 19 | 22.4% |
| 65 to 74 Years | 38 | 44.7% |
| 75 to 84 Years | 13 | 15.3% |
| 85 Years and Over | 2 | 2.4% |
| Total | 85 | 100.0% |
Housing Finances in Beulah
Median Income by Occupancy in Beulah
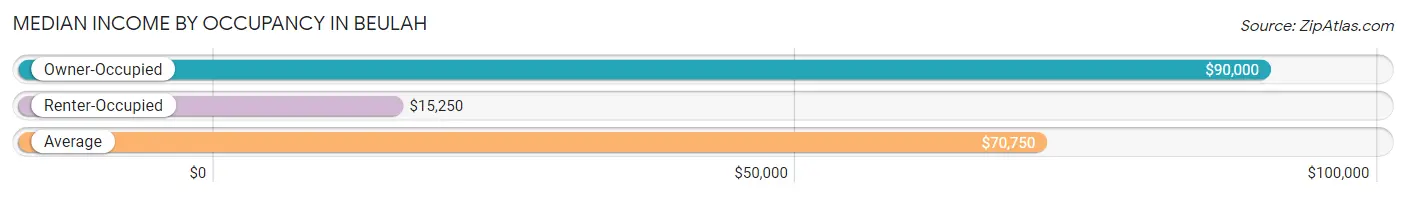
| Occupancy Type | # Households | Median Income |
| Owner-Occupied | 64 (75.3%) | $90,000 |
| Renter-Occupied | 21 (24.7%) | $15,250 |
| Average | 85 (100.0%) | $70,750 |
Occupancy by Householder Income Bracket in Beulah
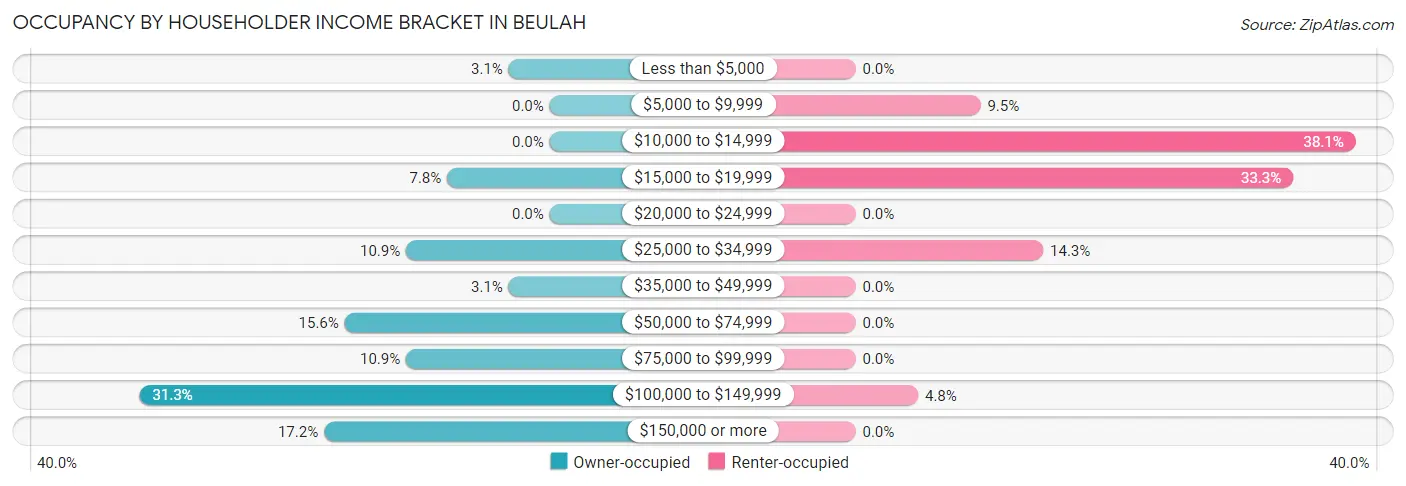
| Income Bracket | Owner-occupied | Renter-occupied |
| Less than $5,000 | 2 (3.1%) | 0 (0.0%) |
| $5,000 to $9,999 | 0 (0.0%) | 2 (9.5%) |
| $10,000 to $14,999 | 0 (0.0%) | 8 (38.1%) |
| $15,000 to $19,999 | 5 (7.8%) | 7 (33.3%) |
| $20,000 to $24,999 | 0 (0.0%) | 0 (0.0%) |
| $25,000 to $34,999 | 7 (10.9%) | 3 (14.3%) |
| $35,000 to $49,999 | 2 (3.1%) | 0 (0.0%) |
| $50,000 to $74,999 | 10 (15.6%) | 0 (0.0%) |
| $75,000 to $99,999 | 7 (10.9%) | 0 (0.0%) |
| $100,000 to $149,999 | 20 (31.2%) | 1 (4.8%) |
| $150,000 or more | 11 (17.2%) | 0 (0.0%) |
| Total | 64 (100.0%) | 21 (100.0%) |
Monthly Housing Cost Tiers in Beulah
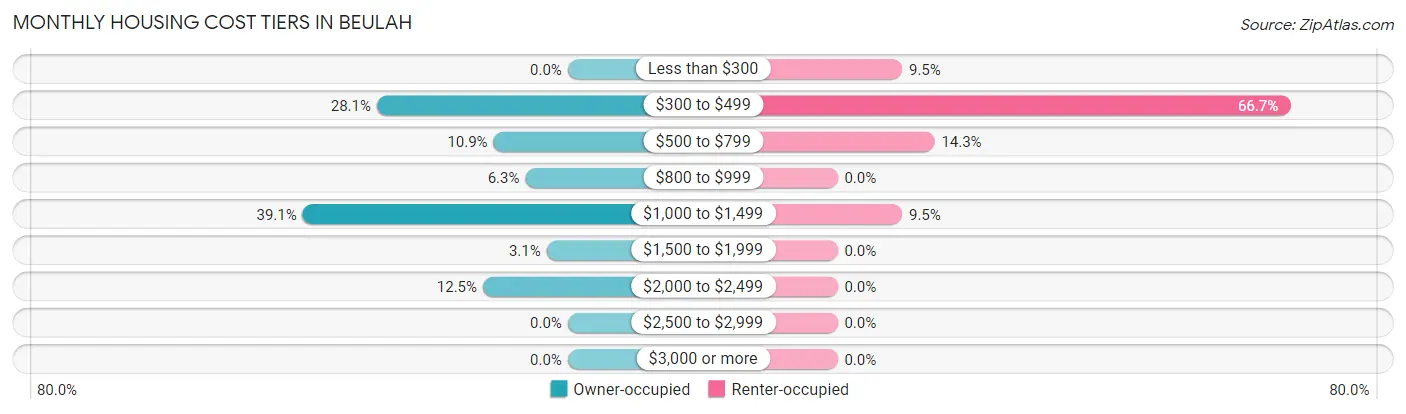
| Monthly Cost | Owner-occupied | Renter-occupied |
| Less than $300 | 0 (0.0%) | 2 (9.5%) |
| $300 to $499 | 18 (28.1%) | 14 (66.7%) |
| $500 to $799 | 7 (10.9%) | 3 (14.3%) |
| $800 to $999 | 4 (6.2%) | 0 (0.0%) |
| $1,000 to $1,499 | 25 (39.1%) | 2 (9.5%) |
| $1,500 to $1,999 | 2 (3.1%) | 0 (0.0%) |
| $2,000 to $2,499 | 8 (12.5%) | 0 (0.0%) |
| $2,500 to $2,999 | 0 (0.0%) | 0 (0.0%) |
| $3,000 or more | 0 (0.0%) | 0 (0.0%) |
| Total | 64 (100.0%) | 21 (100.0%) |
Physical Housing Characteristics in Beulah
Housing Structures in Beulah
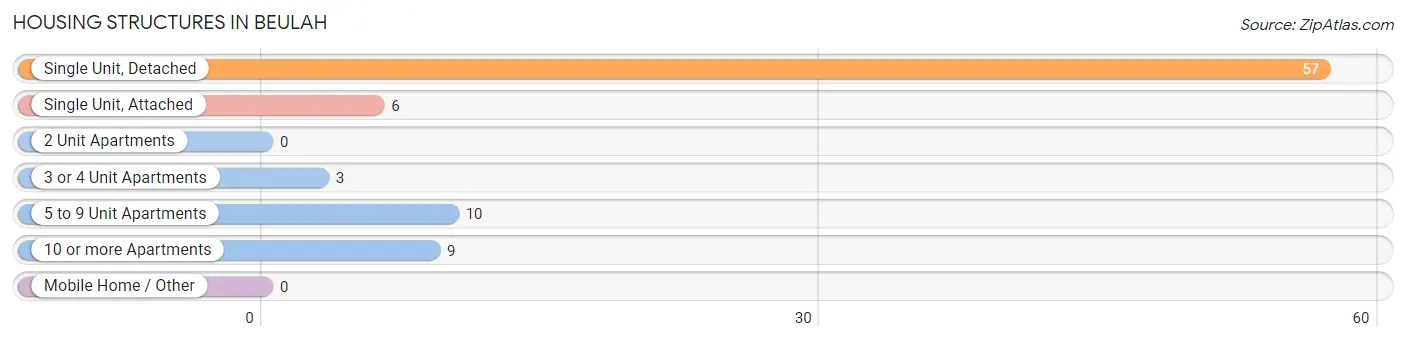
| Structure Type | # Housing Units | % Housing Units |
| Single Unit, Detached | 57 | 67.1% |
| Single Unit, Attached | 6 | 7.1% |
| 2 Unit Apartments | 0 | 0.0% |
| 3 or 4 Unit Apartments | 3 | 3.5% |
| 5 to 9 Unit Apartments | 10 | 11.8% |
| 10 or more Apartments | 9 | 10.6% |
| Mobile Home / Other | 0 | 0.0% |
| Total | 85 | 100.0% |
Housing Structures by Occupancy in Beulah
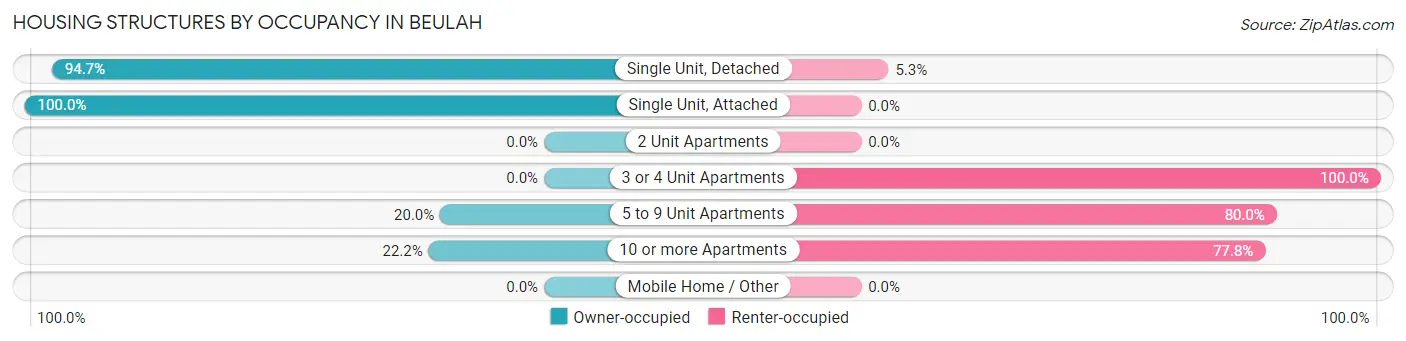
| Structure Type | Owner-occupied | Renter-occupied |
| Single Unit, Detached | 54 (94.7%) | 3 (5.3%) |
| Single Unit, Attached | 6 (100.0%) | 0 (0.0%) |
| 2 Unit Apartments | 0 (0.0%) | 0 (0.0%) |
| 3 or 4 Unit Apartments | 0 (0.0%) | 3 (100.0%) |
| 5 to 9 Unit Apartments | 2 (20.0%) | 8 (80.0%) |
| 10 or more Apartments | 2 (22.2%) | 7 (77.8%) |
| Mobile Home / Other | 0 (0.0%) | 0 (0.0%) |
| Total | 64 (75.3%) | 21 (24.7%) |
Housing Structures by Number of Rooms in Beulah
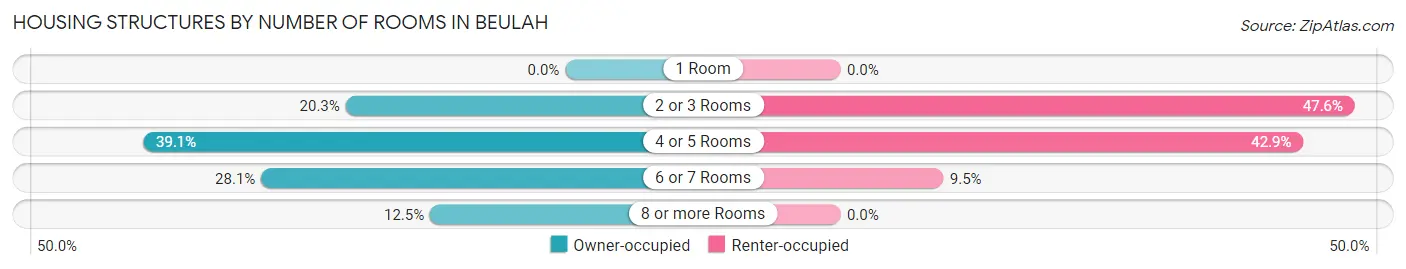
| Number of Rooms | Owner-occupied | Renter-occupied |
| 1 Room | 0 (0.0%) | 0 (0.0%) |
| 2 or 3 Rooms | 13 (20.3%) | 10 (47.6%) |
| 4 or 5 Rooms | 25 (39.1%) | 9 (42.9%) |
| 6 or 7 Rooms | 18 (28.1%) | 2 (9.5%) |
| 8 or more Rooms | 8 (12.5%) | 0 (0.0%) |
| Total | 64 (100.0%) | 21 (100.0%) |
Housing Structure by Heating Type in Beulah
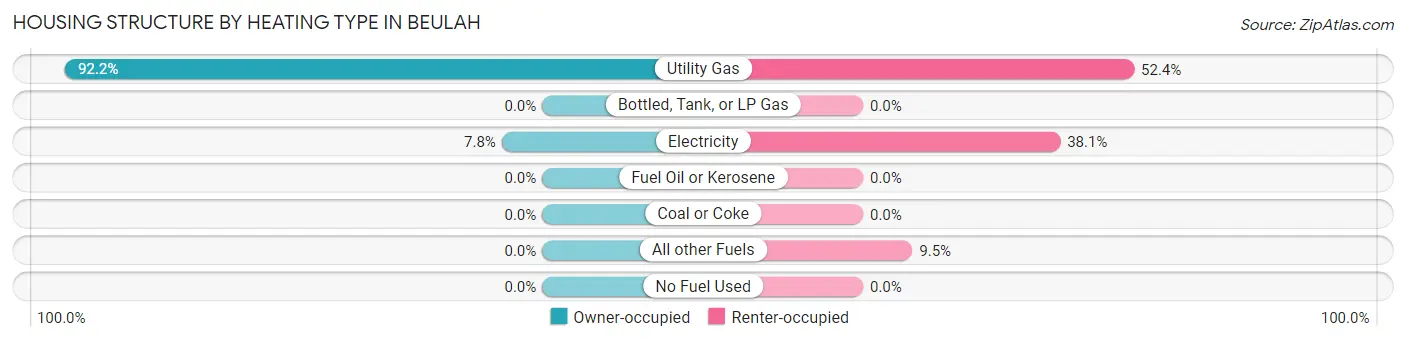
| Heating Type | Owner-occupied | Renter-occupied |
| Utility Gas | 59 (92.2%) | 11 (52.4%) |
| Bottled, Tank, or LP Gas | 0 (0.0%) | 0 (0.0%) |
| Electricity | 5 (7.8%) | 8 (38.1%) |
| Fuel Oil or Kerosene | 0 (0.0%) | 0 (0.0%) |
| Coal or Coke | 0 (0.0%) | 0 (0.0%) |
| All other Fuels | 0 (0.0%) | 2 (9.5%) |
| No Fuel Used | 0 (0.0%) | 0 (0.0%) |
| Total | 64 (100.0%) | 21 (100.0%) |
Household Vehicle Usage in Beulah
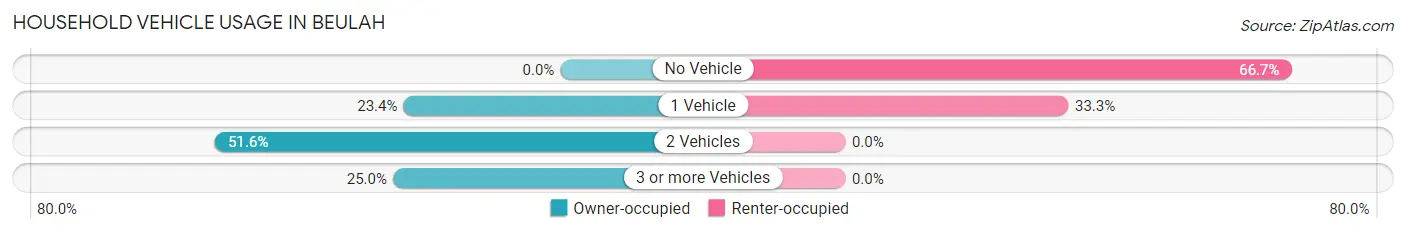
| Vehicles per Household | Owner-occupied | Renter-occupied |
| No Vehicle | 0 (0.0%) | 14 (66.7%) |
| 1 Vehicle | 15 (23.4%) | 7 (33.3%) |
| 2 Vehicles | 33 (51.6%) | 0 (0.0%) |
| 3 or more Vehicles | 16 (25.0%) | 0 (0.0%) |
| Total | 64 (100.0%) | 21 (100.0%) |
Real Estate & Mortgages in Beulah
Real Estate and Mortgage Overview in Beulah
| Characteristic | Without Mortgage | With Mortgage |
| Housing Units | 47 | 17 |
| Median Property Value | $534,100 | $341,700 |
| Median Household Income | $103,750 | $5 |
| Monthly Housing Costs | $725 | $0 |
| Real Estate Taxes | $4,300 | $0 |
Property Value by Mortgage Status in Beulah
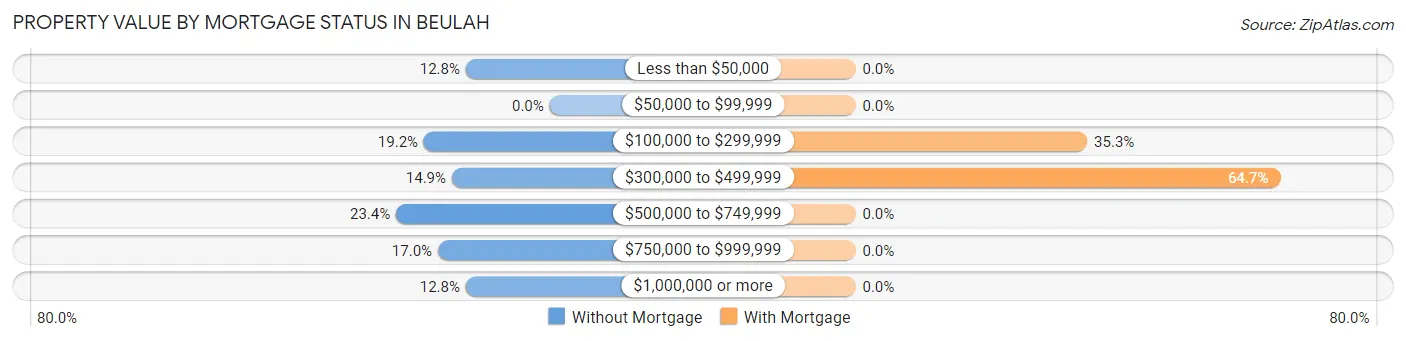
| Property Value | Without Mortgage | With Mortgage |
| Less than $50,000 | 6 (12.8%) | 0 (0.0%) |
| $50,000 to $99,999 | 0 (0.0%) | 0 (0.0%) |
| $100,000 to $299,999 | 9 (19.2%) | 6 (35.3%) |
| $300,000 to $499,999 | 7 (14.9%) | 11 (64.7%) |
| $500,000 to $749,999 | 11 (23.4%) | 0 (0.0%) |
| $750,000 to $999,999 | 8 (17.0%) | 0 (0.0%) |
| $1,000,000 or more | 6 (12.8%) | 0 (0.0%) |
| Total | 47 (100.0%) | 17 (100.0%) |
Household Income by Mortgage Status in Beulah
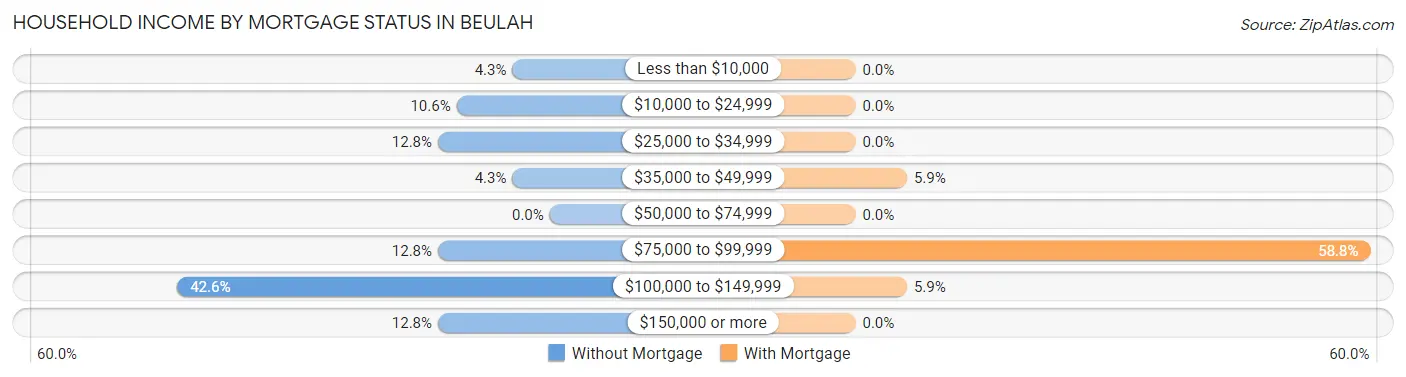
| Household Income | Without Mortgage | With Mortgage |
| Less than $10,000 | 2 (4.3%) | 0 (0.0%) |
| $10,000 to $24,999 | 5 (10.6%) | 0 (0.0%) |
| $25,000 to $34,999 | 6 (12.8%) | 0 (0.0%) |
| $35,000 to $49,999 | 2 (4.3%) | 1 (5.9%) |
| $50,000 to $74,999 | 0 (0.0%) | 0 (0.0%) |
| $75,000 to $99,999 | 6 (12.8%) | 10 (58.8%) |
| $100,000 to $149,999 | 20 (42.5%) | 1 (5.9%) |
| $150,000 or more | 6 (12.8%) | 0 (0.0%) |
| Total | 47 (100.0%) | 17 (100.0%) |
Property Value to Household Income Ratio in Beulah
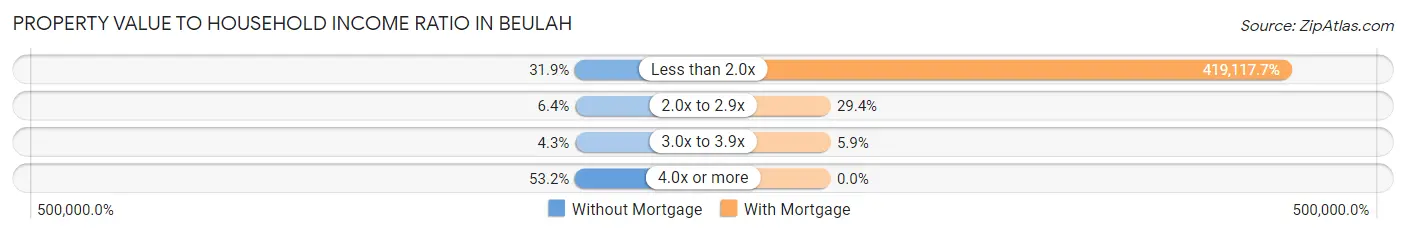
| Value-to-Income Ratio | Without Mortgage | With Mortgage |
| Less than 2.0x | 15 (31.9%) | 71,250 (419,117.6%) |
| 2.0x to 2.9x | 3 (6.4%) | 5 (29.4%) |
| 3.0x to 3.9x | 2 (4.3%) | 1 (5.9%) |
| 4.0x or more | 25 (53.2%) | 0 (0.0%) |
| Total | 47 (100.0%) | 17 (100.0%) |
Real Estate Taxes by Mortgage Status in Beulah
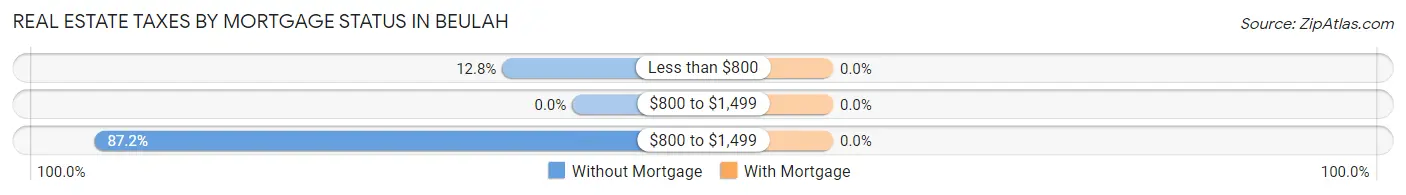
| Property Taxes | Without Mortgage | With Mortgage |
| Less than $800 | 6 (12.8%) | 0 (0.0%) |
| $800 to $1,499 | 0 (0.0%) | 0 (0.0%) |
| $800 to $1,499 | 41 (87.2%) | 0 (0.0%) |
| Total | 47 (100.0%) | 17 (100.0%) |
Health & Disability in Beulah
Health Insurance Coverage by Age in Beulah
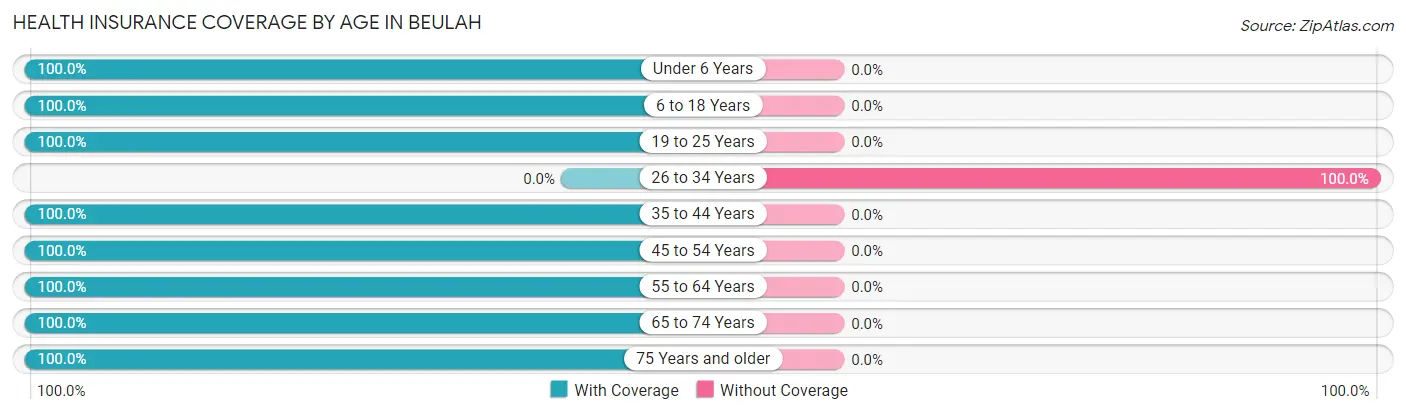
| Age Bracket | With Coverage | Without Coverage |
| Under 6 Years | 6 (100.0%) | 0 (0.0%) |
| 6 to 18 Years | 7 (100.0%) | 0 (0.0%) |
| 19 to 25 Years | 5 (100.0%) | 0 (0.0%) |
| 26 to 34 Years | 0 (0.0%) | 2 (100.0%) |
| 35 to 44 Years | 9 (100.0%) | 0 (0.0%) |
| 45 to 54 Years | 16 (100.0%) | 0 (0.0%) |
| 55 to 64 Years | 27 (100.0%) | 0 (0.0%) |
| 65 to 74 Years | 60 (100.0%) | 0 (0.0%) |
| 75 Years and older | 23 (100.0%) | 0 (0.0%) |
| Total | 153 (98.7%) | 2 (1.3%) |
Health Insurance Coverage by Citizenship Status in Beulah
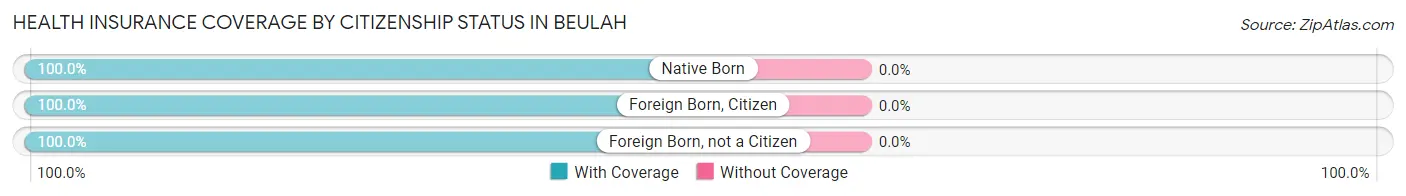
| Citizenship Status | With Coverage | Without Coverage |
| Native Born | 6 (100.0%) | 0 (0.0%) |
| Foreign Born, Citizen | 7 (100.0%) | 0 (0.0%) |
| Foreign Born, not a Citizen | 5 (100.0%) | 0 (0.0%) |
Health Insurance Coverage by Household Income in Beulah
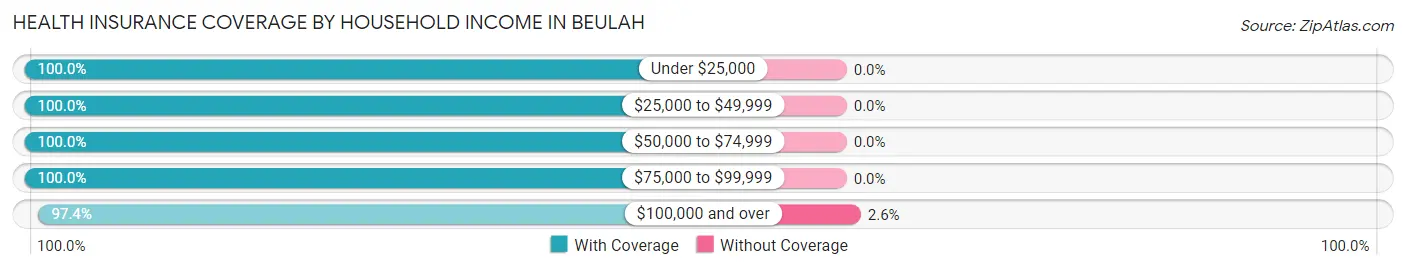
| Household Income | With Coverage | Without Coverage |
| Under $25,000 | 26 (100.0%) | 0 (0.0%) |
| $25,000 to $49,999 | 23 (100.0%) | 0 (0.0%) |
| $50,000 to $74,999 | 21 (100.0%) | 0 (0.0%) |
| $75,000 to $99,999 | 9 (100.0%) | 0 (0.0%) |
| $100,000 and over | 74 (97.4%) | 2 (2.6%) |
Public vs Private Health Insurance Coverage by Age in Beulah
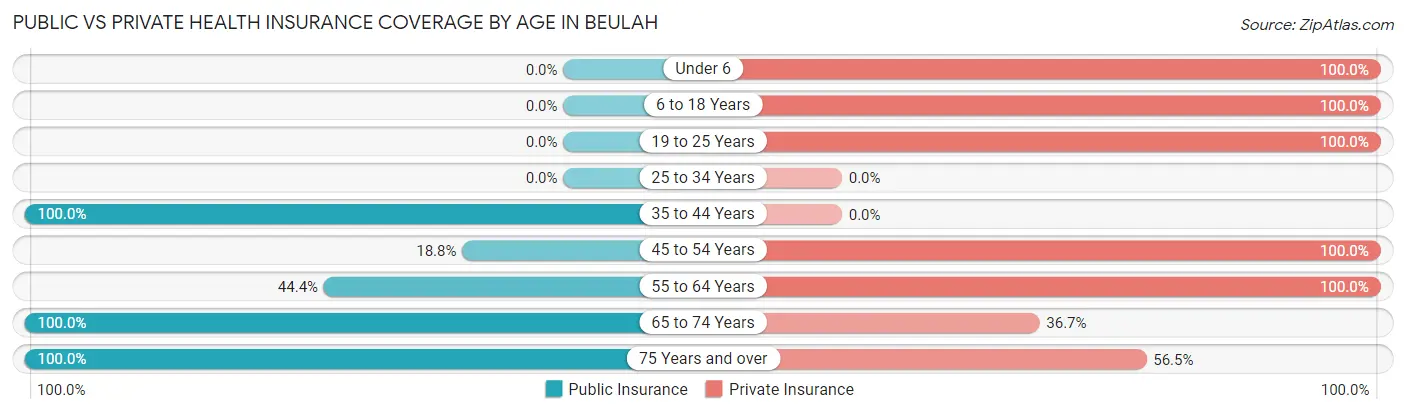
| Age Bracket | Public Insurance | Private Insurance |
| Under 6 | 0 (0.0%) | 6 (100.0%) |
| 6 to 18 Years | 0 (0.0%) | 7 (100.0%) |
| 19 to 25 Years | 0 (0.0%) | 5 (100.0%) |
| 25 to 34 Years | 0 (0.0%) | 0 (0.0%) |
| 35 to 44 Years | 9 (100.0%) | 0 (0.0%) |
| 45 to 54 Years | 3 (18.8%) | 16 (100.0%) |
| 55 to 64 Years | 12 (44.4%) | 27 (100.0%) |
| 65 to 74 Years | 60 (100.0%) | 22 (36.7%) |
| 75 Years and over | 23 (100.0%) | 13 (56.5%) |
| Total | 107 (69.0%) | 96 (61.9%) |
Disability Status by Sex by Age in Beulah
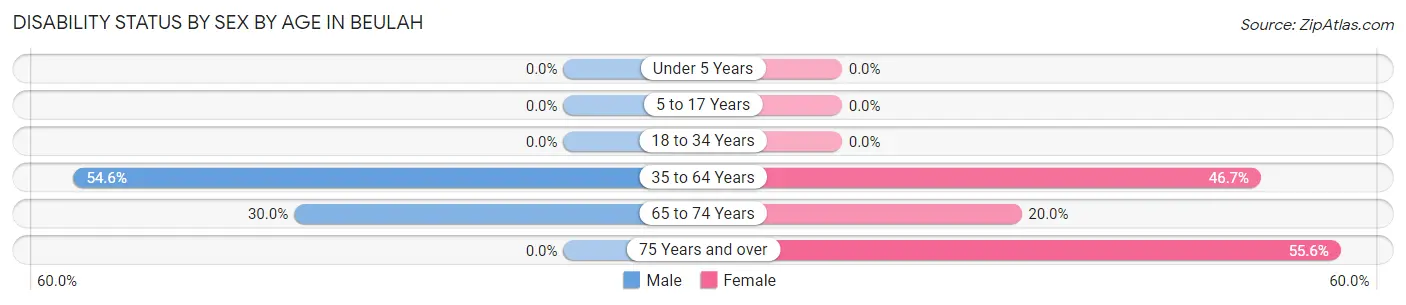
| Age Bracket | Male | Female |
| Under 5 Years | 0 (0.0%) | 0 (0.0%) |
| 5 to 17 Years | 0 (0.0%) | 0 (0.0%) |
| 18 to 34 Years | 0 (0.0%) | 0 (0.0%) |
| 35 to 64 Years | 12 (54.5%) | 14 (46.7%) |
| 65 to 74 Years | 9 (30.0%) | 6 (20.0%) |
| 75 Years and over | 0 (0.0%) | 10 (55.6%) |
Disability Class by Sex by Age in Beulah
Disability Class: Hearing Difficulty
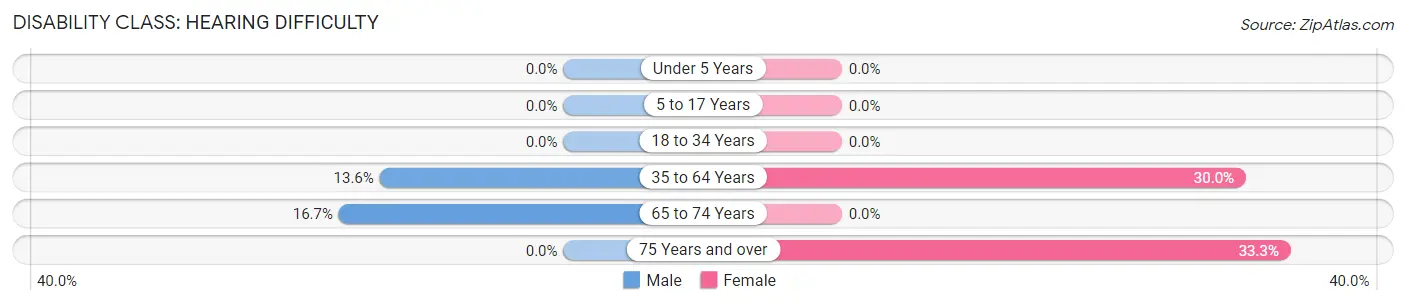
| Age Bracket | Male | Female |
| Under 5 Years | 0 (0.0%) | 0 (0.0%) |
| 5 to 17 Years | 0 (0.0%) | 0 (0.0%) |
| 18 to 34 Years | 0 (0.0%) | 0 (0.0%) |
| 35 to 64 Years | 3 (13.6%) | 9 (30.0%) |
| 65 to 74 Years | 5 (16.7%) | 0 (0.0%) |
| 75 Years and over | 0 (0.0%) | 6 (33.3%) |
Disability Class: Vision Difficulty
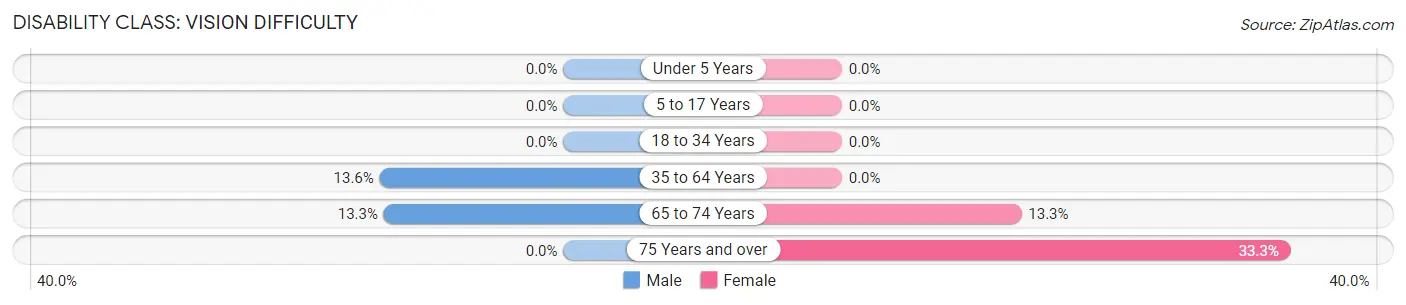
| Age Bracket | Male | Female |
| Under 5 Years | 0 (0.0%) | 0 (0.0%) |
| 5 to 17 Years | 0 (0.0%) | 0 (0.0%) |
| 18 to 34 Years | 0 (0.0%) | 0 (0.0%) |
| 35 to 64 Years | 3 (13.6%) | 0 (0.0%) |
| 65 to 74 Years | 4 (13.3%) | 4 (13.3%) |
| 75 Years and over | 0 (0.0%) | 6 (33.3%) |
Disability Class: Cognitive Difficulty
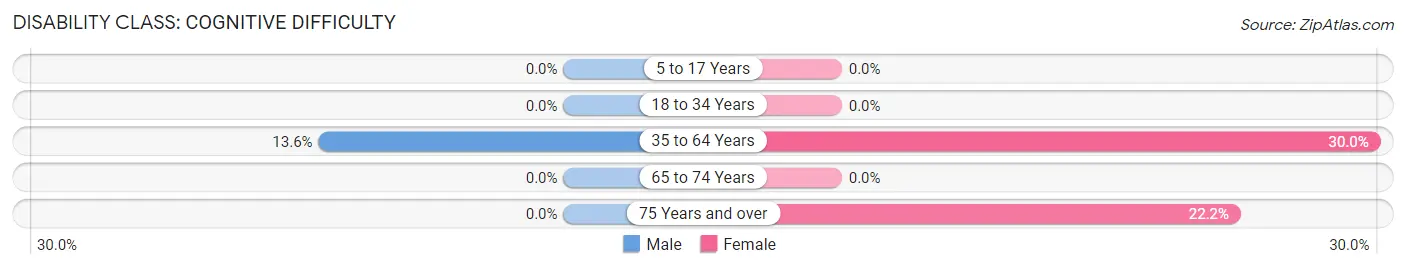
| Age Bracket | Male | Female |
| 5 to 17 Years | 0 (0.0%) | 0 (0.0%) |
| 18 to 34 Years | 0 (0.0%) | 0 (0.0%) |
| 35 to 64 Years | 3 (13.6%) | 9 (30.0%) |
| 65 to 74 Years | 0 (0.0%) | 0 (0.0%) |
| 75 Years and over | 0 (0.0%) | 4 (22.2%) |
Disability Class: Ambulatory Difficulty
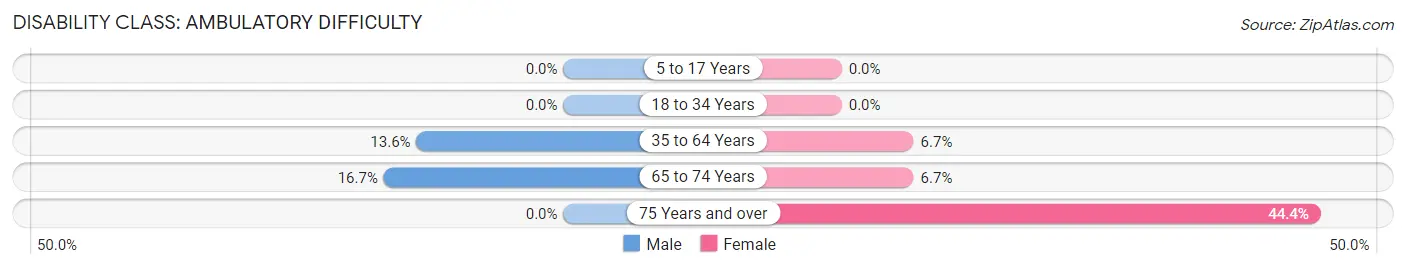
| Age Bracket | Male | Female |
| 5 to 17 Years | 0 (0.0%) | 0 (0.0%) |
| 18 to 34 Years | 0 (0.0%) | 0 (0.0%) |
| 35 to 64 Years | 3 (13.6%) | 2 (6.7%) |
| 65 to 74 Years | 5 (16.7%) | 2 (6.7%) |
| 75 Years and over | 0 (0.0%) | 8 (44.4%) |
Disability Class: Self-Care Difficulty
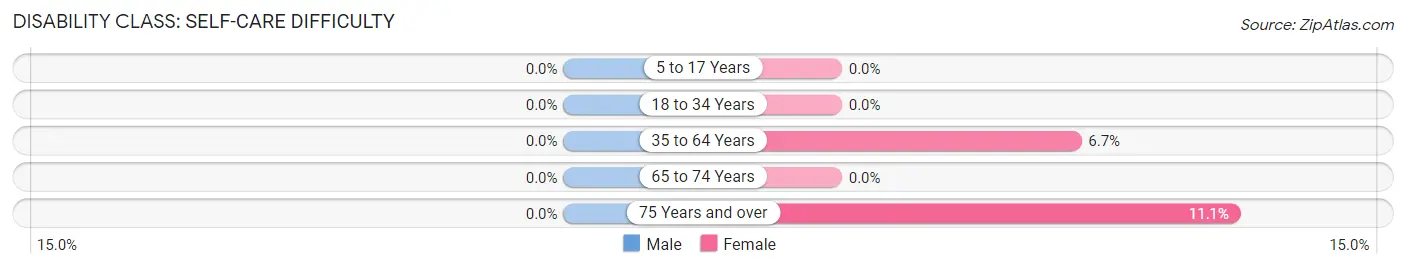
| Age Bracket | Male | Female |
| 5 to 17 Years | 0 (0.0%) | 0 (0.0%) |
| 18 to 34 Years | 0 (0.0%) | 0 (0.0%) |
| 35 to 64 Years | 0 (0.0%) | 2 (6.7%) |
| 65 to 74 Years | 0 (0.0%) | 0 (0.0%) |
| 75 Years and over | 0 (0.0%) | 2 (11.1%) |
Technology Access in Beulah
Computing Device Access in Beulah
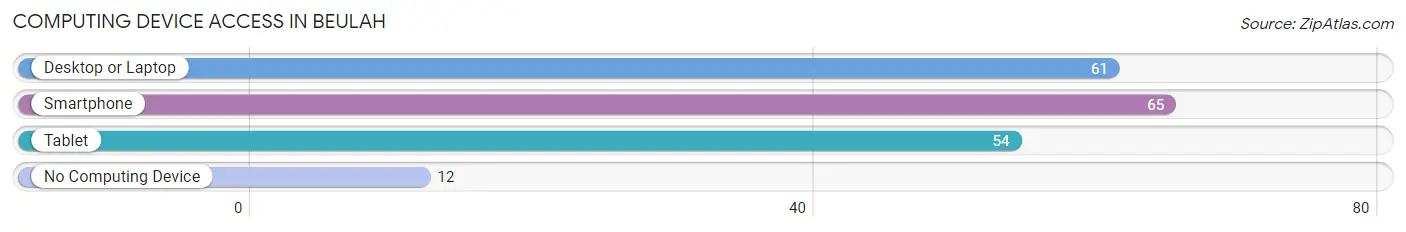
| Device Type | # Households | % Households |
| Desktop or Laptop | 61 | 71.8% |
| Smartphone | 65 | 76.5% |
| Tablet | 54 | 63.5% |
| No Computing Device | 12 | 14.1% |
| Total | 85 | 100.0% |
Internet Access in Beulah
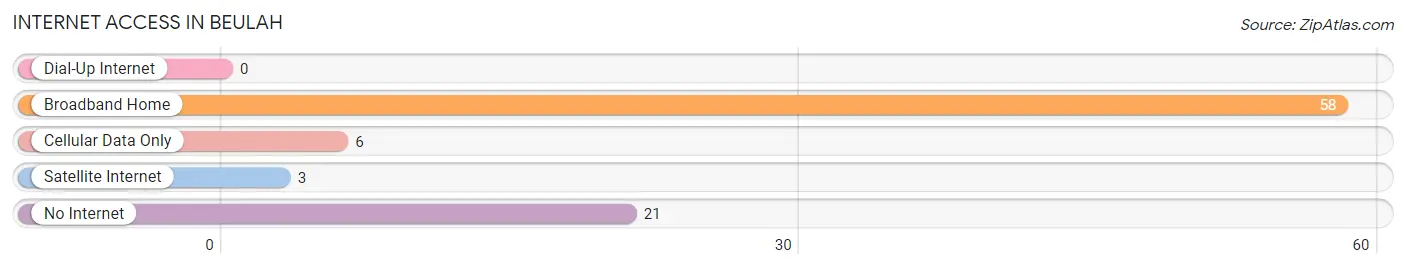
| Internet Type | # Households | % Households |
| Dial-Up Internet | 0 | 0.0% |
| Broadband Home | 58 | 68.2% |
| Cellular Data Only | 6 | 7.1% |
| Satellite Internet | 3 | 3.5% |
| No Internet | 21 | 24.7% |
| Total | 85 | 100.0% |
Beulah Summary
Beulah, Michigan is a small village located in Benzie County in the northwestern part of the state. It is situated on the shores of Crystal Lake, a popular tourist destination. The village has a population of approximately 1,000 people and is known for its quaint charm and rural atmosphere.
Geography
Beulah is located in Benzie County, Michigan, approximately 30 miles northwest of Traverse City. It is situated on the shores of Crystal Lake, a popular tourist destination. The village is surrounded by rolling hills and forests, and is home to a variety of wildlife. The area is known for its beautiful scenery and outdoor activities, such as fishing, boating, and hiking.
The village is located on the eastern shore of Crystal Lake, which is approximately 4 miles long and 1 mile wide. The lake is fed by several small streams and is home to a variety of fish species, including bass, walleye, and northern pike. The lake is also popular for swimming, boating, and other recreational activities.
Economy
Beulah’s economy is largely based on tourism. The village is home to several resorts and hotels, as well as a variety of restaurants and shops. The village also has a marina, which provides boat rentals and other services.
The village is also home to several small businesses, including a grocery store, a hardware store, and a gas station. The village also has a post office and a library.
Demographics
As of the 2010 census, Beulah had a population of 1,000 people. The racial makeup of the village was 97.2% White, 0.7% African American, 0.3% Native American, 0.2% Asian, 0.1% Pacific Islander, 0.2% from other races, and 1.3% from two or more races. Hispanic or Latino of any race were 1.3% of the population.
The median income for a household in Beulah was $37,500, and the median income for a family was $45,000. The per capita income for the village was $20,000. About 8.3% of families and 10.2% of the population were below the poverty line, including 11.3% of those under age 18 and 8.3% of those age 65 or over.
History
Beulah was first settled in 1871 by a group of settlers from Ohio. The village was named after the biblical city of Beulah, which is mentioned in the book of Isaiah. The village was incorporated in 1891 and has remained a small, rural community ever since.
Beulah has a long history of tourism. The village was a popular destination for vacationers in the late 19th and early 20th centuries. The village was also home to several resorts, which attracted visitors from all over the country.
Today, Beulah is still a popular tourist destination. The village is home to several resorts and hotels, as well as a variety of restaurants and shops. The village also has a marina, which provides boat rentals and other services. The village is also home to several small businesses, including a grocery store, a hardware store, and a gas station.
Common Questions
What is the Total Population of Beulah?
Total Population of Beulah is 200.
What is the Total Male Population of Beulah?
Total Male Population of Beulah is 100.
What is the Total Female Population of Beulah?
Total Female Population of Beulah is 100.
What is the Ratio of Males per 100 Females in Beulah?
There are 100.00 Males per 100 Females in Beulah.
What is the Ratio of Females per 100 Males in Beulah?
There are 100.00 Females per 100 Males in Beulah.
What is the Median Population Age in Beulah?
Median Population Age in Beulah is 61.5 Years.
What is the Average Family Size in Beulah
Average Family Size in Beulah is 2.4 People.
What is the Average Household Size in Beulah
Average Household Size in Beulah is 1.8 People.
What is Per Capita Income in Beulah?
Per Capita income in Beulah is $38,872.
What is the Median Family Income in Beulah?
Median Family Income in Beulah is $103,750.
What is the Median Household income in Beulah?
Median Household Income in Beulah is $70,750.
What is Inequality or Gini Index in Beulah?
Inequality or Gini Index in Beulah is 0.52.
How Large is the Labor Force in Beulah?
There are 52 People in the Labor Forcein in Beulah.
What is the Percentage of People in the Labor Force in Beulah?
27.2% of People are in the Labor Force in Beulah.
What is the Unemployment Rate in Beulah?
Unemployment Rate in Beulah is 5.8%.