Cities with the Highest Percentage of Population Employed in Health Care & Social Assistance in Delaware
RELATED REPORTS & OPTIONS
Health Care & Social Assistance
Delaware
Compare Cities
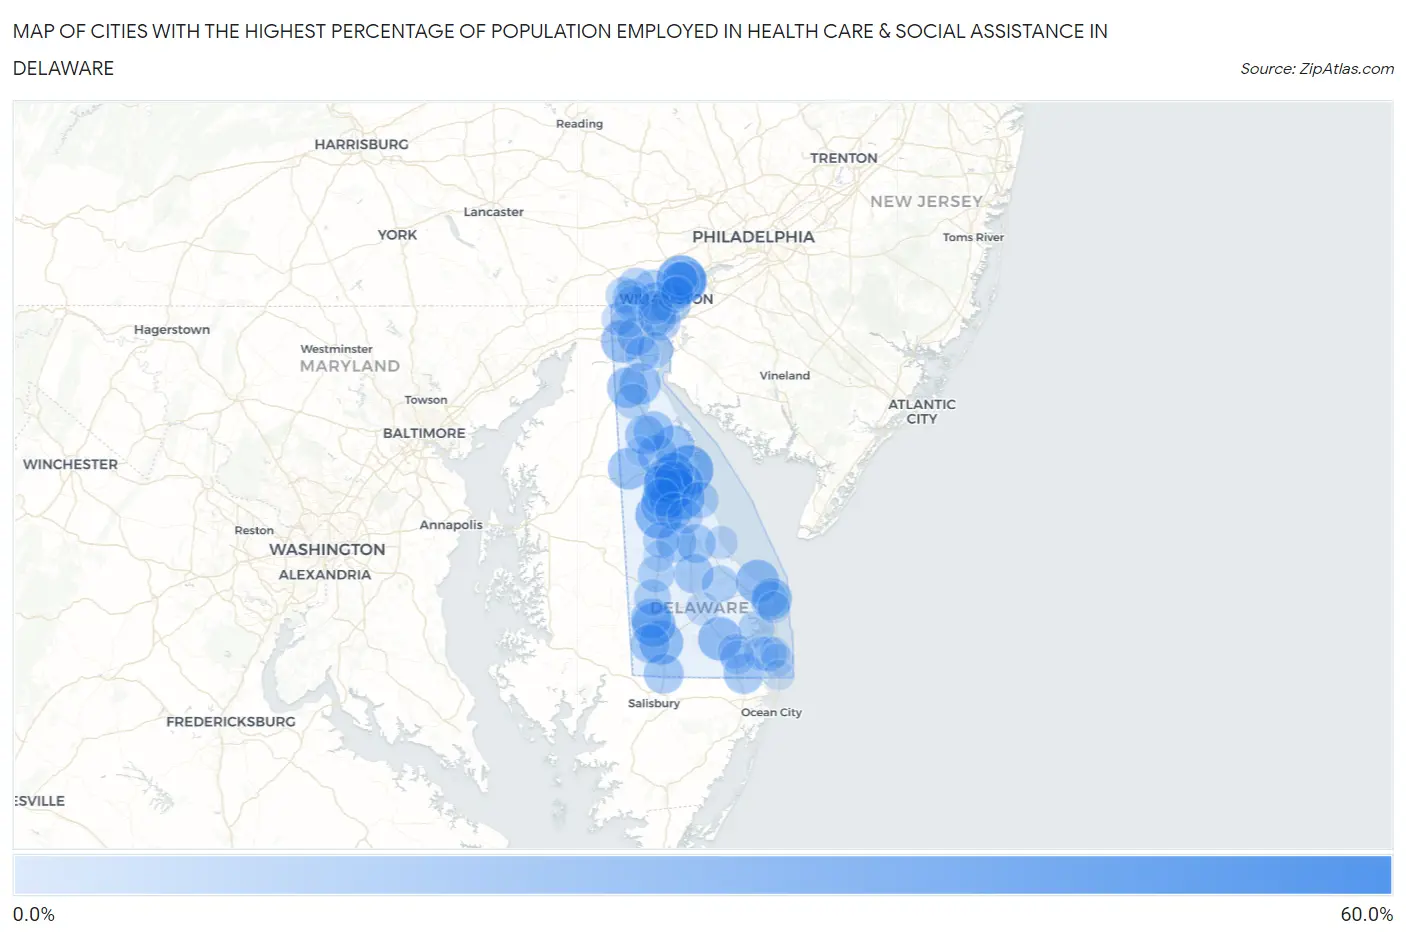
Map of Cities with the Highest Percentage of Population Employed in Health Care & Social Assistance in Delaware
0.0%
60.0%
Cities with the Highest Percentage of Population Employed in Health Care & Social Assistance in Delaware
| City | % Employed | vs State | vs National | |
| 1. | Lincoln | 53.1% | 14.8%(+38.3)#1 | 13.9%(+39.2)#275 |
| 2. | Port Penn | 39.1% | 14.8%(+24.3)#2 | 13.9%(+25.2)#628 |
| 3. | Little Creek | 33.1% | 14.8%(+18.3)#3 | 13.9%(+19.2)#1,074 |
| 4. | Ardentown | 33.0% | 14.8%(+18.2)#4 | 13.9%(+19.1)#1,077 |
| 5. | Felton | 28.6% | 14.8%(+13.8)#5 | 13.9%(+14.7)#1,700 |
| 6. | Rodney Village | 25.4% | 14.8%(+10.6)#6 | 13.9%(+11.5)#2,467 |
| 7. | Dover Base Housing | 24.3% | 14.8%(+9.46)#7 | 13.9%(+10.4)#2,870 |
| 8. | Laurel | 24.3% | 14.8%(+9.45)#8 | 13.9%(+10.3)#2,872 |
| 9. | Magnolia | 24.1% | 14.8%(+9.31)#9 | 13.9%(+10.2)#2,929 |
| 10. | Blades | 23.9% | 14.8%(+9.07)#10 | 13.9%(+9.97)#3,020 |
| 11. | Millsboro | 23.5% | 14.8%(+8.67)#11 | 13.9%(+9.56)#3,203 |
| 12. | Lewes | 22.7% | 14.8%(+7.83)#12 | 13.9%(+8.73)#3,614 |
| 13. | Glasgow | 22.2% | 14.8%(+7.40)#13 | 13.9%(+8.30)#3,803 |
| 14. | Claymont | 20.4% | 14.8%(+5.55)#14 | 13.9%(+6.45)#5,103 |
| 15. | Henlopen Acres | 20.3% | 14.8%(+5.48)#15 | 13.9%(+6.38)#5,171 |
| 16. | Hartly | 20.3% | 14.8%(+5.46)#16 | 13.9%(+6.35)#5,185 |
| 17. | Leipsic | 20.2% | 14.8%(+5.39)#17 | 13.9%(+6.29)#5,234 |
| 18. | Odessa | 19.9% | 14.8%(+5.05)#18 | 13.9%(+5.94)#5,553 |
| 19. | Viola | 19.5% | 14.8%(+4.68)#19 | 13.9%(+5.58)#5,861 |
| 20. | Highland Acres | 19.1% | 14.8%(+4.23)#20 | 13.9%(+5.13)#6,272 |
| 21. | Middletown | 18.9% | 14.8%(+4.05)#21 | 13.9%(+4.95)#6,468 |
| 22. | Seaford | 18.6% | 14.8%(+3.75)#22 | 13.9%(+4.65)#6,780 |
| 23. | Dover | 17.7% | 14.8%(+2.89)#23 | 13.9%(+3.79)#7,781 |
| 24. | Selbyville | 17.6% | 14.8%(+2.81)#24 | 13.9%(+3.71)#7,915 |
| 25. | Cheswold | 17.4% | 14.8%(+2.59)#25 | 13.9%(+3.49)#8,187 |
| 26. | Smyrna | 17.4% | 14.8%(+2.57)#26 | 13.9%(+3.47)#8,219 |
| 27. | Clayton | 17.3% | 14.8%(+2.49)#27 | 13.9%(+3.38)#8,325 |
| 28. | Delmar | 17.3% | 14.8%(+2.44)#28 | 13.9%(+3.34)#8,395 |
| 29. | Houston | 17.1% | 14.8%(+2.23)#29 | 13.9%(+3.13)#8,687 |
| 30. | Rising Sun Lebanon | 16.8% | 14.8%(+1.96)#30 | 13.9%(+2.85)#9,032 |
| 31. | Wilmington | 16.7% | 14.8%(+1.85)#31 | 13.9%(+2.75)#9,176 |
| 32. | Ellendale | 16.5% | 14.8%(+1.66)#32 | 13.9%(+2.55)#9,481 |
| 33. | Camden | 16.4% | 14.8%(+1.58)#33 | 13.9%(+2.47)#9,586 |
| 34. | Bethel | 16.0% | 14.8%(+1.13)#34 | 13.9%(+2.03)#10,258 |
| 35. | Woodside East | 15.9% | 14.8%(+1.06)#35 | 13.9%(+1.95)#10,398 |
| 36. | Milford | 15.8% | 14.8%(+0.976)#36 | 13.9%(+1.87)#10,508 |
| 37. | Ardencroft | 15.8% | 14.8%(+0.957)#37 | 13.9%(+1.85)#10,542 |
| 38. | Elsmere | 15.4% | 14.8%(+0.615)#38 | 13.9%(+1.51)#11,104 |
| 39. | New Castle | 15.4% | 14.8%(+0.554)#39 | 13.9%(+1.45)#11,201 |
| 40. | Wyoming | 15.3% | 14.8%(+0.431)#40 | 13.9%(+1.33)#11,412 |
| 41. | Kent Acres | 15.1% | 14.8%(+0.234)#41 | 13.9%(+1.13)#11,761 |
| 42. | Bear | 14.7% | 14.8%(-0.126)#42 | 13.9%(+0.770)#12,384 |
| 43. | Greenville | 14.5% | 14.8%(-0.380)#43 | 13.9%(+0.517)#12,902 |
| 44. | Woodside | 14.3% | 14.8%(-0.547)#44 | 13.9%(+0.350)#13,212 |
| 45. | Wilmington Manor | 13.8% | 14.8%(-1.03)#45 | 13.9%(-0.129)#14,137 |
| 46. | Riverview | 13.1% | 14.8%(-1.73)#46 | 13.9%(-0.829)#15,513 |
| 47. | Hockessin | 13.0% | 14.8%(-1.85)#47 | 13.9%(-0.958)#15,742 |
| 48. | Bowers | 12.7% | 14.8%(-2.09)#48 | 13.9%(-1.19)#16,204 |
| 49. | Greenwood | 12.3% | 14.8%(-2.52)#49 | 13.9%(-1.62)#17,014 |
| 50. | Bridgeville | 12.3% | 14.8%(-2.55)#50 | 13.9%(-1.65)#17,068 |
| 51. | Milton | 12.1% | 14.8%(-2.70)#51 | 13.9%(-1.80)#17,367 |
| 52. | Pike Creek | 11.9% | 14.8%(-2.97)#52 | 13.9%(-2.08)#17,883 |
| 53. | Harrington | 11.8% | 14.8%(-3.00)#53 | 13.9%(-2.10)#17,933 |
| 54. | Pike Creek Valley | 11.1% | 14.8%(-3.69)#54 | 13.9%(-2.80)#19,211 |
| 55. | Edgemoor | 11.1% | 14.8%(-3.78)#55 | 13.9%(-2.88)#19,360 |
| 56. | Delaware City | 11.0% | 14.8%(-3.82)#56 | 13.9%(-2.92)#19,411 |
| 57. | North Star | 10.9% | 14.8%(-3.90)#57 | 13.9%(-3.00)#19,539 |
| 58. | Long Neck | 10.7% | 14.8%(-4.11)#58 | 13.9%(-3.21)#19,887 |
| 59. | Rehoboth Beach | 10.5% | 14.8%(-4.32)#59 | 13.9%(-3.43)#20,235 |
| 60. | Ocean View | 10.3% | 14.8%(-4.49)#60 | 13.9%(-3.59)#20,525 |
| 61. | Townsend | 10.0% | 14.8%(-4.80)#61 | 13.9%(-3.90)#21,008 |
| 62. | Frederica | 9.9% | 14.8%(-4.92)#62 | 13.9%(-4.02)#21,188 |
| 63. | Dagsboro | 9.2% | 14.8%(-5.63)#63 | 13.9%(-4.73)#22,204 |
| 64. | St Georges | 9.1% | 14.8%(-5.76)#64 | 13.9%(-4.86)#22,434 |
| 65. | Arden | 8.4% | 14.8%(-6.47)#65 | 13.9%(-5.57)#23,309 |
| 66. | Millville | 8.3% | 14.8%(-6.56)#66 | 13.9%(-5.66)#23,435 |
| 67. | Frankford | 8.2% | 14.8%(-6.59)#67 | 13.9%(-5.69)#23,469 |
| 68. | Newark | 8.2% | 14.8%(-6.68)#68 | 13.9%(-5.78)#23,575 |
| 69. | Newport | 7.9% | 14.8%(-6.88)#69 | 13.9%(-5.99)#23,811 |
| 70. | Georgetown | 6.9% | 14.8%(-7.94)#70 | 13.9%(-7.04)#24,942 |
| 71. | Slaughter Beach | 6.3% | 14.8%(-8.51)#71 | 13.9%(-7.61)#25,441 |
| 72. | South Bethany | 6.2% | 14.8%(-8.58)#72 | 13.9%(-7.69)#25,492 |
| 73. | Bellefonte | 6.1% | 14.8%(-8.77)#73 | 13.9%(-7.88)#25,676 |
| 74. | Brookside | 5.5% | 14.8%(-9.31)#74 | 13.9%(-8.42)#26,107 |
| 75. | Dewey Beach | 5.2% | 14.8%(-9.63)#75 | 13.9%(-8.73)#26,325 |
| 76. | Farmington | 3.4% | 14.8%(-11.4)#76 | 13.9%(-10.5)#27,371 |
| 77. | Bethany Beach | 2.8% | 14.8%(-12.0)#77 | 13.9%(-11.1)#27,626 |
| 78. | Fenwick Island | 2.8% | 14.8%(-12.0)#78 | 13.9%(-11.1)#27,629 |
| 79. | Kenton | 1.2% | 14.8%(-13.6)#79 | 13.9%(-12.7)#28,111 |
1
Common Questions
What are the Top 10 Cities with the Highest Percentage of Population Employed in Health Care & Social Assistance in Delaware?
Top 10 Cities with the Highest Percentage of Population Employed in Health Care & Social Assistance in Delaware are:
#1
33.1%
#2
33.0%
#3
28.6%
#4
25.4%
#5
24.3%
#6
24.3%
#7
24.1%
#8
23.9%
#9
23.5%
#10
22.7%
What city has the Highest Percentage of Population Employed in Health Care & Social Assistance in Delaware?
Little Creek has the Highest Percentage of Population Employed in Health Care & Social Assistance in Delaware with 33.1%.
What is the Percentage of Population Employed in Health Care & Social Assistance in the State of Delaware?
Percentage of Population Employed in Health Care & Social Assistance in Delaware is 14.8%.
What is the Percentage of Population Employed in Health Care & Social Assistance in the United States?
Percentage of Population Employed in Health Care & Social Assistance in the United States is 13.9%.