Cities with the Most Immigrants from Chile in Utah
RELATED REPORTS & OPTIONS
Chile
Utah
Compare Cities
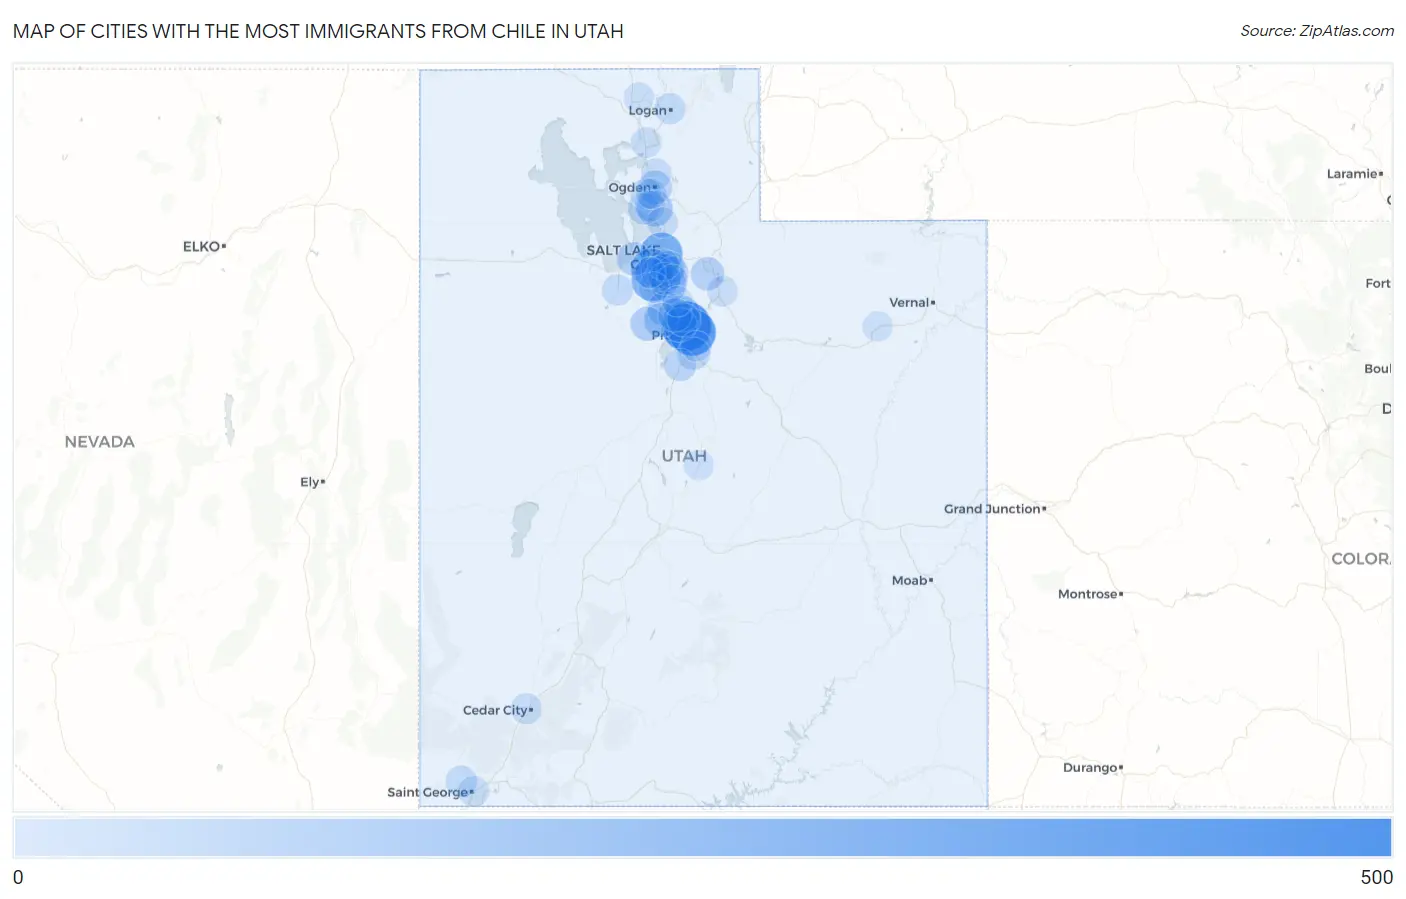
Map of Cities with the Most Immigrants from Chile in Utah
0
500
Cities with the Most Immigrants from Chile in Utah
| City | Chile | vs State | vs National | |
| 1. | Orem | 446 | 3,479(12.82%)#1 | 106,565(0.42%)#18 |
| 2. | Provo | 376 | 3,479(10.81%)#2 | 106,565(0.35%)#27 |
| 3. | Salt Lake City | 279 | 3,479(8.02%)#3 | 106,565(0.26%)#42 |
| 4. | West Jordan | 269 | 3,479(7.73%)#4 | 106,565(0.25%)#48 |
| 5. | West Valley City | 226 | 3,479(6.50%)#5 | 106,565(0.21%)#67 |
| 6. | Murray | 154 | 3,479(4.43%)#6 | 106,565(0.14%)#116 |
| 7. | Pleasant Grove | 123 | 3,479(3.54%)#7 | 106,565(0.12%)#154 |
| 8. | Layton | 122 | 3,479(3.51%)#8 | 106,565(0.11%)#155 |
| 9. | Sandy | 114 | 3,479(3.28%)#9 | 106,565(0.11%)#170 |
| 10. | Lehi | 104 | 3,479(2.99%)#10 | 106,565(0.10%)#191 |
| 11. | Saratoga Springs | 93 | 3,479(2.67%)#11 | 106,565(0.09%)#218 |
| 12. | Eagle Mountain | 86 | 3,479(2.47%)#12 | 106,565(0.08%)#242 |
| 13. | Vineyard | 84 | 3,479(2.41%)#13 | 106,565(0.08%)#246 |
| 14. | Ogden | 78 | 3,479(2.24%)#14 | 106,565(0.07%)#271 |
| 15. | Magna | 76 | 3,479(2.18%)#15 | 106,565(0.07%)#278 |
| 16. | American Fork | 75 | 3,479(2.16%)#16 | 106,565(0.07%)#283 |
| 17. | Park City | 75 | 3,479(2.16%)#17 | 106,565(0.07%)#286 |
| 18. | Lindon | 68 | 3,479(1.95%)#18 | 106,565(0.06%)#319 |
| 19. | Millcreek | 67 | 3,479(1.93%)#19 | 106,565(0.06%)#322 |
| 20. | Taylorsville | 53 | 3,479(1.52%)#20 | 106,565(0.05%)#401 |
| 21. | Spanish Fork | 53 | 3,479(1.52%)#21 | 106,565(0.05%)#403 |
| 22. | Payson | 48 | 3,479(1.38%)#22 | 106,565(0.05%)#442 |
| 23. | Holladay | 44 | 3,479(1.26%)#23 | 106,565(0.04%)#478 |
| 24. | Midvale | 41 | 3,479(1.18%)#24 | 106,565(0.04%)#524 |
| 25. | Syracuse | 36 | 3,479(1.03%)#25 | 106,565(0.03%)#576 |
| 26. | Ivins | 27 | 3,479(0.78%)#26 | 106,565(0.03%)#712 |
| 27. | Tooele | 23 | 3,479(0.66%)#27 | 106,565(0.02%)#783 |
| 28. | South Salt Lake | 22 | 3,479(0.63%)#28 | 106,565(0.02%)#806 |
| 29. | Roy | 20 | 3,479(0.57%)#29 | 106,565(0.02%)#846 |
| 30. | Logan | 19 | 3,479(0.55%)#30 | 106,565(0.02%)#879 |
| 31. | Cedar City | 18 | 3,479(0.52%)#31 | 106,565(0.02%)#908 |
| 32. | North Ogden | 15 | 3,479(0.43%)#32 | 106,565(0.01%)#1,011 |
| 33. | Clearfield | 14 | 3,479(0.40%)#33 | 106,565(0.01%)#1,047 |
| 34. | Brigham City | 14 | 3,479(0.40%)#34 | 106,565(0.01%)#1,053 |
| 35. | Cottonwood Heights | 13 | 3,479(0.37%)#35 | 106,565(0.01%)#1,088 |
| 36. | St George | 12 | 3,479(0.34%)#36 | 106,565(0.01%)#1,121 |
| 37. | Farmington | 12 | 3,479(0.34%)#37 | 106,565(0.01%)#1,135 |
| 38. | South Jordan | 11 | 3,479(0.32%)#38 | 106,565(0.01%)#1,161 |
| 39. | Springville | 11 | 3,479(0.32%)#39 | 106,565(0.01%)#1,166 |
| 40. | Heber | 11 | 3,479(0.32%)#40 | 106,565(0.01%)#1,181 |
| 41. | Kearns | 9 | 3,479(0.26%)#41 | 106,565(0.01%)#1,260 |
| 42. | White | 9 | 3,479(0.26%)#42 | 106,565(0.01%)#1,284 |
| 43. | Riverdale | 7 | 3,479(0.20%)#43 | 106,565(0.01%)#1,373 |
| 44. | Alpine | 5 | 3,479(0.14%)#44 | 106,565(0.00%)#1,441 |
| 45. | Fielding | 3 | 3,479(0.09%)#45 | 106,565(0.00%)#1,522 |
| 46. | Roosevelt | 2 | 3,479(0.06%)#46 | 106,565(0.00%)#1,534 |
| 47. | Ephraim | 1 | 3,479(0.03%)#47 | 106,565(0.00%)#1,565 |
Common Questions
What are the Top 10 Cities with the Most Immigrants from Chile in Utah?
Top 10 Cities with the Most Immigrants from Chile in Utah are:
#1
446
#2
376
#3
279
#4
269
#5
226
#6
154
#7
123
#8
122
#9
114
#10
104
What city has the Most Immigrants from Chile in Utah?
Orem has the Most Immigrants from Chile in Utah with 446.
What is the Total Immigrants from Chile in the State of Utah?
Total Immigrants from Chile in Utah is 3,479.
What is the Total Immigrants from Chile in the United States?
Total Immigrants from Chile in the United States is 106,565.