Immigrants from Russia vs Immigrants from Eastern Africa 1 or more Vehicles in Household

COMPARE

Immigrants from Russia
Race
Ancestry
AfghanAfricanAlaska NativeAlaskan AthabascanAlbanianAleutAlsatianAmericanApacheArabArapahoArgentineanArmenianAssyrian/Chaldean/SyriacAustralianAustrianBahamianBangladeshiBarbadianBasqueBelgianBelizeanBermudanBhutaneseBlackfeetBolivianBrazilianBritishBritish West IndianBulgarianBurmeseCajunCambodianCanadianCape VerdeanCarpatho RusynCelticCentral AmericanCentral American IndianCherokeeCheyenneChickasawChileanChineseChippewaChoctawColombianColvilleComancheCosta RicanCreeCreekCroatianCrowCubanCypriotCzechCzechoslovakianDanishDelawareDominicanDutchDutch West IndianEastern EuropeanEcuadorianEgyptianEnglishEstonianEthiopianEuropeanFijianFilipinoFinnishFrenchFrench American IndianFrench CanadianGermanGerman RussianGhanaianGreekGuamanian/ChamorroGuatemalanGuyaneseHaitianHmongHonduranHopiHoumaHungarianIcelanderIndian (Asian)IndonesianInupiatIranianIraqiIrishIroquoisIsraeliItalianJamaicanJapaneseJordanianKenyanKiowaKoreanLaotianLatvianLebaneseLiberianLithuanianLumbeeLuxembourgerMacedonianMalaysianMalteseMarshalleseMenomineeMexicanMexican American IndianMongolianMoroccanNative HawaiianNavajoNepaleseNew ZealanderNicaraguanNigerianNorthern EuropeanNorwegianOkinawanOsageOttawaPaiutePakistaniPalestinianPanamanianParaguayanPennsylvania GermanPeruvianPimaPolishPortuguesePotawatomiPuebloPuerto RicanPuget Sound SalishRomanianRussianSalvadoranSamoanScandinavianScotch-IrishScottishSeminoleSenegaleseSerbianShoshoneSierra LeoneanSiouxSlavicSlovakSloveneSomaliSouth AfricanSouth AmericanSouth American IndianSoviet UnionSpaniardSpanishSpanish AmericanSpanish American IndianSri LankanSubsaharan AfricanSudaneseSwedishSwissSyrianTaiwaneseThaiTlingit-HaidaTohono O'OdhamTonganTrinidadian and TobagonianTsimshianTurkishU.S. Virgin IslanderUgandanUkrainianUruguayanUteVenezuelanVietnameseWelshWest IndianYakamaYaquiYugoslavianYumanYup'ikZimbabwean
Immigration
NonimmigrantsImmigrantsAfghanistanAfricaAlbaniaArgentinaArmeniaAsiaAustraliaAustriaBahamasBangladeshBarbadosBelarusBelgiumBelizeBoliviaBosnia and HerzegovinaBrazilBulgariaBurma/MyanmarCabo VerdeCambodiaCameroonCanadaCaribbeanCentral AmericaChileChinaColombiaCongoCosta RicaCroatiaCubaCzechoslovakiaDenmarkDominicaDominican RepublicEastern AsiaEastern EuropeEcuadorEgyptEl SalvadorEnglandEritreaEthiopiaEuropeFijiFranceGermanyGhanaGreeceGrenadaGuatemalaGuyanaHaitiHondurasHong KongHungaryIndiaIndonesiaIranIraqIrelandIsraelItalyJamaicaJapanJordanKazakhstanKenyaKoreaKuwaitLaosLatin AmericaLatviaLebanonLiberiaLithuaniaMalaysiaMexicoMicronesiaMiddle AfricaMoldovaMoroccoNepalNetherlandsNicaraguaNigeriaNorth AmericaNorth MacedoniaNorthern AfricaNorthern EuropeNorwayOceaniaPakistanPanamaPeruPhilippinesPolandPortugalRomaniaRussiaSaudi ArabiaScotlandSenegalSerbiaSierra LeoneSingaporeSomaliaSouth AfricaSouth AmericaSouth Central AsiaSouth Eastern AsiaSouthern EuropeSpainSri LankaSt. Vincent and the GrenadinesSudanSwedenSwitzerlandSyriaTaiwanThailandTrinidad and TobagoTurkeyUgandaUkraineUruguayUzbekistanVenezuelaVietnamWest IndiesWestern AfricaWestern AsiaWestern EuropeYemenZaireZimbabweAzores
Immigrants from Eastern Africa
Race
Ancestry
AfghanAfricanAlaska NativeAlaskan AthabascanAlbanianAleutAlsatianAmericanApacheArabArapahoArgentineanArmenianAssyrian/Chaldean/SyriacAustralianAustrianBahamianBangladeshiBarbadianBasqueBelgianBelizeanBermudanBhutaneseBlackfeetBolivianBrazilianBritishBritish West IndianBulgarianBurmeseCajunCambodianCanadianCape VerdeanCarpatho RusynCelticCentral AmericanCentral American IndianCherokeeCheyenneChickasawChileanChineseChippewaChoctawColombianColvilleComancheCosta RicanCreeCreekCroatianCrowCubanCypriotCzechCzechoslovakianDanishDelawareDominicanDutchDutch West IndianEastern EuropeanEcuadorianEgyptianEnglishEstonianEthiopianEuropeanFijianFilipinoFinnishFrenchFrench American IndianFrench CanadianGermanGerman RussianGhanaianGreekGuamanian/ChamorroGuatemalanGuyaneseHaitianHmongHonduranHopiHoumaHungarianIcelanderIndian (Asian)IndonesianInupiatIranianIraqiIrishIroquoisIsraeliItalianJamaicanJapaneseJordanianKenyanKiowaKoreanLaotianLatvianLebaneseLiberianLithuanianLumbeeLuxembourgerMacedonianMalaysianMalteseMarshalleseMenomineeMexicanMexican American IndianMongolianMoroccanNative HawaiianNavajoNepaleseNew ZealanderNicaraguanNigerianNorthern EuropeanNorwegianOkinawanOsageOttawaPaiutePakistaniPalestinianPanamanianParaguayanPennsylvania GermanPeruvianPimaPolishPortuguesePotawatomiPuebloPuerto RicanPuget Sound SalishRomanianRussianSalvadoranSamoanScandinavianScotch-IrishScottishSeminoleSenegaleseSerbianShoshoneSierra LeoneanSiouxSlavicSlovakSloveneSomaliSouth AfricanSouth AmericanSouth American IndianSoviet UnionSpaniardSpanishSpanish AmericanSpanish American IndianSri LankanSubsaharan AfricanSudaneseSwedishSwissSyrianTaiwaneseThaiTlingit-HaidaTohono O'OdhamTonganTrinidadian and TobagonianTsimshianTurkishU.S. Virgin IslanderUgandanUkrainianUruguayanUteVenezuelanVietnameseWelshWest IndianYakamaYaquiYugoslavianYumanYup'ikZimbabwean
Immigration
NonimmigrantsImmigrantsAfghanistanAfricaAlbaniaArgentinaArmeniaAsiaAustraliaAustriaBahamasBangladeshBarbadosBelarusBelgiumBelizeBoliviaBosnia and HerzegovinaBrazilBulgariaBurma/MyanmarCabo VerdeCambodiaCameroonCanadaCaribbeanCentral AmericaChileChinaColombiaCongoCosta RicaCroatiaCubaCzechoslovakiaDenmarkDominicaDominican RepublicEastern AfricaEastern AsiaEastern EuropeEcuadorEgyptEl SalvadorEnglandEritreaEthiopiaEuropeFijiFranceGermanyGhanaGreeceGrenadaGuatemalaGuyanaHaitiHondurasHong KongHungaryIndiaIndonesiaIranIraqIrelandIsraelItalyJamaicaJapanJordanKazakhstanKenyaKoreaKuwaitLaosLatin AmericaLatviaLebanonLiberiaLithuaniaMalaysiaMexicoMicronesiaMiddle AfricaMoldovaMoroccoNepalNetherlandsNicaraguaNigeriaNorth AmericaNorth MacedoniaNorthern AfricaNorthern EuropeNorwayOceaniaPakistanPanamaPeruPhilippinesPolandPortugalRomaniaSaudi ArabiaScotlandSenegalSerbiaSierra LeoneSingaporeSomaliaSouth AfricaSouth AmericaSouth Central AsiaSouth Eastern AsiaSouthern EuropeSpainSri LankaSt. Vincent and the GrenadinesSudanSwedenSwitzerlandSyriaTaiwanThailandTrinidad and TobagoTurkeyUgandaUkraineUruguayUzbekistanVenezuelaVietnamWest IndiesWestern AfricaWestern AsiaWestern EuropeYemenZaireZimbabweAzores
1 or more Vehicles in Household
Income
Poverty
Unemployment
Labor Participation
Family Structure
Vehicle Availability
Education Level
Disability

1 or more Vehicles in Household Comparison

Immigrants from Russia

Immigrants from Eastern Africa

Tragic
Good
85.4%
1 OR MORE VEHICLES IN HOUSEHOLD
0.0/ 100
METRIC RATING
300th/ 347
METRIC RANK
90.1%
1 OR MORE VEHICLES IN HOUSEHOLD
78.2/ 100
METRIC RATING
148th/ 347
METRIC RANK

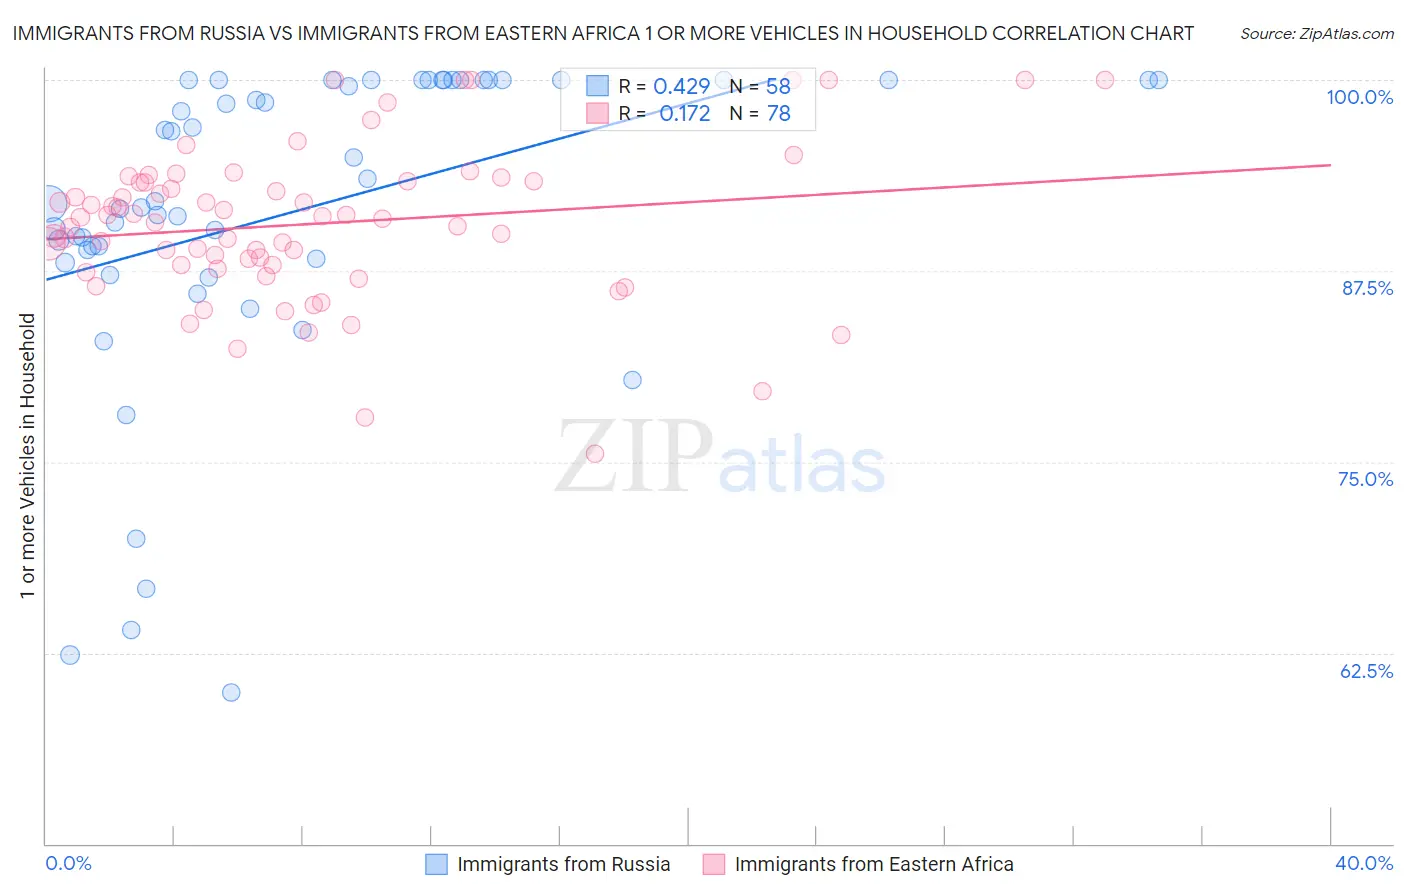
Immigrants from Russia vs Immigrants from Eastern Africa 1 or more Vehicles in Household Correlation Chart

The statistical analysis conducted on geographies consisting of 347,625,185 people shows a moderate positive correlation between the proportion of Immigrants from Russia and percentage of households with 1 or more vehicles available in the United States with a correlation coefficient (R) of 0.429 and weighted average of 85.4%. Similarly, the statistical analysis conducted on geographies consisting of 354,905,659 people shows a poor positive correlation between the proportion of Immigrants from Eastern Africa and percentage of households with 1 or more vehicles available in the United States with a correlation coefficient (R) of 0.172 and weighted average of 90.1%, a difference of 5.5%.
Immigrants from Russia vs Immigrants from Eastern Africa 1 or more Vehicles in Household

1 or more Vehicles in Household Correlation Summary

MeasurementImmigrants from RussiaImmigrants from Eastern Africa
Minimum59.9%75.5%
Maximum100.0%100.0%
Range40.1%24.5%
Mean91.3%90.6%
Median92.0%91.0%
Interquartile 25% (IQ1)88.3%87.9%
Interquartile 75% (IQ3)100.0%93.4%
Interquartile Range (IQR)11.7%5.5%
Standard Deviation (Sample)10.2%5.0%
Standard Deviation (Population)10.1%5.0%

Similar Demographics by 1 or more Vehicles in Household

Demographics Similar to Immigrants from Russia by 1 or more Vehicles in Household

In terms of 1 or more vehicles in household, the demographic groups most similar to Immigrants from Russia are Yuman (85.5%, a difference of 0.0%), Immigrants from Panama (85.4%, a difference of 0.040%), Moroccan (85.4%, a difference of 0.060%), Immigrants from Greece (85.4%, a difference of 0.090%), and Belizean (85.7%, a difference of 0.25%).
DemographicsRating | Rank1 or more Vehicles in Household
Indians (Asian)
0.0
/100
|
#293
Tragic
86.0%
Alaskan Athabascans
0.0
/100
|
#294
Tragic
86.0%
Immigrants | Jamaica
0.0
/100
|
#295
Tragic
85.8%
Immigrants | Spain
0.0
/100
|
#296
Tragic
85.8%
Paraguayans
0.0
/100
|
#297
Tragic
85.7%
Belizeans
0.0
/100
|
#298
Tragic
85.7%
Yuman
0.0
/100
|
#299
Tragic
85.5%
Immigrants | Russia
0.0
/100
|
#300
Tragic
85.4%
Immigrants | Panama
0.0
/100
|
#301
Tragic
85.4%
Moroccans
0.0
/100
|
#302
Tragic
85.4%
Immigrants | Greece
0.0
/100
|
#303
Tragic
85.4%
Immigrants | Ukraine
0.0
/100
|
#304
Tragic
85.2%
Immigrants | China
0.0
/100
|
#305
Tragic
84.9%
Immigrants | Western Africa
0.0
/100
|
#306
Tragic
84.9%
Tohono O'odham
0.0
/100
|
#307
Tragic
84.7%

Demographics Similar to Immigrants from Eastern Africa by 1 or more Vehicles in Household

In terms of 1 or more vehicles in household, the demographic groups most similar to Immigrants from Eastern Africa are Immigrants from Nicaragua (90.1%, a difference of 0.030%), Chilean (90.2%, a difference of 0.040%), Bahamian (90.2%, a difference of 0.050%), Immigrants from Micronesia (90.1%, a difference of 0.050%), and Immigrants from Bosnia and Herzegovina (90.1%, a difference of 0.060%).
DemographicsRating | Rank1 or more Vehicles in Household
Immigrants | Moldova
83.1
/100
|
#141
Excellent
90.2%
Immigrants | Lithuania
83.0
/100
|
#142
Excellent
90.2%
Immigrants | Bahamas
81.5
/100
|
#143
Excellent
90.2%
Immigrants | Zimbabwe
81.5
/100
|
#144
Excellent
90.2%
Sioux
81.3
/100
|
#145
Excellent
90.2%
Bahamians
80.5
/100
|
#146
Excellent
90.2%
Chileans
79.8
/100
|
#147
Good
90.2%
Immigrants | Eastern Africa
78.2
/100
|
#148
Good
90.1%
Immigrants | Nicaragua
76.7
/100
|
#149
Good
90.1%
Immigrants | Micronesia
75.9
/100
|
#150
Good
90.1%
Immigrants | Bosnia and Herzegovina
75.4
/100
|
#151
Good
90.1%
Tlingit-Haida
74.3
/100
|
#152
Good
90.1%
New Zealanders
73.8
/100
|
#153
Good
90.1%
Immigrants | Uganda
73.8
/100
|
#154
Good
90.1%
Immigrants | Immigrants
73.6
/100
|
#155
Good
90.1%