Fate, TX
Fate Map
Fate Overview
19,010
TOTAL POPULATION
9,686
MALE POPULATION
9,324
FEMALE POPULATION
103.88
MALES / 100 FEMALES
96.26
FEMALES / 100 MALES
33.0
MEDIAN AGE
3.4
AVG FAMILY SIZE
3.2
AVG HOUSEHOLD SIZE
$41,305
PER CAPITA INCOME
$126,173
AVG FAMILY INCOME
$121,935
AVG HOUSEHOLD INCOME
45.8%
WAGE / INCOME GAP [ % ]
54.2¢/ $1
WAGE / INCOME GAP [ $ ]
0.30
INEQUALITY / GINI INDEX
10,047
LABOR FORCE [ PEOPLE ]
75.0%
PERCENT IN LABOR FORCE
6.8%
UNEMPLOYMENT RATE
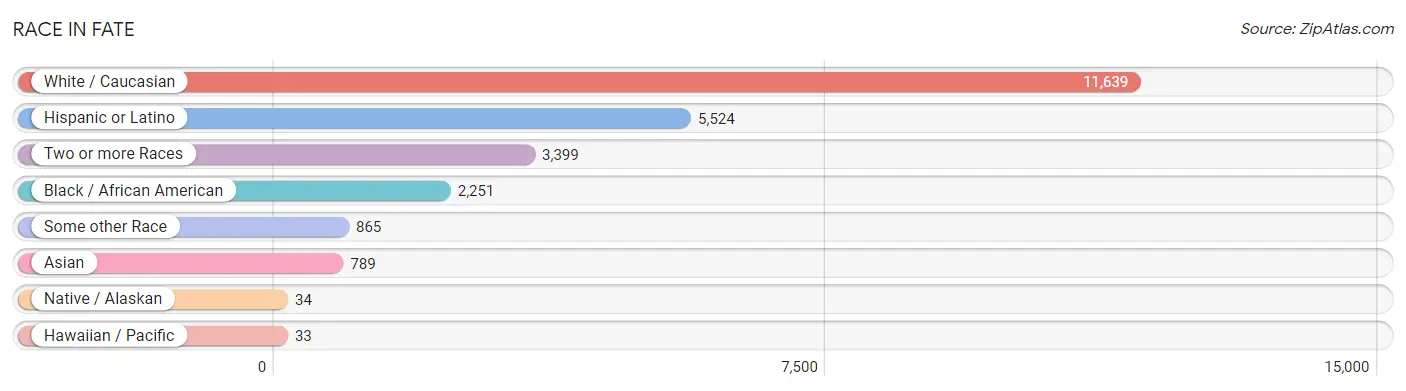
Race in Fate
The most populous races in Fate are White / Caucasian (11,639 | 61.2%), Hispanic or Latino (5,524 | 29.1%), and Two or more Races (3,399 | 17.9%).
| Race | # Population | % Population |
| Asian | 789 | 4.2% |
| Black / African American | 2,251 | 11.8% |
| Hawaiian / Pacific | 33 | 0.2% |
| Hispanic or Latino | 5,524 | 29.1% |
| Native / Alaskan | 34 | 0.2% |
| White / Caucasian | 11,639 | 61.2% |
| Two or more Races | 3,399 | 17.9% |
| Some other Race | 865 | 4.5% |
| Total | 19,010 | 100.0% |
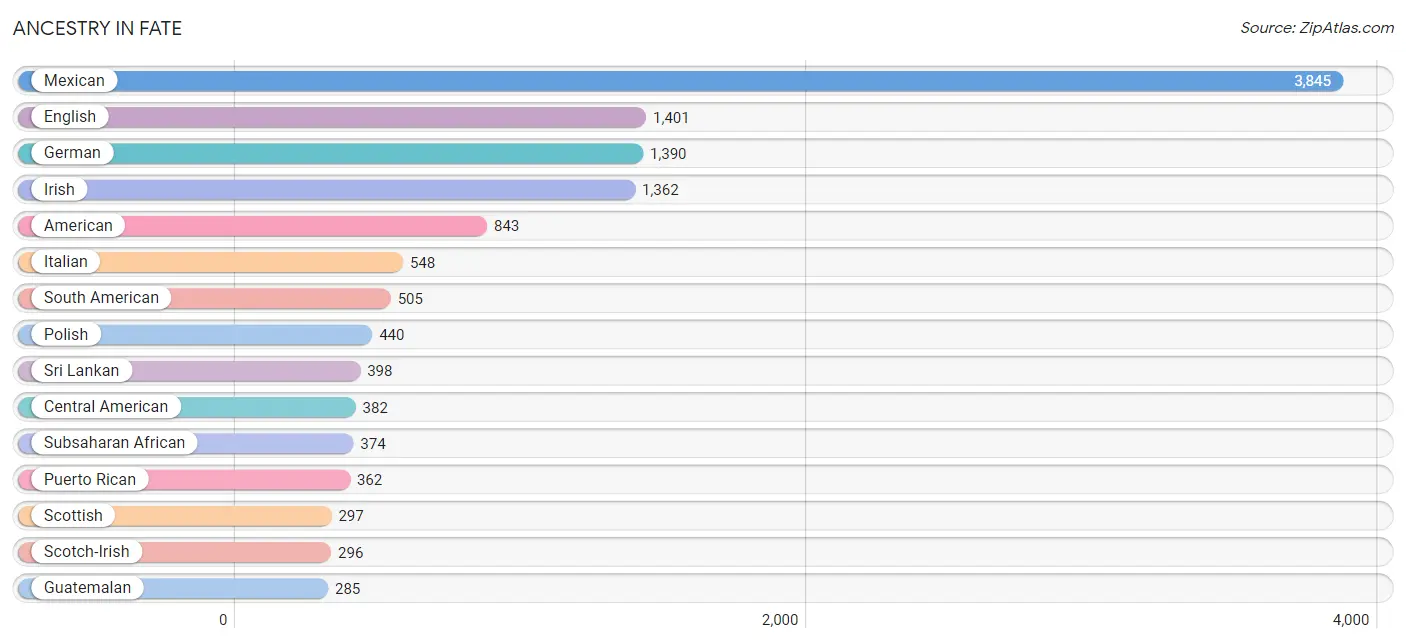
Ancestry in Fate
The most populous ancestries reported in Fate are Mexican (3,845 | 20.2%), English (1,401 | 7.4%), German (1,390 | 7.3%), Irish (1,362 | 7.2%), and American (843 | 4.4%), together accounting for 46.5% of all Fate residents.
| Ancestry | # Population | % Population |
| African | 181 | 0.9% |
| American | 843 | 4.4% |
| Arab | 40 | 0.2% |
| Argentinean | 82 | 0.4% |
| Australian | 20 | 0.1% |
| Belgian | 71 | 0.4% |
| Belizean | 42 | 0.2% |
| Bhutanese | 69 | 0.4% |
| British | 67 | 0.4% |
| Burmese | 97 | 0.5% |
| Canadian | 24 | 0.1% |
| Central American | 382 | 2.0% |
| Cherokee | 90 | 0.5% |
| Chickasaw | 77 | 0.4% |
| Chippewa | 25 | 0.1% |
| Choctaw | 51 | 0.3% |
| Colombian | 124 | 0.6% |
| Comanche | 4 | 0.0% |
| Costa Rican | 22 | 0.1% |
| Czech | 63 | 0.3% |
| Czechoslovakian | 32 | 0.2% |
| Danish | 52 | 0.3% |
| Dominican | 81 | 0.4% |
| Dutch | 105 | 0.5% |
| Eastern European | 32 | 0.2% |
| English | 1,401 | 7.4% |
| Ethiopian | 32 | 0.2% |
| European | 122 | 0.6% |
| Finnish | 35 | 0.2% |
| French | 174 | 0.9% |
| French Canadian | 15 | 0.1% |
| German | 1,390 | 7.3% |
| Ghanaian | 22 | 0.1% |
| Greek | 56 | 0.3% |
| Guatemalan | 285 | 1.5% |
| Hungarian | 40 | 0.2% |
| Indian (Asian) | 168 | 0.9% |
| Irish | 1,362 | 7.2% |
| Italian | 548 | 2.9% |
| Jamaican | 36 | 0.2% |
| Kenyan | 28 | 0.2% |
| Korean | 50 | 0.3% |
| Laotian | 25 | 0.1% |
| Mexican | 3,845 | 20.2% |
| Mexican American Indian | 87 | 0.5% |
| Native Hawaiian | 33 | 0.2% |
| Nigerian | 32 | 0.2% |
| Northern European | 54 | 0.3% |
| Norwegian | 69 | 0.4% |
| Pakistani | 91 | 0.5% |
| Panamanian | 21 | 0.1% |
| Peruvian | 165 | 0.9% |
| Polish | 440 | 2.3% |
| Portuguese | 11 | 0.1% |
| Puerto Rican | 362 | 1.9% |
| Russian | 88 | 0.5% |
| Salvadoran | 54 | 0.3% |
| Scandinavian | 66 | 0.4% |
| Scotch-Irish | 296 | 1.6% |
| Scottish | 297 | 1.6% |
| South American | 505 | 2.7% |
| Spaniard | 130 | 0.7% |
| Spanish | 100 | 0.5% |
| Sri Lankan | 398 | 2.1% |
| Subsaharan African | 374 | 2.0% |
| Swedish | 80 | 0.4% |
| Swiss | 10 | 0.1% |
| Syrian | 40 | 0.2% |
| Thai | 170 | 0.9% |
| Venezuelan | 134 | 0.7% |
| Welsh | 123 | 0.6% |
| West Indian | 36 | 0.2% | View All 72 Rows |
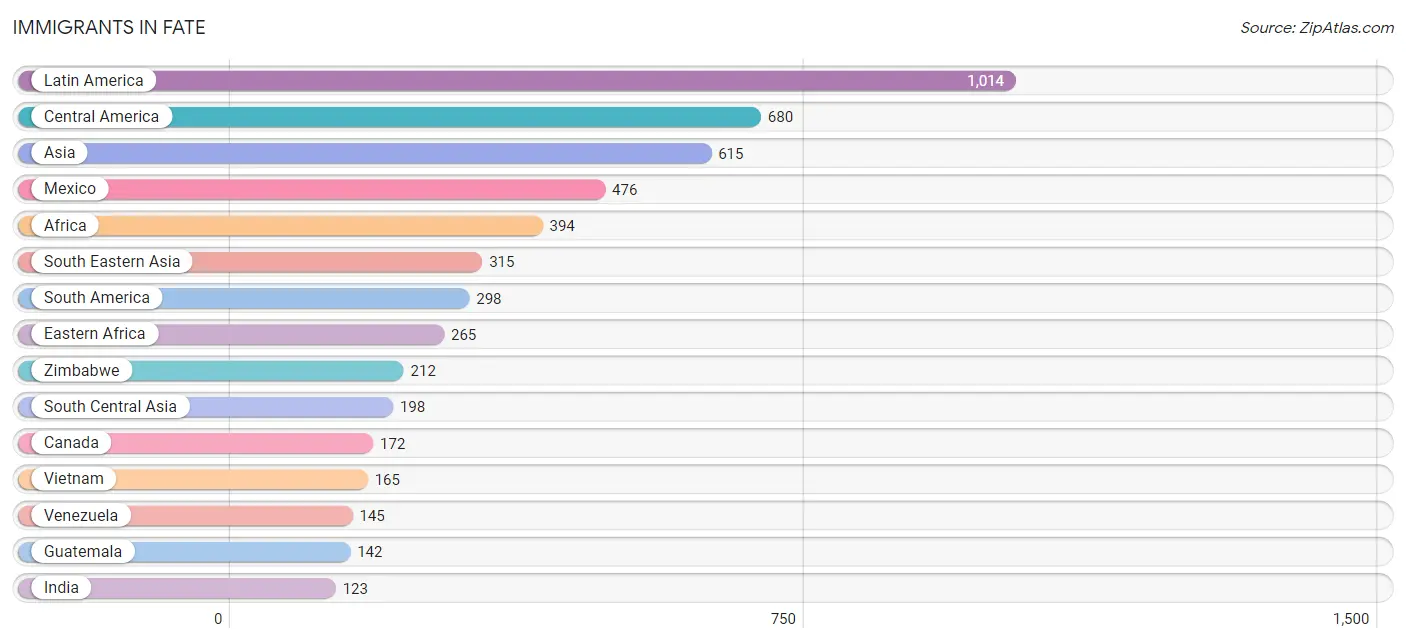
Immigrants in Fate
The most numerous immigrant groups reported in Fate came from Latin America (1,014 | 5.3%), Central America (680 | 3.6%), Asia (615 | 3.2%), Mexico (476 | 2.5%), and Africa (394 | 2.1%), together accounting for 16.7% of all Fate residents.
| Immigration Origin | # Population | % Population |
| Africa | 394 | 2.1% |
| Asia | 615 | 3.2% |
| Belarus | 29 | 0.2% |
| Cameroon | 74 | 0.4% |
| Canada | 172 | 0.9% |
| Caribbean | 36 | 0.2% |
| Central America | 680 | 3.6% |
| China | 62 | 0.3% |
| Colombia | 85 | 0.4% |
| Costa Rica | 8 | 0.0% |
| Dominican Republic | 36 | 0.2% |
| Eastern Africa | 265 | 1.4% |
| Eastern Asia | 102 | 0.5% |
| Eastern Europe | 40 | 0.2% |
| Ecuador | 38 | 0.2% |
| El Salvador | 54 | 0.3% |
| England | 21 | 0.1% |
| Ethiopia | 32 | 0.2% |
| Europe | 85 | 0.4% |
| Germany | 7 | 0.0% |
| Ghana | 55 | 0.3% |
| Guatemala | 142 | 0.7% |
| India | 123 | 0.6% |
| Indonesia | 25 | 0.1% |
| Japan | 10 | 0.1% |
| Kenya | 21 | 0.1% |
| Korea | 30 | 0.2% |
| Latin America | 1,014 | 5.3% |
| Mexico | 476 | 2.5% |
| Middle Africa | 74 | 0.4% |
| Northern Europe | 38 | 0.2% |
| Peru | 30 | 0.2% |
| Philippines | 53 | 0.3% |
| Russia | 5 | 0.0% |
| Scotland | 17 | 0.1% |
| South America | 298 | 1.6% |
| South Central Asia | 198 | 1.0% |
| South Eastern Asia | 315 | 1.7% |
| Thailand | 72 | 0.4% |
| Uzbekistan | 75 | 0.4% |
| Venezuela | 145 | 0.8% |
| Vietnam | 165 | 0.9% |
| Western Africa | 55 | 0.3% |
| Western Europe | 7 | 0.0% |
| Zimbabwe | 212 | 1.1% | View All 45 Rows |
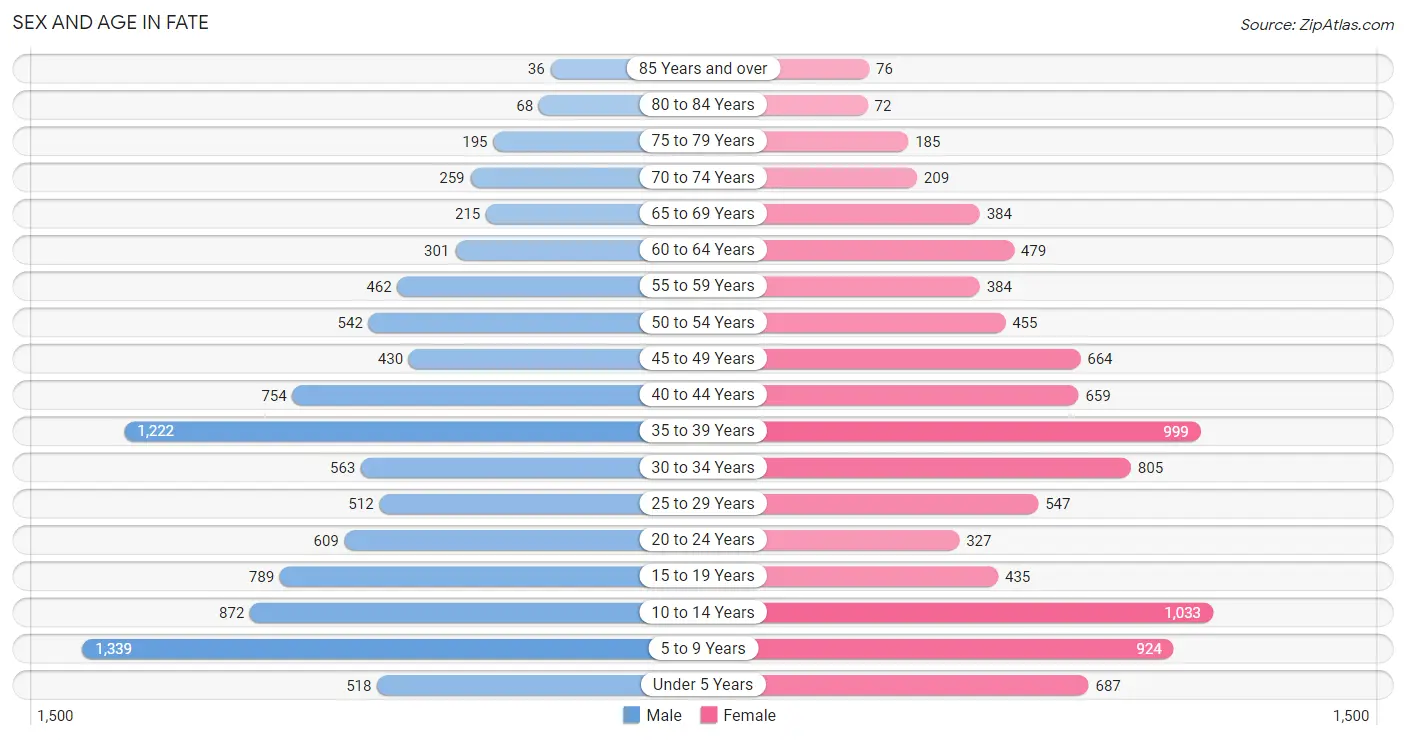
Sex and Age in Fate
Sex and Age in Fate
The most populous age groups in Fate are 5 to 9 Years (1,339 | 13.8%) for men and 10 to 14 Years (1,033 | 11.1%) for women.
| Age Bracket | Male | Female |
| Under 5 Years | 518 (5.3%) | 687 (7.4%) |
| 5 to 9 Years | 1,339 (13.8%) | 924 (9.9%) |
| 10 to 14 Years | 872 (9.0%) | 1,033 (11.1%) |
| 15 to 19 Years | 789 (8.2%) | 435 (4.7%) |
| 20 to 24 Years | 609 (6.3%) | 327 (3.5%) |
| 25 to 29 Years | 512 (5.3%) | 547 (5.9%) |
| 30 to 34 Years | 563 (5.8%) | 805 (8.6%) |
| 35 to 39 Years | 1,222 (12.6%) | 999 (10.7%) |
| 40 to 44 Years | 754 (7.8%) | 659 (7.1%) |
| 45 to 49 Years | 430 (4.4%) | 664 (7.1%) |
| 50 to 54 Years | 542 (5.6%) | 455 (4.9%) |
| 55 to 59 Years | 462 (4.8%) | 384 (4.1%) |
| 60 to 64 Years | 301 (3.1%) | 479 (5.1%) |
| 65 to 69 Years | 215 (2.2%) | 384 (4.1%) |
| 70 to 74 Years | 259 (2.7%) | 209 (2.2%) |
| 75 to 79 Years | 195 (2.0%) | 185 (2.0%) |
| 80 to 84 Years | 68 (0.7%) | 72 (0.8%) |
| 85 Years and over | 36 (0.4%) | 76 (0.8%) |
| Total | 9,686 (100.0%) | 9,324 (100.0%) |
Families and Households in Fate
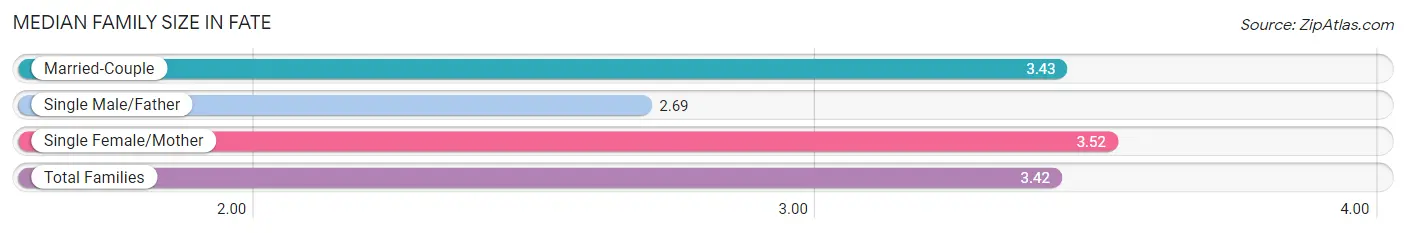
Median Family Size in Fate
The median family size in Fate is 3.42 persons per family, with single female/mother families (563 | 11.0%) accounting for the largest median family size of 3.52 persons per family. On the other hand, single male/father families (131 | 2.5%) represent the smallest median family size with 2.69 persons per family.
| Family Type | # Families | Family Size |
| Married-Couple | 4,447 (86.5%) | 3.43 |
| Single Male/Father | 131 (2.5%) | 2.69 |
| Single Female/Mother | 563 (11.0%) | 3.52 |
| Total Families | 5,141 (100.0%) | 3.42 |
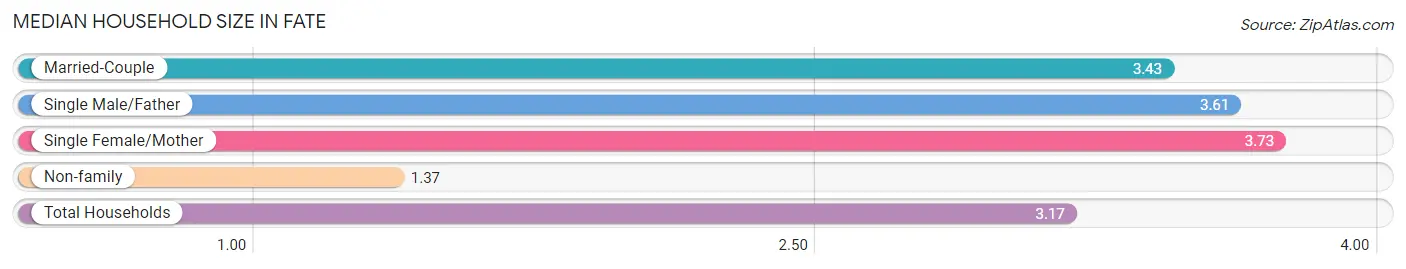
Median Household Size in Fate
The median household size in Fate is 3.17 persons per household, with single female/mother households (563 | 9.4%) accounting for the largest median household size of 3.73 persons per household. non-family households (853 | 14.2%) represent the smallest median household size with 1.37 persons per household.
| Household Type | # Households | Household Size |
| Married-Couple | 4,447 (74.2%) | 3.43 |
| Single Male/Father | 131 (2.2%) | 3.61 |
| Single Female/Mother | 563 (9.4%) | 3.73 |
| Non-family | 853 (14.2%) | 1.37 |
| Total Households | 5,994 (100.0%) | 3.17 |
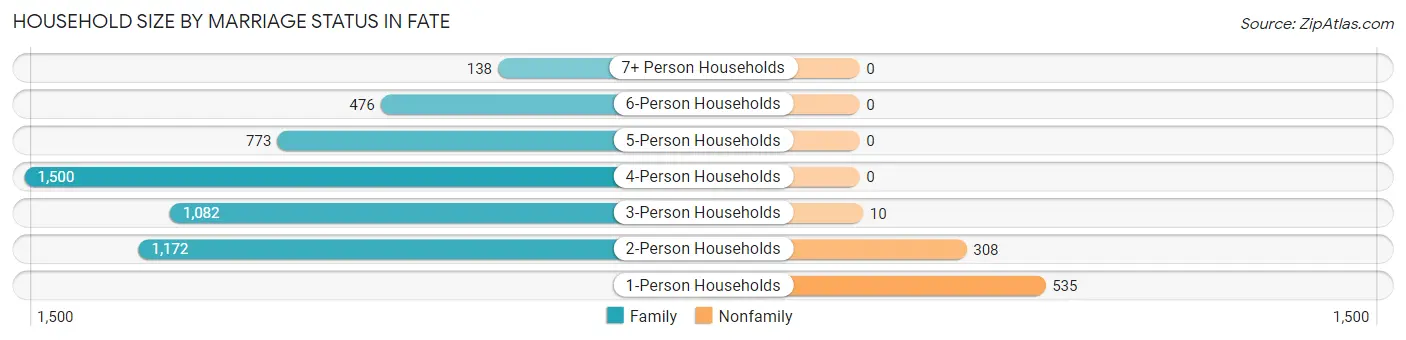
Household Size by Marriage Status in Fate
Out of a total of 5,994 households in Fate, 5,141 (85.8%) are family households, while 853 (14.2%) are nonfamily households. The most numerous type of family households are 4-person households, comprising 1,500, and the most common type of nonfamily households are 1-person households, comprising 535.
| Household Size | Family Households | Nonfamily Households |
| 1-Person Households | - | 535 (8.9%) |
| 2-Person Households | 1,172 (19.6%) | 308 (5.1%) |
| 3-Person Households | 1,082 (18.0%) | 10 (0.2%) |
| 4-Person Households | 1,500 (25.0%) | 0 (0.0%) |
| 5-Person Households | 773 (12.9%) | 0 (0.0%) |
| 6-Person Households | 476 (7.9%) | 0 (0.0%) |
| 7+ Person Households | 138 (2.3%) | 0 (0.0%) |
| Total | 5,141 (85.8%) | 853 (14.2%) |
Female Fertility in Fate
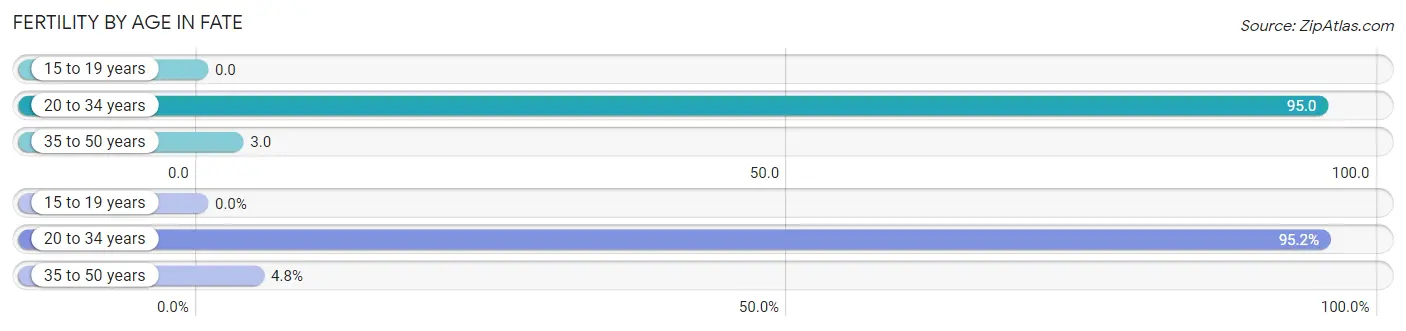
Fertility by Age in Fate
Average fertility rate in Fate is 37.0 births per 1,000 women. Women in the age bracket of 20 to 34 years have the highest fertility rate with 95.0 births per 1,000 women. Women in the age bracket of 20 to 34 years acount for 95.2% of all women with births.
| Age Bracket | Women with Births | Births / 1,000 Women |
| 15 to 19 years | 0 (0.0%) | 0.0 |
| 20 to 34 years | 160 (95.2%) | 95.0 |
| 35 to 50 years | 8 (4.8%) | 3.0 |
| Total | 168 (100.0%) | 37.0 |
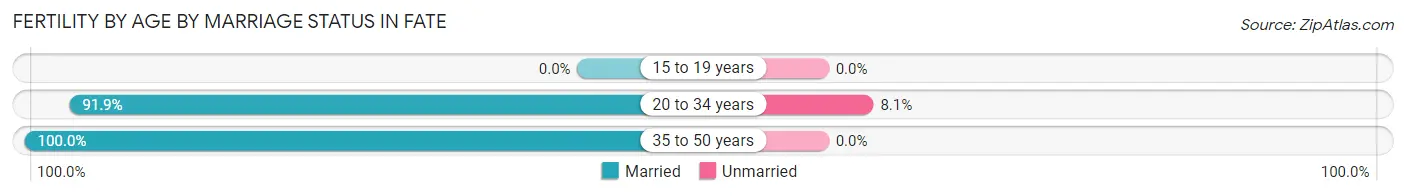
Fertility by Age by Marriage Status in Fate
92.3% of women with births (168) in Fate are married. The highest percentage of unmarried women with births falls into 20 to 34 years age bracket with 8.1% of them unmarried at the time of birth, while the lowest percentage of unmarried women with births belong to 35 to 50 years age bracket with 0.0% of them unmarried.
| Age Bracket | Married | Unmarried |
| 15 to 19 years | 0 (0.0%) | 0 (0.0%) |
| 20 to 34 years | 147 (91.9%) | 13 (8.1%) |
| 35 to 50 years | 8 (100.0%) | 0 (0.0%) |
| Total | 155 (92.3%) | 13 (7.7%) |
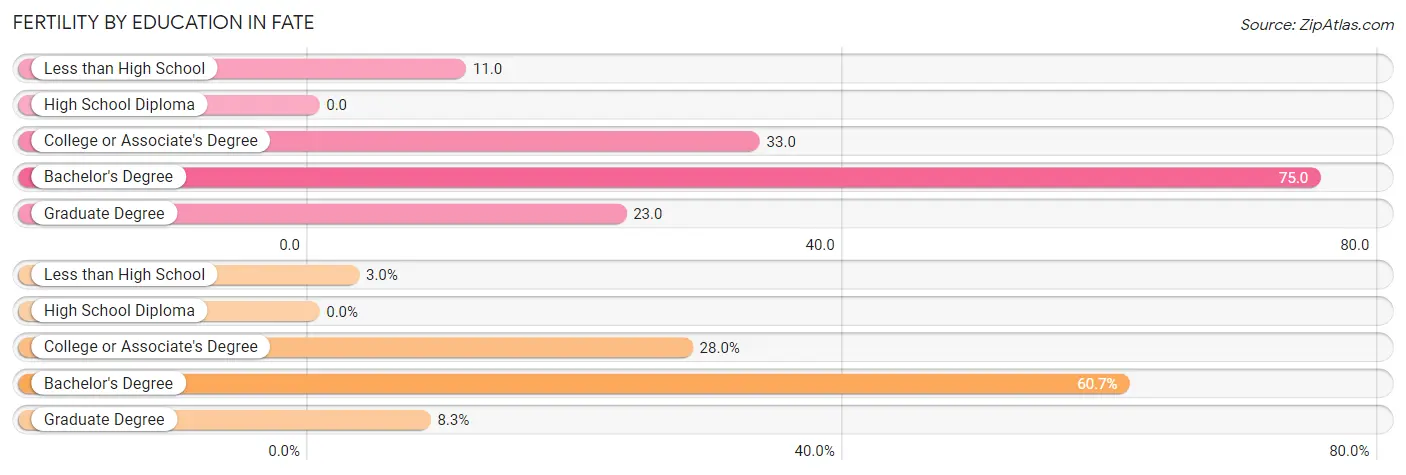
Fertility by Education in Fate
| Educational Attainment | Women with Births | Births / 1,000 Women |
| Less than High School | 5 (3.0%) | 11.0 |
| High School Diploma | 0 (0.0%) | 0.0 |
| College or Associate's Degree | 47 (28.0%) | 33.0 |
| Bachelor's Degree | 102 (60.7%) | 75.0 |
| Graduate Degree | 14 (8.3%) | 23.0 |
| Total | 168 (100.0%) | 37.0 |
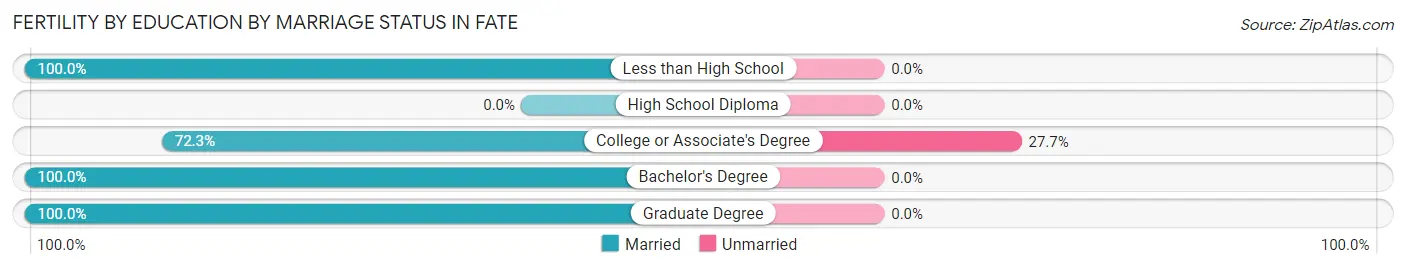
Fertility by Education by Marriage Status in Fate
7.7% of women with births in Fate are unmarried. Women with the educational attainment of less than high school are most likely to be married with 100.0% of them married at childbirth, while women with the educational attainment of college or associate's degree are least likely to be married with 27.7% of them unmarried at childbirth.
| Educational Attainment | Married | Unmarried |
| Less than High School | 5 (100.0%) | 0 (0.0%) |
| High School Diploma | 0 (0.0%) | 0 (0.0%) |
| College or Associate's Degree | 34 (72.3%) | 13 (27.7%) |
| Bachelor's Degree | 102 (100.0%) | 0 (0.0%) |
| Graduate Degree | 14 (100.0%) | 0 (0.0%) |
| Total | 155 (92.3%) | 13 (7.7%) |
Income in Fate
Income Overview in Fate
Per Capita Income in Fate is $41,305, while median incomes of families and households are $126,173 and $121,935 respectively.
| Characteristic | Number | Measure |
| Per Capita Income | 19,010 | $41,305 |
| Median Family Income | 5,141 | $126,173 |
| Mean Family Income | 5,141 | $135,998 |
| Median Household Income | 5,994 | $121,935 |
| Mean Household Income | 5,994 | $136,317 |
| Income Deficit | 5,141 | $0 |
| Wage / Income Gap (%) | 19,010 | 45.84% |
| Wage / Income Gap ($) | 19,010 | 54.16¢ per $1 |
| Gini / Inequality Index | 19,010 | 0.30 |
Earnings by Sex in Fate
Average Earnings in Fate are $58,181, $77,019 for men and $41,710 for women, a difference of 45.8%.
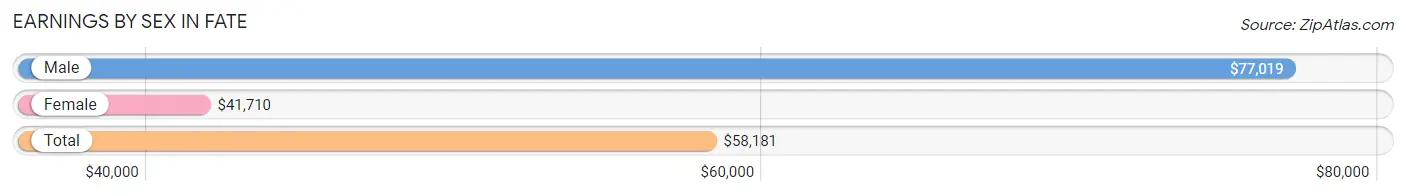
| Sex | Number | Average Earnings |
| Male | 5,717 (54.9%) | $77,019 |
| Female | 4,689 (45.1%) | $41,710 |
| Total | 10,406 (100.0%) | $58,181 |
Earnings by Sex by Income Bracket in Fate
The most common earnings brackets in Fate are $100,000+ for men (1,858 | 32.5%) and $100,000+ for women (686 | 14.6%).
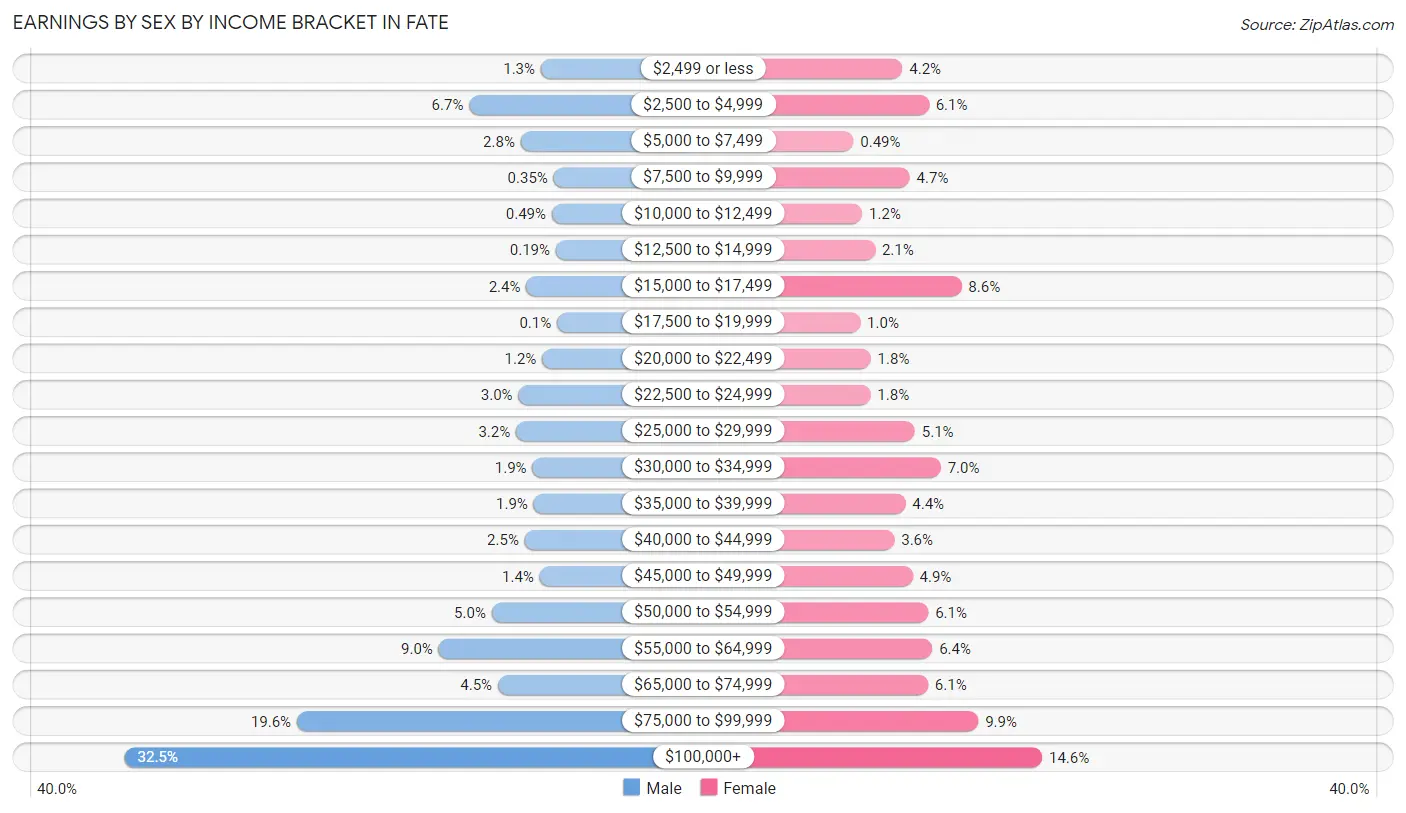
| Income | Male | Female |
| $2,499 or less | 75 (1.3%) | 195 (4.2%) |
| $2,500 to $4,999 | 382 (6.7%) | 288 (6.1%) |
| $5,000 to $7,499 | 161 (2.8%) | 23 (0.5%) |
| $7,500 to $9,999 | 20 (0.4%) | 221 (4.7%) |
| $10,000 to $12,499 | 28 (0.5%) | 54 (1.1%) |
| $12,500 to $14,999 | 11 (0.2%) | 99 (2.1%) |
| $15,000 to $17,499 | 137 (2.4%) | 403 (8.6%) |
| $17,500 to $19,999 | 6 (0.1%) | 47 (1.0%) |
| $20,000 to $22,499 | 69 (1.2%) | 84 (1.8%) |
| $22,500 to $24,999 | 171 (3.0%) | 83 (1.8%) |
| $25,000 to $29,999 | 181 (3.2%) | 239 (5.1%) |
| $30,000 to $34,999 | 111 (1.9%) | 330 (7.0%) |
| $35,000 to $39,999 | 106 (1.8%) | 206 (4.4%) |
| $40,000 to $44,999 | 144 (2.5%) | 167 (3.6%) |
| $45,000 to $49,999 | 80 (1.4%) | 231 (4.9%) |
| $50,000 to $54,999 | 285 (5.0%) | 286 (6.1%) |
| $55,000 to $64,999 | 513 (9.0%) | 300 (6.4%) |
| $65,000 to $74,999 | 259 (4.5%) | 285 (6.1%) |
| $75,000 to $99,999 | 1,120 (19.6%) | 462 (9.9%) |
| $100,000+ | 1,858 (32.5%) | 686 (14.6%) |
| Total | 5,717 (100.0%) | 4,689 (100.0%) |
Earnings by Sex by Educational Attainment in Fate
Average earnings in Fate are $86,322 for men and $46,742 for women, a difference of 45.9%. Men with an educational attainment of graduate degree enjoy the highest average annual earnings of $122,083, while those with less than high school education earn the least with $55,817. Women with an educational attainment of graduate degree earn the most with the average annual earnings of $56,563, while those with less than high school education have the smallest earnings of $17,264.
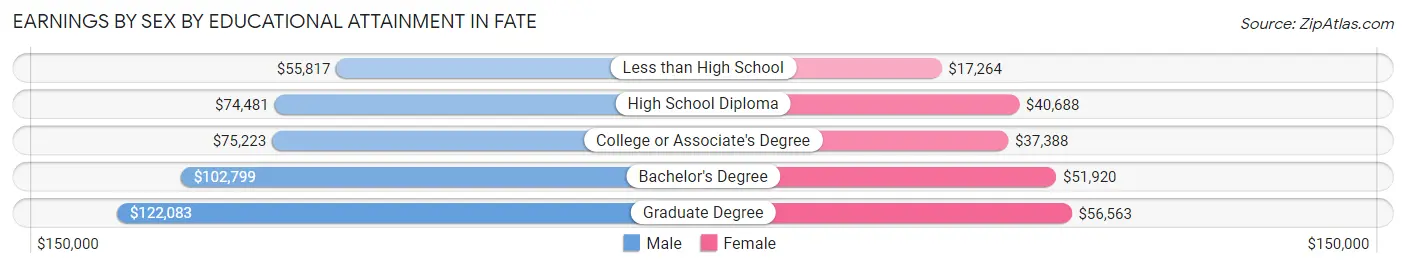
| Educational Attainment | Male Income | Female Income |
| Less than High School | $55,817 | $17,264 |
| High School Diploma | $74,481 | $40,688 |
| College or Associate's Degree | $75,223 | $37,388 |
| Bachelor's Degree | $102,799 | $51,920 |
| Graduate Degree | $122,083 | $56,563 |
| Total | $86,322 | $46,742 |
Family Income in Fate
Family Income Brackets in Fate
According to the Fate family income data, there are 1,933 families falling into the $100,000 to $149,999 income range, which is the most common income bracket and makes up 37.6% of all families.
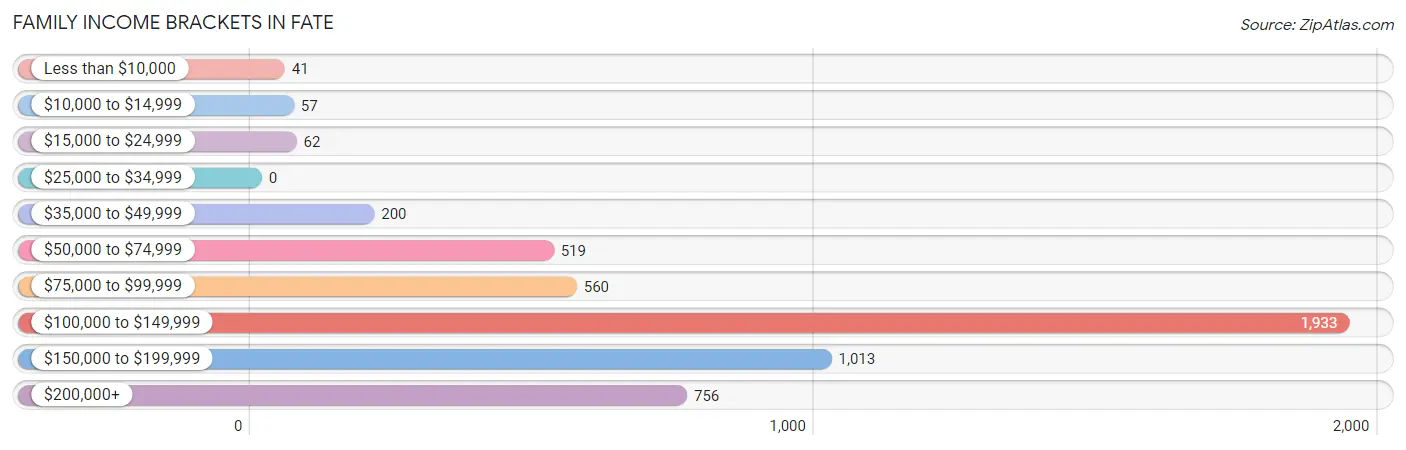
| Income Bracket | # Families | % Families |
| Less than $10,000 | 41 | 0.8% |
| $10,000 to $14,999 | 57 | 1.1% |
| $15,000 to $24,999 | 62 | 1.2% |
| $25,000 to $34,999 | 0 | 0.0% |
| $35,000 to $49,999 | 200 | 3.9% |
| $50,000 to $74,999 | 519 | 10.1% |
| $75,000 to $99,999 | 560 | 10.9% |
| $100,000 to $149,999 | 1,933 | 37.6% |
| $150,000 to $199,999 | 1,013 | 19.7% |
| $200,000+ | 756 | 14.7% |
Family Income by Famaliy Size in Fate
6-person families (476 | 9.3%) account for the highest median family income in Fate with $250,001 per family, while 2-person families (1,320 | 25.7%) have the highest median income of $52,946 per family member.
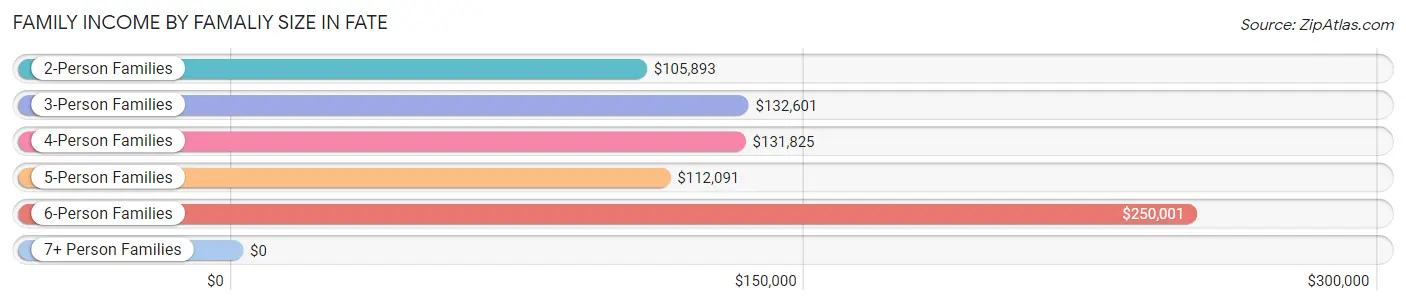
| Income Bracket | # Families | Median Income |
| 2-Person Families | 1,320 (25.7%) | $105,893 |
| 3-Person Families | 981 (19.1%) | $132,601 |
| 4-Person Families | 1,453 (28.3%) | $131,825 |
| 5-Person Families | 773 (15.0%) | $112,091 |
| 6-Person Families | 476 (9.3%) | $250,001 |
| 7+ Person Families | 138 (2.7%) | $0 |
| Total | 5,141 (100.0%) | $126,173 |
Family Income by Number of Earners in Fate
The median family income in Fate is $126,173, with families comprising 3+ earners (1,020) having the highest median family income of $196,788, while families with no earners (480) have the lowest median family income of $62,083, accounting for 19.8% and 9.3% of families, respectively.
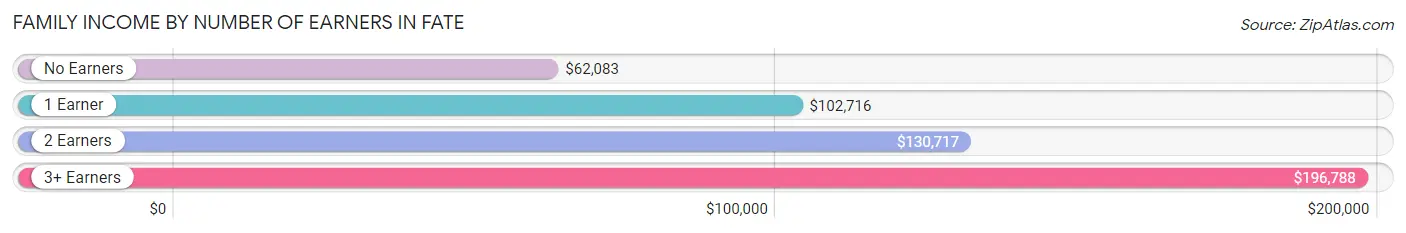
| Number of Earners | # Families | Median Income |
| No Earners | 480 (9.3%) | $62,083 |
| 1 Earner | 918 (17.9%) | $102,716 |
| 2 Earners | 2,723 (53.0%) | $130,717 |
| 3+ Earners | 1,020 (19.8%) | $196,788 |
| Total | 5,141 (100.0%) | $126,173 |
Household Income in Fate
Household Income Brackets in Fate
With 2,092 households falling in the category, the $100,000 to $149,999 income range is the most frequent in Fate, accounting for 34.9% of all households.
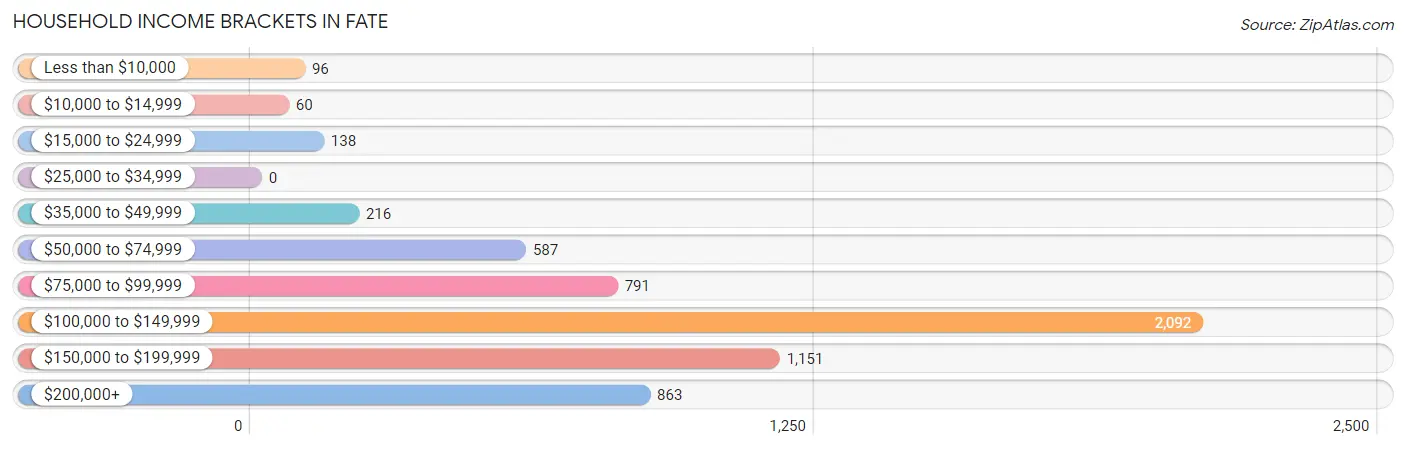
| Income Bracket | # Households | % Households |
| Less than $10,000 | 96 | 1.6% |
| $10,000 to $14,999 | 60 | 1.0% |
| $15,000 to $24,999 | 138 | 2.3% |
| $25,000 to $34,999 | 0 | 0.0% |
| $35,000 to $49,999 | 216 | 3.6% |
| $50,000 to $74,999 | 587 | 9.8% |
| $75,000 to $99,999 | 791 | 13.2% |
| $100,000 to $149,999 | 2,092 | 34.9% |
| $150,000 to $199,999 | 1,151 | 19.2% |
| $200,000+ | 863 | 14.4% |
Household Income by Householder Age in Fate
The median household income in Fate is $121,935, with the highest median household income of $130,000 found in the 25 to 44 years age bracket for the primary householder. A total of 3,332 households (55.6%) fall into this category. Meanwhile, the 15 to 24 years age bracket for the primary householder has the lowest median household income of $0, with 35 households (0.6%) in this group.
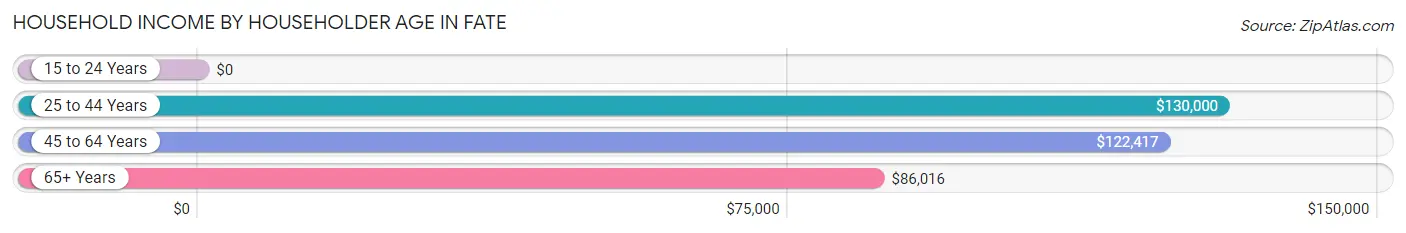
| Income Bracket | # Households | Median Income |
| 15 to 24 Years | 35 (0.6%) | $0 |
| 25 to 44 Years | 3,332 (55.6%) | $130,000 |
| 45 to 64 Years | 1,787 (29.8%) | $122,417 |
| 65+ Years | 840 (14.0%) | $86,016 |
| Total | 5,994 (100.0%) | $121,935 |
Poverty in Fate
Income Below Poverty by Sex and Age in Fate
With 1.7% poverty level for males and 4.0% for females among the residents of Fate, 75 year old and over males and under 5 year old females are the most vulnerable to poverty, with 54 males (18.1%) and 83 females (12.3%) in their respective age groups living below the poverty level.
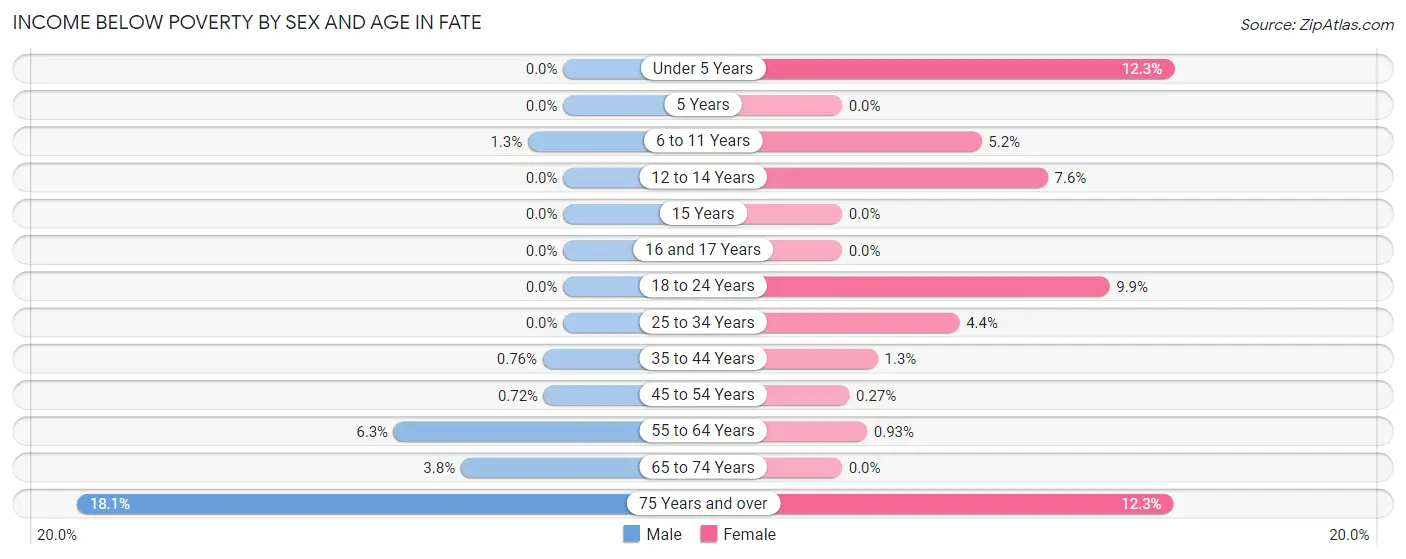
| Age Bracket | Male | Female |
| Under 5 Years | 0 (0.0%) | 83 (12.3%) |
| 5 Years | 0 (0.0%) | 0 (0.0%) |
| 6 to 11 Years | 21 (1.3%) | 65 (5.2%) |
| 12 to 14 Years | 0 (0.0%) | 45 (7.6%) |
| 15 Years | 0 (0.0%) | 0 (0.0%) |
| 16 and 17 Years | 0 (0.0%) | 0 (0.0%) |
| 18 to 24 Years | 0 (0.0%) | 42 (9.9%) |
| 25 to 34 Years | 0 (0.0%) | 59 (4.4%) |
| 35 to 44 Years | 15 (0.8%) | 22 (1.3%) |
| 45 to 54 Years | 7 (0.7%) | 3 (0.3%) |
| 55 to 64 Years | 48 (6.3%) | 8 (0.9%) |
| 65 to 74 Years | 18 (3.8%) | 0 (0.0%) |
| 75 Years and over | 54 (18.1%) | 41 (12.3%) |
| Total | 163 (1.7%) | 368 (4.0%) |
Income Above Poverty by Sex and Age in Fate
According to the poverty statistics in Fate, males aged under 5 years and females aged 5 years are the age groups that are most secure financially, with 100.0% of males and 100.0% of females in these age groups living above the poverty line.
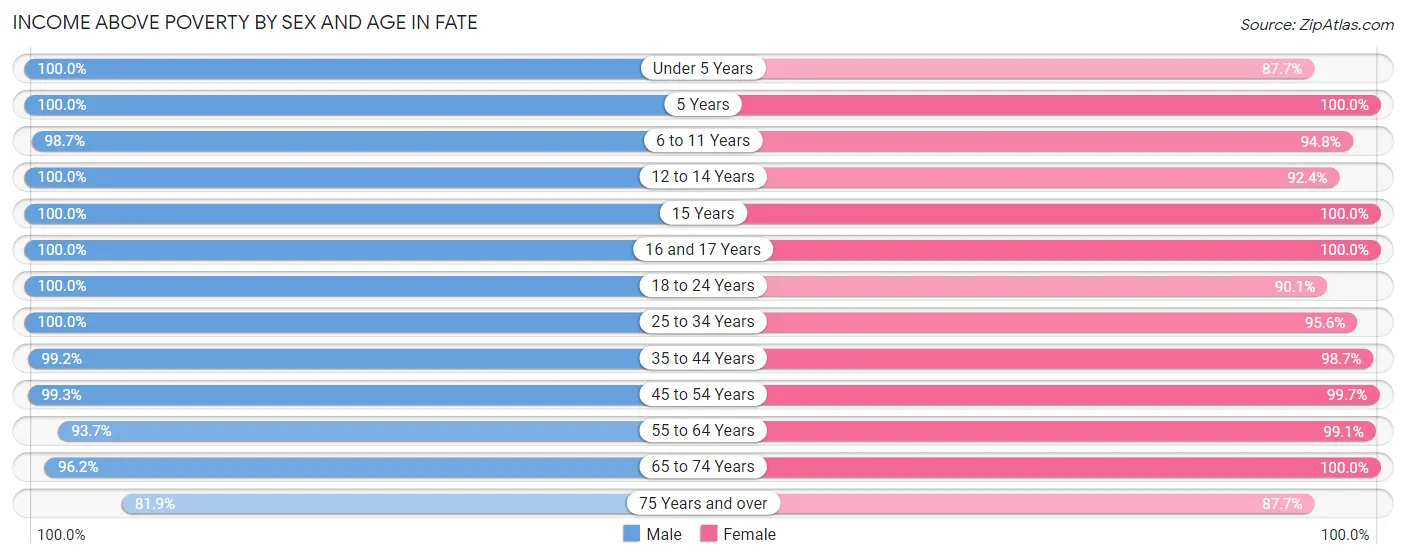
| Age Bracket | Male | Female |
| Under 5 Years | 518 (100.0%) | 590 (87.7%) |
| 5 Years | 198 (100.0%) | 113 (100.0%) |
| 6 to 11 Years | 1,583 (98.7%) | 1,190 (94.8%) |
| 12 to 14 Years | 409 (100.0%) | 544 (92.4%) |
| 15 Years | 134 (100.0%) | 107 (100.0%) |
| 16 and 17 Years | 360 (100.0%) | 232 (100.0%) |
| 18 to 24 Years | 904 (100.0%) | 381 (90.1%) |
| 25 to 34 Years | 1,075 (100.0%) | 1,293 (95.6%) |
| 35 to 44 Years | 1,961 (99.2%) | 1,636 (98.7%) |
| 45 to 54 Years | 965 (99.3%) | 1,116 (99.7%) |
| 55 to 64 Years | 715 (93.7%) | 855 (99.1%) |
| 65 to 74 Years | 456 (96.2%) | 593 (100.0%) |
| 75 Years and over | 245 (81.9%) | 292 (87.7%) |
| Total | 9,523 (98.3%) | 8,942 (96.1%) |
Income Below Poverty Among Married-Couple Families in Fate
The poverty statistics for married-couple families in Fate show that 0.4% or 18 of the total 4,447 families live below the poverty line. Families with no children have the highest poverty rate of 1.2%, comprising of 18 families. On the other hand, families with 1 or 2 children have the lowest poverty rate of 0.0%, which includes 0 families.
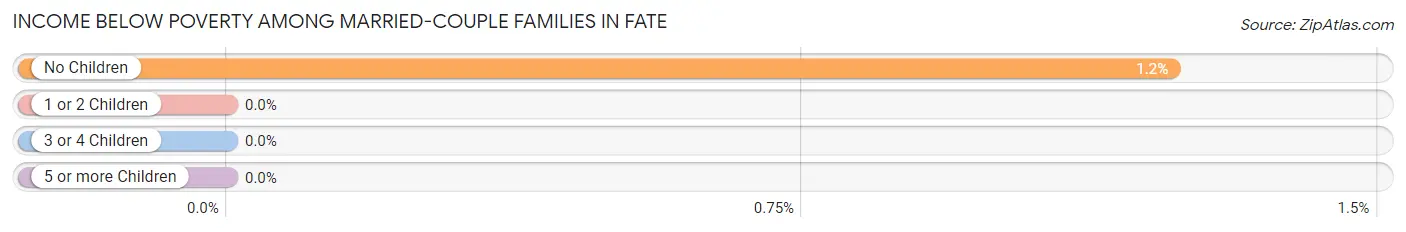
| Children | Above Poverty | Below Poverty |
| No Children | 1,442 (98.8%) | 18 (1.2%) |
| 1 or 2 Children | 1,951 (100.0%) | 0 (0.0%) |
| 3 or 4 Children | 1,004 (100.0%) | 0 (0.0%) |
| 5 or more Children | 32 (100.0%) | 0 (0.0%) |
| Total | 4,429 (99.6%) | 18 (0.4%) |
Income Below Poverty Among Single-Parent Households in Fate
According to the poverty data in Fate, 48.1% or 63 single-father households and 11.0% or 62 single-mother households are living below the poverty line. Among single-father households, those with 3 or 4 children have the highest poverty rate, with 15 households (100.0%) experiencing poverty. Likewise, among single-mother households, those with 3 or 4 children have the highest poverty rate, with 59 households (100.0%) falling below the poverty line.
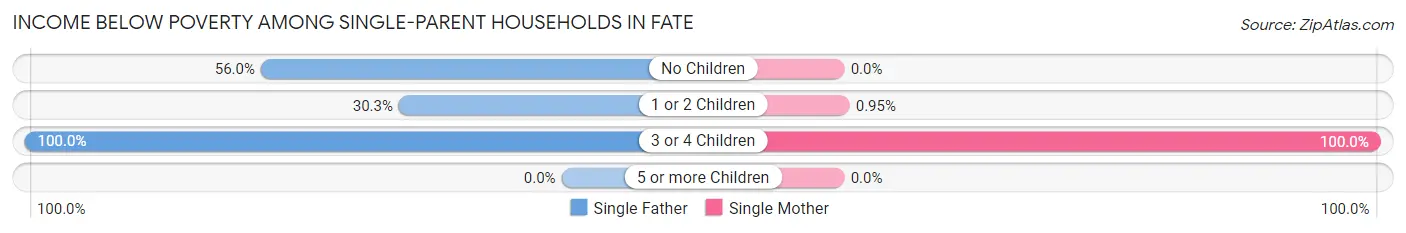
| Children | Single Father | Single Mother |
| No Children | 28 (56.0%) | 0 (0.0%) |
| 1 or 2 Children | 20 (30.3%) | 3 (0.9%) |
| 3 or 4 Children | 15 (100.0%) | 59 (100.0%) |
| 5 or more Children | 0 (0.0%) | 0 (0.0%) |
| Total | 63 (48.1%) | 62 (11.0%) |
Income Below Poverty Among Married-Couple vs Single-Parent Households in Fate
The poverty data for Fate shows that 18 of the married-couple family households (0.4%) and 125 of the single-parent households (18.0%) are living below the poverty level. Within the married-couple family households, those with no children have the highest poverty rate, with 18 households (1.2%) falling below the poverty line. Among the single-parent households, those with 3 or 4 children have the highest poverty rate, with 74 household (100.0%) living below poverty.
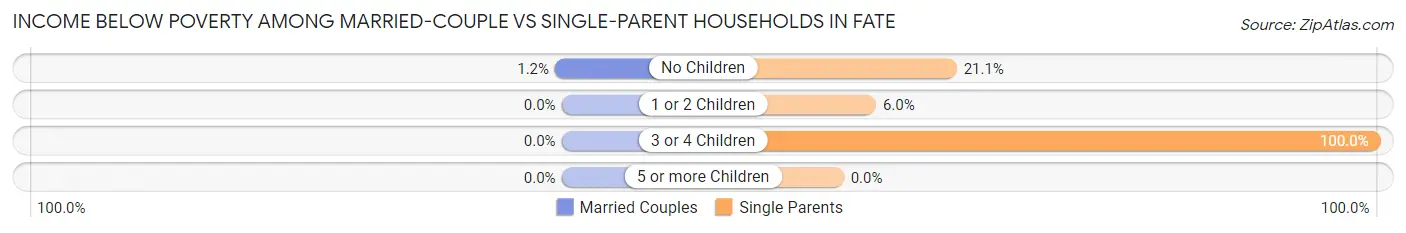
| Children | Married-Couple Families | Single-Parent Households |
| No Children | 18 (1.2%) | 28 (21.0%) |
| 1 or 2 Children | 0 (0.0%) | 23 (6.0%) |
| 3 or 4 Children | 0 (0.0%) | 74 (100.0%) |
| 5 or more Children | 0 (0.0%) | 0 (0.0%) |
| Total | 18 (0.4%) | 125 (18.0%) |
Employment Characteristics in Fate
Employment by Class of Employer in Fate
Among the 9,126 employed individuals in Fate, private company employees (6,348 | 69.6%), not-for-profit organizations (892 | 9.8%), and local government employees (707 | 7.7%) make up the most common classes of employment.
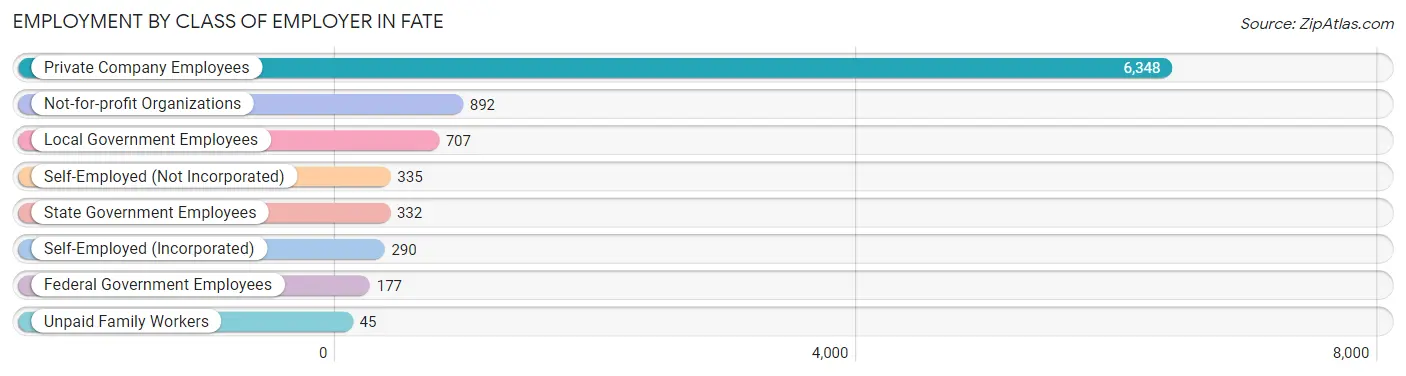
| Employer Class | # Employees | % Employees |
| Private Company Employees | 6,348 | 69.6% |
| Self-Employed (Incorporated) | 290 | 3.2% |
| Self-Employed (Not Incorporated) | 335 | 3.7% |
| Not-for-profit Organizations | 892 | 9.8% |
| Local Government Employees | 707 | 7.7% |
| State Government Employees | 332 | 3.6% |
| Federal Government Employees | 177 | 1.9% |
| Unpaid Family Workers | 45 | 0.5% |
| Total | 9,126 | 100.0% |
Employment Status by Age in Fate
According to the labor force statistics for Fate, out of the total population over 16 years of age (13,396), 75.0% or 10,047 individuals are in the labor force, with 6.8% or 683 of them unemployed. The age group with the highest labor force participation rate is 35 to 44 years, with 92.1% or 3,347 individuals in the labor force. Within the labor force, the 16 to 19 years age range has the highest percentage of unemployed individuals, with 39.0% or 167 of them being unemployed.
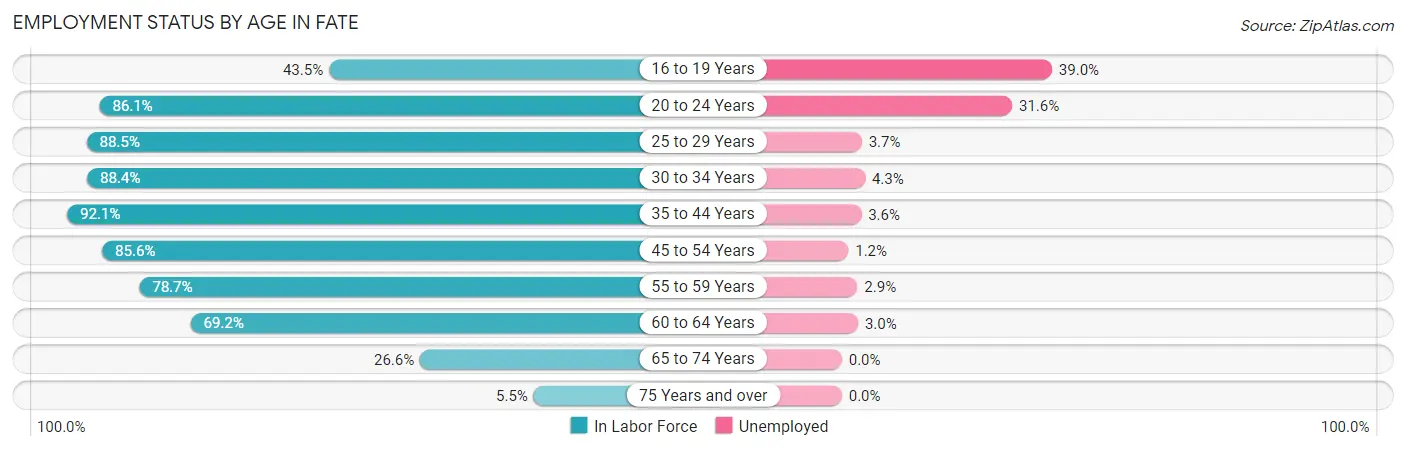
| Age Bracket | In Labor Force | Unemployed |
| 16 to 19 Years | 428 (43.5%) | 167 (39.0%) |
| 20 to 24 Years | 806 (86.1%) | 255 (31.6%) |
| 25 to 29 Years | 937 (88.5%) | 35 (3.7%) |
| 30 to 34 Years | 1,209 (88.4%) | 52 (4.3%) |
| 35 to 44 Years | 3,347 (92.1%) | 120 (3.6%) |
| 45 to 54 Years | 1,790 (85.6%) | 21 (1.2%) |
| 55 to 59 Years | 666 (78.7%) | 19 (2.9%) |
| 60 to 64 Years | 540 (69.2%) | 16 (3.0%) |
| 65 to 74 Years | 284 (26.6%) | 0 (0.0%) |
| 75 Years and over | 35 (5.5%) | 0 (0.0%) |
| Total | 10,047 (75.0%) | 683 (6.8%) |
Employment Status by Educational Attainment in Fate
According to labor force statistics for Fate, 86.8% of individuals (8,487) out of the total population between 25 and 64 years of age (9,778) are in the labor force, with 3.1% or 263 of them being unemployed. The group with the highest labor force participation rate are those with the educational attainment of bachelor's degree or higher, with 91.3% or 4,272 individuals in the labor force. Within the labor force, individuals with college / associate degree education have the highest percentage of unemployment, with 5.4% or 136 of them being unemployed.
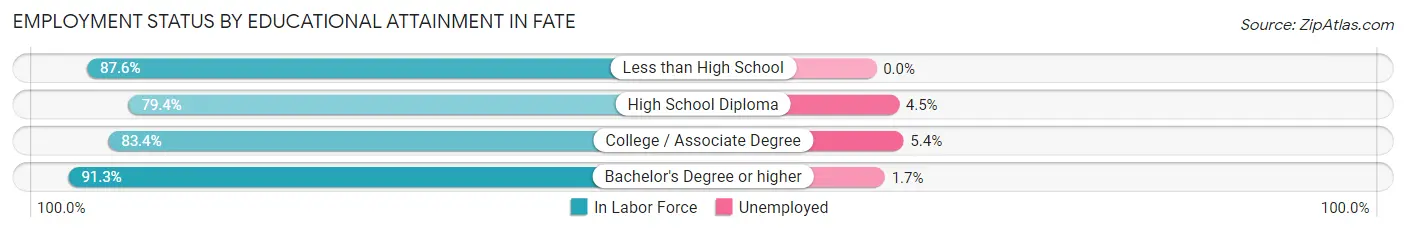
| Educational Attainment | In Labor Force | Unemployed |
| Less than High School | 489 (87.6%) | 0 (0.0%) |
| High School Diploma | 1,203 (79.4%) | 68 (4.5%) |
| College / Associate Degree | 2,524 (83.4%) | 163 (5.4%) |
| Bachelor's Degree or higher | 4,272 (91.3%) | 80 (1.7%) |
| Total | 8,487 (86.8%) | 303 (3.1%) |
Employment Occupations by Sex in Fate
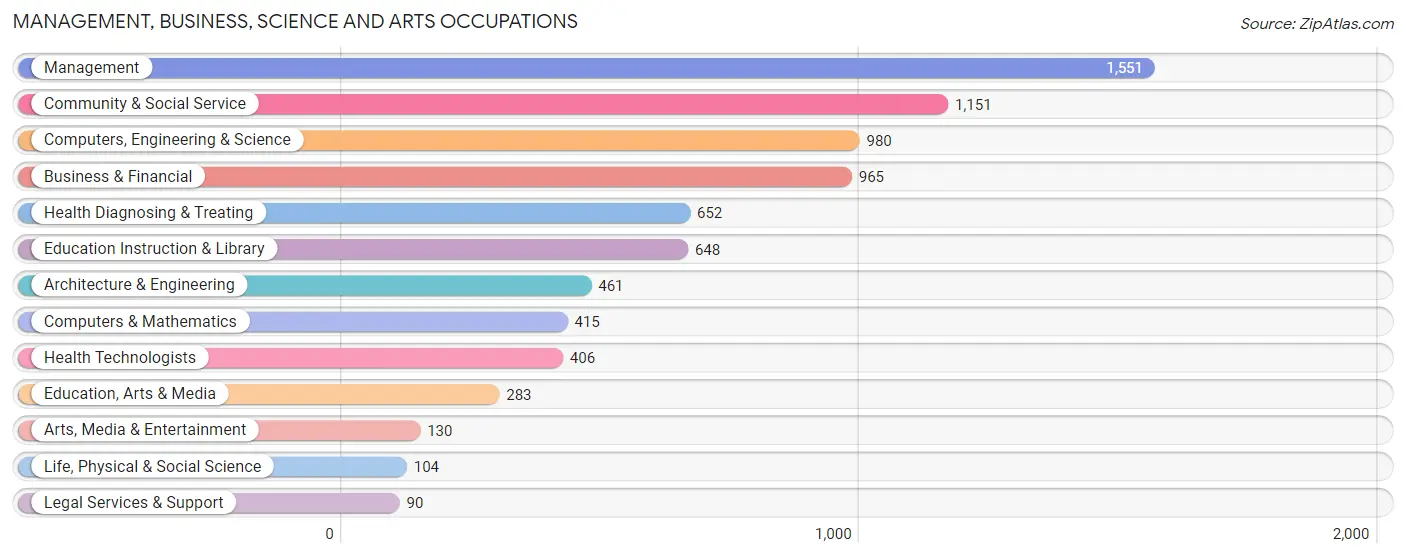
Management, Business, Science and Arts Occupations
The most common Management, Business, Science and Arts occupations in Fate are Management (1,551 | 16.6%), Community & Social Service (1,151 | 12.3%), Computers, Engineering & Science (980 | 10.5%), Business & Financial (965 | 10.3%), and Health Diagnosing & Treating (652 | 7.0%).
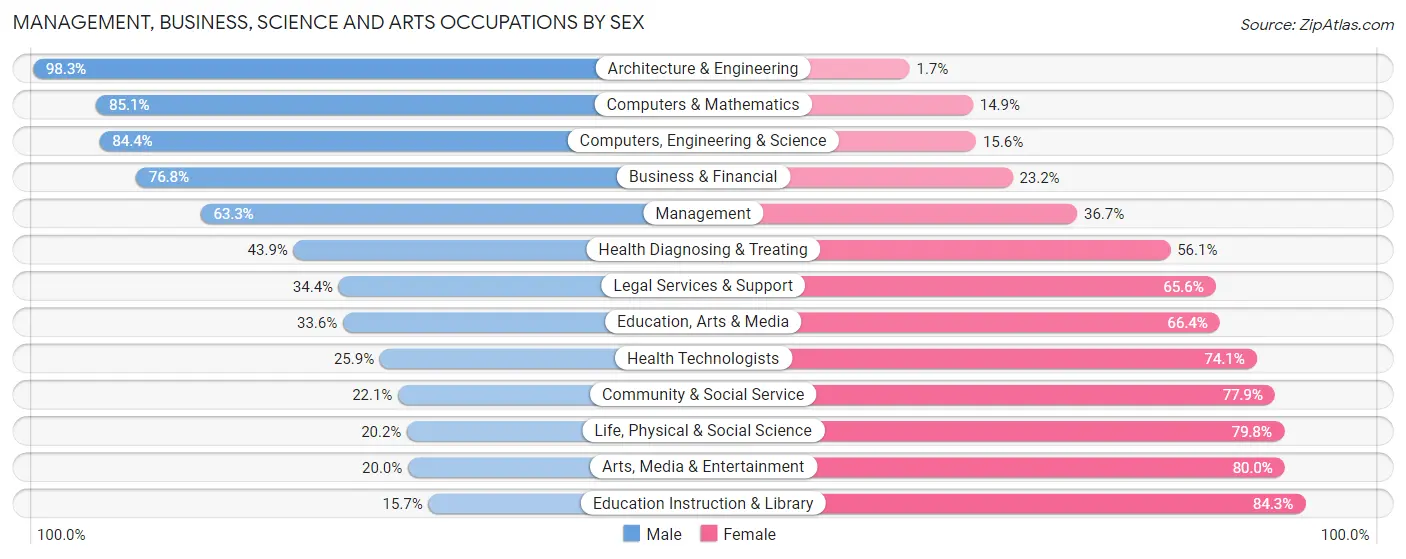
Management, Business, Science and Arts Occupations by Sex
Within the Management, Business, Science and Arts occupations in Fate, the most male-oriented occupations are Architecture & Engineering (98.3%), Computers & Mathematics (85.1%), and Computers, Engineering & Science (84.4%), while the most female-oriented occupations are Education Instruction & Library (84.3%), Arts, Media & Entertainment (80.0%), and Life, Physical & Social Science (79.8%).
| Occupation | Male | Female |
| Management | 982 (63.3%) | 569 (36.7%) |
| Business & Financial | 741 (76.8%) | 224 (23.2%) |
| Computers, Engineering & Science | 827 (84.4%) | 153 (15.6%) |
| Computers & Mathematics | 353 (85.1%) | 62 (14.9%) |
| Architecture & Engineering | 453 (98.3%) | 8 (1.7%) |
| Life, Physical & Social Science | 21 (20.2%) | 83 (79.8%) |
| Community & Social Service | 254 (22.1%) | 897 (77.9%) |
| Education, Arts & Media | 95 (33.6%) | 188 (66.4%) |
| Legal Services & Support | 31 (34.4%) | 59 (65.6%) |
| Education Instruction & Library | 102 (15.7%) | 546 (84.3%) |
| Arts, Media & Entertainment | 26 (20.0%) | 104 (80.0%) |
| Health Diagnosing & Treating | 286 (43.9%) | 366 (56.1%) |
| Health Technologists | 105 (25.9%) | 301 (74.1%) |
| Total (Category) | 3,090 (58.3%) | 2,209 (41.7%) |
| Total (Overall) | 5,170 (55.3%) | 4,184 (44.7%) |
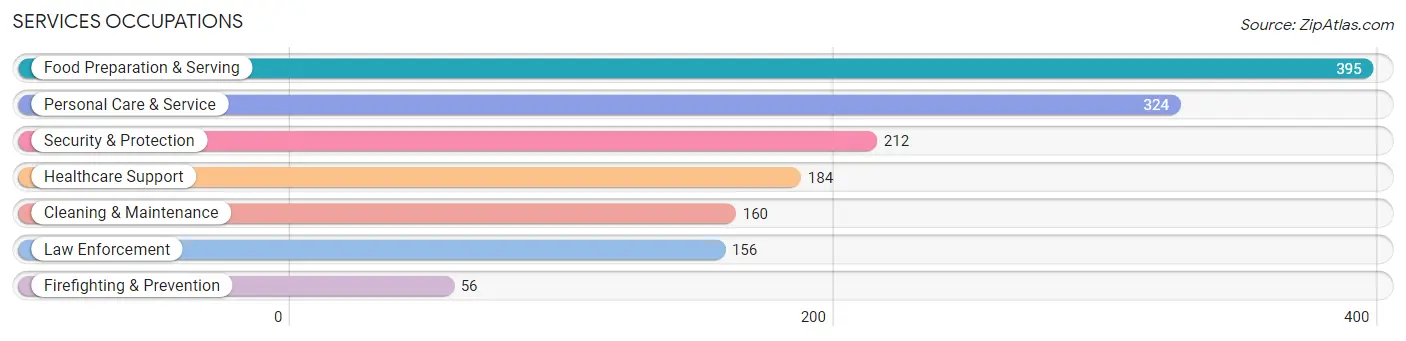
Services Occupations
The most common Services occupations in Fate are Food Preparation & Serving (395 | 4.2%), Personal Care & Service (324 | 3.5%), Security & Protection (212 | 2.3%), Healthcare Support (184 | 2.0%), and Cleaning & Maintenance (160 | 1.7%).
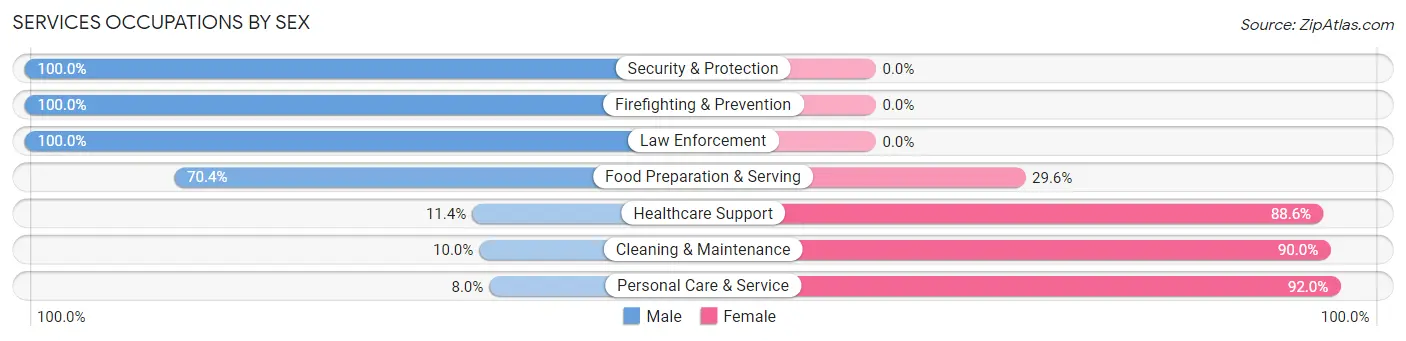
Services Occupations by Sex
Within the Services occupations in Fate, the most male-oriented occupations are Security & Protection (100.0%), Firefighting & Prevention (100.0%), and Law Enforcement (100.0%), while the most female-oriented occupations are Personal Care & Service (92.0%), Cleaning & Maintenance (90.0%), and Healthcare Support (88.6%).
| Occupation | Male | Female |
| Healthcare Support | 21 (11.4%) | 163 (88.6%) |
| Security & Protection | 212 (100.0%) | 0 (0.0%) |
| Firefighting & Prevention | 56 (100.0%) | 0 (0.0%) |
| Law Enforcement | 156 (100.0%) | 0 (0.0%) |
| Food Preparation & Serving | 278 (70.4%) | 117 (29.6%) |
| Cleaning & Maintenance | 16 (10.0%) | 144 (90.0%) |
| Personal Care & Service | 26 (8.0%) | 298 (92.0%) |
| Total (Category) | 553 (43.4%) | 722 (56.6%) |
| Total (Overall) | 5,170 (55.3%) | 4,184 (44.7%) |
Sales and Office Occupations
The most common Sales and Office occupations in Fate are Office & Administration (885 | 9.5%), and Sales & Related (482 | 5.1%).

Sales and Office Occupations by Sex

| Occupation | Male | Female |
| Sales & Related | 253 (52.5%) | 229 (47.5%) |
| Office & Administration | 116 (13.1%) | 769 (86.9%) |
| Total (Category) | 369 (27.0%) | 998 (73.0%) |
| Total (Overall) | 5,170 (55.3%) | 4,184 (44.7%) |
Natural Resources, Construction and Maintenance Occupations
The most common Natural Resources, Construction and Maintenance occupations in Fate are Installation, Maintenance & Repair (434 | 4.6%), and Construction & Extraction (380 | 4.1%).
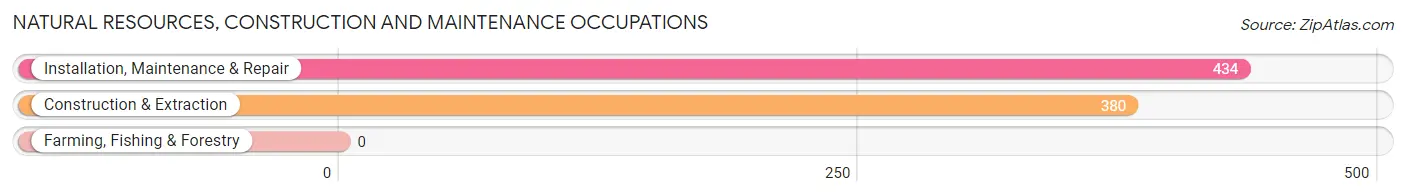
Natural Resources, Construction and Maintenance Occupations by Sex
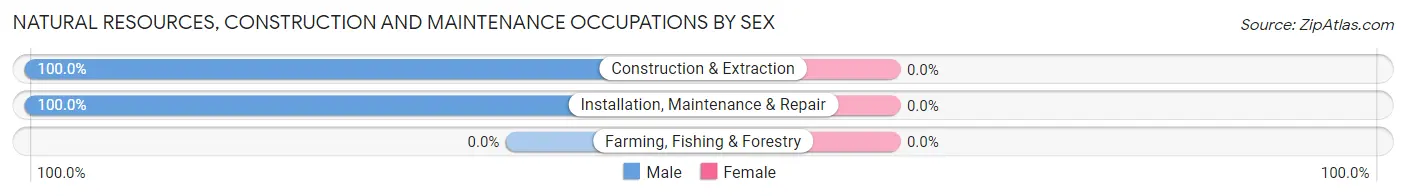
| Occupation | Male | Female |
| Farming, Fishing & Forestry | 0 (0.0%) | 0 (0.0%) |
| Construction & Extraction | 380 (100.0%) | 0 (0.0%) |
| Installation, Maintenance & Repair | 434 (100.0%) | 0 (0.0%) |
| Total (Category) | 814 (100.0%) | 0 (0.0%) |
| Total (Overall) | 5,170 (55.3%) | 4,184 (44.7%) |
Production, Transportation and Moving Occupations
The most common Production, Transportation and Moving occupations in Fate are Transportation (265 | 2.8%), Production (195 | 2.1%), and Material Moving (139 | 1.5%).
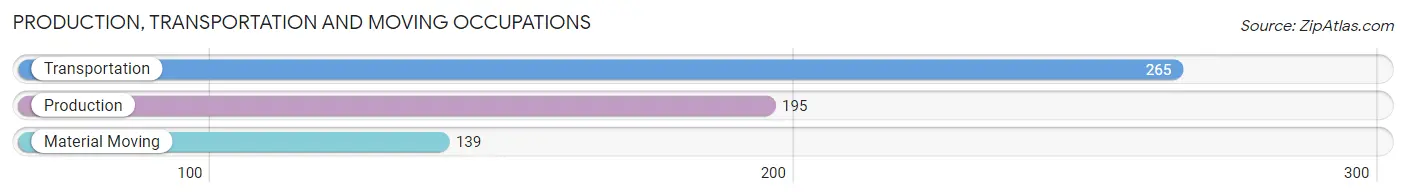
Production, Transportation and Moving Occupations by Sex
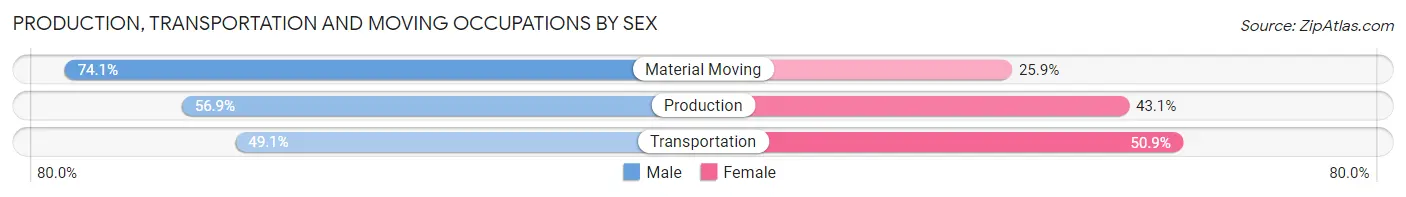
| Occupation | Male | Female |
| Production | 111 (56.9%) | 84 (43.1%) |
| Transportation | 130 (49.1%) | 135 (50.9%) |
| Material Moving | 103 (74.1%) | 36 (25.9%) |
| Total (Category) | 344 (57.4%) | 255 (42.6%) |
| Total (Overall) | 5,170 (55.3%) | 4,184 (44.7%) |
Employment Industries by Sex in Fate
Employment Industries in Fate
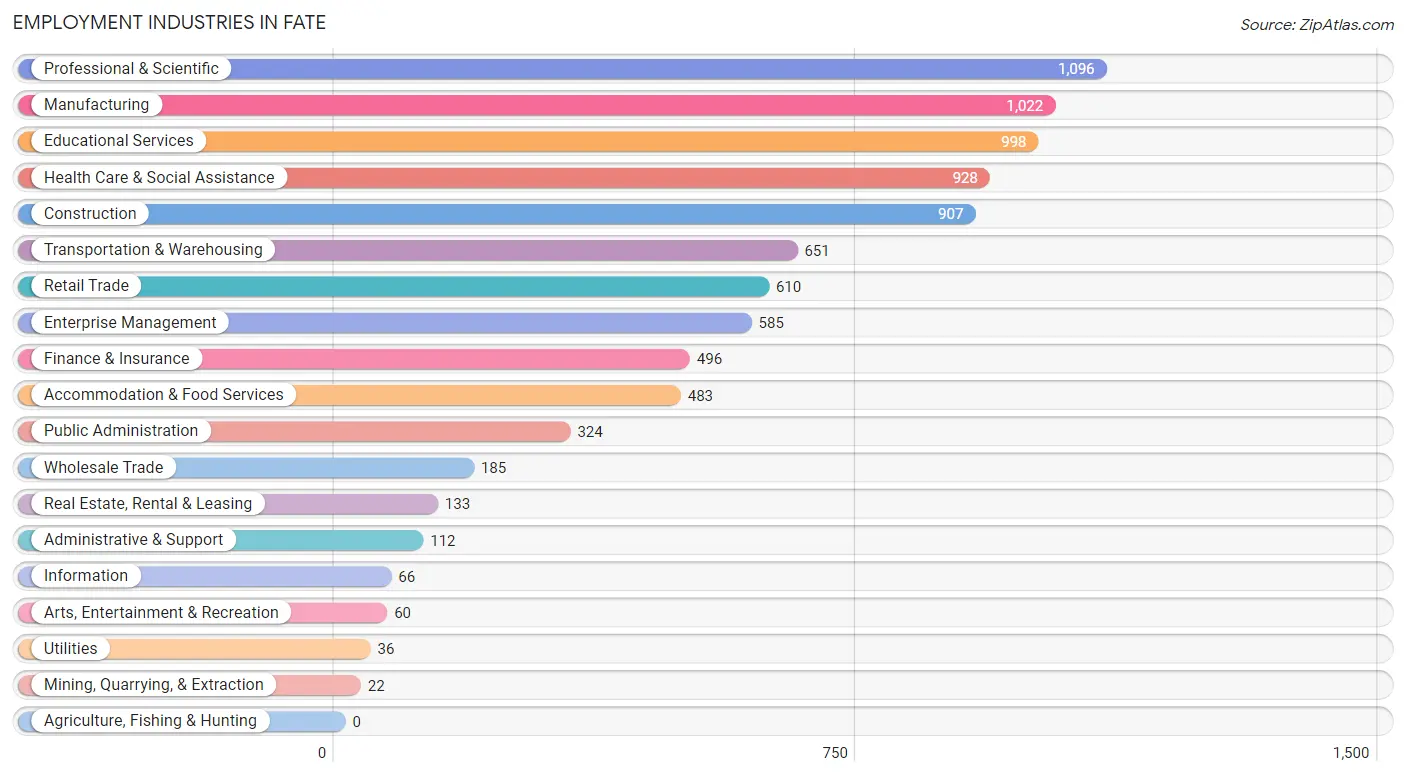
The major employment industries in Fate include Professional & Scientific (1,096 | 11.7%), Manufacturing (1,022 | 10.9%), Educational Services (998 | 10.7%), Health Care & Social Assistance (928 | 9.9%), and Construction (907 | 9.7%).
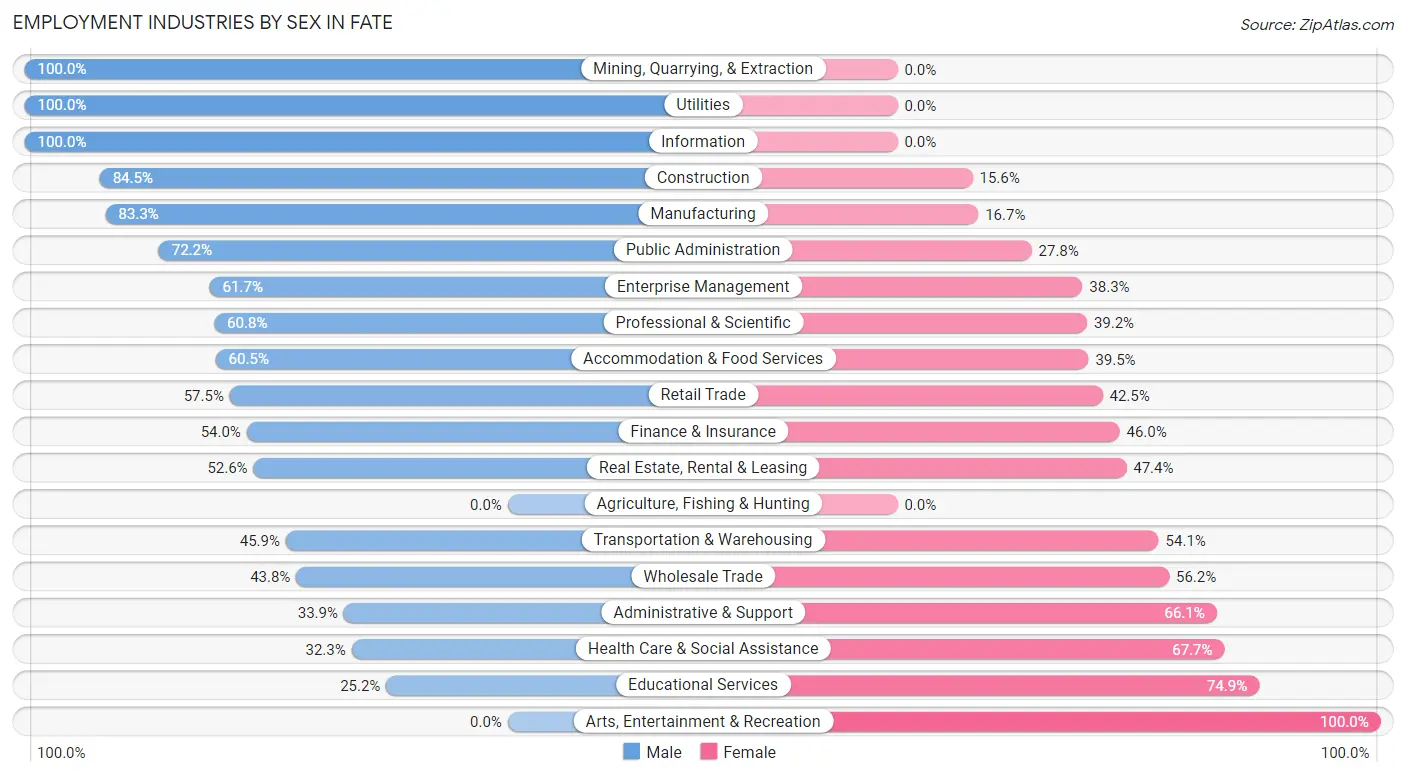
Employment Industries by Sex in Fate
The Fate industries that see more men than women are Mining, Quarrying, & Extraction (100.0%), Utilities (100.0%), and Information (100.0%), whereas the industries that tend to have a higher number of women are Arts, Entertainment & Recreation (100.0%), Educational Services (74.9%), and Health Care & Social Assistance (67.7%).
| Industry | Male | Female |
| Agriculture, Fishing & Hunting | 0 (0.0%) | 0 (0.0%) |
| Mining, Quarrying, & Extraction | 22 (100.0%) | 0 (0.0%) |
| Construction | 766 (84.5%) | 141 (15.5%) |
| Manufacturing | 851 (83.3%) | 171 (16.7%) |
| Wholesale Trade | 81 (43.8%) | 104 (56.2%) |
| Retail Trade | 351 (57.5%) | 259 (42.5%) |
| Transportation & Warehousing | 299 (45.9%) | 352 (54.1%) |
| Utilities | 36 (100.0%) | 0 (0.0%) |
| Information | 66 (100.0%) | 0 (0.0%) |
| Finance & Insurance | 268 (54.0%) | 228 (46.0%) |
| Real Estate, Rental & Leasing | 70 (52.6%) | 63 (47.4%) |
| Professional & Scientific | 666 (60.8%) | 430 (39.2%) |
| Enterprise Management | 361 (61.7%) | 224 (38.3%) |
| Administrative & Support | 38 (33.9%) | 74 (66.1%) |
| Educational Services | 251 (25.2%) | 747 (74.9%) |
| Health Care & Social Assistance | 300 (32.3%) | 628 (67.7%) |
| Arts, Entertainment & Recreation | 0 (0.0%) | 60 (100.0%) |
| Accommodation & Food Services | 292 (60.5%) | 191 (39.5%) |
| Public Administration | 234 (72.2%) | 90 (27.8%) |
| Total | 5,170 (55.3%) | 4,184 (44.7%) |
Education in Fate
School Enrollment in Fate
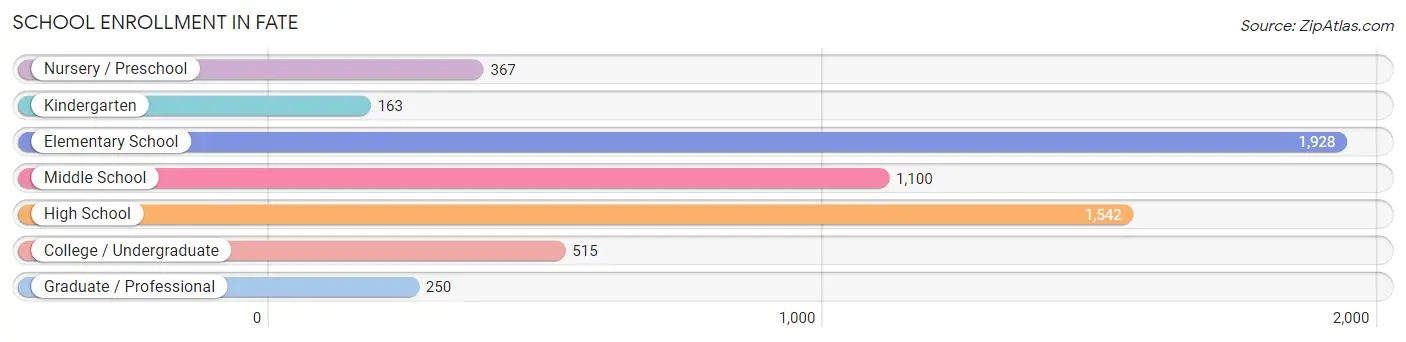
The most common levels of schooling among the 5,865 students in Fate are elementary school (1,928 | 32.9%), high school (1,542 | 26.3%), and middle school (1,100 | 18.8%).
| School Level | # Students | % Students |
| Nursery / Preschool | 367 | 6.3% |
| Kindergarten | 163 | 2.8% |
| Elementary School | 1,928 | 32.9% |
| Middle School | 1,100 | 18.8% |
| High School | 1,542 | 26.3% |
| College / Undergraduate | 515 | 8.8% |
| Graduate / Professional | 250 | 4.3% |
| Total | 5,865 | 100.0% |
School Enrollment by Age by Funding Source in Fate
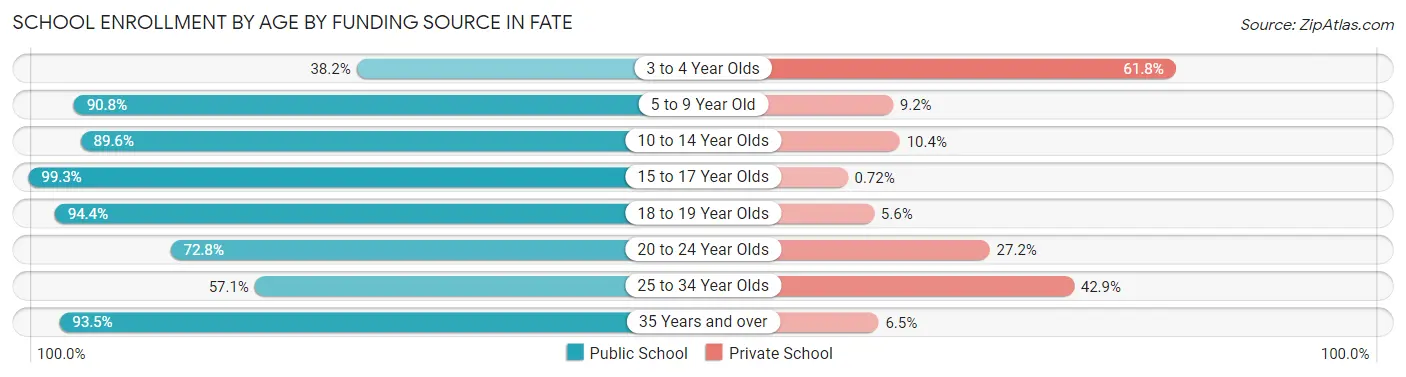
Out of a total of 5,865 students who are enrolled in schools in Fate, 716 (12.2%) attend a private institution, while the remaining 5,149 (87.8%) are enrolled in public schools. The age group of 3 to 4 year olds has the highest likelihood of being enrolled in private schools, with 183 (61.8% in the age bracket) enrolled. Conversely, the age group of 15 to 17 year olds has the lowest likelihood of being enrolled in a private school, with 827 (99.3% in the age bracket) attending a public institution.
| Age Bracket | Public School | Private School |
| 3 to 4 Year Olds | 113 (38.2%) | 183 (61.8%) |
| 5 to 9 Year Old | 1,825 (90.8%) | 184 (9.2%) |
| 10 to 14 Year Olds | 1,578 (89.6%) | 184 (10.4%) |
| 15 to 17 Year Olds | 827 (99.3%) | 6 (0.7%) |
| 18 to 19 Year Olds | 268 (94.4%) | 16 (5.6%) |
| 20 to 24 Year Olds | 158 (72.8%) | 59 (27.2%) |
| 25 to 34 Year Olds | 80 (57.1%) | 60 (42.9%) |
| 35 Years and over | 303 (93.5%) | 21 (6.5%) |
| Total | 5,149 (87.8%) | 716 (12.2%) |
Educational Attainment by Field of Study in Fate
Business (1,440 | 26.8%), engineering (672 | 12.5%), liberal arts & history (485 | 9.0%), computers & mathematics (457 | 8.5%), and science & technology (431 | 8.0%) are the most common fields of study among 5,384 individuals in Fate who have obtained a bachelor's degree or higher.
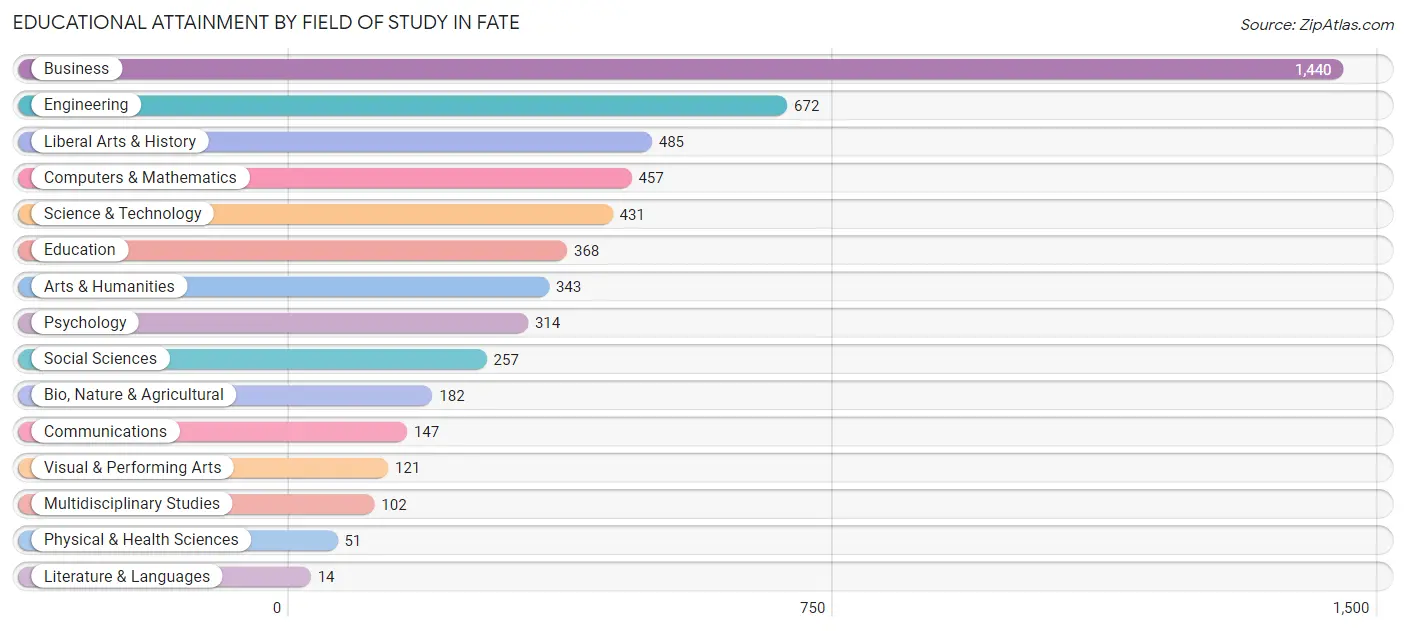
| Field of Study | # Graduates | % Graduates |
| Computers & Mathematics | 457 | 8.5% |
| Bio, Nature & Agricultural | 182 | 3.4% |
| Physical & Health Sciences | 51 | 0.9% |
| Psychology | 314 | 5.8% |
| Social Sciences | 257 | 4.8% |
| Engineering | 672 | 12.5% |
| Multidisciplinary Studies | 102 | 1.9% |
| Science & Technology | 431 | 8.0% |
| Business | 1,440 | 26.8% |
| Education | 368 | 6.8% |
| Literature & Languages | 14 | 0.3% |
| Liberal Arts & History | 485 | 9.0% |
| Visual & Performing Arts | 121 | 2.2% |
| Communications | 147 | 2.7% |
| Arts & Humanities | 343 | 6.4% |
| Total | 5,384 | 100.0% |
Transportation & Commute in Fate
Vehicle Availability by Sex in Fate
The most prevalent vehicle ownership categories in Fate are males with 2 vehicles (2,660, accounting for 51.4%) and females with 2 vehicles (2,193, making up 67.2%).
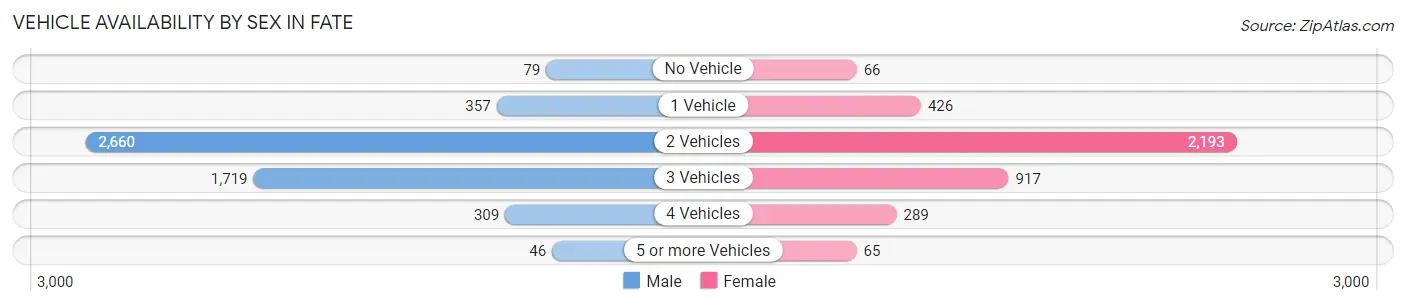
| Vehicles Available | Male | Female |
| No Vehicle | 79 (1.5%) | 66 (1.7%) |
| 1 Vehicle | 357 (6.9%) | 426 (10.8%) |
| 2 Vehicles | 2,660 (51.4%) | 2,193 (55.4%) |
| 3 Vehicles | 1,719 (33.3%) | 917 (23.2%) |
| 4 Vehicles | 309 (6.0%) | 289 (7.3%) |
| 5 or more Vehicles | 46 (0.9%) | 65 (1.6%) |
| Total | 5,170 (100.0%) | 3,956 (100.0%) |
Commute Time in Fate
The most frequently occuring commute durations in Fate are 45 to 59 minutes (1,503 commuters, 18.6%), 30 to 34 minutes (1,361 commuters, 16.9%), and 10 to 14 minutes (883 commuters, 10.9%).
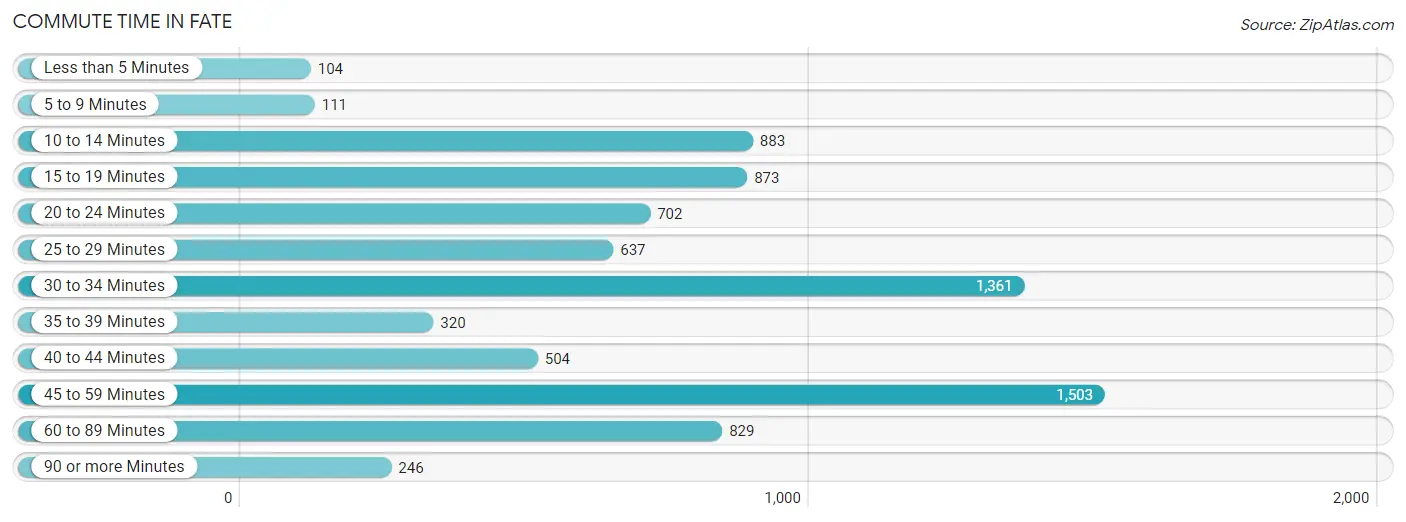
| Commute Time | # Commuters | % Commuters |
| Less than 5 Minutes | 104 | 1.3% |
| 5 to 9 Minutes | 111 | 1.4% |
| 10 to 14 Minutes | 883 | 10.9% |
| 15 to 19 Minutes | 873 | 10.8% |
| 20 to 24 Minutes | 702 | 8.7% |
| 25 to 29 Minutes | 637 | 7.9% |
| 30 to 34 Minutes | 1,361 | 16.9% |
| 35 to 39 Minutes | 320 | 4.0% |
| 40 to 44 Minutes | 504 | 6.2% |
| 45 to 59 Minutes | 1,503 | 18.6% |
| 60 to 89 Minutes | 829 | 10.3% |
| 90 or more Minutes | 246 | 3.0% |
Commute Time by Sex in Fate
The most common commute times in Fate are 45 to 59 minutes (732 commuters, 16.3%) for males and 30 to 34 minutes (814 commuters, 22.8%) for females.
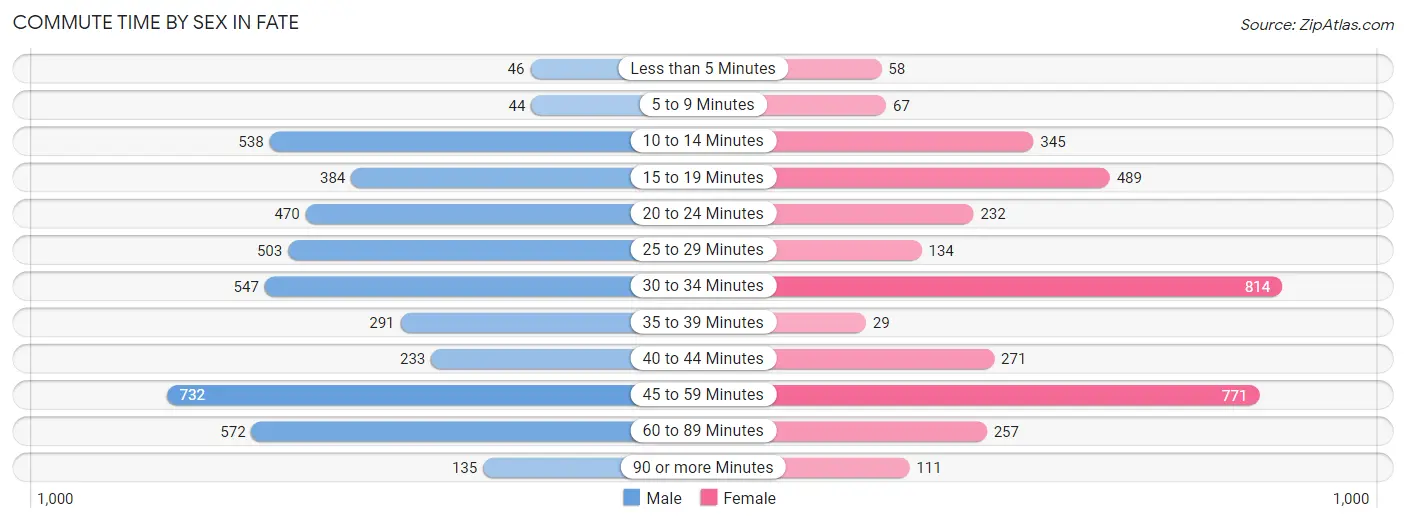
| Commute Time | Male | Female |
| Less than 5 Minutes | 46 (1.0%) | 58 (1.6%) |
| 5 to 9 Minutes | 44 (1.0%) | 67 (1.9%) |
| 10 to 14 Minutes | 538 (12.0%) | 345 (9.6%) |
| 15 to 19 Minutes | 384 (8.5%) | 489 (13.7%) |
| 20 to 24 Minutes | 470 (10.5%) | 232 (6.5%) |
| 25 to 29 Minutes | 503 (11.2%) | 134 (3.7%) |
| 30 to 34 Minutes | 547 (12.2%) | 814 (22.8%) |
| 35 to 39 Minutes | 291 (6.5%) | 29 (0.8%) |
| 40 to 44 Minutes | 233 (5.2%) | 271 (7.6%) |
| 45 to 59 Minutes | 732 (16.3%) | 771 (21.5%) |
| 60 to 89 Minutes | 572 (12.7%) | 257 (7.2%) |
| 90 or more Minutes | 135 (3.0%) | 111 (3.1%) |
Time of Departure to Work by Sex in Fate
The most frequent times of departure to work in Fate are 6:00 AM to 6:29 AM (692, 15.4%) for males and 6:00 AM to 6:29 AM (607, 17.0%) for females.
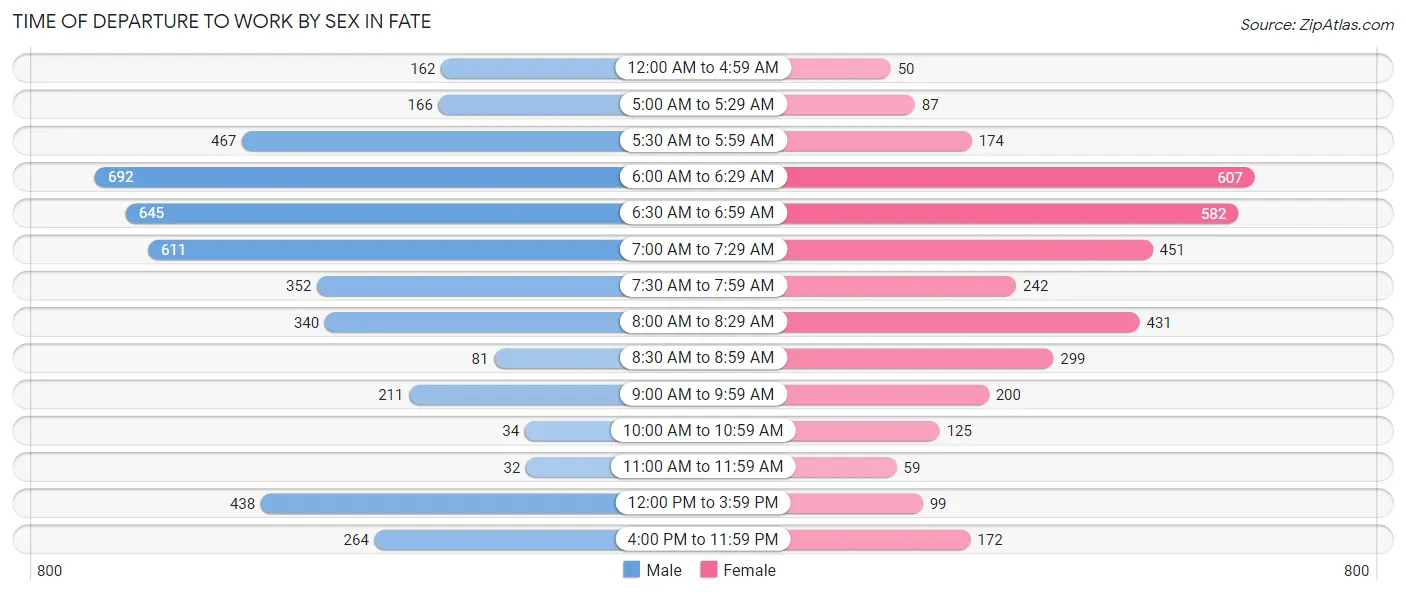
| Time of Departure | Male | Female |
| 12:00 AM to 4:59 AM | 162 (3.6%) | 50 (1.4%) |
| 5:00 AM to 5:29 AM | 166 (3.7%) | 87 (2.4%) |
| 5:30 AM to 5:59 AM | 467 (10.4%) | 174 (4.9%) |
| 6:00 AM to 6:29 AM | 692 (15.4%) | 607 (17.0%) |
| 6:30 AM to 6:59 AM | 645 (14.3%) | 582 (16.3%) |
| 7:00 AM to 7:29 AM | 611 (13.6%) | 451 (12.6%) |
| 7:30 AM to 7:59 AM | 352 (7.8%) | 242 (6.8%) |
| 8:00 AM to 8:29 AM | 340 (7.6%) | 431 (12.0%) |
| 8:30 AM to 8:59 AM | 81 (1.8%) | 299 (8.4%) |
| 9:00 AM to 9:59 AM | 211 (4.7%) | 200 (5.6%) |
| 10:00 AM to 10:59 AM | 34 (0.8%) | 125 (3.5%) |
| 11:00 AM to 11:59 AM | 32 (0.7%) | 59 (1.7%) |
| 12:00 PM to 3:59 PM | 438 (9.7%) | 99 (2.8%) |
| 4:00 PM to 11:59 PM | 264 (5.9%) | 172 (4.8%) |
| Total | 4,495 (100.0%) | 3,578 (100.0%) |
Housing Occupancy in Fate
Occupancy by Ownership in Fate
Of the total 5,994 dwellings in Fate, owner-occupied units account for 5,389 (89.9%), while renter-occupied units make up 605 (10.1%).
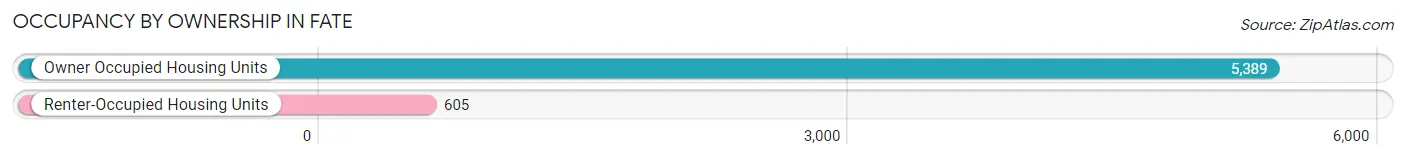
| Occupancy | # Housing Units | % Housing Units |
| Owner Occupied Housing Units | 5,389 | 89.9% |
| Renter-Occupied Housing Units | 605 | 10.1% |
| Total Occupied Housing Units | 5,994 | 100.0% |
Occupancy by Household Size in Fate
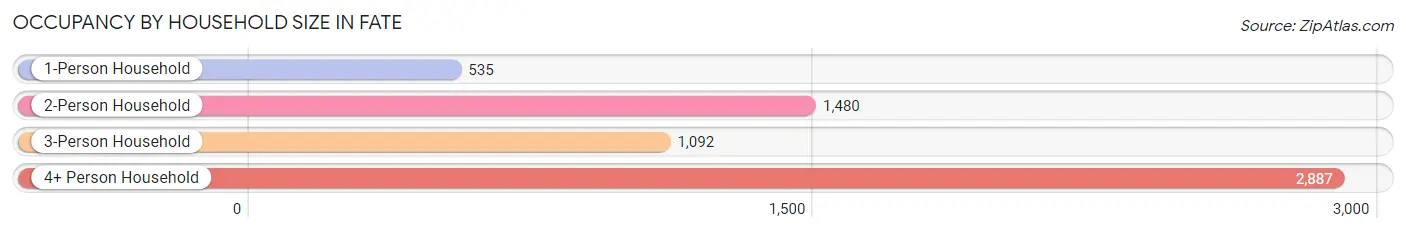
| Household Size | # Housing Units | % Housing Units |
| 1-Person Household | 535 | 8.9% |
| 2-Person Household | 1,480 | 24.7% |
| 3-Person Household | 1,092 | 18.2% |
| 4+ Person Household | 2,887 | 48.2% |
| Total Housing Units | 5,994 | 100.0% |
Occupancy by Ownership by Household Size in Fate
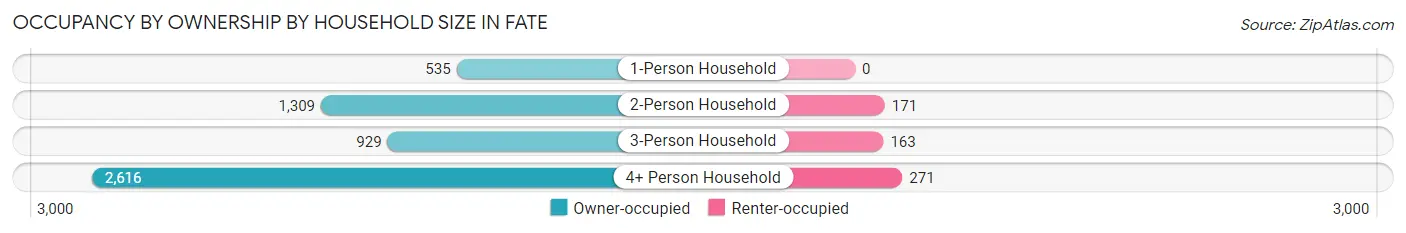
| Household Size | Owner-occupied | Renter-occupied |
| 1-Person Household | 535 (100.0%) | 0 (0.0%) |
| 2-Person Household | 1,309 (88.4%) | 171 (11.6%) |
| 3-Person Household | 929 (85.1%) | 163 (14.9%) |
| 4+ Person Household | 2,616 (90.6%) | 271 (9.4%) |
| Total Housing Units | 5,389 (89.9%) | 605 (10.1%) |
Occupancy by Educational Attainment in Fate
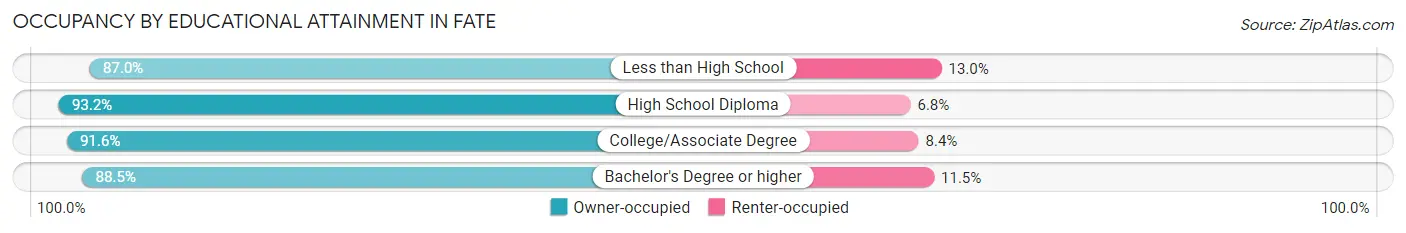
| Household Size | Owner-occupied | Renter-occupied |
| Less than High School | 262 (87.0%) | 39 (13.0%) |
| High School Diploma | 616 (93.2%) | 45 (6.8%) |
| College/Associate Degree | 1,699 (91.6%) | 156 (8.4%) |
| Bachelor's Degree or higher | 2,812 (88.5%) | 365 (11.5%) |
Occupancy by Age of Householder in Fate
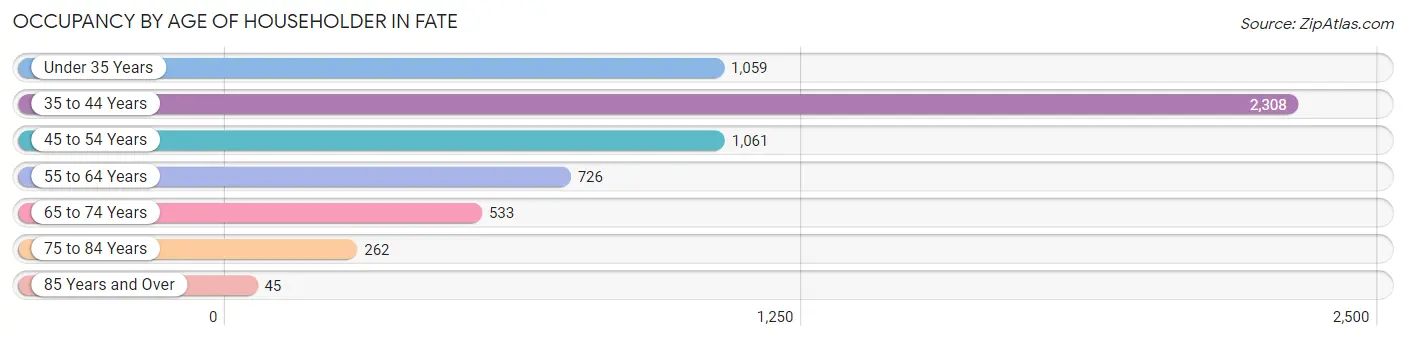
| Age Bracket | # Households | % Households |
| Under 35 Years | 1,059 | 17.7% |
| 35 to 44 Years | 2,308 | 38.5% |
| 45 to 54 Years | 1,061 | 17.7% |
| 55 to 64 Years | 726 | 12.1% |
| 65 to 74 Years | 533 | 8.9% |
| 75 to 84 Years | 262 | 4.4% |
| 85 Years and Over | 45 | 0.7% |
| Total | 5,994 | 100.0% |
Housing Finances in Fate
Median Income by Occupancy in Fate
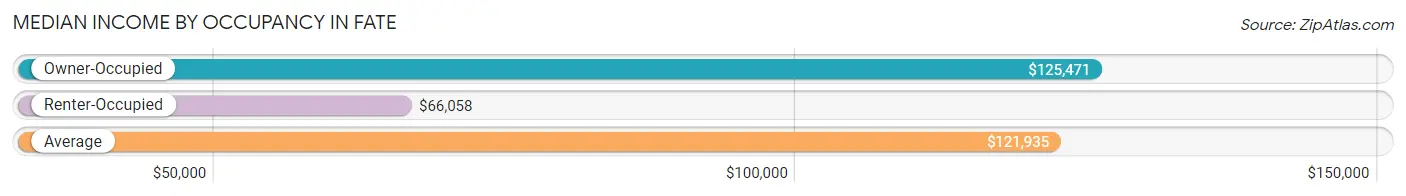
| Occupancy Type | # Households | Median Income |
| Owner-Occupied | 5,389 (89.9%) | $125,471 |
| Renter-Occupied | 605 (10.1%) | $66,058 |
| Average | 5,994 (100.0%) | $121,935 |
Occupancy by Householder Income Bracket in Fate
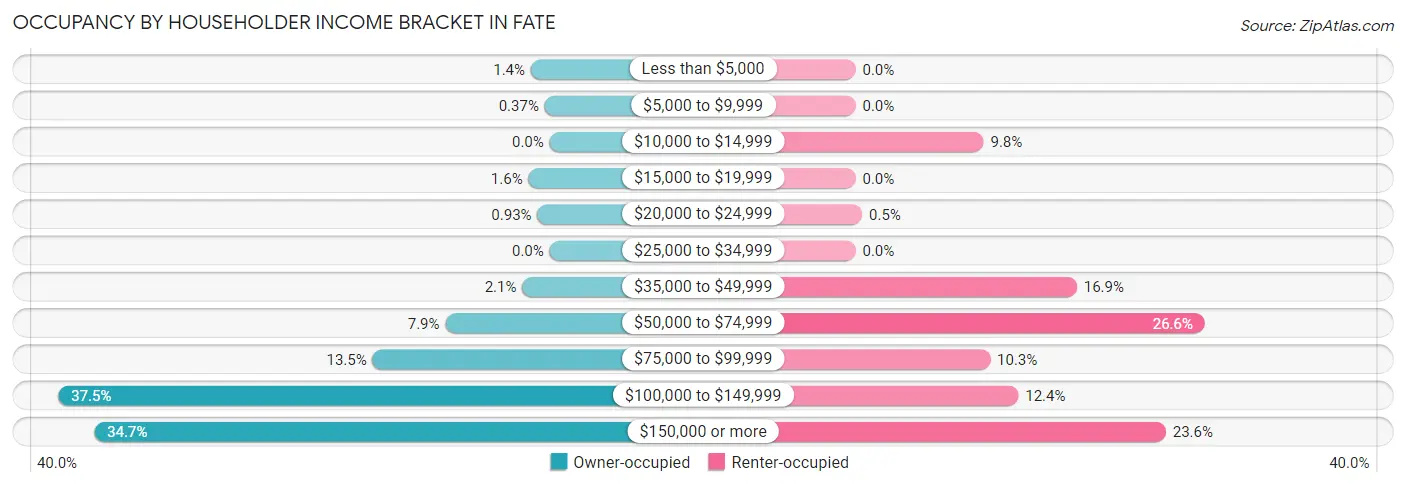
| Income Bracket | Owner-occupied | Renter-occupied |
| Less than $5,000 | 77 (1.4%) | 0 (0.0%) |
| $5,000 to $9,999 | 20 (0.4%) | 0 (0.0%) |
| $10,000 to $14,999 | 0 (0.0%) | 59 (9.8%) |
| $15,000 to $19,999 | 87 (1.6%) | 0 (0.0%) |
| $20,000 to $24,999 | 50 (0.9%) | 3 (0.5%) |
| $25,000 to $34,999 | 0 (0.0%) | 0 (0.0%) |
| $35,000 to $49,999 | 112 (2.1%) | 102 (16.9%) |
| $50,000 to $74,999 | 428 (7.9%) | 161 (26.6%) |
| $75,000 to $99,999 | 727 (13.5%) | 62 (10.2%) |
| $100,000 to $149,999 | 2,018 (37.4%) | 75 (12.4%) |
| $150,000 or more | 1,870 (34.7%) | 143 (23.6%) |
| Total | 5,389 (100.0%) | 605 (100.0%) |
Monthly Housing Cost Tiers in Fate
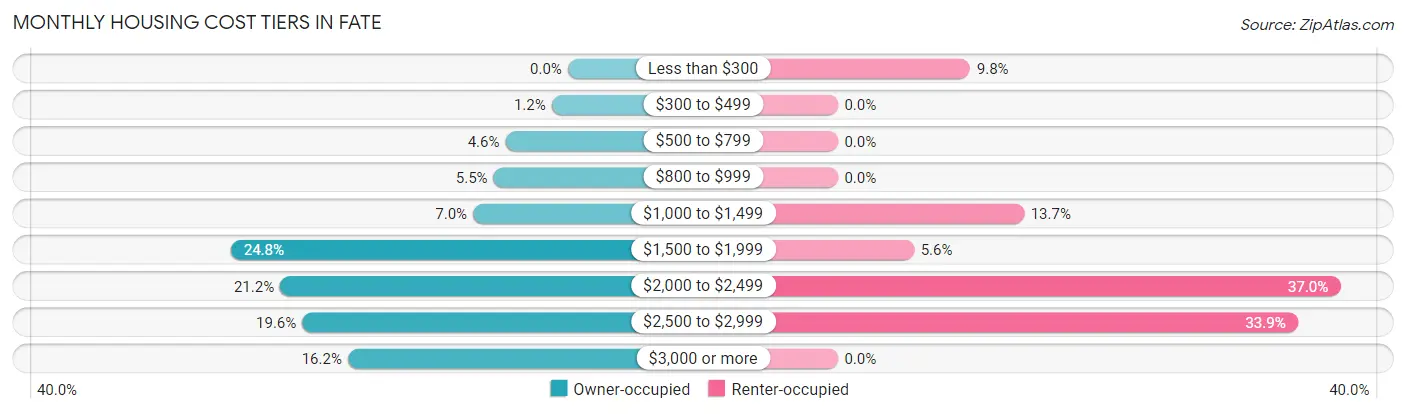
| Monthly Cost | Owner-occupied | Renter-occupied |
| Less than $300 | 0 (0.0%) | 59 (9.8%) |
| $300 to $499 | 64 (1.2%) | 0 (0.0%) |
| $500 to $799 | 248 (4.6%) | 0 (0.0%) |
| $800 to $999 | 295 (5.5%) | 0 (0.0%) |
| $1,000 to $1,499 | 376 (7.0%) | 83 (13.7%) |
| $1,500 to $1,999 | 1,337 (24.8%) | 34 (5.6%) |
| $2,000 to $2,499 | 1,142 (21.2%) | 224 (37.0%) |
| $2,500 to $2,999 | 1,054 (19.6%) | 205 (33.9%) |
| $3,000 or more | 873 (16.2%) | 0 (0.0%) |
| Total | 5,389 (100.0%) | 605 (100.0%) |
Physical Housing Characteristics in Fate
Housing Structures in Fate
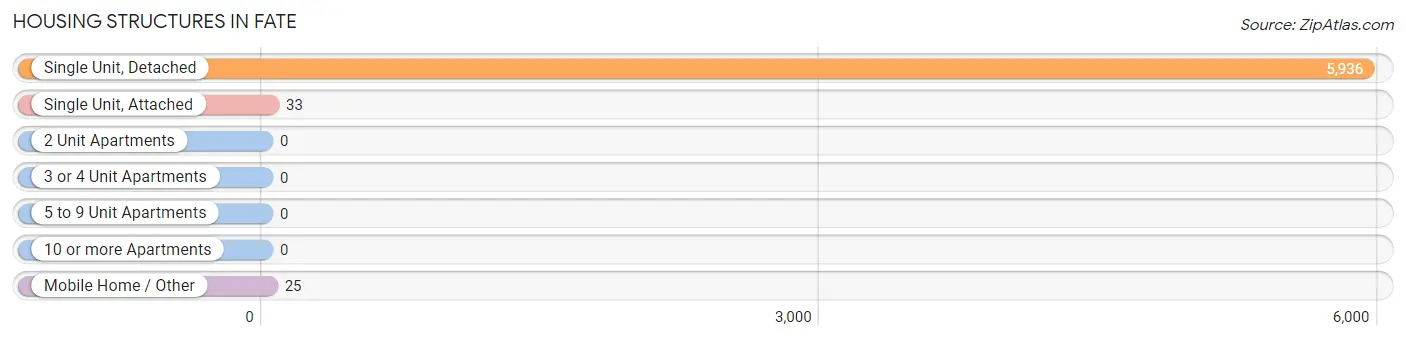
| Structure Type | # Housing Units | % Housing Units |
| Single Unit, Detached | 5,936 | 99.0% |
| Single Unit, Attached | 33 | 0.5% |
| 2 Unit Apartments | 0 | 0.0% |
| 3 or 4 Unit Apartments | 0 | 0.0% |
| 5 to 9 Unit Apartments | 0 | 0.0% |
| 10 or more Apartments | 0 | 0.0% |
| Mobile Home / Other | 25 | 0.4% |
| Total | 5,994 | 100.0% |
Housing Structures by Occupancy in Fate
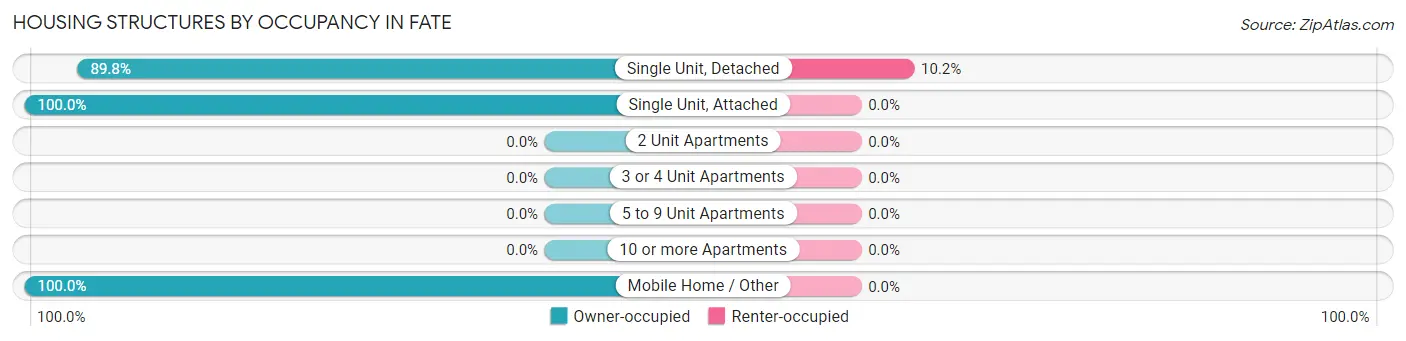
| Structure Type | Owner-occupied | Renter-occupied |
| Single Unit, Detached | 5,331 (89.8%) | 605 (10.2%) |
| Single Unit, Attached | 33 (100.0%) | 0 (0.0%) |
| 2 Unit Apartments | 0 (0.0%) | 0 (0.0%) |
| 3 or 4 Unit Apartments | 0 (0.0%) | 0 (0.0%) |
| 5 to 9 Unit Apartments | 0 (0.0%) | 0 (0.0%) |
| 10 or more Apartments | 0 (0.0%) | 0 (0.0%) |
| Mobile Home / Other | 25 (100.0%) | 0 (0.0%) |
| Total | 5,389 (89.9%) | 605 (10.1%) |
Housing Structures by Number of Rooms in Fate
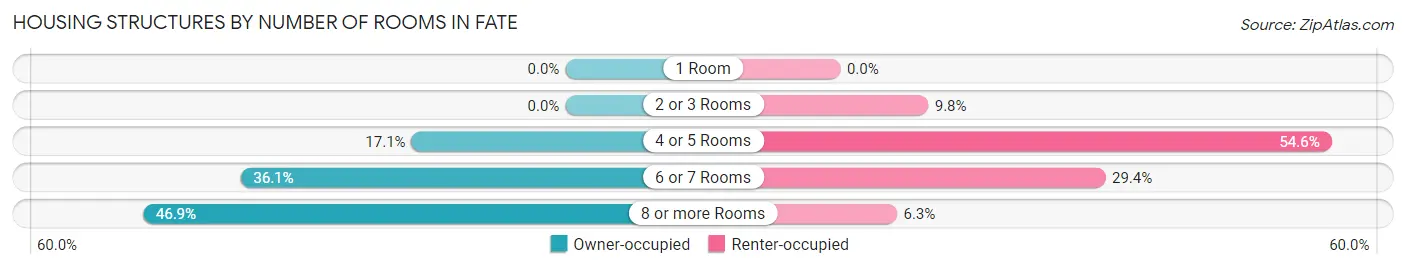
| Number of Rooms | Owner-occupied | Renter-occupied |
| 1 Room | 0 (0.0%) | 0 (0.0%) |
| 2 or 3 Rooms | 0 (0.0%) | 59 (9.8%) |
| 4 or 5 Rooms | 920 (17.1%) | 330 (54.5%) |
| 6 or 7 Rooms | 1,943 (36.0%) | 178 (29.4%) |
| 8 or more Rooms | 2,526 (46.9%) | 38 (6.3%) |
| Total | 5,389 (100.0%) | 605 (100.0%) |
Housing Structure by Heating Type in Fate
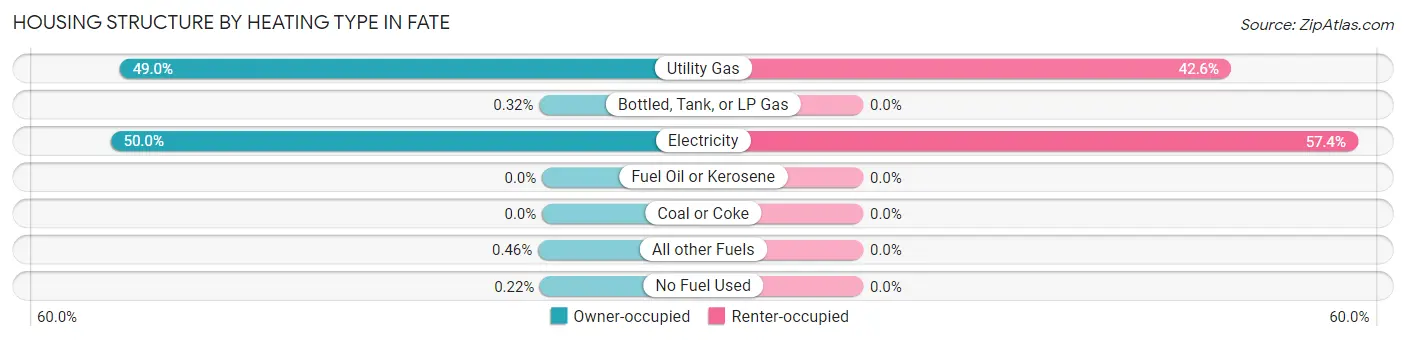
| Heating Type | Owner-occupied | Renter-occupied |
| Utility Gas | 2,639 (49.0%) | 258 (42.6%) |
| Bottled, Tank, or LP Gas | 17 (0.3%) | 0 (0.0%) |
| Electricity | 2,696 (50.0%) | 347 (57.4%) |
| Fuel Oil or Kerosene | 0 (0.0%) | 0 (0.0%) |
| Coal or Coke | 0 (0.0%) | 0 (0.0%) |
| All other Fuels | 25 (0.5%) | 0 (0.0%) |
| No Fuel Used | 12 (0.2%) | 0 (0.0%) |
| Total | 5,389 (100.0%) | 605 (100.0%) |
Household Vehicle Usage in Fate
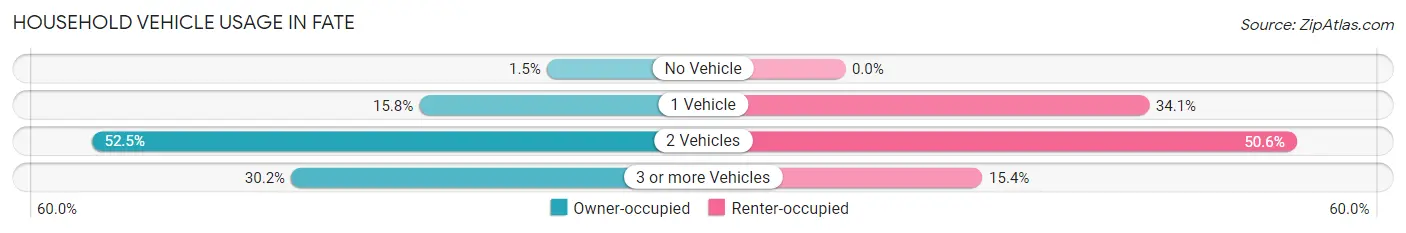
| Vehicles per Household | Owner-occupied | Renter-occupied |
| No Vehicle | 82 (1.5%) | 0 (0.0%) |
| 1 Vehicle | 852 (15.8%) | 206 (34.1%) |
| 2 Vehicles | 2,829 (52.5%) | 306 (50.6%) |
| 3 or more Vehicles | 1,626 (30.2%) | 93 (15.4%) |
| Total | 5,389 (100.0%) | 605 (100.0%) |
Real Estate & Mortgages in Fate
Real Estate and Mortgage Overview in Fate
| Characteristic | Without Mortgage | With Mortgage |
| Housing Units | 814 | 4,575 |
| Median Property Value | $306,300 | $348,700 |
| Median Household Income | $102,577 | $1,701 |
| Monthly Housing Costs | $911 | $873 |
| Real Estate Taxes | $4,714 | $128 |
Property Value by Mortgage Status in Fate
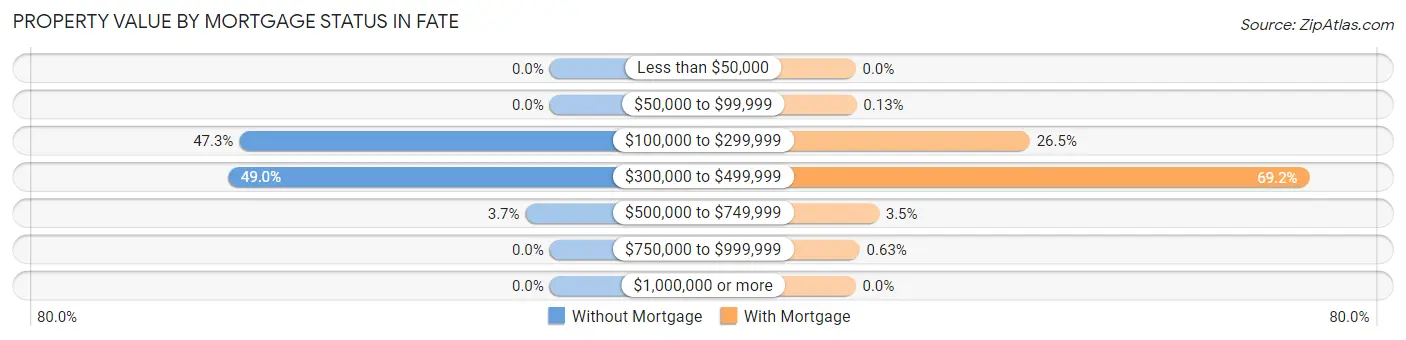
| Property Value | Without Mortgage | With Mortgage |
| Less than $50,000 | 0 (0.0%) | 0 (0.0%) |
| $50,000 to $99,999 | 0 (0.0%) | 6 (0.1%) |
| $100,000 to $299,999 | 385 (47.3%) | 1,214 (26.5%) |
| $300,000 to $499,999 | 399 (49.0%) | 3,164 (69.2%) |
| $500,000 to $749,999 | 30 (3.7%) | 162 (3.5%) |
| $750,000 to $999,999 | 0 (0.0%) | 29 (0.6%) |
| $1,000,000 or more | 0 (0.0%) | 0 (0.0%) |
| Total | 814 (100.0%) | 4,575 (100.0%) |
Household Income by Mortgage Status in Fate
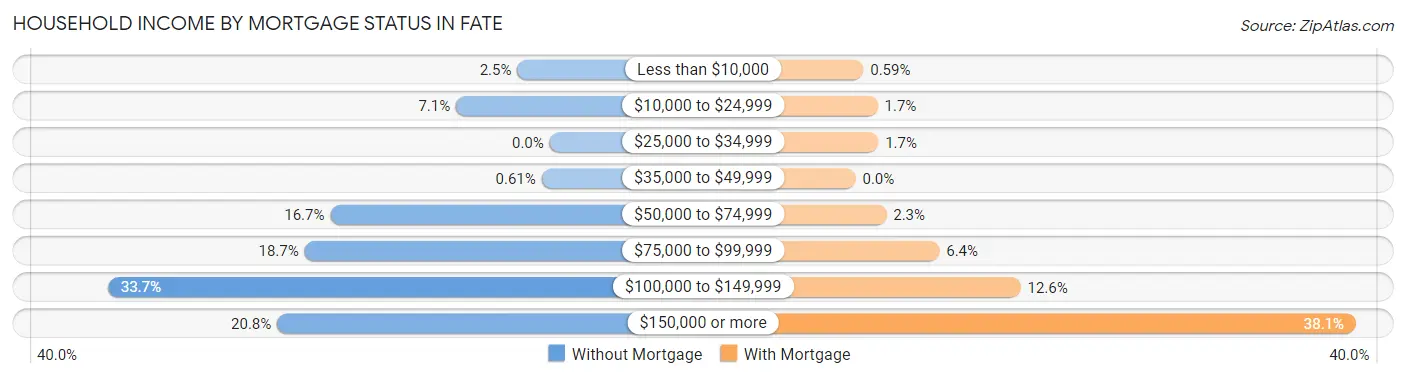
| Household Income | Without Mortgage | With Mortgage |
| Less than $10,000 | 20 (2.5%) | 27 (0.6%) |
| $10,000 to $24,999 | 58 (7.1%) | 77 (1.7%) |
| $25,000 to $34,999 | 0 (0.0%) | 79 (1.7%) |
| $35,000 to $49,999 | 5 (0.6%) | 0 (0.0%) |
| $50,000 to $74,999 | 136 (16.7%) | 107 (2.3%) |
| $75,000 to $99,999 | 152 (18.7%) | 292 (6.4%) |
| $100,000 to $149,999 | 274 (33.7%) | 575 (12.6%) |
| $150,000 or more | 169 (20.8%) | 1,744 (38.1%) |
| Total | 814 (100.0%) | 4,575 (100.0%) |
Property Value to Household Income Ratio in Fate
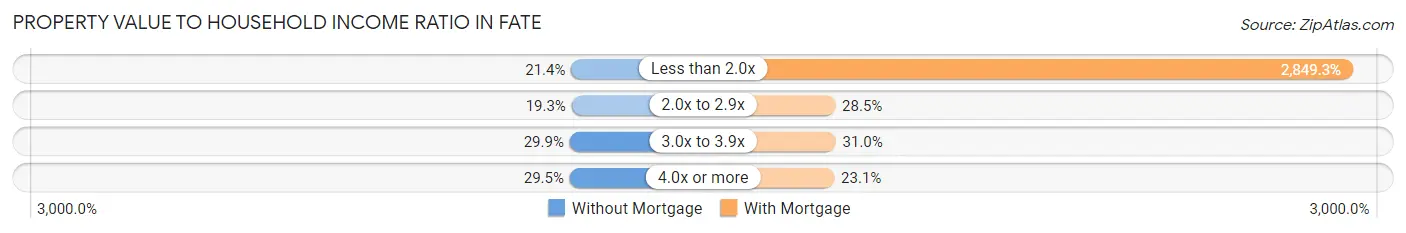
| Value-to-Income Ratio | Without Mortgage | With Mortgage |
| Less than 2.0x | 174 (21.4%) | 130,354 (2,849.3%) |
| 2.0x to 2.9x | 157 (19.3%) | 1,305 (28.5%) |
| 3.0x to 3.9x | 243 (29.8%) | 1,419 (31.0%) |
| 4.0x or more | 240 (29.5%) | 1,058 (23.1%) |
| Total | 814 (100.0%) | 4,575 (100.0%) |
Real Estate Taxes by Mortgage Status in Fate

| Property Taxes | Without Mortgage | With Mortgage |
| Less than $800 | 0 (0.0%) | 23 (0.5%) |
| $800 to $1,499 | 71 (8.7%) | 92 (2.0%) |
| $800 to $1,499 | 722 (88.7%) | 37 (0.8%) |
| Total | 814 (100.0%) | 4,575 (100.0%) |
Health & Disability in Fate
Health Insurance Coverage by Age in Fate
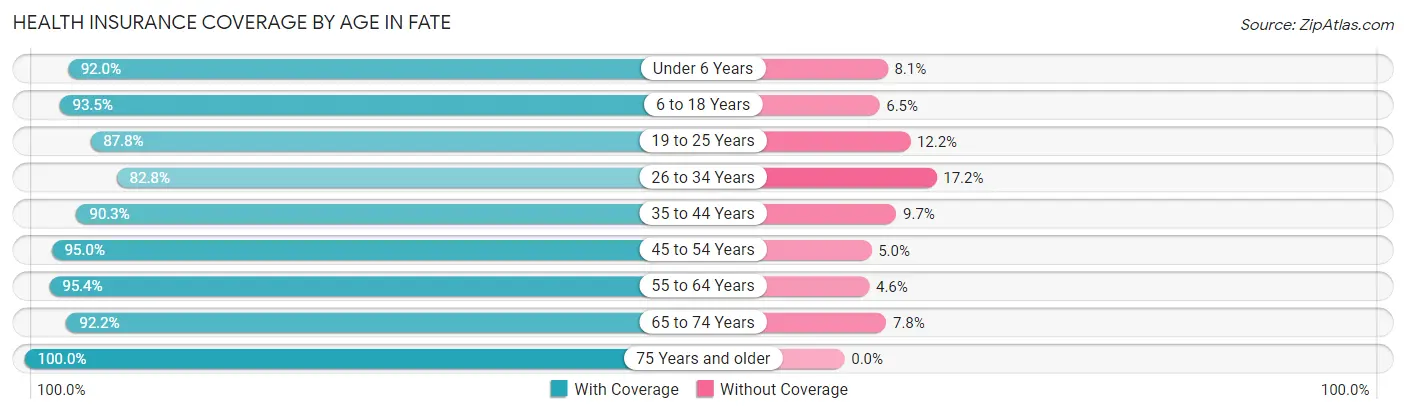
| Age Bracket | With Coverage | Without Coverage |
| Under 6 Years | 1,394 (91.9%) | 122 (8.1%) |
| 6 to 18 Years | 4,616 (93.5%) | 322 (6.5%) |
| 19 to 25 Years | 1,133 (87.8%) | 158 (12.2%) |
| 26 to 34 Years | 1,835 (82.8%) | 380 (17.2%) |
| 35 to 44 Years | 3,283 (90.3%) | 351 (9.7%) |
| 45 to 54 Years | 1,986 (95.0%) | 105 (5.0%) |
| 55 to 64 Years | 1,551 (95.4%) | 75 (4.6%) |
| 65 to 74 Years | 984 (92.2%) | 83 (7.8%) |
| 75 Years and older | 632 (100.0%) | 0 (0.0%) |
| Total | 17,414 (91.6%) | 1,596 (8.4%) |
Health Insurance Coverage by Citizenship Status in Fate
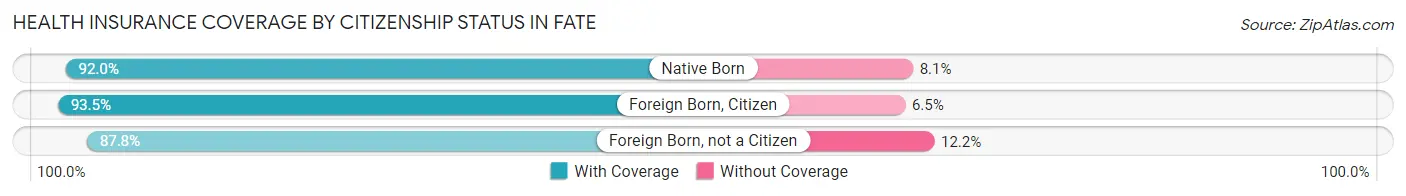
| Citizenship Status | With Coverage | Without Coverage |
| Native Born | 1,394 (91.9%) | 122 (8.1%) |
| Foreign Born, Citizen | 4,616 (93.5%) | 322 (6.5%) |
| Foreign Born, not a Citizen | 1,133 (87.8%) | 158 (12.2%) |
Health Insurance Coverage by Household Income in Fate
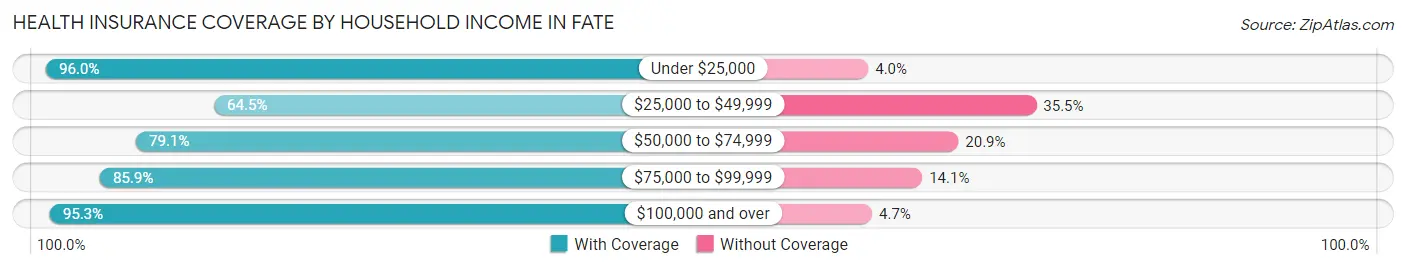
| Household Income | With Coverage | Without Coverage |
| Under $25,000 | 666 (96.0%) | 28 (4.0%) |
| $25,000 to $49,999 | 354 (64.5%) | 195 (35.5%) |
| $50,000 to $74,999 | 1,658 (79.1%) | 438 (20.9%) |
| $75,000 to $99,999 | 1,762 (85.9%) | 290 (14.1%) |
| $100,000 and over | 12,974 (95.3%) | 645 (4.7%) |
Public vs Private Health Insurance Coverage by Age in Fate
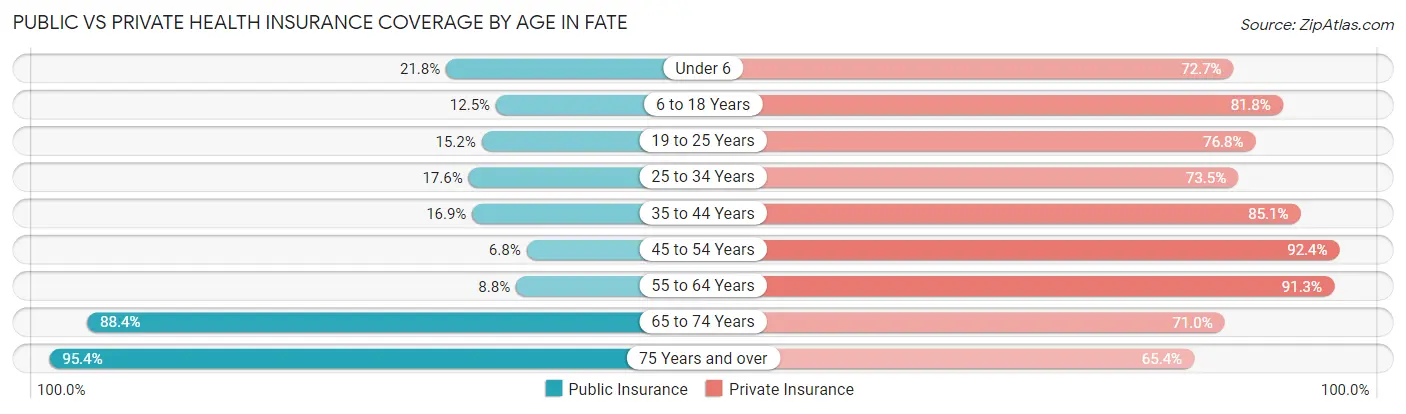
| Age Bracket | Public Insurance | Private Insurance |
| Under 6 | 330 (21.8%) | 1,102 (72.7%) |
| 6 to 18 Years | 618 (12.5%) | 4,041 (81.8%) |
| 19 to 25 Years | 196 (15.2%) | 991 (76.8%) |
| 25 to 34 Years | 390 (17.6%) | 1,629 (73.5%) |
| 35 to 44 Years | 615 (16.9%) | 3,093 (85.1%) |
| 45 to 54 Years | 143 (6.8%) | 1,931 (92.3%) |
| 55 to 64 Years | 143 (8.8%) | 1,485 (91.3%) |
| 65 to 74 Years | 943 (88.4%) | 758 (71.0%) |
| 75 Years and over | 603 (95.4%) | 413 (65.3%) |
| Total | 3,981 (20.9%) | 15,443 (81.2%) |
Disability Status by Sex by Age in Fate
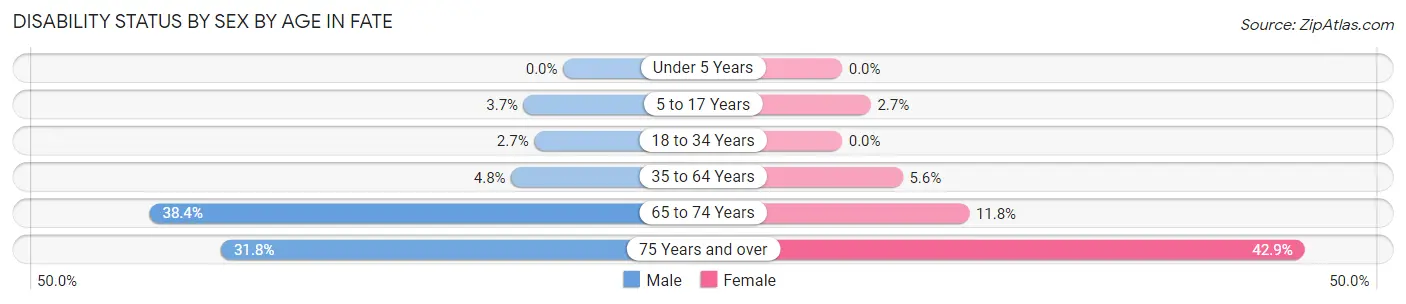
| Age Bracket | Male | Female |
| Under 5 Years | 0 (0.0%) | 0 (0.0%) |
| 5 to 17 Years | 99 (3.7%) | 61 (2.7%) |
| 18 to 34 Years | 53 (2.7%) | 0 (0.0%) |
| 35 to 64 Years | 179 (4.8%) | 205 (5.6%) |
| 65 to 74 Years | 182 (38.4%) | 70 (11.8%) |
| 75 Years and over | 95 (31.8%) | 143 (42.9%) |
Disability Class by Sex by Age in Fate
Disability Class: Hearing Difficulty
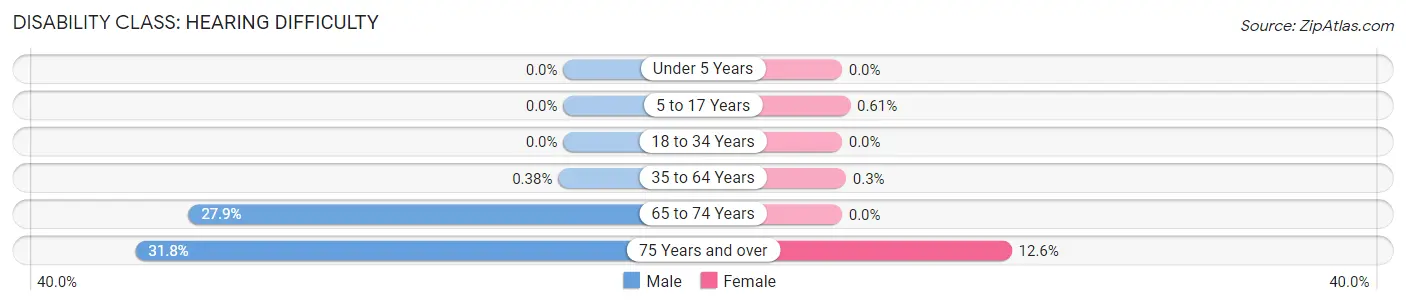
| Age Bracket | Male | Female |
| Under 5 Years | 0 (0.0%) | 0 (0.0%) |
| 5 to 17 Years | 0 (0.0%) | 14 (0.6%) |
| 18 to 34 Years | 0 (0.0%) | 0 (0.0%) |
| 35 to 64 Years | 14 (0.4%) | 11 (0.3%) |
| 65 to 74 Years | 132 (27.9%) | 0 (0.0%) |
| 75 Years and over | 95 (31.8%) | 42 (12.6%) |
Disability Class: Vision Difficulty
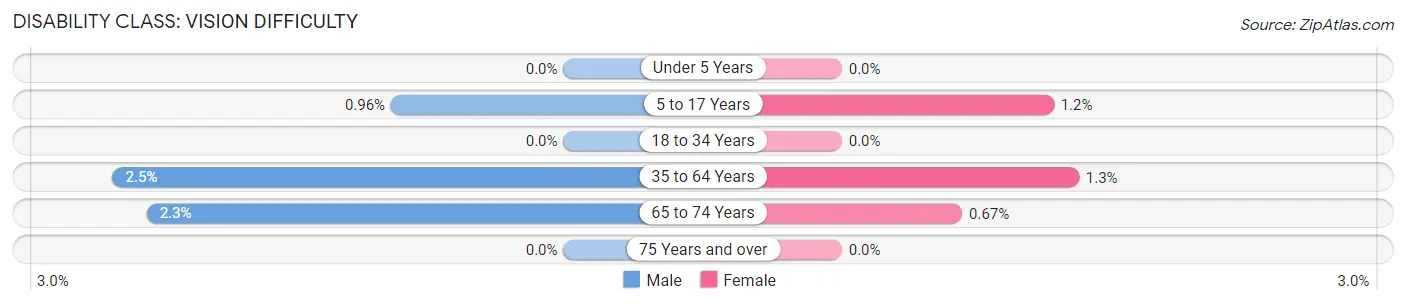
| Age Bracket | Male | Female |
| Under 5 Years | 0 (0.0%) | 0 (0.0%) |
| 5 to 17 Years | 26 (1.0%) | 27 (1.2%) |
| 18 to 34 Years | 0 (0.0%) | 0 (0.0%) |
| 35 to 64 Years | 93 (2.5%) | 48 (1.3%) |
| 65 to 74 Years | 11 (2.3%) | 4 (0.7%) |
| 75 Years and over | 0 (0.0%) | 0 (0.0%) |
Disability Class: Cognitive Difficulty
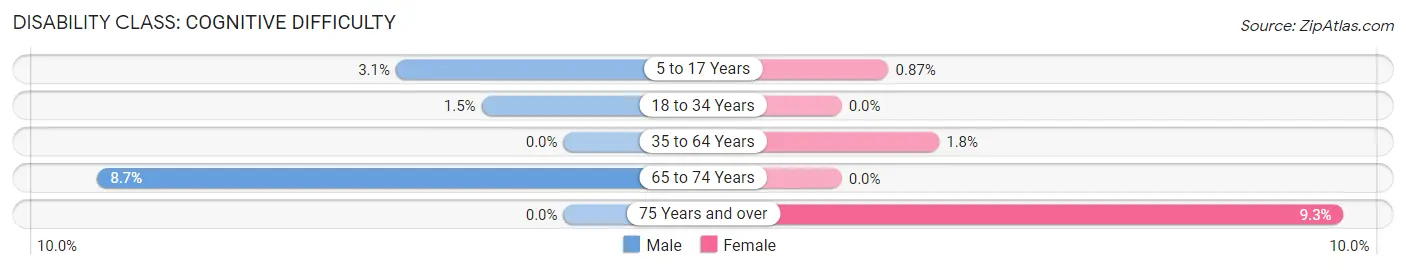
| Age Bracket | Male | Female |
| 5 to 17 Years | 84 (3.1%) | 20 (0.9%) |
| 18 to 34 Years | 30 (1.5%) | 0 (0.0%) |
| 35 to 64 Years | 0 (0.0%) | 66 (1.8%) |
| 65 to 74 Years | 41 (8.6%) | 0 (0.0%) |
| 75 Years and over | 0 (0.0%) | 31 (9.3%) |
Disability Class: Ambulatory Difficulty
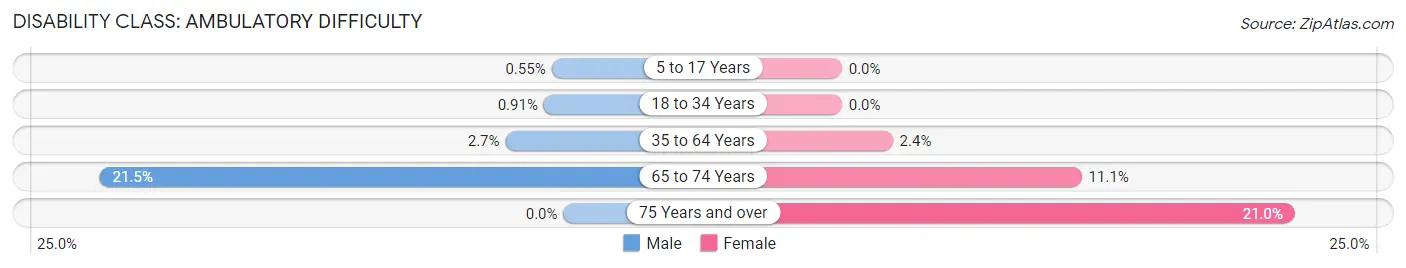
| Age Bracket | Male | Female |
| 5 to 17 Years | 15 (0.5%) | 0 (0.0%) |
| 18 to 34 Years | 18 (0.9%) | 0 (0.0%) |
| 35 to 64 Years | 100 (2.7%) | 86 (2.4%) |
| 65 to 74 Years | 102 (21.5%) | 66 (11.1%) |
| 75 Years and over | 0 (0.0%) | 70 (21.0%) |
Disability Class: Self-Care Difficulty
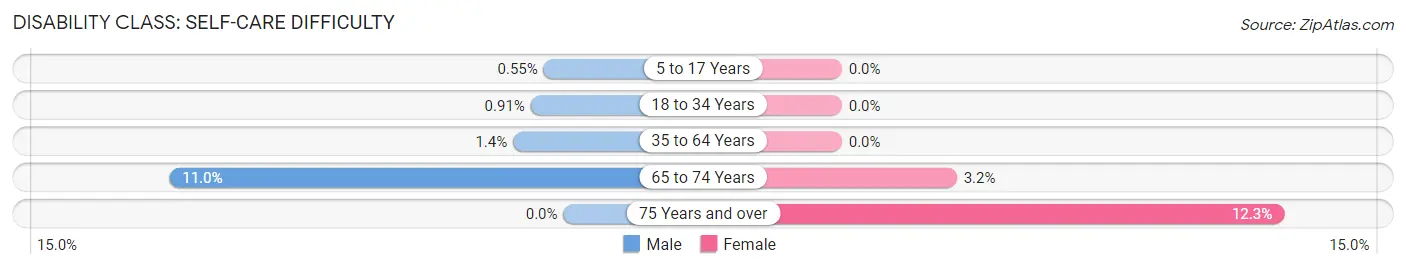
| Age Bracket | Male | Female |
| 5 to 17 Years | 15 (0.5%) | 0 (0.0%) |
| 18 to 34 Years | 18 (0.9%) | 0 (0.0%) |
| 35 to 64 Years | 52 (1.4%) | 0 (0.0%) |
| 65 to 74 Years | 52 (11.0%) | 19 (3.2%) |
| 75 Years and over | 0 (0.0%) | 41 (12.3%) |
Technology Access in Fate
Computing Device Access in Fate
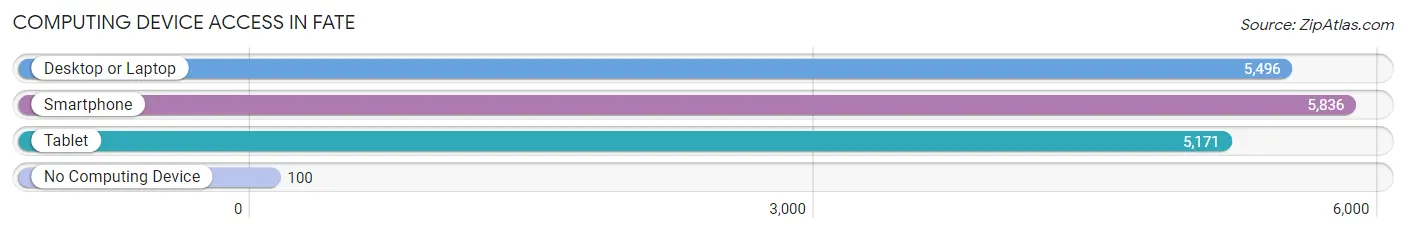
| Device Type | # Households | % Households |
| Desktop or Laptop | 5,496 | 91.7% |
| Smartphone | 5,836 | 97.4% |
| Tablet | 5,171 | 86.3% |
| No Computing Device | 100 | 1.7% |
| Total | 5,994 | 100.0% |
Internet Access in Fate
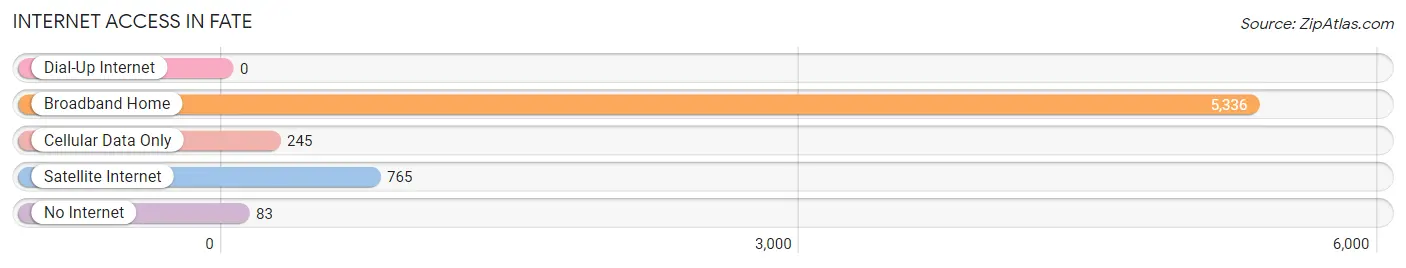
| Internet Type | # Households | % Households |
| Dial-Up Internet | 0 | 0.0% |
| Broadband Home | 5,336 | 89.0% |
| Cellular Data Only | 245 | 4.1% |
| Satellite Internet | 765 | 12.8% |
| No Internet | 83 | 1.4% |
| Total | 5,994 | 100.0% |
Fate Summary
Fate, Texas is a small city located in Rockwall County, Texas, United States. It is part of the Dallas-Fort Worth-Arlington metropolitan area. The population was 6,357 at the 2010 census.
History
Fate was founded in 1873 by William and Mary Ann (McGee) Fate. The Fates were among the first settlers in the area, and the town was named after them. The Fates had come to the area from Tennessee, and they were joined by other settlers from the same state.
The town was originally known as Fate Station, as it was a stop on the Texas and Pacific Railway. The town was incorporated in 1891, and the first post office was established in 1892.
Geography
Fate is located at 32°59'25" North, 96°30'45" West (32.9903, -96.5125). It is situated in the northeast corner of Rockwall County, about 25 miles east of Dallas.
The city has a total area of 4 2 square miles all of which is land
Economy
Fate is primarily a bedroom community, with most of its residents commuting to nearby cities for work. The city does have some local businesses, including a few restaurants, a grocery store, and a few small retail stores.
The city is also home to a number of industrial and manufacturing businesses, including a plastics manufacturer, a metal fabricator, and a printing company.
Demographics
As of the 2010 census, there were 6,357 people, 2,093 households, and 1,637 families residing in the city. The population density was 1,509.3 people per square mile. The racial makeup of the city was 79.2% White, 8.2% African American, 0.5% Native American, 0.7% Asian, 0.1% Pacific Islander, 8.7% from other races, and 2.6% from two or more races. Hispanic or Latino of any race were 18.2% of the population.
There were 2,093 households, out of which 44.2% had children under the age of 18 living with them, 58.2% were married couples living together, 12.7% had a female householder with no husband present, and 24.2% were non-families. 19.2% of all households were made up of individuals, and 6.2% had someone living alone who was 65 years of age or older. The average household size was 3.02 and the average family size was 3.48.
In the city, the population was spread out, with 33.2% under the age of 18, 8.3% from 18 to 24, 32.2% from 25 to 44, 19.7% from 45 to 64, and 6.6% who were 65 years of age or older. The median age was 32 years. For every 100 females, there were 97.2 males. For every 100 females age 18 and over, there were 94.2 males.
The median income for a household in the city was $50,945, and the median income for a family was $54,917. Males had a median income of $41,919 versus $30,917 for females. The per capita income for the city was $20,945. About 6.2% of families and 8.2% of the population were below the poverty line, including 10.2% of those under age 18 and 6.2% of those age 65 or over.
Common Questions
What is the Total Population of Fate?
Total Population of Fate is 19,010.
What is the Total Male Population of Fate?
Total Male Population of Fate is 9,686.
What is the Total Female Population of Fate?
Total Female Population of Fate is 9,324.
What is the Ratio of Males per 100 Females in Fate?
There are 103.88 Males per 100 Females in Fate.
What is the Ratio of Females per 100 Males in Fate?
There are 96.26 Females per 100 Males in Fate.
What is the Median Population Age in Fate?
Median Population Age in Fate is 33.0 Years.
What is the Average Family Size in Fate
Average Family Size in Fate is 3.4 People.
What is the Average Household Size in Fate
Average Household Size in Fate is 3.2 People.
What is Per Capita Income in Fate?
Per Capita income in Fate is $41,305.
What is the Median Family Income in Fate?
Median Family Income in Fate is $126,173.
What is the Median Household income in Fate?
Median Household Income in Fate is $121,935.
What is Income or Wage Gap in Fate?
Income or Wage Gap in Fate is 45.8%.
Women in Fate earn 54.2 cents for every dollar earned by a man.
What is Inequality or Gini Index in Fate?
Inequality or Gini Index in Fate is 0.30.
How Large is the Labor Force in Fate?
There are 10,047 People in the Labor Forcein in Fate.
What is the Percentage of People in the Labor Force in Fate?
75.0% of People are in the Labor Force in Fate.
What is the Unemployment Rate in Fate?
Unemployment Rate in Fate is 6.8%.