Manor, TX
Manor Map
Manor Overview
15,341
TOTAL POPULATION
7,647
MALE POPULATION
7,694
FEMALE POPULATION
99.39
MALES / 100 FEMALES
100.61
FEMALES / 100 MALES
30.7
MEDIAN AGE
3.7
AVG FAMILY SIZE
3.4
AVG HOUSEHOLD SIZE
$30,408
PER CAPITA INCOME
$100,878
AVG FAMILY INCOME
$96,657
AVG HOUSEHOLD INCOME
37.0%
WAGE / INCOME GAP [ % ]
63.0¢/ $1
WAGE / INCOME GAP [ $ ]
0.28
INEQUALITY / GINI INDEX
8,007
LABOR FORCE [ PEOPLE ]
76.0%
PERCENT IN LABOR FORCE
4.5%
UNEMPLOYMENT RATE
Manor Zip Codes
Manor Area Codes
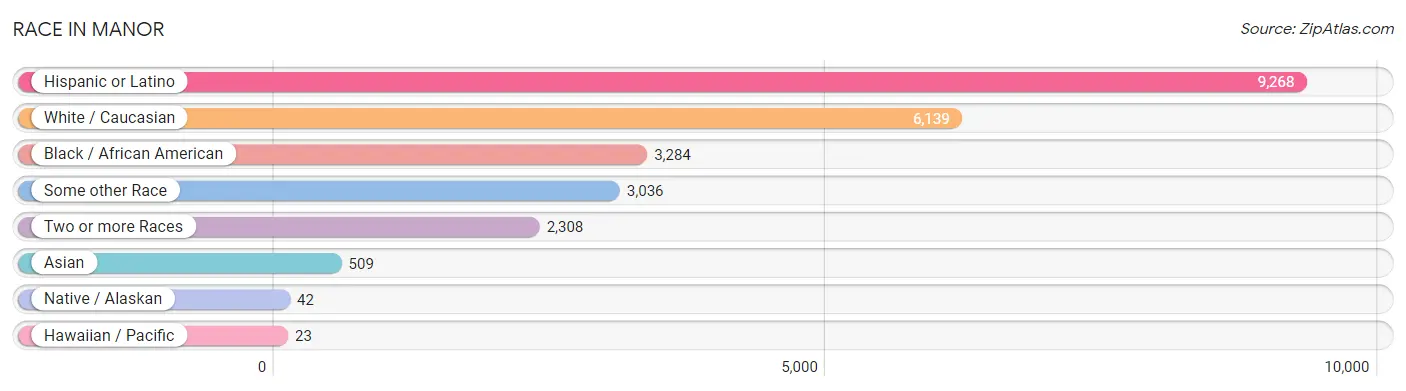
Race in Manor
The most populous races in Manor are Hispanic or Latino (9,268 | 60.4%), White / Caucasian (6,139 | 40.0%), and Black / African American (3,284 | 21.4%).
| Race | # Population | % Population |
| Asian | 509 | 3.3% |
| Black / African American | 3,284 | 21.4% |
| Hawaiian / Pacific | 23 | 0.2% |
| Hispanic or Latino | 9,268 | 60.4% |
| Native / Alaskan | 42 | 0.3% |
| White / Caucasian | 6,139 | 40.0% |
| Two or more Races | 2,308 | 15.0% |
| Some other Race | 3,036 | 19.8% |
| Total | 15,341 | 100.0% |
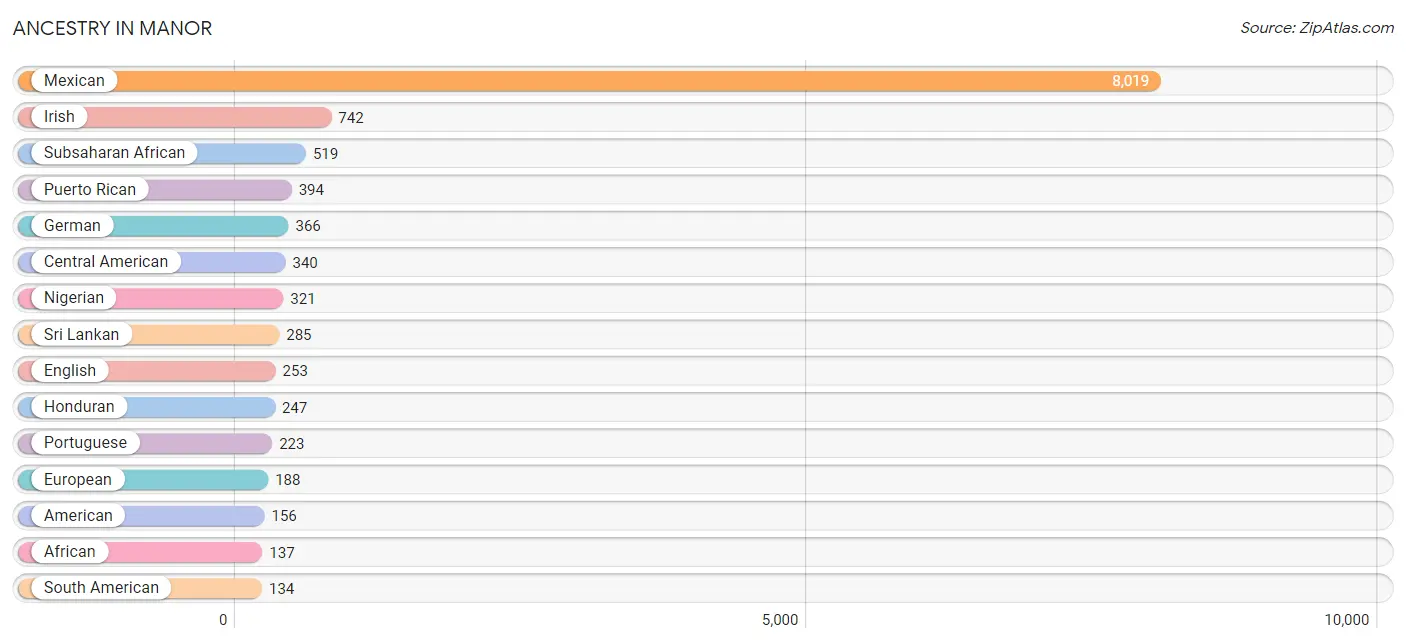
Ancestry in Manor
The most populous ancestries reported in Manor are Mexican (8,019 | 52.3%), Irish (742 | 4.8%), Subsaharan African (519 | 3.4%), Puerto Rican (394 | 2.6%), and German (366 | 2.4%), together accounting for 65.5% of all Manor residents.
| Ancestry | # Population | % Population |
| African | 137 | 0.9% |
| American | 156 | 1.0% |
| Arab | 75 | 0.5% |
| Basque | 6 | 0.0% |
| British | 45 | 0.3% |
| Central American | 340 | 2.2% |
| Czech | 27 | 0.2% |
| Delaware | 12 | 0.1% |
| Dutch | 98 | 0.6% |
| Eastern European | 6 | 0.0% |
| Ecuadorian | 18 | 0.1% |
| English | 253 | 1.7% |
| Ethiopian | 56 | 0.4% |
| European | 188 | 1.2% |
| Filipino | 42 | 0.3% |
| French | 53 | 0.4% |
| German | 366 | 2.4% |
| Honduran | 247 | 1.6% |
| Irish | 742 | 4.8% |
| Italian | 108 | 0.7% |
| Jamaican | 9 | 0.1% |
| Korean | 36 | 0.2% |
| Laotian | 21 | 0.1% |
| Mexican | 8,019 | 52.3% |
| Mexican American Indian | 42 | 0.3% |
| Native Hawaiian | 23 | 0.2% |
| Nigerian | 321 | 2.1% |
| Norwegian | 13 | 0.1% |
| Peruvian | 116 | 0.8% |
| Polish | 104 | 0.7% |
| Portuguese | 223 | 1.5% |
| Puerto Rican | 394 | 2.6% |
| Russian | 54 | 0.4% |
| Salvadoran | 93 | 0.6% |
| Scottish | 123 | 0.8% |
| Sierra Leonean | 5 | 0.0% |
| South American | 134 | 0.9% |
| Spanish | 15 | 0.1% |
| Sri Lankan | 285 | 1.9% |
| Subsaharan African | 519 | 3.4% |
| Swedish | 6 | 0.0% |
| Thai | 42 | 0.3% |
| Turkish | 7 | 0.1% |
| Ukrainian | 132 | 0.9% |
| Welsh | 22 | 0.1% | View All 45 Rows |
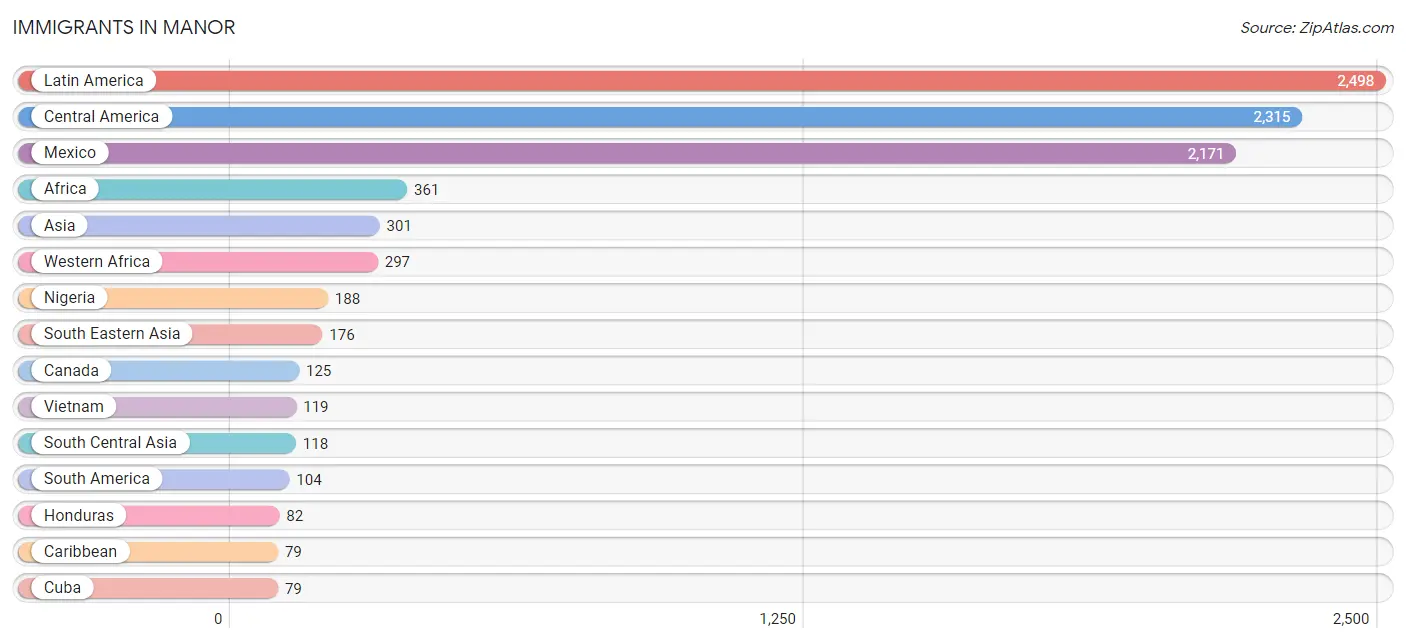
Immigrants in Manor
The most numerous immigrant groups reported in Manor came from Latin America (2,498 | 16.3%), Central America (2,315 | 15.1%), Mexico (2,171 | 14.1%), Africa (361 | 2.4%), and Asia (301 | 2.0%), together accounting for 49.8% of all Manor residents.
| Immigration Origin | # Population | % Population |
| Africa | 361 | 2.4% |
| Asia | 301 | 2.0% |
| Canada | 125 | 0.8% |
| Caribbean | 79 | 0.5% |
| Central America | 2,315 | 15.1% |
| Cuba | 79 | 0.5% |
| Eastern Africa | 20 | 0.1% |
| Eastern Europe | 9 | 0.1% |
| El Salvador | 62 | 0.4% |
| Ethiopia | 20 | 0.1% |
| Europe | 54 | 0.4% |
| Ghana | 63 | 0.4% |
| Guyana | 36 | 0.2% |
| Honduras | 82 | 0.5% |
| India | 19 | 0.1% |
| Indonesia | 21 | 0.1% |
| Latin America | 2,498 | 16.3% |
| Mexico | 2,171 | 14.1% |
| Morocco | 13 | 0.1% |
| Nepal | 59 | 0.4% |
| Nigeria | 188 | 1.2% |
| Northern Africa | 44 | 0.3% |
| Northern Europe | 33 | 0.2% |
| Pakistan | 29 | 0.2% |
| Peru | 68 | 0.4% |
| Philippines | 36 | 0.2% |
| Poland | 9 | 0.1% |
| Sierra Leone | 5 | 0.0% |
| South America | 104 | 0.7% |
| South Central Asia | 118 | 0.8% |
| South Eastern Asia | 176 | 1.1% |
| Southern Europe | 12 | 0.1% |
| Sri Lanka | 11 | 0.1% |
| Turkey | 7 | 0.1% |
| Vietnam | 119 | 0.8% |
| Western Africa | 297 | 1.9% |
| Western Asia | 7 | 0.1% | View All 37 Rows |
Sex and Age in Manor
Sex and Age in Manor
The most populous age groups in Manor are Under 5 Years (904 | 11.8%) for men and Under 5 Years (1,037 | 13.5%) for women.
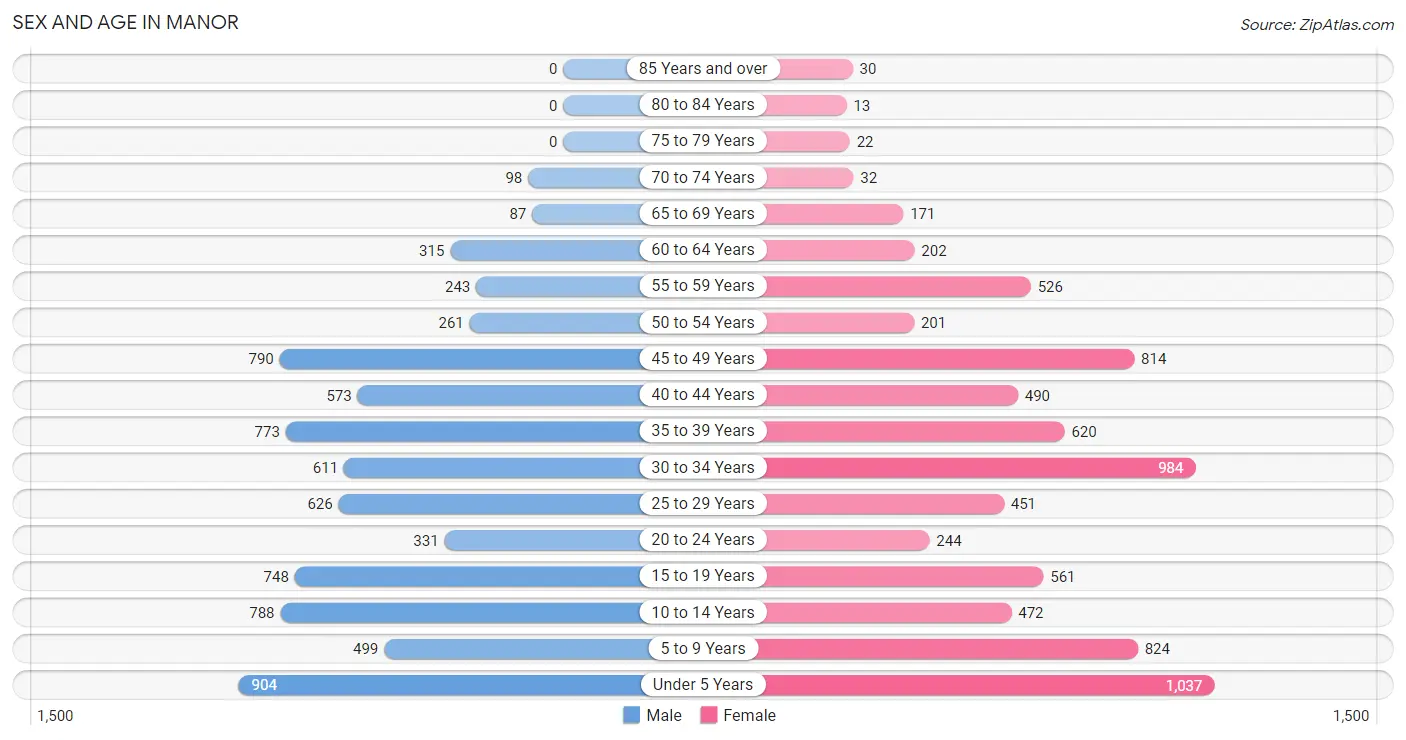
| Age Bracket | Male | Female |
| Under 5 Years | 904 (11.8%) | 1,037 (13.5%) |
| 5 to 9 Years | 499 (6.5%) | 824 (10.7%) |
| 10 to 14 Years | 788 (10.3%) | 472 (6.1%) |
| 15 to 19 Years | 748 (9.8%) | 561 (7.3%) |
| 20 to 24 Years | 331 (4.3%) | 244 (3.2%) |
| 25 to 29 Years | 626 (8.2%) | 451 (5.9%) |
| 30 to 34 Years | 611 (8.0%) | 984 (12.8%) |
| 35 to 39 Years | 773 (10.1%) | 620 (8.1%) |
| 40 to 44 Years | 573 (7.5%) | 490 (6.4%) |
| 45 to 49 Years | 790 (10.3%) | 814 (10.6%) |
| 50 to 54 Years | 261 (3.4%) | 201 (2.6%) |
| 55 to 59 Years | 243 (3.2%) | 526 (6.8%) |
| 60 to 64 Years | 315 (4.1%) | 202 (2.6%) |
| 65 to 69 Years | 87 (1.1%) | 171 (2.2%) |
| 70 to 74 Years | 98 (1.3%) | 32 (0.4%) |
| 75 to 79 Years | 0 (0.0%) | 22 (0.3%) |
| 80 to 84 Years | 0 (0.0%) | 13 (0.2%) |
| 85 Years and over | 0 (0.0%) | 30 (0.4%) |
| Total | 7,647 (100.0%) | 7,694 (100.0%) |
Families and Households in Manor
Median Family Size in Manor
The median family size in Manor is 3.73 persons per family, with married-couple families (2,867 | 77.3%) accounting for the largest median family size of 3.9 persons per family. On the other hand, single male/father families (222 | 6.0%) represent the smallest median family size with 2.80 persons per family.
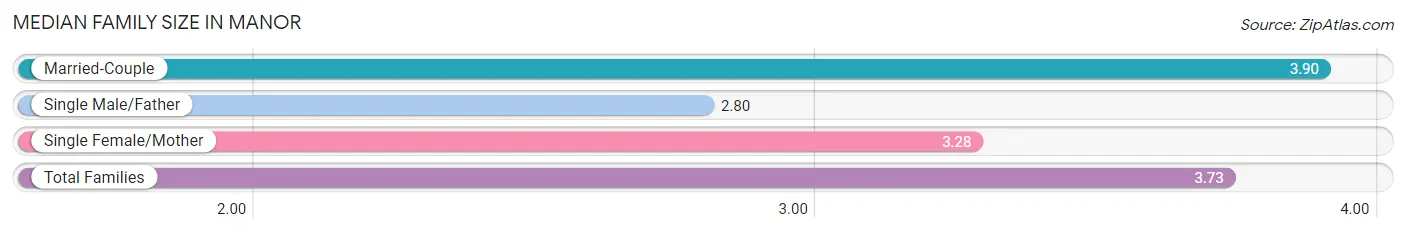
| Family Type | # Families | Family Size |
| Married-Couple | 2,867 (77.3%) | 3.90 |
| Single Male/Father | 222 (6.0%) | 2.80 |
| Single Female/Mother | 621 (16.7%) | 3.28 |
| Total Families | 3,710 (100.0%) | 3.73 |
Median Household Size in Manor
The median household size in Manor is 3.37 persons per household, with married-couple households (2,867 | 63.0%) accounting for the largest median household size of 3.94 persons per household. non-family households (841 | 18.5%) represent the smallest median household size with 1.30 persons per household.
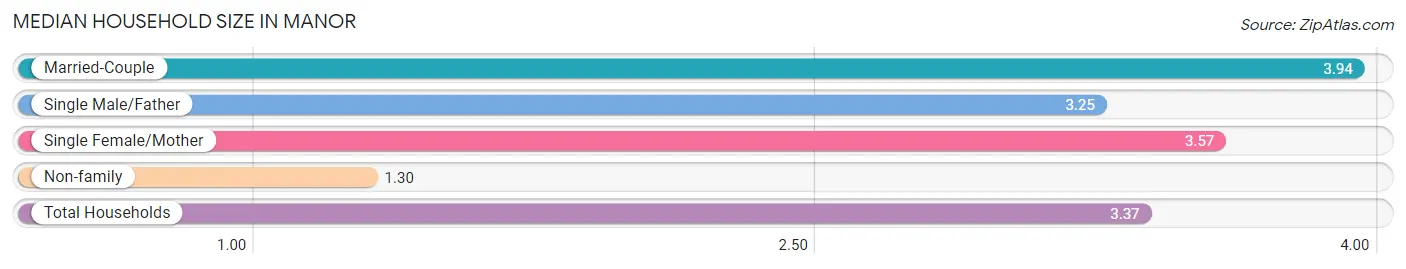
| Household Type | # Households | Household Size |
| Married-Couple | 2,867 (63.0%) | 3.94 |
| Single Male/Father | 222 (4.9%) | 3.25 |
| Single Female/Mother | 621 (13.7%) | 3.57 |
| Non-family | 841 (18.5%) | 1.30 |
| Total Households | 4,551 (100.0%) | 3.37 |
Household Size by Marriage Status in Manor
Out of a total of 4,551 households in Manor, 3,710 (81.5%) are family households, while 841 (18.5%) are nonfamily households. The most numerous type of family households are 3-person households, comprising 1,030, and the most common type of nonfamily households are 1-person households, comprising 620.
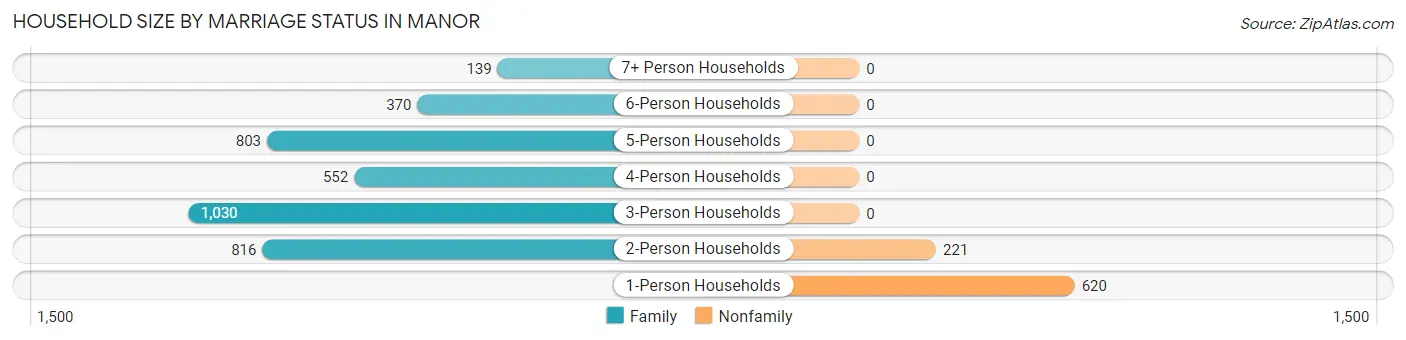
| Household Size | Family Households | Nonfamily Households |
| 1-Person Households | - | 620 (13.6%) |
| 2-Person Households | 816 (17.9%) | 221 (4.9%) |
| 3-Person Households | 1,030 (22.6%) | 0 (0.0%) |
| 4-Person Households | 552 (12.1%) | 0 (0.0%) |
| 5-Person Households | 803 (17.6%) | 0 (0.0%) |
| 6-Person Households | 370 (8.1%) | 0 (0.0%) |
| 7+ Person Households | 139 (3.0%) | 0 (0.0%) |
| Total | 3,710 (81.5%) | 841 (18.5%) |
Female Fertility in Manor
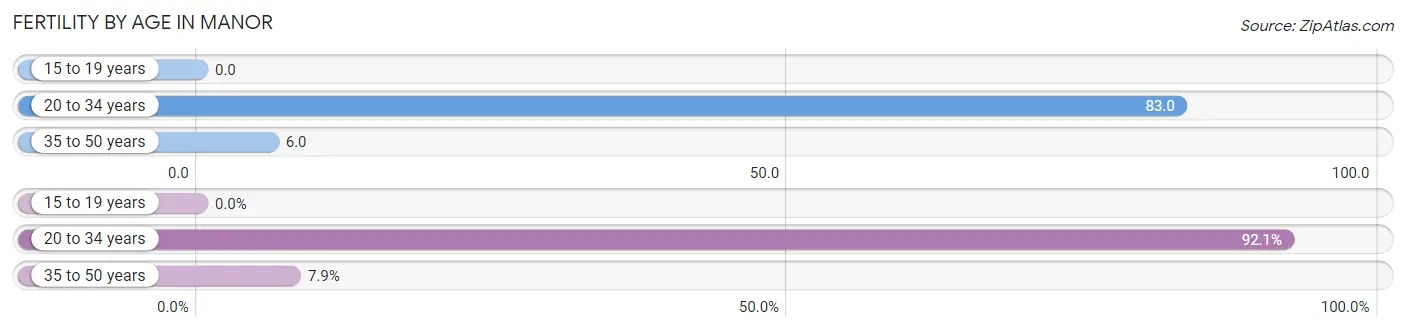
Fertility by Age in Manor
Average fertility rate in Manor is 36.0 births per 1,000 women. Women in the age bracket of 20 to 34 years have the highest fertility rate with 83.0 births per 1,000 women. Women in the age bracket of 20 to 34 years acount for 92.1% of all women with births.
| Age Bracket | Women with Births | Births / 1,000 Women |
| 15 to 19 years | 0 (0.0%) | 0.0 |
| 20 to 34 years | 140 (92.1%) | 83.0 |
| 35 to 50 years | 12 (7.9%) | 6.0 |
| Total | 152 (100.0%) | 36.0 |
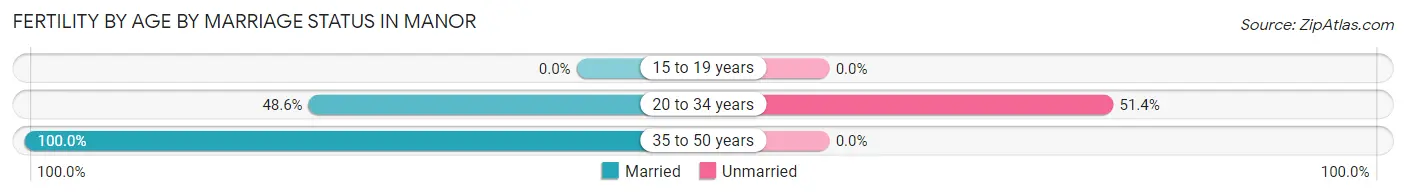
Fertility by Age by Marriage Status in Manor
52.6% of women with births (152) in Manor are married. The highest percentage of unmarried women with births falls into 20 to 34 years age bracket with 51.4% of them unmarried at the time of birth, while the lowest percentage of unmarried women with births belong to 35 to 50 years age bracket with 0.0% of them unmarried.
| Age Bracket | Married | Unmarried |
| 15 to 19 years | 0 (0.0%) | 0 (0.0%) |
| 20 to 34 years | 68 (48.6%) | 72 (51.4%) |
| 35 to 50 years | 12 (100.0%) | 0 (0.0%) |
| Total | 80 (52.6%) | 72 (47.4%) |
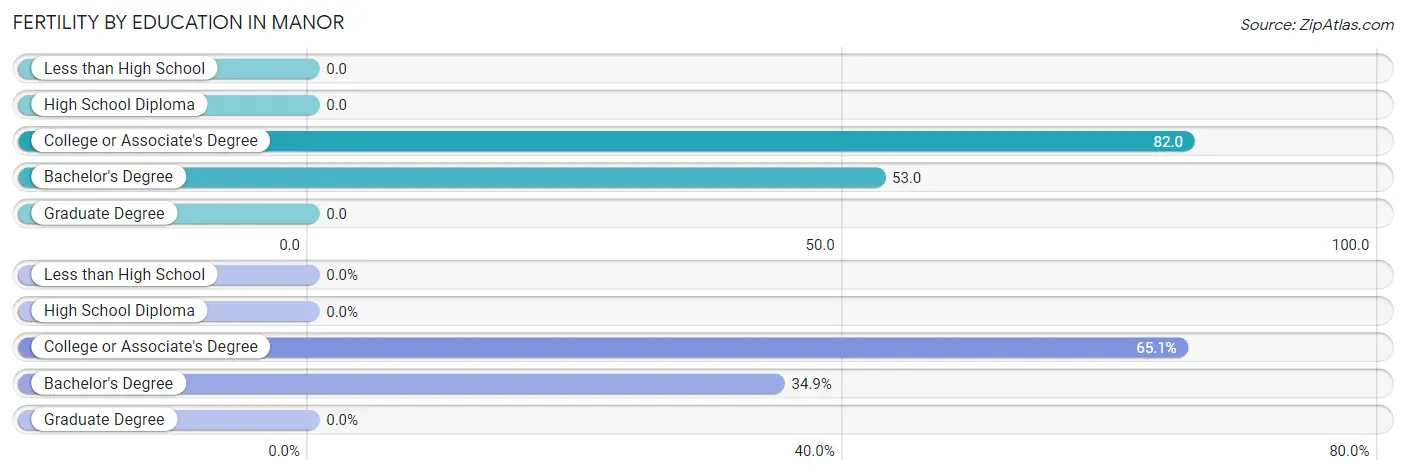
Fertility by Education in Manor
| Educational Attainment | Women with Births | Births / 1,000 Women |
| Less than High School | 0 (0.0%) | 0.0 |
| High School Diploma | 0 (0.0%) | 0.0 |
| College or Associate's Degree | 99 (65.1%) | 82.0 |
| Bachelor's Degree | 53 (34.9%) | 53.0 |
| Graduate Degree | 0 (0.0%) | 0.0 |
| Total | 152 (100.0%) | 36.0 |
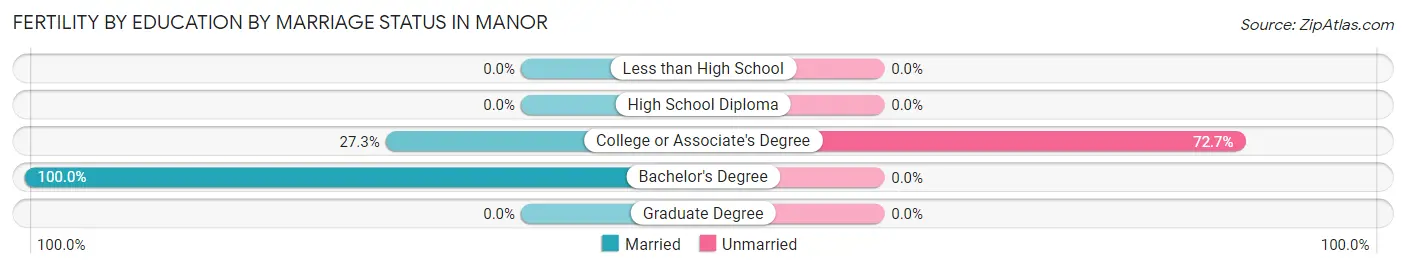
Fertility by Education by Marriage Status in Manor
47.4% of women with births in Manor are unmarried. Women with the educational attainment of bachelor's degree are most likely to be married with 100.0% of them married at childbirth, while women with the educational attainment of college or associate's degree are least likely to be married with 72.7% of them unmarried at childbirth.
| Educational Attainment | Married | Unmarried |
| Less than High School | 0 (0.0%) | 0 (0.0%) |
| High School Diploma | 0 (0.0%) | 0 (0.0%) |
| College or Associate's Degree | 27 (27.3%) | 72 (72.7%) |
| Bachelor's Degree | 53 (100.0%) | 0 (0.0%) |
| Graduate Degree | 0 (0.0%) | 0 (0.0%) |
| Total | 80 (52.6%) | 72 (47.4%) |
Income in Manor
Income Overview in Manor
Per Capita Income in Manor is $30,408, while median incomes of families and households are $100,878 and $96,657 respectively.
| Characteristic | Number | Measure |
| Per Capita Income | 15,341 | $30,408 |
| Median Family Income | 3,710 | $100,878 |
| Mean Family Income | 3,710 | $107,635 |
| Median Household Income | 4,551 | $96,657 |
| Mean Household Income | 4,551 | $101,938 |
| Income Deficit | 3,710 | $0 |
| Wage / Income Gap (%) | 15,341 | 36.97% |
| Wage / Income Gap ($) | 15,341 | 63.03¢ per $1 |
| Gini / Inequality Index | 15,341 | 0.28 |
Earnings by Sex in Manor
Average Earnings in Manor are $47,278, $57,858 for men and $36,469 for women, a difference of 37.0%.
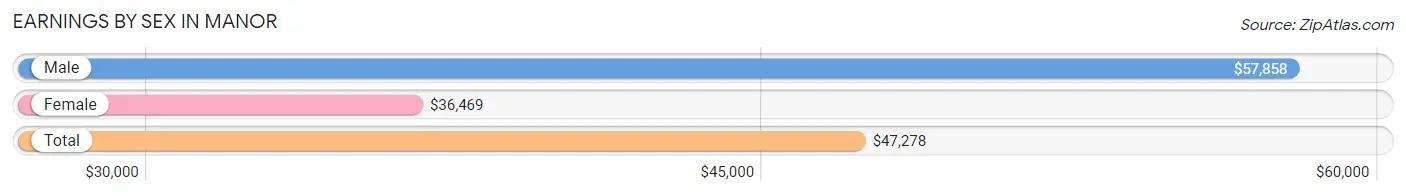
| Sex | Number | Average Earnings |
| Male | 4,423 (54.8%) | $57,858 |
| Female | 3,650 (45.2%) | $36,469 |
| Total | 8,073 (100.0%) | $47,278 |
Earnings by Sex by Income Bracket in Manor
The most common earnings brackets in Manor are $75,000 to $99,999 for men (1,018 | 23.0%) and $25,000 to $29,999 for women (453 | 12.4%).
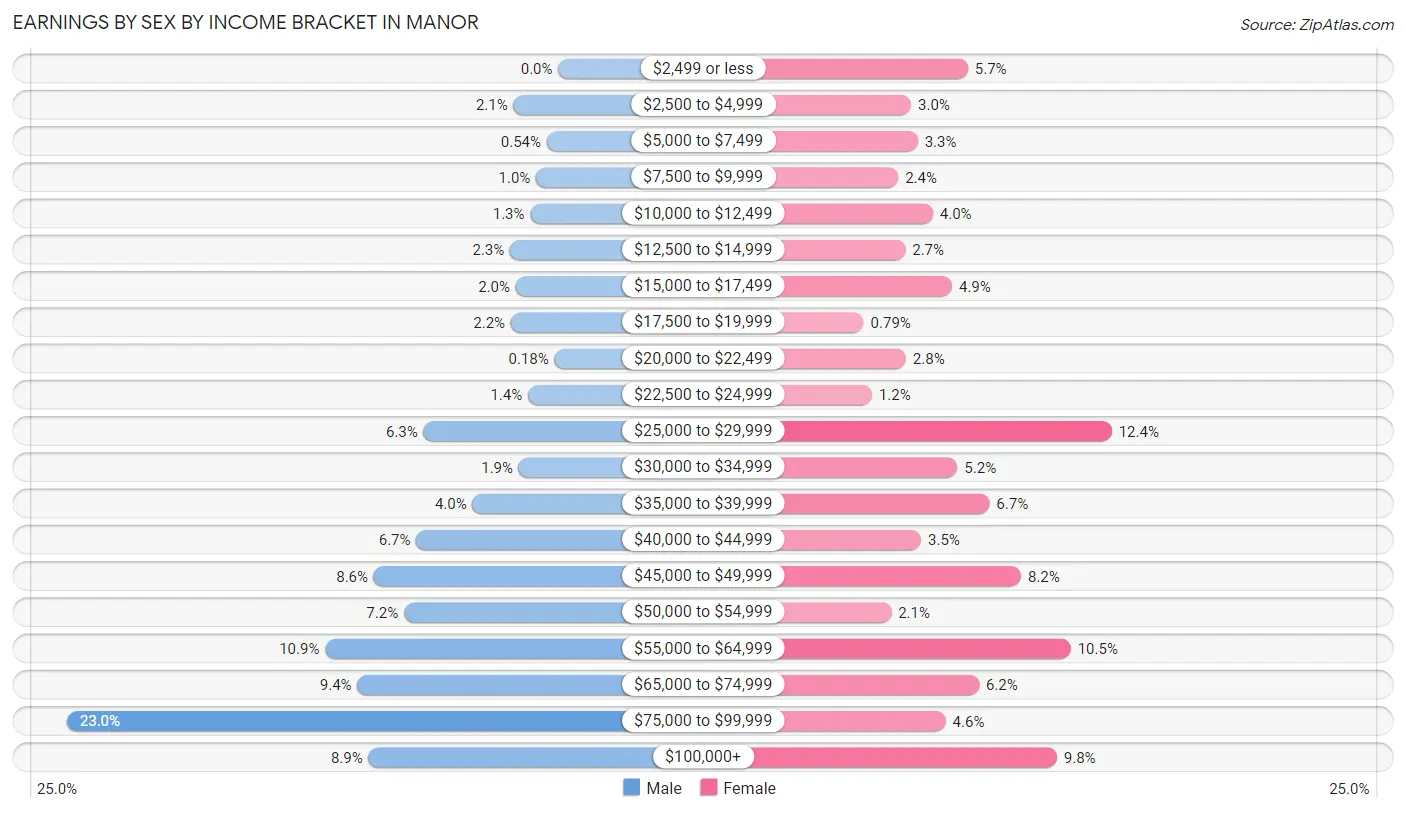
| Income | Male | Female |
| $2,499 or less | 0 (0.0%) | 207 (5.7%) |
| $2,500 to $4,999 | 93 (2.1%) | 110 (3.0%) |
| $5,000 to $7,499 | 24 (0.5%) | 121 (3.3%) |
| $7,500 to $9,999 | 46 (1.0%) | 88 (2.4%) |
| $10,000 to $12,499 | 58 (1.3%) | 147 (4.0%) |
| $12,500 to $14,999 | 100 (2.3%) | 100 (2.7%) |
| $15,000 to $17,499 | 88 (2.0%) | 180 (4.9%) |
| $17,500 to $19,999 | 98 (2.2%) | 29 (0.8%) |
| $20,000 to $22,499 | 8 (0.2%) | 101 (2.8%) |
| $22,500 to $24,999 | 63 (1.4%) | 43 (1.2%) |
| $25,000 to $29,999 | 279 (6.3%) | 453 (12.4%) |
| $30,000 to $34,999 | 82 (1.8%) | 189 (5.2%) |
| $35,000 to $39,999 | 178 (4.0%) | 244 (6.7%) |
| $40,000 to $44,999 | 294 (6.7%) | 127 (3.5%) |
| $45,000 to $49,999 | 382 (8.6%) | 298 (8.2%) |
| $50,000 to $54,999 | 320 (7.2%) | 76 (2.1%) |
| $55,000 to $64,999 | 483 (10.9%) | 383 (10.5%) |
| $65,000 to $74,999 | 416 (9.4%) | 226 (6.2%) |
| $75,000 to $99,999 | 1,018 (23.0%) | 169 (4.6%) |
| $100,000+ | 393 (8.9%) | 359 (9.8%) |
| Total | 4,423 (100.0%) | 3,650 (100.0%) |
Earnings by Sex by Educational Attainment in Manor
Average earnings in Manor are $60,246 for men and $39,736 for women, a difference of 34.0%. Men with an educational attainment of graduate degree enjoy the highest average annual earnings of $74,412, while those with high school diploma education earn the least with $53,696. Women with an educational attainment of graduate degree earn the most with the average annual earnings of $69,071, while those with less than high school education have the smallest earnings of $19,224.
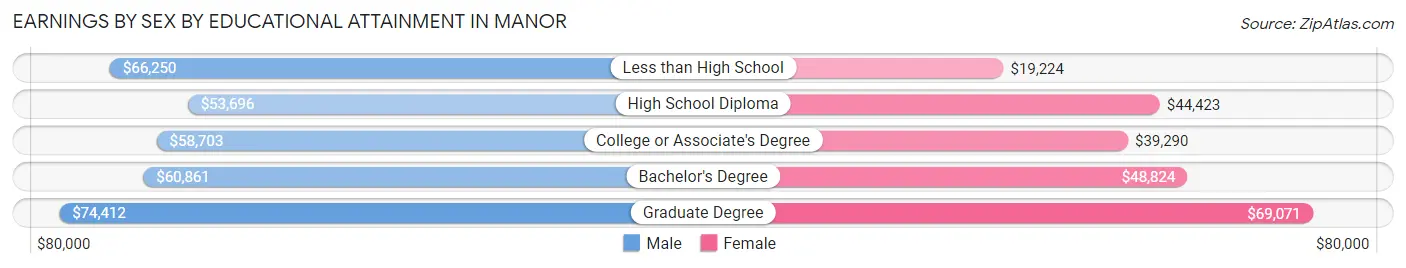
| Educational Attainment | Male Income | Female Income |
| Less than High School | $66,250 | $19,224 |
| High School Diploma | $53,696 | $44,423 |
| College or Associate's Degree | $58,703 | $39,290 |
| Bachelor's Degree | $60,861 | $48,824 |
| Graduate Degree | $74,412 | $69,071 |
| Total | $60,246 | $39,736 |
Family Income in Manor
Family Income Brackets in Manor
According to the Manor family income data, there are 1,261 families falling into the $100,000 to $149,999 income range, which is the most common income bracket and makes up 34.0% of all families.
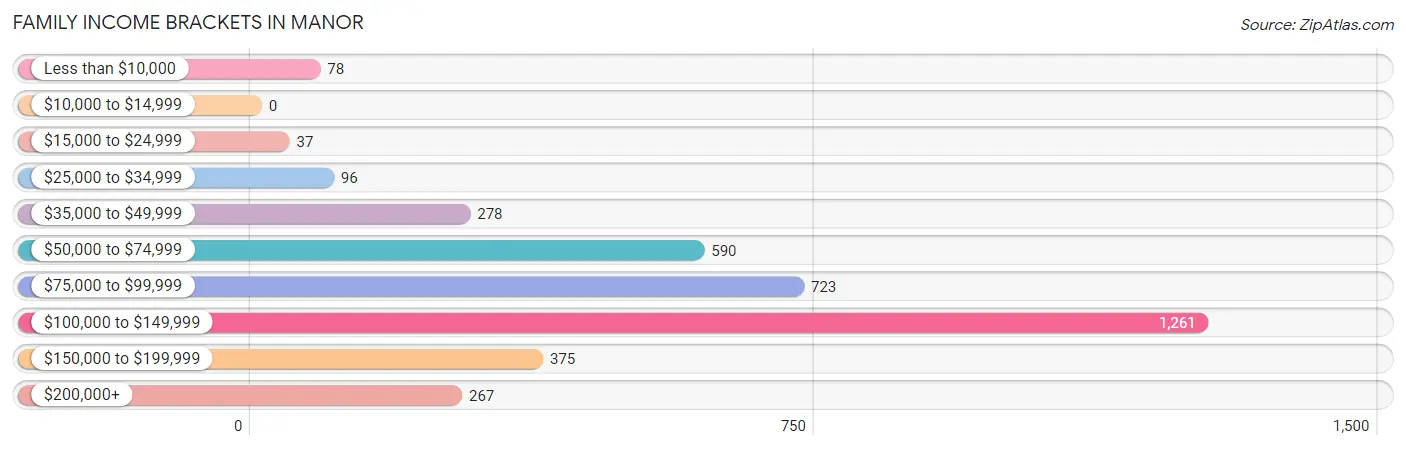
| Income Bracket | # Families | % Families |
| Less than $10,000 | 78 | 2.1% |
| $10,000 to $14,999 | 0 | 0.0% |
| $15,000 to $24,999 | 37 | 1.0% |
| $25,000 to $34,999 | 96 | 2.6% |
| $35,000 to $49,999 | 278 | 7.5% |
| $50,000 to $74,999 | 590 | 15.9% |
| $75,000 to $99,999 | 723 | 19.5% |
| $100,000 to $149,999 | 1,261 | 34.0% |
| $150,000 to $199,999 | 375 | 10.1% |
| $200,000+ | 267 | 7.2% |
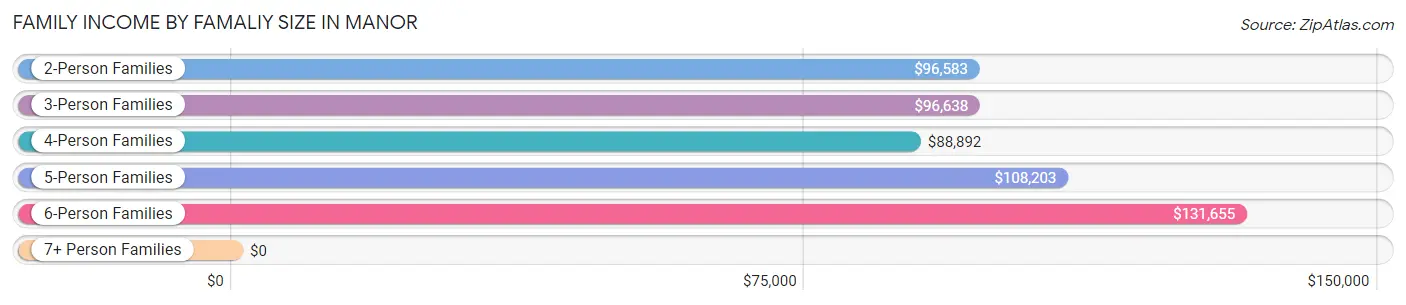
Family Income by Famaliy Size in Manor
6-person families (392 | 10.6%) account for the highest median family income in Manor with $131,655 per family, while 2-person families (918 | 24.7%) have the highest median income of $48,292 per family member.
| Income Bracket | # Families | Median Income |
| 2-Person Families | 918 (24.7%) | $96,583 |
| 3-Person Families | 966 (26.0%) | $96,638 |
| 4-Person Families | 659 (17.8%) | $88,892 |
| 5-Person Families | 658 (17.7%) | $108,203 |
| 6-Person Families | 392 (10.6%) | $131,655 |
| 7+ Person Families | 117 (3.2%) | $0 |
| Total | 3,710 (100.0%) | $100,878 |
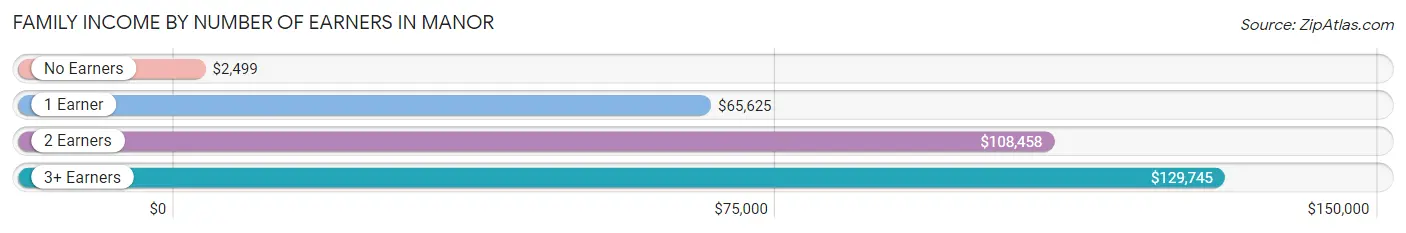
Family Income by Number of Earners in Manor
The median family income in Manor is $100,878, with families comprising 3+ earners (623) having the highest median family income of $129,745, while families with no earners (96) have the lowest median family income of $2,499, accounting for 16.8% and 2.6% of families, respectively.
| Number of Earners | # Families | Median Income |
| No Earners | 96 (2.6%) | $2,499 |
| 1 Earner | 1,075 (29.0%) | $65,625 |
| 2 Earners | 1,916 (51.6%) | $108,458 |
| 3+ Earners | 623 (16.8%) | $129,745 |
| Total | 3,710 (100.0%) | $100,878 |
Household Income in Manor
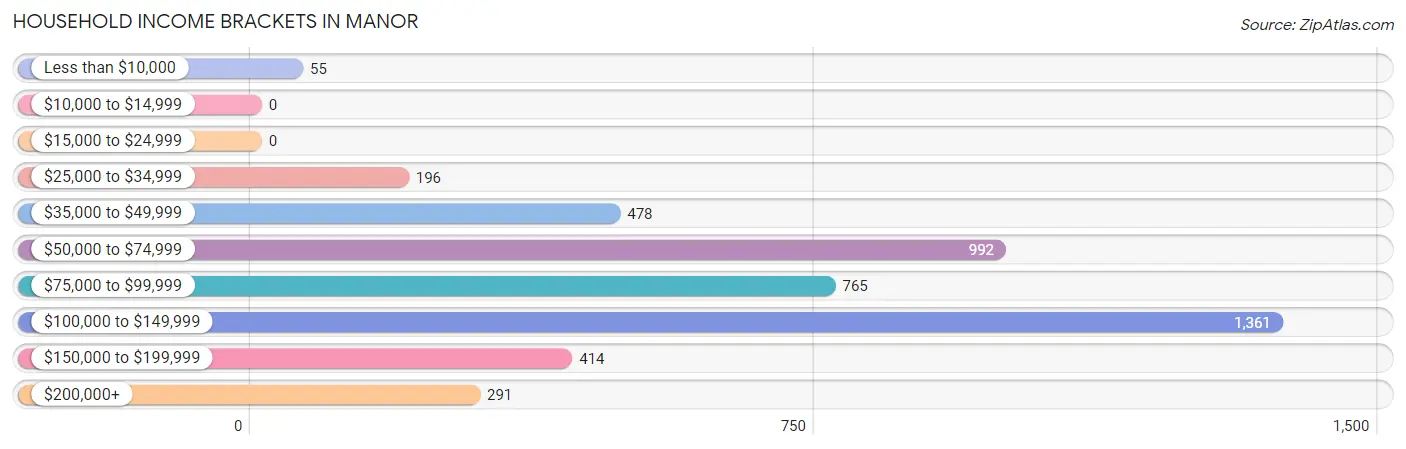
Household Income Brackets in Manor
With 1,361 households falling in the category, the $100,000 to $149,999 income range is the most frequent in Manor, accounting for 29.9% of all households.
| Income Bracket | # Households | % Households |
| Less than $10,000 | 55 | 1.2% |
| $10,000 to $14,999 | 0 | 0.0% |
| $15,000 to $24,999 | 0 | 0.0% |
| $25,000 to $34,999 | 196 | 4.3% |
| $35,000 to $49,999 | 478 | 10.5% |
| $50,000 to $74,999 | 992 | 21.8% |
| $75,000 to $99,999 | 765 | 16.8% |
| $100,000 to $149,999 | 1,361 | 29.9% |
| $150,000 to $199,999 | 414 | 9.1% |
| $200,000+ | 291 | 6.4% |
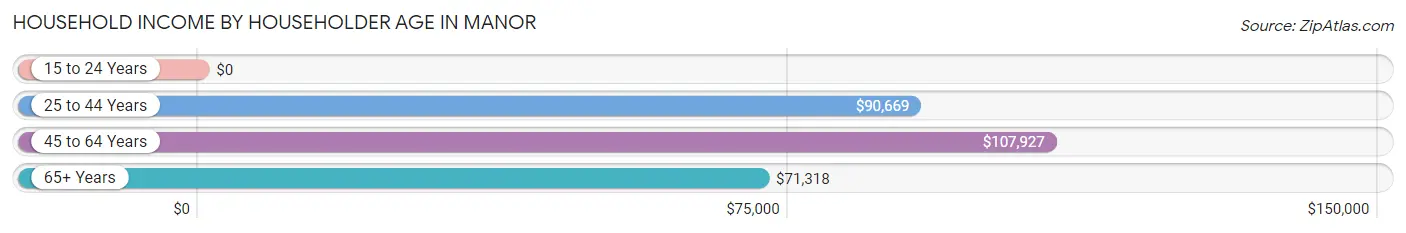
Household Income by Householder Age in Manor
The median household income in Manor is $96,657, with the highest median household income of $107,927 found in the 45 to 64 years age bracket for the primary householder. A total of 1,749 households (38.4%) fall into this category. Meanwhile, the 15 to 24 years age bracket for the primary householder has the lowest median household income of $0, with 53 households (1.2%) in this group.
| Income Bracket | # Households | Median Income |
| 15 to 24 Years | 53 (1.2%) | $0 |
| 25 to 44 Years | 2,608 (57.3%) | $90,669 |
| 45 to 64 Years | 1,749 (38.4%) | $107,927 |
| 65+ Years | 141 (3.1%) | $71,318 |
| Total | 4,551 (100.0%) | $96,657 |
Poverty in Manor
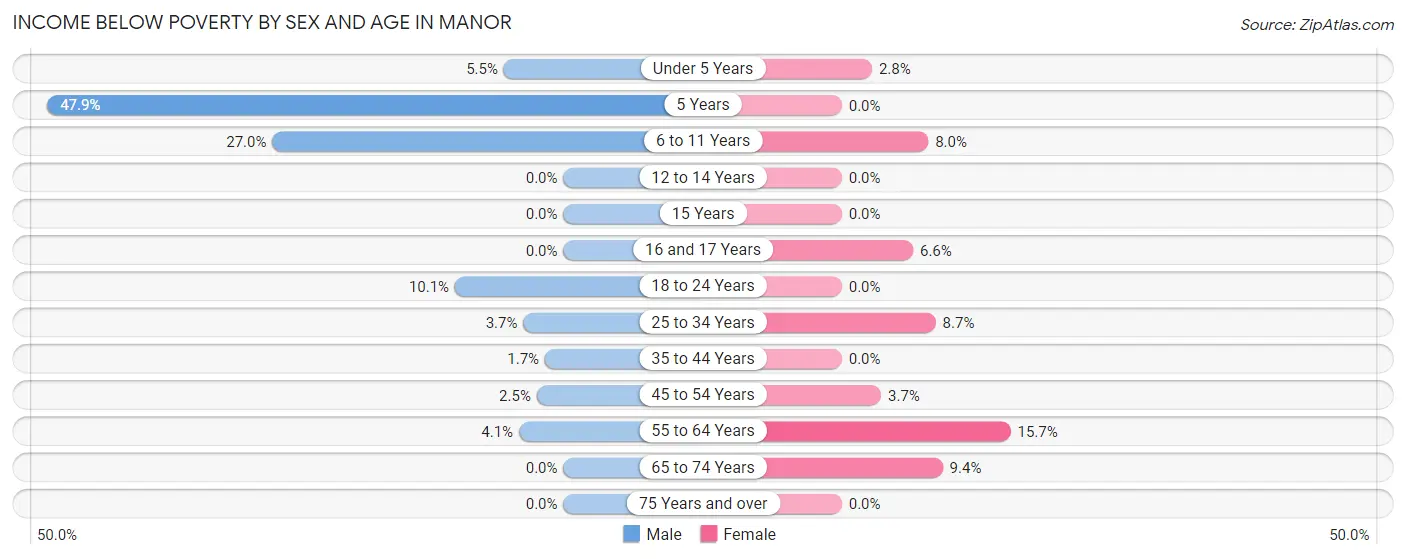
Income Below Poverty by Sex and Age in Manor
With 5.7% poverty level for males and 5.4% for females among the residents of Manor, 5 year old males and 55 to 64 year old females are the most vulnerable to poverty, with 57 males (47.9%) and 114 females (15.7%) in their respective age groups living below the poverty level.
| Age Bracket | Male | Female |
| Under 5 Years | 50 (5.5%) | 29 (2.8%) |
| 5 Years | 57 (47.9%) | 0 (0.0%) |
| 6 to 11 Years | 161 (27.0%) | 72 (8.0%) |
| 12 to 14 Years | 0 (0.0%) | 0 (0.0%) |
| 15 Years | 0 (0.0%) | 0 (0.0%) |
| 16 and 17 Years | 0 (0.0%) | 17 (6.6%) |
| 18 to 24 Years | 53 (10.1%) | 0 (0.0%) |
| 25 to 34 Years | 46 (3.7%) | 125 (8.7%) |
| 35 to 44 Years | 23 (1.7%) | 0 (0.0%) |
| 45 to 54 Years | 26 (2.5%) | 37 (3.6%) |
| 55 to 64 Years | 23 (4.1%) | 114 (15.7%) |
| 65 to 74 Years | 0 (0.0%) | 19 (9.4%) |
| 75 Years and over | 0 (0.0%) | 0 (0.0%) |
| Total | 439 (5.7%) | 413 (5.4%) |
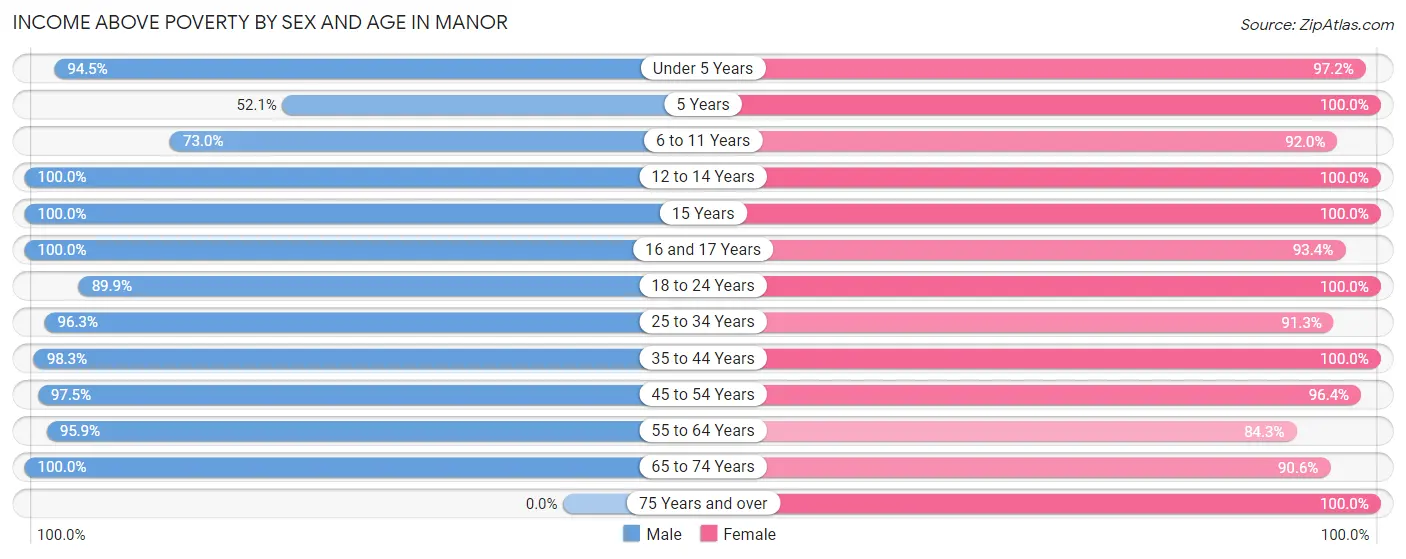
Income Above Poverty by Sex and Age in Manor
According to the poverty statistics in Manor, males aged 12 to 14 years and females aged 5 years are the age groups that are most secure financially, with 100.0% of males and 100.0% of females in these age groups living above the poverty line.
| Age Bracket | Male | Female |
| Under 5 Years | 854 (94.5%) | 1,008 (97.2%) |
| 5 Years | 62 (52.1%) | 80 (100.0%) |
| 6 to 11 Years | 435 (73.0%) | 826 (92.0%) |
| 12 to 14 Years | 572 (100.0%) | 243 (100.0%) |
| 15 Years | 29 (100.0%) | 253 (100.0%) |
| 16 and 17 Years | 523 (100.0%) | 240 (93.4%) |
| 18 to 24 Years | 474 (89.9%) | 295 (100.0%) |
| 25 to 34 Years | 1,191 (96.3%) | 1,310 (91.3%) |
| 35 to 44 Years | 1,323 (98.3%) | 1,110 (100.0%) |
| 45 to 54 Years | 1,025 (97.5%) | 978 (96.4%) |
| 55 to 64 Years | 535 (95.9%) | 614 (84.3%) |
| 65 to 74 Years | 185 (100.0%) | 184 (90.6%) |
| 75 Years and over | 0 (0.0%) | 65 (100.0%) |
| Total | 7,208 (94.3%) | 7,206 (94.6%) |
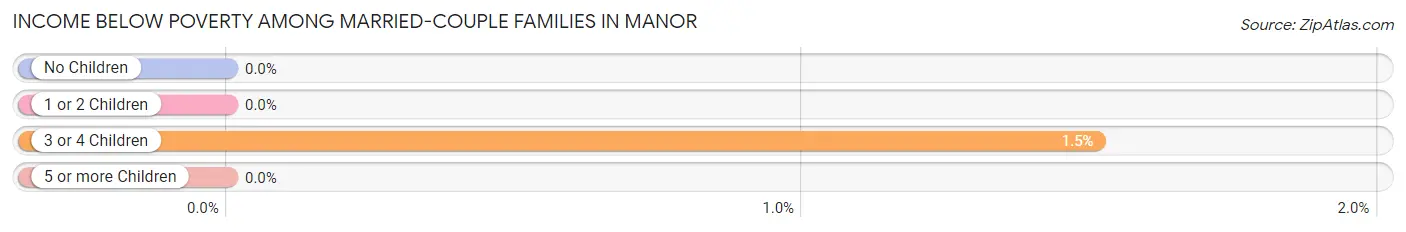
Income Below Poverty Among Married-Couple Families in Manor
The poverty statistics for married-couple families in Manor show that 0.4% or 12 of the total 2,867 families live below the poverty line. Families with 3 or 4 children have the highest poverty rate of 1.5%, comprising of 12 families. On the other hand, families with no children have the lowest poverty rate of 0.0%, which includes 0 families.
| Children | Above Poverty | Below Poverty |
| No Children | 1,143 (100.0%) | 0 (0.0%) |
| 1 or 2 Children | 871 (100.0%) | 0 (0.0%) |
| 3 or 4 Children | 785 (98.5%) | 12 (1.5%) |
| 5 or more Children | 56 (100.0%) | 0 (0.0%) |
| Total | 2,855 (99.6%) | 12 (0.4%) |
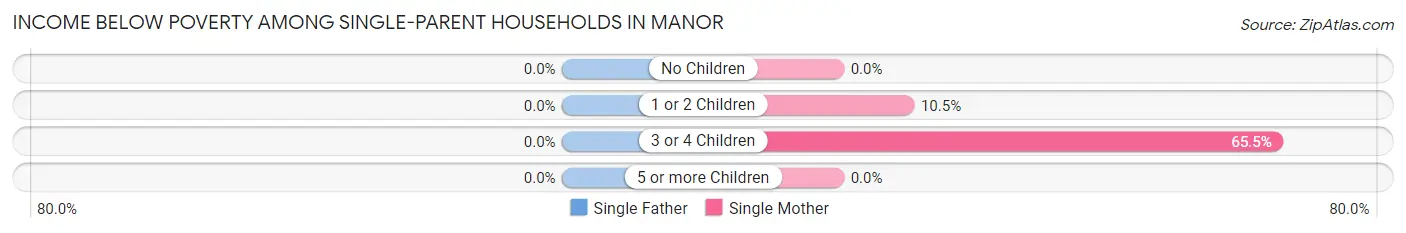
Income Below Poverty Among Single-Parent Households in Manor
| Children | Single Father | Single Mother |
| No Children | 0 (0.0%) | 0 (0.0%) |
| 1 or 2 Children | 0 (0.0%) | 37 (10.5%) |
| 3 or 4 Children | 0 (0.0%) | 97 (65.5%) |
| 5 or more Children | 0 (0.0%) | 0 (0.0%) |
| Total | 0 (0.0%) | 134 (21.6%) |
Income Below Poverty Among Married-Couple vs Single-Parent Households in Manor
The poverty data for Manor shows that 12 of the married-couple family households (0.4%) and 134 of the single-parent households (15.9%) are living below the poverty level. Within the married-couple family households, those with 3 or 4 children have the highest poverty rate, with 12 households (1.5%) falling below the poverty line. Among the single-parent households, those with 3 or 4 children have the highest poverty rate, with 97 household (65.5%) living below poverty.
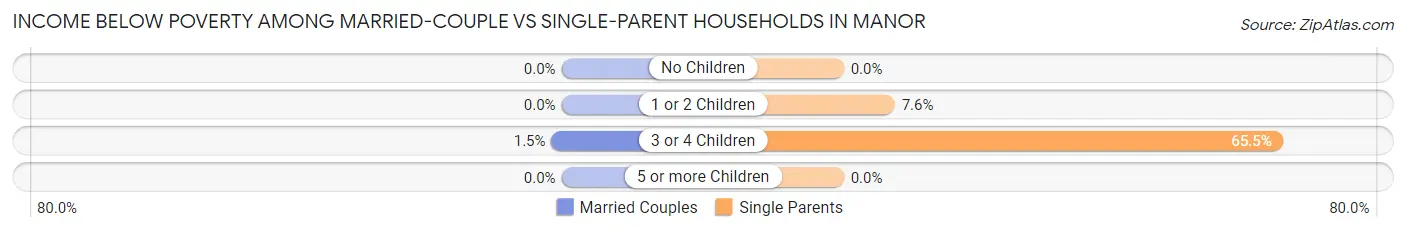
| Children | Married-Couple Families | Single-Parent Households |
| No Children | 0 (0.0%) | 0 (0.0%) |
| 1 or 2 Children | 0 (0.0%) | 37 (7.6%) |
| 3 or 4 Children | 12 (1.5%) | 97 (65.5%) |
| 5 or more Children | 0 (0.0%) | 0 (0.0%) |
| Total | 12 (0.4%) | 134 (15.9%) |
Employment Characteristics in Manor
Employment by Class of Employer in Manor
Among the 7,557 employed individuals in Manor, private company employees (4,817 | 63.7%), local government employees (1,232 | 16.3%), and self-employed (not incorporated) (577 | 7.6%) make up the most common classes of employment.
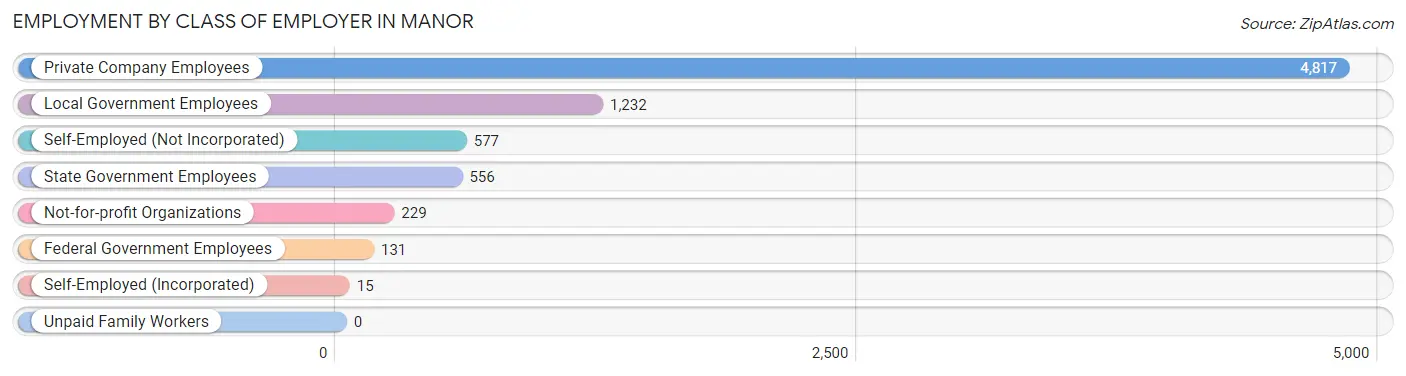
| Employer Class | # Employees | % Employees |
| Private Company Employees | 4,817 | 63.7% |
| Self-Employed (Incorporated) | 15 | 0.2% |
| Self-Employed (Not Incorporated) | 577 | 7.6% |
| Not-for-profit Organizations | 229 | 3.0% |
| Local Government Employees | 1,232 | 16.3% |
| State Government Employees | 556 | 7.4% |
| Federal Government Employees | 131 | 1.7% |
| Unpaid Family Workers | 0 | 0.0% |
| Total | 7,557 | 100.0% |
Employment Status by Age in Manor
According to the labor force statistics for Manor, out of the total population over 16 years of age (10,535), 76.0% or 8,007 individuals are in the labor force, with 4.5% or 360 of them unemployed. The age group with the highest labor force participation rate is 25 to 29 years, with 94.0% or 1,012 individuals in the labor force. Within the labor force, the 20 to 24 years age range has the highest percentage of unemployed individuals, with 36.9% or 171 of them being unemployed.
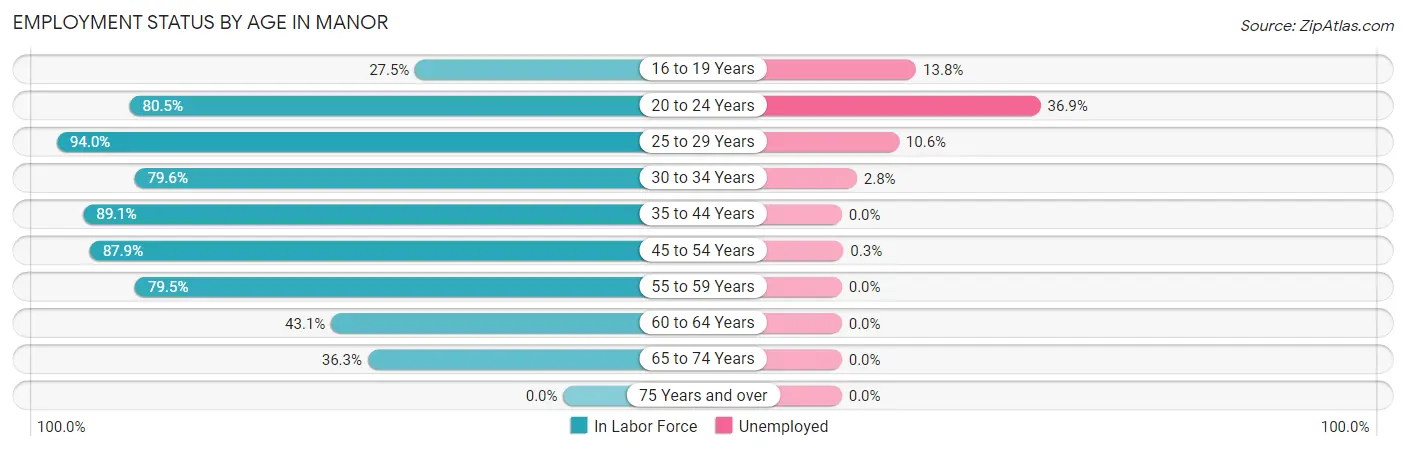
| Age Bracket | In Labor Force | Unemployed |
| 16 to 19 Years | 282 (27.5%) | 39 (13.8%) |
| 20 to 24 Years | 463 (80.5%) | 171 (36.9%) |
| 25 to 29 Years | 1,012 (94.0%) | 107 (10.6%) |
| 30 to 34 Years | 1,270 (79.6%) | 36 (2.8%) |
| 35 to 44 Years | 2,188 (89.1%) | 0 (0.0%) |
| 45 to 54 Years | 1,816 (87.9%) | 5 (0.3%) |
| 55 to 59 Years | 611 (79.5%) | 0 (0.0%) |
| 60 to 64 Years | 223 (43.1%) | 0 (0.0%) |
| 65 to 74 Years | 141 (36.3%) | 0 (0.0%) |
| 75 Years and over | 0 (0.0%) | 0 (0.0%) |
| Total | 8,007 (76.0%) | 360 (4.5%) |
Employment Status by Educational Attainment in Manor
According to labor force statistics for Manor, 84.0% of individuals (7,123) out of the total population between 25 and 64 years of age (8,480) are in the labor force, with 2.1% or 150 of them being unemployed. The group with the highest labor force participation rate are those with the educational attainment of bachelor's degree or higher, with 92.2% or 2,439 individuals in the labor force. Within the labor force, individuals with high school diploma education have the highest percentage of unemployment, with 5.0% or 82 of them being unemployed.
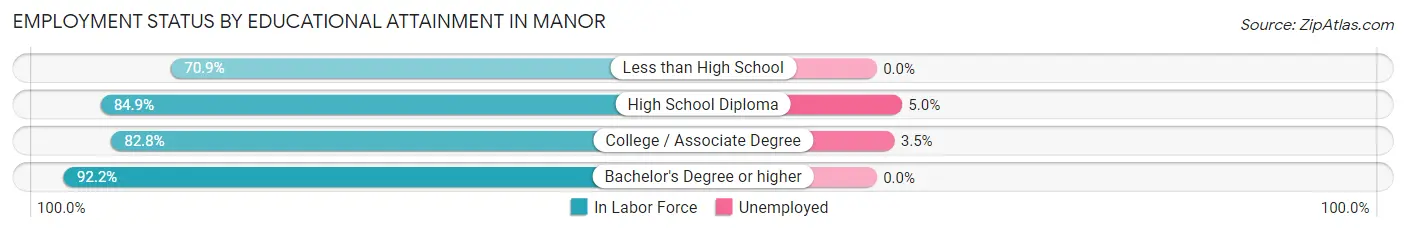
| Educational Attainment | In Labor Force | Unemployed |
| Less than High School | 1,149 (70.9%) | 0 (0.0%) |
| High School Diploma | 1,633 (84.9%) | 96 (5.0%) |
| College / Associate Degree | 1,897 (82.8%) | 80 (3.5%) |
| Bachelor's Degree or higher | 2,439 (92.2%) | 0 (0.0%) |
| Total | 7,123 (84.0%) | 178 (2.1%) |
Employment Occupations by Sex in Manor
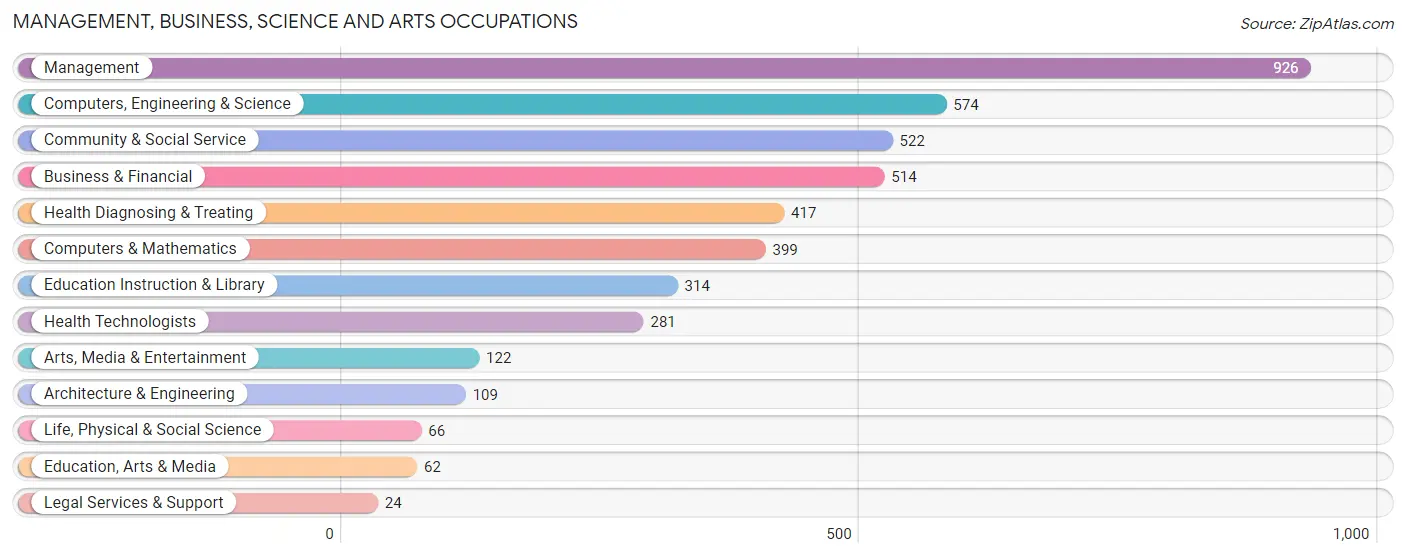
Management, Business, Science and Arts Occupations
The most common Management, Business, Science and Arts occupations in Manor are Management (926 | 12.1%), Computers, Engineering & Science (574 | 7.5%), Community & Social Service (522 | 6.8%), Business & Financial (514 | 6.7%), and Health Diagnosing & Treating (417 | 5.4%).
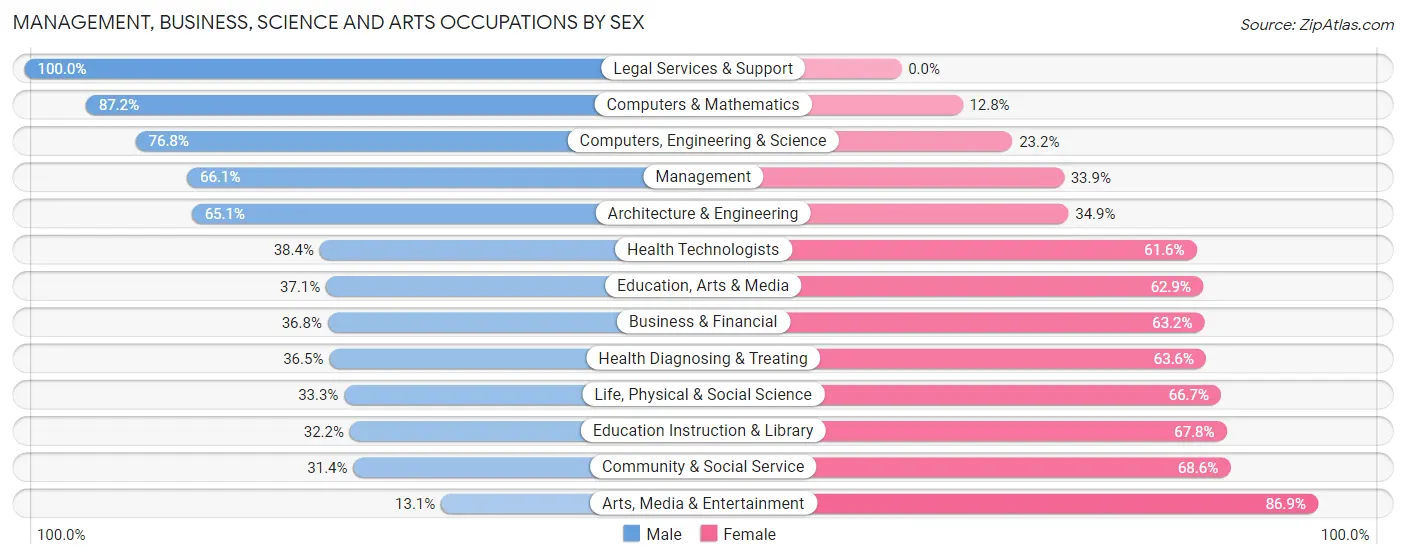
Management, Business, Science and Arts Occupations by Sex
Within the Management, Business, Science and Arts occupations in Manor, the most male-oriented occupations are Legal Services & Support (100.0%), Computers & Mathematics (87.2%), and Computers, Engineering & Science (76.8%), while the most female-oriented occupations are Arts, Media & Entertainment (86.9%), Community & Social Service (68.6%), and Education Instruction & Library (67.8%).
| Occupation | Male | Female |
| Management | 612 (66.1%) | 314 (33.9%) |
| Business & Financial | 189 (36.8%) | 325 (63.2%) |
| Computers, Engineering & Science | 441 (76.8%) | 133 (23.2%) |
| Computers & Mathematics | 348 (87.2%) | 51 (12.8%) |
| Architecture & Engineering | 71 (65.1%) | 38 (34.9%) |
| Life, Physical & Social Science | 22 (33.3%) | 44 (66.7%) |
| Community & Social Service | 164 (31.4%) | 358 (68.6%) |
| Education, Arts & Media | 23 (37.1%) | 39 (62.9%) |
| Legal Services & Support | 24 (100.0%) | 0 (0.0%) |
| Education Instruction & Library | 101 (32.2%) | 213 (67.8%) |
| Arts, Media & Entertainment | 16 (13.1%) | 106 (86.9%) |
| Health Diagnosing & Treating | 152 (36.4%) | 265 (63.5%) |
| Health Technologists | 108 (38.4%) | 173 (61.6%) |
| Total (Category) | 1,558 (52.8%) | 1,395 (47.2%) |
| Total (Overall) | 4,311 (56.4%) | 3,336 (43.6%) |
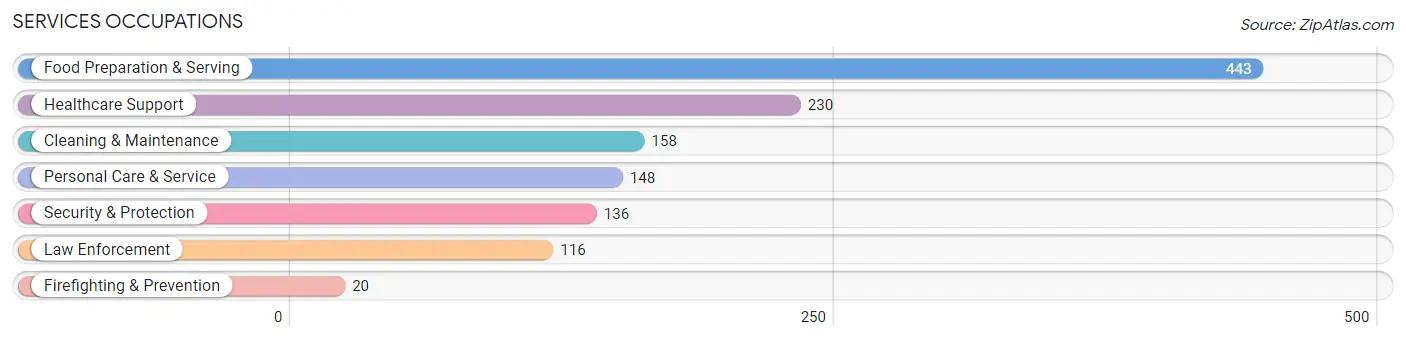
Services Occupations
The most common Services occupations in Manor are Food Preparation & Serving (443 | 5.8%), Healthcare Support (230 | 3.0%), Cleaning & Maintenance (158 | 2.1%), Personal Care & Service (148 | 1.9%), and Security & Protection (136 | 1.8%).
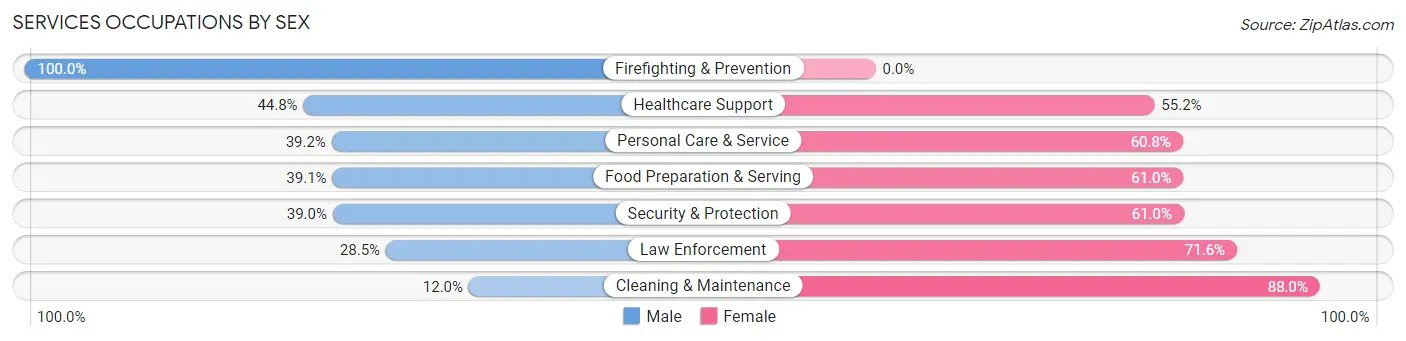
Services Occupations by Sex
Within the Services occupations in Manor, the most male-oriented occupations are Firefighting & Prevention (100.0%), Healthcare Support (44.8%), and Personal Care & Service (39.2%), while the most female-oriented occupations are Cleaning & Maintenance (88.0%), Law Enforcement (71.6%), and Security & Protection (61.0%).
| Occupation | Male | Female |
| Healthcare Support | 103 (44.8%) | 127 (55.2%) |
| Security & Protection | 53 (39.0%) | 83 (61.0%) |
| Firefighting & Prevention | 20 (100.0%) | 0 (0.0%) |
| Law Enforcement | 33 (28.4%) | 83 (71.6%) |
| Food Preparation & Serving | 173 (39.1%) | 270 (61.0%) |
| Cleaning & Maintenance | 19 (12.0%) | 139 (88.0%) |
| Personal Care & Service | 58 (39.2%) | 90 (60.8%) |
| Total (Category) | 406 (36.4%) | 709 (63.6%) |
| Total (Overall) | 4,311 (56.4%) | 3,336 (43.6%) |
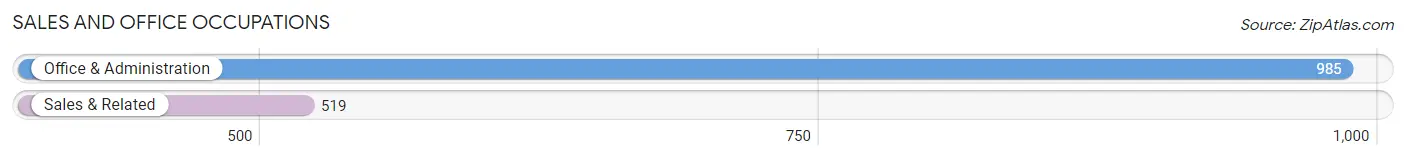
Sales and Office Occupations
The most common Sales and Office occupations in Manor are Office & Administration (985 | 12.9%), and Sales & Related (519 | 6.8%).
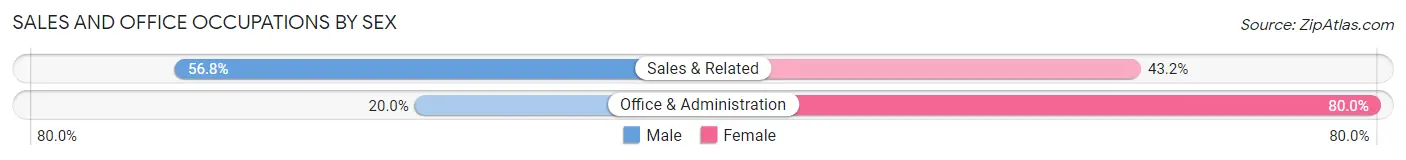
Sales and Office Occupations by Sex
| Occupation | Male | Female |
| Sales & Related | 295 (56.8%) | 224 (43.2%) |
| Office & Administration | 197 (20.0%) | 788 (80.0%) |
| Total (Category) | 492 (32.7%) | 1,012 (67.3%) |
| Total (Overall) | 4,311 (56.4%) | 3,336 (43.6%) |
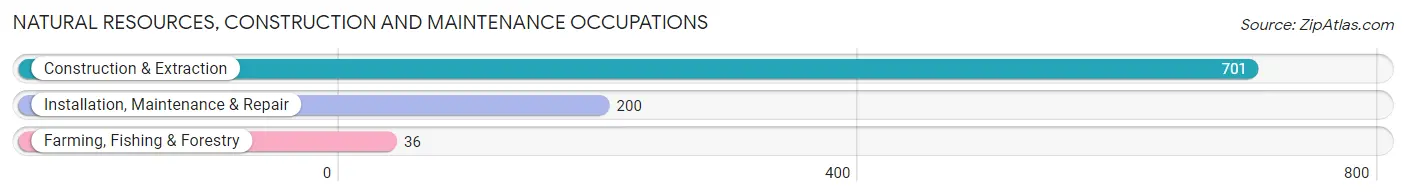
Natural Resources, Construction and Maintenance Occupations
The most common Natural Resources, Construction and Maintenance occupations in Manor are Construction & Extraction (701 | 9.2%), Installation, Maintenance & Repair (200 | 2.6%), and Farming, Fishing & Forestry (36 | 0.5%).
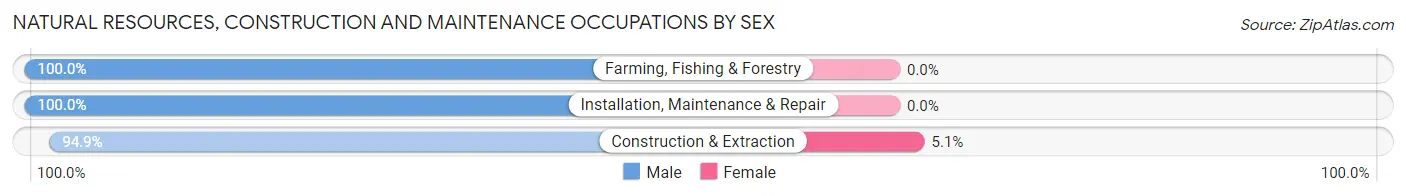
Natural Resources, Construction and Maintenance Occupations by Sex
| Occupation | Male | Female |
| Farming, Fishing & Forestry | 36 (100.0%) | 0 (0.0%) |
| Construction & Extraction | 665 (94.9%) | 36 (5.1%) |
| Installation, Maintenance & Repair | 200 (100.0%) | 0 (0.0%) |
| Total (Category) | 901 (96.2%) | 36 (3.8%) |
| Total (Overall) | 4,311 (56.4%) | 3,336 (43.6%) |
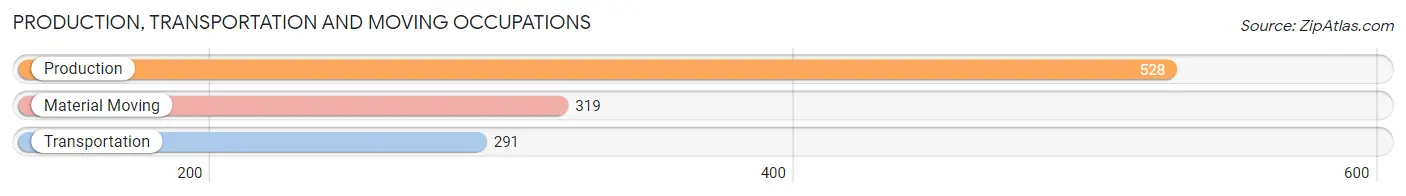
Production, Transportation and Moving Occupations
The most common Production, Transportation and Moving occupations in Manor are Production (528 | 6.9%), Material Moving (319 | 4.2%), and Transportation (291 | 3.8%).
Production, Transportation and Moving Occupations by Sex
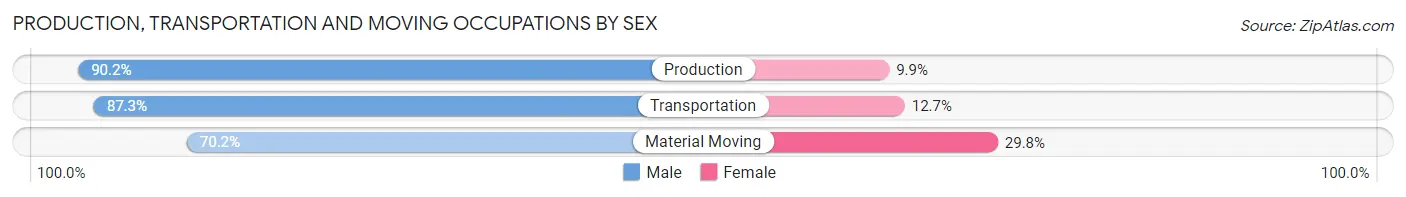
| Occupation | Male | Female |
| Production | 476 (90.1%) | 52 (9.9%) |
| Transportation | 254 (87.3%) | 37 (12.7%) |
| Material Moving | 224 (70.2%) | 95 (29.8%) |
| Total (Category) | 954 (83.8%) | 184 (16.2%) |
| Total (Overall) | 4,311 (56.4%) | 3,336 (43.6%) |
Employment Industries by Sex in Manor
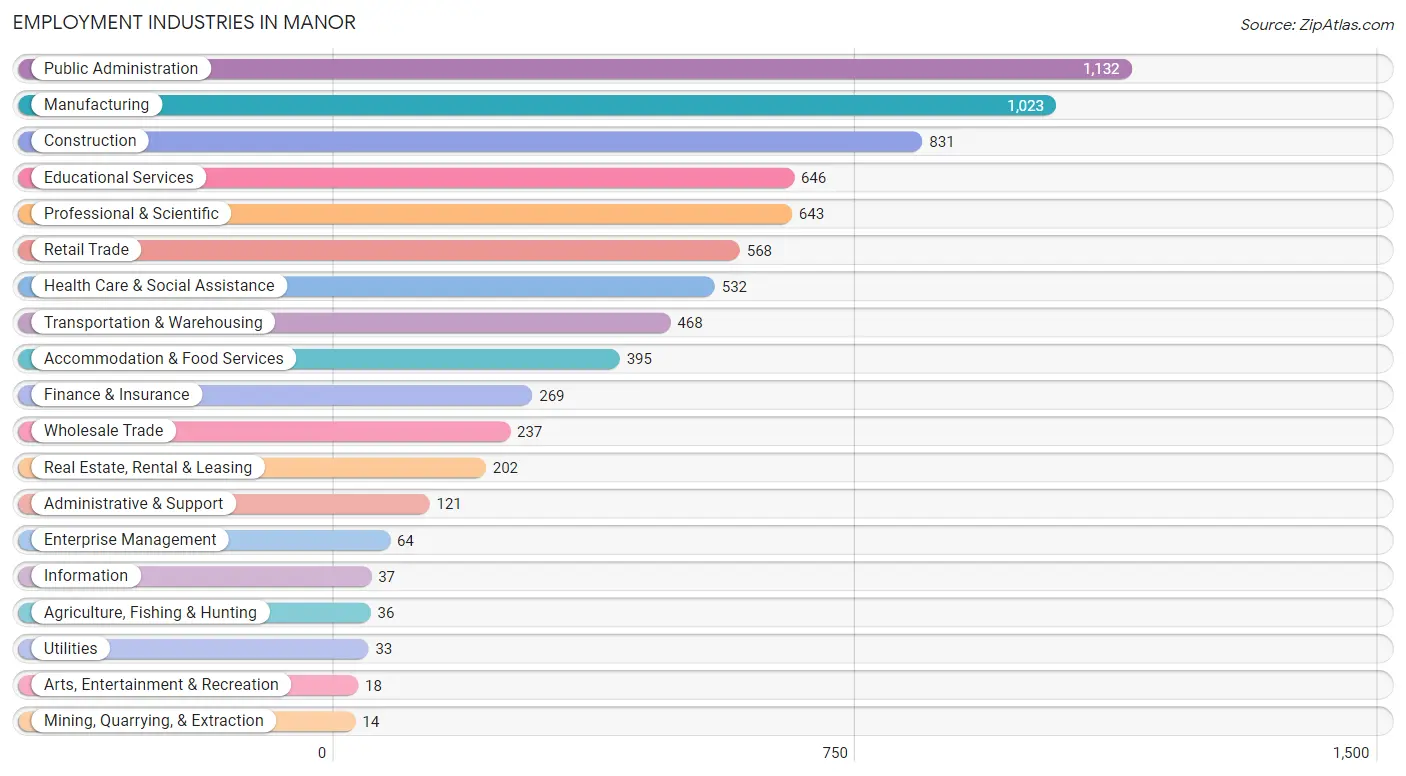
Employment Industries in Manor
The major employment industries in Manor include Public Administration (1,132 | 14.8%), Manufacturing (1,023 | 13.4%), Construction (831 | 10.9%), Educational Services (646 | 8.5%), and Professional & Scientific (643 | 8.4%).
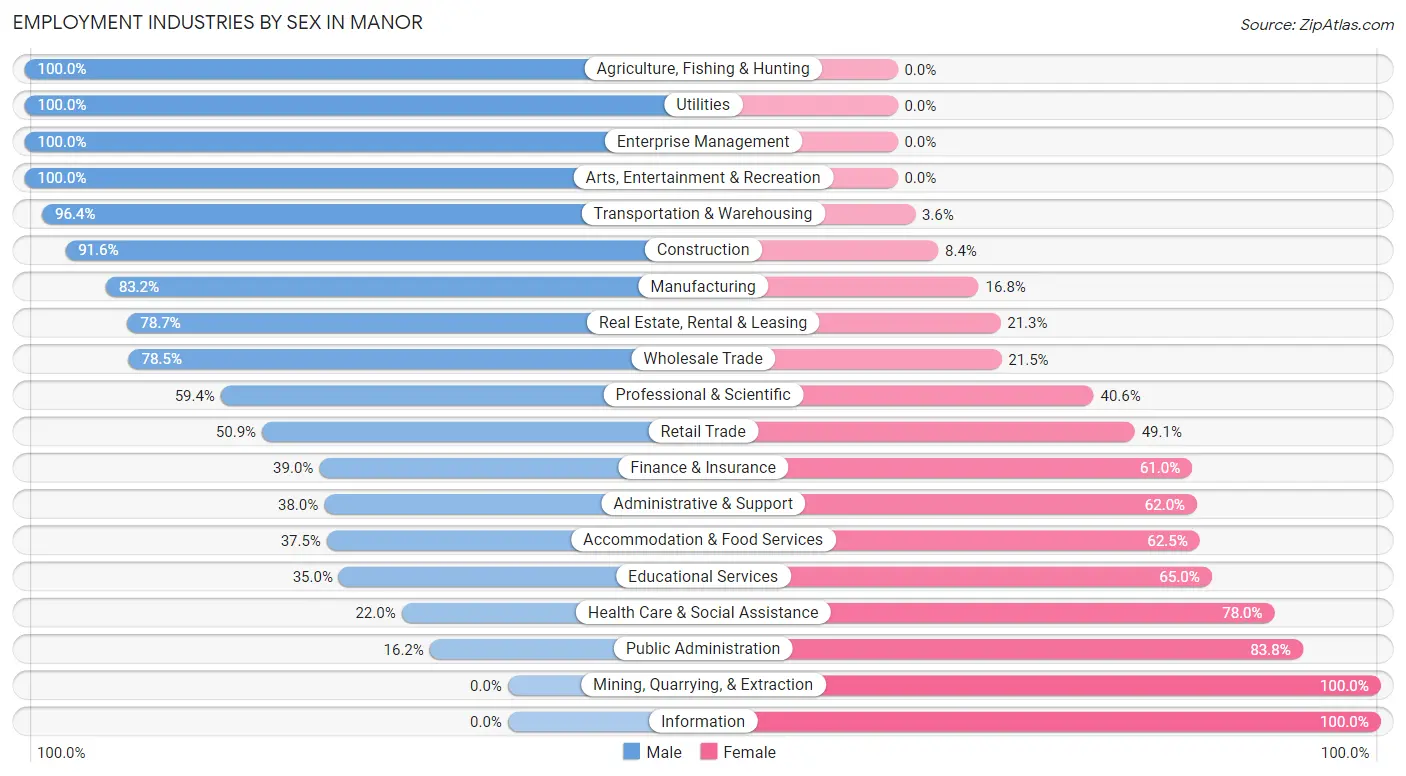
Employment Industries by Sex in Manor
The Manor industries that see more men than women are Agriculture, Fishing & Hunting (100.0%), Utilities (100.0%), and Enterprise Management (100.0%), whereas the industries that tend to have a higher number of women are Mining, Quarrying, & Extraction (100.0%), Information (100.0%), and Public Administration (83.8%).
| Industry | Male | Female |
| Agriculture, Fishing & Hunting | 36 (100.0%) | 0 (0.0%) |
| Mining, Quarrying, & Extraction | 0 (0.0%) | 14 (100.0%) |
| Construction | 761 (91.6%) | 70 (8.4%) |
| Manufacturing | 851 (83.2%) | 172 (16.8%) |
| Wholesale Trade | 186 (78.5%) | 51 (21.5%) |
| Retail Trade | 289 (50.9%) | 279 (49.1%) |
| Transportation & Warehousing | 451 (96.4%) | 17 (3.6%) |
| Utilities | 33 (100.0%) | 0 (0.0%) |
| Information | 0 (0.0%) | 37 (100.0%) |
| Finance & Insurance | 105 (39.0%) | 164 (61.0%) |
| Real Estate, Rental & Leasing | 159 (78.7%) | 43 (21.3%) |
| Professional & Scientific | 382 (59.4%) | 261 (40.6%) |
| Enterprise Management | 64 (100.0%) | 0 (0.0%) |
| Administrative & Support | 46 (38.0%) | 75 (62.0%) |
| Educational Services | 226 (35.0%) | 420 (65.0%) |
| Health Care & Social Assistance | 117 (22.0%) | 415 (78.0%) |
| Arts, Entertainment & Recreation | 18 (100.0%) | 0 (0.0%) |
| Accommodation & Food Services | 148 (37.5%) | 247 (62.5%) |
| Public Administration | 183 (16.2%) | 949 (83.8%) |
| Total | 4,311 (56.4%) | 3,336 (43.6%) |
Education in Manor
School Enrollment in Manor
The most common levels of schooling among the 4,644 students in Manor are high school (1,198 | 25.8%), middle school (1,003 | 21.6%), and elementary school (835 | 18.0%).
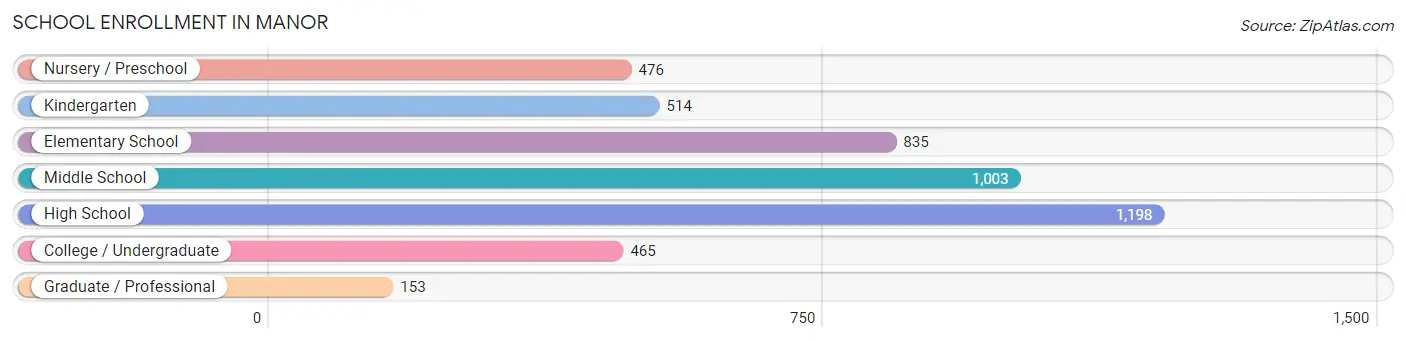
| School Level | # Students | % Students |
| Nursery / Preschool | 476 | 10.2% |
| Kindergarten | 514 | 11.1% |
| Elementary School | 835 | 18.0% |
| Middle School | 1,003 | 21.6% |
| High School | 1,198 | 25.8% |
| College / Undergraduate | 465 | 10.0% |
| Graduate / Professional | 153 | 3.3% |
| Total | 4,644 | 100.0% |
School Enrollment by Age by Funding Source in Manor
Out of a total of 4,644 students who are enrolled in schools in Manor, 348 (7.5%) attend a private institution, while the remaining 4,296 (92.5%) are enrolled in public schools. The age group of 25 to 34 year olds has the highest likelihood of being enrolled in private schools, with 79 (44.6% in the age bracket) enrolled. Conversely, the age group of 18 to 19 year olds has the lowest likelihood of being enrolled in a private school, with 148 (100.0% in the age bracket) attending a public institution.
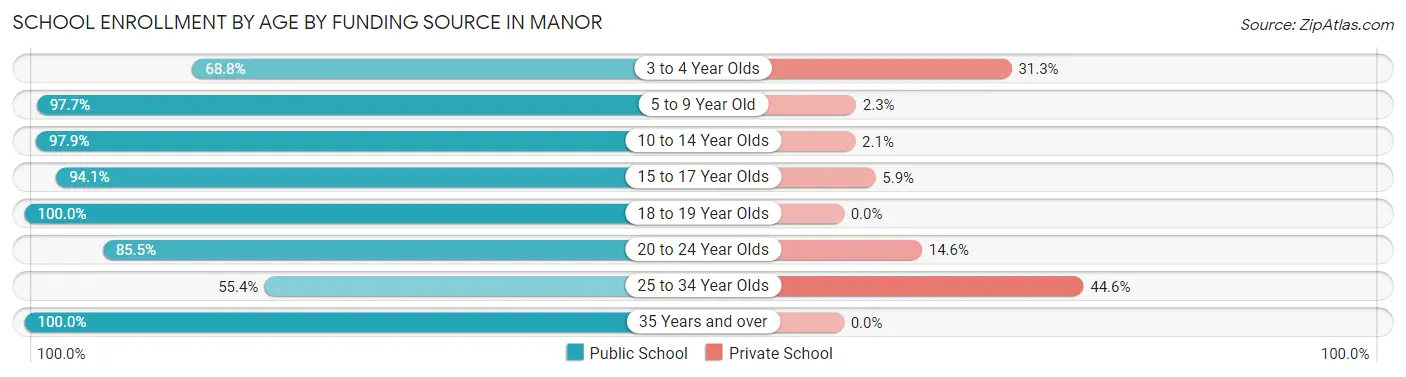
| Age Bracket | Public School | Private School |
| 3 to 4 Year Olds | 264 (68.8%) | 120 (31.2%) |
| 5 to 9 Year Old | 1,293 (97.7%) | 30 (2.3%) |
| 10 to 14 Year Olds | 1,233 (97.9%) | 27 (2.1%) |
| 15 to 17 Year Olds | 973 (94.1%) | 61 (5.9%) |
| 18 to 19 Year Olds | 148 (100.0%) | 0 (0.0%) |
| 20 to 24 Year Olds | 188 (85.5%) | 32 (14.5%) |
| 25 to 34 Year Olds | 98 (55.4%) | 79 (44.6%) |
| 35 Years and over | 98 (100.0%) | 0 (0.0%) |
| Total | 4,296 (92.5%) | 348 (7.5%) |
Educational Attainment by Field of Study in Manor
Business (563 | 17.4%), science & technology (411 | 12.7%), arts & humanities (389 | 12.0%), education (350 | 10.8%), and engineering (298 | 9.2%) are the most common fields of study among 3,233 individuals in Manor who have obtained a bachelor's degree or higher.
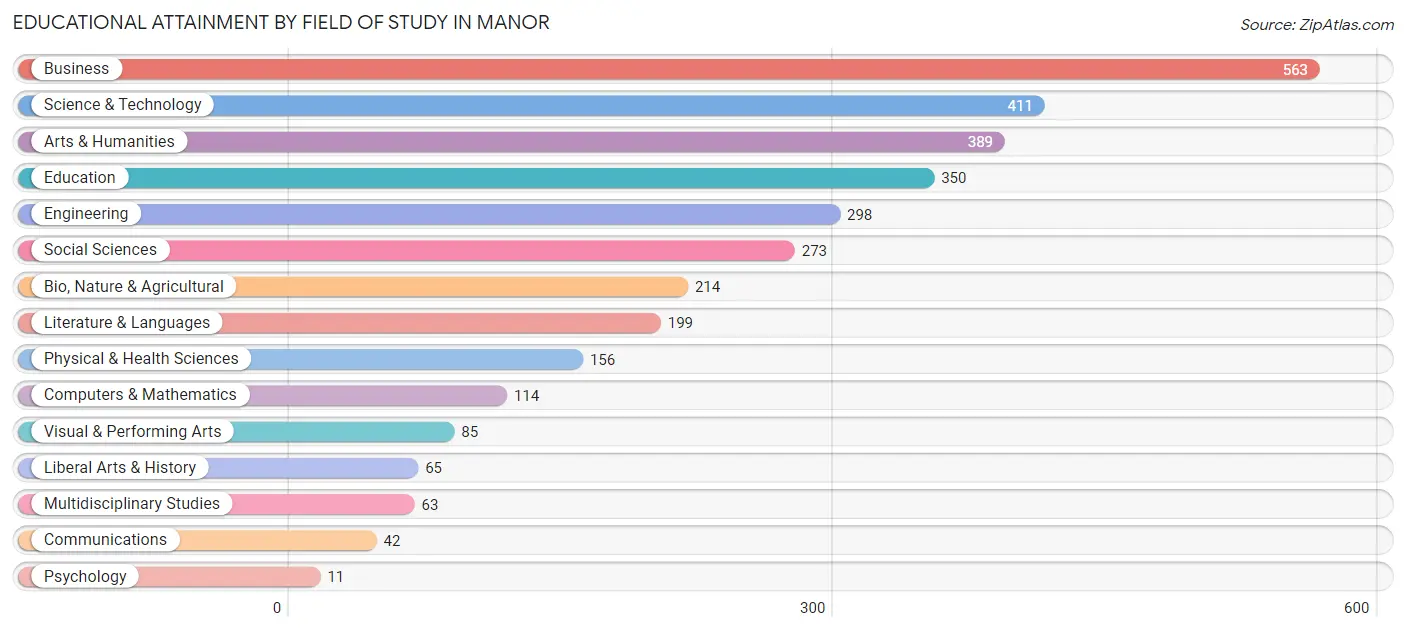
| Field of Study | # Graduates | % Graduates |
| Computers & Mathematics | 114 | 3.5% |
| Bio, Nature & Agricultural | 214 | 6.6% |
| Physical & Health Sciences | 156 | 4.8% |
| Psychology | 11 | 0.3% |
| Social Sciences | 273 | 8.4% |
| Engineering | 298 | 9.2% |
| Multidisciplinary Studies | 63 | 1.9% |
| Science & Technology | 411 | 12.7% |
| Business | 563 | 17.4% |
| Education | 350 | 10.8% |
| Literature & Languages | 199 | 6.2% |
| Liberal Arts & History | 65 | 2.0% |
| Visual & Performing Arts | 85 | 2.6% |
| Communications | 42 | 1.3% |
| Arts & Humanities | 389 | 12.0% |
| Total | 3,233 | 100.0% |
Transportation & Commute in Manor
Vehicle Availability by Sex in Manor
The most prevalent vehicle ownership categories in Manor are males with 2 vehicles (1,672, accounting for 39.1%) and females with 2 vehicles (1,101, making up 51.0%).
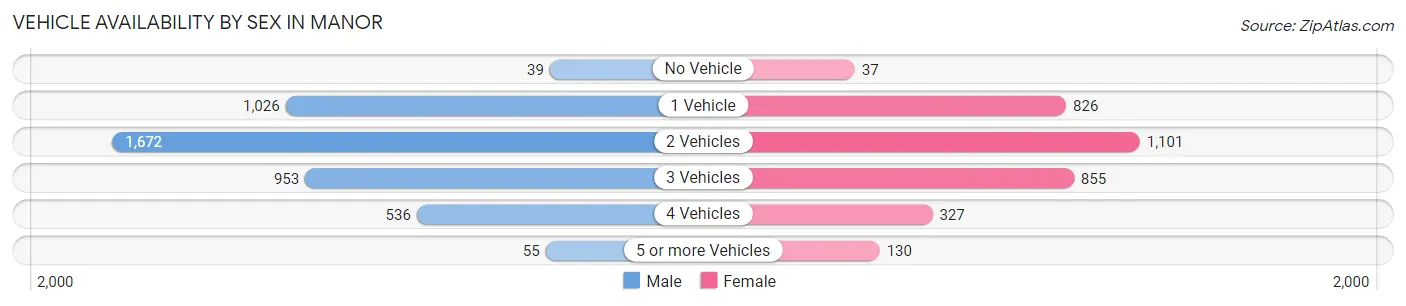
| Vehicles Available | Male | Female |
| No Vehicle | 39 (0.9%) | 37 (1.1%) |
| 1 Vehicle | 1,026 (24.0%) | 826 (25.2%) |
| 2 Vehicles | 1,672 (39.1%) | 1,101 (33.6%) |
| 3 Vehicles | 953 (22.3%) | 855 (26.1%) |
| 4 Vehicles | 536 (12.5%) | 327 (10.0%) |
| 5 or more Vehicles | 55 (1.3%) | 130 (4.0%) |
| Total | 4,281 (100.0%) | 3,276 (100.0%) |
Commute Time in Manor
The most frequently occuring commute durations in Manor are 30 to 34 minutes (1,128 commuters, 17.0%), 60 to 89 minutes (1,105 commuters, 16.7%), and 20 to 24 minutes (1,050 commuters, 15.9%).
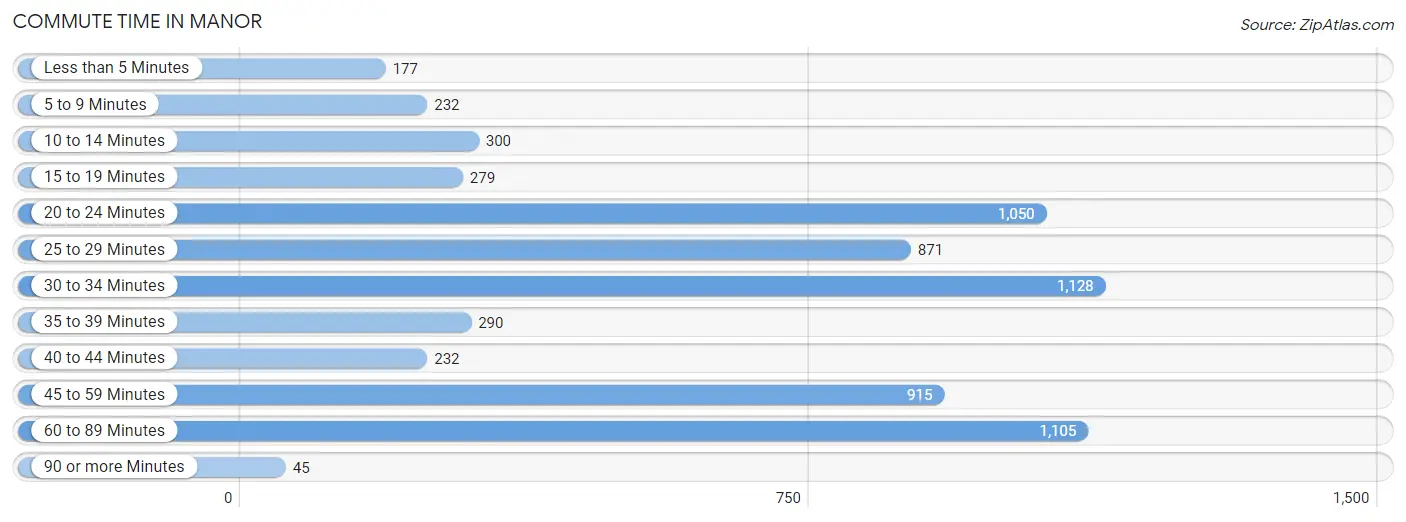
| Commute Time | # Commuters | % Commuters |
| Less than 5 Minutes | 177 | 2.7% |
| 5 to 9 Minutes | 232 | 3.5% |
| 10 to 14 Minutes | 300 | 4.5% |
| 15 to 19 Minutes | 279 | 4.2% |
| 20 to 24 Minutes | 1,050 | 15.9% |
| 25 to 29 Minutes | 871 | 13.2% |
| 30 to 34 Minutes | 1,128 | 17.0% |
| 35 to 39 Minutes | 290 | 4.4% |
| 40 to 44 Minutes | 232 | 3.5% |
| 45 to 59 Minutes | 915 | 13.8% |
| 60 to 89 Minutes | 1,105 | 16.7% |
| 90 or more Minutes | 45 | 0.7% |
Commute Time by Sex in Manor
The most common commute times in Manor are 25 to 29 minutes (640 commuters, 17.2%) for males and 30 to 34 minutes (592 commuters, 20.4%) for females.
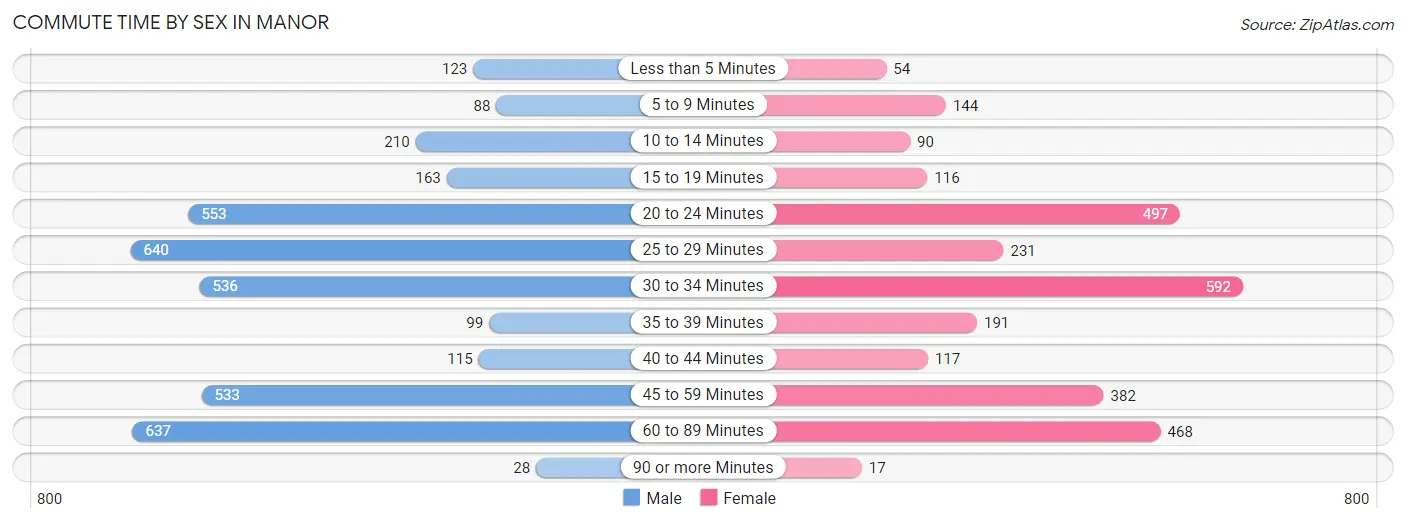
| Commute Time | Male | Female |
| Less than 5 Minutes | 123 (3.3%) | 54 (1.9%) |
| 5 to 9 Minutes | 88 (2.4%) | 144 (5.0%) |
| 10 to 14 Minutes | 210 (5.6%) | 90 (3.1%) |
| 15 to 19 Minutes | 163 (4.4%) | 116 (4.0%) |
| 20 to 24 Minutes | 553 (14.8%) | 497 (17.1%) |
| 25 to 29 Minutes | 640 (17.2%) | 231 (8.0%) |
| 30 to 34 Minutes | 536 (14.4%) | 592 (20.4%) |
| 35 to 39 Minutes | 99 (2.7%) | 191 (6.6%) |
| 40 to 44 Minutes | 115 (3.1%) | 117 (4.0%) |
| 45 to 59 Minutes | 533 (14.3%) | 382 (13.2%) |
| 60 to 89 Minutes | 637 (17.1%) | 468 (16.1%) |
| 90 or more Minutes | 28 (0.7%) | 17 (0.6%) |
Time of Departure to Work by Sex in Manor
The most frequent times of departure to work in Manor are 6:00 AM to 6:29 AM (1,020, 27.4%) for males and 7:00 AM to 7:29 AM (740, 25.5%) for females.
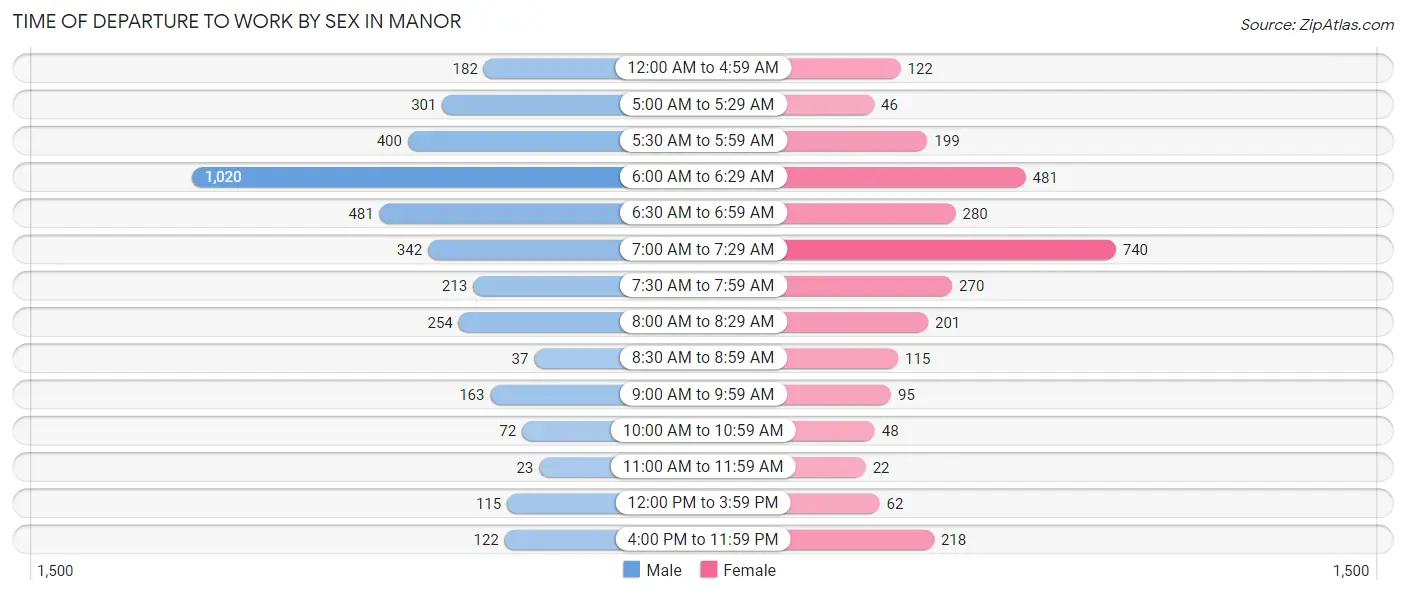
| Time of Departure | Male | Female |
| 12:00 AM to 4:59 AM | 182 (4.9%) | 122 (4.2%) |
| 5:00 AM to 5:29 AM | 301 (8.1%) | 46 (1.6%) |
| 5:30 AM to 5:59 AM | 400 (10.7%) | 199 (6.9%) |
| 6:00 AM to 6:29 AM | 1,020 (27.4%) | 481 (16.6%) |
| 6:30 AM to 6:59 AM | 481 (12.9%) | 280 (9.7%) |
| 7:00 AM to 7:29 AM | 342 (9.2%) | 740 (25.5%) |
| 7:30 AM to 7:59 AM | 213 (5.7%) | 270 (9.3%) |
| 8:00 AM to 8:29 AM | 254 (6.8%) | 201 (6.9%) |
| 8:30 AM to 8:59 AM | 37 (1.0%) | 115 (4.0%) |
| 9:00 AM to 9:59 AM | 163 (4.4%) | 95 (3.3%) |
| 10:00 AM to 10:59 AM | 72 (1.9%) | 48 (1.7%) |
| 11:00 AM to 11:59 AM | 23 (0.6%) | 22 (0.8%) |
| 12:00 PM to 3:59 PM | 115 (3.1%) | 62 (2.1%) |
| 4:00 PM to 11:59 PM | 122 (3.3%) | 218 (7.5%) |
| Total | 3,725 (100.0%) | 2,899 (100.0%) |
Housing Occupancy in Manor
Occupancy by Ownership in Manor
Of the total 4,551 dwellings in Manor, owner-occupied units account for 3,874 (85.1%), while renter-occupied units make up 677 (14.9%).
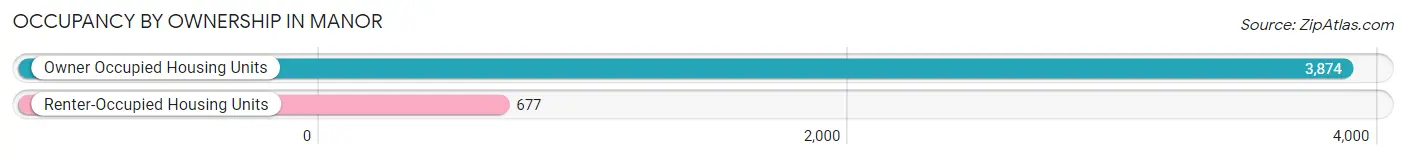
| Occupancy | # Housing Units | % Housing Units |
| Owner Occupied Housing Units | 3,874 | 85.1% |
| Renter-Occupied Housing Units | 677 | 14.9% |
| Total Occupied Housing Units | 4,551 | 100.0% |
Occupancy by Household Size in Manor
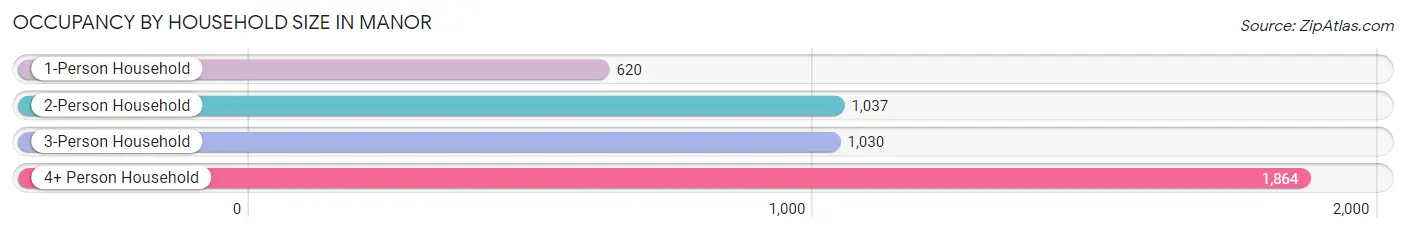
| Household Size | # Housing Units | % Housing Units |
| 1-Person Household | 620 | 13.6% |
| 2-Person Household | 1,037 | 22.8% |
| 3-Person Household | 1,030 | 22.6% |
| 4+ Person Household | 1,864 | 41.0% |
| Total Housing Units | 4,551 | 100.0% |
Occupancy by Ownership by Household Size in Manor
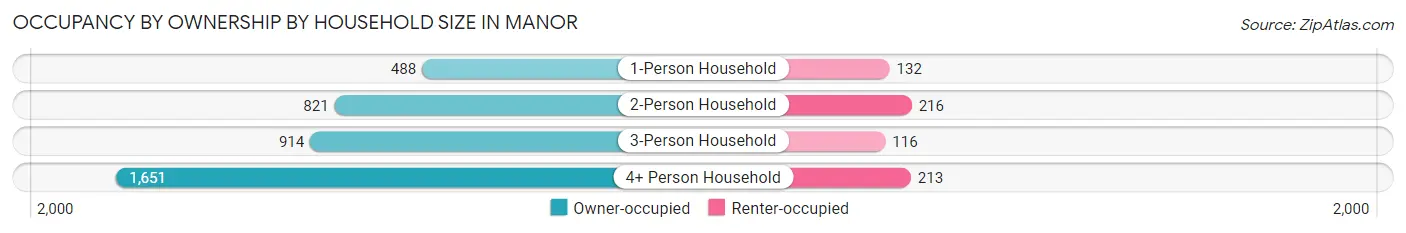
| Household Size | Owner-occupied | Renter-occupied |
| 1-Person Household | 488 (78.7%) | 132 (21.3%) |
| 2-Person Household | 821 (79.2%) | 216 (20.8%) |
| 3-Person Household | 914 (88.7%) | 116 (11.3%) |
| 4+ Person Household | 1,651 (88.6%) | 213 (11.4%) |
| Total Housing Units | 3,874 (85.1%) | 677 (14.9%) |
Occupancy by Educational Attainment in Manor
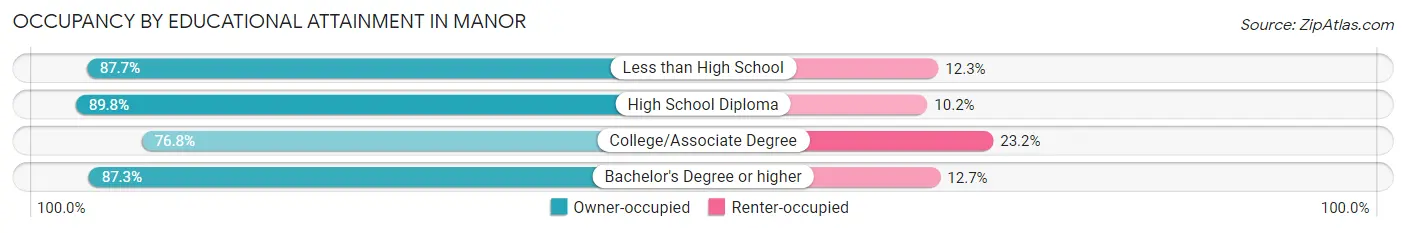
| Household Size | Owner-occupied | Renter-occupied |
| Less than High School | 618 (87.7%) | 87 (12.3%) |
| High School Diploma | 1,061 (89.8%) | 120 (10.2%) |
| College/Associate Degree | 955 (76.8%) | 289 (23.2%) |
| Bachelor's Degree or higher | 1,240 (87.3%) | 181 (12.7%) |
Occupancy by Age of Householder in Manor
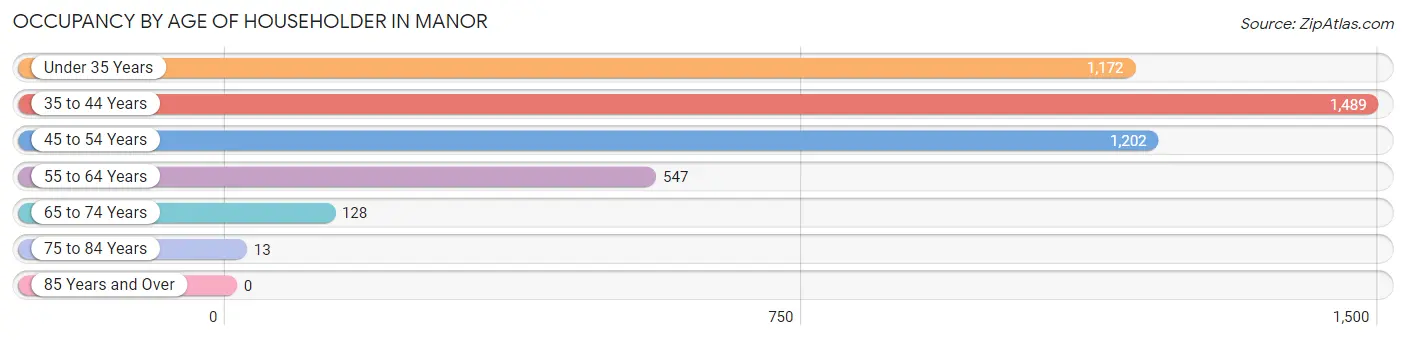
| Age Bracket | # Households | % Households |
| Under 35 Years | 1,172 | 25.8% |
| 35 to 44 Years | 1,489 | 32.7% |
| 45 to 54 Years | 1,202 | 26.4% |
| 55 to 64 Years | 547 | 12.0% |
| 65 to 74 Years | 128 | 2.8% |
| 75 to 84 Years | 13 | 0.3% |
| 85 Years and Over | 0 | 0.0% |
| Total | 4,551 | 100.0% |
Housing Finances in Manor
Median Income by Occupancy in Manor
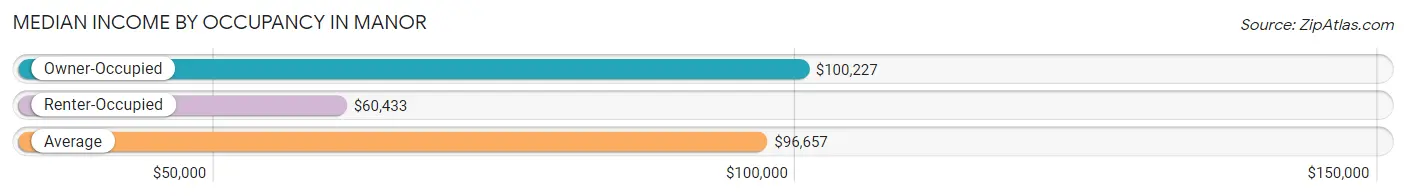
| Occupancy Type | # Households | Median Income |
| Owner-Occupied | 3,874 (85.1%) | $100,227 |
| Renter-Occupied | 677 (14.9%) | $60,433 |
| Average | 4,551 (100.0%) | $96,657 |
Occupancy by Householder Income Bracket in Manor
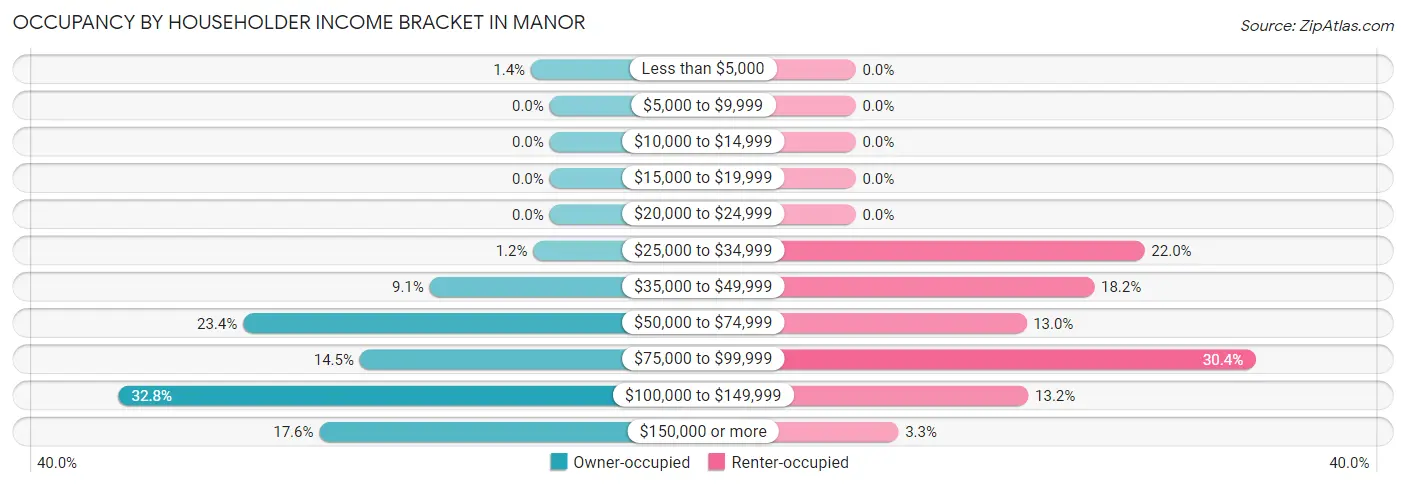
| Income Bracket | Owner-occupied | Renter-occupied |
| Less than $5,000 | 55 (1.4%) | 0 (0.0%) |
| $5,000 to $9,999 | 0 (0.0%) | 0 (0.0%) |
| $10,000 to $14,999 | 0 (0.0%) | 0 (0.0%) |
| $15,000 to $19,999 | 0 (0.0%) | 0 (0.0%) |
| $20,000 to $24,999 | 0 (0.0%) | 0 (0.0%) |
| $25,000 to $34,999 | 48 (1.2%) | 149 (22.0%) |
| $35,000 to $49,999 | 354 (9.1%) | 123 (18.2%) |
| $50,000 to $74,999 | 905 (23.4%) | 88 (13.0%) |
| $75,000 to $99,999 | 560 (14.5%) | 206 (30.4%) |
| $100,000 to $149,999 | 1,272 (32.8%) | 89 (13.2%) |
| $150,000 or more | 680 (17.5%) | 22 (3.3%) |
| Total | 3,874 (100.0%) | 677 (100.0%) |
Monthly Housing Cost Tiers in Manor
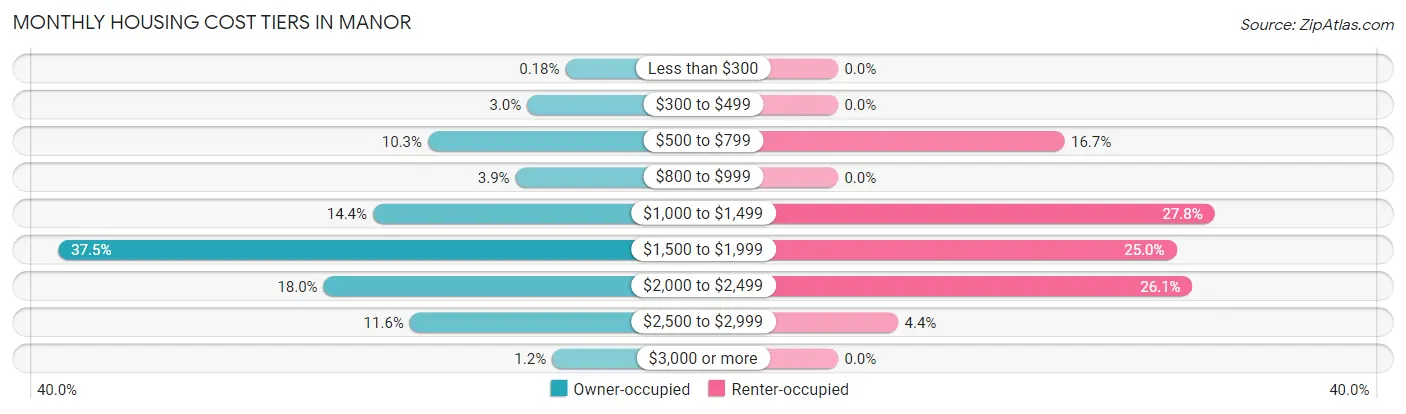
| Monthly Cost | Owner-occupied | Renter-occupied |
| Less than $300 | 7 (0.2%) | 0 (0.0%) |
| $300 to $499 | 116 (3.0%) | 0 (0.0%) |
| $500 to $799 | 399 (10.3%) | 113 (16.7%) |
| $800 to $999 | 149 (3.8%) | 0 (0.0%) |
| $1,000 to $1,499 | 556 (14.3%) | 188 (27.8%) |
| $1,500 to $1,999 | 1,454 (37.5%) | 169 (25.0%) |
| $2,000 to $2,499 | 697 (18.0%) | 177 (26.1%) |
| $2,500 to $2,999 | 451 (11.6%) | 30 (4.4%) |
| $3,000 or more | 45 (1.2%) | 0 (0.0%) |
| Total | 3,874 (100.0%) | 677 (100.0%) |
Physical Housing Characteristics in Manor
Housing Structures in Manor
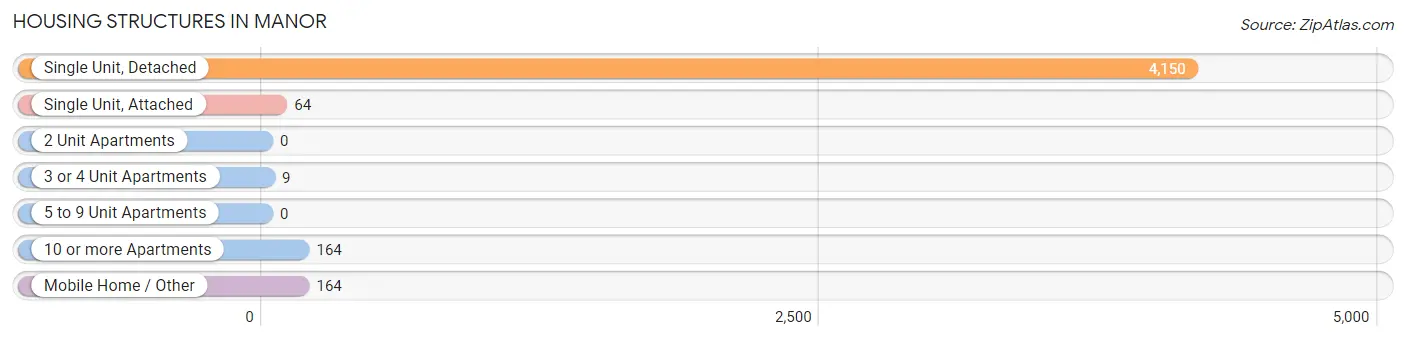
| Structure Type | # Housing Units | % Housing Units |
| Single Unit, Detached | 4,150 | 91.2% |
| Single Unit, Attached | 64 | 1.4% |
| 2 Unit Apartments | 0 | 0.0% |
| 3 or 4 Unit Apartments | 9 | 0.2% |
| 5 to 9 Unit Apartments | 0 | 0.0% |
| 10 or more Apartments | 164 | 3.6% |
| Mobile Home / Other | 164 | 3.6% |
| Total | 4,551 | 100.0% |
Housing Structures by Occupancy in Manor
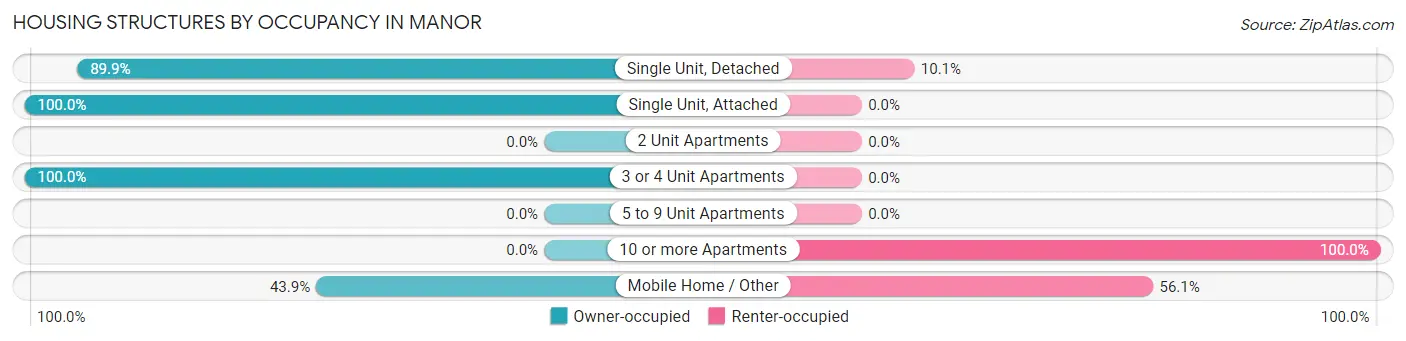
| Structure Type | Owner-occupied | Renter-occupied |
| Single Unit, Detached | 3,729 (89.9%) | 421 (10.1%) |
| Single Unit, Attached | 64 (100.0%) | 0 (0.0%) |
| 2 Unit Apartments | 0 (0.0%) | 0 (0.0%) |
| 3 or 4 Unit Apartments | 9 (100.0%) | 0 (0.0%) |
| 5 to 9 Unit Apartments | 0 (0.0%) | 0 (0.0%) |
| 10 or more Apartments | 0 (0.0%) | 164 (100.0%) |
| Mobile Home / Other | 72 (43.9%) | 92 (56.1%) |
| Total | 3,874 (85.1%) | 677 (14.9%) |
Housing Structures by Number of Rooms in Manor
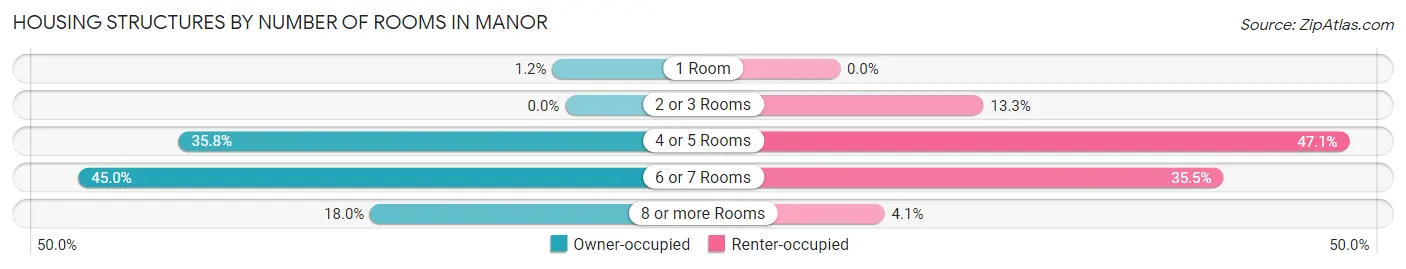
| Number of Rooms | Owner-occupied | Renter-occupied |
| 1 Room | 46 (1.2%) | 0 (0.0%) |
| 2 or 3 Rooms | 0 (0.0%) | 90 (13.3%) |
| 4 or 5 Rooms | 1,385 (35.7%) | 319 (47.1%) |
| 6 or 7 Rooms | 1,744 (45.0%) | 240 (35.4%) |
| 8 or more Rooms | 699 (18.0%) | 28 (4.1%) |
| Total | 3,874 (100.0%) | 677 (100.0%) |
Housing Structure by Heating Type in Manor
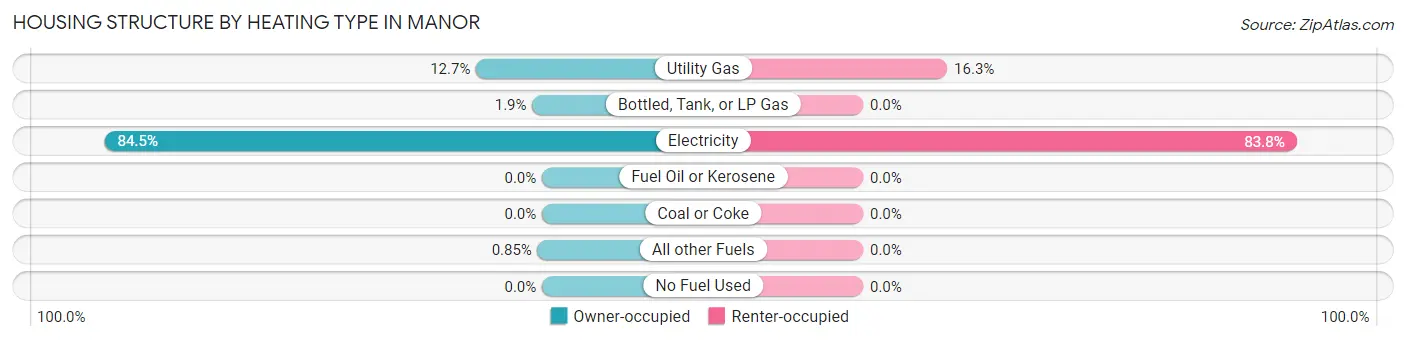
| Heating Type | Owner-occupied | Renter-occupied |
| Utility Gas | 493 (12.7%) | 110 (16.3%) |
| Bottled, Tank, or LP Gas | 73 (1.9%) | 0 (0.0%) |
| Electricity | 3,275 (84.5%) | 567 (83.8%) |
| Fuel Oil or Kerosene | 0 (0.0%) | 0 (0.0%) |
| Coal or Coke | 0 (0.0%) | 0 (0.0%) |
| All other Fuels | 33 (0.9%) | 0 (0.0%) |
| No Fuel Used | 0 (0.0%) | 0 (0.0%) |
| Total | 3,874 (100.0%) | 677 (100.0%) |
Household Vehicle Usage in Manor
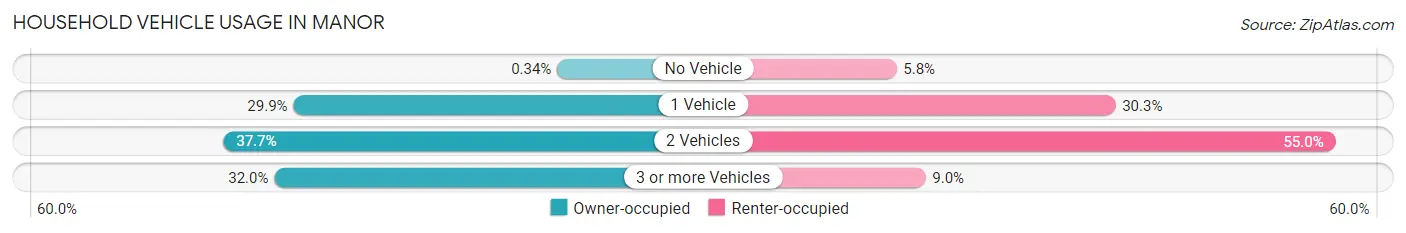
| Vehicles per Household | Owner-occupied | Renter-occupied |
| No Vehicle | 13 (0.3%) | 39 (5.8%) |
| 1 Vehicle | 1,158 (29.9%) | 205 (30.3%) |
| 2 Vehicles | 1,462 (37.7%) | 372 (54.9%) |
| 3 or more Vehicles | 1,241 (32.0%) | 61 (9.0%) |
| Total | 3,874 (100.0%) | 677 (100.0%) |
Real Estate & Mortgages in Manor
Real Estate and Mortgage Overview in Manor
| Characteristic | Without Mortgage | With Mortgage |
| Housing Units | 509 | 3,365 |
| Median Property Value | $223,300 | $302,400 |
| Median Household Income | $120,215 | $561 |
| Monthly Housing Costs | $661 | $45 |
| Real Estate Taxes | $4,857 | $120 |
Property Value by Mortgage Status in Manor
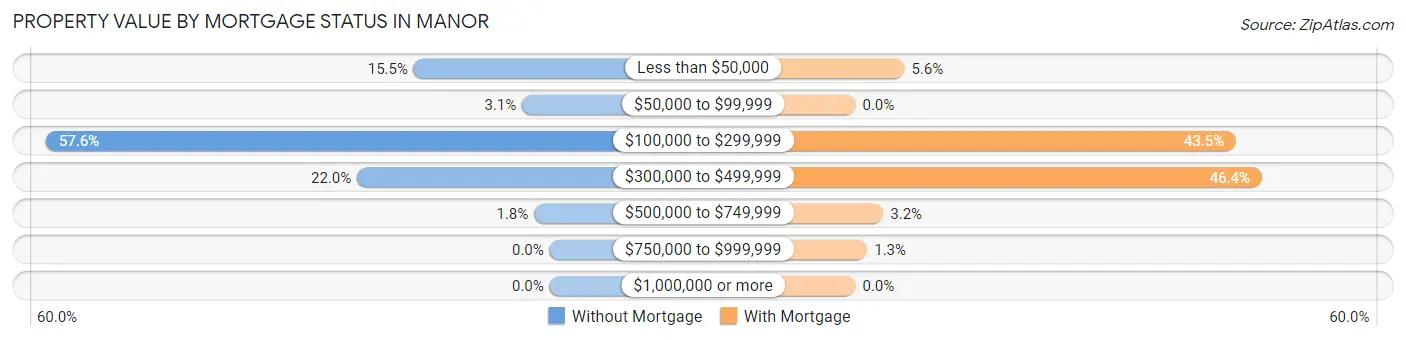
| Property Value | Without Mortgage | With Mortgage |
| Less than $50,000 | 79 (15.5%) | 188 (5.6%) |
| $50,000 to $99,999 | 16 (3.1%) | 0 (0.0%) |
| $100,000 to $299,999 | 293 (57.6%) | 1,463 (43.5%) |
| $300,000 to $499,999 | 112 (22.0%) | 1,562 (46.4%) |
| $500,000 to $749,999 | 9 (1.8%) | 107 (3.2%) |
| $750,000 to $999,999 | 0 (0.0%) | 45 (1.3%) |
| $1,000,000 or more | 0 (0.0%) | 0 (0.0%) |
| Total | 509 (100.0%) | 3,365 (100.0%) |
Household Income by Mortgage Status in Manor
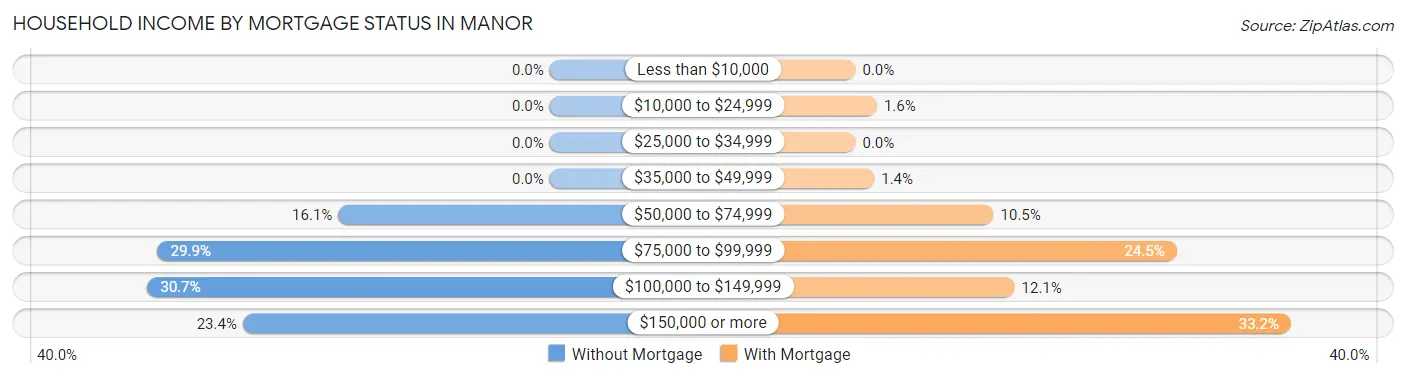
| Household Income | Without Mortgage | With Mortgage |
| Less than $10,000 | 0 (0.0%) | 0 (0.0%) |
| $10,000 to $24,999 | 0 (0.0%) | 55 (1.6%) |
| $25,000 to $34,999 | 0 (0.0%) | 0 (0.0%) |
| $35,000 to $49,999 | 0 (0.0%) | 48 (1.4%) |
| $50,000 to $74,999 | 82 (16.1%) | 354 (10.5%) |
| $75,000 to $99,999 | 152 (29.9%) | 823 (24.5%) |
| $100,000 to $149,999 | 156 (30.6%) | 408 (12.1%) |
| $150,000 or more | 119 (23.4%) | 1,116 (33.2%) |
| Total | 509 (100.0%) | 3,365 (100.0%) |
Property Value to Household Income Ratio in Manor
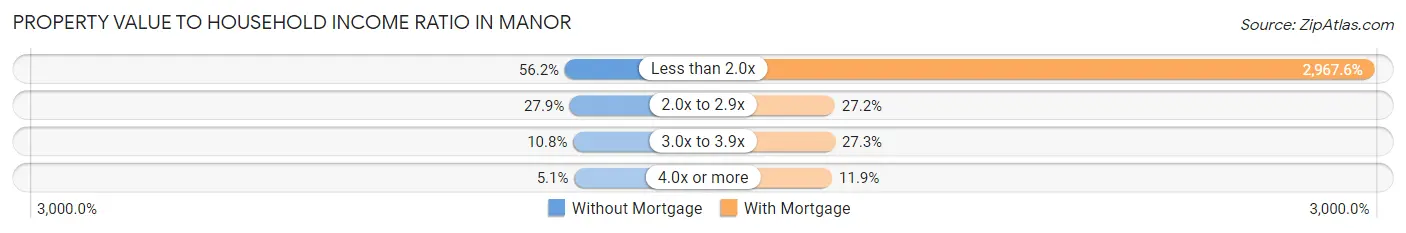
| Value-to-Income Ratio | Without Mortgage | With Mortgage |
| Less than 2.0x | 286 (56.2%) | 99,860 (2,967.6%) |
| 2.0x to 2.9x | 142 (27.9%) | 915 (27.2%) |
| 3.0x to 3.9x | 55 (10.8%) | 917 (27.3%) |
| 4.0x or more | 26 (5.1%) | 400 (11.9%) |
| Total | 509 (100.0%) | 3,365 (100.0%) |
Real Estate Taxes by Mortgage Status in Manor
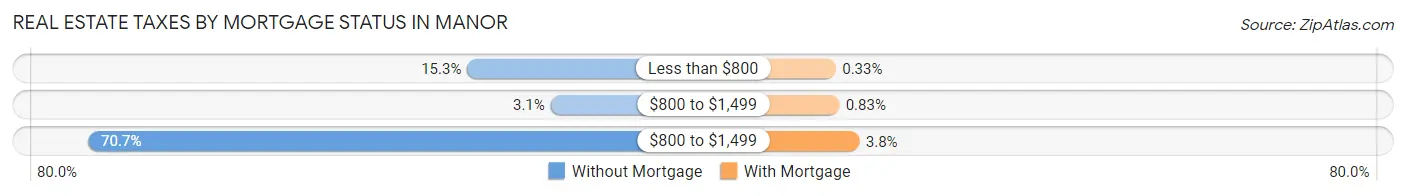
| Property Taxes | Without Mortgage | With Mortgage |
| Less than $800 | 78 (15.3%) | 11 (0.3%) |
| $800 to $1,499 | 16 (3.1%) | 28 (0.8%) |
| $800 to $1,499 | 360 (70.7%) | 127 (3.8%) |
| Total | 509 (100.0%) | 3,365 (100.0%) |
Health & Disability in Manor
Health Insurance Coverage by Age in Manor
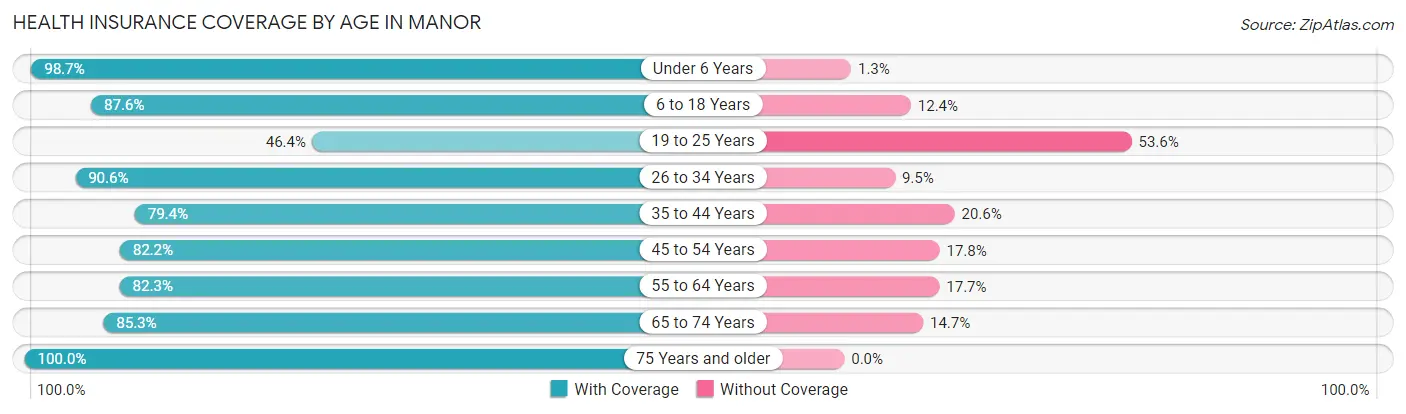
| Age Bracket | With Coverage | Without Coverage |
| Under 6 Years | 2,113 (98.7%) | 27 (1.3%) |
| 6 to 18 Years | 3,113 (87.6%) | 441 (12.4%) |
| 19 to 25 Years | 437 (46.4%) | 504 (53.6%) |
| 26 to 34 Years | 2,214 (90.5%) | 231 (9.5%) |
| 35 to 44 Years | 1,951 (79.4%) | 505 (20.6%) |
| 45 to 54 Years | 1,699 (82.2%) | 367 (17.8%) |
| 55 to 64 Years | 1,058 (82.3%) | 228 (17.7%) |
| 65 to 74 Years | 331 (85.3%) | 57 (14.7%) |
| 75 Years and older | 65 (100.0%) | 0 (0.0%) |
| Total | 12,981 (84.6%) | 2,360 (15.4%) |
Health Insurance Coverage by Citizenship Status in Manor
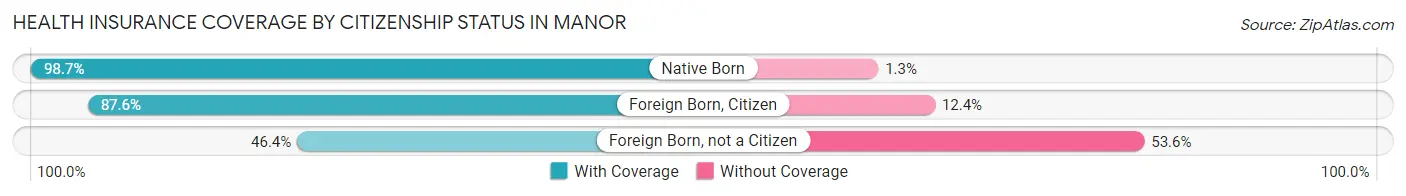
| Citizenship Status | With Coverage | Without Coverage |
| Native Born | 2,113 (98.7%) | 27 (1.3%) |
| Foreign Born, Citizen | 3,113 (87.6%) | 441 (12.4%) |
| Foreign Born, not a Citizen | 437 (46.4%) | 504 (53.6%) |
Health Insurance Coverage by Household Income in Manor
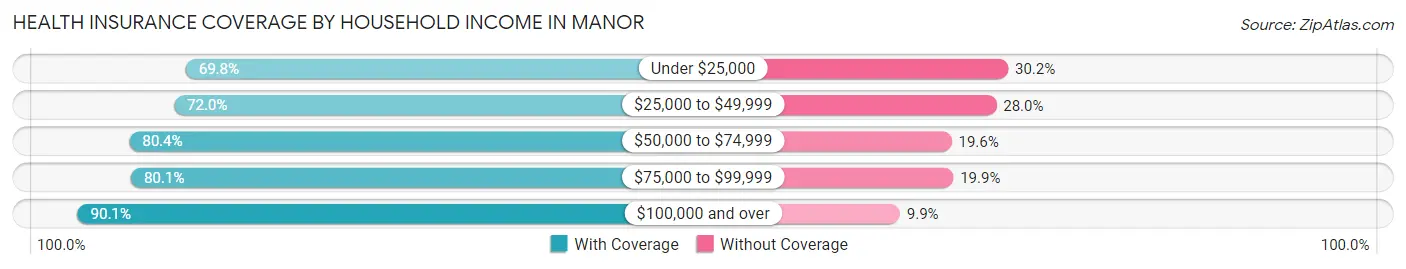
| Household Income | With Coverage | Without Coverage |
| Under $25,000 | 67 (69.8%) | 29 (30.2%) |
| $25,000 to $49,999 | 1,231 (72.0%) | 479 (28.0%) |
| $50,000 to $74,999 | 2,188 (80.4%) | 534 (19.6%) |
| $75,000 to $99,999 | 1,951 (80.1%) | 486 (19.9%) |
| $100,000 and over | 7,541 (90.1%) | 832 (9.9%) |
Public vs Private Health Insurance Coverage by Age in Manor
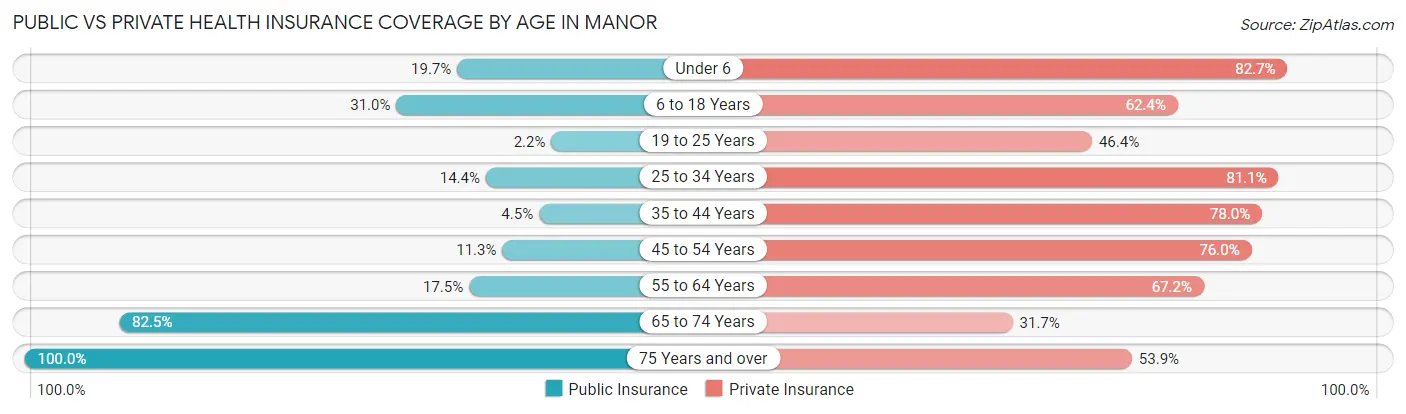
| Age Bracket | Public Insurance | Private Insurance |
| Under 6 | 422 (19.7%) | 1,770 (82.7%) |
| 6 to 18 Years | 1,102 (31.0%) | 2,216 (62.4%) |
| 19 to 25 Years | 21 (2.2%) | 437 (46.4%) |
| 25 to 34 Years | 352 (14.4%) | 1,982 (81.1%) |
| 35 to 44 Years | 111 (4.5%) | 1,916 (78.0%) |
| 45 to 54 Years | 234 (11.3%) | 1,571 (76.0%) |
| 55 to 64 Years | 225 (17.5%) | 864 (67.2%) |
| 65 to 74 Years | 320 (82.5%) | 123 (31.7%) |
| 75 Years and over | 65 (100.0%) | 35 (53.8%) |
| Total | 2,852 (18.6%) | 10,914 (71.1%) |
Disability Status by Sex by Age in Manor
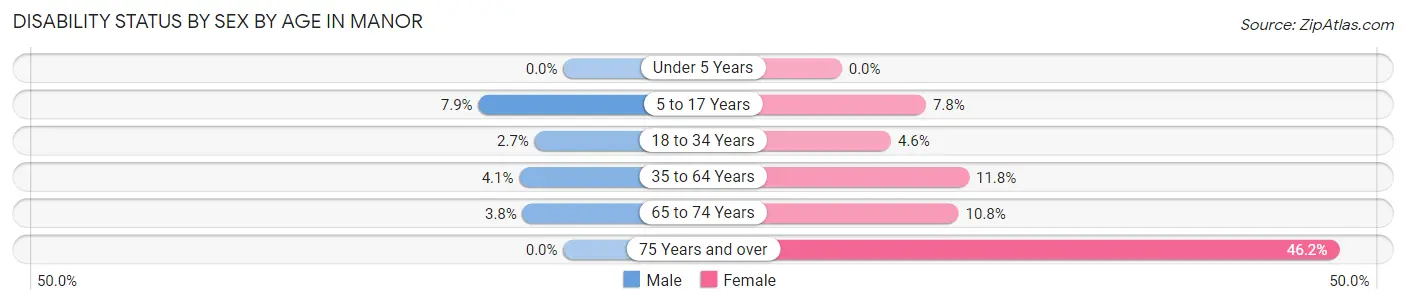
| Age Bracket | Male | Female |
| Under 5 Years | 0 (0.0%) | 0 (0.0%) |
| 5 to 17 Years | 145 (7.9%) | 141 (7.8%) |
| 18 to 34 Years | 47 (2.7%) | 79 (4.6%) |
| 35 to 64 Years | 121 (4.1%) | 337 (11.8%) |
| 65 to 74 Years | 7 (3.8%) | 22 (10.8%) |
| 75 Years and over | 0 (0.0%) | 30 (46.2%) |
Disability Class by Sex by Age in Manor
Disability Class: Hearing Difficulty
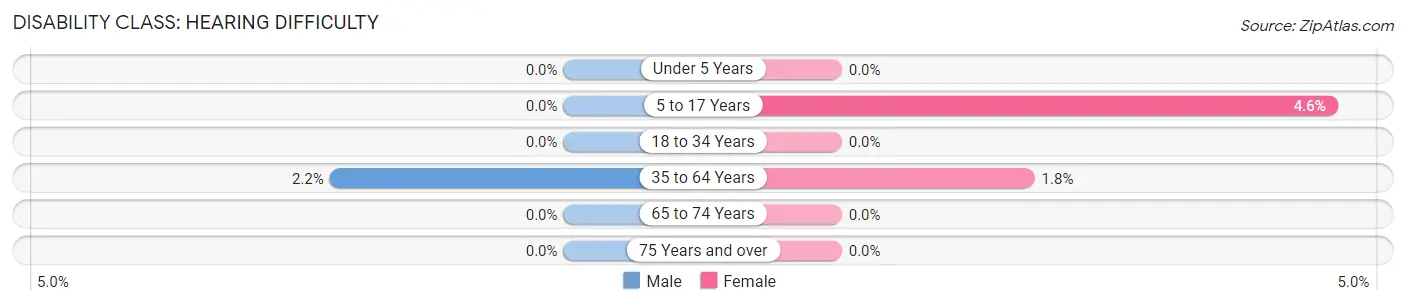
| Age Bracket | Male | Female |
| Under 5 Years | 0 (0.0%) | 0 (0.0%) |
| 5 to 17 Years | 0 (0.0%) | 83 (4.6%) |
| 18 to 34 Years | 0 (0.0%) | 0 (0.0%) |
| 35 to 64 Years | 64 (2.2%) | 51 (1.8%) |
| 65 to 74 Years | 0 (0.0%) | 0 (0.0%) |
| 75 Years and over | 0 (0.0%) | 0 (0.0%) |
Disability Class: Vision Difficulty
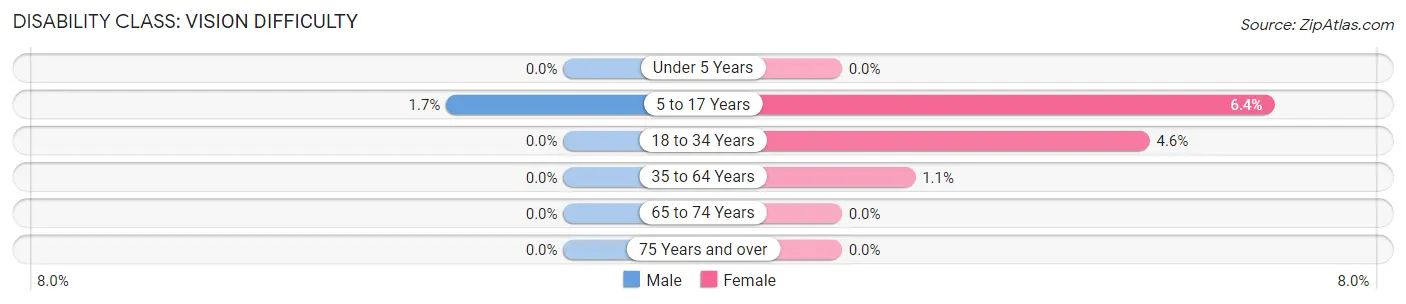
| Age Bracket | Male | Female |
| Under 5 Years | 0 (0.0%) | 0 (0.0%) |
| 5 to 17 Years | 32 (1.7%) | 116 (6.4%) |
| 18 to 34 Years | 0 (0.0%) | 79 (4.6%) |
| 35 to 64 Years | 0 (0.0%) | 31 (1.1%) |
| 65 to 74 Years | 0 (0.0%) | 0 (0.0%) |
| 75 Years and over | 0 (0.0%) | 0 (0.0%) |
Disability Class: Cognitive Difficulty
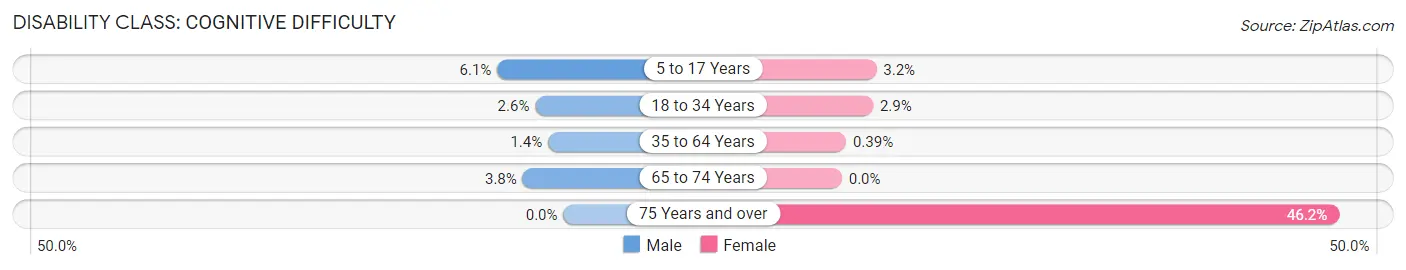
| Age Bracket | Male | Female |
| 5 to 17 Years | 113 (6.1%) | 58 (3.2%) |
| 18 to 34 Years | 46 (2.6%) | 50 (2.9%) |
| 35 to 64 Years | 42 (1.4%) | 11 (0.4%) |
| 65 to 74 Years | 7 (3.8%) | 0 (0.0%) |
| 75 Years and over | 0 (0.0%) | 30 (46.2%) |
Disability Class: Ambulatory Difficulty
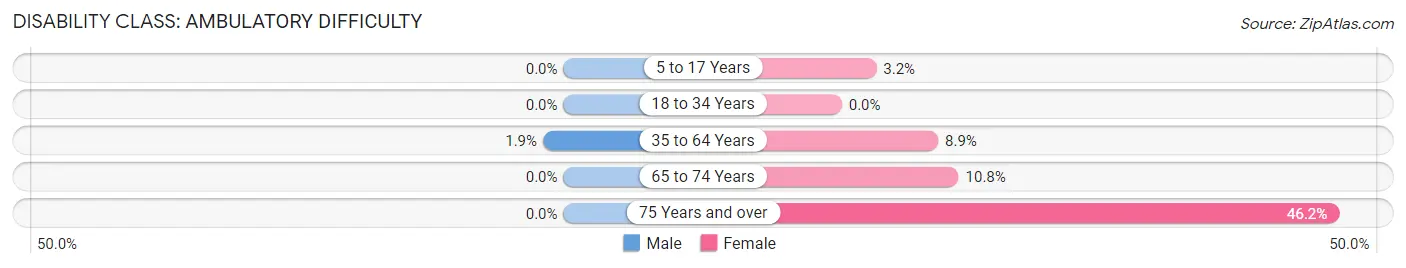
| Age Bracket | Male | Female |
| 5 to 17 Years | 0 (0.0%) | 58 (3.2%) |
| 18 to 34 Years | 0 (0.0%) | 0 (0.0%) |
| 35 to 64 Years | 56 (1.9%) | 255 (8.9%) |
| 65 to 74 Years | 0 (0.0%) | 22 (10.8%) |
| 75 Years and over | 0 (0.0%) | 30 (46.2%) |
Disability Class: Self-Care Difficulty
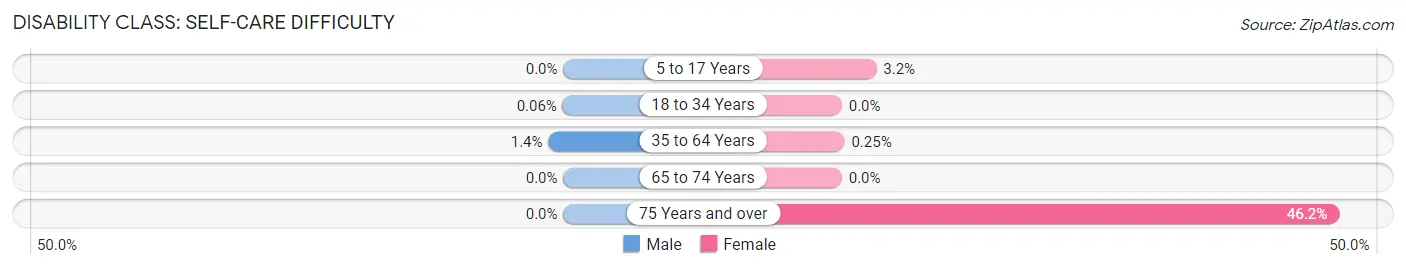
| Age Bracket | Male | Female |
| 5 to 17 Years | 0 (0.0%) | 58 (3.2%) |
| 18 to 34 Years | 1 (0.1%) | 0 (0.0%) |
| 35 to 64 Years | 41 (1.4%) | 7 (0.3%) |
| 65 to 74 Years | 0 (0.0%) | 0 (0.0%) |
| 75 Years and over | 0 (0.0%) | 30 (46.2%) |
Technology Access in Manor
Computing Device Access in Manor
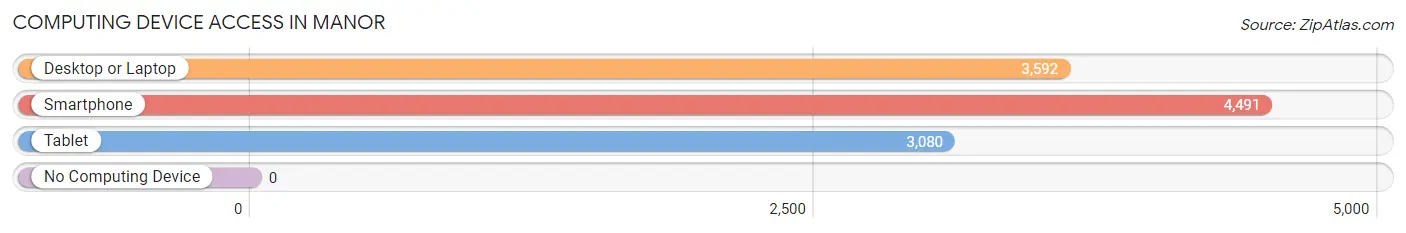
| Device Type | # Households | % Households |
| Desktop or Laptop | 3,592 | 78.9% |
| Smartphone | 4,491 | 98.7% |
| Tablet | 3,080 | 67.7% |
| No Computing Device | 0 | 0.0% |
| Total | 4,551 | 100.0% |
Internet Access in Manor
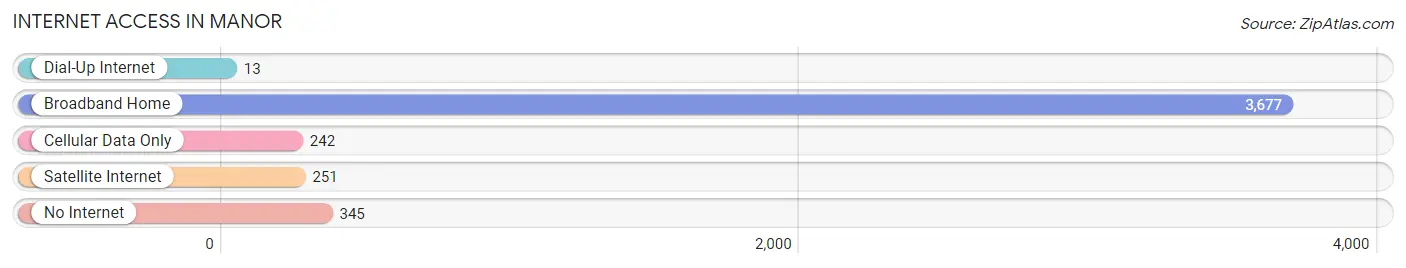
| Internet Type | # Households | % Households |
| Dial-Up Internet | 13 | 0.3% |
| Broadband Home | 3,677 | 80.8% |
| Cellular Data Only | 242 | 5.3% |
| Satellite Internet | 251 | 5.5% |
| No Internet | 345 | 7.6% |
| Total | 4,551 | 100.0% |
Manor Summary
Manor, Texas is a small city located in Travis County, Texas, United States. It is situated about 12 miles northeast of Austin, the state capital. The population of Manor was estimated to be 6,527 in 2019.
History
Manor was founded in 1871 by James B. Manor, a former Confederate soldier. He purchased the land from the state of Texas and named the town after himself. The town was originally a farming community, but it soon became a stop on the Austin and Northwestern Railroad. This allowed the town to grow and become a center for commerce and industry.
In the early 1900s, Manor was home to several cotton gins, a brick factory, and a lumber mill. The town also had a school, a post office, and a few stores.
In the 1950s, Manor began to experience a population boom as people moved to the area from other parts of Texas. This growth was spurred by the construction of the Manor Expressway, which connected Manor to Austin.
Geography
Manor is located in Travis County, Texas, about 12 miles northeast of Austin. The city is situated on the Balcones Escarpment, a geological formation that runs through Central Texas. The terrain is mostly flat, with some rolling hills. The climate is humid subtropical, with hot summers and mild winters.
Economy
Manor’s economy is largely based on agriculture and manufacturing. The city is home to several large farms, which produce cotton, corn, and other crops. There are also several manufacturing plants in the area, which produce a variety of products, including furniture, clothing, and electronics.
The city is also home to several businesses, including restaurants, retail stores, and professional services. The Manor Independent School District is the largest employer in the city, with over 1,000 employees.
Demographics
As of 2019, the population of Manor was estimated to be 6,527. The racial makeup of the city was 73.3% White, 16.2% Hispanic or Latino, 8.2% African American, and 2.3% Asian. The median household income was $50,945, and the median home value was $179,000.
Manor is a diverse city, with a variety of cultures and backgrounds. The city is home to a large Hispanic population, as well as a growing African American population. The city is also home to a large number of immigrants from Mexico, El Salvador, and other countries.
Conclusion
Manor, Texas is a small city located in Travis County, Texas, United States. It is situated about 12 miles northeast of Austin, the state capital. The population of Manor was estimated to be 6,527 in 2019. The city’s economy is largely based on agriculture and manufacturing, and it is home to a diverse population with a variety of cultures and backgrounds. Manor is a great place to live, work, and raise a family.
Common Questions
What is the Total Population of Manor?
Total Population of Manor is 15,341.
What is the Total Male Population of Manor?
Total Male Population of Manor is 7,647.
What is the Total Female Population of Manor?
Total Female Population of Manor is 7,694.
What is the Ratio of Males per 100 Females in Manor?
There are 99.39 Males per 100 Females in Manor.
What is the Ratio of Females per 100 Males in Manor?
There are 100.61 Females per 100 Males in Manor.
What is the Median Population Age in Manor?
Median Population Age in Manor is 30.7 Years.
What is the Average Family Size in Manor
Average Family Size in Manor is 3.7 People.
What is the Average Household Size in Manor
Average Household Size in Manor is 3.4 People.
What is Per Capita Income in Manor?
Per Capita income in Manor is $30,408.
What is the Median Family Income in Manor?
Median Family Income in Manor is $100,878.
What is the Median Household income in Manor?
Median Household Income in Manor is $96,657.
What is Income or Wage Gap in Manor?
Income or Wage Gap in Manor is 37.0%.
Women in Manor earn 63.0 cents for every dollar earned by a man.
What is Inequality or Gini Index in Manor?
Inequality or Gini Index in Manor is 0.28.
How Large is the Labor Force in Manor?
There are 8,007 People in the Labor Forcein in Manor.
What is the Percentage of People in the Labor Force in Manor?
76.0% of People are in the Labor Force in Manor.
What is the Unemployment Rate in Manor?
Unemployment Rate in Manor is 4.5%.