San Perlita, TX
San Perlita Map
San Perlita Overview
784
TOTAL POPULATION
449
MALE POPULATION
335
FEMALE POPULATION
134.03
MALES / 100 FEMALES
74.61
FEMALES / 100 MALES
27.5
MEDIAN AGE
5.3
AVG FAMILY SIZE
5.1
AVG HOUSEHOLD SIZE
$13,695
PER CAPITA INCOME
$31,719
AVG FAMILY INCOME
$30,156
AVG HOUSEHOLD INCOME
38.5%
WAGE / INCOME GAP [ % ]
61.5¢/ $1
WAGE / INCOME GAP [ $ ]
0.41
INEQUALITY / GINI INDEX
294
LABOR FORCE [ PEOPLE ]
49.1%
PERCENT IN LABOR FORCE
5.8%
UNEMPLOYMENT RATE
San Perlita Zip Codes
San Perlita Area Codes
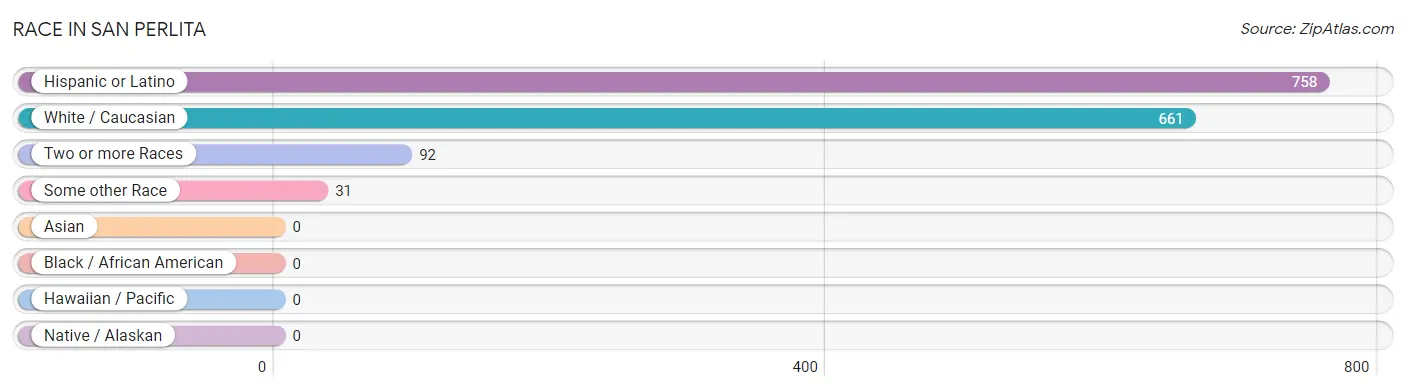
Race in San Perlita
The most populous races in San Perlita are Hispanic or Latino (758 | 96.7%), White / Caucasian (661 | 84.3%), and Two or more Races (92 | 11.7%).
| Race | # Population | % Population |
| Asian | 0 | 0.0% |
| Black / African American | 0 | 0.0% |
| Hawaiian / Pacific | 0 | 0.0% |
| Hispanic or Latino | 758 | 96.7% |
| Native / Alaskan | 0 | 0.0% |
| White / Caucasian | 661 | 84.3% |
| Two or more Races | 92 | 11.7% |
| Some other Race | 31 | 4.0% |
| Total | 784 | 100.0% |
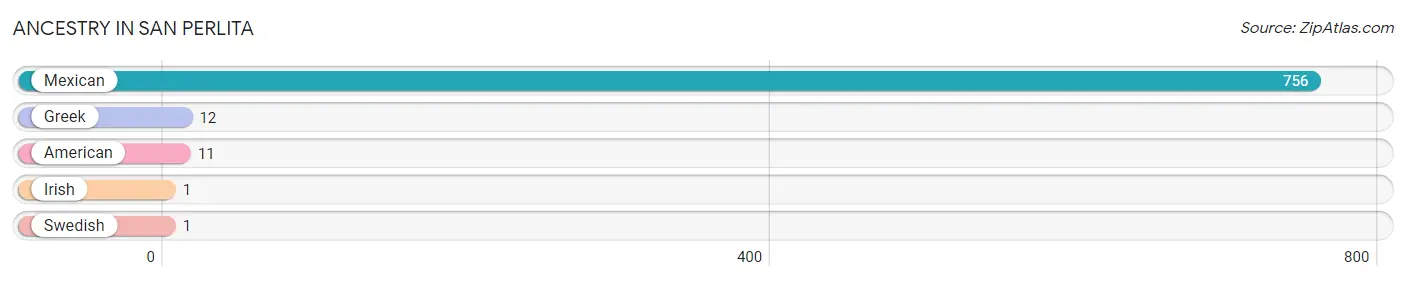
Ancestry in San Perlita
The most populous ancestries reported in San Perlita are Mexican (756 | 96.4%), Greek (12 | 1.5%), American (11 | 1.4%), Irish (1 | 0.1%), and Swedish (1 | 0.1%), together accounting for 99.6% of all San Perlita residents.
| Ancestry | # Population | % Population |
| American | 11 | 1.4% |
| Greek | 12 | 1.5% |
| Irish | 1 | 0.1% |
| Mexican | 756 | 96.4% |
| Swedish | 1 | 0.1% | View All 5 Rows |
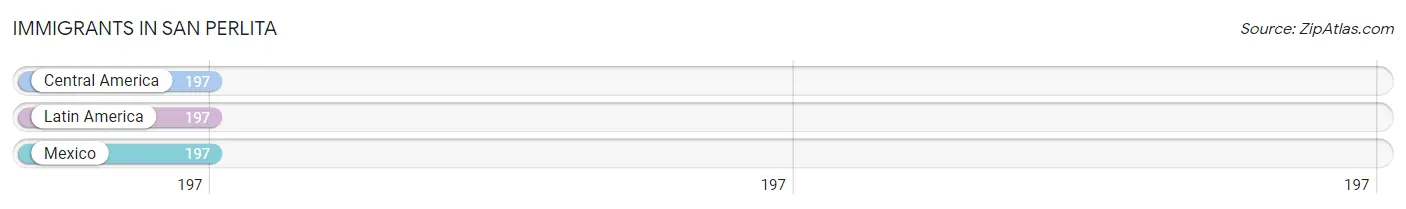
Immigrants in San Perlita
The most numerous immigrant groups reported in San Perlita came from Central America (197 | 25.1%), Latin America (197 | 25.1%), and Mexico (197 | 25.1%), together accounting for 75.4% of all San Perlita residents.
| Immigration Origin | # Population | % Population |
| Central America | 197 | 25.1% |
| Latin America | 197 | 25.1% |
| Mexico | 197 | 25.1% | View All 3 Rows |
Sex and Age in San Perlita
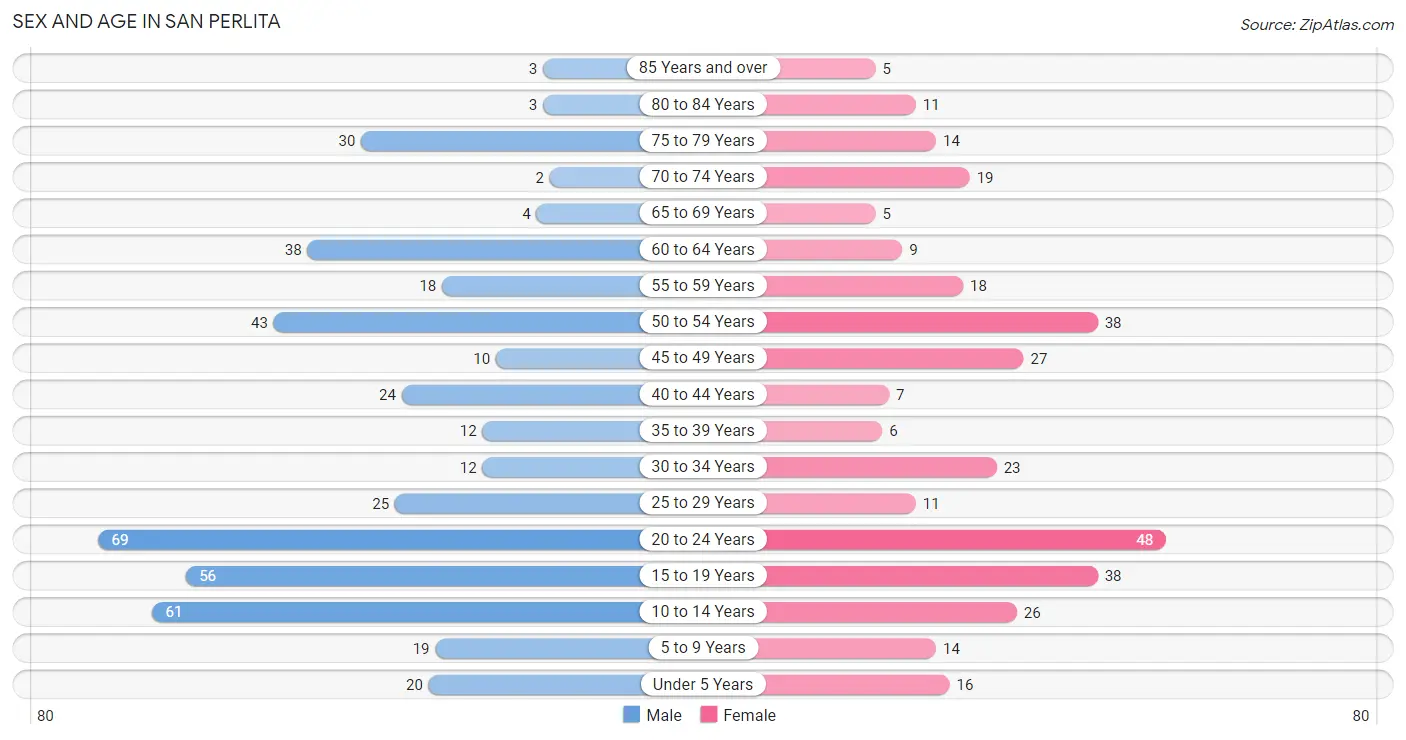
Sex and Age in San Perlita
The most populous age groups in San Perlita are 20 to 24 Years (69 | 15.4%) for men and 20 to 24 Years (48 | 14.3%) for women.
| Age Bracket | Male | Female |
| Under 5 Years | 20 (4.4%) | 16 (4.8%) |
| 5 to 9 Years | 19 (4.2%) | 14 (4.2%) |
| 10 to 14 Years | 61 (13.6%) | 26 (7.8%) |
| 15 to 19 Years | 56 (12.5%) | 38 (11.3%) |
| 20 to 24 Years | 69 (15.4%) | 48 (14.3%) |
| 25 to 29 Years | 25 (5.6%) | 11 (3.3%) |
| 30 to 34 Years | 12 (2.7%) | 23 (6.9%) |
| 35 to 39 Years | 12 (2.7%) | 6 (1.8%) |
| 40 to 44 Years | 24 (5.3%) | 7 (2.1%) |
| 45 to 49 Years | 10 (2.2%) | 27 (8.1%) |
| 50 to 54 Years | 43 (9.6%) | 38 (11.3%) |
| 55 to 59 Years | 18 (4.0%) | 18 (5.4%) |
| 60 to 64 Years | 38 (8.5%) | 9 (2.7%) |
| 65 to 69 Years | 4 (0.9%) | 5 (1.5%) |
| 70 to 74 Years | 2 (0.4%) | 19 (5.7%) |
| 75 to 79 Years | 30 (6.7%) | 14 (4.2%) |
| 80 to 84 Years | 3 (0.7%) | 11 (3.3%) |
| 85 Years and over | 3 (0.7%) | 5 (1.5%) |
| Total | 449 (100.0%) | 335 (100.0%) |
Families and Households in San Perlita
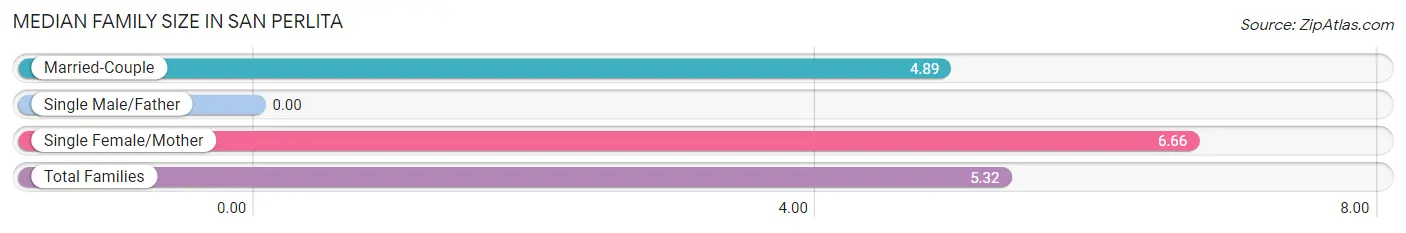
Median Family Size in San Perlita
| Family Type | # Families | Family Size |
| Married-Couple | 110 (75.9%) | 4.89 |
| Single Male/Father | 0 (0.0%) | - |
| Single Female/Mother | 35 (24.1%) | 6.66 |
| Total Families | 145 (100.0%) | 5.32 |
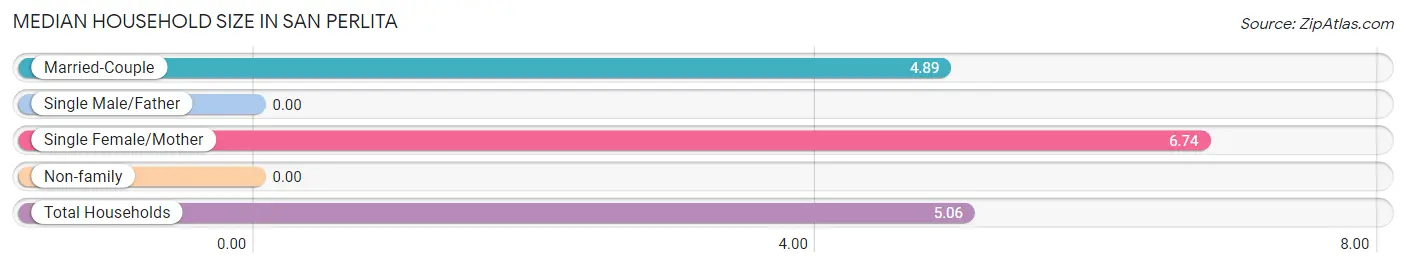
Median Household Size in San Perlita
| Household Type | # Households | Household Size |
| Married-Couple | 110 (71.0%) | 4.89 |
| Single Male/Father | 0 (0.0%) | - |
| Single Female/Mother | 35 (22.6%) | 6.74 |
| Non-family | 10 (6.5%) | - |
| Total Households | 155 (100.0%) | 5.06 |
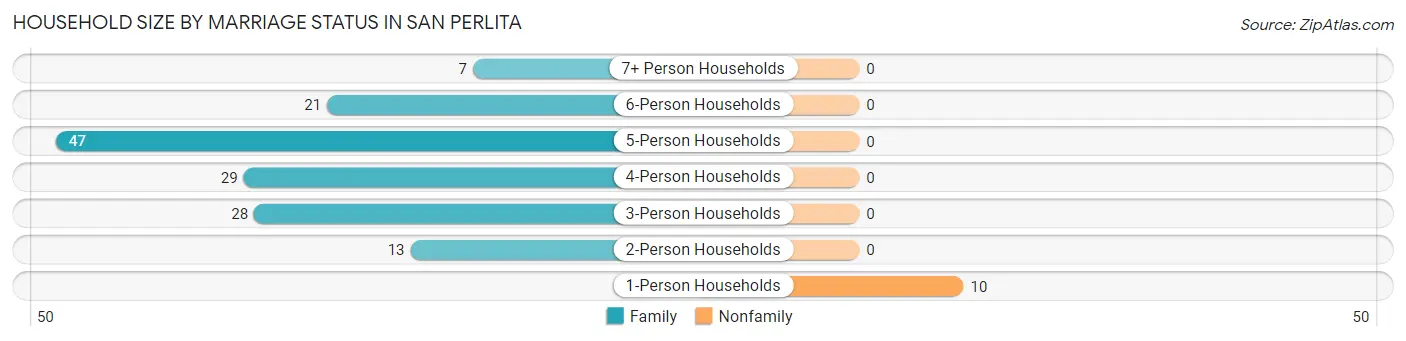
Household Size by Marriage Status in San Perlita
Out of a total of 155 households in San Perlita, 145 (93.5%) are family households, while 10 (6.5%) are nonfamily households. The most numerous type of family households are 5-person households, comprising 47, and the most common type of nonfamily households are 1-person households, comprising 10.
| Household Size | Family Households | Nonfamily Households |
| 1-Person Households | - | 10 (6.5%) |
| 2-Person Households | 13 (8.4%) | 0 (0.0%) |
| 3-Person Households | 28 (18.1%) | 0 (0.0%) |
| 4-Person Households | 29 (18.7%) | 0 (0.0%) |
| 5-Person Households | 47 (30.3%) | 0 (0.0%) |
| 6-Person Households | 21 (13.6%) | 0 (0.0%) |
| 7+ Person Households | 7 (4.5%) | 0 (0.0%) |
| Total | 145 (93.5%) | 10 (6.5%) |
Female Fertility in San Perlita
Fertility by Age in San Perlita
Average fertility rate in San Perlita is 175.0 births per 1,000 women. Women in the age bracket of 20 to 34 years have the highest fertility rate with 341.0 births per 1,000 women. Women in the age bracket of 20 to 34 years acount for 100.0% of all women with births.
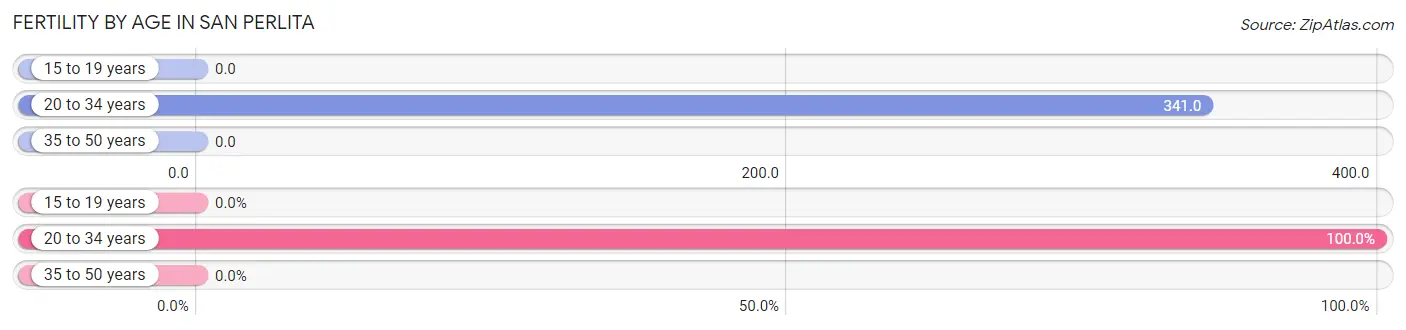
| Age Bracket | Women with Births | Births / 1,000 Women |
| 15 to 19 years | 0 (0.0%) | 0.0 |
| 20 to 34 years | 28 (100.0%) | 341.0 |
| 35 to 50 years | 0 (0.0%) | 0.0 |
| Total | 28 (100.0%) | 175.0 |
Fertility by Age by Marriage Status in San Perlita
25.0% of women with births (28) in San Perlita are married. The highest percentage of unmarried women with births falls into 20 to 34 years age bracket with 75.0% of them unmarried at the time of birth, while the lowest percentage of unmarried women with births belong to 20 to 34 years age bracket with 75.0% of them unmarried.
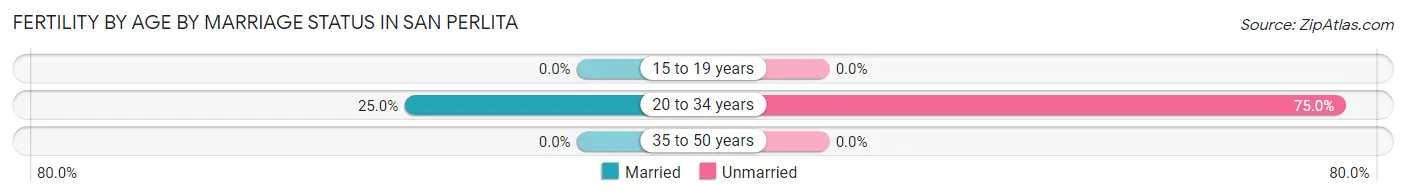
| Age Bracket | Married | Unmarried |
| 15 to 19 years | 0 (0.0%) | 0 (0.0%) |
| 20 to 34 years | 7 (25.0%) | 21 (75.0%) |
| 35 to 50 years | 0 (0.0%) | 0 (0.0%) |
| Total | 7 (25.0%) | 21 (75.0%) |
Fertility by Education in San Perlita
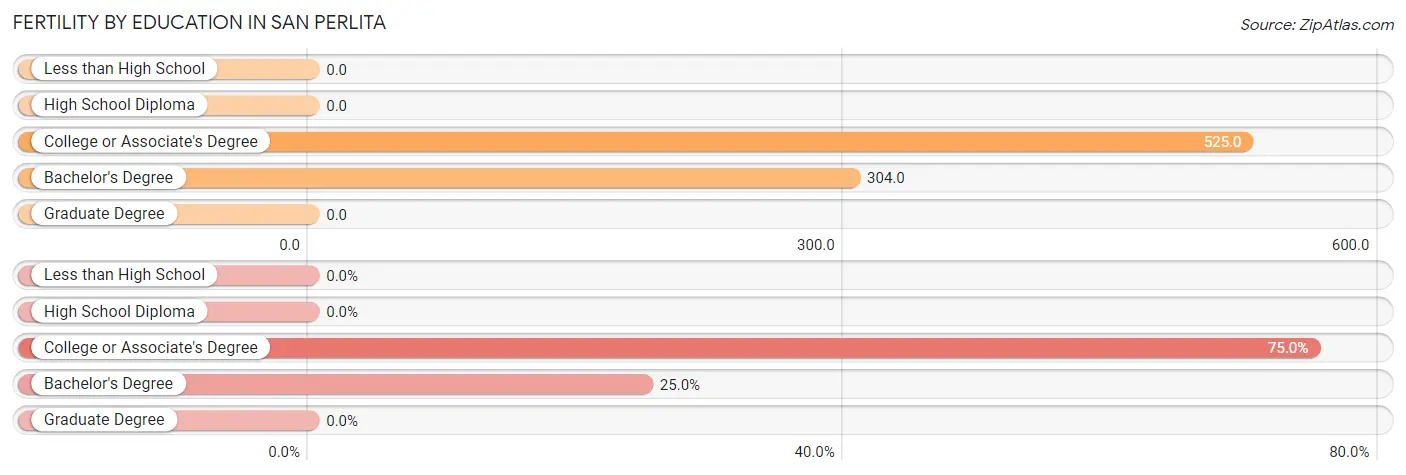
| Educational Attainment | Women with Births | Births / 1,000 Women |
| Less than High School | 0 (0.0%) | 0.0 |
| High School Diploma | 0 (0.0%) | 0.0 |
| College or Associate's Degree | 21 (75.0%) | 525.0 |
| Bachelor's Degree | 7 (25.0%) | 304.0 |
| Graduate Degree | 0 (0.0%) | 0.0 |
| Total | 28 (100.0%) | 175.0 |
Fertility by Education by Marriage Status in San Perlita
75.0% of women with births in San Perlita are unmarried. Women with the educational attainment of bachelor's degree are most likely to be married with 100.0% of them married at childbirth, while women with the educational attainment of college or associate's degree are least likely to be married with 100.0% of them unmarried at childbirth.
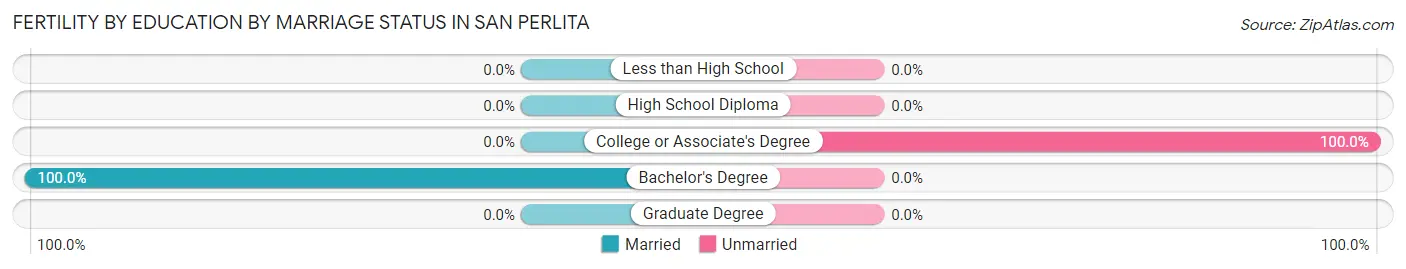
| Educational Attainment | Married | Unmarried |
| Less than High School | 0 (0.0%) | 0 (0.0%) |
| High School Diploma | 0 (0.0%) | 0 (0.0%) |
| College or Associate's Degree | 0 (0.0%) | 21 (100.0%) |
| Bachelor's Degree | 7 (100.0%) | 0 (0.0%) |
| Graduate Degree | 0 (0.0%) | 0 (0.0%) |
| Total | 7 (25.0%) | 21 (75.0%) |
Income in San Perlita
Income Overview in San Perlita
Per Capita Income in San Perlita is $13,695, while median incomes of families and households are $31,719 and $30,156 respectively.
| Characteristic | Number | Measure |
| Per Capita Income | 784 | $13,695 |
| Median Family Income | 145 | $31,719 |
| Mean Family Income | 145 | $56,164 |
| Median Household Income | 155 | $30,156 |
| Mean Household Income | 155 | $54,038 |
| Income Deficit | 145 | $0 |
| Wage / Income Gap (%) | 784 | 38.47% |
| Wage / Income Gap ($) | 784 | 61.53¢ per $1 |
| Gini / Inequality Index | 784 | 0.41 |
Earnings by Sex in San Perlita
Average Earnings in San Perlita are $28,173, $29,455 for men and $18,125 for women, a difference of 38.5%.
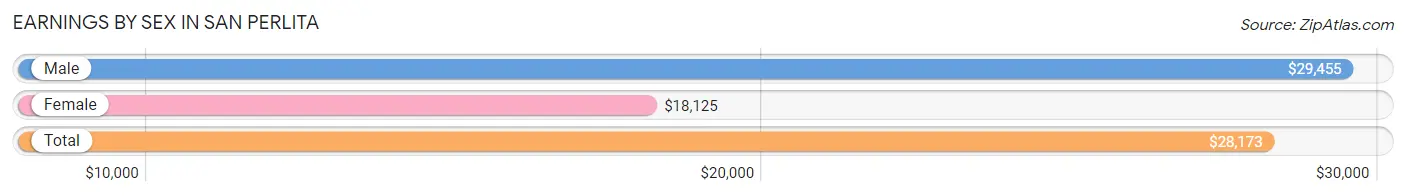
| Sex | Number | Average Earnings |
| Male | 163 (58.8%) | $29,455 |
| Female | 114 (41.2%) | $18,125 |
| Total | 277 (100.0%) | $28,173 |
Earnings by Sex by Income Bracket in San Perlita
The most common earnings brackets in San Perlita are $25,000 to $29,999 for men (39 | 23.9%) and $12,500 to $14,999 for women (24 | 21.0%).
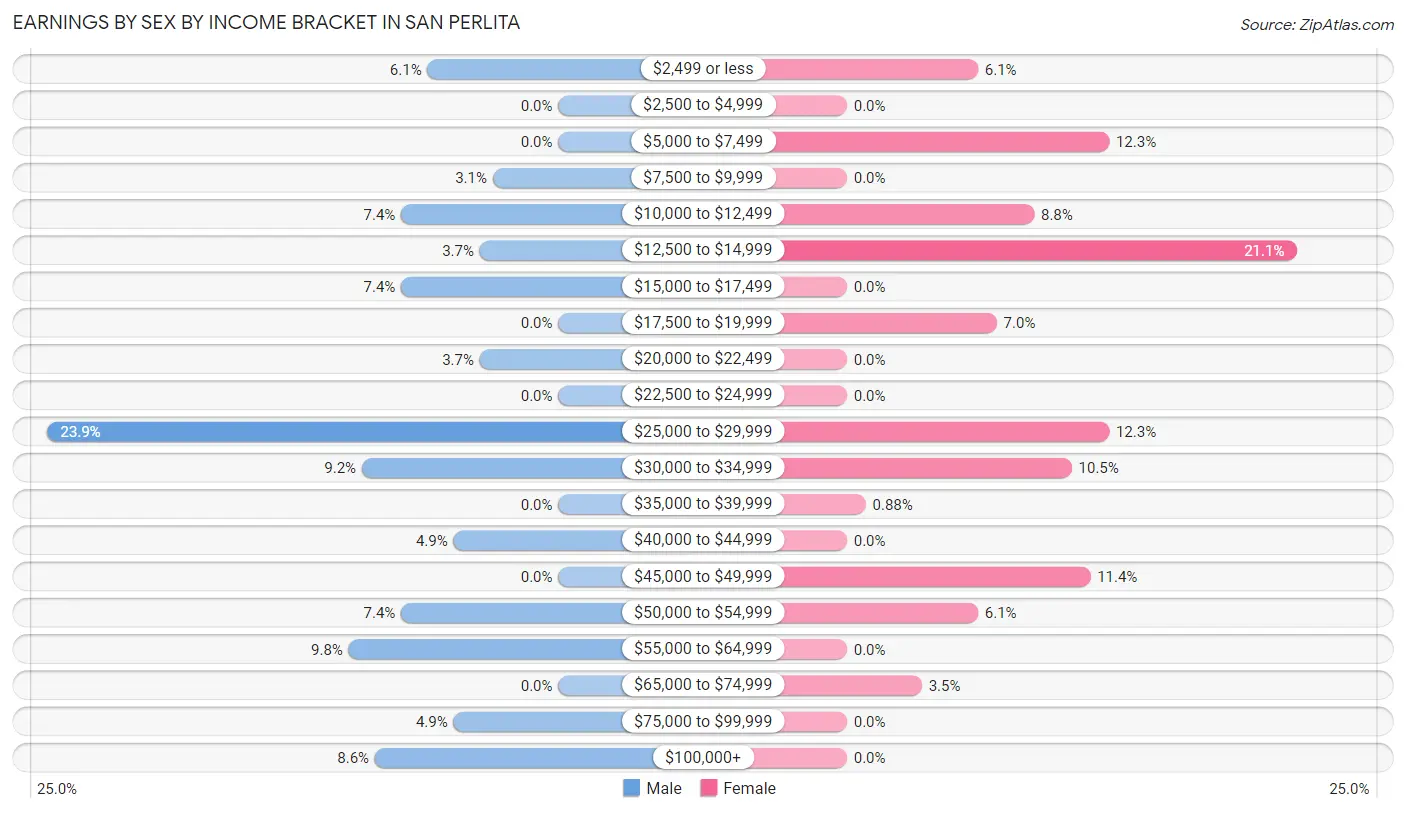
| Income | Male | Female |
| $2,499 or less | 10 (6.1%) | 7 (6.1%) |
| $2,500 to $4,999 | 0 (0.0%) | 0 (0.0%) |
| $5,000 to $7,499 | 0 (0.0%) | 14 (12.3%) |
| $7,500 to $9,999 | 5 (3.1%) | 0 (0.0%) |
| $10,000 to $12,499 | 12 (7.4%) | 10 (8.8%) |
| $12,500 to $14,999 | 6 (3.7%) | 24 (21.0%) |
| $15,000 to $17,499 | 12 (7.4%) | 0 (0.0%) |
| $17,500 to $19,999 | 0 (0.0%) | 8 (7.0%) |
| $20,000 to $22,499 | 6 (3.7%) | 0 (0.0%) |
| $22,500 to $24,999 | 0 (0.0%) | 0 (0.0%) |
| $25,000 to $29,999 | 39 (23.9%) | 14 (12.3%) |
| $30,000 to $34,999 | 15 (9.2%) | 12 (10.5%) |
| $35,000 to $39,999 | 0 (0.0%) | 1 (0.9%) |
| $40,000 to $44,999 | 8 (4.9%) | 0 (0.0%) |
| $45,000 to $49,999 | 0 (0.0%) | 13 (11.4%) |
| $50,000 to $54,999 | 12 (7.4%) | 7 (6.1%) |
| $55,000 to $64,999 | 16 (9.8%) | 0 (0.0%) |
| $65,000 to $74,999 | 0 (0.0%) | 4 (3.5%) |
| $75,000 to $99,999 | 8 (4.9%) | 0 (0.0%) |
| $100,000+ | 14 (8.6%) | 0 (0.0%) |
| Total | 163 (100.0%) | 114 (100.0%) |
Earnings by Sex by Educational Attainment in San Perlita
Average earnings in San Perlita are $29,968 for men and $26,696 for women, a difference of 10.9%. Men with an educational attainment of college or associate's degree enjoy the highest average annual earnings of $105,568, while those with college or associate's degree education earn the least with $105,568. Women with an educational attainment of bachelor's degree earn the most with the average annual earnings of $52,813, while those with college or associate's degree education have the smallest earnings of $26,875.
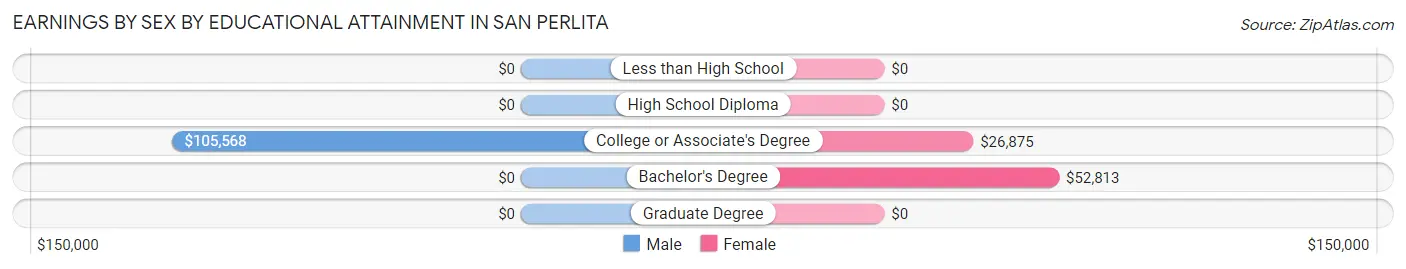
| Educational Attainment | Male Income | Female Income |
| Less than High School | - | - |
| High School Diploma | - | - |
| College or Associate's Degree | $105,568 | $26,875 |
| Bachelor's Degree | - | - |
| Graduate Degree | - | - |
| Total | $29,968 | $26,696 |
Family Income in San Perlita
Family Income Brackets in San Perlita
According to the San Perlita family income data, there are 61 families falling into the $25,000 to $34,999 income range, which is the most common income bracket and makes up 42.1% of all families.
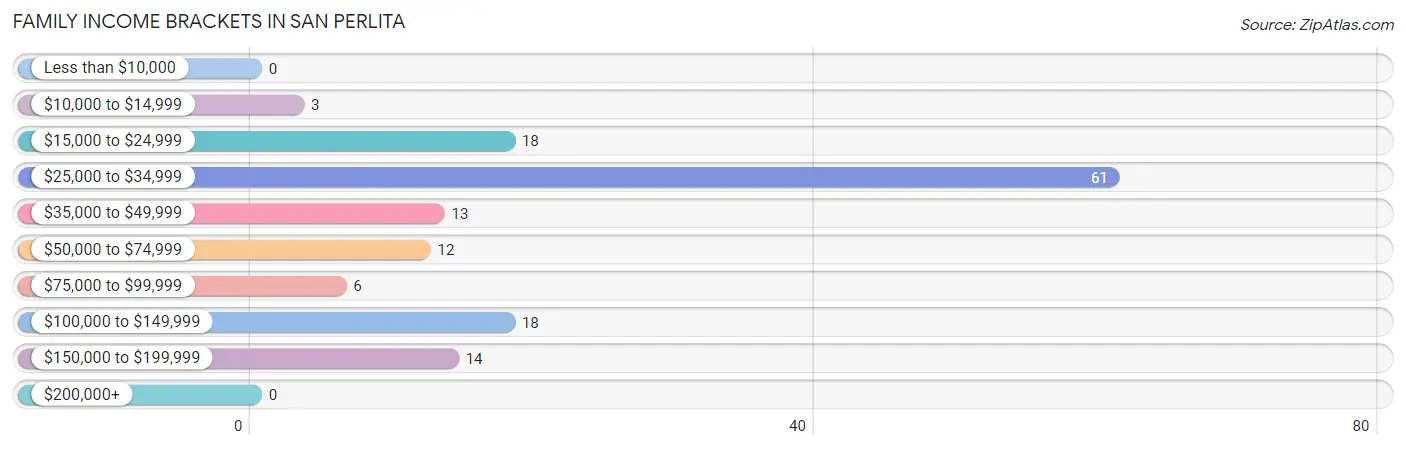
| Income Bracket | # Families | % Families |
| Less than $10,000 | 0 | 0.0% |
| $10,000 to $14,999 | 3 | 2.1% |
| $15,000 to $24,999 | 18 | 12.4% |
| $25,000 to $34,999 | 61 | 42.1% |
| $35,000 to $49,999 | 13 | 9.0% |
| $50,000 to $74,999 | 12 | 8.3% |
| $75,000 to $99,999 | 6 | 4.1% |
| $100,000 to $149,999 | 18 | 12.4% |
| $150,000 to $199,999 | 14 | 9.7% |
| $200,000+ | 0 | 0.0% |
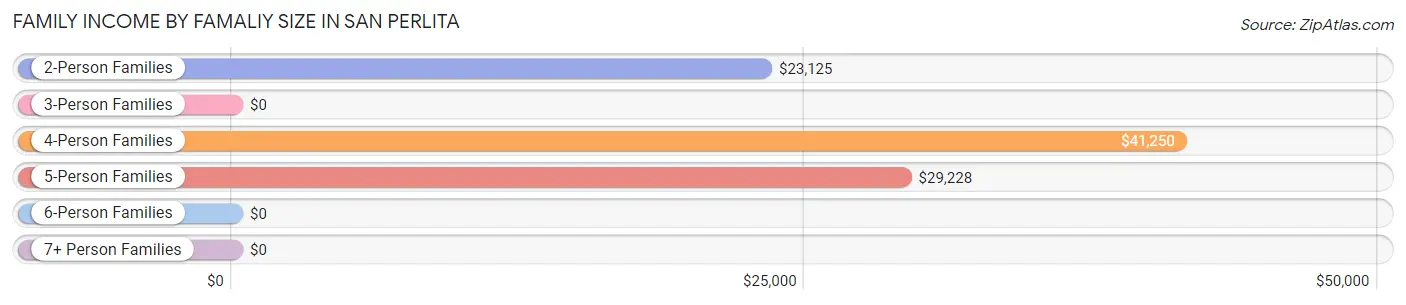
Family Income by Famaliy Size in San Perlita
4-person families (29 | 20.0%) account for the highest median family income in San Perlita with $41,250 per family, while 2-person families (13 | 9.0%) have the highest median income of $11,562 per family member.
| Income Bracket | # Families | Median Income |
| 2-Person Families | 13 (9.0%) | $23,125 |
| 3-Person Families | 28 (19.3%) | $0 |
| 4-Person Families | 29 (20.0%) | $41,250 |
| 5-Person Families | 47 (32.4%) | $29,228 |
| 6-Person Families | 24 (16.6%) | $0 |
| 7+ Person Families | 4 (2.8%) | $0 |
| Total | 145 (100.0%) | $31,719 |
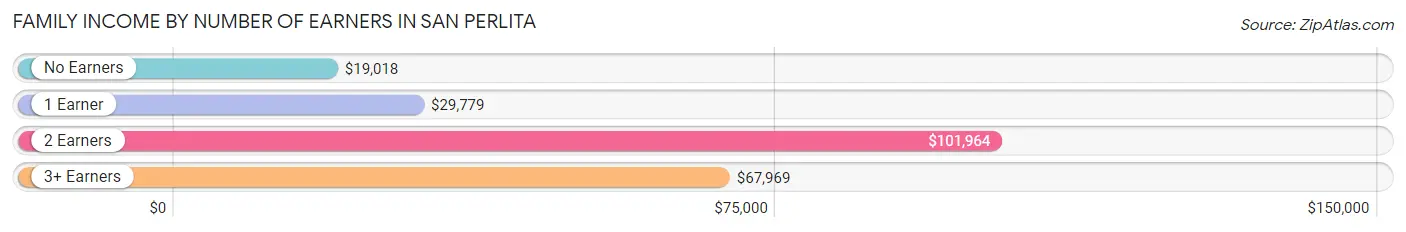
Family Income by Number of Earners in San Perlita
The median family income in San Perlita is $31,719, with families comprising 2 earners (47) having the highest median family income of $101,964, while families with no earners (23) have the lowest median family income of $19,018, accounting for 32.4% and 15.9% of families, respectively.
| Number of Earners | # Families | Median Income |
| No Earners | 23 (15.9%) | $19,018 |
| 1 Earner | 62 (42.8%) | $29,779 |
| 2 Earners | 47 (32.4%) | $101,964 |
| 3+ Earners | 13 (9.0%) | $67,969 |
| Total | 145 (100.0%) | $31,719 |
Household Income in San Perlita
Household Income Brackets in San Perlita
With 61 households falling in the category, the $25,000 to $34,999 income range is the most frequent in San Perlita, accounting for 39.4% of all households.
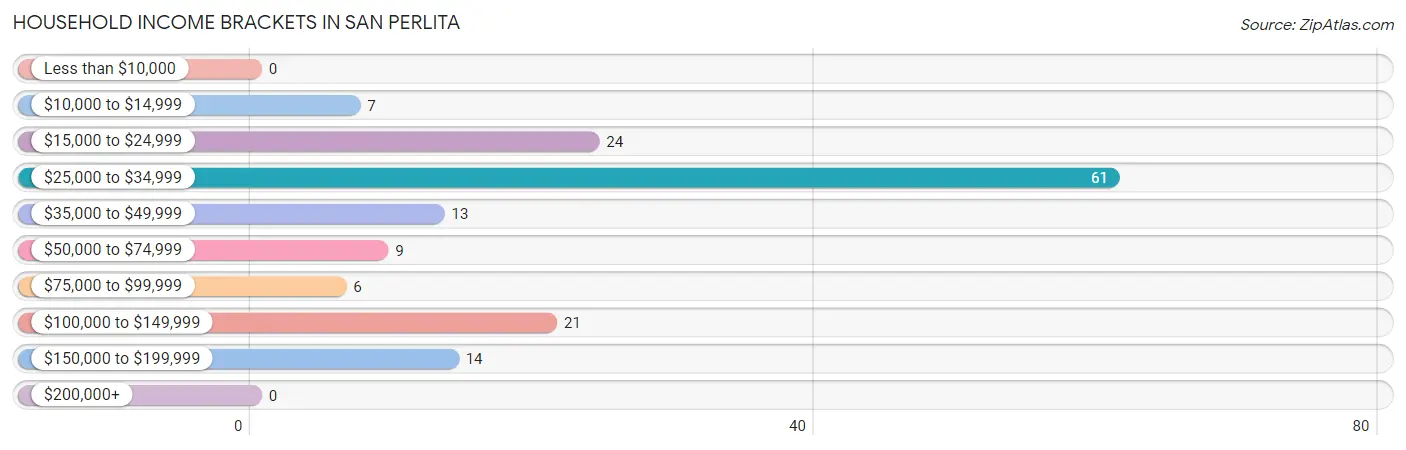
| Income Bracket | # Households | % Households |
| Less than $10,000 | 0 | 0.0% |
| $10,000 to $14,999 | 7 | 4.5% |
| $15,000 to $24,999 | 24 | 15.5% |
| $25,000 to $34,999 | 61 | 39.4% |
| $35,000 to $49,999 | 13 | 8.4% |
| $50,000 to $74,999 | 9 | 5.8% |
| $75,000 to $99,999 | 6 | 3.9% |
| $100,000 to $149,999 | 21 | 13.5% |
| $150,000 to $199,999 | 14 | 9.0% |
| $200,000+ | 0 | 0.0% |
Household Income by Householder Age in San Perlita
The median household income in San Perlita is $30,156, with the highest median household income of $30,313 found in the 65+ years age bracket for the primary householder. A total of 44 households (28.4%) fall into this category.
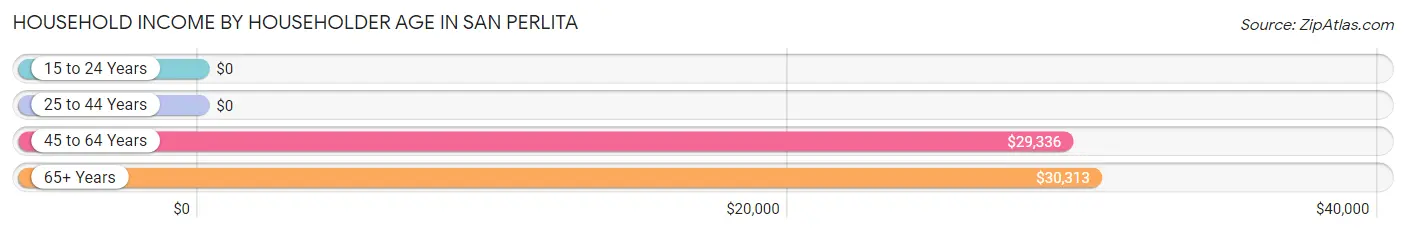
| Income Bracket | # Households | Median Income |
| 15 to 24 Years | 0 (0.0%) | $0 |
| 25 to 44 Years | 24 (15.5%) | $0 |
| 45 to 64 Years | 87 (56.1%) | $29,336 |
| 65+ Years | 44 (28.4%) | $30,313 |
| Total | 155 (100.0%) | $30,156 |
Poverty in San Perlita
Income Below Poverty by Sex and Age in San Perlita
With 55.0% poverty level for males and 46.0% for females among the residents of San Perlita, 12 to 14 year old males and 5 year old females are the most vulnerable to poverty, with 40 males (90.9%) and 4 females (100.0%) in their respective age groups living below the poverty level.
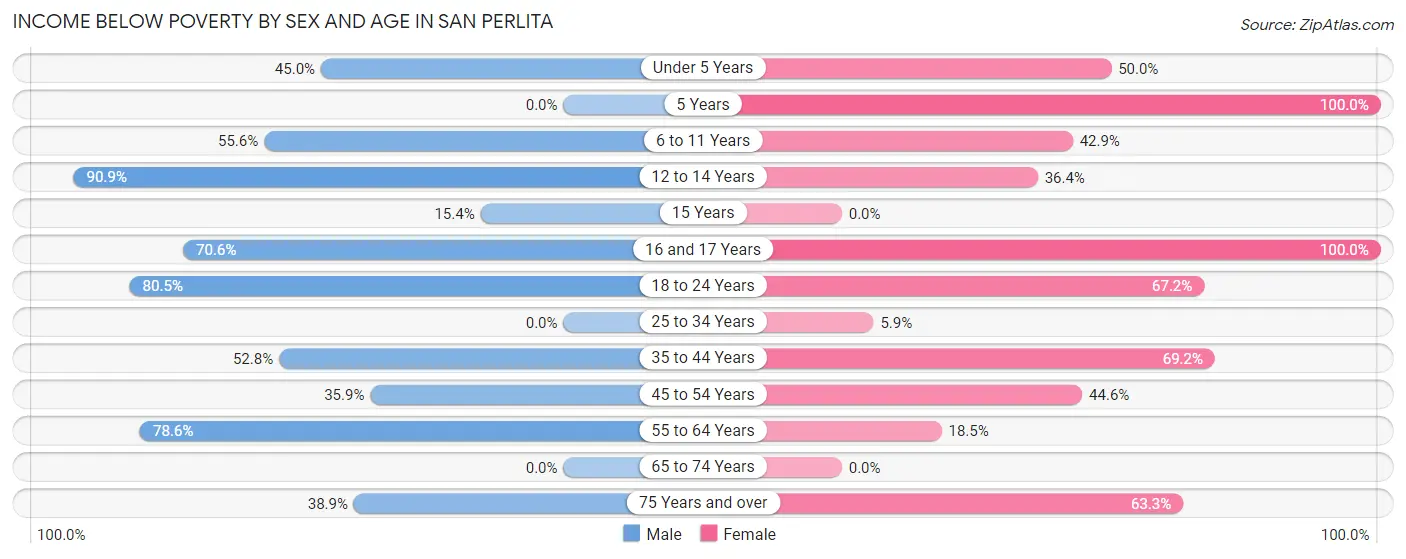
| Age Bracket | Male | Female |
| Under 5 Years | 9 (45.0%) | 8 (50.0%) |
| 5 Years | 0 (0.0%) | 4 (100.0%) |
| 6 to 11 Years | 20 (55.6%) | 6 (42.9%) |
| 12 to 14 Years | 40 (90.9%) | 8 (36.4%) |
| 15 Years | 4 (15.4%) | 0 (0.0%) |
| 16 and 17 Years | 12 (70.6%) | 25 (100.0%) |
| 18 to 24 Years | 66 (80.5%) | 39 (67.2%) |
| 25 to 34 Years | 0 (0.0%) | 2 (5.9%) |
| 35 to 44 Years | 19 (52.8%) | 9 (69.2%) |
| 45 to 54 Years | 19 (35.8%) | 29 (44.6%) |
| 55 to 64 Years | 44 (78.6%) | 5 (18.5%) |
| 65 to 74 Years | 0 (0.0%) | 0 (0.0%) |
| 75 Years and over | 14 (38.9%) | 19 (63.3%) |
| Total | 247 (55.0%) | 154 (46.0%) |
Income Above Poverty by Sex and Age in San Perlita
According to the poverty statistics in San Perlita, males aged 25 to 34 years and females aged 15 years are the age groups that are most secure financially, with 100.0% of males and 100.0% of females in these age groups living above the poverty line.
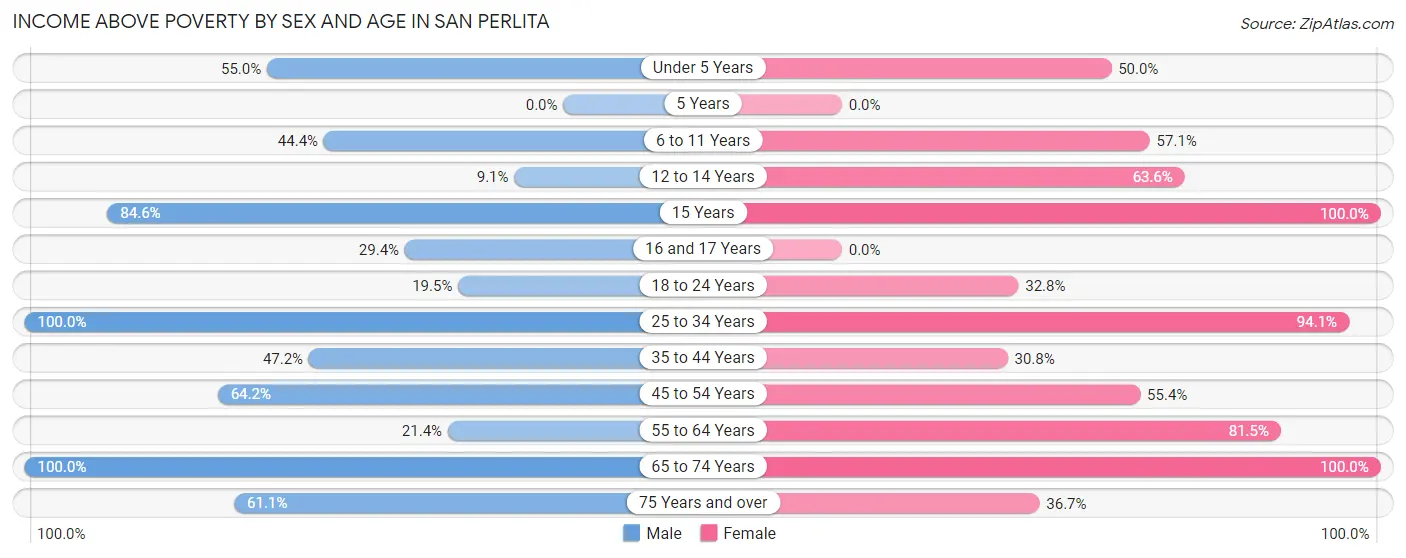
| Age Bracket | Male | Female |
| Under 5 Years | 11 (55.0%) | 8 (50.0%) |
| 5 Years | 0 (0.0%) | 0 (0.0%) |
| 6 to 11 Years | 16 (44.4%) | 8 (57.1%) |
| 12 to 14 Years | 4 (9.1%) | 14 (63.6%) |
| 15 Years | 22 (84.6%) | 3 (100.0%) |
| 16 and 17 Years | 5 (29.4%) | 0 (0.0%) |
| 18 to 24 Years | 16 (19.5%) | 19 (32.8%) |
| 25 to 34 Years | 37 (100.0%) | 32 (94.1%) |
| 35 to 44 Years | 17 (47.2%) | 4 (30.8%) |
| 45 to 54 Years | 34 (64.1%) | 36 (55.4%) |
| 55 to 64 Years | 12 (21.4%) | 22 (81.5%) |
| 65 to 74 Years | 6 (100.0%) | 24 (100.0%) |
| 75 Years and over | 22 (61.1%) | 11 (36.7%) |
| Total | 202 (45.0%) | 181 (54.0%) |
Income Below Poverty Among Married-Couple Families in San Perlita
The poverty statistics for married-couple families in San Perlita show that 60.9% or 67 of the total 110 families live below the poverty line. Families with 3 or 4 children have the highest poverty rate of 100.0%, comprising of 2 families. On the other hand, families with 5 or more children have the lowest poverty rate of 0.0%, which includes 0 families.
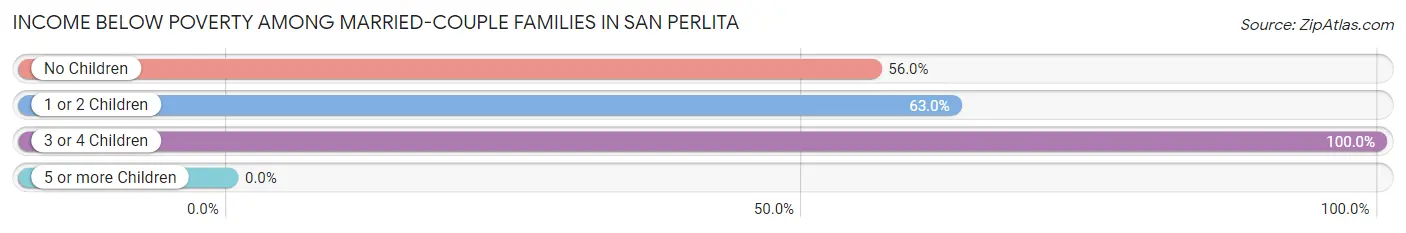
| Children | Above Poverty | Below Poverty |
| No Children | 11 (44.0%) | 14 (56.0%) |
| 1 or 2 Children | 30 (37.0%) | 51 (63.0%) |
| 3 or 4 Children | 0 (0.0%) | 2 (100.0%) |
| 5 or more Children | 2 (100.0%) | 0 (0.0%) |
| Total | 43 (39.1%) | 67 (60.9%) |
Income Below Poverty Among Single-Parent Households in San Perlita
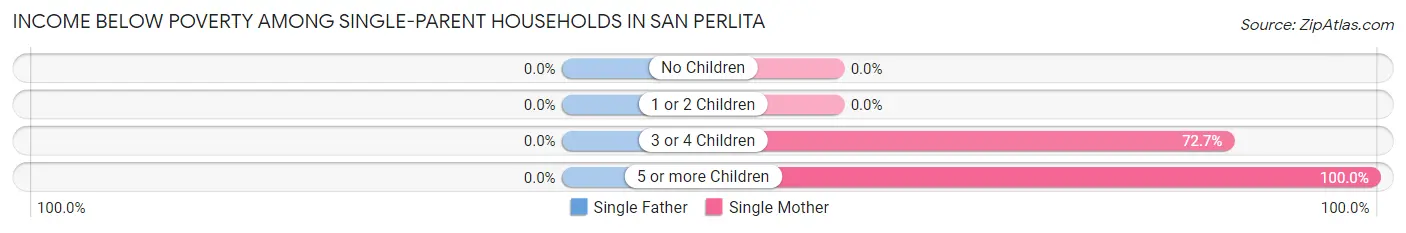
| Children | Single Father | Single Mother |
| No Children | 0 (0.0%) | 0 (0.0%) |
| 1 or 2 Children | 0 (0.0%) | 0 (0.0%) |
| 3 or 4 Children | 0 (0.0%) | 8 (72.7%) |
| 5 or more Children | 0 (0.0%) | 2 (100.0%) |
| Total | 0 (0.0%) | 10 (28.6%) |
Income Below Poverty Among Married-Couple vs Single-Parent Households in San Perlita
The poverty data for San Perlita shows that 67 of the married-couple family households (60.9%) and 10 of the single-parent households (28.6%) are living below the poverty level. Within the married-couple family households, those with 3 or 4 children have the highest poverty rate, with 2 households (100.0%) falling below the poverty line. Among the single-parent households, those with 5 or more children have the highest poverty rate, with 2 household (100.0%) living below poverty.
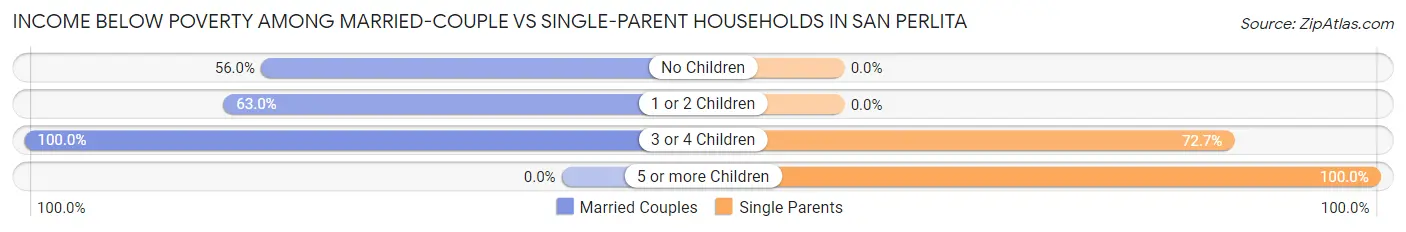
| Children | Married-Couple Families | Single-Parent Households |
| No Children | 14 (56.0%) | 0 (0.0%) |
| 1 or 2 Children | 51 (63.0%) | 0 (0.0%) |
| 3 or 4 Children | 2 (100.0%) | 8 (72.7%) |
| 5 or more Children | 0 (0.0%) | 2 (100.0%) |
| Total | 67 (60.9%) | 10 (28.6%) |
Employment Characteristics in San Perlita
Employment by Class of Employer in San Perlita
Among the 277 employed individuals in San Perlita, private company employees (120 | 43.3%), local government employees (73 | 26.4%), and self-employed (not incorporated) (30 | 10.8%) make up the most common classes of employment.
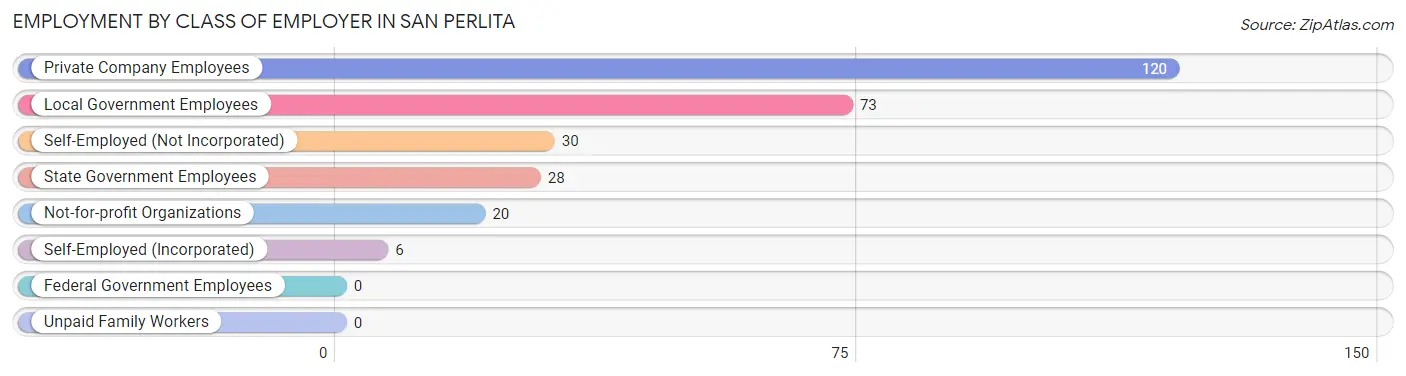
| Employer Class | # Employees | % Employees |
| Private Company Employees | 120 | 43.3% |
| Self-Employed (Incorporated) | 6 | 2.2% |
| Self-Employed (Not Incorporated) | 30 | 10.8% |
| Not-for-profit Organizations | 20 | 7.2% |
| Local Government Employees | 73 | 26.4% |
| State Government Employees | 28 | 10.1% |
| Federal Government Employees | 0 | 0.0% |
| Unpaid Family Workers | 0 | 0.0% |
| Total | 277 | 100.0% |
Employment Status by Age in San Perlita
According to the labor force statistics for San Perlita, out of the total population over 16 years of age (599), 49.1% or 294 individuals are in the labor force, with 5.8% or 17 of them unemployed. The age group with the highest labor force participation rate is 30 to 34 years, with 100.0% or 35 individuals in the labor force. Within the labor force, the 30 to 34 years age range has the highest percentage of unemployed individuals, with 34.3% or 12 of them being unemployed.
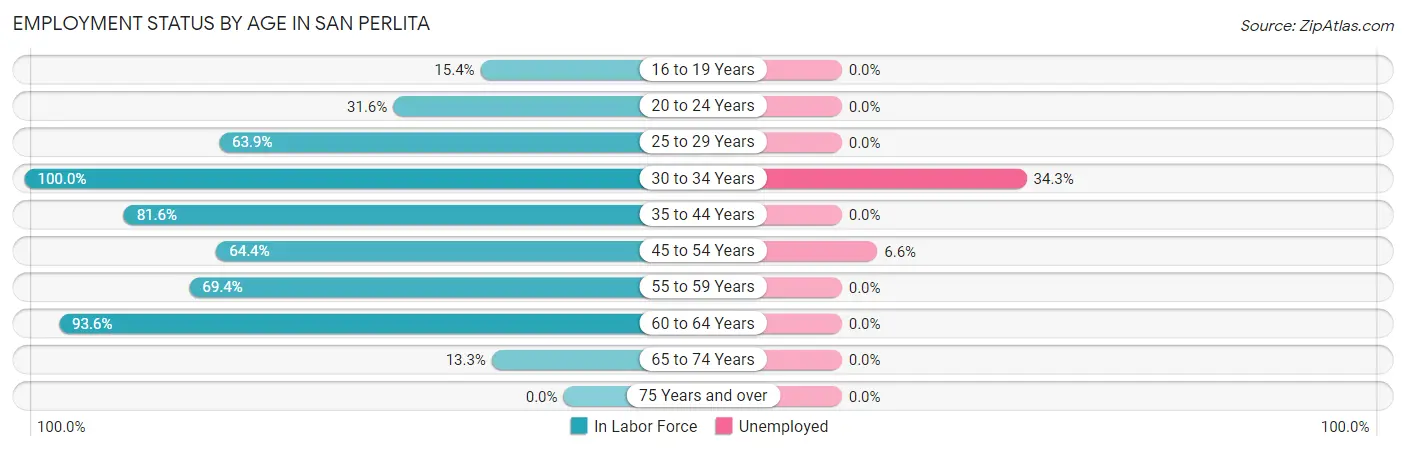
| Age Bracket | In Labor Force | Unemployed |
| 16 to 19 Years | 10 (15.4%) | 0 (0.0%) |
| 20 to 24 Years | 37 (31.6%) | 0 (0.0%) |
| 25 to 29 Years | 23 (63.9%) | 0 (0.0%) |
| 30 to 34 Years | 35 (100.0%) | 12 (34.3%) |
| 35 to 44 Years | 40 (81.6%) | 0 (0.0%) |
| 45 to 54 Years | 76 (64.4%) | 5 (6.6%) |
| 55 to 59 Years | 25 (69.4%) | 0 (0.0%) |
| 60 to 64 Years | 44 (93.6%) | 0 (0.0%) |
| 65 to 74 Years | 4 (13.3%) | 0 (0.0%) |
| 75 Years and over | 0 (0.0%) | 0 (0.0%) |
| Total | 294 (49.1%) | 17 (5.8%) |
Employment Status by Educational Attainment in San Perlita
According to labor force statistics for San Perlita, 75.7% of individuals (243) out of the total population between 25 and 64 years of age (321) are in the labor force, with 7.0% or 17 of them being unemployed. The group with the highest labor force participation rate are those with the educational attainment of bachelor's degree or higher, with 95.5% or 42 individuals in the labor force. Within the labor force, individuals with bachelor's degree or higher education have the highest percentage of unemployment, with 23.8% or 10 of them being unemployed.
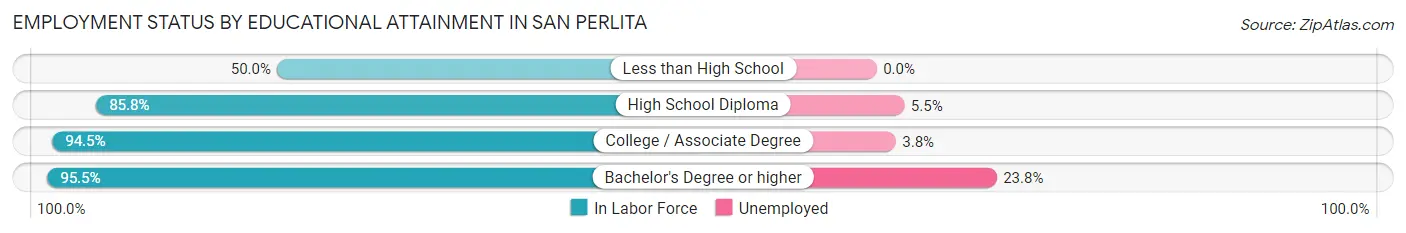
| Educational Attainment | In Labor Force | Unemployed |
| Less than High School | 58 (50.0%) | 0 (0.0%) |
| High School Diploma | 91 (85.8%) | 6 (5.5%) |
| College / Associate Degree | 52 (94.5%) | 2 (3.8%) |
| Bachelor's Degree or higher | 42 (95.5%) | 10 (23.8%) |
| Total | 243 (75.7%) | 22 (7.0%) |
Employment Occupations by Sex in San Perlita
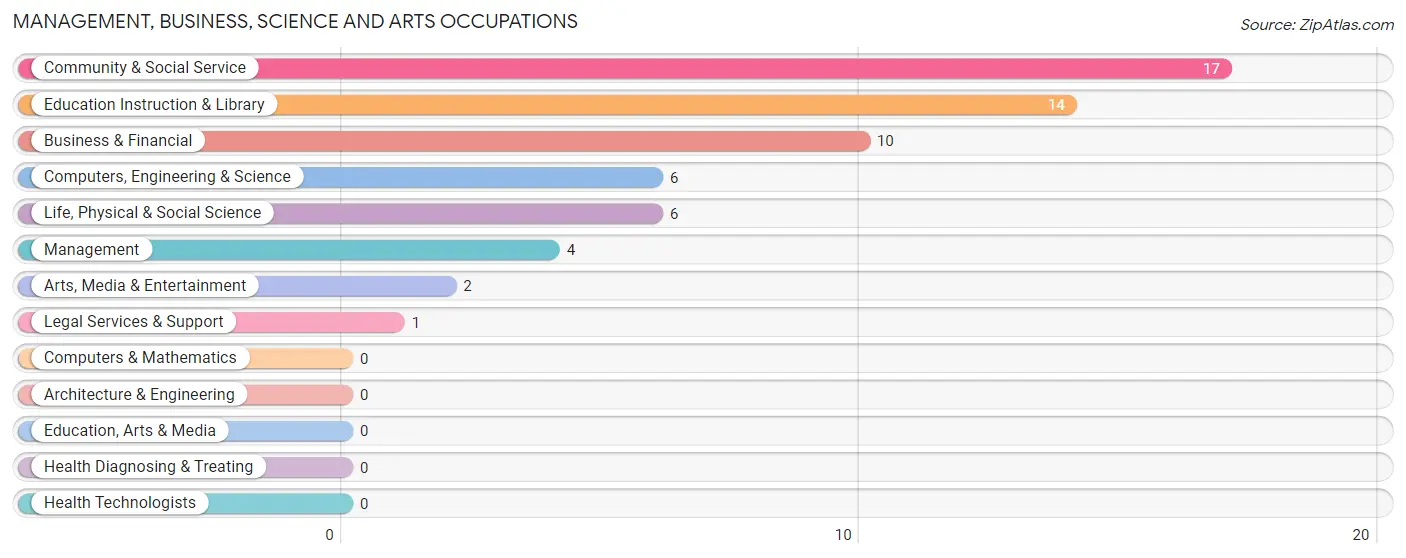
Management, Business, Science and Arts Occupations
The most common Management, Business, Science and Arts occupations in San Perlita are Community & Social Service (17 | 6.1%), Education Instruction & Library (14 | 5.1%), Business & Financial (10 | 3.6%), Computers, Engineering & Science (6 | 2.2%), and Life, Physical & Social Science (6 | 2.2%).
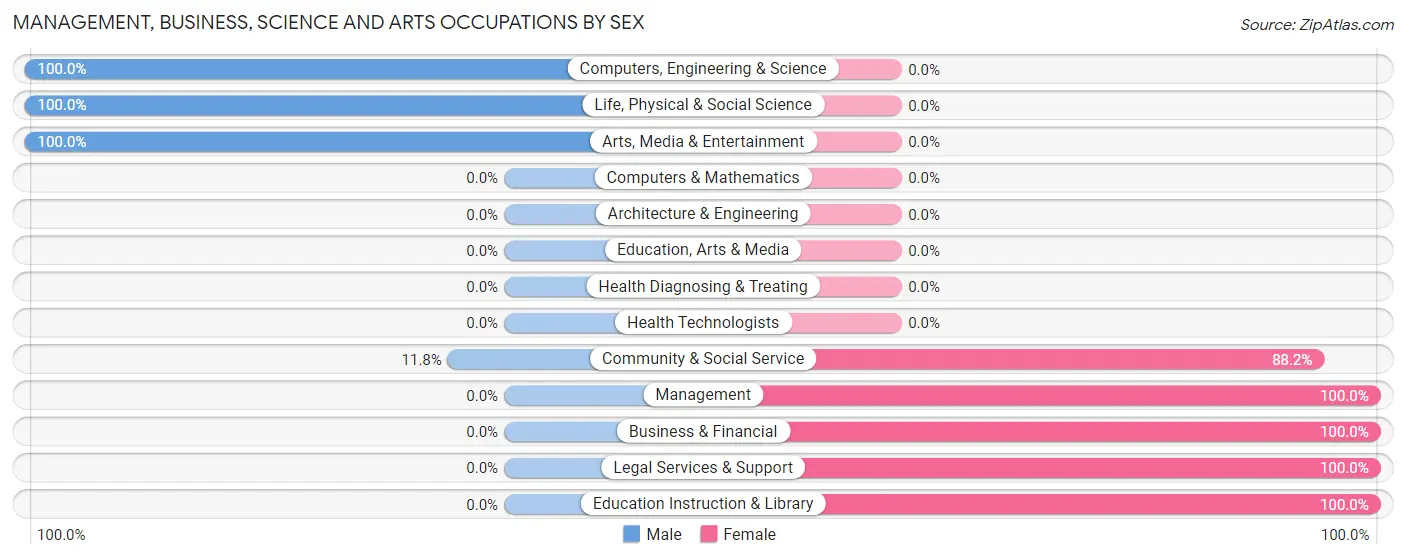
Management, Business, Science and Arts Occupations by Sex
Within the Management, Business, Science and Arts occupations in San Perlita, the most male-oriented occupations are Computers, Engineering & Science (100.0%), Life, Physical & Social Science (100.0%), and Arts, Media & Entertainment (100.0%), while the most female-oriented occupations are Management (100.0%), Business & Financial (100.0%), and Legal Services & Support (100.0%).
| Occupation | Male | Female |
| Management | 0 (0.0%) | 4 (100.0%) |
| Business & Financial | 0 (0.0%) | 10 (100.0%) |
| Computers, Engineering & Science | 6 (100.0%) | 0 (0.0%) |
| Computers & Mathematics | 0 (0.0%) | 0 (0.0%) |
| Architecture & Engineering | 0 (0.0%) | 0 (0.0%) |
| Life, Physical & Social Science | 6 (100.0%) | 0 (0.0%) |
| Community & Social Service | 2 (11.8%) | 15 (88.2%) |
| Education, Arts & Media | 0 (0.0%) | 0 (0.0%) |
| Legal Services & Support | 0 (0.0%) | 1 (100.0%) |
| Education Instruction & Library | 0 (0.0%) | 14 (100.0%) |
| Arts, Media & Entertainment | 2 (100.0%) | 0 (0.0%) |
| Health Diagnosing & Treating | 0 (0.0%) | 0 (0.0%) |
| Health Technologists | 0 (0.0%) | 0 (0.0%) |
| Total (Category) | 8 (21.6%) | 29 (78.4%) |
| Total (Overall) | 163 (58.8%) | 114 (41.2%) |
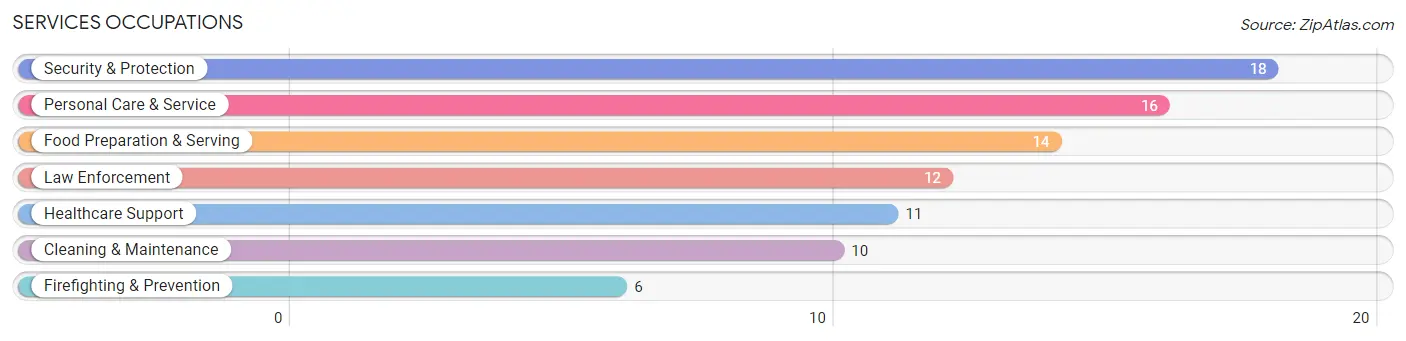
Services Occupations
The most common Services occupations in San Perlita are Security & Protection (18 | 6.5%), Personal Care & Service (16 | 5.8%), Food Preparation & Serving (14 | 5.1%), Law Enforcement (12 | 4.3%), and Healthcare Support (11 | 4.0%).
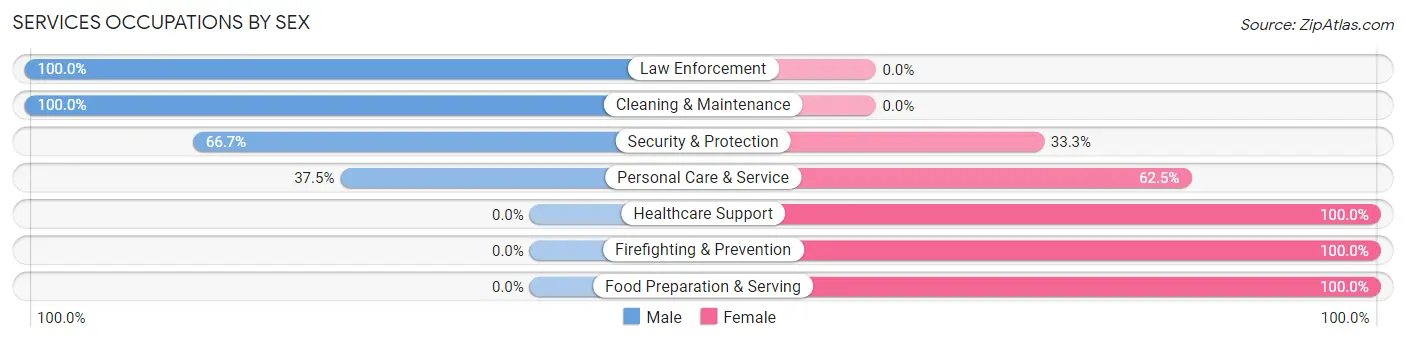
Services Occupations by Sex
Within the Services occupations in San Perlita, the most male-oriented occupations are Law Enforcement (100.0%), Cleaning & Maintenance (100.0%), and Security & Protection (66.7%), while the most female-oriented occupations are Healthcare Support (100.0%), Firefighting & Prevention (100.0%), and Food Preparation & Serving (100.0%).
| Occupation | Male | Female |
| Healthcare Support | 0 (0.0%) | 11 (100.0%) |
| Security & Protection | 12 (66.7%) | 6 (33.3%) |
| Firefighting & Prevention | 0 (0.0%) | 6 (100.0%) |
| Law Enforcement | 12 (100.0%) | 0 (0.0%) |
| Food Preparation & Serving | 0 (0.0%) | 14 (100.0%) |
| Cleaning & Maintenance | 10 (100.0%) | 0 (0.0%) |
| Personal Care & Service | 6 (37.5%) | 10 (62.5%) |
| Total (Category) | 28 (40.6%) | 41 (59.4%) |
| Total (Overall) | 163 (58.8%) | 114 (41.2%) |
Sales and Office Occupations
The most common Sales and Office occupations in San Perlita are Office & Administration (39 | 14.1%), and Sales & Related (21 | 7.6%).
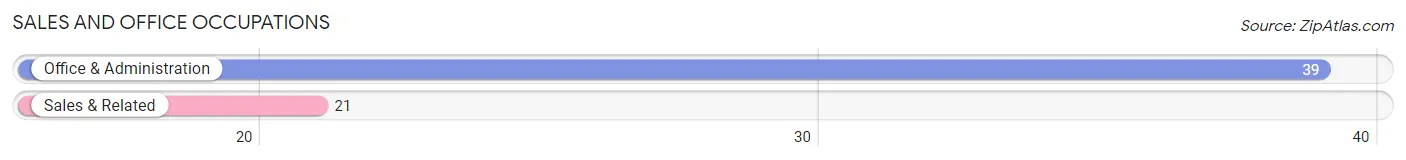
Sales and Office Occupations by Sex
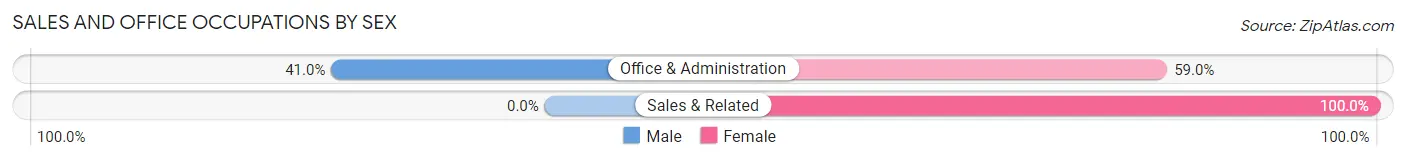
| Occupation | Male | Female |
| Sales & Related | 0 (0.0%) | 21 (100.0%) |
| Office & Administration | 16 (41.0%) | 23 (59.0%) |
| Total (Category) | 16 (26.7%) | 44 (73.3%) |
| Total (Overall) | 163 (58.8%) | 114 (41.2%) |
Natural Resources, Construction and Maintenance Occupations
The most common Natural Resources, Construction and Maintenance occupations in San Perlita are Construction & Extraction (51 | 18.4%), Farming, Fishing & Forestry (6 | 2.2%), and Installation, Maintenance & Repair (3 | 1.1%).
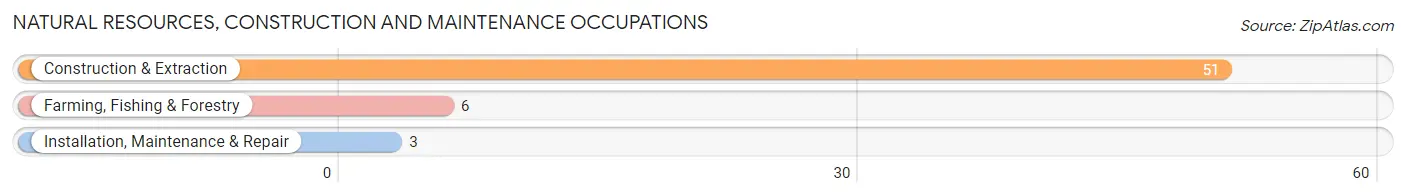
Natural Resources, Construction and Maintenance Occupations by Sex
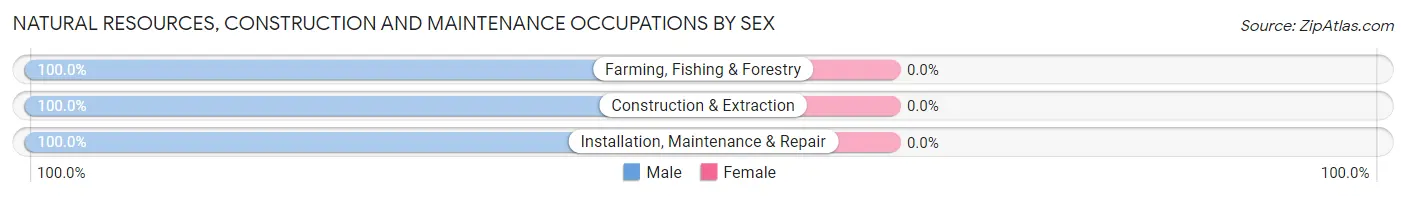
| Occupation | Male | Female |
| Farming, Fishing & Forestry | 6 (100.0%) | 0 (0.0%) |
| Construction & Extraction | 51 (100.0%) | 0 (0.0%) |
| Installation, Maintenance & Repair | 3 (100.0%) | 0 (0.0%) |
| Total (Category) | 60 (100.0%) | 0 (0.0%) |
| Total (Overall) | 163 (58.8%) | 114 (41.2%) |
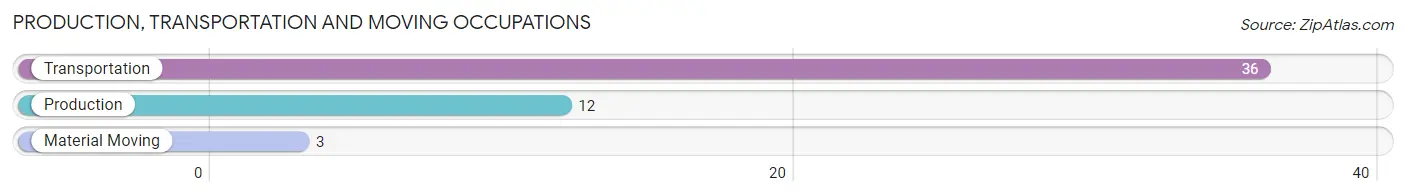
Production, Transportation and Moving Occupations
The most common Production, Transportation and Moving occupations in San Perlita are Transportation (36 | 13.0%), Production (12 | 4.3%), and Material Moving (3 | 1.1%).
Production, Transportation and Moving Occupations by Sex
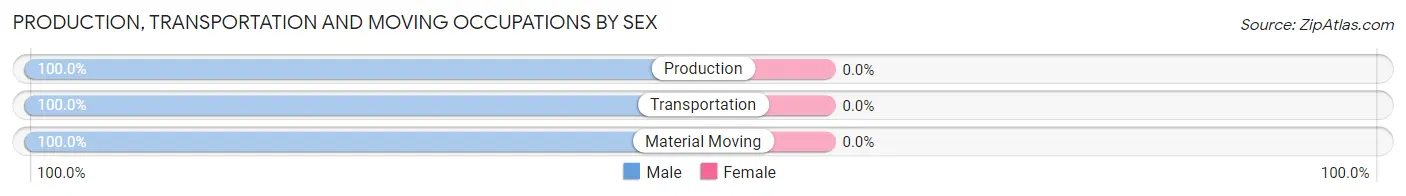
| Occupation | Male | Female |
| Production | 12 (100.0%) | 0 (0.0%) |
| Transportation | 36 (100.0%) | 0 (0.0%) |
| Material Moving | 3 (100.0%) | 0 (0.0%) |
| Total (Category) | 51 (100.0%) | 0 (0.0%) |
| Total (Overall) | 163 (58.8%) | 114 (41.2%) |
Employment Industries by Sex in San Perlita
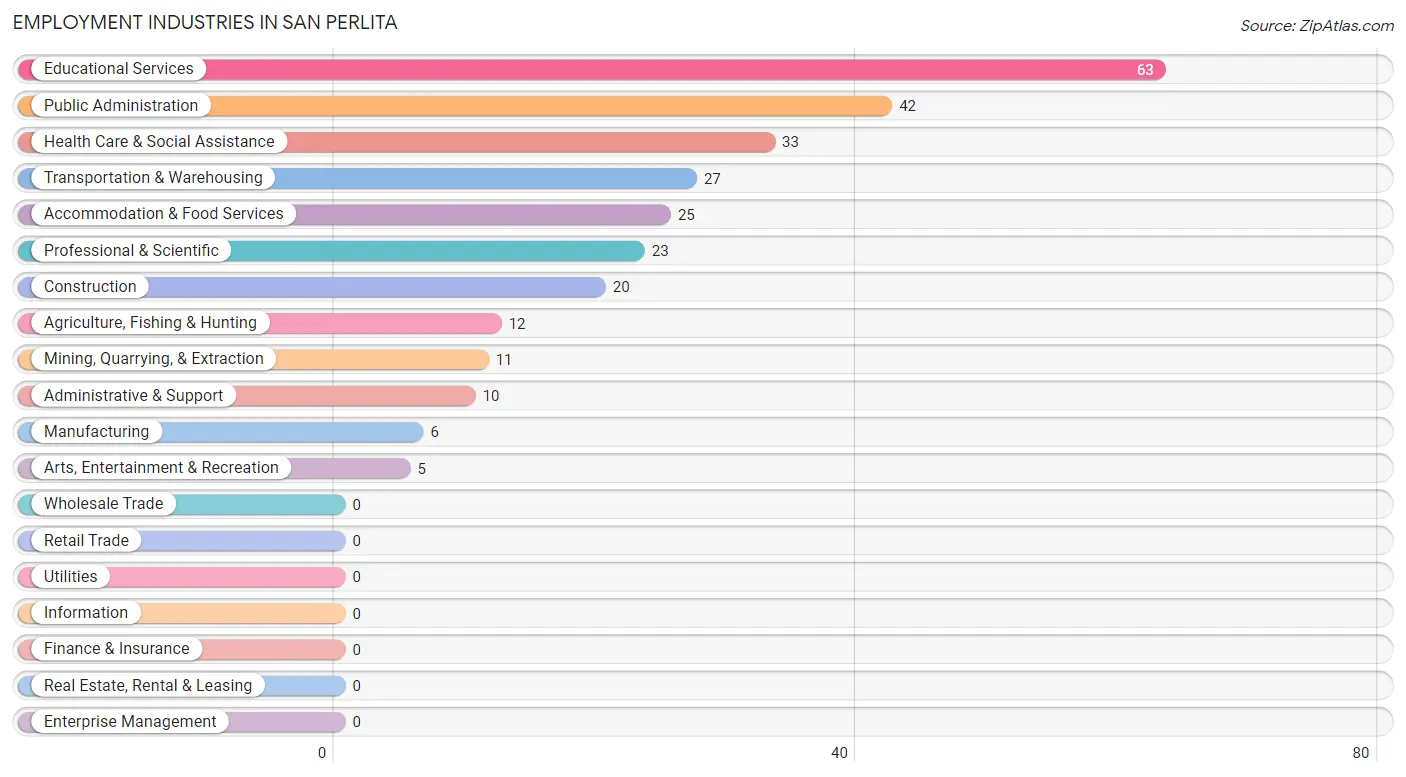
Employment Industries in San Perlita
The major employment industries in San Perlita include Educational Services (63 | 22.7%), Public Administration (42 | 15.2%), Health Care & Social Assistance (33 | 11.9%), Transportation & Warehousing (27 | 9.8%), and Accommodation & Food Services (25 | 9.0%).
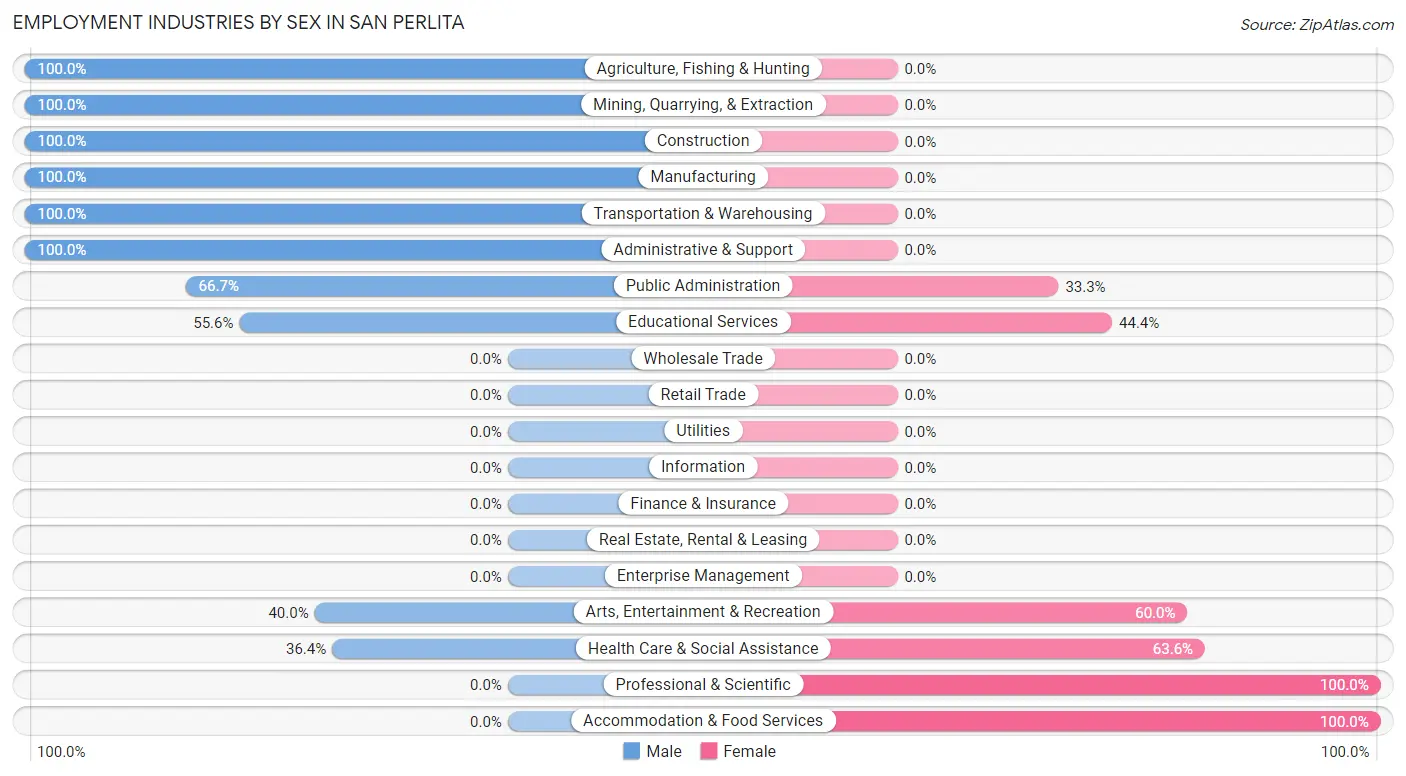
Employment Industries by Sex in San Perlita
The San Perlita industries that see more men than women are Agriculture, Fishing & Hunting (100.0%), Mining, Quarrying, & Extraction (100.0%), and Construction (100.0%), whereas the industries that tend to have a higher number of women are Professional & Scientific (100.0%), Accommodation & Food Services (100.0%), and Health Care & Social Assistance (63.6%).
| Industry | Male | Female |
| Agriculture, Fishing & Hunting | 12 (100.0%) | 0 (0.0%) |
| Mining, Quarrying, & Extraction | 11 (100.0%) | 0 (0.0%) |
| Construction | 20 (100.0%) | 0 (0.0%) |
| Manufacturing | 6 (100.0%) | 0 (0.0%) |
| Wholesale Trade | 0 (0.0%) | 0 (0.0%) |
| Retail Trade | 0 (0.0%) | 0 (0.0%) |
| Transportation & Warehousing | 27 (100.0%) | 0 (0.0%) |
| Utilities | 0 (0.0%) | 0 (0.0%) |
| Information | 0 (0.0%) | 0 (0.0%) |
| Finance & Insurance | 0 (0.0%) | 0 (0.0%) |
| Real Estate, Rental & Leasing | 0 (0.0%) | 0 (0.0%) |
| Professional & Scientific | 0 (0.0%) | 23 (100.0%) |
| Enterprise Management | 0 (0.0%) | 0 (0.0%) |
| Administrative & Support | 10 (100.0%) | 0 (0.0%) |
| Educational Services | 35 (55.6%) | 28 (44.4%) |
| Health Care & Social Assistance | 12 (36.4%) | 21 (63.6%) |
| Arts, Entertainment & Recreation | 2 (40.0%) | 3 (60.0%) |
| Accommodation & Food Services | 0 (0.0%) | 25 (100.0%) |
| Public Administration | 28 (66.7%) | 14 (33.3%) |
| Total | 163 (58.8%) | 114 (41.2%) |
Education in San Perlita
School Enrollment in San Perlita
The most common levels of schooling among the 274 students in San Perlita are high school (101 | 36.9%), middle school (71 | 25.9%), and college / undergraduate (62 | 22.6%).
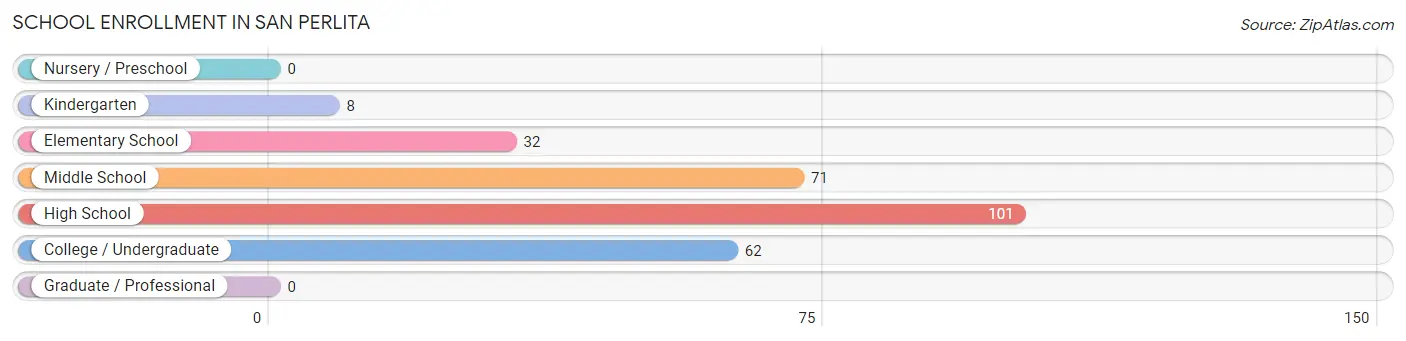
| School Level | # Students | % Students |
| Nursery / Preschool | 0 | 0.0% |
| Kindergarten | 8 | 2.9% |
| Elementary School | 32 | 11.7% |
| Middle School | 71 | 25.9% |
| High School | 101 | 36.9% |
| College / Undergraduate | 62 | 22.6% |
| Graduate / Professional | 0 | 0.0% |
| Total | 274 | 100.0% |
School Enrollment by Age by Funding Source in San Perlita
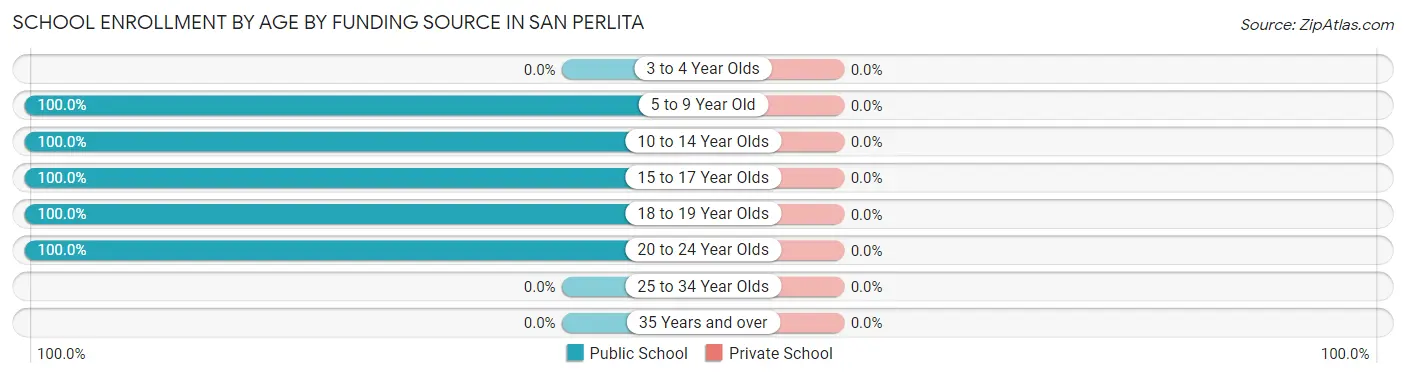
| Age Bracket | Public School | Private School |
| 3 to 4 Year Olds | 0 (0.0%) | 0 (0.0%) |
| 5 to 9 Year Old | 33 (100.0%) | 0 (0.0%) |
| 10 to 14 Year Olds | 87 (100.0%) | 0 (0.0%) |
| 15 to 17 Year Olds | 71 (100.0%) | 0 (0.0%) |
| 18 to 19 Year Olds | 3 (100.0%) | 0 (0.0%) |
| 20 to 24 Year Olds | 80 (100.0%) | 0 (0.0%) |
| 25 to 34 Year Olds | 0 (0.0%) | 0 (0.0%) |
| 35 Years and over | 0 (0.0%) | 0 (0.0%) |
| Total | 274 (100.0%) | 0 (0.0%) |
Educational Attainment by Field of Study in San Perlita
Bio, nature & agricultural (19 | 43.2%), communications (10 | 22.7%), education (9 | 20.4%), and business (6 | 13.6%) are the most common fields of study among 44 individuals in San Perlita who have obtained a bachelor's degree or higher.
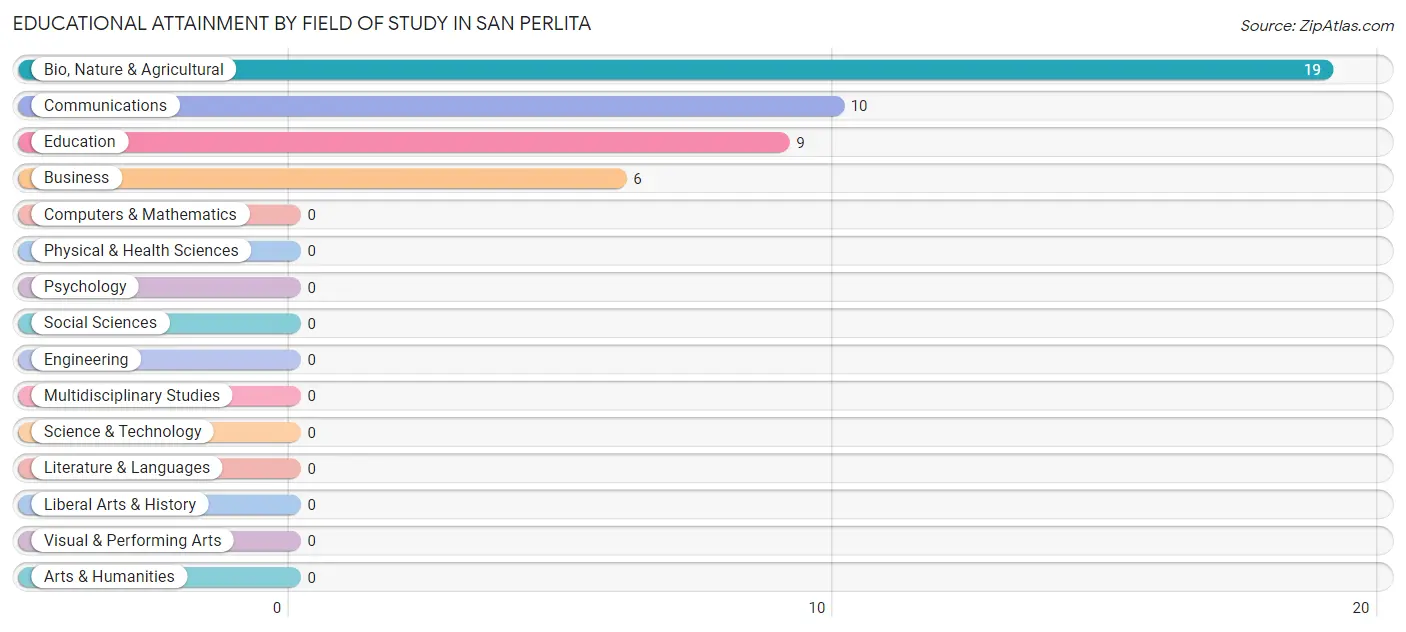
| Field of Study | # Graduates | % Graduates |
| Computers & Mathematics | 0 | 0.0% |
| Bio, Nature & Agricultural | 19 | 43.2% |
| Physical & Health Sciences | 0 | 0.0% |
| Psychology | 0 | 0.0% |
| Social Sciences | 0 | 0.0% |
| Engineering | 0 | 0.0% |
| Multidisciplinary Studies | 0 | 0.0% |
| Science & Technology | 0 | 0.0% |
| Business | 6 | 13.6% |
| Education | 9 | 20.4% |
| Literature & Languages | 0 | 0.0% |
| Liberal Arts & History | 0 | 0.0% |
| Visual & Performing Arts | 0 | 0.0% |
| Communications | 10 | 22.7% |
| Arts & Humanities | 0 | 0.0% |
| Total | 44 | 100.0% |
Transportation & Commute in San Perlita
Vehicle Availability by Sex in San Perlita
The most prevalent vehicle ownership categories in San Perlita are males with 2 vehicles (53, accounting for 32.5%) and females with 2 vehicles (54, making up 46.5%).
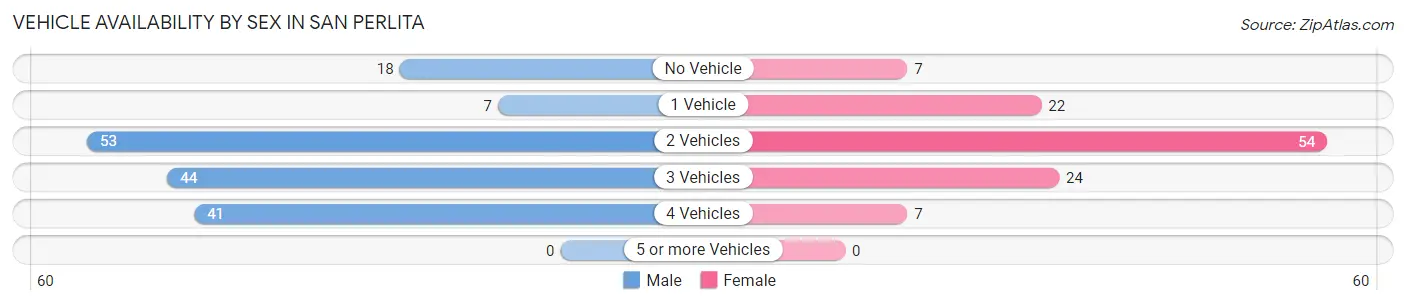
| Vehicles Available | Male | Female |
| No Vehicle | 18 (11.0%) | 7 (6.1%) |
| 1 Vehicle | 7 (4.3%) | 22 (19.3%) |
| 2 Vehicles | 53 (32.5%) | 54 (47.4%) |
| 3 Vehicles | 44 (27.0%) | 24 (21.0%) |
| 4 Vehicles | 41 (25.2%) | 7 (6.1%) |
| 5 or more Vehicles | 0 (0.0%) | 0 (0.0%) |
| Total | 163 (100.0%) | 114 (100.0%) |
Commute Time in San Perlita
The most frequently occuring commute durations in San Perlita are 30 to 34 minutes (68 commuters, 25.0%), 10 to 14 minutes (55 commuters, 20.2%), and 15 to 19 minutes (49 commuters, 18.0%).
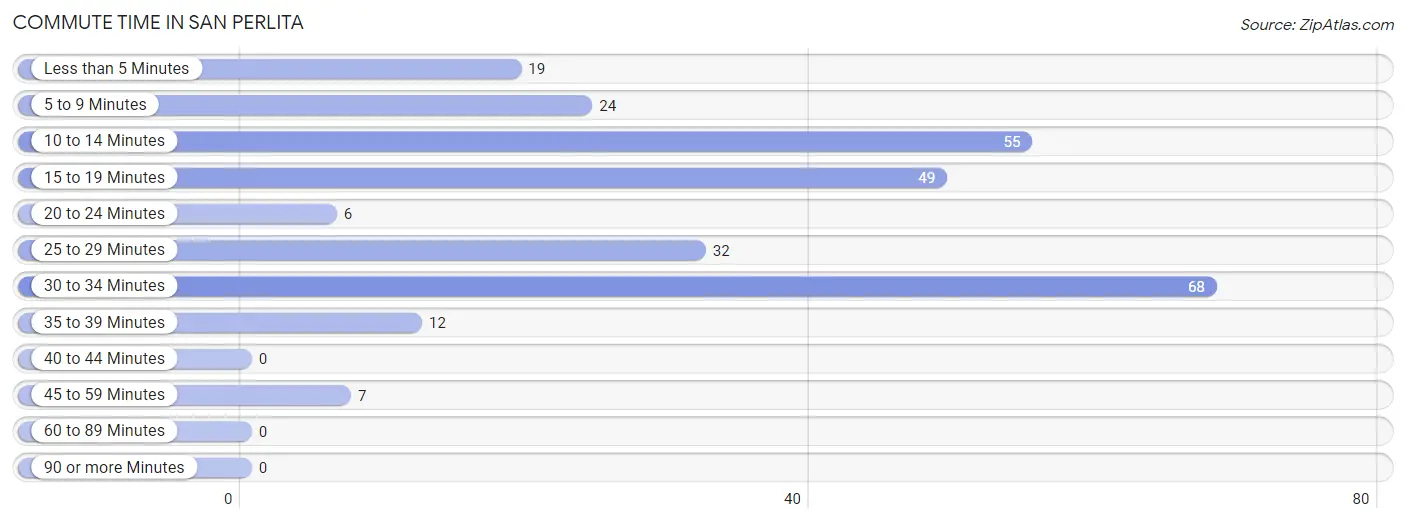
| Commute Time | # Commuters | % Commuters |
| Less than 5 Minutes | 19 | 7.0% |
| 5 to 9 Minutes | 24 | 8.8% |
| 10 to 14 Minutes | 55 | 20.2% |
| 15 to 19 Minutes | 49 | 18.0% |
| 20 to 24 Minutes | 6 | 2.2% |
| 25 to 29 Minutes | 32 | 11.8% |
| 30 to 34 Minutes | 68 | 25.0% |
| 35 to 39 Minutes | 12 | 4.4% |
| 40 to 44 Minutes | 0 | 0.0% |
| 45 to 59 Minutes | 7 | 2.6% |
| 60 to 89 Minutes | 0 | 0.0% |
| 90 or more Minutes | 0 | 0.0% |
Commute Time by Sex in San Perlita
The most common commute times in San Perlita are 30 to 34 minutes (50 commuters, 30.7%) for males and 10 to 14 minutes (31 commuters, 28.4%) for females.
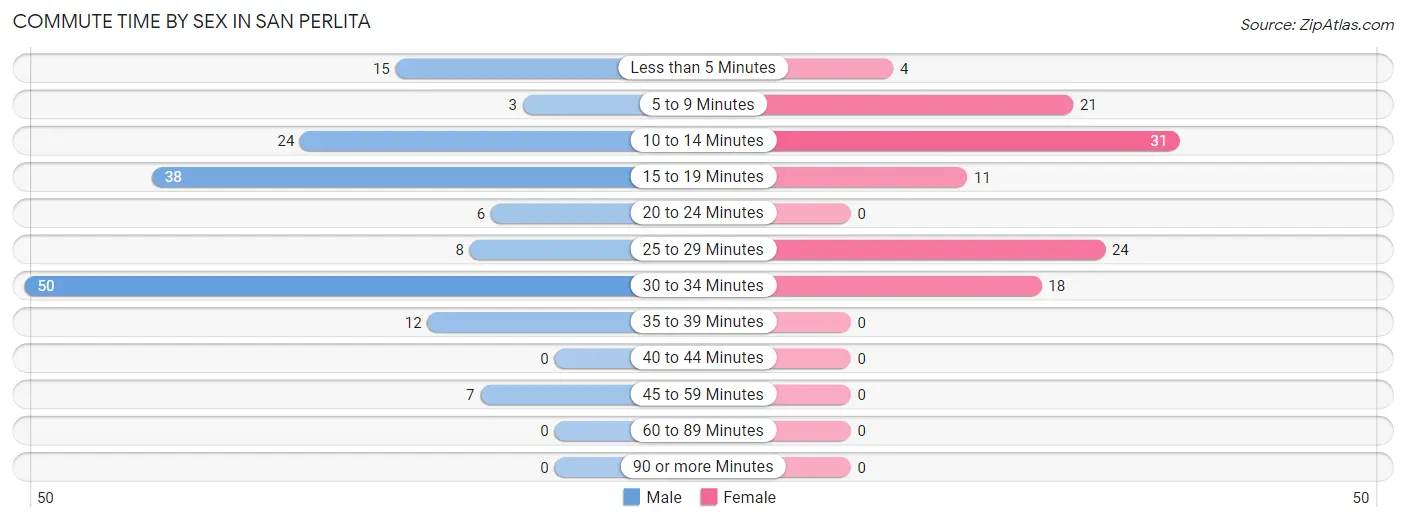
| Commute Time | Male | Female |
| Less than 5 Minutes | 15 (9.2%) | 4 (3.7%) |
| 5 to 9 Minutes | 3 (1.8%) | 21 (19.3%) |
| 10 to 14 Minutes | 24 (14.7%) | 31 (28.4%) |
| 15 to 19 Minutes | 38 (23.3%) | 11 (10.1%) |
| 20 to 24 Minutes | 6 (3.7%) | 0 (0.0%) |
| 25 to 29 Minutes | 8 (4.9%) | 24 (22.0%) |
| 30 to 34 Minutes | 50 (30.7%) | 18 (16.5%) |
| 35 to 39 Minutes | 12 (7.4%) | 0 (0.0%) |
| 40 to 44 Minutes | 0 (0.0%) | 0 (0.0%) |
| 45 to 59 Minutes | 7 (4.3%) | 0 (0.0%) |
| 60 to 89 Minutes | 0 (0.0%) | 0 (0.0%) |
| 90 or more Minutes | 0 (0.0%) | 0 (0.0%) |
Time of Departure to Work by Sex in San Perlita
The most frequent times of departure to work in San Perlita are 8:00 AM to 8:29 AM (48, 29.4%) for males and 8:00 AM to 8:29 AM (36, 33.0%) for females.
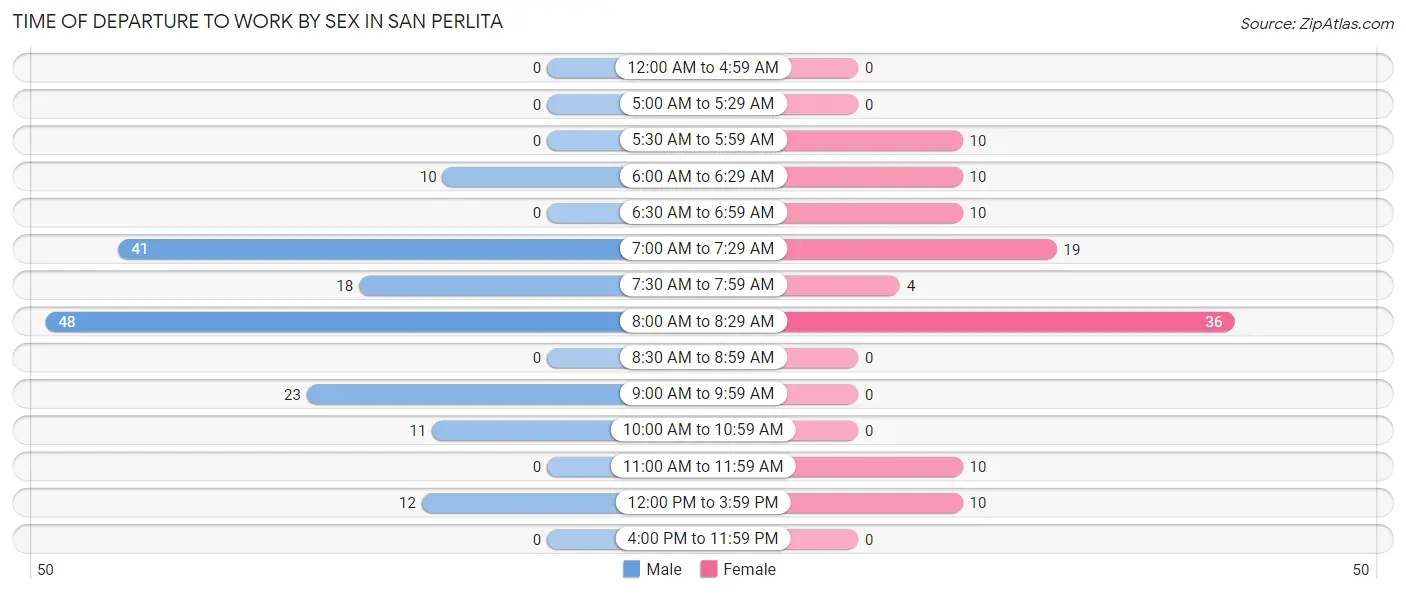
| Time of Departure | Male | Female |
| 12:00 AM to 4:59 AM | 0 (0.0%) | 0 (0.0%) |
| 5:00 AM to 5:29 AM | 0 (0.0%) | 0 (0.0%) |
| 5:30 AM to 5:59 AM | 0 (0.0%) | 10 (9.2%) |
| 6:00 AM to 6:29 AM | 10 (6.1%) | 10 (9.2%) |
| 6:30 AM to 6:59 AM | 0 (0.0%) | 10 (9.2%) |
| 7:00 AM to 7:29 AM | 41 (25.2%) | 19 (17.4%) |
| 7:30 AM to 7:59 AM | 18 (11.0%) | 4 (3.7%) |
| 8:00 AM to 8:29 AM | 48 (29.4%) | 36 (33.0%) |
| 8:30 AM to 8:59 AM | 0 (0.0%) | 0 (0.0%) |
| 9:00 AM to 9:59 AM | 23 (14.1%) | 0 (0.0%) |
| 10:00 AM to 10:59 AM | 11 (6.8%) | 0 (0.0%) |
| 11:00 AM to 11:59 AM | 0 (0.0%) | 10 (9.2%) |
| 12:00 PM to 3:59 PM | 12 (7.4%) | 10 (9.2%) |
| 4:00 PM to 11:59 PM | 0 (0.0%) | 0 (0.0%) |
| Total | 163 (100.0%) | 109 (100.0%) |
Housing Occupancy in San Perlita
Occupancy by Ownership in San Perlita
Of the total 155 dwellings in San Perlita, owner-occupied units account for 121 (78.1%), while renter-occupied units make up 34 (21.9%).
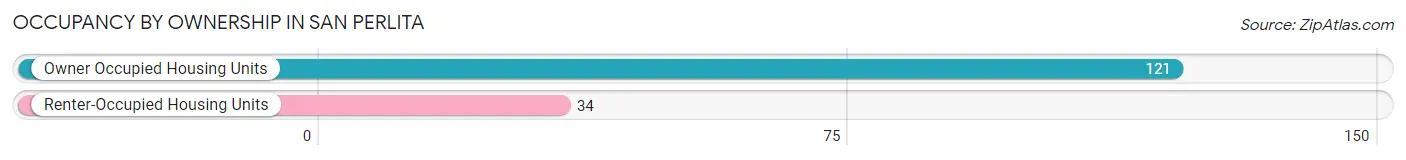
| Occupancy | # Housing Units | % Housing Units |
| Owner Occupied Housing Units | 121 | 78.1% |
| Renter-Occupied Housing Units | 34 | 21.9% |
| Total Occupied Housing Units | 155 | 100.0% |
Occupancy by Household Size in San Perlita
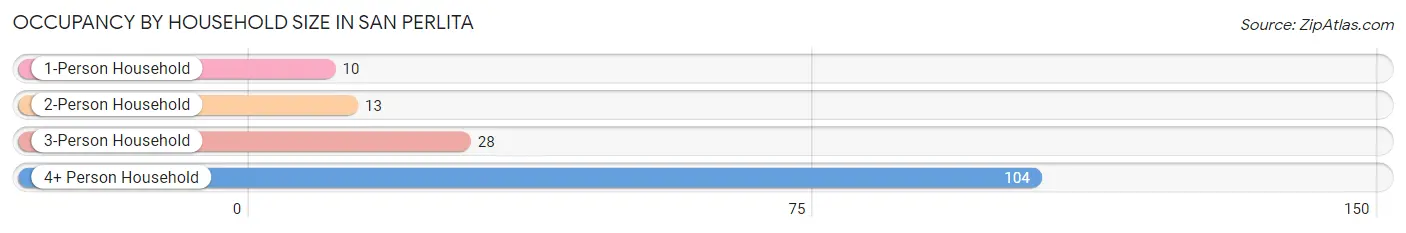
| Household Size | # Housing Units | % Housing Units |
| 1-Person Household | 10 | 6.5% |
| 2-Person Household | 13 | 8.4% |
| 3-Person Household | 28 | 18.1% |
| 4+ Person Household | 104 | 67.1% |
| Total Housing Units | 155 | 100.0% |
Occupancy by Ownership by Household Size in San Perlita
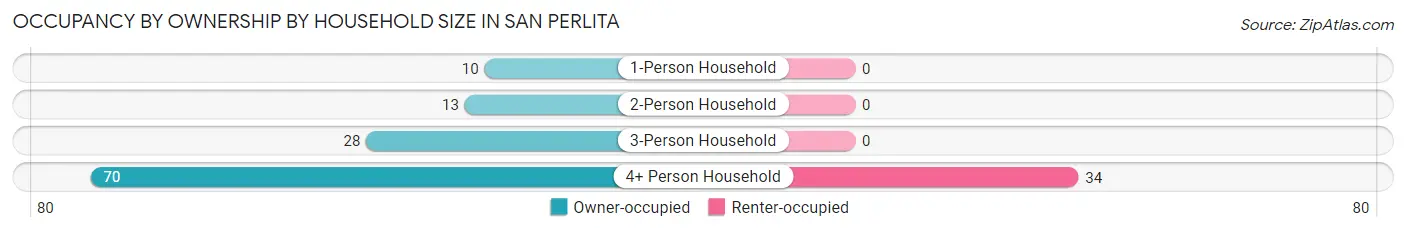
| Household Size | Owner-occupied | Renter-occupied |
| 1-Person Household | 10 (100.0%) | 0 (0.0%) |
| 2-Person Household | 13 (100.0%) | 0 (0.0%) |
| 3-Person Household | 28 (100.0%) | 0 (0.0%) |
| 4+ Person Household | 70 (67.3%) | 34 (32.7%) |
| Total Housing Units | 121 (78.1%) | 34 (21.9%) |
Occupancy by Educational Attainment in San Perlita
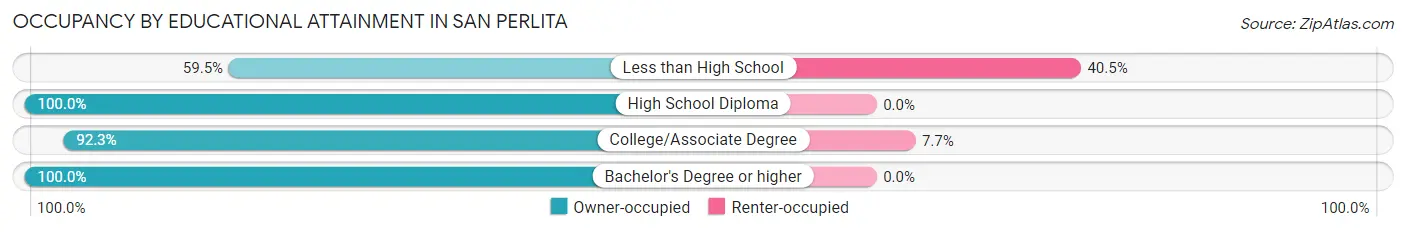
| Household Size | Owner-occupied | Renter-occupied |
| Less than High School | 47 (59.5%) | 32 (40.5%) |
| High School Diploma | 38 (100.0%) | 0 (0.0%) |
| College/Associate Degree | 24 (92.3%) | 2 (7.7%) |
| Bachelor's Degree or higher | 12 (100.0%) | 0 (0.0%) |
Occupancy by Age of Householder in San Perlita
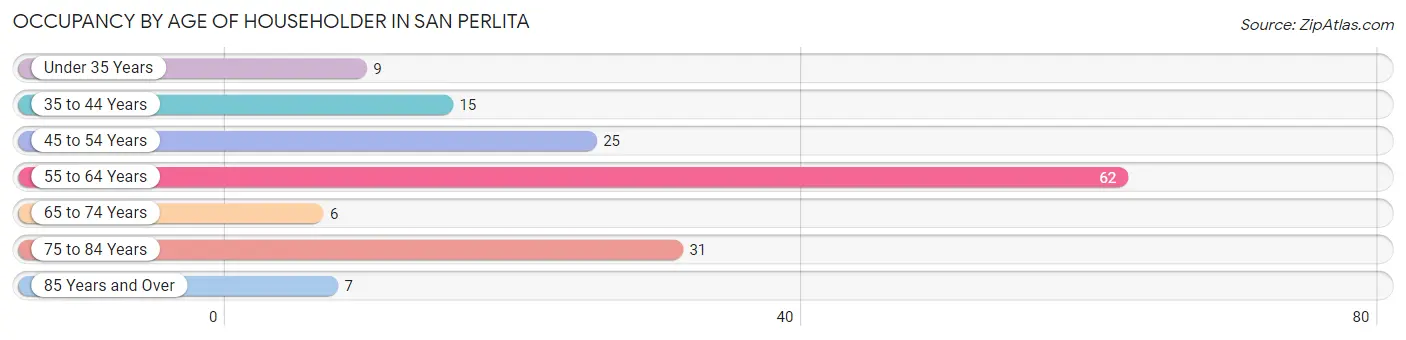
| Age Bracket | # Households | % Households |
| Under 35 Years | 9 | 5.8% |
| 35 to 44 Years | 15 | 9.7% |
| 45 to 54 Years | 25 | 16.1% |
| 55 to 64 Years | 62 | 40.0% |
| 65 to 74 Years | 6 | 3.9% |
| 75 to 84 Years | 31 | 20.0% |
| 85 Years and Over | 7 | 4.5% |
| Total | 155 | 100.0% |
Housing Finances in San Perlita
Median Income by Occupancy in San Perlita
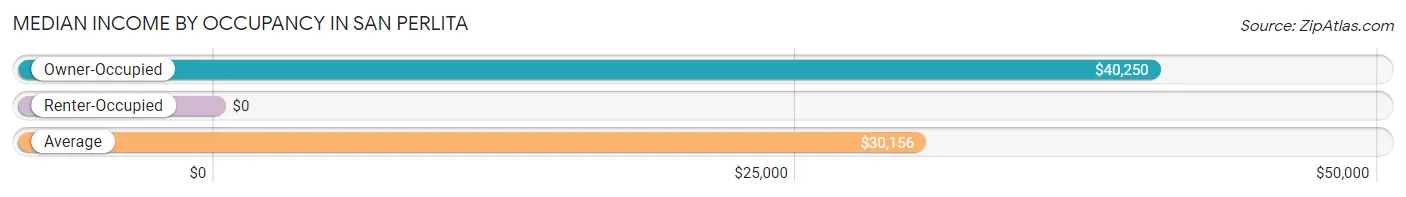
| Occupancy Type | # Households | Median Income |
| Owner-Occupied | 121 (78.1%) | $40,250 |
| Renter-Occupied | 34 (21.9%) | $0 |
| Average | 155 (100.0%) | $30,156 |
Occupancy by Householder Income Bracket in San Perlita
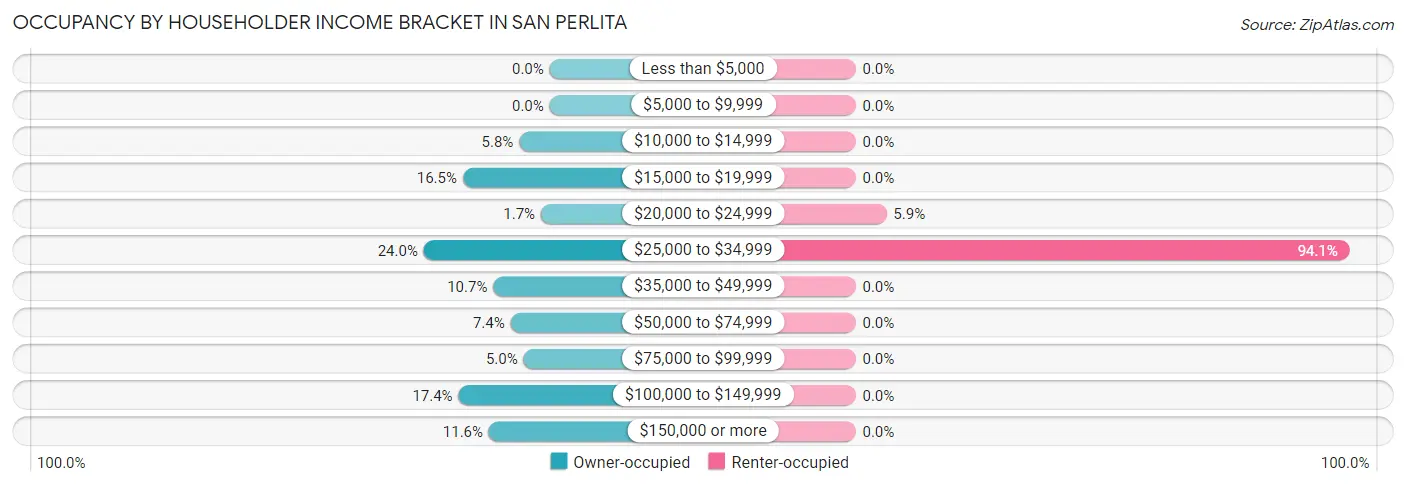
| Income Bracket | Owner-occupied | Renter-occupied |
| Less than $5,000 | 0 (0.0%) | 0 (0.0%) |
| $5,000 to $9,999 | 0 (0.0%) | 0 (0.0%) |
| $10,000 to $14,999 | 7 (5.8%) | 0 (0.0%) |
| $15,000 to $19,999 | 20 (16.5%) | 0 (0.0%) |
| $20,000 to $24,999 | 2 (1.7%) | 2 (5.9%) |
| $25,000 to $34,999 | 29 (24.0%) | 32 (94.1%) |
| $35,000 to $49,999 | 13 (10.7%) | 0 (0.0%) |
| $50,000 to $74,999 | 9 (7.4%) | 0 (0.0%) |
| $75,000 to $99,999 | 6 (5.0%) | 0 (0.0%) |
| $100,000 to $149,999 | 21 (17.4%) | 0 (0.0%) |
| $150,000 or more | 14 (11.6%) | 0 (0.0%) |
| Total | 121 (100.0%) | 34 (100.0%) |
Monthly Housing Cost Tiers in San Perlita
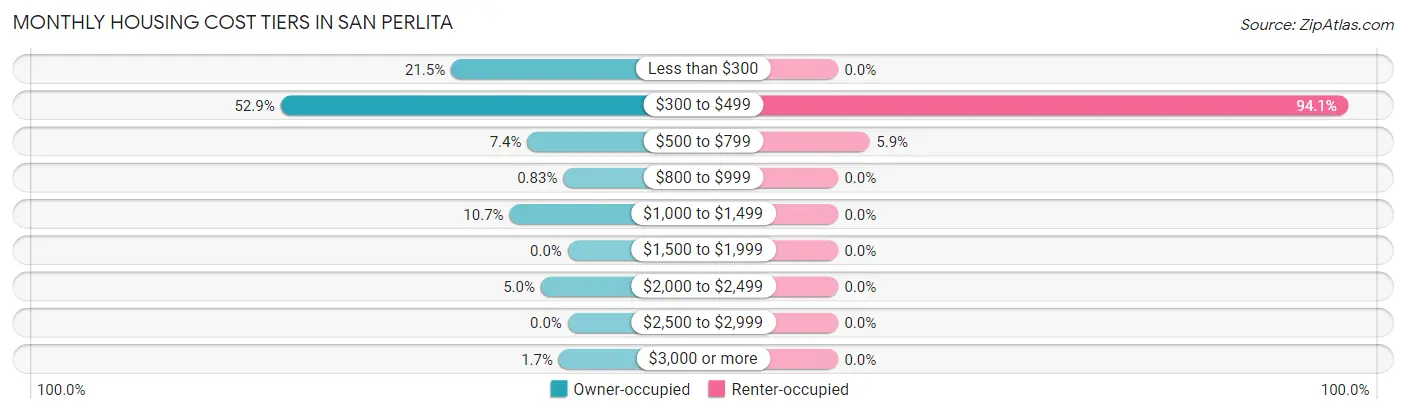
| Monthly Cost | Owner-occupied | Renter-occupied |
| Less than $300 | 26 (21.5%) | 0 (0.0%) |
| $300 to $499 | 64 (52.9%) | 32 (94.1%) |
| $500 to $799 | 9 (7.4%) | 2 (5.9%) |
| $800 to $999 | 1 (0.8%) | 0 (0.0%) |
| $1,000 to $1,499 | 13 (10.7%) | 0 (0.0%) |
| $1,500 to $1,999 | 0 (0.0%) | 0 (0.0%) |
| $2,000 to $2,499 | 6 (5.0%) | 0 (0.0%) |
| $2,500 to $2,999 | 0 (0.0%) | 0 (0.0%) |
| $3,000 or more | 2 (1.7%) | 0 (0.0%) |
| Total | 121 (100.0%) | 34 (100.0%) |
Physical Housing Characteristics in San Perlita
Housing Structures in San Perlita
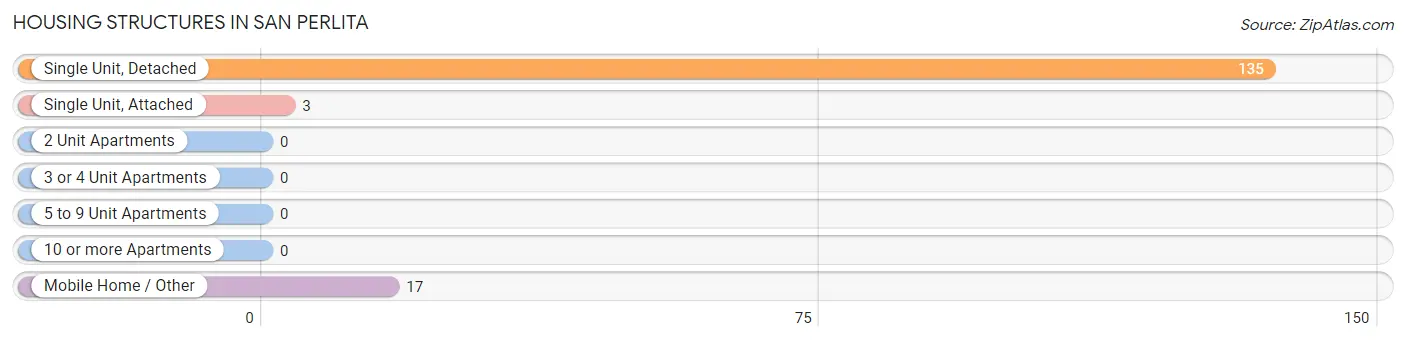
| Structure Type | # Housing Units | % Housing Units |
| Single Unit, Detached | 135 | 87.1% |
| Single Unit, Attached | 3 | 1.9% |
| 2 Unit Apartments | 0 | 0.0% |
| 3 or 4 Unit Apartments | 0 | 0.0% |
| 5 to 9 Unit Apartments | 0 | 0.0% |
| 10 or more Apartments | 0 | 0.0% |
| Mobile Home / Other | 17 | 11.0% |
| Total | 155 | 100.0% |
Housing Structures by Occupancy in San Perlita
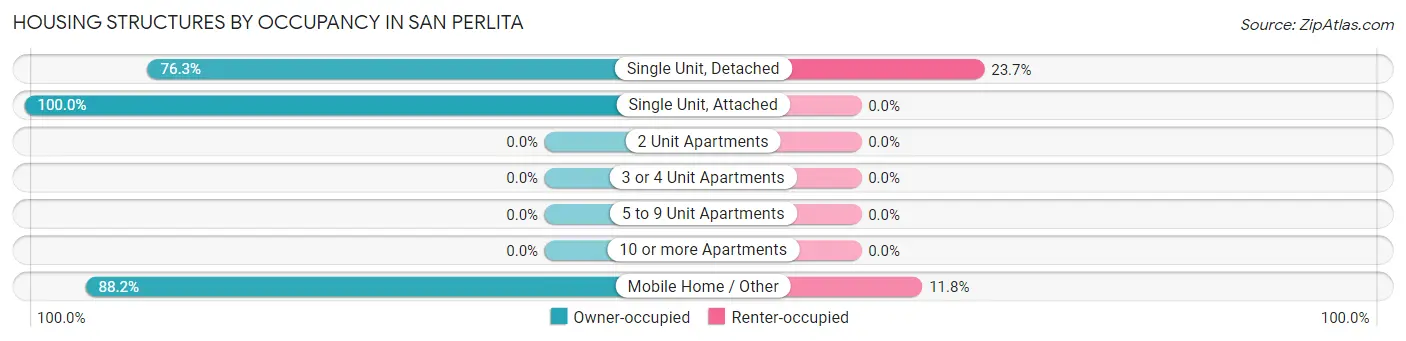
| Structure Type | Owner-occupied | Renter-occupied |
| Single Unit, Detached | 103 (76.3%) | 32 (23.7%) |
| Single Unit, Attached | 3 (100.0%) | 0 (0.0%) |
| 2 Unit Apartments | 0 (0.0%) | 0 (0.0%) |
| 3 or 4 Unit Apartments | 0 (0.0%) | 0 (0.0%) |
| 5 to 9 Unit Apartments | 0 (0.0%) | 0 (0.0%) |
| 10 or more Apartments | 0 (0.0%) | 0 (0.0%) |
| Mobile Home / Other | 15 (88.2%) | 2 (11.8%) |
| Total | 121 (78.1%) | 34 (21.9%) |
Housing Structures by Number of Rooms in San Perlita
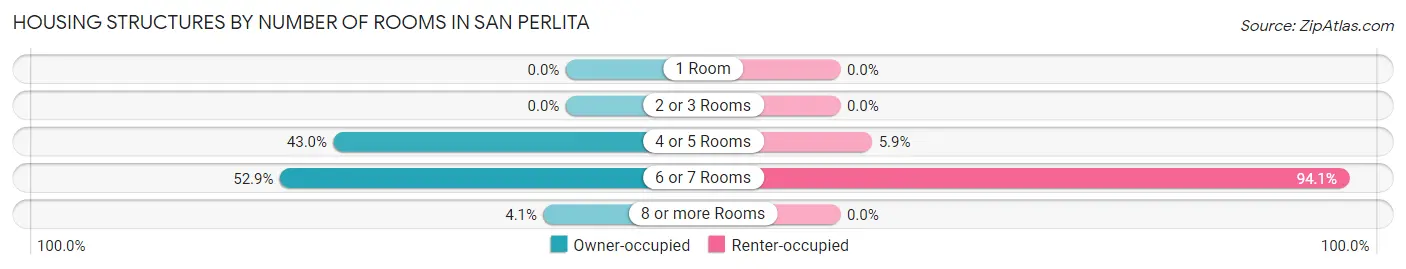
| Number of Rooms | Owner-occupied | Renter-occupied |
| 1 Room | 0 (0.0%) | 0 (0.0%) |
| 2 or 3 Rooms | 0 (0.0%) | 0 (0.0%) |
| 4 or 5 Rooms | 52 (43.0%) | 2 (5.9%) |
| 6 or 7 Rooms | 64 (52.9%) | 32 (94.1%) |
| 8 or more Rooms | 5 (4.1%) | 0 (0.0%) |
| Total | 121 (100.0%) | 34 (100.0%) |
Housing Structure by Heating Type in San Perlita
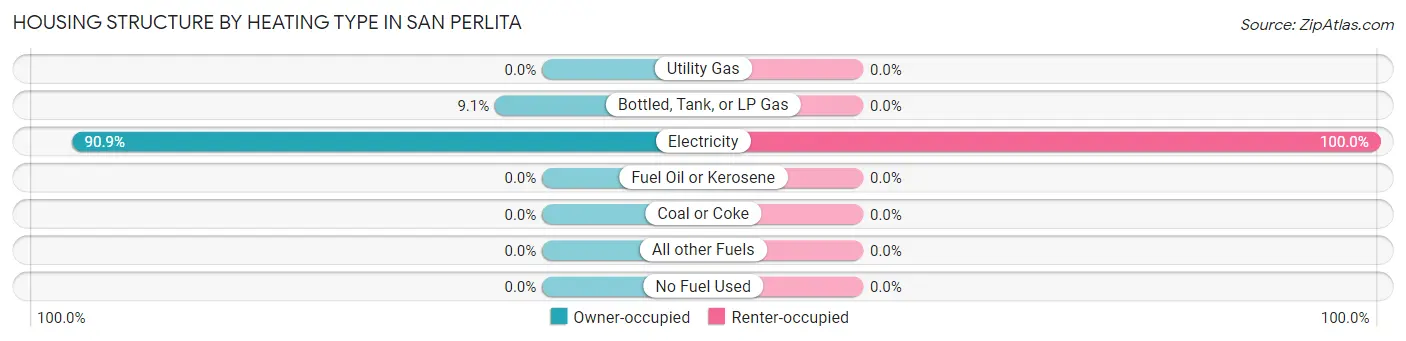
| Heating Type | Owner-occupied | Renter-occupied |
| Utility Gas | 0 (0.0%) | 0 (0.0%) |
| Bottled, Tank, or LP Gas | 11 (9.1%) | 0 (0.0%) |
| Electricity | 110 (90.9%) | 34 (100.0%) |
| Fuel Oil or Kerosene | 0 (0.0%) | 0 (0.0%) |
| Coal or Coke | 0 (0.0%) | 0 (0.0%) |
| All other Fuels | 0 (0.0%) | 0 (0.0%) |
| No Fuel Used | 0 (0.0%) | 0 (0.0%) |
| Total | 121 (100.0%) | 34 (100.0%) |
Household Vehicle Usage in San Perlita
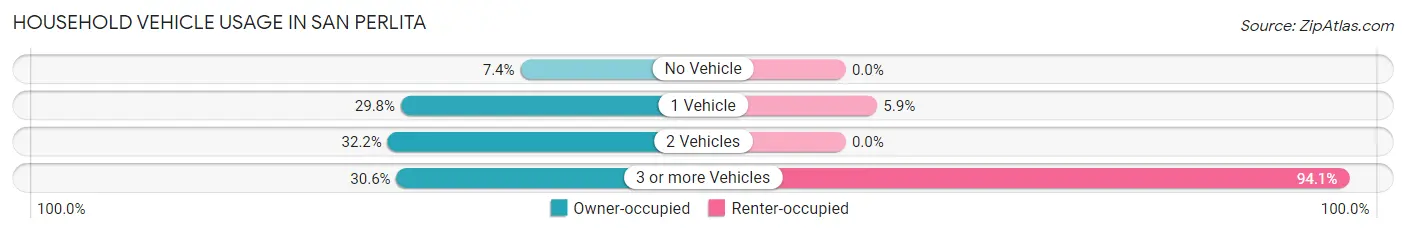
| Vehicles per Household | Owner-occupied | Renter-occupied |
| No Vehicle | 9 (7.4%) | 0 (0.0%) |
| 1 Vehicle | 36 (29.7%) | 2 (5.9%) |
| 2 Vehicles | 39 (32.2%) | 0 (0.0%) |
| 3 or more Vehicles | 37 (30.6%) | 32 (94.1%) |
| Total | 121 (100.0%) | 34 (100.0%) |
Real Estate & Mortgages in San Perlita
Real Estate and Mortgage Overview in San Perlita
| Characteristic | Without Mortgage | With Mortgage |
| Housing Units | 93 | 28 |
| Median Property Value | $42,000 | $0 |
| Median Household Income | $36,875 | $6 |
| Monthly Housing Costs | $338 | $2 |
| Real Estate Taxes | $462 | $0 |
Property Value by Mortgage Status in San Perlita
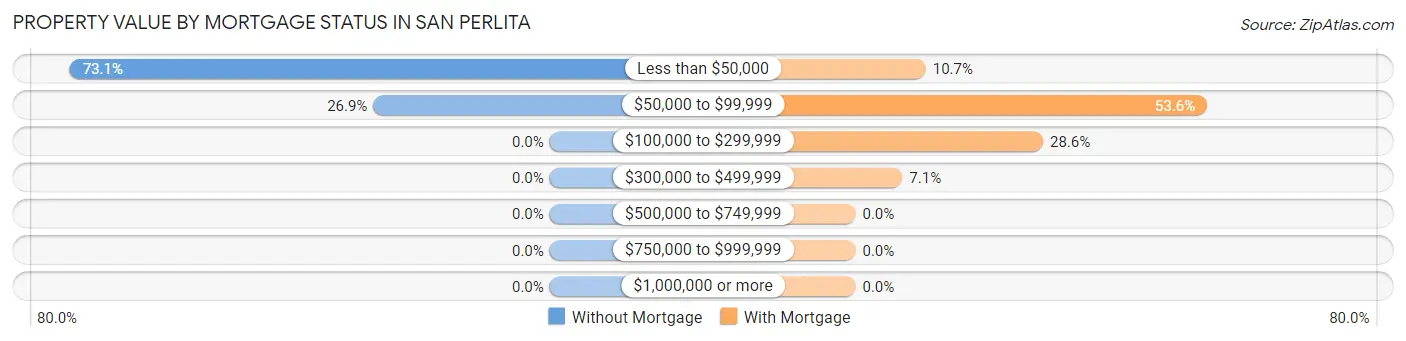
| Property Value | Without Mortgage | With Mortgage |
| Less than $50,000 | 68 (73.1%) | 3 (10.7%) |
| $50,000 to $99,999 | 25 (26.9%) | 15 (53.6%) |
| $100,000 to $299,999 | 0 (0.0%) | 8 (28.6%) |
| $300,000 to $499,999 | 0 (0.0%) | 2 (7.1%) |
| $500,000 to $749,999 | 0 (0.0%) | 0 (0.0%) |
| $750,000 to $999,999 | 0 (0.0%) | 0 (0.0%) |
| $1,000,000 or more | 0 (0.0%) | 0 (0.0%) |
| Total | 93 (100.0%) | 28 (100.0%) |
Household Income by Mortgage Status in San Perlita
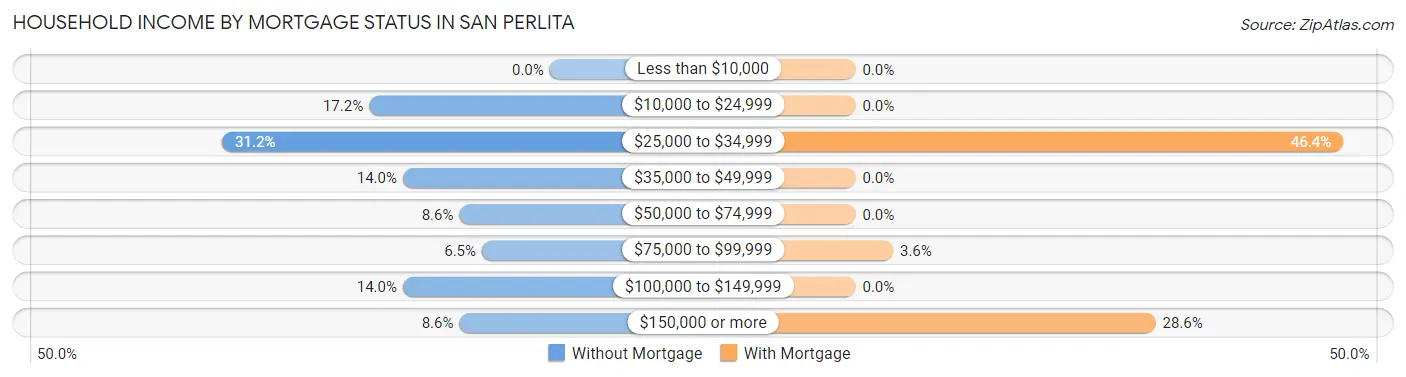
| Household Income | Without Mortgage | With Mortgage |
| Less than $10,000 | 0 (0.0%) | 0 (0.0%) |
| $10,000 to $24,999 | 16 (17.2%) | 0 (0.0%) |
| $25,000 to $34,999 | 29 (31.2%) | 13 (46.4%) |
| $35,000 to $49,999 | 13 (14.0%) | 0 (0.0%) |
| $50,000 to $74,999 | 8 (8.6%) | 0 (0.0%) |
| $75,000 to $99,999 | 6 (6.5%) | 1 (3.6%) |
| $100,000 to $149,999 | 13 (14.0%) | 0 (0.0%) |
| $150,000 or more | 8 (8.6%) | 8 (28.6%) |
| Total | 93 (100.0%) | 28 (100.0%) |
Property Value to Household Income Ratio in San Perlita
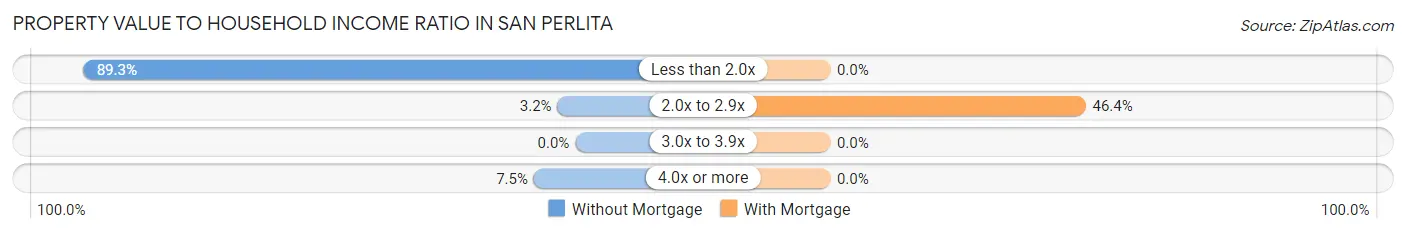
| Value-to-Income Ratio | Without Mortgage | With Mortgage |
| Less than 2.0x | 83 (89.2%) | 0 (0.0%) |
| 2.0x to 2.9x | 3 (3.2%) | 13 (46.4%) |
| 3.0x to 3.9x | 0 (0.0%) | 0 (0.0%) |
| 4.0x or more | 7 (7.5%) | 0 (0.0%) |
| Total | 93 (100.0%) | 28 (100.0%) |
Real Estate Taxes by Mortgage Status in San Perlita
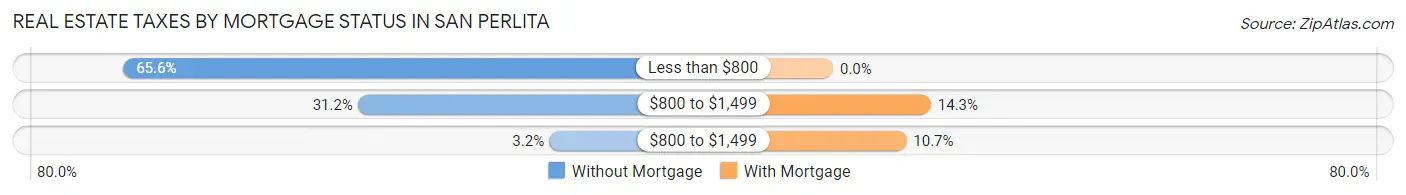
| Property Taxes | Without Mortgage | With Mortgage |
| Less than $800 | 61 (65.6%) | 0 (0.0%) |
| $800 to $1,499 | 29 (31.2%) | 4 (14.3%) |
| $800 to $1,499 | 3 (3.2%) | 3 (10.7%) |
| Total | 93 (100.0%) | 28 (100.0%) |
Health & Disability in San Perlita
Health Insurance Coverage by Age in San Perlita
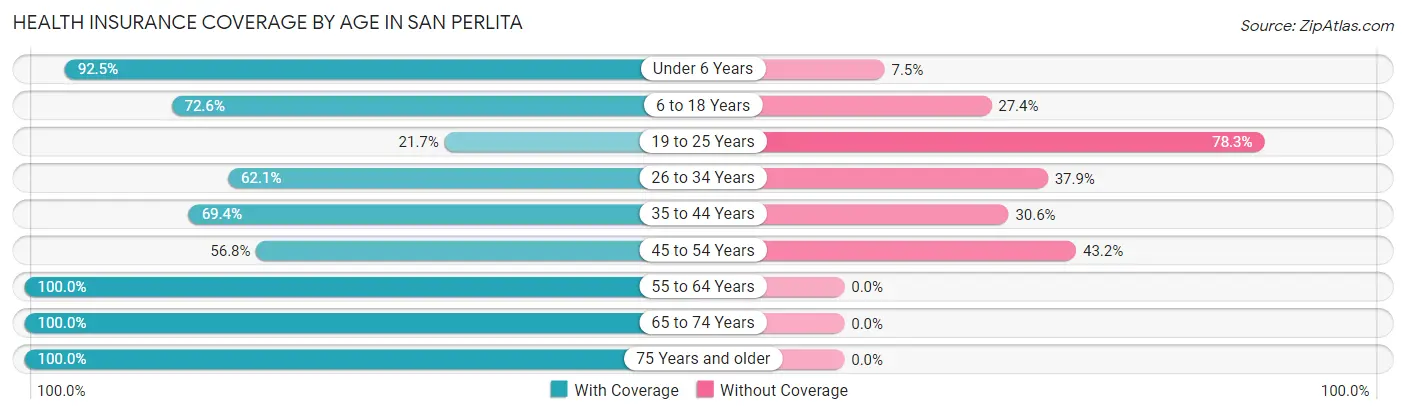
| Age Bracket | With Coverage | Without Coverage |
| Under 6 Years | 37 (92.5%) | 3 (7.5%) |
| 6 to 18 Years | 143 (72.6%) | 54 (27.4%) |
| 19 to 25 Years | 31 (21.7%) | 112 (78.3%) |
| 26 to 34 Years | 36 (62.1%) | 22 (37.9%) |
| 35 to 44 Years | 34 (69.4%) | 15 (30.6%) |
| 45 to 54 Years | 67 (56.8%) | 51 (43.2%) |
| 55 to 64 Years | 83 (100.0%) | 0 (0.0%) |
| 65 to 74 Years | 30 (100.0%) | 0 (0.0%) |
| 75 Years and older | 66 (100.0%) | 0 (0.0%) |
| Total | 527 (67.2%) | 257 (32.8%) |
Health Insurance Coverage by Citizenship Status in San Perlita
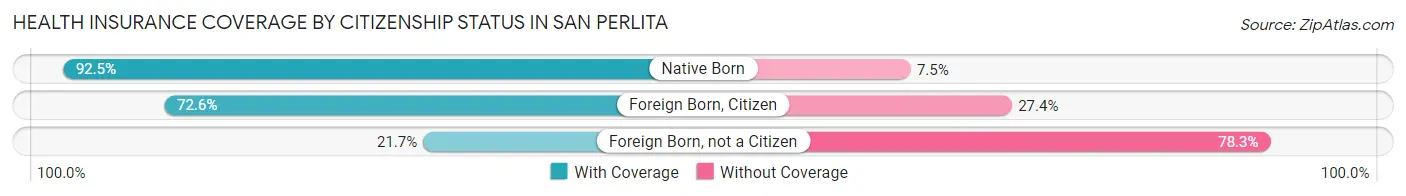
| Citizenship Status | With Coverage | Without Coverage |
| Native Born | 37 (92.5%) | 3 (7.5%) |
| Foreign Born, Citizen | 143 (72.6%) | 54 (27.4%) |
| Foreign Born, not a Citizen | 31 (21.7%) | 112 (78.3%) |
Health Insurance Coverage by Household Income in San Perlita
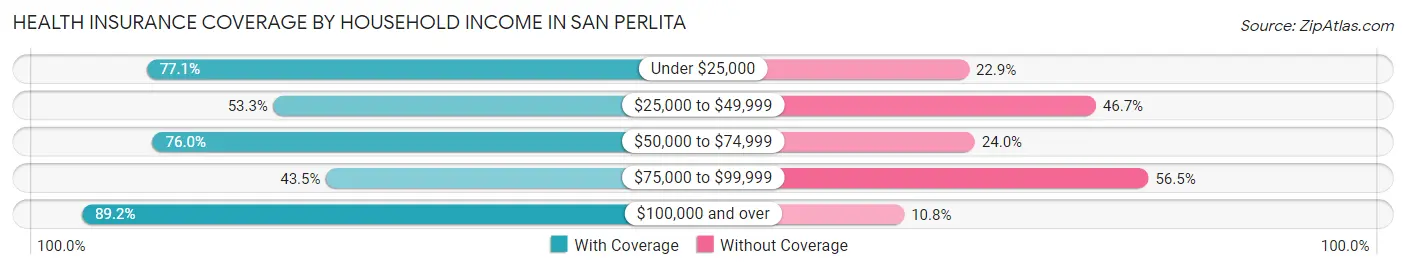
| Household Income | With Coverage | Without Coverage |
| Under $25,000 | 64 (77.1%) | 19 (22.9%) |
| $25,000 to $49,999 | 216 (53.3%) | 189 (46.7%) |
| $50,000 to $74,999 | 38 (76.0%) | 12 (24.0%) |
| $75,000 to $99,999 | 10 (43.5%) | 13 (56.5%) |
| $100,000 and over | 199 (89.2%) | 24 (10.8%) |
Public vs Private Health Insurance Coverage by Age in San Perlita
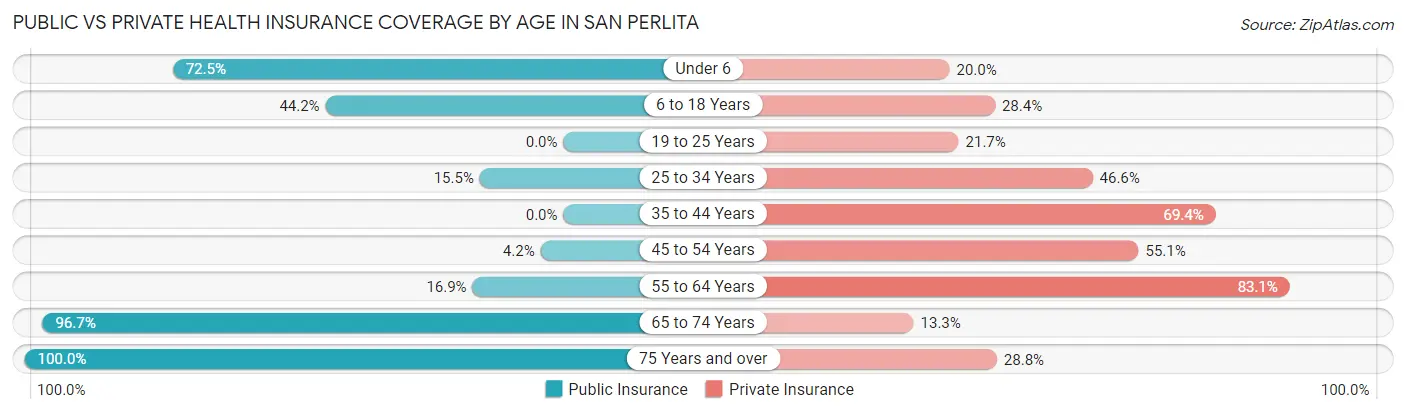
| Age Bracket | Public Insurance | Private Insurance |
| Under 6 | 29 (72.5%) | 8 (20.0%) |
| 6 to 18 Years | 87 (44.2%) | 56 (28.4%) |
| 19 to 25 Years | 0 (0.0%) | 31 (21.7%) |
| 25 to 34 Years | 9 (15.5%) | 27 (46.6%) |
| 35 to 44 Years | 0 (0.0%) | 34 (69.4%) |
| 45 to 54 Years | 5 (4.2%) | 65 (55.1%) |
| 55 to 64 Years | 14 (16.9%) | 69 (83.1%) |
| 65 to 74 Years | 29 (96.7%) | 4 (13.3%) |
| 75 Years and over | 66 (100.0%) | 19 (28.8%) |
| Total | 239 (30.5%) | 313 (39.9%) |
Disability Status by Sex by Age in San Perlita
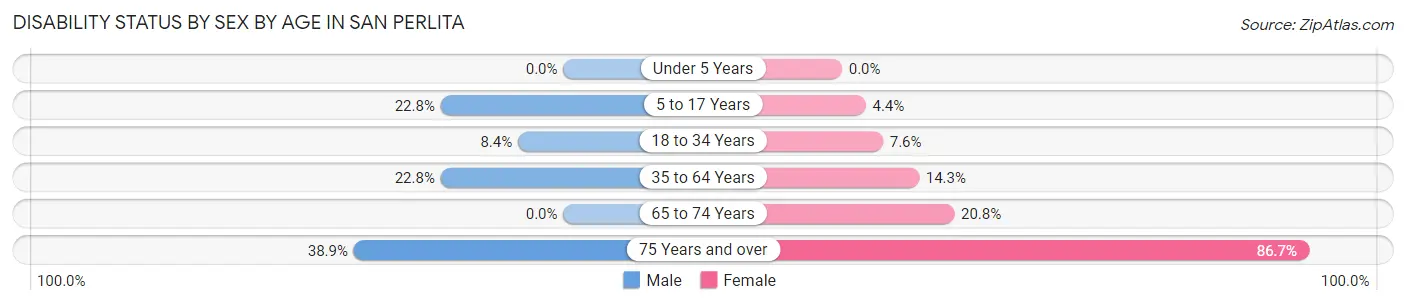
| Age Bracket | Male | Female |
| Under 5 Years | 0 (0.0%) | 0 (0.0%) |
| 5 to 17 Years | 28 (22.8%) | 3 (4.4%) |
| 18 to 34 Years | 10 (8.4%) | 7 (7.6%) |
| 35 to 64 Years | 33 (22.8%) | 15 (14.3%) |
| 65 to 74 Years | 0 (0.0%) | 5 (20.8%) |
| 75 Years and over | 14 (38.9%) | 26 (86.7%) |
Disability Class by Sex by Age in San Perlita
Disability Class: Hearing Difficulty
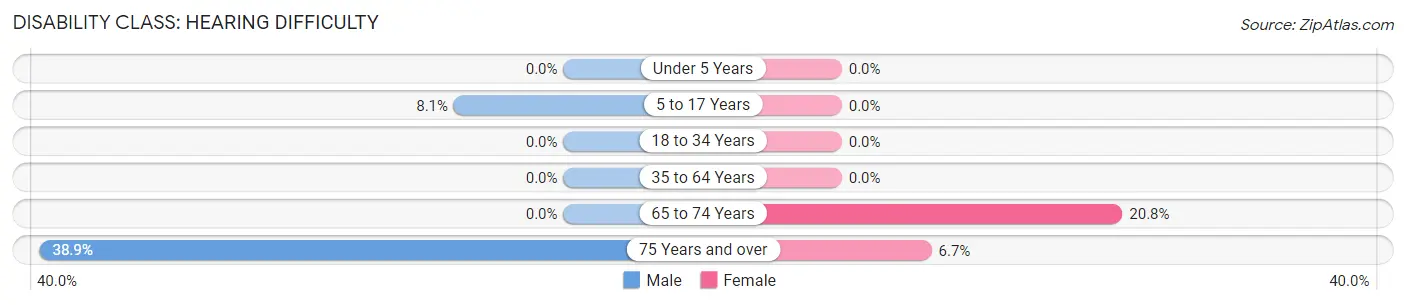
| Age Bracket | Male | Female |
| Under 5 Years | 0 (0.0%) | 0 (0.0%) |
| 5 to 17 Years | 10 (8.1%) | 0 (0.0%) |
| 18 to 34 Years | 0 (0.0%) | 0 (0.0%) |
| 35 to 64 Years | 0 (0.0%) | 0 (0.0%) |
| 65 to 74 Years | 0 (0.0%) | 5 (20.8%) |
| 75 Years and over | 14 (38.9%) | 2 (6.7%) |
Disability Class: Vision Difficulty
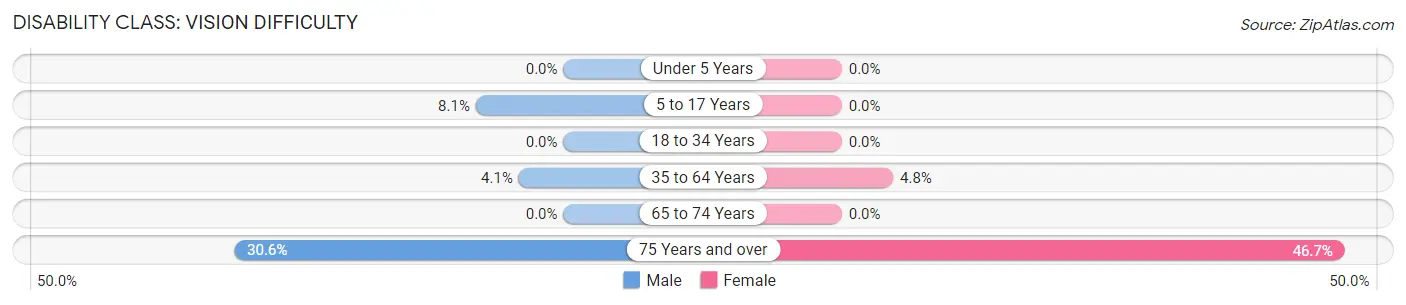
| Age Bracket | Male | Female |
| Under 5 Years | 0 (0.0%) | 0 (0.0%) |
| 5 to 17 Years | 10 (8.1%) | 0 (0.0%) |
| 18 to 34 Years | 0 (0.0%) | 0 (0.0%) |
| 35 to 64 Years | 6 (4.1%) | 5 (4.8%) |
| 65 to 74 Years | 0 (0.0%) | 0 (0.0%) |
| 75 Years and over | 11 (30.6%) | 14 (46.7%) |
Disability Class: Cognitive Difficulty
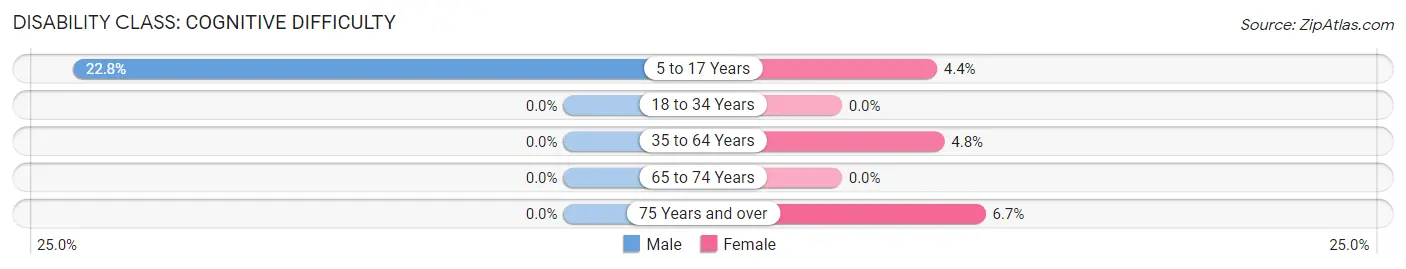
| Age Bracket | Male | Female |
| 5 to 17 Years | 28 (22.8%) | 3 (4.4%) |
| 18 to 34 Years | 0 (0.0%) | 0 (0.0%) |
| 35 to 64 Years | 0 (0.0%) | 5 (4.8%) |
| 65 to 74 Years | 0 (0.0%) | 0 (0.0%) |
| 75 Years and over | 0 (0.0%) | 2 (6.7%) |
Disability Class: Ambulatory Difficulty
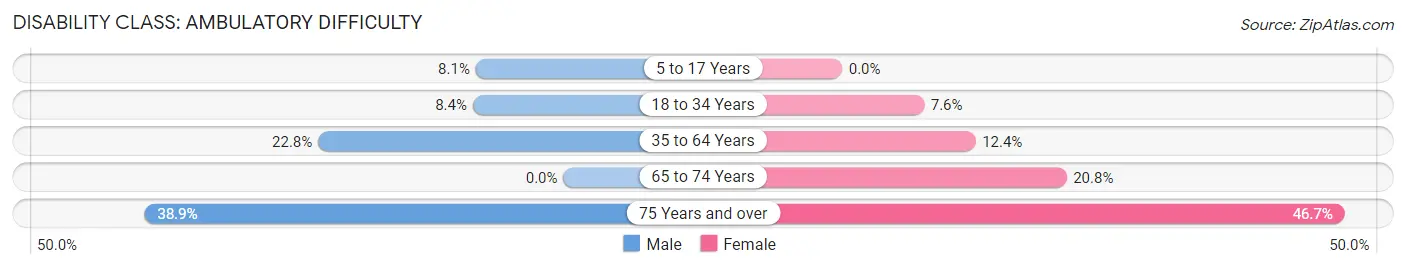
| Age Bracket | Male | Female |
| 5 to 17 Years | 10 (8.1%) | 0 (0.0%) |
| 18 to 34 Years | 10 (8.4%) | 7 (7.6%) |
| 35 to 64 Years | 33 (22.8%) | 13 (12.4%) |
| 65 to 74 Years | 0 (0.0%) | 5 (20.8%) |
| 75 Years and over | 14 (38.9%) | 14 (46.7%) |
Disability Class: Self-Care Difficulty
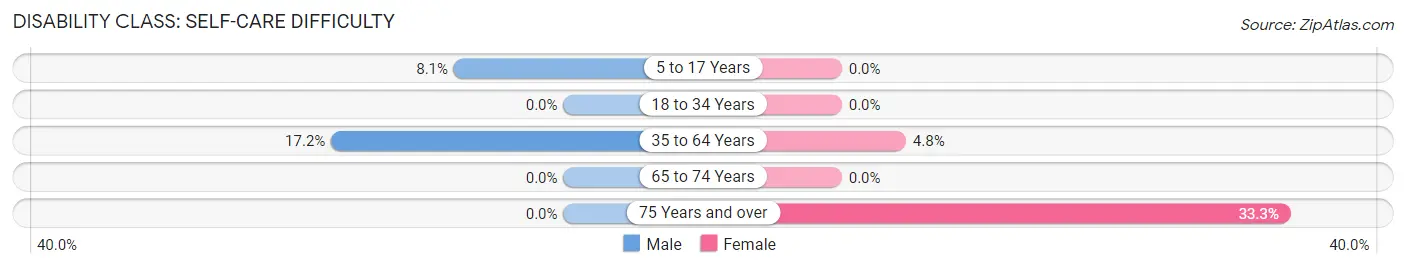
| Age Bracket | Male | Female |
| 5 to 17 Years | 10 (8.1%) | 0 (0.0%) |
| 18 to 34 Years | 0 (0.0%) | 0 (0.0%) |
| 35 to 64 Years | 25 (17.2%) | 5 (4.8%) |
| 65 to 74 Years | 0 (0.0%) | 0 (0.0%) |
| 75 Years and over | 0 (0.0%) | 10 (33.3%) |
Technology Access in San Perlita
Computing Device Access in San Perlita
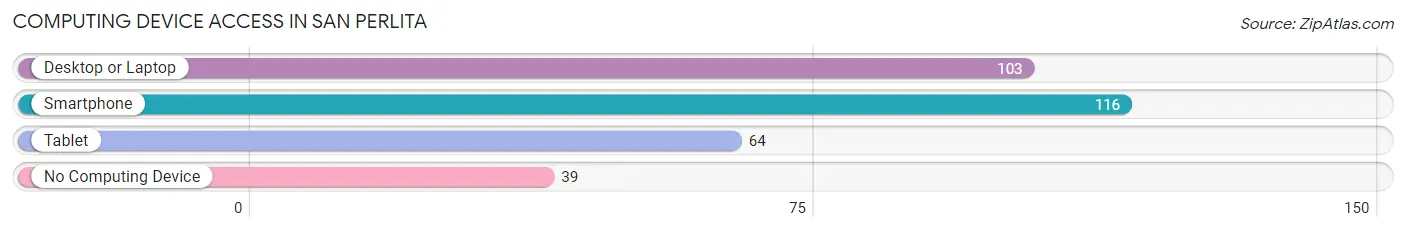
| Device Type | # Households | % Households |
| Desktop or Laptop | 103 | 66.4% |
| Smartphone | 116 | 74.8% |
| Tablet | 64 | 41.3% |
| No Computing Device | 39 | 25.2% |
| Total | 155 | 100.0% |
Internet Access in San Perlita
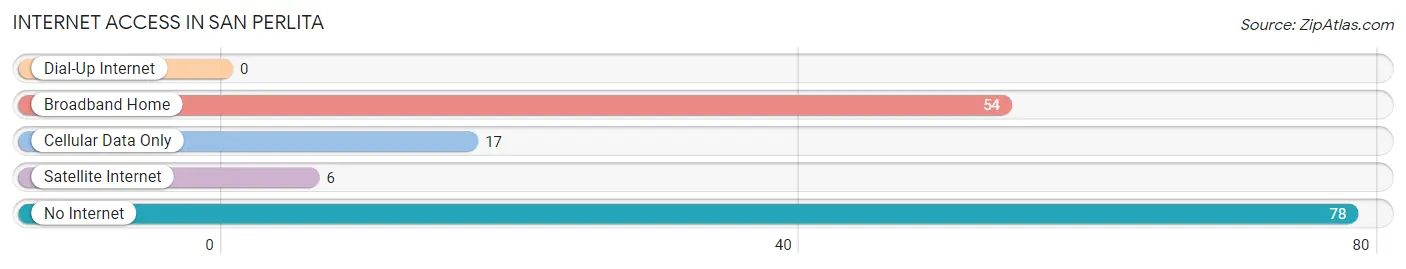
| Internet Type | # Households | % Households |
| Dial-Up Internet | 0 | 0.0% |
| Broadband Home | 54 | 34.8% |
| Cellular Data Only | 17 | 11.0% |
| Satellite Internet | 6 | 3.9% |
| No Internet | 78 | 50.3% |
| Total | 155 | 100.0% |
San Perlita Summary
History
The small town of San Perlita, Texas is located in Willacy County, in the Rio Grande Valley of South Texas. It is situated on the banks of the Rio Grande River, and is part of the larger metropolitan area of McAllen-Edinburg-Mission. The town was founded in the late 19th century by a group of Mexican settlers who were looking for a place to settle and farm. The town was originally called San Pedro de la Laguna, but was later changed to San Perlita, which means “little pearl” in Spanish.
The town was officially incorporated in 1909, and the first mayor was elected in 1910. The town was a small farming community, and the main crops grown were cotton, corn, and sorghum. The town also had a small dairy industry, and a few small businesses.
In the early 20th century, the town began to grow and develop. The first school was built in 1910, and the first bank opened in 1911. The town also had a post office, a hotel, and a few stores.
In the 1920s, the town began to experience a population boom, as many Mexican immigrants moved to the area to work in the cotton fields. This influx of people helped to spur the growth of the town, and by the 1930s, San Perlita had become a thriving community.
The town continued to grow and develop throughout the 20th century. In the 1950s, the town was connected to the rest of the state by a new highway, and in the 1960s, the town was connected to the rest of the country by a new railroad line.
In the late 20th century, the town began to experience a decline in population, as many of the younger residents moved away to larger cities. However, the town has managed to remain a vibrant and active community, and is now home to a variety of businesses, including a grocery store, a hardware store, and a few restaurants.
Geography
San Perlita is located in the Rio Grande Valley of South Texas, on the banks of the Rio Grande River. The town is situated in Willacy County, and is part of the larger metropolitan area of McAllen-Edinburg-Mission. The town is located about 30 miles south of the city of Harlingen, and about 40 miles north of the city of Brownsville.
The town is situated in a flat, low-lying area, and is surrounded by farmland and ranches. The climate in the area is subtropical, with hot summers and mild winters. The average annual temperature is around 75 degrees Fahrenheit, and the average annual rainfall is around 25 inches.
Economy
San Perlita’s economy is largely based on agriculture and tourism. The town is home to a variety of farms and ranches, and the main crops grown in the area are cotton, corn, and sorghum. The town also has a small dairy industry, and a few small businesses.
The town is also a popular tourist destination, as it is located close to the Mexican border. The town is home to a variety of attractions, including a museum, a historic church, and a few restaurants.
Demographics
As of the 2010 census, the population of San Perlita was 1,845. The racial makeup of the town was 94.3% Hispanic or Latino, 4.2% White, 0.2% African American, 0.2% Native American, and 0.1% Asian. The median household income in the town was $25,000, and the median age was 33.
Conclusion
San Perlita is a small town located in the Rio Grande Valley of South Texas. The town was founded in the late 19th century by a group of Mexican settlers, and has since grown into a vibrant and active community. The town’s economy is largely based on agriculture and tourism, and the town is home to a variety of attractions. The population of the town is largely Hispanic or Latino, and the median household income is around $25,000.
Common Questions
What is the Total Population of San Perlita?
Total Population of San Perlita is 784.
What is the Total Male Population of San Perlita?
Total Male Population of San Perlita is 449.
What is the Total Female Population of San Perlita?
Total Female Population of San Perlita is 335.
What is the Ratio of Males per 100 Females in San Perlita?
There are 134.03 Males per 100 Females in San Perlita.
What is the Ratio of Females per 100 Males in San Perlita?
There are 74.61 Females per 100 Males in San Perlita.
What is the Median Population Age in San Perlita?
Median Population Age in San Perlita is 27.5 Years.
What is the Average Family Size in San Perlita
Average Family Size in San Perlita is 5.3 People.
What is the Average Household Size in San Perlita
Average Household Size in San Perlita is 5.1 People.
What is Per Capita Income in San Perlita?
Per Capita income in San Perlita is $13,695.
What is the Median Family Income in San Perlita?
Median Family Income in San Perlita is $31,719.
What is the Median Household income in San Perlita?
Median Household Income in San Perlita is $30,156.
What is Income or Wage Gap in San Perlita?
Income or Wage Gap in San Perlita is 38.5%.
Women in San Perlita earn 61.5 cents for every dollar earned by a man.
What is Inequality or Gini Index in San Perlita?
Inequality or Gini Index in San Perlita is 0.41.
How Large is the Labor Force in San Perlita?
There are 294 People in the Labor Forcein in San Perlita.
What is the Percentage of People in the Labor Force in San Perlita?
49.1% of People are in the Labor Force in San Perlita.
What is the Unemployment Rate in San Perlita?
Unemployment Rate in San Perlita is 5.8%.