El Refugio, TX
El Refugio Map
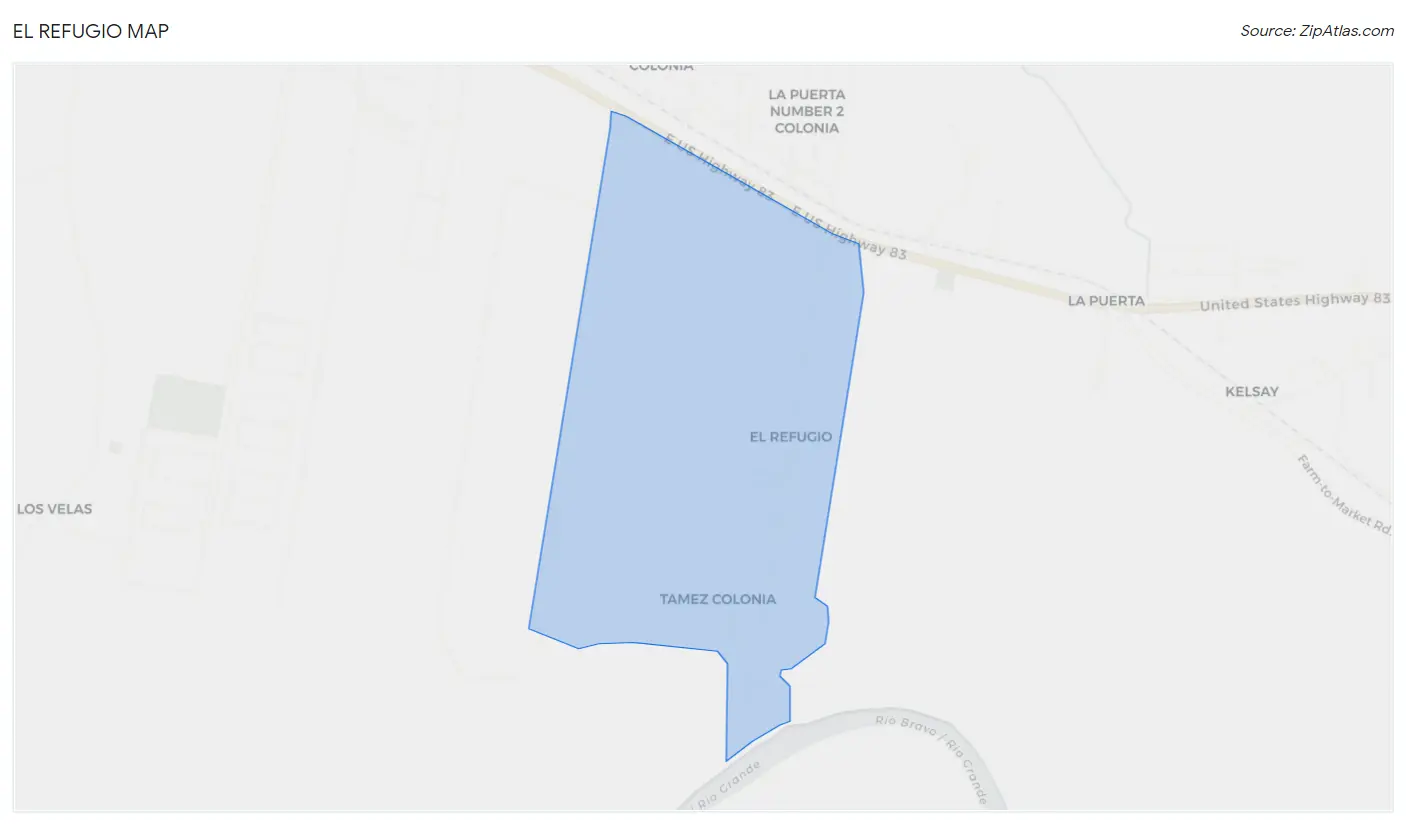
El Refugio Overview
737
TOTAL POPULATION
304
MALE POPULATION
433
FEMALE POPULATION
70.21
MALES / 100 FEMALES
142.43
FEMALES / 100 MALES
22.1
MEDIAN AGE
4.6
AVG FAMILY SIZE
3.9
AVG HOUSEHOLD SIZE
$12,529
PER CAPITA INCOME
$47,942
AVG FAMILY INCOME
$44,650
AVG HOUSEHOLD INCOME
0.27
INEQUALITY / GINI INDEX
349
LABOR FORCE [ PEOPLE ]
63.9%
PERCENT IN LABOR FORCE
5.2%
UNEMPLOYMENT RATE
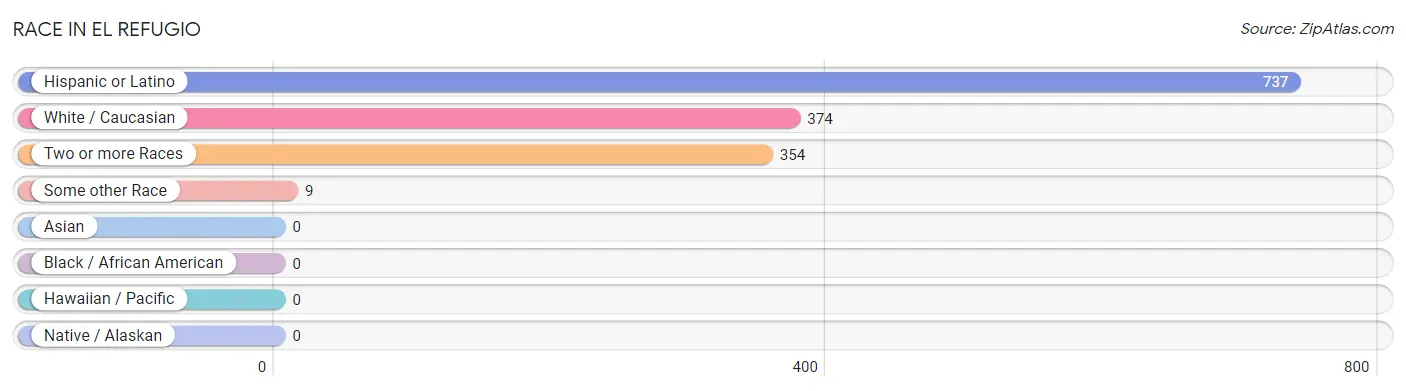
Race in El Refugio
The most populous races in El Refugio are Hispanic or Latino (737 | 100.0%), White / Caucasian (374 | 50.7%), and Two or more Races (354 | 48.0%).
| Race | # Population | % Population |
| Asian | 0 | 0.0% |
| Black / African American | 0 | 0.0% |
| Hawaiian / Pacific | 0 | 0.0% |
| Hispanic or Latino | 737 | 100.0% |
| Native / Alaskan | 0 | 0.0% |
| White / Caucasian | 374 | 50.7% |
| Two or more Races | 354 | 48.0% |
| Some other Race | 9 | 1.2% |
| Total | 737 | 100.0% |
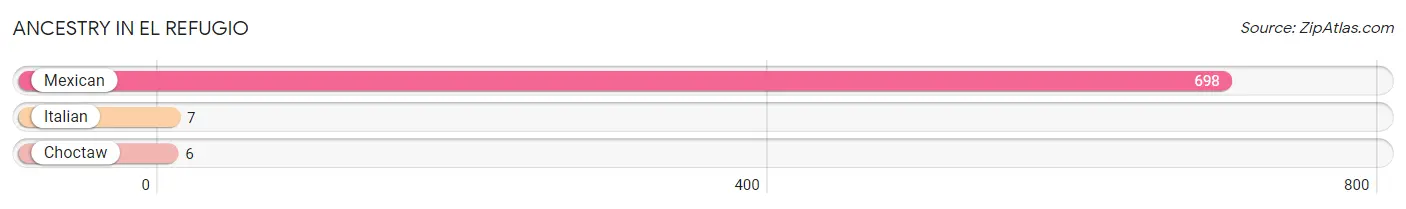
Ancestry in El Refugio
The most populous ancestries reported in El Refugio are Mexican (698 | 94.7%), Italian (7 | 0.9%), and Choctaw (6 | 0.8%), together accounting for 96.5% of all El Refugio residents.
| Ancestry | # Population | % Population |
| Choctaw | 6 | 0.8% |
| Italian | 7 | 0.9% |
| Mexican | 698 | 94.7% | View All 3 Rows |
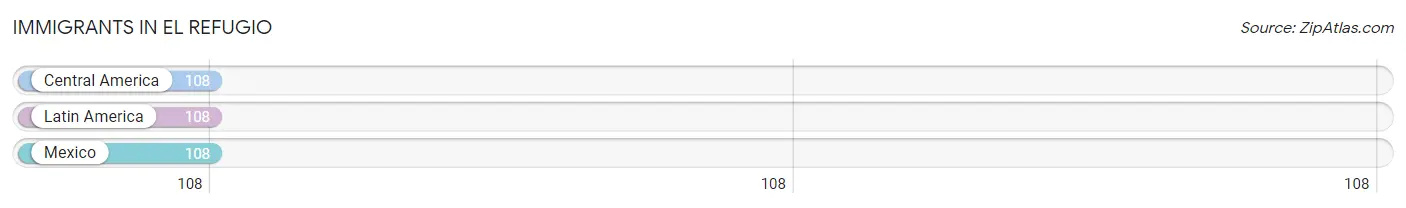
Immigrants in El Refugio
The most numerous immigrant groups reported in El Refugio came from Central America (108 | 14.6%), Latin America (108 | 14.6%), and Mexico (108 | 14.6%), together accounting for 44.0% of all El Refugio residents.
| Immigration Origin | # Population | % Population |
| Central America | 108 | 14.6% |
| Latin America | 108 | 14.6% |
| Mexico | 108 | 14.6% | View All 3 Rows |
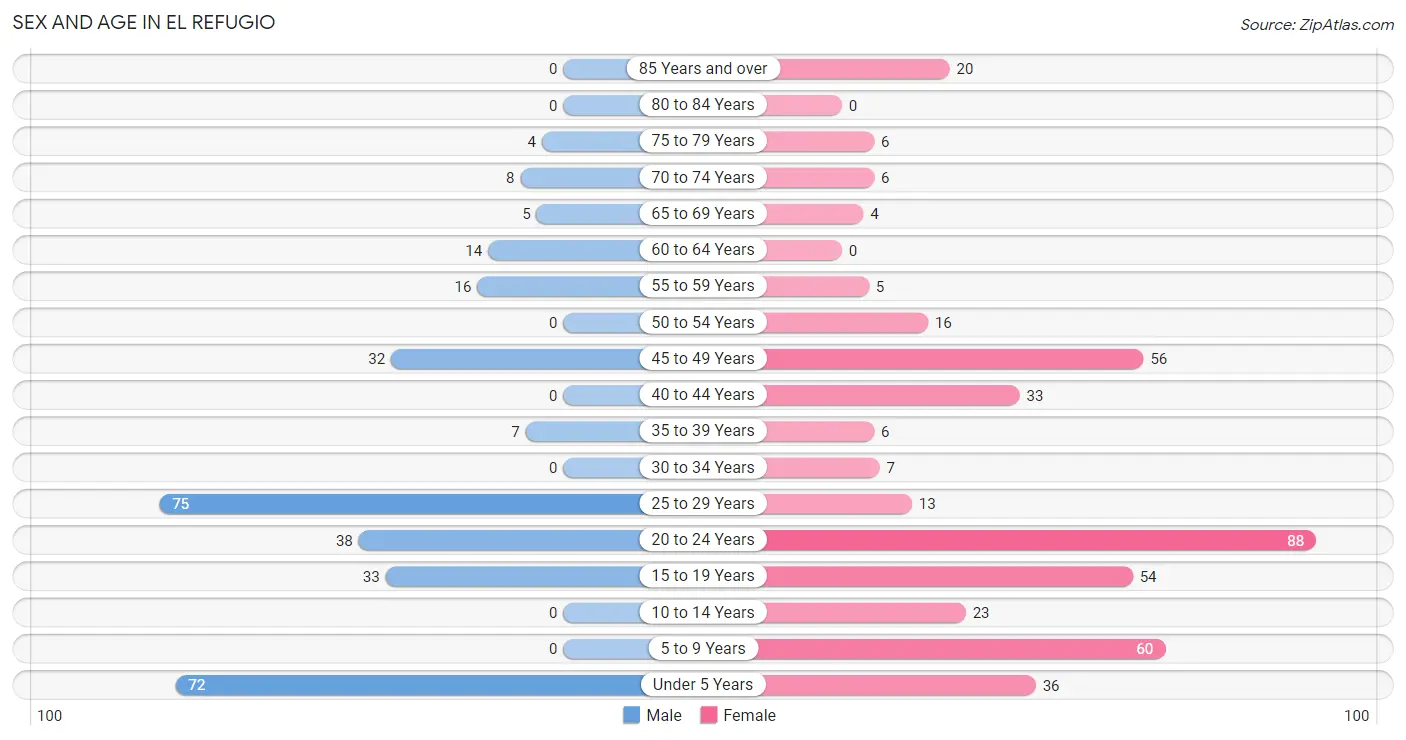
Sex and Age in El Refugio
Sex and Age in El Refugio
The most populous age groups in El Refugio are 25 to 29 Years (75 | 24.7%) for men and 20 to 24 Years (88 | 20.3%) for women.
| Age Bracket | Male | Female |
| Under 5 Years | 72 (23.7%) | 36 (8.3%) |
| 5 to 9 Years | 0 (0.0%) | 60 (13.9%) |
| 10 to 14 Years | 0 (0.0%) | 23 (5.3%) |
| 15 to 19 Years | 33 (10.9%) | 54 (12.5%) |
| 20 to 24 Years | 38 (12.5%) | 88 (20.3%) |
| 25 to 29 Years | 75 (24.7%) | 13 (3.0%) |
| 30 to 34 Years | 0 (0.0%) | 7 (1.6%) |
| 35 to 39 Years | 7 (2.3%) | 6 (1.4%) |
| 40 to 44 Years | 0 (0.0%) | 33 (7.6%) |
| 45 to 49 Years | 32 (10.5%) | 56 (12.9%) |
| 50 to 54 Years | 0 (0.0%) | 16 (3.7%) |
| 55 to 59 Years | 16 (5.3%) | 5 (1.1%) |
| 60 to 64 Years | 14 (4.6%) | 0 (0.0%) |
| 65 to 69 Years | 5 (1.6%) | 4 (0.9%) |
| 70 to 74 Years | 8 (2.6%) | 6 (1.4%) |
| 75 to 79 Years | 4 (1.3%) | 6 (1.4%) |
| 80 to 84 Years | 0 (0.0%) | 0 (0.0%) |
| 85 Years and over | 0 (0.0%) | 20 (4.6%) |
| Total | 304 (100.0%) | 433 (100.0%) |
Families and Households in El Refugio
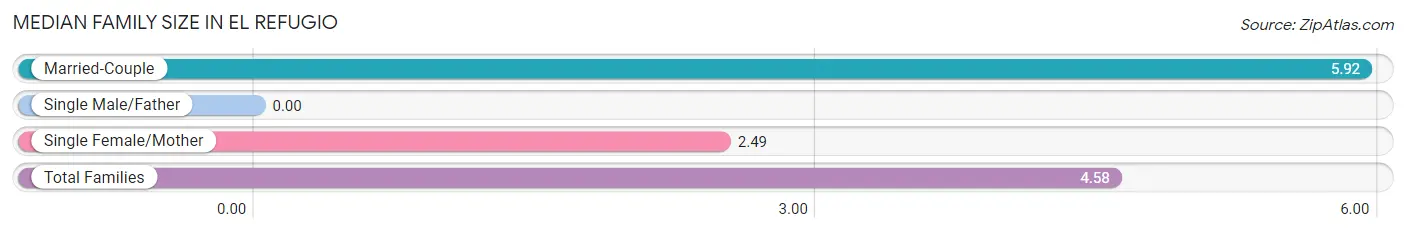
Median Family Size in El Refugio
| Family Type | # Families | Family Size |
| Married-Couple | 92 (60.9%) | 5.92 |
| Single Male/Father | 0 (0.0%) | - |
| Single Female/Mother | 59 (39.1%) | 2.49 |
| Total Families | 151 (100.0%) | 4.58 |
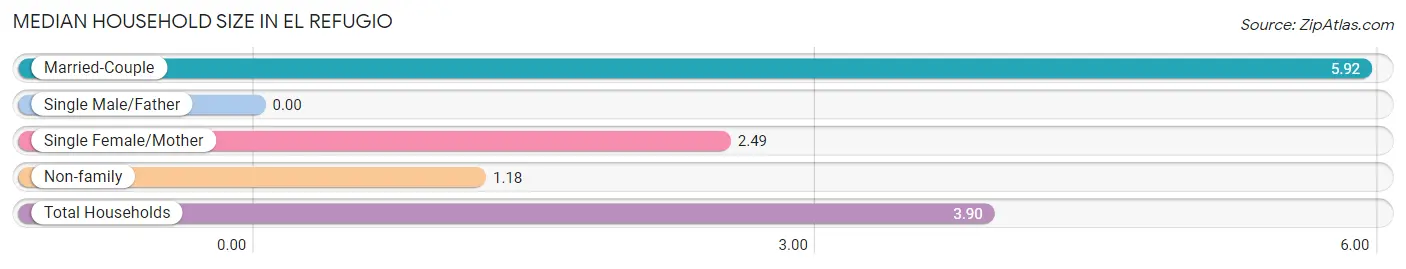
Median Household Size in El Refugio
| Household Type | # Households | Household Size |
| Married-Couple | 92 (48.7%) | 5.92 |
| Single Male/Father | 0 (0.0%) | - |
| Single Female/Mother | 59 (31.2%) | 2.49 |
| Non-family | 38 (20.1%) | 1.18 |
| Total Households | 189 (100.0%) | 3.90 |
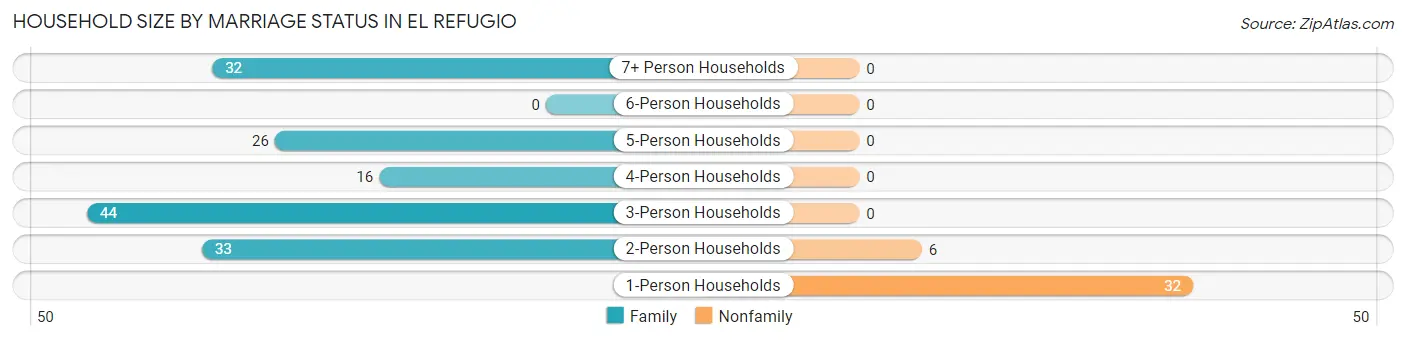
Household Size by Marriage Status in El Refugio
Out of a total of 189 households in El Refugio, 151 (79.9%) are family households, while 38 (20.1%) are nonfamily households. The most numerous type of family households are 3-person households, comprising 44, and the most common type of nonfamily households are 1-person households, comprising 32.
| Household Size | Family Households | Nonfamily Households |
| 1-Person Households | - | 32 (16.9%) |
| 2-Person Households | 33 (17.5%) | 6 (3.2%) |
| 3-Person Households | 44 (23.3%) | 0 (0.0%) |
| 4-Person Households | 16 (8.5%) | 0 (0.0%) |
| 5-Person Households | 26 (13.8%) | 0 (0.0%) |
| 6-Person Households | 0 (0.0%) | 0 (0.0%) |
| 7+ Person Households | 32 (16.9%) | 0 (0.0%) |
| Total | 151 (79.9%) | 38 (20.1%) |
Female Fertility in El Refugio
Fertility by Age in El Refugio
| Age Bracket | Women with Births | Births / 1,000 Women |
| 15 to 19 years | 0 (0.0%) | 0.0 |
| 20 to 34 years | 0 (0.0%) | 0.0 |
| 35 to 50 years | 0 (0.0%) | 0.0 |
| Total | 0 (0.0%) | 0.0 |
Fertility by Age by Marriage Status in El Refugio
| Age Bracket | Married | Unmarried |
| 15 to 19 years | 0 (0.0%) | 0 (0.0%) |
| 20 to 34 years | 0 (0.0%) | 0 (0.0%) |
| 35 to 50 years | 0 (0.0%) | 0 (0.0%) |
| Total | 0 (0.0%) | 0 (0.0%) |
Fertility by Education in El Refugio
| Educational Attainment | Women with Births | Births / 1,000 Women |
| Less than High School | 0 (0.0%) | 0.0 |
| High School Diploma | 0 (0.0%) | 0.0 |
| College or Associate's Degree | 0 (0.0%) | 0.0 |
| Bachelor's Degree | 0 (0.0%) | 0.0 |
| Graduate Degree | 0 (0.0%) | 0.0 |
| Total | 0 (0.0%) | 0.0 |
Fertility by Education by Marriage Status in El Refugio
| Educational Attainment | Married | Unmarried |
| Less than High School | 0 (0.0%) | 0 (0.0%) |
| High School Diploma | 0 (0.0%) | 0 (0.0%) |
| College or Associate's Degree | 0 (0.0%) | 0 (0.0%) |
| Bachelor's Degree | 0 (0.0%) | 0 (0.0%) |
| Graduate Degree | 0 (0.0%) | 0 (0.0%) |
| Total | 0 (0.0%) | 0 (0.0%) |
Income in El Refugio
Income Overview in El Refugio
Per Capita Income in El Refugio is $12,529, while median incomes of families and households are $47,942 and $44,650 respectively.
| Characteristic | Number | Measure |
| Per Capita Income | 737 | $12,529 |
| Median Family Income | 151 | $47,942 |
| Mean Family Income | 151 | $51,322 |
| Median Household Income | 189 | $44,650 |
| Mean Household Income | 189 | $46,397 |
| Income Deficit | 151 | $0 |
| Wage / Income Gap (%) | 737 | 0.00% |
| Wage / Income Gap ($) | 737 | 100.00¢ per $1 |
| Gini / Inequality Index | 737 | 0.27 |
Earnings by Sex in El Refugio
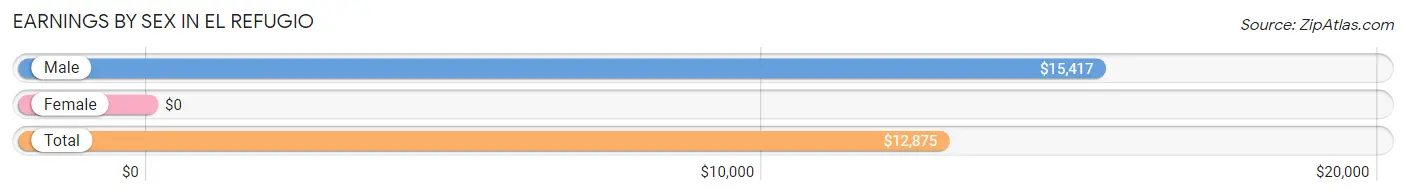
| Sex | Number | Average Earnings |
| Male | 180 (46.9%) | $15,417 |
| Female | 204 (53.1%) | $0 |
| Total | 384 (100.0%) | $12,875 |
Earnings by Sex by Income Bracket in El Refugio
The most common earnings brackets in El Refugio are $7,500 to $9,999 for men (44 | 24.4%) and $2,499 or less for women (47 | 23.0%).
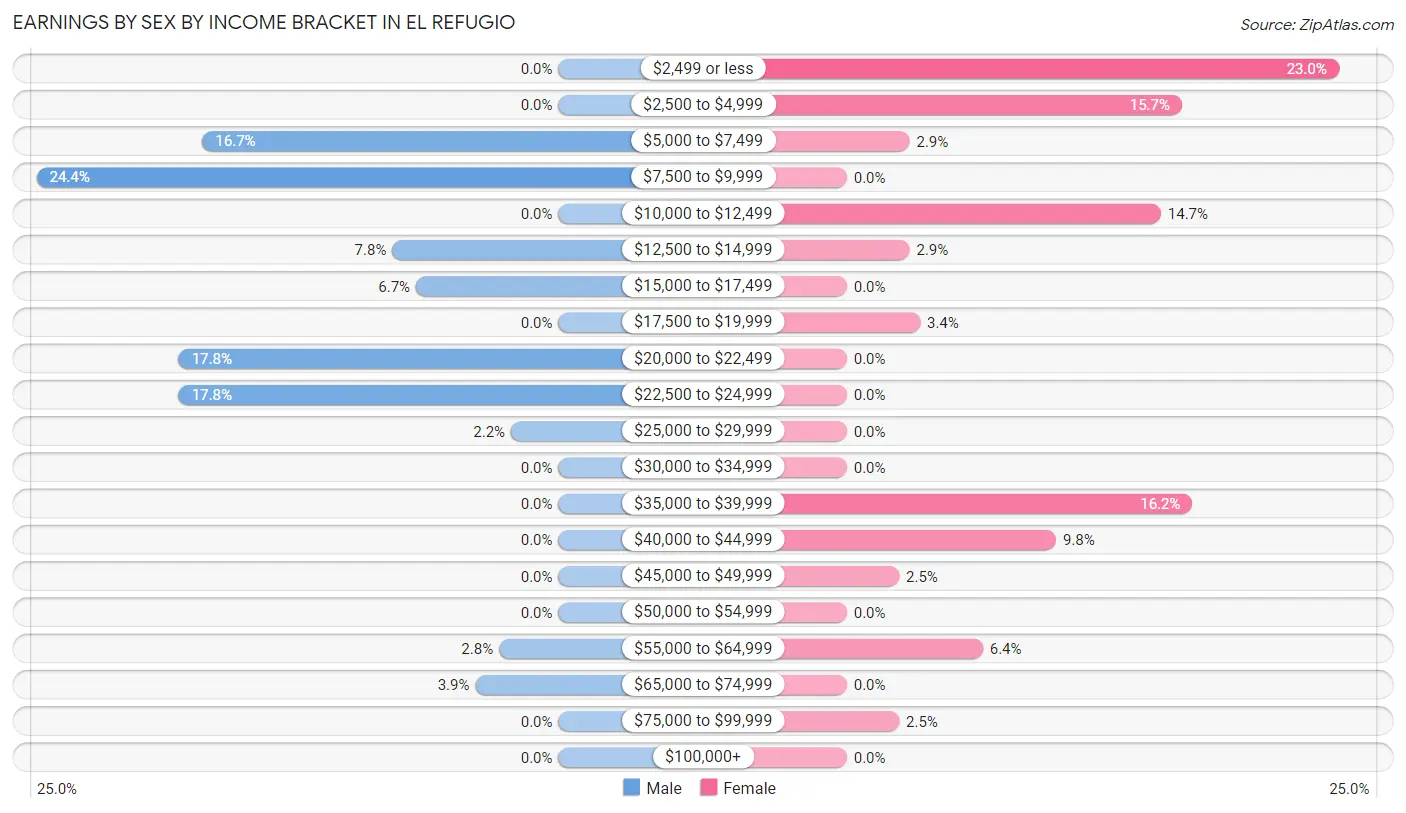
| Income | Male | Female |
| $2,499 or less | 0 (0.0%) | 47 (23.0%) |
| $2,500 to $4,999 | 0 (0.0%) | 32 (15.7%) |
| $5,000 to $7,499 | 30 (16.7%) | 6 (2.9%) |
| $7,500 to $9,999 | 44 (24.4%) | 0 (0.0%) |
| $10,000 to $12,499 | 0 (0.0%) | 30 (14.7%) |
| $12,500 to $14,999 | 14 (7.8%) | 6 (2.9%) |
| $15,000 to $17,499 | 12 (6.7%) | 0 (0.0%) |
| $17,500 to $19,999 | 0 (0.0%) | 7 (3.4%) |
| $20,000 to $22,499 | 32 (17.8%) | 0 (0.0%) |
| $22,500 to $24,999 | 32 (17.8%) | 0 (0.0%) |
| $25,000 to $29,999 | 4 (2.2%) | 0 (0.0%) |
| $30,000 to $34,999 | 0 (0.0%) | 0 (0.0%) |
| $35,000 to $39,999 | 0 (0.0%) | 33 (16.2%) |
| $40,000 to $44,999 | 0 (0.0%) | 20 (9.8%) |
| $45,000 to $49,999 | 0 (0.0%) | 5 (2.5%) |
| $50,000 to $54,999 | 0 (0.0%) | 0 (0.0%) |
| $55,000 to $64,999 | 5 (2.8%) | 13 (6.4%) |
| $65,000 to $74,999 | 7 (3.9%) | 0 (0.0%) |
| $75,000 to $99,999 | 0 (0.0%) | 5 (2.5%) |
| $100,000+ | 0 (0.0%) | 0 (0.0%) |
| Total | 180 (100.0%) | 204 (100.0%) |
Earnings by Sex by Educational Attainment in El Refugio
Average earnings in El Refugio are $21,250 for men and $38,977 for women, a difference of 45.5%. Men with an educational attainment of college or associate's degree enjoy the highest average annual earnings of $22,188, while those with college or associate's degree education earn the least with $22,188. Women with an educational attainment of bachelor's degree earn the most with the average annual earnings of $58,750, while those with high school diploma education have the smallest earnings of $38,598.
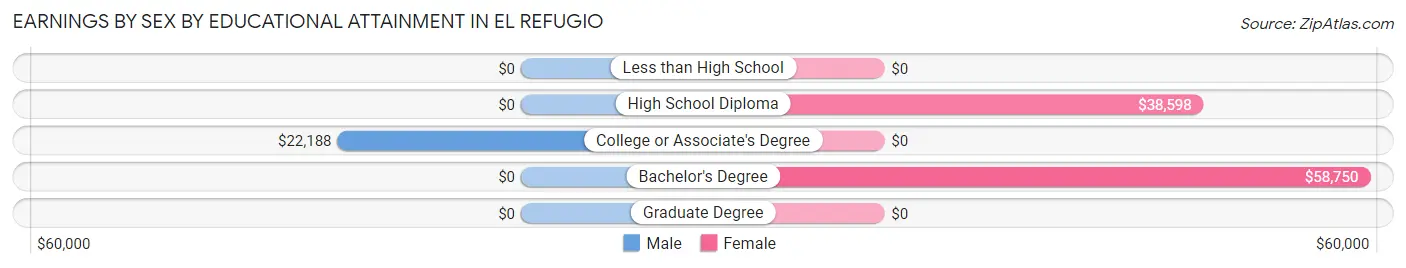
| Educational Attainment | Male Income | Female Income |
| Less than High School | - | - |
| High School Diploma | - | - |
| College or Associate's Degree | $22,188 | $0 |
| Bachelor's Degree | - | - |
| Graduate Degree | - | - |
| Total | $21,250 | $38,977 |
Family Income in El Refugio
Family Income Brackets in El Refugio
According to the El Refugio family income data, there are 110 families falling into the $35,000 to $49,999 income range, which is the most common income bracket and makes up 72.9% of all families.
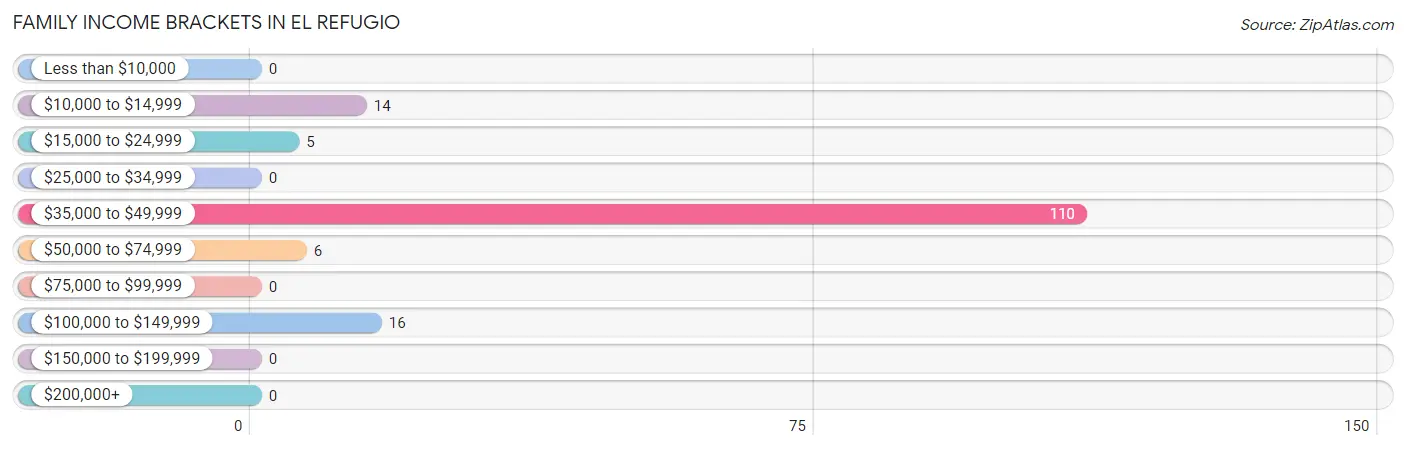
| Income Bracket | # Families | % Families |
| Less than $10,000 | 0 | 0.0% |
| $10,000 to $14,999 | 14 | 9.3% |
| $15,000 to $24,999 | 5 | 3.3% |
| $25,000 to $34,999 | 0 | 0.0% |
| $35,000 to $49,999 | 110 | 72.8% |
| $50,000 to $74,999 | 6 | 4.0% |
| $75,000 to $99,999 | 0 | 0.0% |
| $100,000 to $149,999 | 16 | 10.6% |
| $150,000 to $199,999 | 0 | 0.0% |
| $200,000+ | 0 | 0.0% |
Family Income by Famaliy Size in El Refugio
3-person families (44 | 29.1%) account for the highest median family income in El Refugio with $48,788 per family, while 2-person families (33 | 21.8%) have the highest median income of $21,969 per family member.
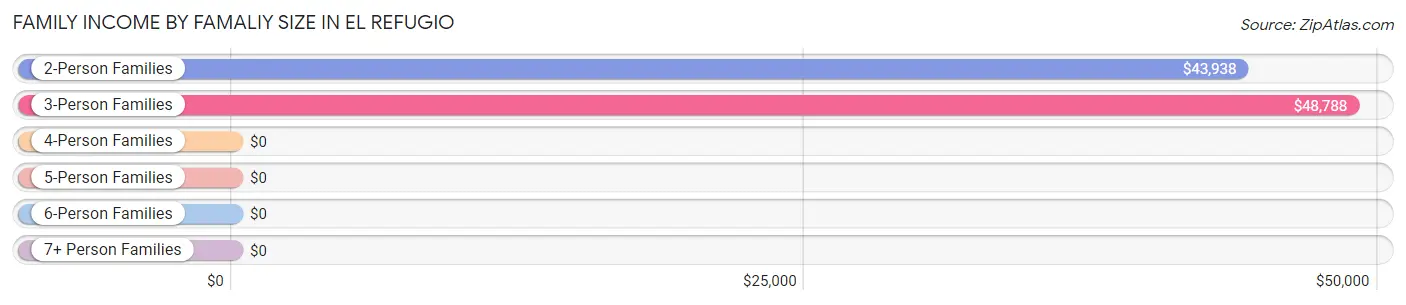
| Income Bracket | # Families | Median Income |
| 2-Person Families | 33 (21.8%) | $43,938 |
| 3-Person Families | 44 (29.1%) | $48,788 |
| 4-Person Families | 16 (10.6%) | $0 |
| 5-Person Families | 26 (17.2%) | $0 |
| 6-Person Families | 0 (0.0%) | $0 |
| 7+ Person Families | 32 (21.2%) | $0 |
| Total | 151 (100.0%) | $47,942 |
Family Income by Number of Earners in El Refugio
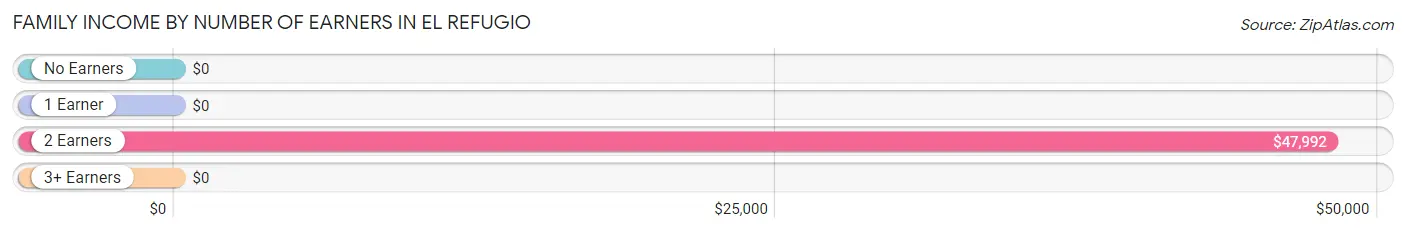
| Number of Earners | # Families | Median Income |
| No Earners | 4 (2.6%) | $0 |
| 1 Earner | 30 (19.9%) | $0 |
| 2 Earners | 85 (56.3%) | $47,992 |
| 3+ Earners | 32 (21.2%) | $0 |
| Total | 151 (100.0%) | $47,942 |
Household Income in El Refugio
Household Income Brackets in El Refugio
With 130 households falling in the category, the $35,000 to $49,999 income range is the most frequent in El Refugio, accounting for 68.8% of all households.
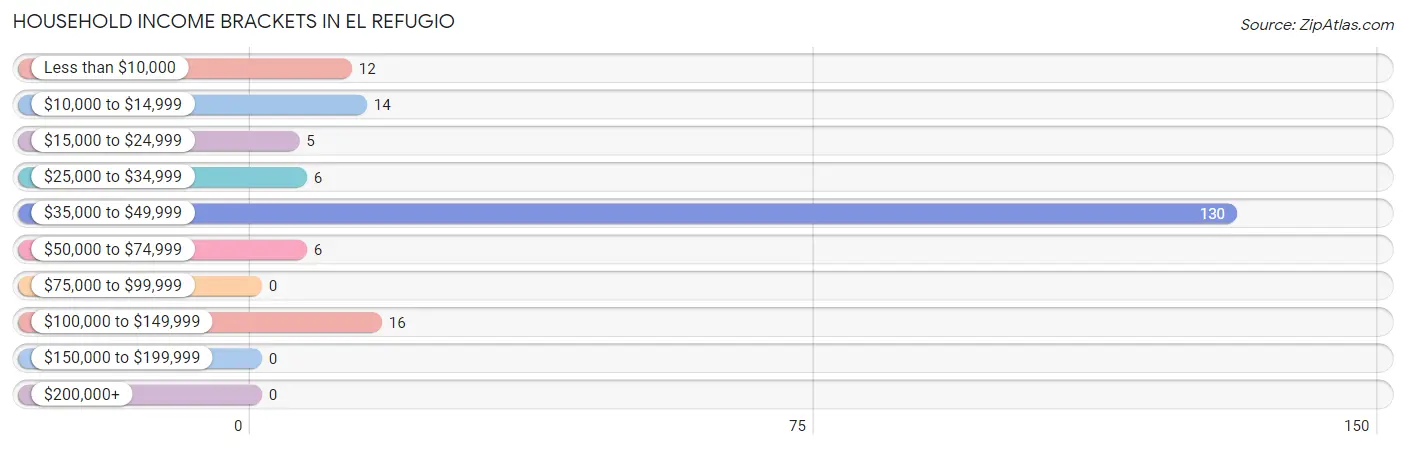
| Income Bracket | # Households | % Households |
| Less than $10,000 | 12 | 6.3% |
| $10,000 to $14,999 | 14 | 7.4% |
| $15,000 to $24,999 | 5 | 2.6% |
| $25,000 to $34,999 | 6 | 3.2% |
| $35,000 to $49,999 | 130 | 68.8% |
| $50,000 to $74,999 | 6 | 3.2% |
| $75,000 to $99,999 | 0 | 0.0% |
| $100,000 to $149,999 | 16 | 8.5% |
| $150,000 to $199,999 | 0 | 0.0% |
| $200,000+ | 0 | 0.0% |
Household Income by Householder Age in El Refugio
The median household income in El Refugio is $44,650, with the highest median household income of $48,333 found in the 25 to 44 years age bracket for the primary householder. A total of 58 households (30.7%) fall into this category. Meanwhile, the 15 to 24 years age bracket for the primary householder has the lowest median household income of $0, with 14 households (7.4%) in this group.
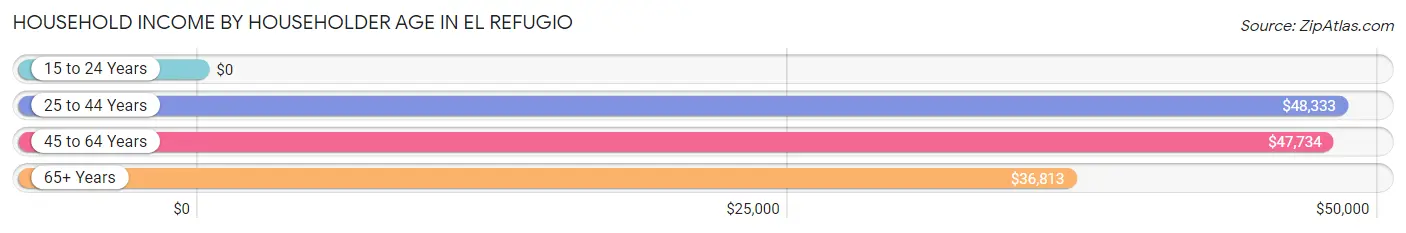
| Income Bracket | # Households | Median Income |
| 15 to 24 Years | 14 (7.4%) | $0 |
| 25 to 44 Years | 58 (30.7%) | $48,333 |
| 45 to 64 Years | 88 (46.6%) | $47,734 |
| 65+ Years | 29 (15.3%) | $36,813 |
| Total | 189 (100.0%) | $44,650 |
Poverty in El Refugio
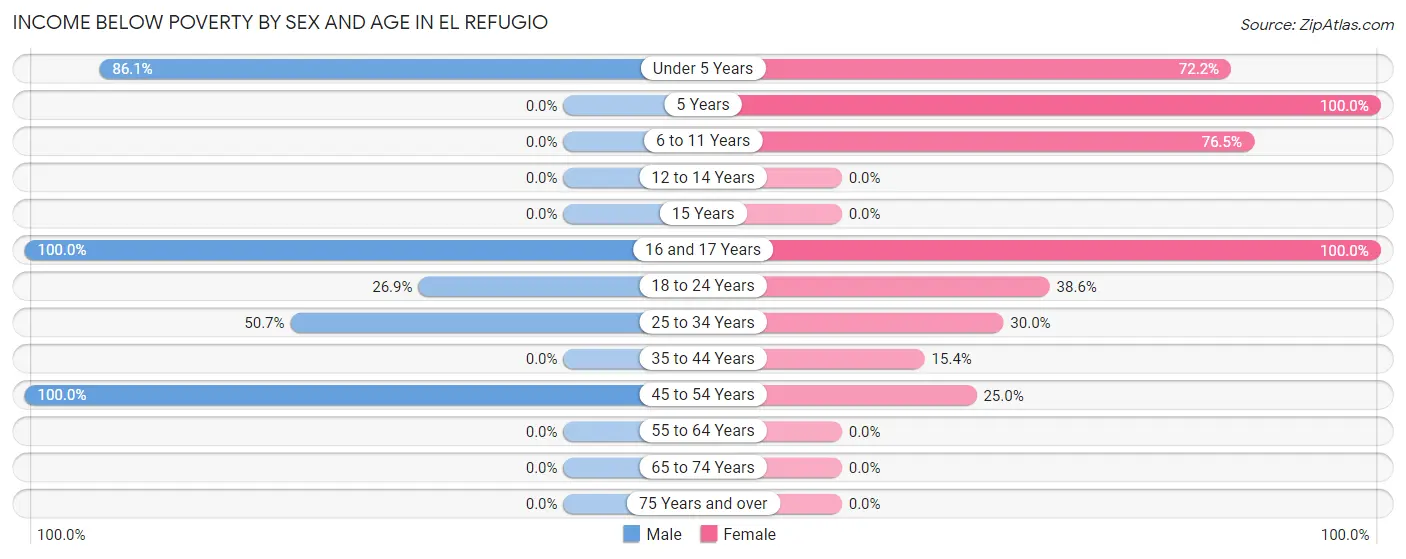
Income Below Poverty by Sex and Age in El Refugio
With 54.3% poverty level for males and 39.7% for females among the residents of El Refugio, 16 and 17 year old males and 5 year old females are the most vulnerable to poverty, with 19 males (100.0%) and 26 females (100.0%) in their respective age groups living below the poverty level.
| Age Bracket | Male | Female |
| Under 5 Years | 62 (86.1%) | 26 (72.2%) |
| 5 Years | 0 (0.0%) | 26 (100.0%) |
| 6 to 11 Years | 0 (0.0%) | 26 (76.5%) |
| 12 to 14 Years | 0 (0.0%) | 0 (0.0%) |
| 15 Years | 0 (0.0%) | 0 (0.0%) |
| 16 and 17 Years | 19 (100.0%) | 15 (100.0%) |
| 18 to 24 Years | 14 (26.9%) | 49 (38.6%) |
| 25 to 34 Years | 38 (50.7%) | 6 (30.0%) |
| 35 to 44 Years | 0 (0.0%) | 6 (15.4%) |
| 45 to 54 Years | 32 (100.0%) | 18 (25.0%) |
| 55 to 64 Years | 0 (0.0%) | 0 (0.0%) |
| 65 to 74 Years | 0 (0.0%) | 0 (0.0%) |
| 75 Years and over | 0 (0.0%) | 0 (0.0%) |
| Total | 165 (54.3%) | 172 (39.7%) |
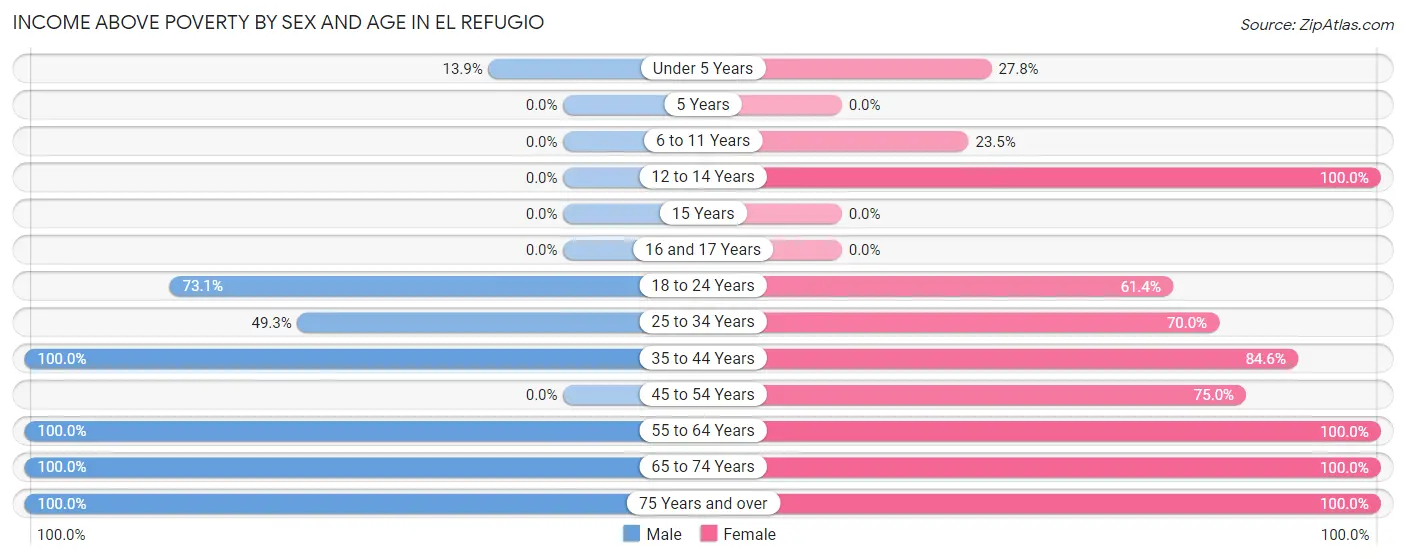
Income Above Poverty by Sex and Age in El Refugio
According to the poverty statistics in El Refugio, males aged 35 to 44 years and females aged 12 to 14 years are the age groups that are most secure financially, with 100.0% of males and 100.0% of females in these age groups living above the poverty line.
| Age Bracket | Male | Female |
| Under 5 Years | 10 (13.9%) | 10 (27.8%) |
| 5 Years | 0 (0.0%) | 0 (0.0%) |
| 6 to 11 Years | 0 (0.0%) | 8 (23.5%) |
| 12 to 14 Years | 0 (0.0%) | 23 (100.0%) |
| 15 Years | 0 (0.0%) | 0 (0.0%) |
| 16 and 17 Years | 0 (0.0%) | 0 (0.0%) |
| 18 to 24 Years | 38 (73.1%) | 78 (61.4%) |
| 25 to 34 Years | 37 (49.3%) | 14 (70.0%) |
| 35 to 44 Years | 7 (100.0%) | 33 (84.6%) |
| 45 to 54 Years | 0 (0.0%) | 54 (75.0%) |
| 55 to 64 Years | 30 (100.0%) | 5 (100.0%) |
| 65 to 74 Years | 13 (100.0%) | 10 (100.0%) |
| 75 Years and over | 4 (100.0%) | 26 (100.0%) |
| Total | 139 (45.7%) | 261 (60.3%) |
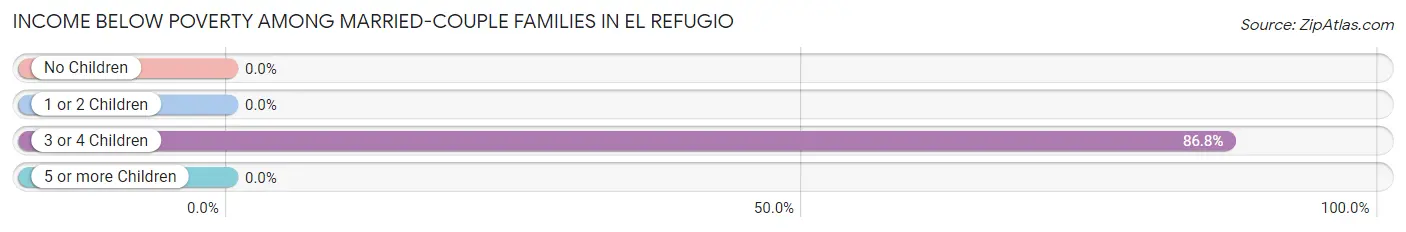
Income Below Poverty Among Married-Couple Families in El Refugio
The poverty statistics for married-couple families in El Refugio show that 50.0% or 46 of the total 92 families live below the poverty line. Families with 3 or 4 children have the highest poverty rate of 86.8%, comprising of 46 families. On the other hand, families with no children have the lowest poverty rate of 0.0%, which includes 0 families.
| Children | Above Poverty | Below Poverty |
| No Children | 34 (100.0%) | 0 (0.0%) |
| 1 or 2 Children | 5 (100.0%) | 0 (0.0%) |
| 3 or 4 Children | 7 (13.2%) | 46 (86.8%) |
| 5 or more Children | 0 (0.0%) | 0 (0.0%) |
| Total | 46 (50.0%) | 46 (50.0%) |
Income Below Poverty Among Single-Parent Households in El Refugio
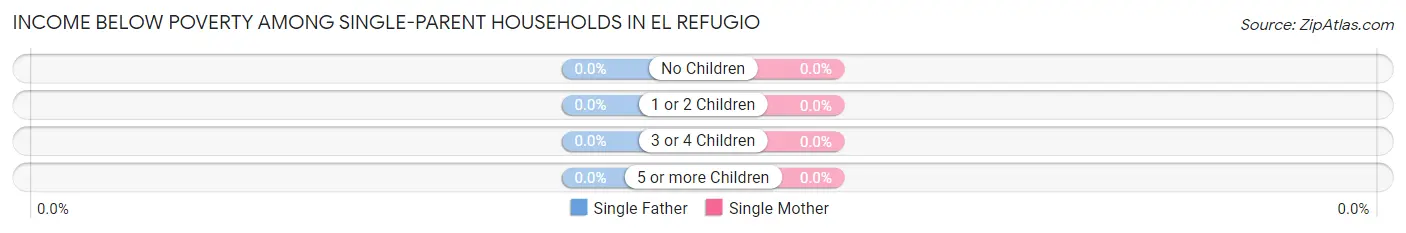
| Children | Single Father | Single Mother |
| No Children | 0 (0.0%) | 0 (0.0%) |
| 1 or 2 Children | 0 (0.0%) | 0 (0.0%) |
| 3 or 4 Children | 0 (0.0%) | 0 (0.0%) |
| 5 or more Children | 0 (0.0%) | 0 (0.0%) |
| Total | 0 (0.0%) | 0 (0.0%) |
Income Below Poverty Among Married-Couple vs Single-Parent Households in El Refugio
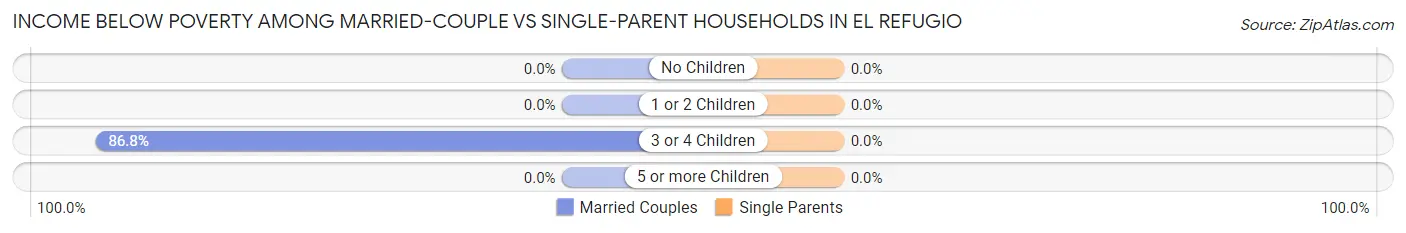
| Children | Married-Couple Families | Single-Parent Households |
| No Children | 0 (0.0%) | 0 (0.0%) |
| 1 or 2 Children | 0 (0.0%) | 0 (0.0%) |
| 3 or 4 Children | 46 (86.8%) | 0 (0.0%) |
| 5 or more Children | 0 (0.0%) | 0 (0.0%) |
| Total | 46 (50.0%) | 0 (0.0%) |
Employment Characteristics in El Refugio
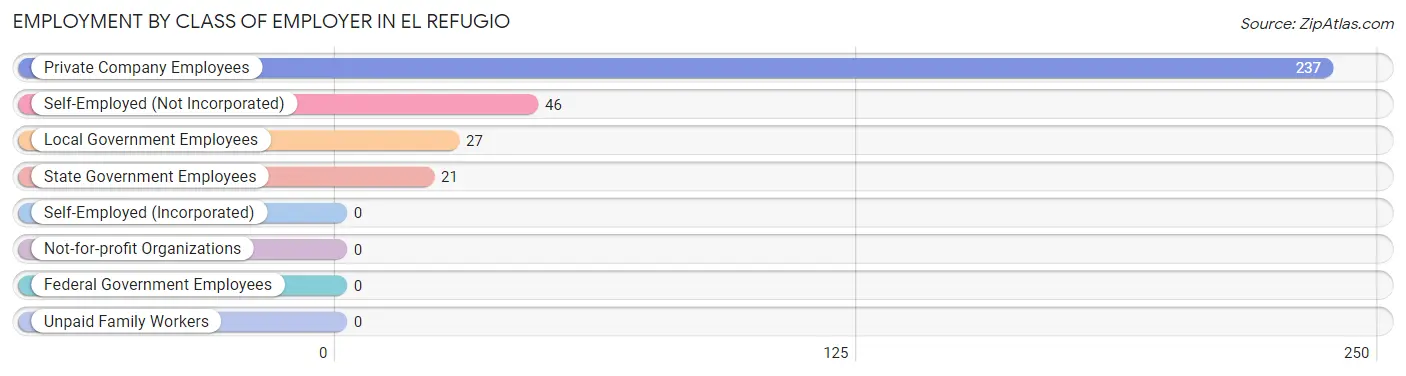
Employment by Class of Employer in El Refugio
Among the 331 employed individuals in El Refugio, private company employees (237 | 71.6%), self-employed (not incorporated) (46 | 13.9%), and local government employees (27 | 8.2%) make up the most common classes of employment.
| Employer Class | # Employees | % Employees |
| Private Company Employees | 237 | 71.6% |
| Self-Employed (Incorporated) | 0 | 0.0% |
| Self-Employed (Not Incorporated) | 46 | 13.9% |
| Not-for-profit Organizations | 0 | 0.0% |
| Local Government Employees | 27 | 8.2% |
| State Government Employees | 21 | 6.3% |
| Federal Government Employees | 0 | 0.0% |
| Unpaid Family Workers | 0 | 0.0% |
| Total | 331 | 100.0% |
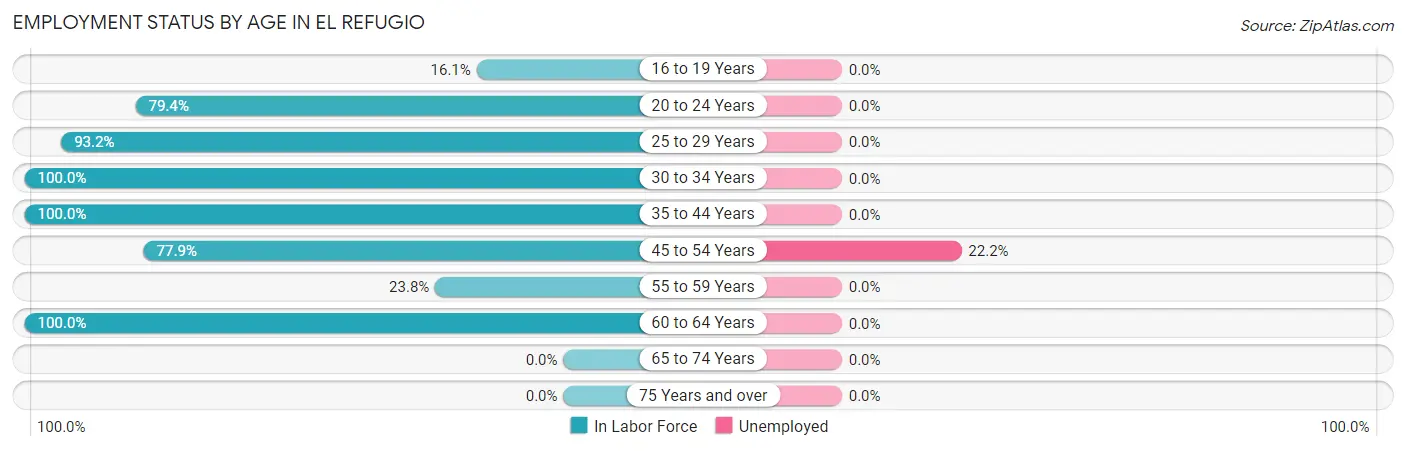
Employment Status by Age in El Refugio
According to the labor force statistics for El Refugio, out of the total population over 16 years of age (546), 63.9% or 349 individuals are in the labor force, with 5.2% or 18 of them unemployed. The age group with the highest labor force participation rate is 30 to 34 years, with 100.0% or 7 individuals in the labor force. Within the labor force, the 45 to 54 years age range has the highest percentage of unemployed individuals, with 22.2% or 18 of them being unemployed.
| Age Bracket | In Labor Force | Unemployed |
| 16 to 19 Years | 14 (16.1%) | 0 (0.0%) |
| 20 to 24 Years | 100 (79.4%) | 0 (0.0%) |
| 25 to 29 Years | 82 (93.2%) | 0 (0.0%) |
| 30 to 34 Years | 7 (100.0%) | 0 (0.0%) |
| 35 to 44 Years | 46 (100.0%) | 0 (0.0%) |
| 45 to 54 Years | 81 (77.9%) | 18 (22.2%) |
| 55 to 59 Years | 5 (23.8%) | 0 (0.0%) |
| 60 to 64 Years | 14 (100.0%) | 0 (0.0%) |
| 65 to 74 Years | 0 (0.0%) | 0 (0.0%) |
| 75 Years and over | 0 (0.0%) | 0 (0.0%) |
| Total | 349 (63.9%) | 18 (5.2%) |
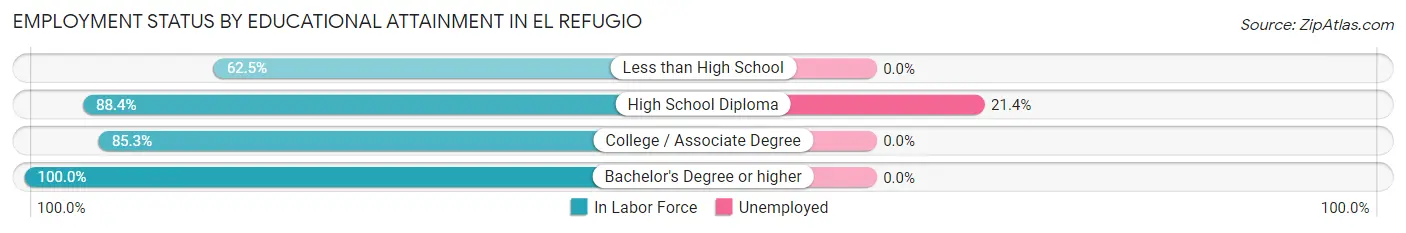
Employment Status by Educational Attainment in El Refugio
According to labor force statistics for El Refugio, 83.9% of individuals (235) out of the total population between 25 and 64 years of age (280) are in the labor force, with 7.7% or 18 of them being unemployed. The group with the highest labor force participation rate are those with the educational attainment of bachelor's degree or higher, with 100.0% or 28 individuals in the labor force. Within the labor force, individuals with high school diploma education have the highest percentage of unemployment, with 21.4% or 18 of them being unemployed.
| Educational Attainment | In Labor Force | Unemployed |
| Less than High School | 30 (62.5%) | 0 (0.0%) |
| High School Diploma | 84 (88.4%) | 20 (21.4%) |
| College / Associate Degree | 93 (85.3%) | 0 (0.0%) |
| Bachelor's Degree or higher | 28 (100.0%) | 0 (0.0%) |
| Total | 235 (83.9%) | 22 (7.7%) |
Employment Occupations by Sex in El Refugio
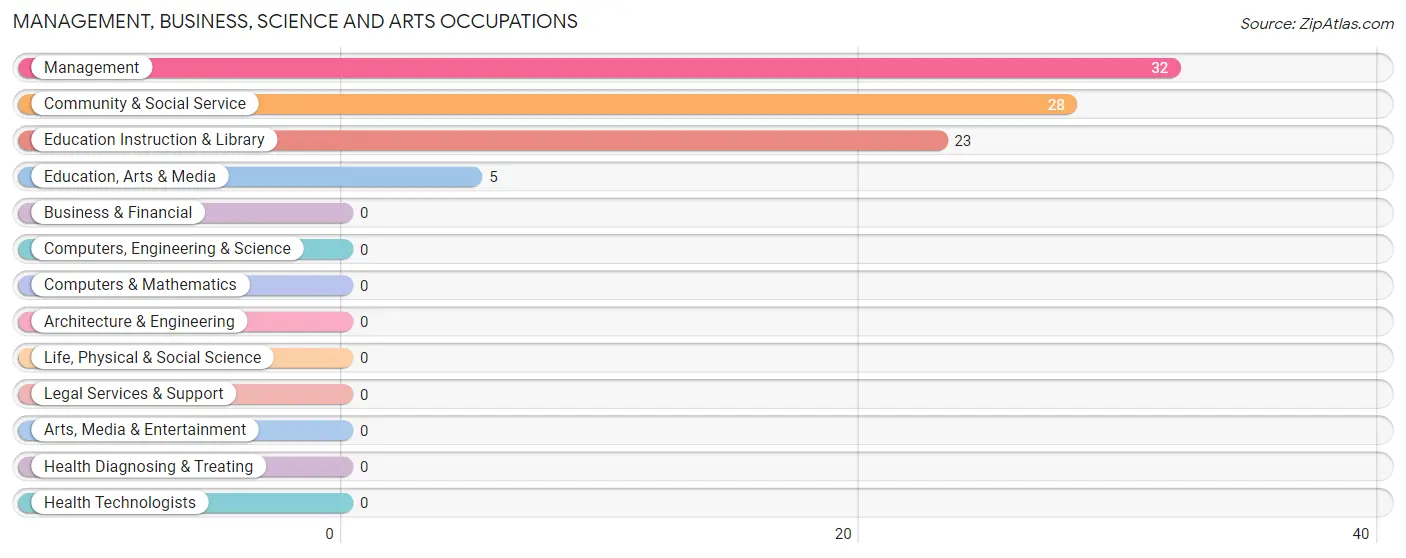
Management, Business, Science and Arts Occupations
The most common Management, Business, Science and Arts occupations in El Refugio are Management (32 | 9.7%), Community & Social Service (28 | 8.5%), Education Instruction & Library (23 | 7.0%), and Education, Arts & Media (5 | 1.5%).
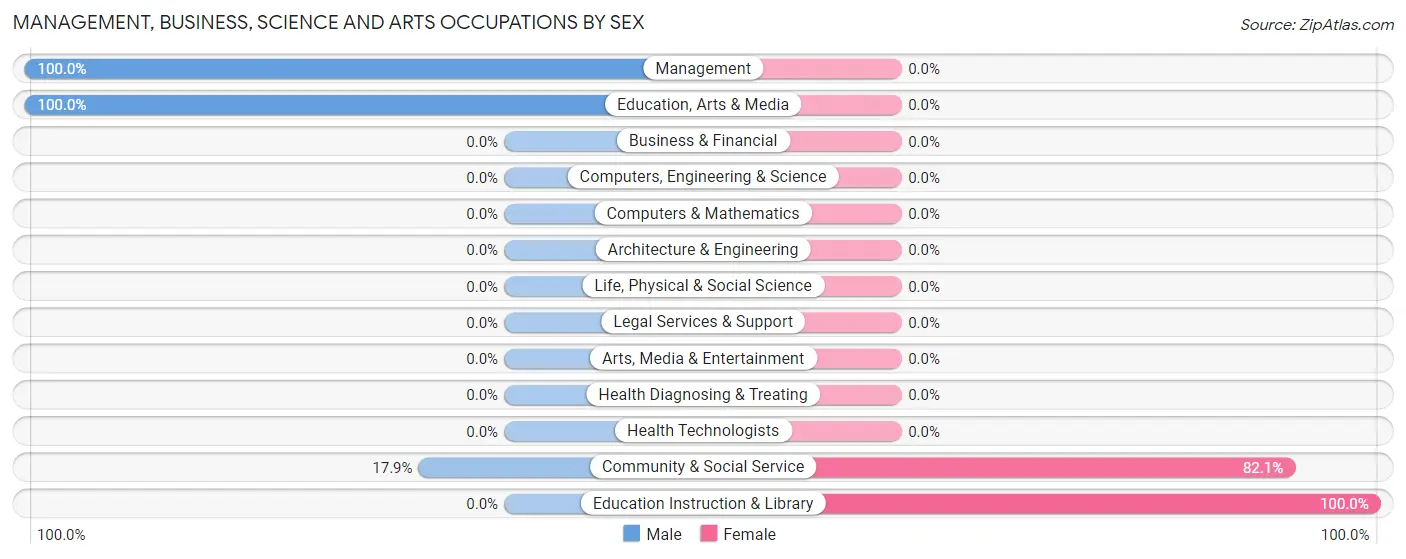
Management, Business, Science and Arts Occupations by Sex
Within the Management, Business, Science and Arts occupations in El Refugio, the most male-oriented occupations are Management (100.0%), Education, Arts & Media (100.0%), and Community & Social Service (17.9%), while the most female-oriented occupations are Education Instruction & Library (100.0%), and Community & Social Service (82.1%).
| Occupation | Male | Female |
| Management | 32 (100.0%) | 0 (0.0%) |
| Business & Financial | 0 (0.0%) | 0 (0.0%) |
| Computers, Engineering & Science | 0 (0.0%) | 0 (0.0%) |
| Computers & Mathematics | 0 (0.0%) | 0 (0.0%) |
| Architecture & Engineering | 0 (0.0%) | 0 (0.0%) |
| Life, Physical & Social Science | 0 (0.0%) | 0 (0.0%) |
| Community & Social Service | 5 (17.9%) | 23 (82.1%) |
| Education, Arts & Media | 5 (100.0%) | 0 (0.0%) |
| Legal Services & Support | 0 (0.0%) | 0 (0.0%) |
| Education Instruction & Library | 0 (0.0%) | 23 (100.0%) |
| Arts, Media & Entertainment | 0 (0.0%) | 0 (0.0%) |
| Health Diagnosing & Treating | 0 (0.0%) | 0 (0.0%) |
| Health Technologists | 0 (0.0%) | 0 (0.0%) |
| Total (Category) | 37 (61.7%) | 23 (38.3%) |
| Total (Overall) | 180 (54.4%) | 151 (45.6%) |
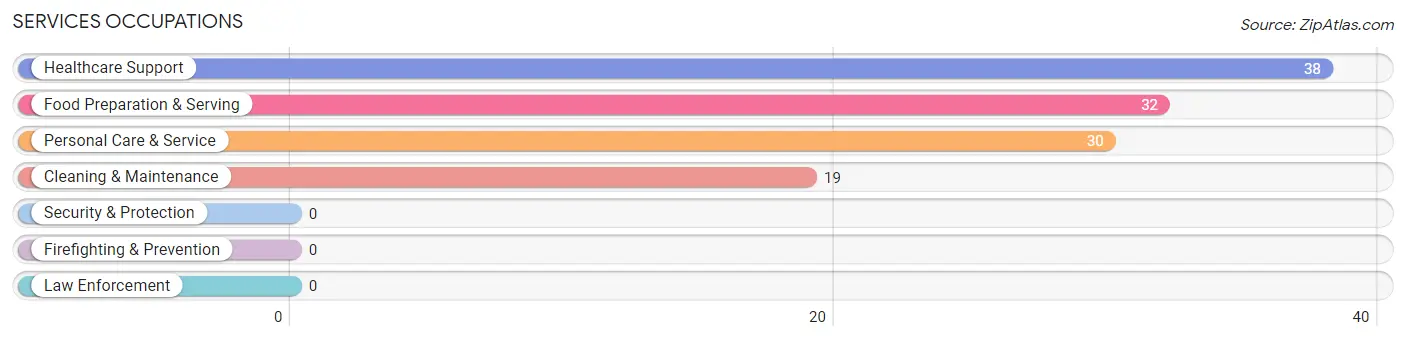
Services Occupations
The most common Services occupations in El Refugio are Healthcare Support (38 | 11.5%), Food Preparation & Serving (32 | 9.7%), Personal Care & Service (30 | 9.1%), and Cleaning & Maintenance (19 | 5.7%).
Services Occupations by Sex
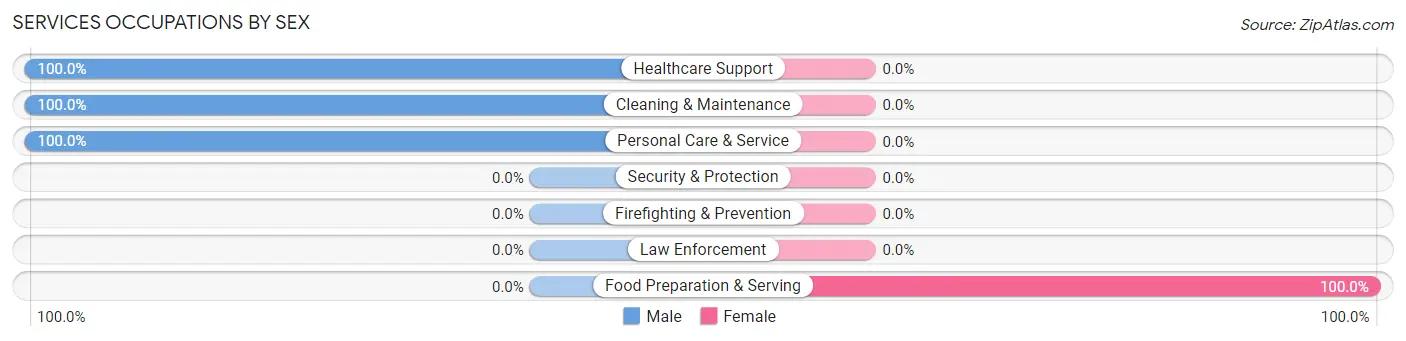
| Occupation | Male | Female |
| Healthcare Support | 38 (100.0%) | 0 (0.0%) |
| Security & Protection | 0 (0.0%) | 0 (0.0%) |
| Firefighting & Prevention | 0 (0.0%) | 0 (0.0%) |
| Law Enforcement | 0 (0.0%) | 0 (0.0%) |
| Food Preparation & Serving | 0 (0.0%) | 32 (100.0%) |
| Cleaning & Maintenance | 19 (100.0%) | 0 (0.0%) |
| Personal Care & Service | 30 (100.0%) | 0 (0.0%) |
| Total (Category) | 87 (73.1%) | 32 (26.9%) |
| Total (Overall) | 180 (54.4%) | 151 (45.6%) |
Sales and Office Occupations
The most common Sales and Office occupations in El Refugio are Office & Administration (53 | 16.0%), and Sales & Related (50 | 15.1%).

Sales and Office Occupations by Sex
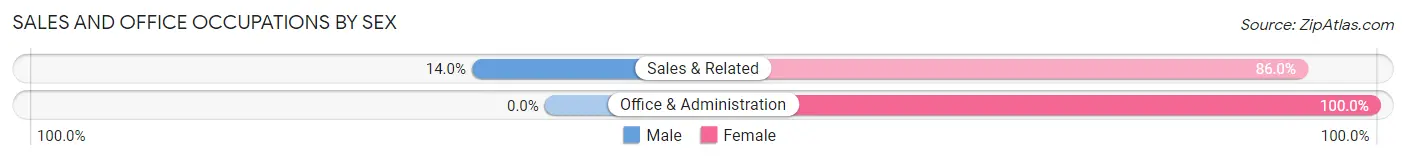
| Occupation | Male | Female |
| Sales & Related | 7 (14.0%) | 43 (86.0%) |
| Office & Administration | 0 (0.0%) | 53 (100.0%) |
| Total (Category) | 7 (6.8%) | 96 (93.2%) |
| Total (Overall) | 180 (54.4%) | 151 (45.6%) |
Natural Resources, Construction and Maintenance Occupations
The most common Natural Resources, Construction and Maintenance occupations in El Refugio are Installation, Maintenance & Repair (32 | 9.7%), and Construction & Extraction (13 | 3.9%).

Natural Resources, Construction and Maintenance Occupations by Sex
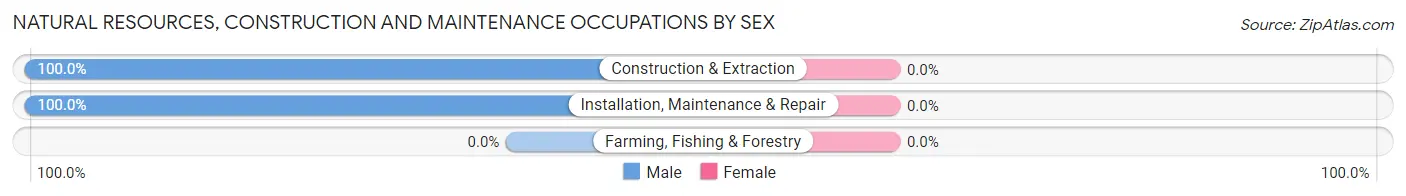
| Occupation | Male | Female |
| Farming, Fishing & Forestry | 0 (0.0%) | 0 (0.0%) |
| Construction & Extraction | 13 (100.0%) | 0 (0.0%) |
| Installation, Maintenance & Repair | 32 (100.0%) | 0 (0.0%) |
| Total (Category) | 45 (100.0%) | 0 (0.0%) |
| Total (Overall) | 180 (54.4%) | 151 (45.6%) |
Production, Transportation and Moving Occupations
The most common Production, Transportation and Moving occupations in El Refugio are , and Transportation (4 | 1.2%).
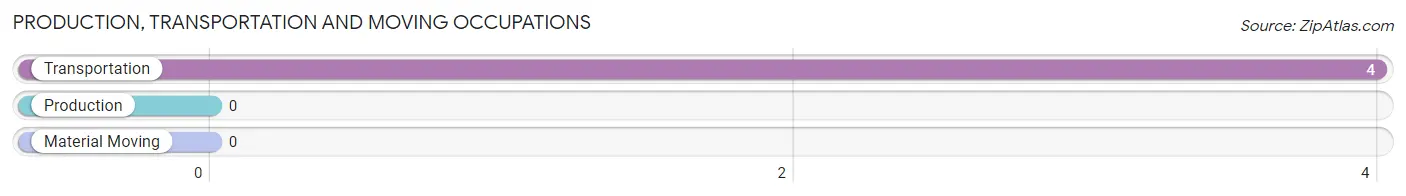
Production, Transportation and Moving Occupations by Sex
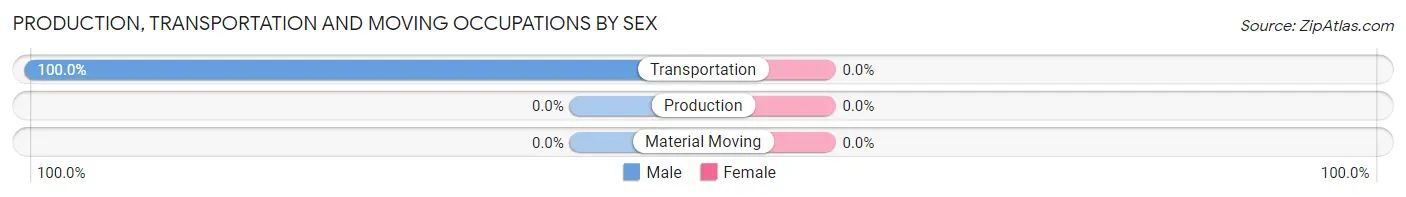
| Occupation | Male | Female |
| Production | 0 (0.0%) | 0 (0.0%) |
| Transportation | 4 (100.0%) | 0 (0.0%) |
| Material Moving | 0 (0.0%) | 0 (0.0%) |
| Total (Category) | 4 (100.0%) | 0 (0.0%) |
| Total (Overall) | 180 (54.4%) | 151 (45.6%) |
Employment Industries by Sex in El Refugio
Employment Industries in El Refugio
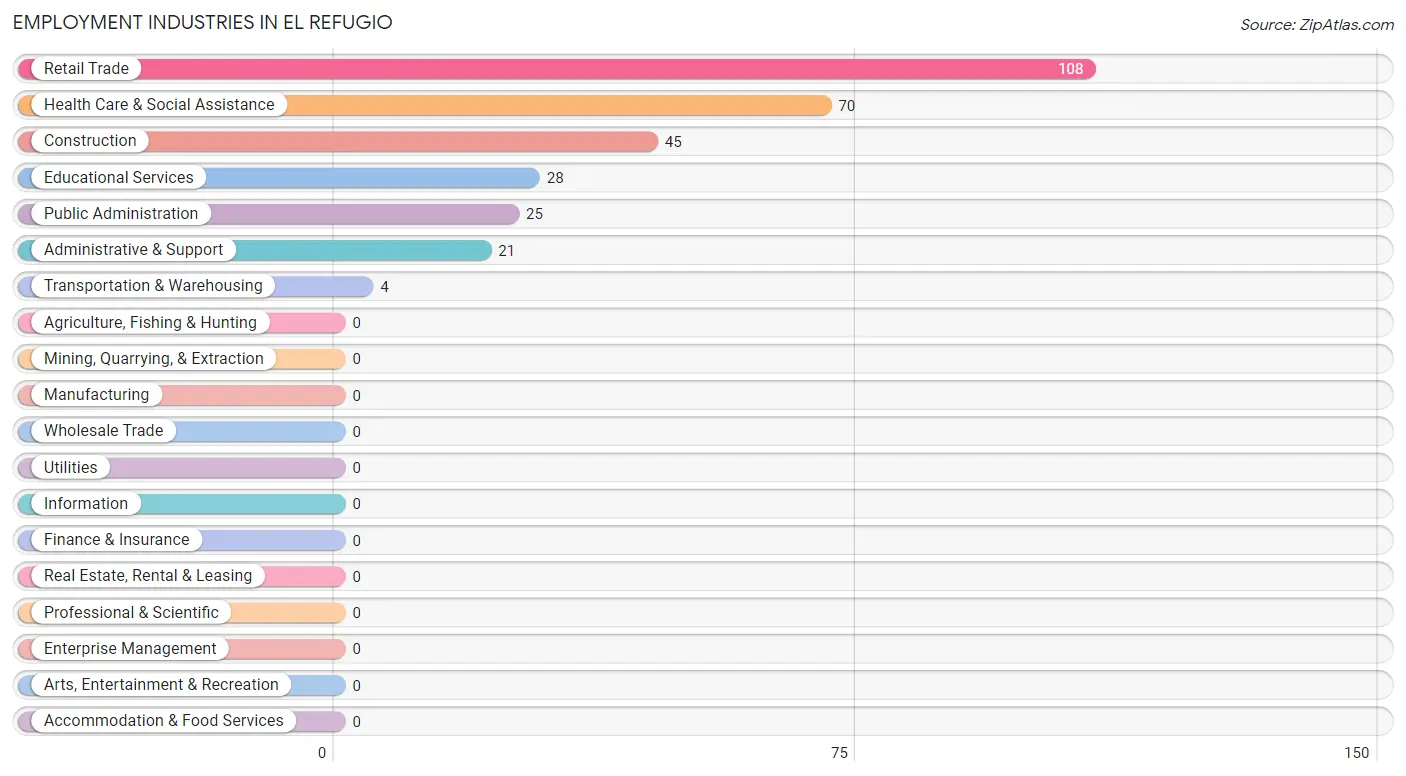
The major employment industries in El Refugio include Retail Trade (108 | 32.6%), Health Care & Social Assistance (70 | 21.1%), Construction (45 | 13.6%), Educational Services (28 | 8.5%), and Public Administration (25 | 7.5%).
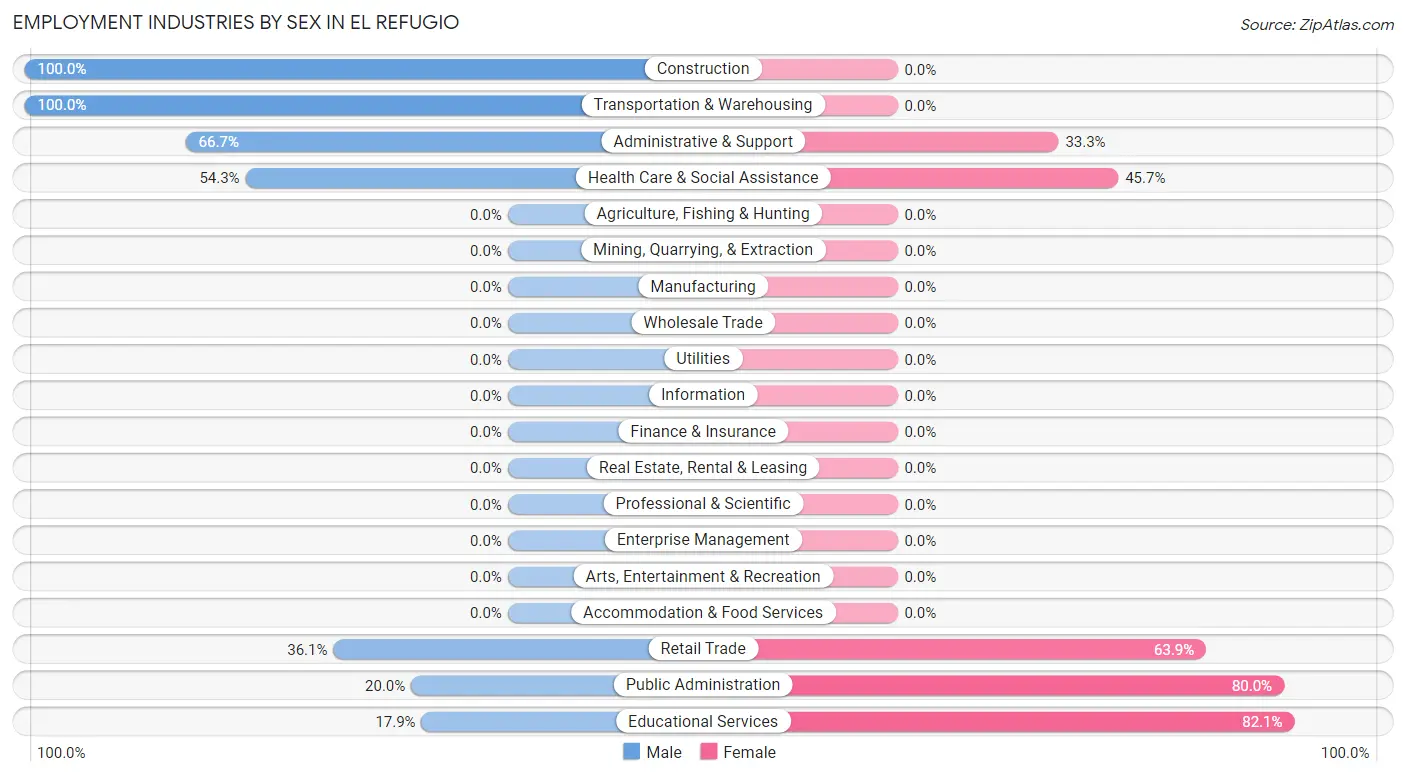
Employment Industries by Sex in El Refugio
The El Refugio industries that see more men than women are Construction (100.0%), Transportation & Warehousing (100.0%), and Administrative & Support (66.7%), whereas the industries that tend to have a higher number of women are Educational Services (82.1%), Public Administration (80.0%), and Retail Trade (63.9%).
| Industry | Male | Female |
| Agriculture, Fishing & Hunting | 0 (0.0%) | 0 (0.0%) |
| Mining, Quarrying, & Extraction | 0 (0.0%) | 0 (0.0%) |
| Construction | 45 (100.0%) | 0 (0.0%) |
| Manufacturing | 0 (0.0%) | 0 (0.0%) |
| Wholesale Trade | 0 (0.0%) | 0 (0.0%) |
| Retail Trade | 39 (36.1%) | 69 (63.9%) |
| Transportation & Warehousing | 4 (100.0%) | 0 (0.0%) |
| Utilities | 0 (0.0%) | 0 (0.0%) |
| Information | 0 (0.0%) | 0 (0.0%) |
| Finance & Insurance | 0 (0.0%) | 0 (0.0%) |
| Real Estate, Rental & Leasing | 0 (0.0%) | 0 (0.0%) |
| Professional & Scientific | 0 (0.0%) | 0 (0.0%) |
| Enterprise Management | 0 (0.0%) | 0 (0.0%) |
| Administrative & Support | 14 (66.7%) | 7 (33.3%) |
| Educational Services | 5 (17.9%) | 23 (82.1%) |
| Health Care & Social Assistance | 38 (54.3%) | 32 (45.7%) |
| Arts, Entertainment & Recreation | 0 (0.0%) | 0 (0.0%) |
| Accommodation & Food Services | 0 (0.0%) | 0 (0.0%) |
| Public Administration | 5 (20.0%) | 20 (80.0%) |
| Total | 180 (54.4%) | 151 (45.6%) |
Education in El Refugio
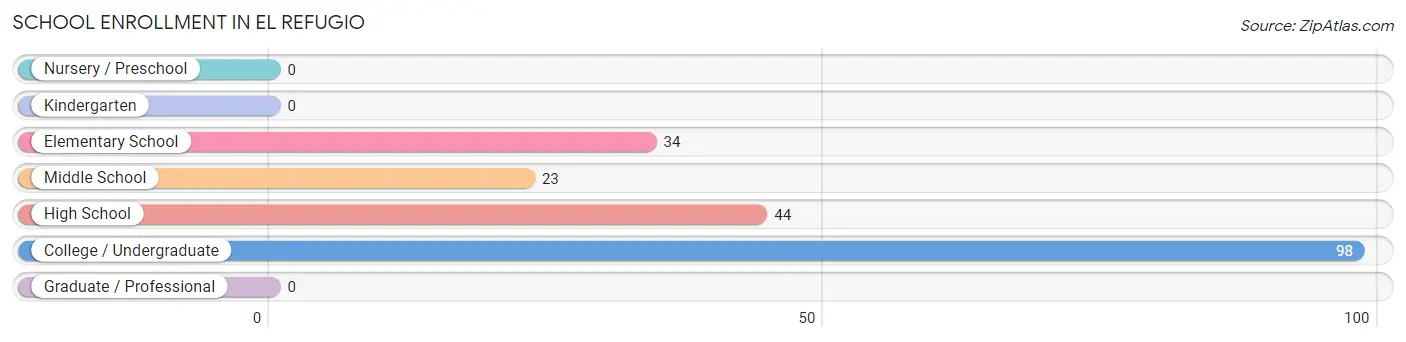
School Enrollment in El Refugio
The most common levels of schooling among the 199 students in El Refugio are college / undergraduate (98 | 49.2%), high school (44 | 22.1%), and elementary school (34 | 17.1%).
| School Level | # Students | % Students |
| Nursery / Preschool | 0 | 0.0% |
| Kindergarten | 0 | 0.0% |
| Elementary School | 34 | 17.1% |
| Middle School | 23 | 11.6% |
| High School | 44 | 22.1% |
| College / Undergraduate | 98 | 49.2% |
| Graduate / Professional | 0 | 0.0% |
| Total | 199 | 100.0% |
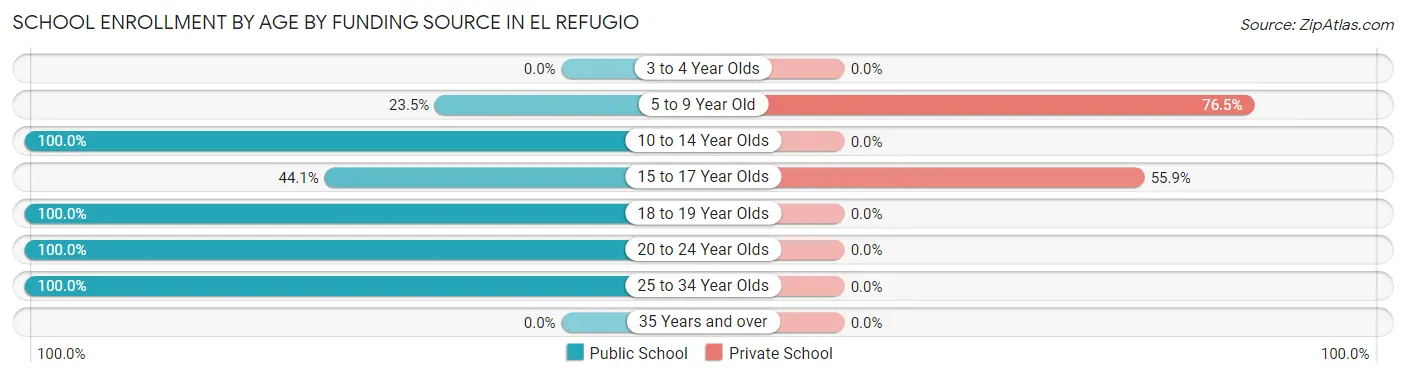
School Enrollment by Age by Funding Source in El Refugio
Out of a total of 199 students who are enrolled in schools in El Refugio, 45 (22.6%) attend a private institution, while the remaining 154 (77.4%) are enrolled in public schools. The age group of 5 to 9 year old has the highest likelihood of being enrolled in private schools, with 26 (76.5% in the age bracket) enrolled. Conversely, the age group of 10 to 14 year olds has the lowest likelihood of being enrolled in a private school, with 23 (100.0% in the age bracket) attending a public institution.
| Age Bracket | Public School | Private School |
| 3 to 4 Year Olds | 0 (0.0%) | 0 (0.0%) |
| 5 to 9 Year Old | 8 (23.5%) | 26 (76.5%) |
| 10 to 14 Year Olds | 23 (100.0%) | 0 (0.0%) |
| 15 to 17 Year Olds | 15 (44.1%) | 19 (55.9%) |
| 18 to 19 Year Olds | 39 (100.0%) | 0 (0.0%) |
| 20 to 24 Year Olds | 62 (100.0%) | 0 (0.0%) |
| 25 to 34 Year Olds | 7 (100.0%) | 0 (0.0%) |
| 35 Years and over | 0 (0.0%) | 0 (0.0%) |
| Total | 154 (77.4%) | 45 (22.6%) |
Educational Attainment by Field of Study in El Refugio
Education (12 | 42.9%), arts & humanities (10 | 35.7%), and communications (6 | 21.4%) are the most common fields of study among 28 individuals in El Refugio who have obtained a bachelor's degree or higher.
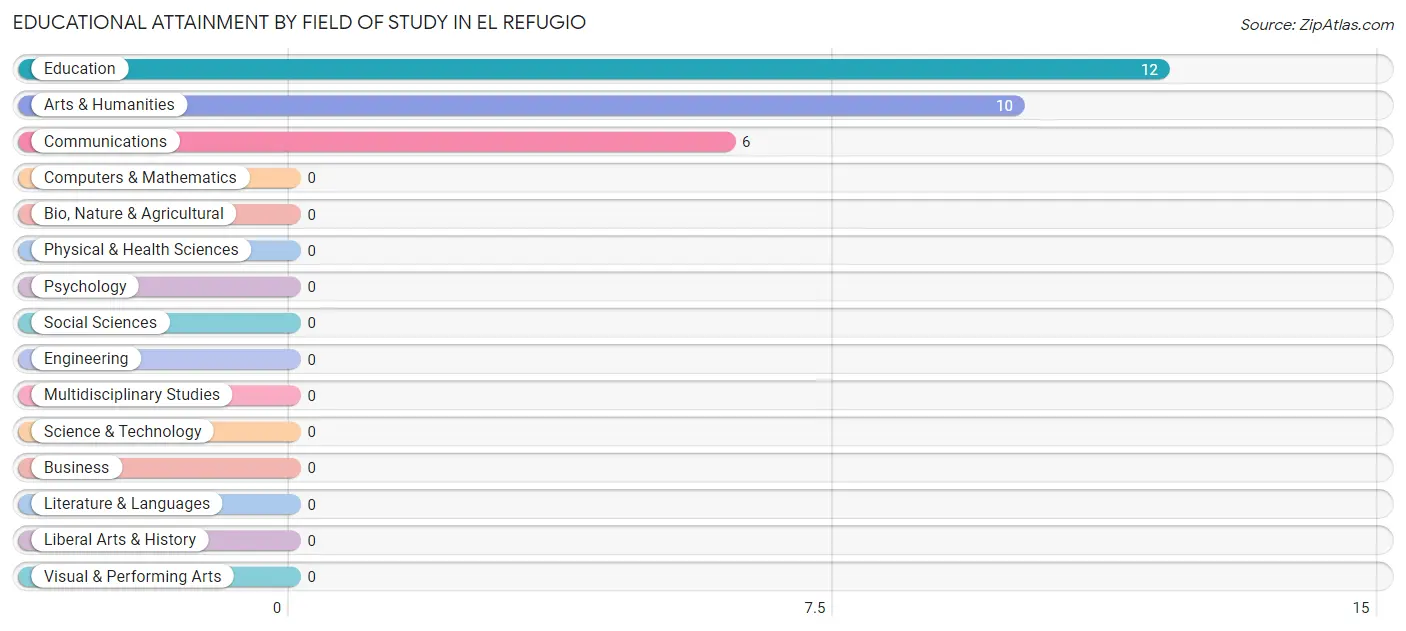
| Field of Study | # Graduates | % Graduates |
| Computers & Mathematics | 0 | 0.0% |
| Bio, Nature & Agricultural | 0 | 0.0% |
| Physical & Health Sciences | 0 | 0.0% |
| Psychology | 0 | 0.0% |
| Social Sciences | 0 | 0.0% |
| Engineering | 0 | 0.0% |
| Multidisciplinary Studies | 0 | 0.0% |
| Science & Technology | 0 | 0.0% |
| Business | 0 | 0.0% |
| Education | 12 | 42.9% |
| Literature & Languages | 0 | 0.0% |
| Liberal Arts & History | 0 | 0.0% |
| Visual & Performing Arts | 0 | 0.0% |
| Communications | 6 | 21.4% |
| Arts & Humanities | 10 | 35.7% |
| Total | 28 | 100.0% |
Transportation & Commute in El Refugio
Vehicle Availability by Sex in El Refugio
The most prevalent vehicle ownership categories in El Refugio are males with 2 vehicles (92, accounting for 51.1%) and females with 2 vehicles (135, making up 60.9%).
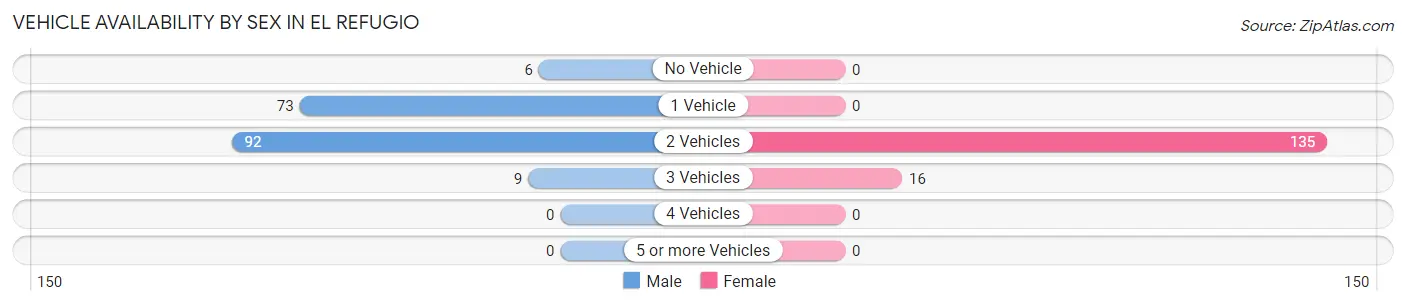
| Vehicles Available | Male | Female |
| No Vehicle | 6 (3.3%) | 0 (0.0%) |
| 1 Vehicle | 73 (40.6%) | 0 (0.0%) |
| 2 Vehicles | 92 (51.1%) | 135 (89.4%) |
| 3 Vehicles | 9 (5.0%) | 16 (10.6%) |
| 4 Vehicles | 0 (0.0%) | 0 (0.0%) |
| 5 or more Vehicles | 0 (0.0%) | 0 (0.0%) |
| Total | 180 (100.0%) | 151 (100.0%) |
Commute Time in El Refugio
The most frequently occuring commute durations in El Refugio are 10 to 14 minutes (100 commuters, 40.3%), 30 to 34 minutes (72 commuters, 29.0%), and 15 to 19 minutes (44 commuters, 17.7%).
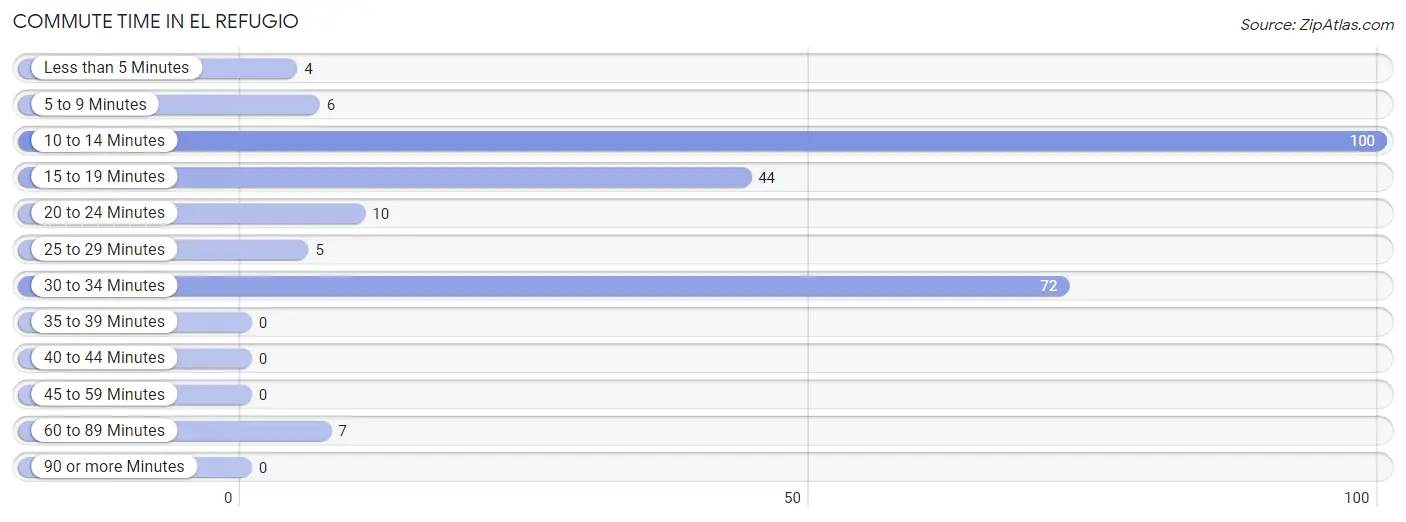
| Commute Time | # Commuters | % Commuters |
| Less than 5 Minutes | 4 | 1.6% |
| 5 to 9 Minutes | 6 | 2.4% |
| 10 to 14 Minutes | 100 | 40.3% |
| 15 to 19 Minutes | 44 | 17.7% |
| 20 to 24 Minutes | 10 | 4.0% |
| 25 to 29 Minutes | 5 | 2.0% |
| 30 to 34 Minutes | 72 | 29.0% |
| 35 to 39 Minutes | 0 | 0.0% |
| 40 to 44 Minutes | 0 | 0.0% |
| 45 to 59 Minutes | 0 | 0.0% |
| 60 to 89 Minutes | 7 | 2.8% |
| 90 or more Minutes | 0 | 0.0% |
Commute Time by Sex in El Refugio
The most common commute times in El Refugio are 15 to 19 minutes (44 commuters, 40.0%) for males and 10 to 14 minutes (68 commuters, 49.3%) for females.
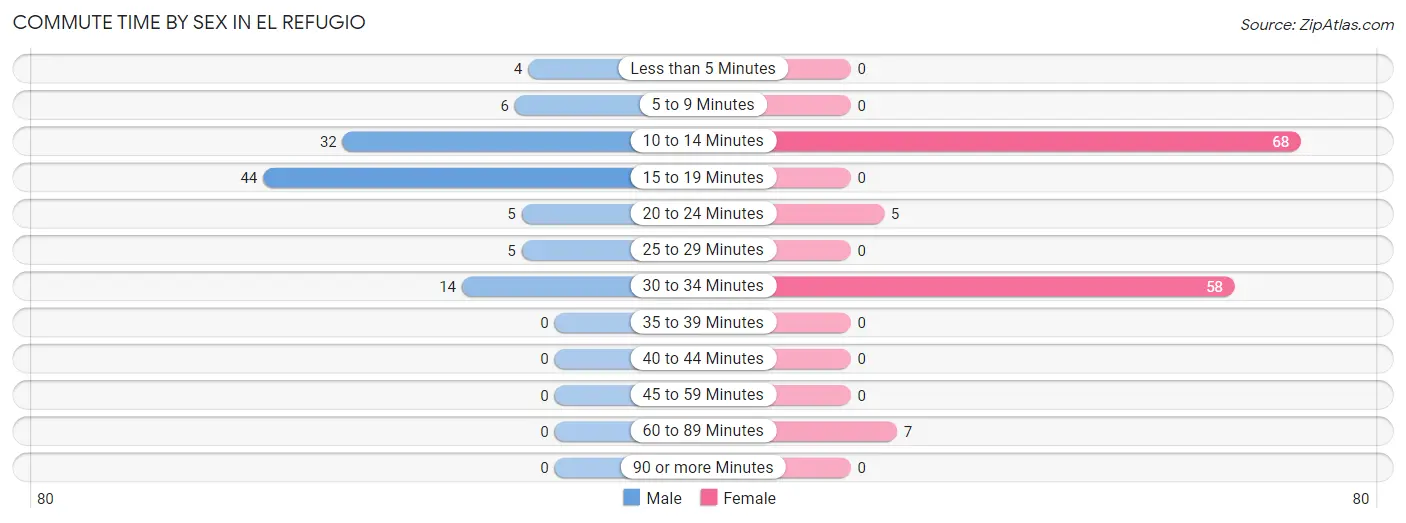
| Commute Time | Male | Female |
| Less than 5 Minutes | 4 (3.6%) | 0 (0.0%) |
| 5 to 9 Minutes | 6 (5.4%) | 0 (0.0%) |
| 10 to 14 Minutes | 32 (29.1%) | 68 (49.3%) |
| 15 to 19 Minutes | 44 (40.0%) | 0 (0.0%) |
| 20 to 24 Minutes | 5 (4.5%) | 5 (3.6%) |
| 25 to 29 Minutes | 5 (4.5%) | 0 (0.0%) |
| 30 to 34 Minutes | 14 (12.7%) | 58 (42.0%) |
| 35 to 39 Minutes | 0 (0.0%) | 0 (0.0%) |
| 40 to 44 Minutes | 0 (0.0%) | 0 (0.0%) |
| 45 to 59 Minutes | 0 (0.0%) | 0 (0.0%) |
| 60 to 89 Minutes | 0 (0.0%) | 7 (5.1%) |
| 90 or more Minutes | 0 (0.0%) | 0 (0.0%) |
Time of Departure to Work by Sex in El Refugio
The most frequent times of departure to work in El Refugio are 7:00 AM to 7:29 AM (55, 50.0%) for males and 4:00 PM to 11:59 PM (62, 44.9%) for females.
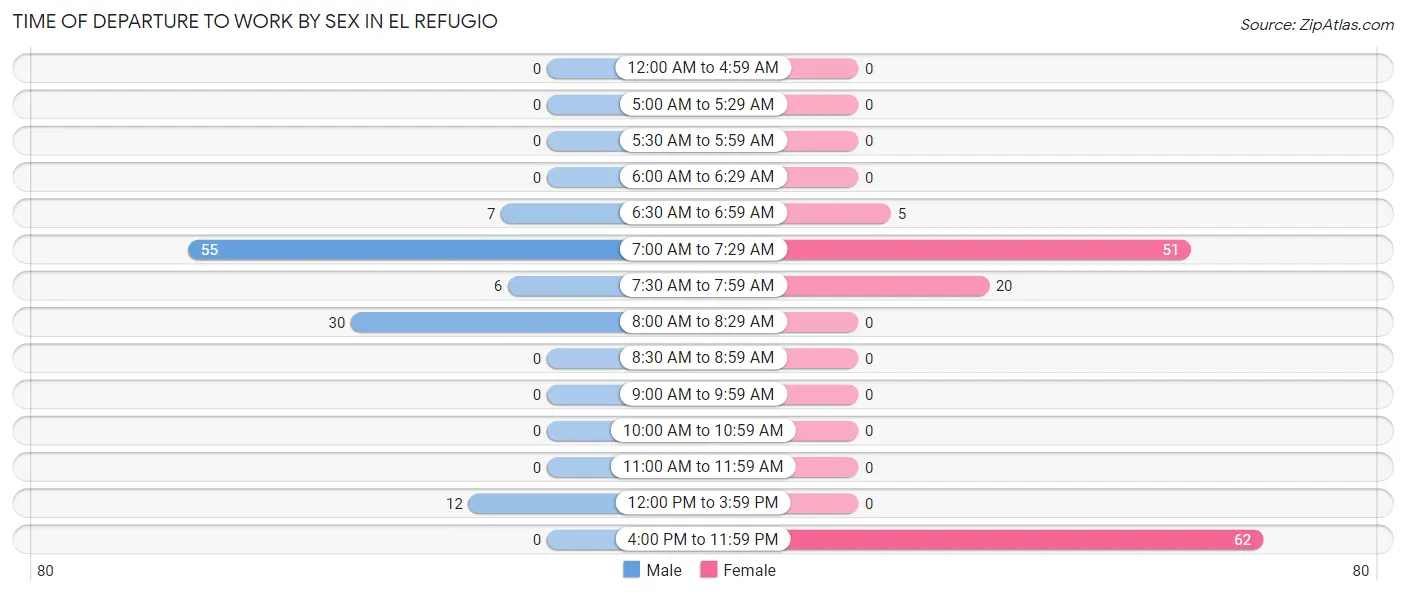
| Time of Departure | Male | Female |
| 12:00 AM to 4:59 AM | 0 (0.0%) | 0 (0.0%) |
| 5:00 AM to 5:29 AM | 0 (0.0%) | 0 (0.0%) |
| 5:30 AM to 5:59 AM | 0 (0.0%) | 0 (0.0%) |
| 6:00 AM to 6:29 AM | 0 (0.0%) | 0 (0.0%) |
| 6:30 AM to 6:59 AM | 7 (6.4%) | 5 (3.6%) |
| 7:00 AM to 7:29 AM | 55 (50.0%) | 51 (37.0%) |
| 7:30 AM to 7:59 AM | 6 (5.4%) | 20 (14.5%) |
| 8:00 AM to 8:29 AM | 30 (27.3%) | 0 (0.0%) |
| 8:30 AM to 8:59 AM | 0 (0.0%) | 0 (0.0%) |
| 9:00 AM to 9:59 AM | 0 (0.0%) | 0 (0.0%) |
| 10:00 AM to 10:59 AM | 0 (0.0%) | 0 (0.0%) |
| 11:00 AM to 11:59 AM | 0 (0.0%) | 0 (0.0%) |
| 12:00 PM to 3:59 PM | 12 (10.9%) | 0 (0.0%) |
| 4:00 PM to 11:59 PM | 0 (0.0%) | 62 (44.9%) |
| Total | 110 (100.0%) | 138 (100.0%) |
Housing Occupancy in El Refugio
Occupancy by Ownership in El Refugio
Of the total 189 dwellings in El Refugio, owner-occupied units account for 105 (55.6%), while renter-occupied units make up 84 (44.4%).
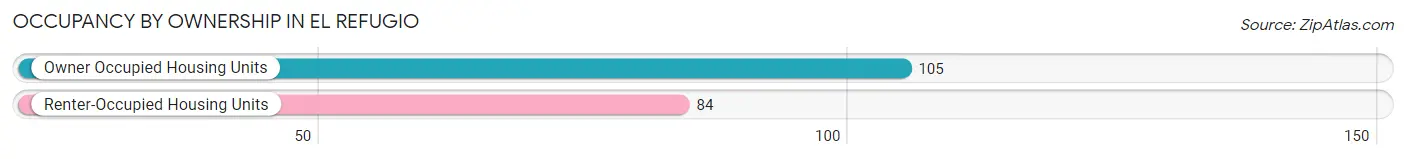
| Occupancy | # Housing Units | % Housing Units |
| Owner Occupied Housing Units | 105 | 55.6% |
| Renter-Occupied Housing Units | 84 | 44.4% |
| Total Occupied Housing Units | 189 | 100.0% |
Occupancy by Household Size in El Refugio
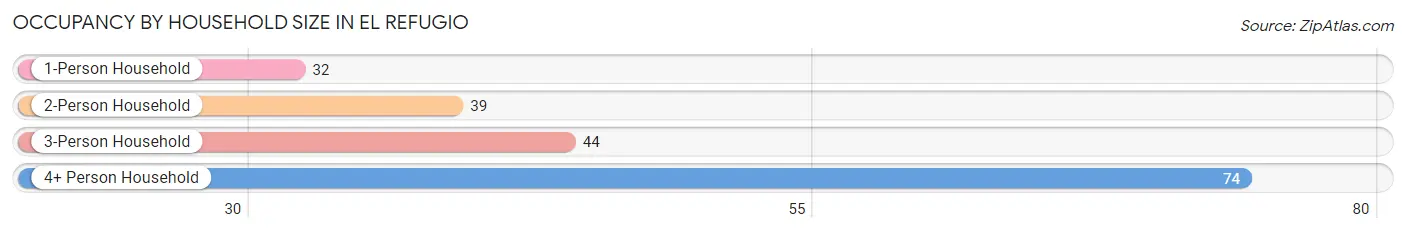
| Household Size | # Housing Units | % Housing Units |
| 1-Person Household | 32 | 16.9% |
| 2-Person Household | 39 | 20.6% |
| 3-Person Household | 44 | 23.3% |
| 4+ Person Household | 74 | 39.2% |
| Total Housing Units | 189 | 100.0% |
Occupancy by Ownership by Household Size in El Refugio
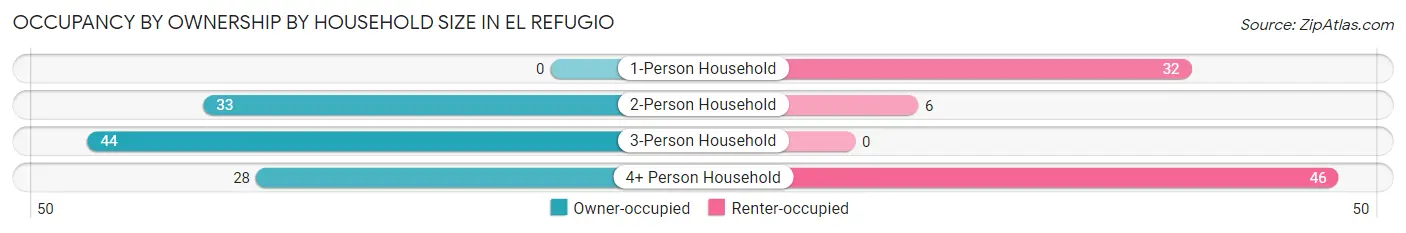
| Household Size | Owner-occupied | Renter-occupied |
| 1-Person Household | 0 (0.0%) | 32 (100.0%) |
| 2-Person Household | 33 (84.6%) | 6 (15.4%) |
| 3-Person Household | 44 (100.0%) | 0 (0.0%) |
| 4+ Person Household | 28 (37.8%) | 46 (62.2%) |
| Total Housing Units | 105 (55.6%) | 84 (44.4%) |
Occupancy by Educational Attainment in El Refugio
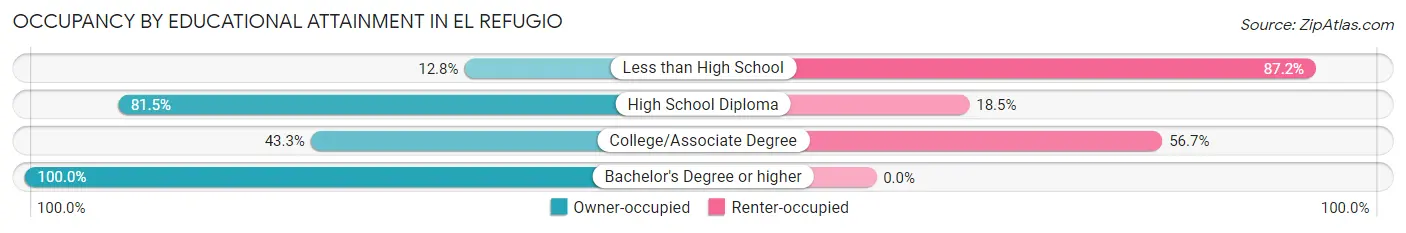
| Household Size | Owner-occupied | Renter-occupied |
| Less than High School | 5 (12.8%) | 34 (87.2%) |
| High School Diploma | 53 (81.5%) | 12 (18.5%) |
| College/Associate Degree | 29 (43.3%) | 38 (56.7%) |
| Bachelor's Degree or higher | 18 (100.0%) | 0 (0.0%) |
Occupancy by Age of Householder in El Refugio
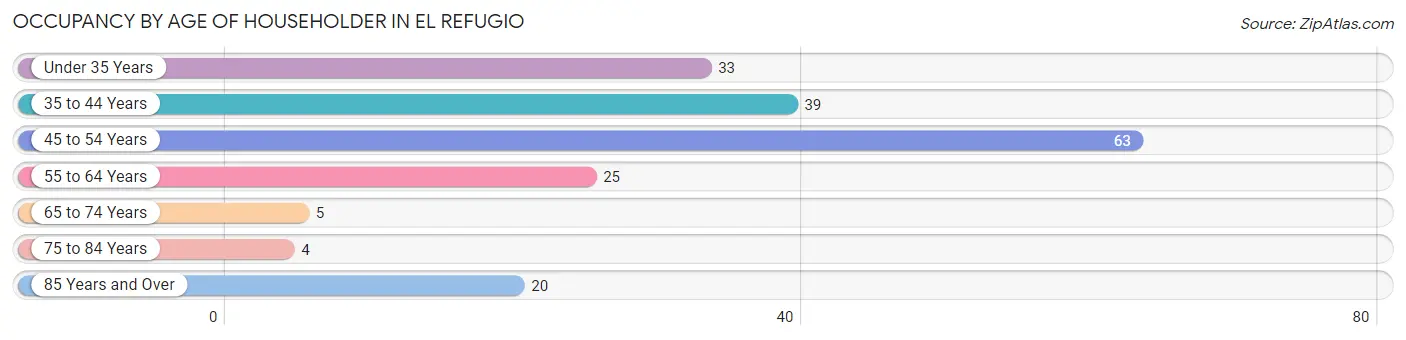
| Age Bracket | # Households | % Households |
| Under 35 Years | 33 | 17.5% |
| 35 to 44 Years | 39 | 20.6% |
| 45 to 54 Years | 63 | 33.3% |
| 55 to 64 Years | 25 | 13.2% |
| 65 to 74 Years | 5 | 2.6% |
| 75 to 84 Years | 4 | 2.1% |
| 85 Years and Over | 20 | 10.6% |
| Total | 189 | 100.0% |
Housing Finances in El Refugio
Median Income by Occupancy in El Refugio
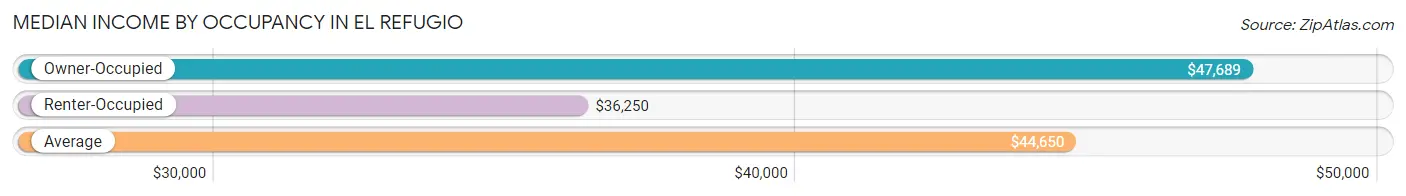
| Occupancy Type | # Households | Median Income |
| Owner-Occupied | 105 (55.6%) | $47,689 |
| Renter-Occupied | 84 (44.4%) | $36,250 |
| Average | 189 (100.0%) | $44,650 |
Occupancy by Householder Income Bracket in El Refugio
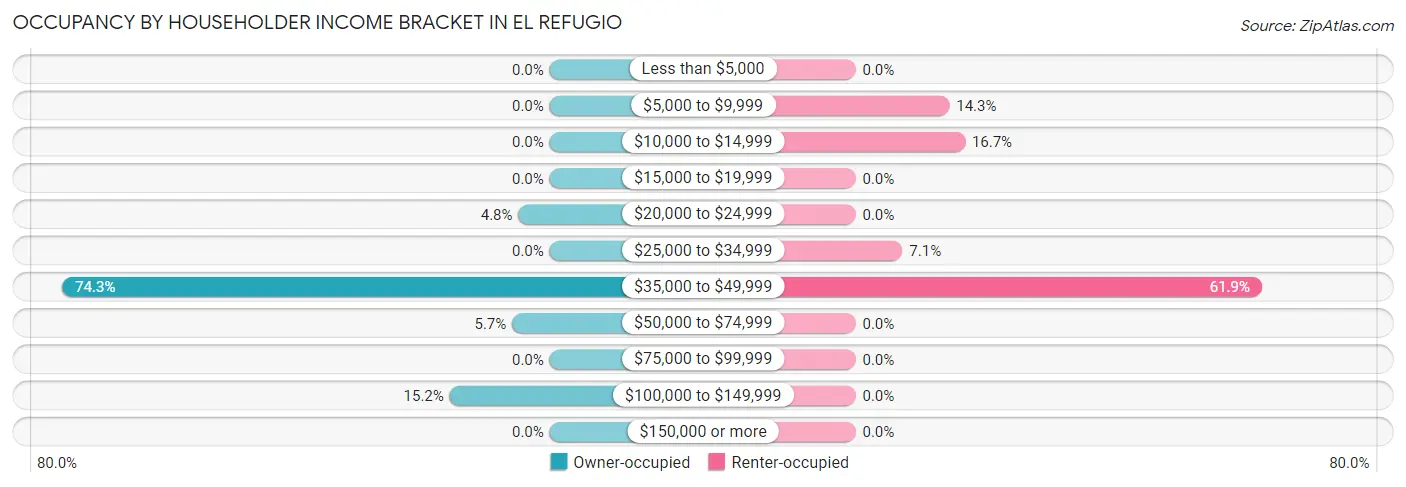
| Income Bracket | Owner-occupied | Renter-occupied |
| Less than $5,000 | 0 (0.0%) | 0 (0.0%) |
| $5,000 to $9,999 | 0 (0.0%) | 12 (14.3%) |
| $10,000 to $14,999 | 0 (0.0%) | 14 (16.7%) |
| $15,000 to $19,999 | 0 (0.0%) | 0 (0.0%) |
| $20,000 to $24,999 | 5 (4.8%) | 0 (0.0%) |
| $25,000 to $34,999 | 0 (0.0%) | 6 (7.1%) |
| $35,000 to $49,999 | 78 (74.3%) | 52 (61.9%) |
| $50,000 to $74,999 | 6 (5.7%) | 0 (0.0%) |
| $75,000 to $99,999 | 0 (0.0%) | 0 (0.0%) |
| $100,000 to $149,999 | 16 (15.2%) | 0 (0.0%) |
| $150,000 or more | 0 (0.0%) | 0 (0.0%) |
| Total | 105 (100.0%) | 84 (100.0%) |
Monthly Housing Cost Tiers in El Refugio
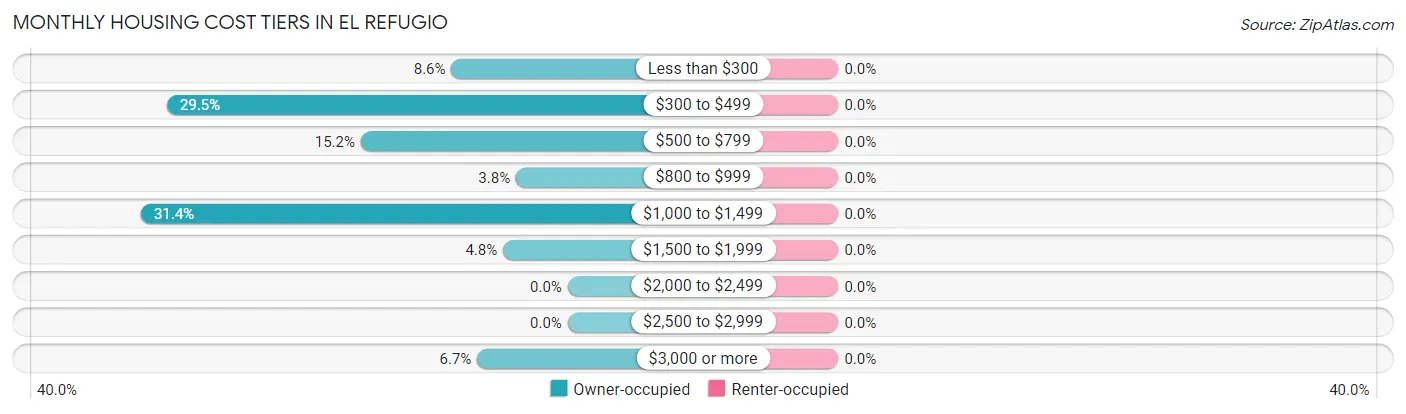
| Monthly Cost | Owner-occupied | Renter-occupied |
| Less than $300 | 9 (8.6%) | 0 (0.0%) |
| $300 to $499 | 31 (29.5%) | 0 (0.0%) |
| $500 to $799 | 16 (15.2%) | 0 (0.0%) |
| $800 to $999 | 4 (3.8%) | 0 (0.0%) |
| $1,000 to $1,499 | 33 (31.4%) | 0 (0.0%) |
| $1,500 to $1,999 | 5 (4.8%) | 0 (0.0%) |
| $2,000 to $2,499 | 0 (0.0%) | 0 (0.0%) |
| $2,500 to $2,999 | 0 (0.0%) | 0 (0.0%) |
| $3,000 or more | 7 (6.7%) | 0 (0.0%) |
| Total | 105 (100.0%) | 84 (100.0%) |
Physical Housing Characteristics in El Refugio
Housing Structures in El Refugio
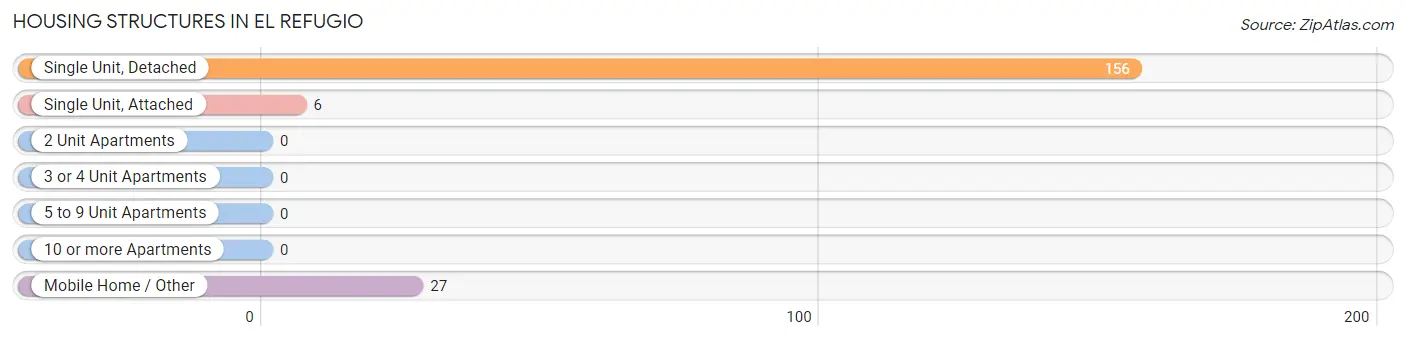
| Structure Type | # Housing Units | % Housing Units |
| Single Unit, Detached | 156 | 82.5% |
| Single Unit, Attached | 6 | 3.2% |
| 2 Unit Apartments | 0 | 0.0% |
| 3 or 4 Unit Apartments | 0 | 0.0% |
| 5 to 9 Unit Apartments | 0 | 0.0% |
| 10 or more Apartments | 0 | 0.0% |
| Mobile Home / Other | 27 | 14.3% |
| Total | 189 | 100.0% |
Housing Structures by Occupancy in El Refugio
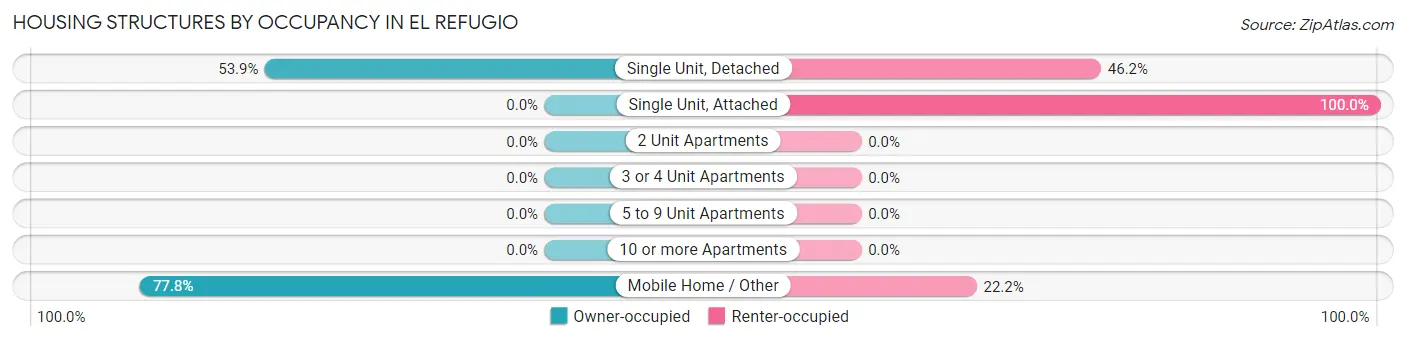
| Structure Type | Owner-occupied | Renter-occupied |
| Single Unit, Detached | 84 (53.8%) | 72 (46.2%) |
| Single Unit, Attached | 0 (0.0%) | 6 (100.0%) |
| 2 Unit Apartments | 0 (0.0%) | 0 (0.0%) |
| 3 or 4 Unit Apartments | 0 (0.0%) | 0 (0.0%) |
| 5 to 9 Unit Apartments | 0 (0.0%) | 0 (0.0%) |
| 10 or more Apartments | 0 (0.0%) | 0 (0.0%) |
| Mobile Home / Other | 21 (77.8%) | 6 (22.2%) |
| Total | 105 (55.6%) | 84 (44.4%) |
Housing Structures by Number of Rooms in El Refugio
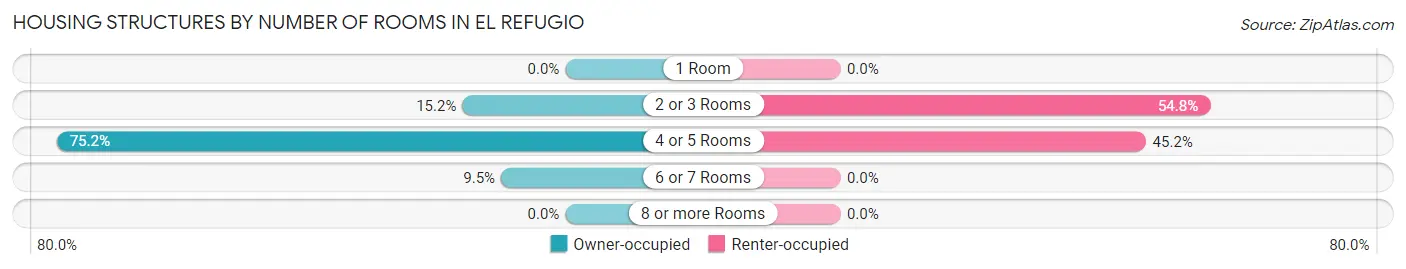
| Number of Rooms | Owner-occupied | Renter-occupied |
| 1 Room | 0 (0.0%) | 0 (0.0%) |
| 2 or 3 Rooms | 16 (15.2%) | 46 (54.8%) |
| 4 or 5 Rooms | 79 (75.2%) | 38 (45.2%) |
| 6 or 7 Rooms | 10 (9.5%) | 0 (0.0%) |
| 8 or more Rooms | 0 (0.0%) | 0 (0.0%) |
| Total | 105 (100.0%) | 84 (100.0%) |
Housing Structure by Heating Type in El Refugio
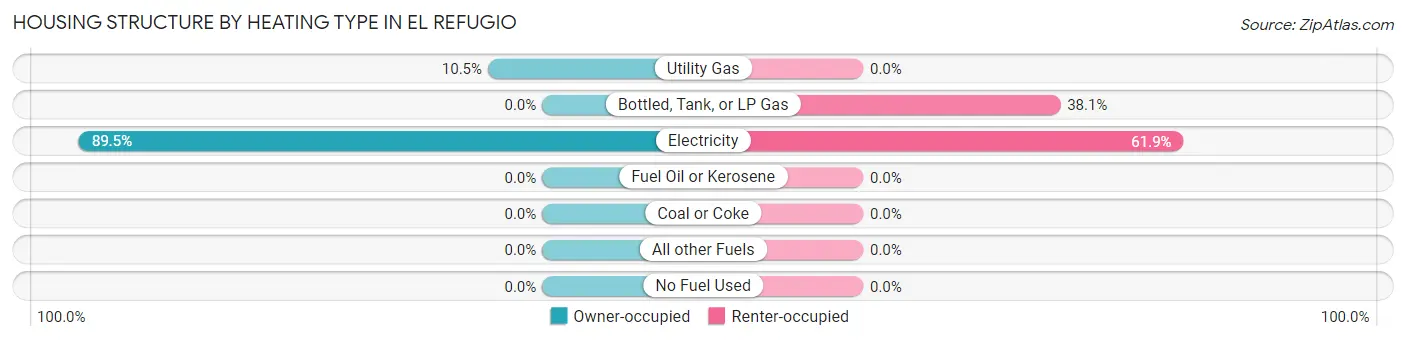
| Heating Type | Owner-occupied | Renter-occupied |
| Utility Gas | 11 (10.5%) | 0 (0.0%) |
| Bottled, Tank, or LP Gas | 0 (0.0%) | 32 (38.1%) |
| Electricity | 94 (89.5%) | 52 (61.9%) |
| Fuel Oil or Kerosene | 0 (0.0%) | 0 (0.0%) |
| Coal or Coke | 0 (0.0%) | 0 (0.0%) |
| All other Fuels | 0 (0.0%) | 0 (0.0%) |
| No Fuel Used | 0 (0.0%) | 0 (0.0%) |
| Total | 105 (100.0%) | 84 (100.0%) |
Household Vehicle Usage in El Refugio
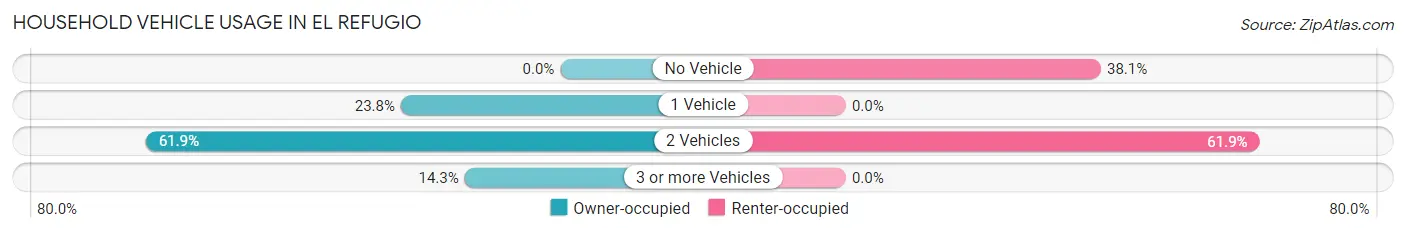
| Vehicles per Household | Owner-occupied | Renter-occupied |
| No Vehicle | 0 (0.0%) | 32 (38.1%) |
| 1 Vehicle | 25 (23.8%) | 0 (0.0%) |
| 2 Vehicles | 65 (61.9%) | 52 (61.9%) |
| 3 or more Vehicles | 15 (14.3%) | 0 (0.0%) |
| Total | 105 (100.0%) | 84 (100.0%) |
Real Estate & Mortgages in El Refugio
Real Estate and Mortgage Overview in El Refugio
| Characteristic | Without Mortgage | With Mortgage |
| Housing Units | 60 | 45 |
| Median Property Value | - | - |
| Median Household Income | $43,400 | $0 |
| Monthly Housing Costs | $409 | $7 |
| Real Estate Taxes | $561 | $0 |
Property Value by Mortgage Status in El Refugio
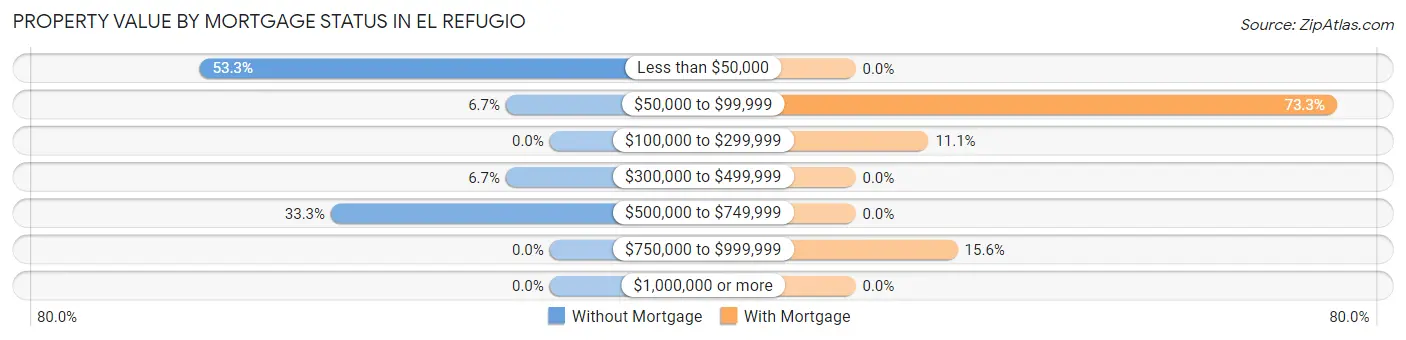
| Property Value | Without Mortgage | With Mortgage |
| Less than $50,000 | 32 (53.3%) | 0 (0.0%) |
| $50,000 to $99,999 | 4 (6.7%) | 33 (73.3%) |
| $100,000 to $299,999 | 0 (0.0%) | 5 (11.1%) |
| $300,000 to $499,999 | 4 (6.7%) | 0 (0.0%) |
| $500,000 to $749,999 | 20 (33.3%) | 0 (0.0%) |
| $750,000 to $999,999 | 0 (0.0%) | 7 (15.6%) |
| $1,000,000 or more | 0 (0.0%) | 0 (0.0%) |
| Total | 60 (100.0%) | 45 (100.0%) |
Household Income by Mortgage Status in El Refugio
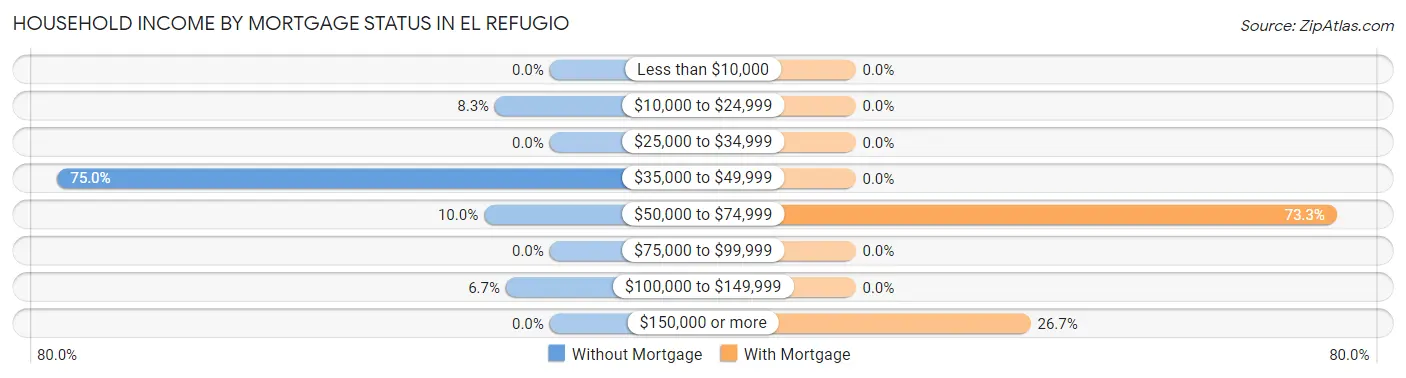
| Household Income | Without Mortgage | With Mortgage |
| Less than $10,000 | 0 (0.0%) | 0 (0.0%) |
| $10,000 to $24,999 | 5 (8.3%) | 0 (0.0%) |
| $25,000 to $34,999 | 0 (0.0%) | 0 (0.0%) |
| $35,000 to $49,999 | 45 (75.0%) | 0 (0.0%) |
| $50,000 to $74,999 | 6 (10.0%) | 33 (73.3%) |
| $75,000 to $99,999 | 0 (0.0%) | 0 (0.0%) |
| $100,000 to $149,999 | 4 (6.7%) | 0 (0.0%) |
| $150,000 or more | 0 (0.0%) | 12 (26.7%) |
| Total | 60 (100.0%) | 45 (100.0%) |
Property Value to Household Income Ratio in El Refugio
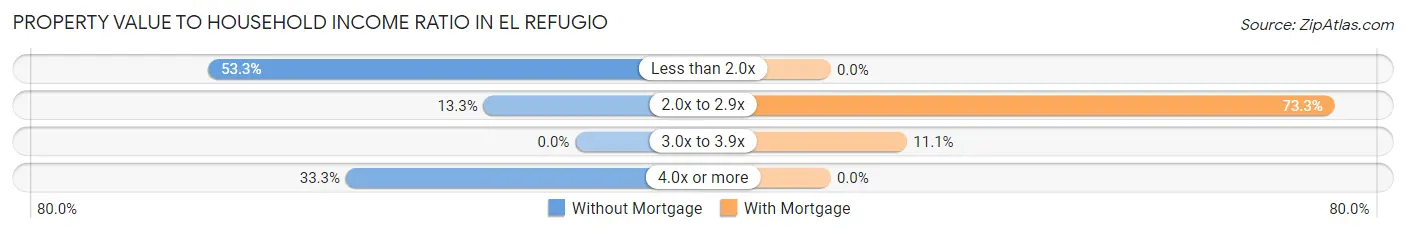
| Value-to-Income Ratio | Without Mortgage | With Mortgage |
| Less than 2.0x | 32 (53.3%) | 0 (0.0%) |
| 2.0x to 2.9x | 8 (13.3%) | 33 (73.3%) |
| 3.0x to 3.9x | 0 (0.0%) | 5 (11.1%) |
| 4.0x or more | 20 (33.3%) | 0 (0.0%) |
| Total | 60 (100.0%) | 45 (100.0%) |
Real Estate Taxes by Mortgage Status in El Refugio
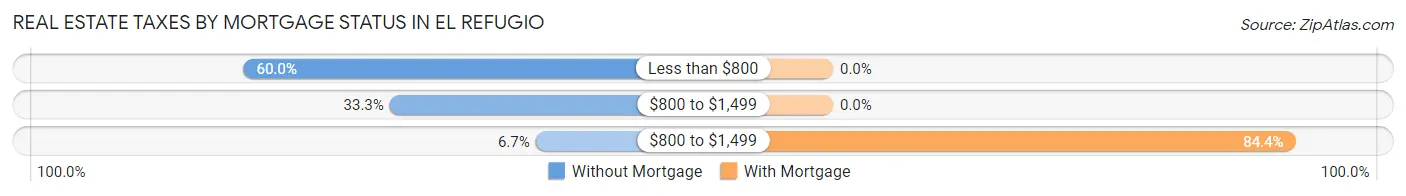
| Property Taxes | Without Mortgage | With Mortgage |
| Less than $800 | 36 (60.0%) | 0 (0.0%) |
| $800 to $1,499 | 20 (33.3%) | 0 (0.0%) |
| $800 to $1,499 | 4 (6.7%) | 38 (84.4%) |
| Total | 60 (100.0%) | 45 (100.0%) |
Health & Disability in El Refugio
Health Insurance Coverage by Age in El Refugio
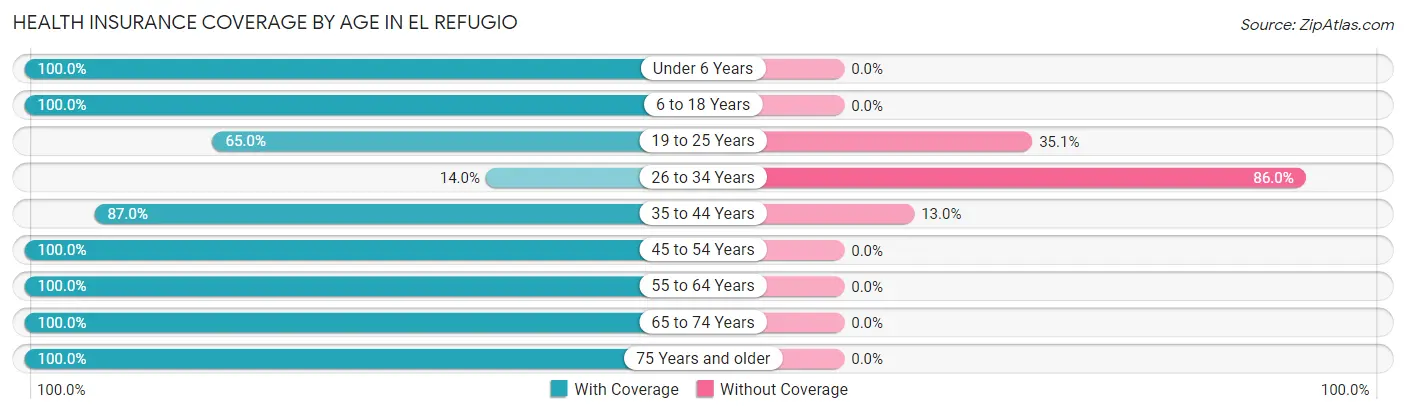
| Age Bracket | With Coverage | Without Coverage |
| Under 6 Years | 134 (100.0%) | 0 (0.0%) |
| 6 to 18 Years | 101 (100.0%) | 0 (0.0%) |
| 19 to 25 Years | 139 (64.9%) | 75 (35.0%) |
| 26 to 34 Years | 7 (14.0%) | 43 (86.0%) |
| 35 to 44 Years | 40 (87.0%) | 6 (13.0%) |
| 45 to 54 Years | 104 (100.0%) | 0 (0.0%) |
| 55 to 64 Years | 35 (100.0%) | 0 (0.0%) |
| 65 to 74 Years | 23 (100.0%) | 0 (0.0%) |
| 75 Years and older | 30 (100.0%) | 0 (0.0%) |
| Total | 613 (83.2%) | 124 (16.8%) |
Health Insurance Coverage by Citizenship Status in El Refugio
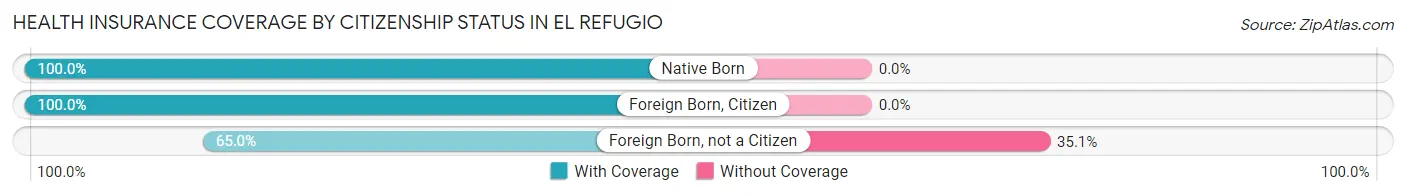
| Citizenship Status | With Coverage | Without Coverage |
| Native Born | 134 (100.0%) | 0 (0.0%) |
| Foreign Born, Citizen | 101 (100.0%) | 0 (0.0%) |
| Foreign Born, not a Citizen | 139 (64.9%) | 75 (35.0%) |
Health Insurance Coverage by Household Income in El Refugio
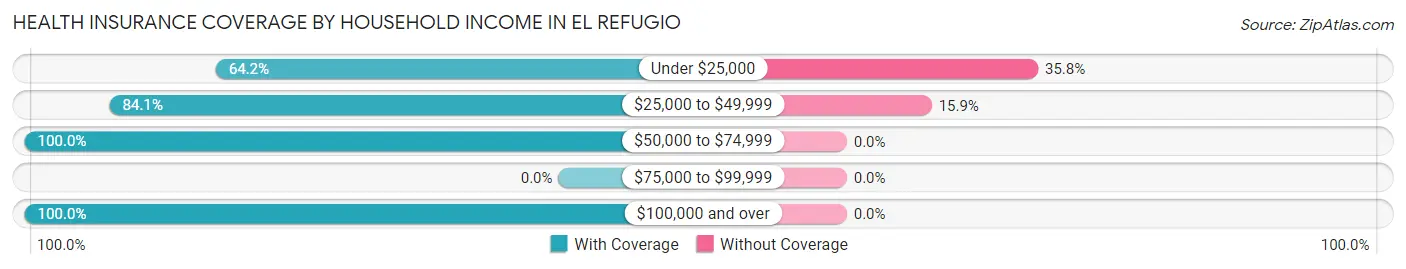
| Household Income | With Coverage | Without Coverage |
| Under $25,000 | 77 (64.2%) | 43 (35.8%) |
| $25,000 to $49,999 | 428 (84.1%) | 81 (15.9%) |
| $50,000 to $74,999 | 20 (100.0%) | 0 (0.0%) |
| $75,000 to $99,999 | 0 (0.0%) | 0 (0.0%) |
| $100,000 and over | 88 (100.0%) | 0 (0.0%) |
Public vs Private Health Insurance Coverage by Age in El Refugio
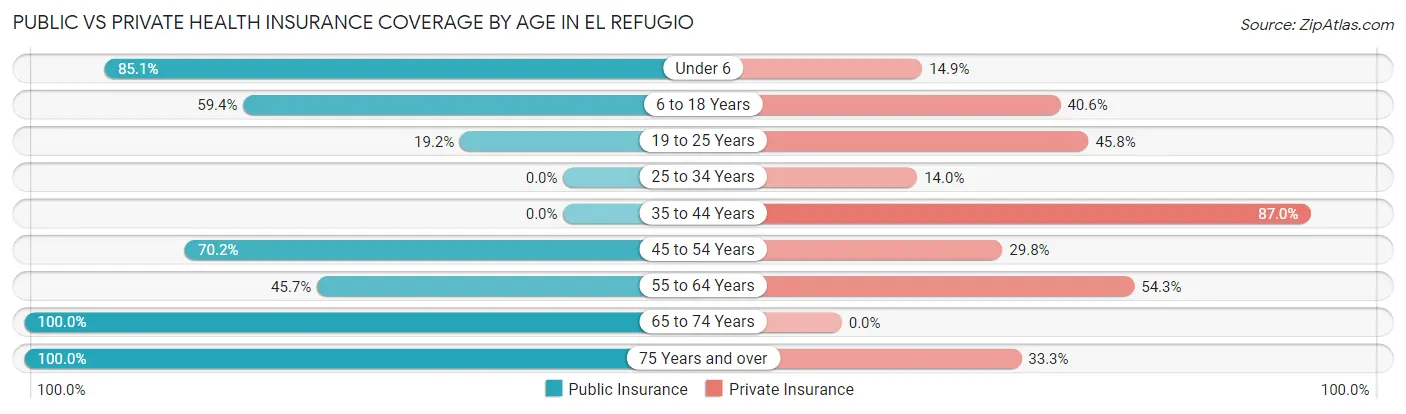
| Age Bracket | Public Insurance | Private Insurance |
| Under 6 | 114 (85.1%) | 20 (14.9%) |
| 6 to 18 Years | 60 (59.4%) | 41 (40.6%) |
| 19 to 25 Years | 41 (19.2%) | 98 (45.8%) |
| 25 to 34 Years | 0 (0.0%) | 7 (14.0%) |
| 35 to 44 Years | 0 (0.0%) | 40 (87.0%) |
| 45 to 54 Years | 73 (70.2%) | 31 (29.8%) |
| 55 to 64 Years | 16 (45.7%) | 19 (54.3%) |
| 65 to 74 Years | 23 (100.0%) | 0 (0.0%) |
| 75 Years and over | 30 (100.0%) | 10 (33.3%) |
| Total | 357 (48.4%) | 266 (36.1%) |
Disability Status by Sex by Age in El Refugio
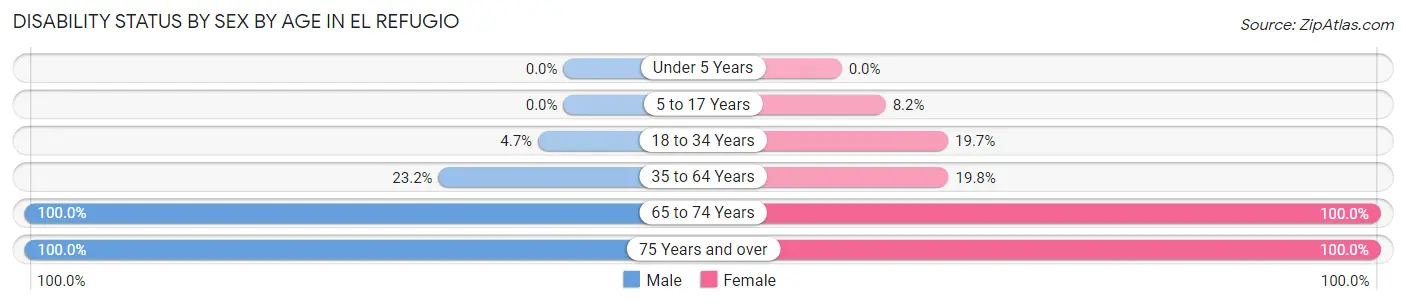
| Age Bracket | Male | Female |
| Under 5 Years | 0 (0.0%) | 0 (0.0%) |
| 5 to 17 Years | 0 (0.0%) | 8 (8.2%) |
| 18 to 34 Years | 6 (4.7%) | 29 (19.7%) |
| 35 to 64 Years | 16 (23.2%) | 23 (19.8%) |
| 65 to 74 Years | 13 (100.0%) | 10 (100.0%) |
| 75 Years and over | 4 (100.0%) | 26 (100.0%) |
Disability Class by Sex by Age in El Refugio
Disability Class: Hearing Difficulty
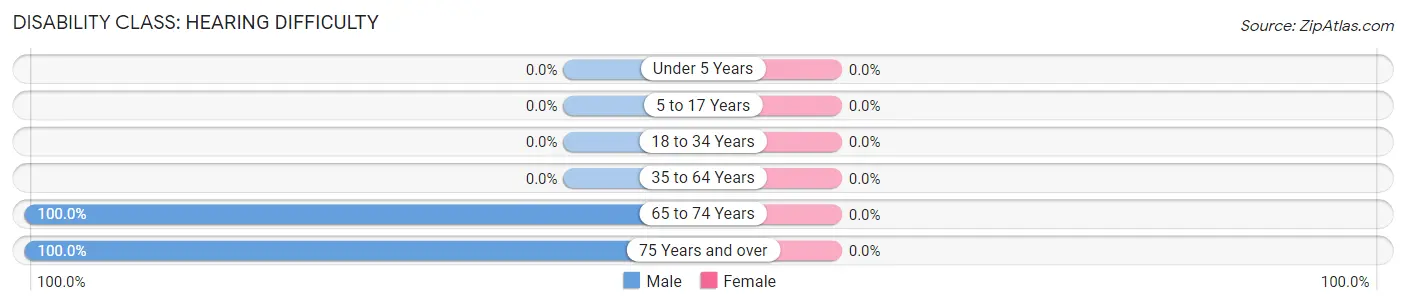
| Age Bracket | Male | Female |
| Under 5 Years | 0 (0.0%) | 0 (0.0%) |
| 5 to 17 Years | 0 (0.0%) | 0 (0.0%) |
| 18 to 34 Years | 0 (0.0%) | 0 (0.0%) |
| 35 to 64 Years | 0 (0.0%) | 0 (0.0%) |
| 65 to 74 Years | 13 (100.0%) | 0 (0.0%) |
| 75 Years and over | 4 (100.0%) | 0 (0.0%) |
Disability Class: Vision Difficulty
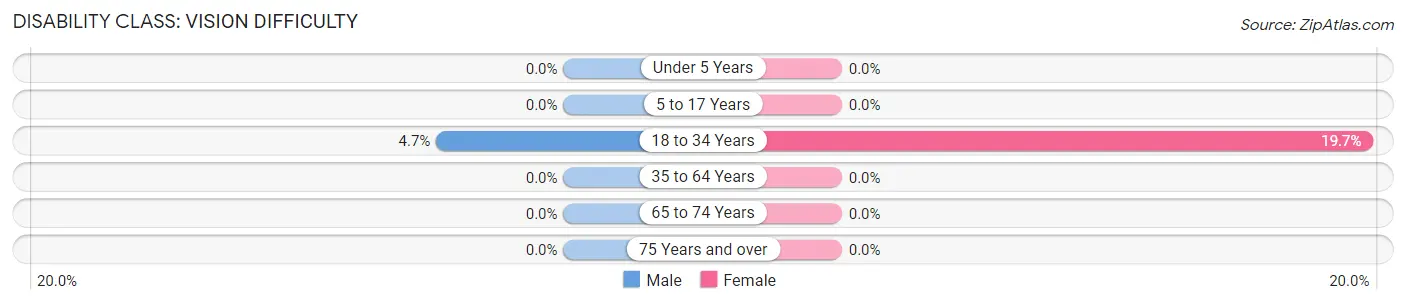
| Age Bracket | Male | Female |
| Under 5 Years | 0 (0.0%) | 0 (0.0%) |
| 5 to 17 Years | 0 (0.0%) | 0 (0.0%) |
| 18 to 34 Years | 6 (4.7%) | 29 (19.7%) |
| 35 to 64 Years | 0 (0.0%) | 0 (0.0%) |
| 65 to 74 Years | 0 (0.0%) | 0 (0.0%) |
| 75 Years and over | 0 (0.0%) | 0 (0.0%) |
Disability Class: Cognitive Difficulty
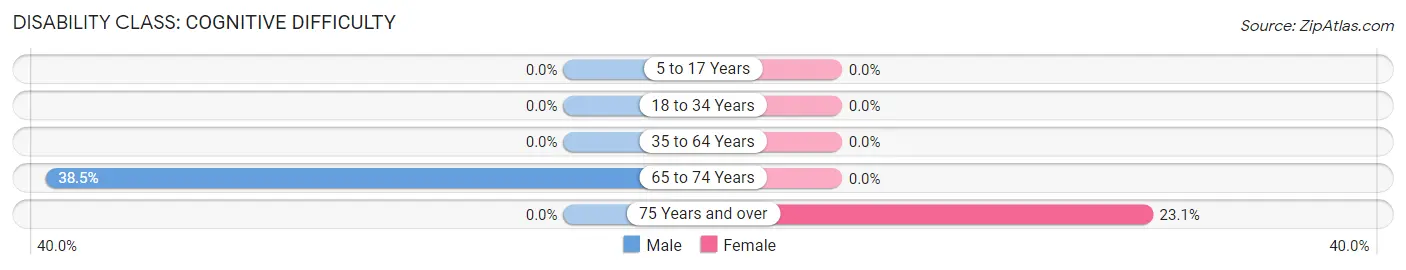
| Age Bracket | Male | Female |
| 5 to 17 Years | 0 (0.0%) | 0 (0.0%) |
| 18 to 34 Years | 0 (0.0%) | 0 (0.0%) |
| 35 to 64 Years | 0 (0.0%) | 0 (0.0%) |
| 65 to 74 Years | 5 (38.5%) | 0 (0.0%) |
| 75 Years and over | 0 (0.0%) | 6 (23.1%) |
Disability Class: Ambulatory Difficulty
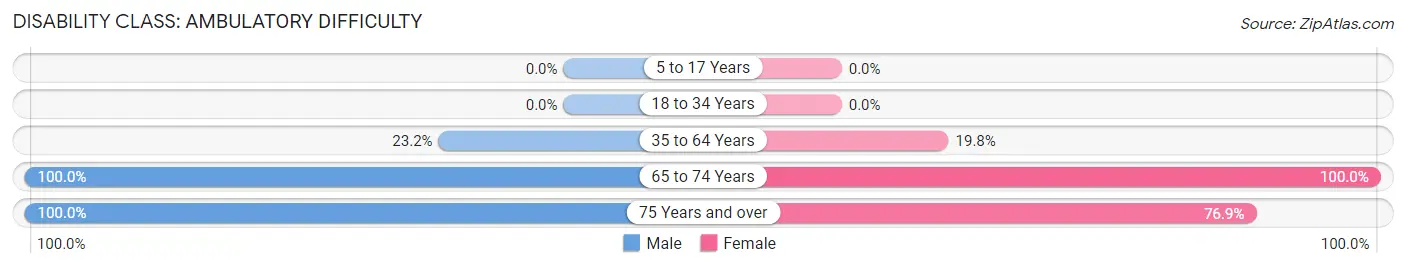
| Age Bracket | Male | Female |
| 5 to 17 Years | 0 (0.0%) | 0 (0.0%) |
| 18 to 34 Years | 0 (0.0%) | 0 (0.0%) |
| 35 to 64 Years | 16 (23.2%) | 23 (19.8%) |
| 65 to 74 Years | 13 (100.0%) | 10 (100.0%) |
| 75 Years and over | 4 (100.0%) | 20 (76.9%) |
Disability Class: Self-Care Difficulty
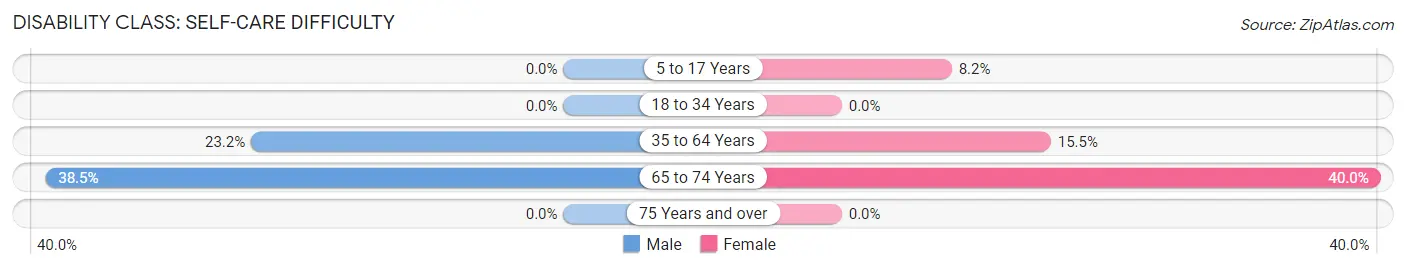
| Age Bracket | Male | Female |
| 5 to 17 Years | 0 (0.0%) | 8 (8.2%) |
| 18 to 34 Years | 0 (0.0%) | 0 (0.0%) |
| 35 to 64 Years | 16 (23.2%) | 18 (15.5%) |
| 65 to 74 Years | 5 (38.5%) | 4 (40.0%) |
| 75 Years and over | 0 (0.0%) | 0 (0.0%) |
Technology Access in El Refugio
Computing Device Access in El Refugio
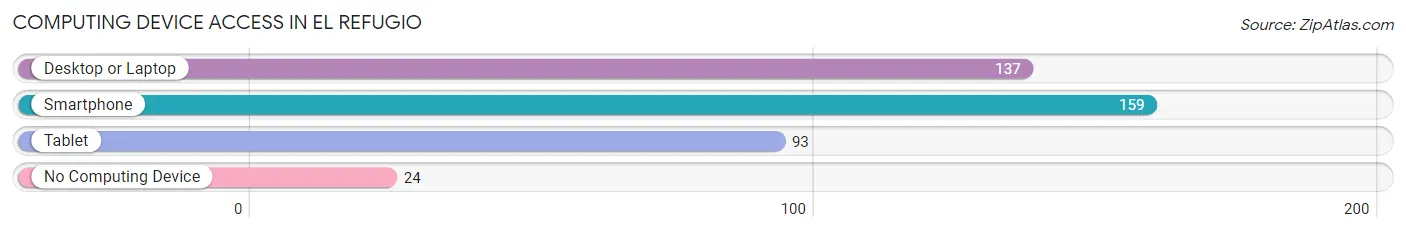
| Device Type | # Households | % Households |
| Desktop or Laptop | 137 | 72.5% |
| Smartphone | 159 | 84.1% |
| Tablet | 93 | 49.2% |
| No Computing Device | 24 | 12.7% |
| Total | 189 | 100.0% |
Internet Access in El Refugio
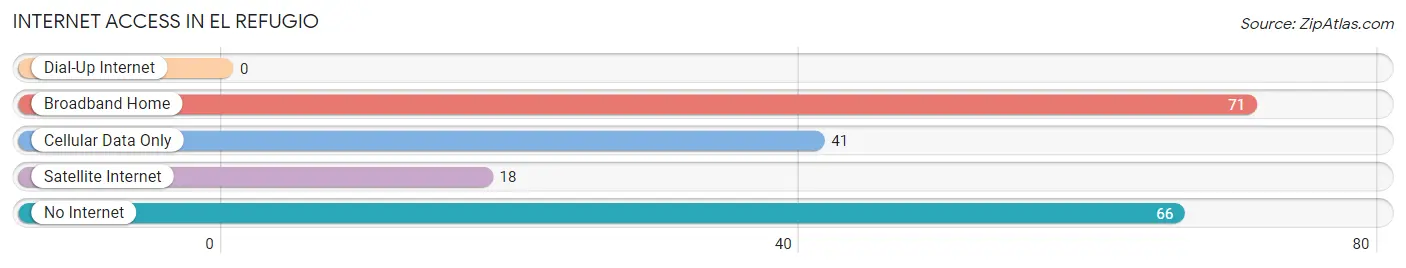
| Internet Type | # Households | % Households |
| Dial-Up Internet | 0 | 0.0% |
| Broadband Home | 71 | 37.6% |
| Cellular Data Only | 41 | 21.7% |
| Satellite Internet | 18 | 9.5% |
| No Internet | 66 | 34.9% |
| Total | 189 | 100.0% |
El Refugio Summary
Refugio, Texas is a small town located in Refugio County, Texas, United States. It is situated on the Gulf Coast, about halfway between Corpus Christi and Victoria. The population was 2,868 at the 2010 census.
History
The area that is now Refugio was first settled in the early 1800s by Spanish and Mexican settlers. The town was originally known as Refugio de la Santísima Trinidad, or Refuge of the Most Holy Trinity. The name was changed to Refugio in 1834.
The town was officially founded in 1836, when the Republic of Texas was established. It was named after the nearby Refugio Mission, which was established in 1793. The mission was abandoned in 1824, but the town of Refugio continued to grow.
In 1845, Refugio was the site of a battle between the Texas Rangers and Mexican forces. The battle was part of the Mexican-American War, and the Texans were victorious.
In the late 1800s, Refugio became a popular tourist destination. The town was known for its beautiful beaches and its proximity to the Gulf of Mexico.
In the early 1900s, Refugio was a major center for the oil industry. The town was home to several oil refineries and other related businesses.
Geography
Refugio is located at 28°20'N 97°20'W (28.33, -97.33). It is situated on the Gulf Coast, about halfway between Corpus Christi and Victoria.
The town is located in Refugio County, which is part of the Coastal Bend region of Texas. The county is bordered by San Patricio County to the north, Aransas County to the east, Calhoun County to the south, and Victoria County to the west.
The climate in Refugio is humid subtropical, with hot summers and mild winters. The average annual temperature is 72°F (22°C).
Economy
The economy of Refugio is largely based on the oil industry. The town is home to several oil refineries and related businesses.
In addition, Refugio is a popular tourist destination. The town is known for its beautiful beaches and its proximity to the Gulf of Mexico.
Demographics
As of the 2010 census, there were 2,868 people, 1,093 households, and 745 families living in Refugio. The population density was 1,093.3 people per square mile (421.7/km2). The racial makeup of the town was 79.2% White, 0.7% African American, 0.3% Native American, 0.2% Asian, 0.1% Pacific Islander, 17.7% from other races, and 2.0% from two or more races. Hispanic or Latino of any race were 37.2% of the population.
The median income for a household in Refugio was $31,250, and the median income for a family was $37,500. Males had a median income of $30,000 versus $20,000 for females. The per capita income for the town was $14,945. About 17.2% of families and 20.2% of the population were below the poverty line, including 28.3% of those under age 18 and 11.2% of those age 65 or over.
Common Questions
What is the Total Population of El Refugio?
Total Population of El Refugio is 737.
What is the Total Male Population of El Refugio?
Total Male Population of El Refugio is 304.
What is the Total Female Population of El Refugio?
Total Female Population of El Refugio is 433.
What is the Ratio of Males per 100 Females in El Refugio?
There are 70.21 Males per 100 Females in El Refugio.
What is the Ratio of Females per 100 Males in El Refugio?
There are 142.43 Females per 100 Males in El Refugio.
What is the Median Population Age in El Refugio?
Median Population Age in El Refugio is 22.1 Years.
What is the Average Family Size in El Refugio
Average Family Size in El Refugio is 4.6 People.
What is the Average Household Size in El Refugio
Average Household Size in El Refugio is 3.9 People.
What is Per Capita Income in El Refugio?
Per Capita income in El Refugio is $12,529.
What is the Median Family Income in El Refugio?
Median Family Income in El Refugio is $47,942.
What is the Median Household income in El Refugio?
Median Household Income in El Refugio is $44,650.
What is Inequality or Gini Index in El Refugio?
Inequality or Gini Index in El Refugio is 0.27.
How Large is the Labor Force in El Refugio?
There are 349 People in the Labor Forcein in El Refugio.
What is the Percentage of People in the Labor Force in El Refugio?
63.9% of People are in the Labor Force in El Refugio.
What is the Unemployment Rate in El Refugio?
Unemployment Rate in El Refugio is 5.2%.