Abram, TX
Abram Map
Abram Overview
1,952
TOTAL POPULATION
982
MALE POPULATION
970
FEMALE POPULATION
101.24
MALES / 100 FEMALES
98.78
FEMALES / 100 MALES
21.0
MEDIAN AGE
4.2
AVG FAMILY SIZE
4.0
AVG HOUSEHOLD SIZE
$10,249
PER CAPITA INCOME
$27,854
AVG FAMILY INCOME
$27,137
AVG HOUSEHOLD INCOME
30.0%
WAGE / INCOME GAP [ % ]
70.0¢/ $1
WAGE / INCOME GAP [ $ ]
0.51
INEQUALITY / GINI INDEX
564
LABOR FORCE [ PEOPLE ]
44.6%
PERCENT IN LABOR FORCE
12.8%
UNEMPLOYMENT RATE
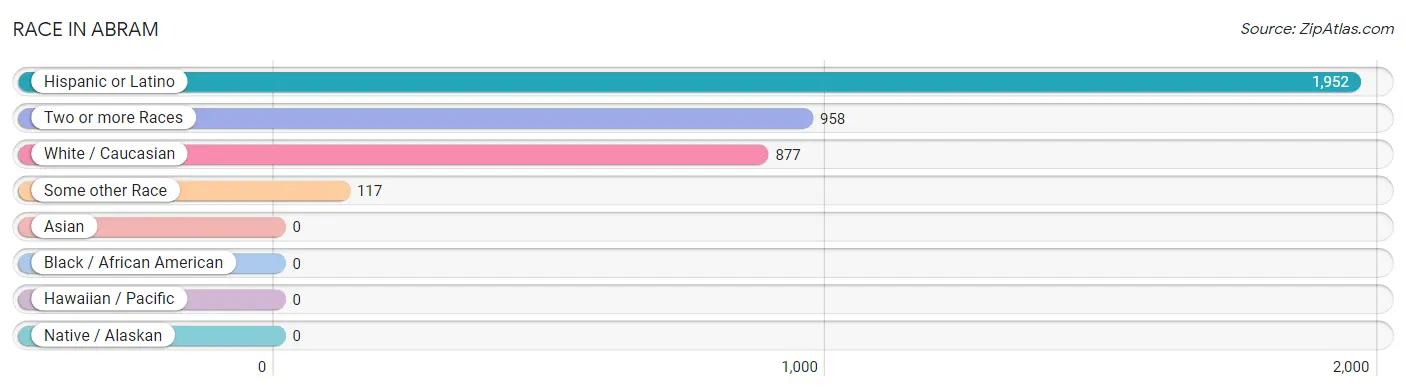
Race in Abram
The most populous races in Abram are Hispanic or Latino (1,952 | 100.0%), Two or more Races (958 | 49.1%), and White / Caucasian (877 | 44.9%).
| Race | # Population | % Population |
| Asian | 0 | 0.0% |
| Black / African American | 0 | 0.0% |
| Hawaiian / Pacific | 0 | 0.0% |
| Hispanic or Latino | 1,952 | 100.0% |
| Native / Alaskan | 0 | 0.0% |
| White / Caucasian | 877 | 44.9% |
| Two or more Races | 958 | 49.1% |
| Some other Race | 117 | 6.0% |
| Total | 1,952 | 100.0% |
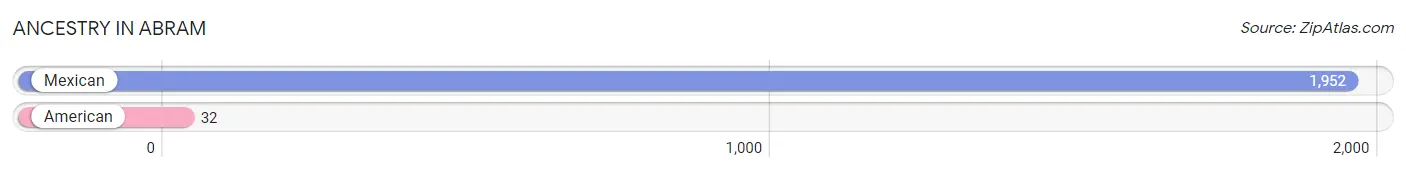
Ancestry in Abram
The most populous ancestries reported in Abram are Mexican (1,952 | 100.0%), and American (32 | 1.6%), together accounting for 101.6% of all Abram residents.
| Ancestry | # Population | % Population |
| American | 32 | 1.6% |
| Mexican | 1,952 | 100.0% | View All 2 Rows |
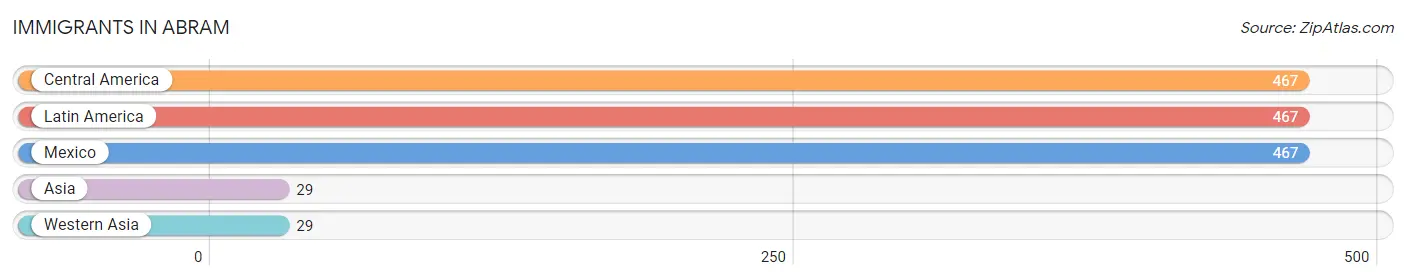
Immigrants in Abram
The most numerous immigrant groups reported in Abram came from Central America (467 | 23.9%), Latin America (467 | 23.9%), Mexico (467 | 23.9%), Asia (29 | 1.5%), and Western Asia (29 | 1.5%), together accounting for 74.7% of all Abram residents.
| Immigration Origin | # Population | % Population |
| Asia | 29 | 1.5% |
| Central America | 467 | 23.9% |
| Latin America | 467 | 23.9% |
| Mexico | 467 | 23.9% |
| Western Asia | 29 | 1.5% | View All 5 Rows |
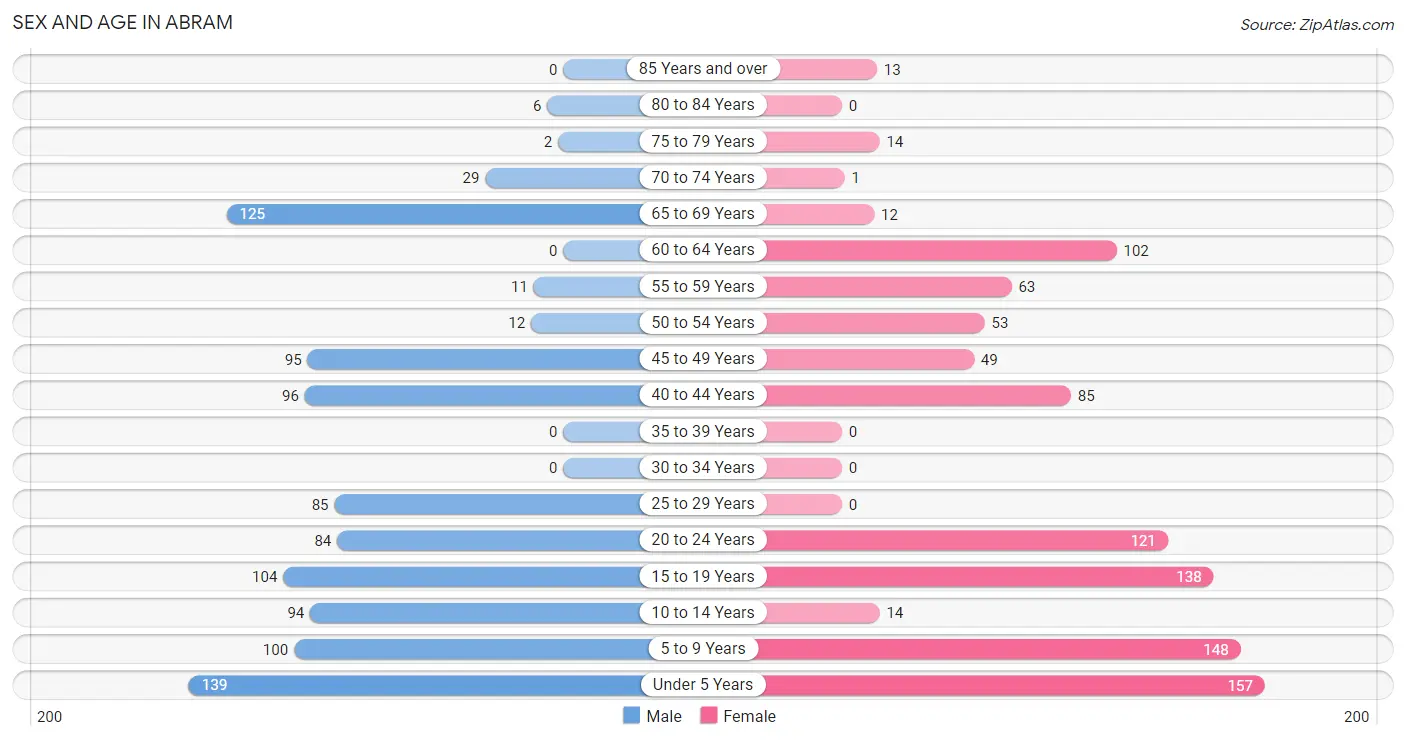
Sex and Age in Abram
Sex and Age in Abram
The most populous age groups in Abram are Under 5 Years (139 | 14.1%) for men and Under 5 Years (157 | 16.2%) for women.
| Age Bracket | Male | Female |
| Under 5 Years | 139 (14.1%) | 157 (16.2%) |
| 5 to 9 Years | 100 (10.2%) | 148 (15.3%) |
| 10 to 14 Years | 94 (9.6%) | 14 (1.4%) |
| 15 to 19 Years | 104 (10.6%) | 138 (14.2%) |
| 20 to 24 Years | 84 (8.6%) | 121 (12.5%) |
| 25 to 29 Years | 85 (8.7%) | 0 (0.0%) |
| 30 to 34 Years | 0 (0.0%) | 0 (0.0%) |
| 35 to 39 Years | 0 (0.0%) | 0 (0.0%) |
| 40 to 44 Years | 96 (9.8%) | 85 (8.8%) |
| 45 to 49 Years | 95 (9.7%) | 49 (5.1%) |
| 50 to 54 Years | 12 (1.2%) | 53 (5.5%) |
| 55 to 59 Years | 11 (1.1%) | 63 (6.5%) |
| 60 to 64 Years | 0 (0.0%) | 102 (10.5%) |
| 65 to 69 Years | 125 (12.7%) | 12 (1.2%) |
| 70 to 74 Years | 29 (2.9%) | 1 (0.1%) |
| 75 to 79 Years | 2 (0.2%) | 14 (1.4%) |
| 80 to 84 Years | 6 (0.6%) | 0 (0.0%) |
| 85 Years and over | 0 (0.0%) | 13 (1.3%) |
| Total | 982 (100.0%) | 970 (100.0%) |
Families and Households in Abram
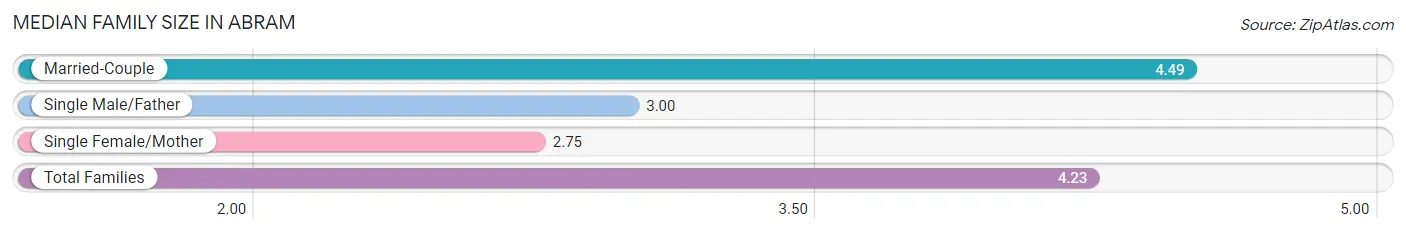
Median Family Size in Abram
The median family size in Abram is 4.23 persons per family, with married-couple families (385 | 84.6%) accounting for the largest median family size of 4.49 persons per family. On the other hand, single female/mother families (53 | 11.7%) represent the smallest median family size with 2.75 persons per family.
| Family Type | # Families | Family Size |
| Married-Couple | 385 (84.6%) | 4.49 |
| Single Male/Father | 17 (3.7%) | 3.00 |
| Single Female/Mother | 53 (11.7%) | 2.75 |
| Total Families | 455 (100.0%) | 4.23 |
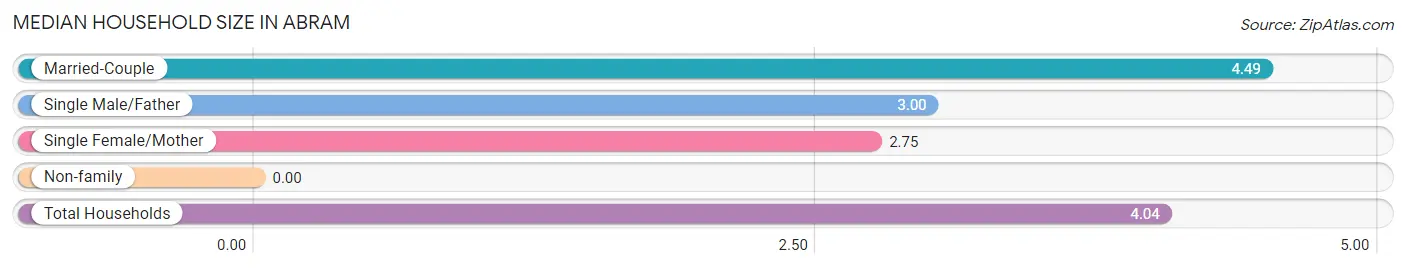
Median Household Size in Abram
| Household Type | # Households | Household Size |
| Married-Couple | 385 (79.7%) | 4.49 |
| Single Male/Father | 17 (3.5%) | 3.00 |
| Single Female/Mother | 53 (11.0%) | 2.75 |
| Non-family | 28 (5.8%) | - |
| Total Households | 483 (100.0%) | 4.04 |
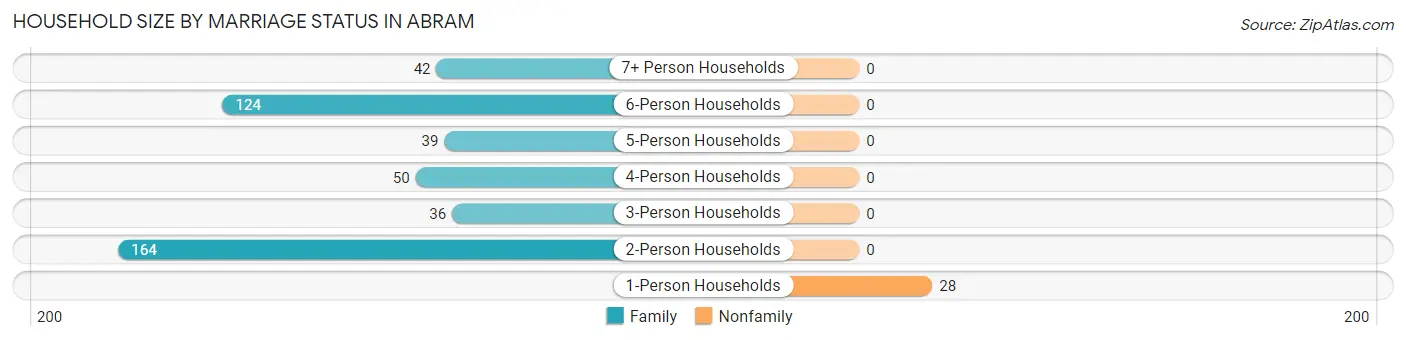
Household Size by Marriage Status in Abram
Out of a total of 483 households in Abram, 455 (94.2%) are family households, while 28 (5.8%) are nonfamily households. The most numerous type of family households are 2-person households, comprising 164, and the most common type of nonfamily households are 1-person households, comprising 28.
| Household Size | Family Households | Nonfamily Households |
| 1-Person Households | - | 28 (5.8%) |
| 2-Person Households | 164 (34.0%) | 0 (0.0%) |
| 3-Person Households | 36 (7.4%) | 0 (0.0%) |
| 4-Person Households | 50 (10.3%) | 0 (0.0%) |
| 5-Person Households | 39 (8.1%) | 0 (0.0%) |
| 6-Person Households | 124 (25.7%) | 0 (0.0%) |
| 7+ Person Households | 42 (8.7%) | 0 (0.0%) |
| Total | 455 (94.2%) | 28 (5.8%) |
Female Fertility in Abram
Fertility by Age in Abram
Average fertility rate in Abram is 131.0 births per 1,000 women. Women in the age bracket of 20 to 34 years have the highest fertility rate with 446.0 births per 1,000 women. Women in the age bracket of 20 to 34 years acount for 100.0% of all women with births.
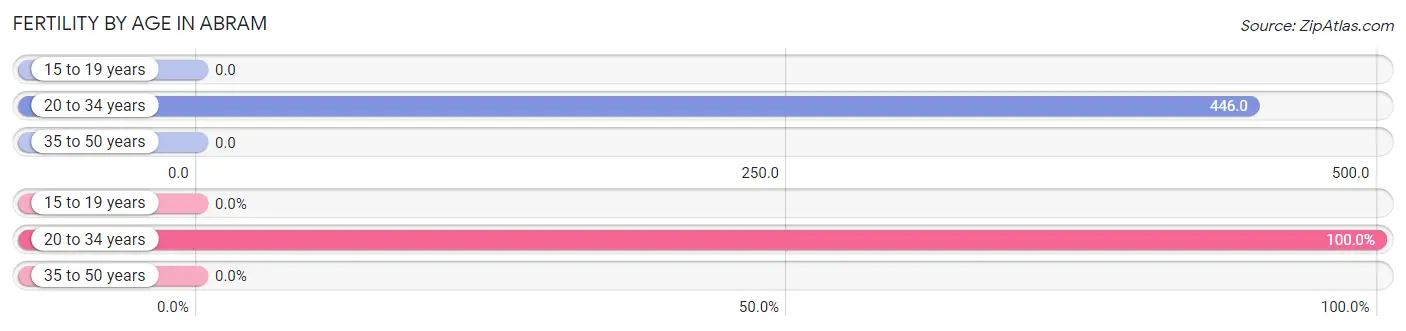
| Age Bracket | Women with Births | Births / 1,000 Women |
| 15 to 19 years | 0 (0.0%) | 0.0 |
| 20 to 34 years | 54 (100.0%) | 446.0 |
| 35 to 50 years | 0 (0.0%) | 0.0 |
| Total | 54 (100.0%) | 131.0 |
Fertility by Age by Marriage Status in Abram
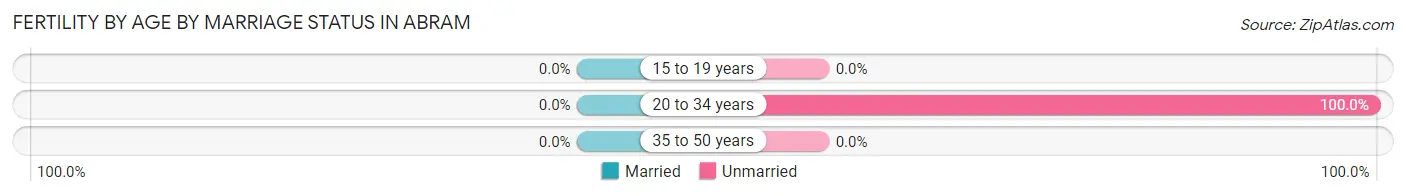
| Age Bracket | Married | Unmarried |
| 15 to 19 years | 0 (0.0%) | 0 (0.0%) |
| 20 to 34 years | 0 (0.0%) | 54 (100.0%) |
| 35 to 50 years | 0 (0.0%) | 0 (0.0%) |
| Total | 0 (0.0%) | 54 (100.0%) |
Fertility by Education in Abram
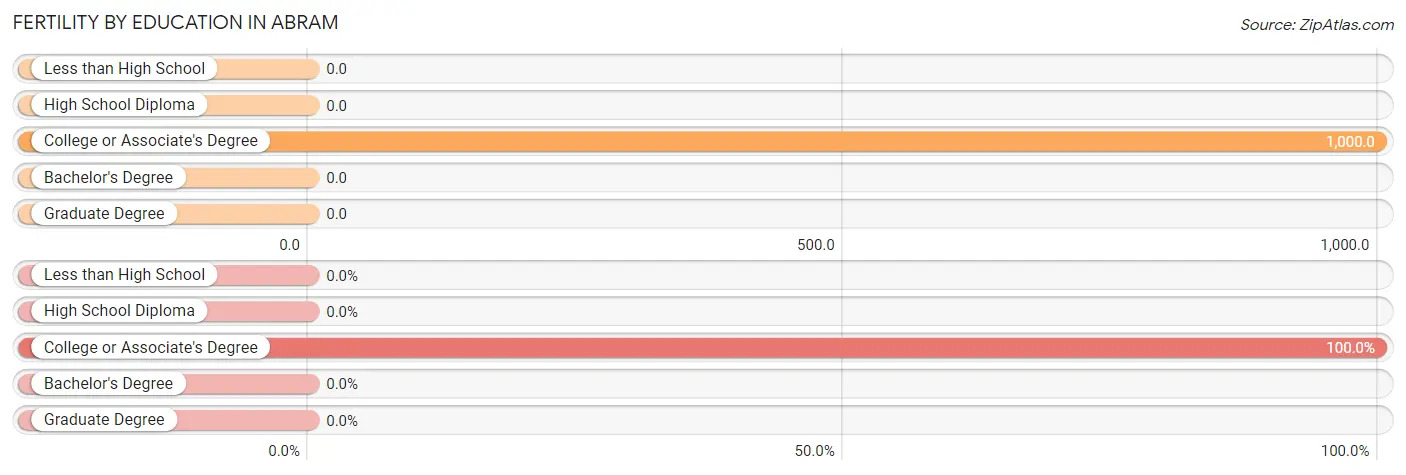
| Educational Attainment | Women with Births | Births / 1,000 Women |
| Less than High School | 0 (0.0%) | 0.0 |
| High School Diploma | 0 (0.0%) | 0.0 |
| College or Associate's Degree | 54 (100.0%) | 1,000.0 |
| Bachelor's Degree | 0 (0.0%) | 0.0 |
| Graduate Degree | 0 (0.0%) | 0.0 |
| Total | 54 (100.0%) | 131.0 |
Fertility by Education by Marriage Status in Abram
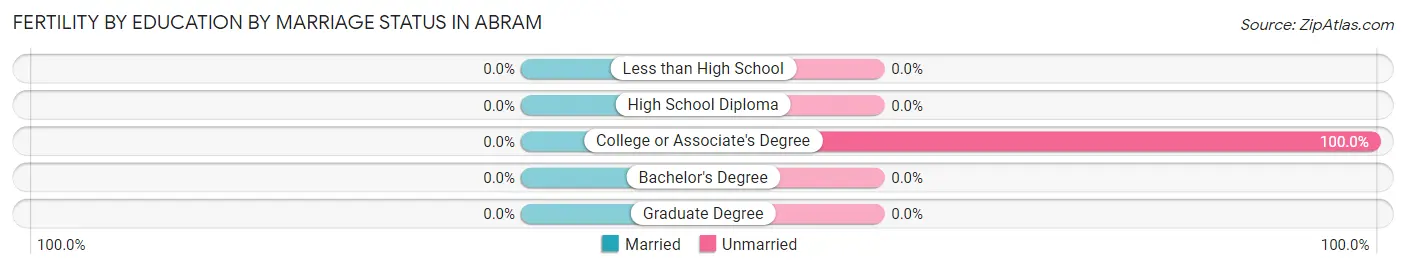
| Educational Attainment | Married | Unmarried |
| Less than High School | 0 (0.0%) | 0 (0.0%) |
| High School Diploma | 0 (0.0%) | 0 (0.0%) |
| College or Associate's Degree | 0 (0.0%) | 54 (100.0%) |
| Bachelor's Degree | 0 (0.0%) | 0 (0.0%) |
| Graduate Degree | 0 (0.0%) | 0 (0.0%) |
| Total | 0 (0.0%) | 54 (100.0%) |
Income in Abram
Income Overview in Abram
Per Capita Income in Abram is $10,249, while median incomes of families and households are $27,854 and $27,137 respectively.
| Characteristic | Number | Measure |
| Per Capita Income | 1,952 | $10,249 |
| Median Family Income | 455 | $27,854 |
| Mean Family Income | 455 | $48,570 |
| Median Household Income | 483 | $27,137 |
| Mean Household Income | 483 | $46,217 |
| Income Deficit | 455 | $0 |
| Wage / Income Gap (%) | 1,952 | 30.00% |
| Wage / Income Gap ($) | 1,952 | 70.00¢ per $1 |
| Gini / Inequality Index | 1,952 | 0.51 |
Earnings by Sex in Abram
Average Earnings in Abram are $27,553, $28,680 for men and $20,076 for women, a difference of 30.0%.
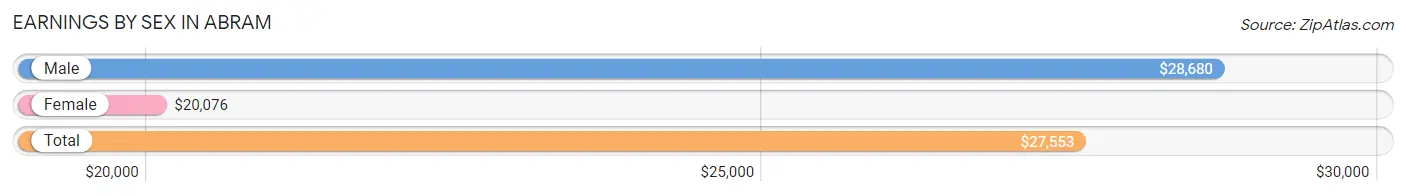
| Sex | Number | Average Earnings |
| Male | 353 (66.2%) | $28,680 |
| Female | 180 (33.8%) | $20,076 |
| Total | 533 (100.0%) | $27,553 |
Earnings by Sex by Income Bracket in Abram
The most common earnings brackets in Abram are $25,000 to $29,999 for men (71 | 20.1%) and $7,500 to $9,999 for women (46 | 25.6%).
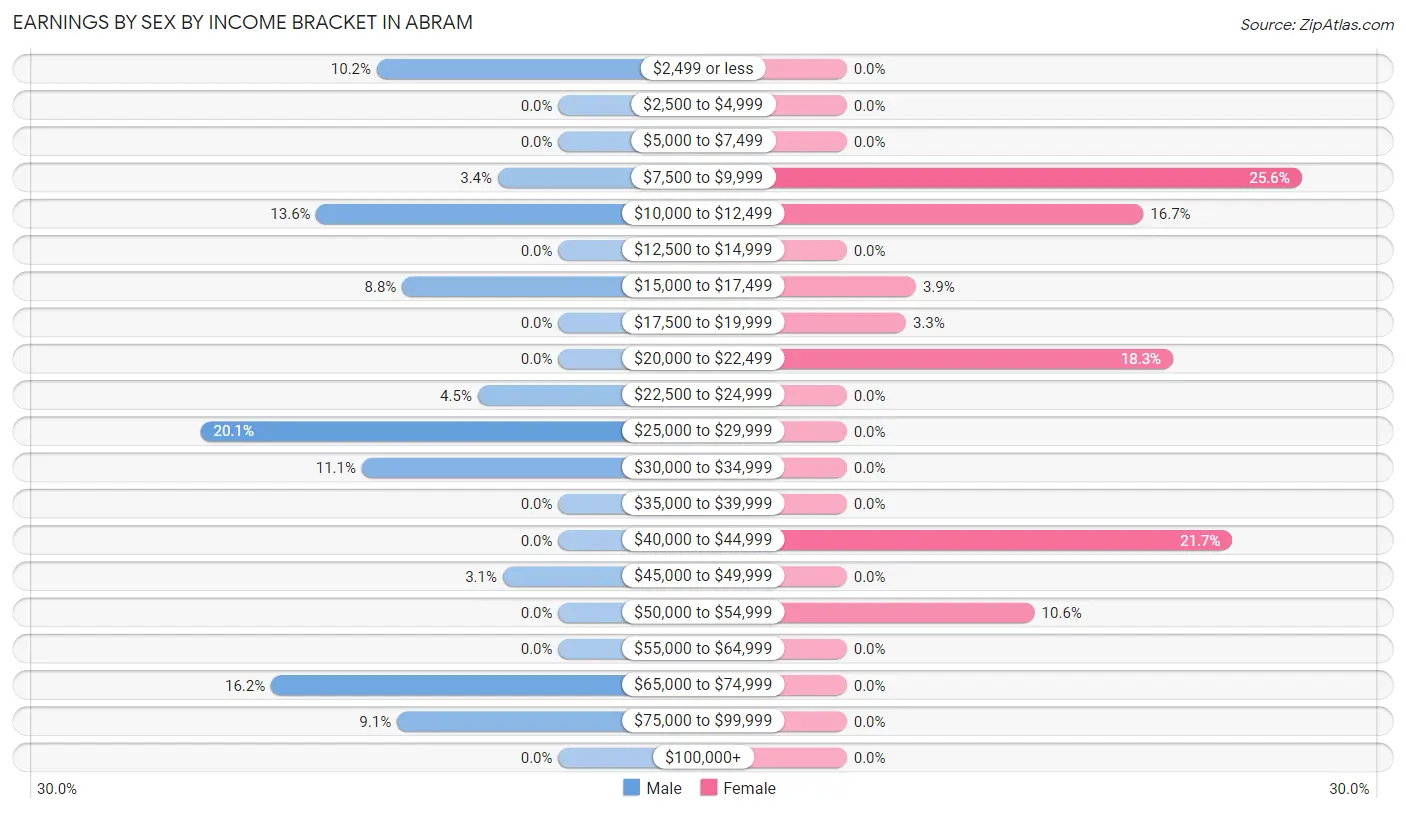
| Income | Male | Female |
| $2,499 or less | 36 (10.2%) | 0 (0.0%) |
| $2,500 to $4,999 | 0 (0.0%) | 0 (0.0%) |
| $5,000 to $7,499 | 0 (0.0%) | 0 (0.0%) |
| $7,500 to $9,999 | 12 (3.4%) | 46 (25.6%) |
| $10,000 to $12,499 | 48 (13.6%) | 30 (16.7%) |
| $12,500 to $14,999 | 0 (0.0%) | 0 (0.0%) |
| $15,000 to $17,499 | 31 (8.8%) | 7 (3.9%) |
| $17,500 to $19,999 | 0 (0.0%) | 6 (3.3%) |
| $20,000 to $22,499 | 0 (0.0%) | 33 (18.3%) |
| $22,500 to $24,999 | 16 (4.5%) | 0 (0.0%) |
| $25,000 to $29,999 | 71 (20.1%) | 0 (0.0%) |
| $30,000 to $34,999 | 39 (11.1%) | 0 (0.0%) |
| $35,000 to $39,999 | 0 (0.0%) | 0 (0.0%) |
| $40,000 to $44,999 | 0 (0.0%) | 39 (21.7%) |
| $45,000 to $49,999 | 11 (3.1%) | 0 (0.0%) |
| $50,000 to $54,999 | 0 (0.0%) | 19 (10.6%) |
| $55,000 to $64,999 | 0 (0.0%) | 0 (0.0%) |
| $65,000 to $74,999 | 57 (16.2%) | 0 (0.0%) |
| $75,000 to $99,999 | 32 (9.1%) | 0 (0.0%) |
| $100,000+ | 0 (0.0%) | 0 (0.0%) |
| Total | 353 (100.0%) | 180 (100.0%) |
Earnings by Sex by Educational Attainment in Abram
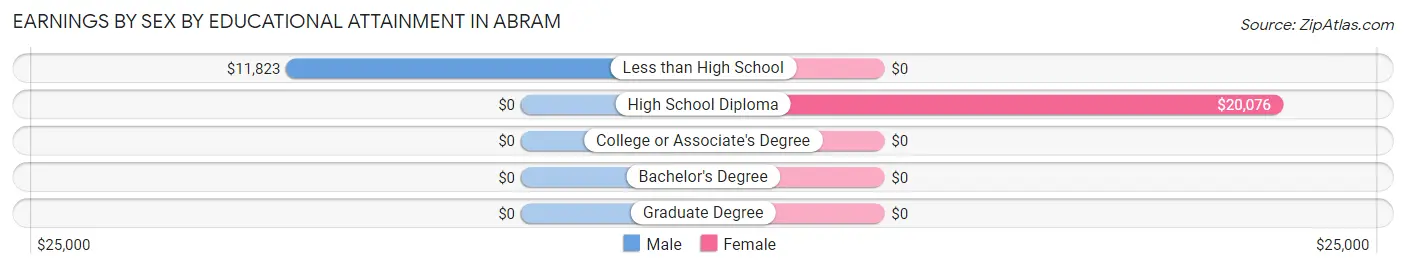
| Educational Attainment | Male Income | Female Income |
| Less than High School | $11,823 | $0 |
| High School Diploma | - | - |
| College or Associate's Degree | - | - |
| Bachelor's Degree | - | - |
| Graduate Degree | - | - |
| Total | $28,116 | $0 |
Family Income in Abram
Family Income Brackets in Abram
According to the Abram family income data, there are 106 families falling into the $10,000 to $14,999 income range, which is the most common income bracket and makes up 23.3% of all families.
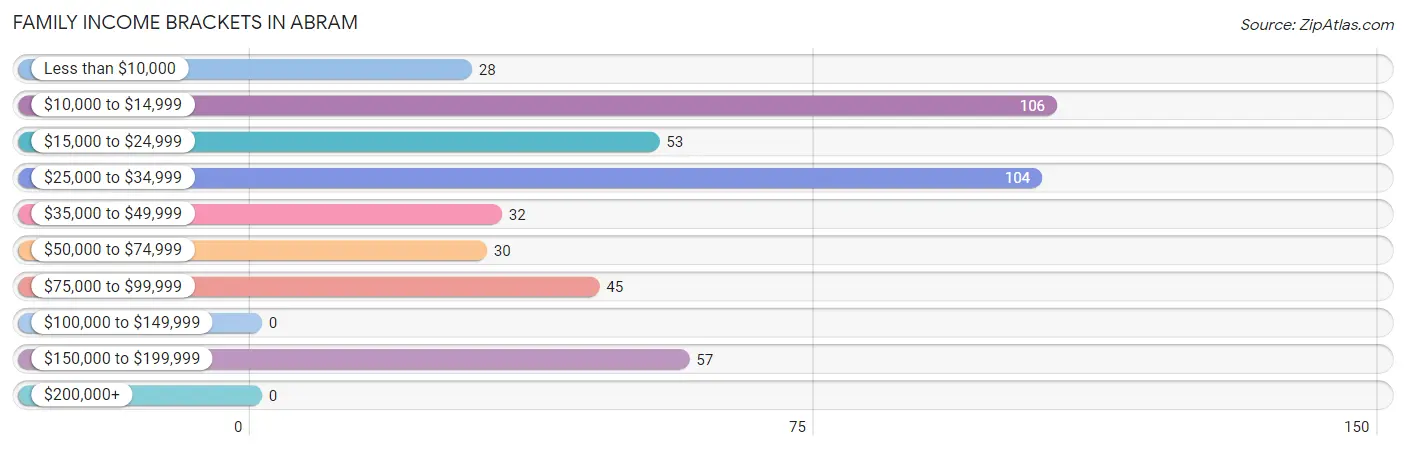
| Income Bracket | # Families | % Families |
| Less than $10,000 | 28 | 6.2% |
| $10,000 to $14,999 | 106 | 23.3% |
| $15,000 to $24,999 | 53 | 11.6% |
| $25,000 to $34,999 | 104 | 22.9% |
| $35,000 to $49,999 | 32 | 7.0% |
| $50,000 to $74,999 | 30 | 6.6% |
| $75,000 to $99,999 | 45 | 9.9% |
| $100,000 to $149,999 | 0 | 0.0% |
| $150,000 to $199,999 | 57 | 12.5% |
| $200,000+ | 0 | 0.0% |
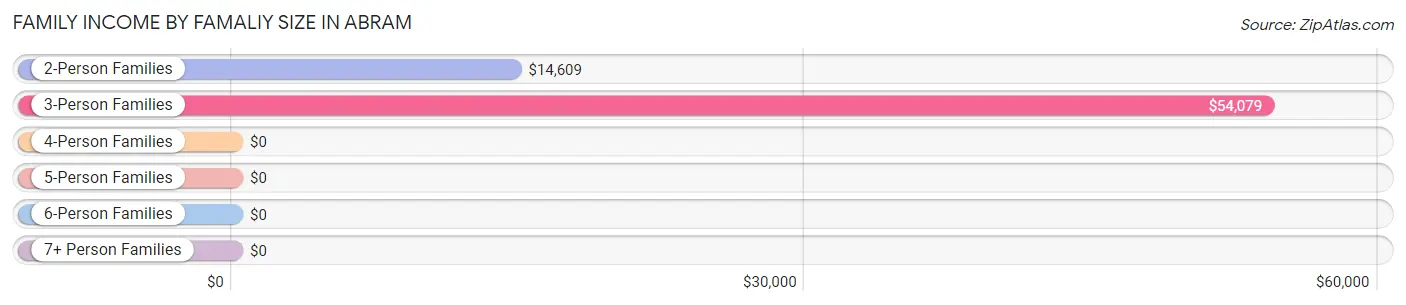
Family Income by Famaliy Size in Abram
3-person families (36 | 7.9%) account for the highest median family income in Abram with $54,079 per family, while 3-person families (36 | 7.9%) have the highest median income of $18,026 per family member.
| Income Bracket | # Families | Median Income |
| 2-Person Families | 164 (36.0%) | $14,609 |
| 3-Person Families | 36 (7.9%) | $54,079 |
| 4-Person Families | 50 (11.0%) | $0 |
| 5-Person Families | 39 (8.6%) | $0 |
| 6-Person Families | 124 (27.3%) | $0 |
| 7+ Person Families | 42 (9.2%) | $0 |
| Total | 455 (100.0%) | $27,854 |
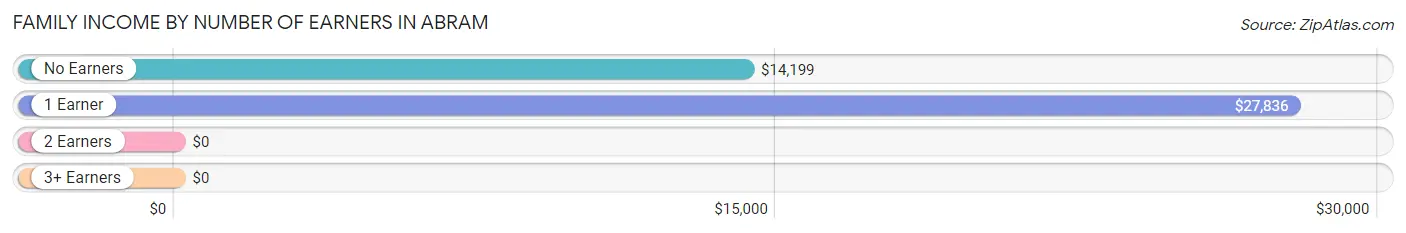
Family Income by Number of Earners in Abram
| Number of Earners | # Families | Median Income |
| No Earners | 87 (19.1%) | $14,199 |
| 1 Earner | 230 (50.5%) | $27,836 |
| 2 Earners | 99 (21.8%) | $0 |
| 3+ Earners | 39 (8.6%) | $0 |
| Total | 455 (100.0%) | $27,854 |
Household Income in Abram
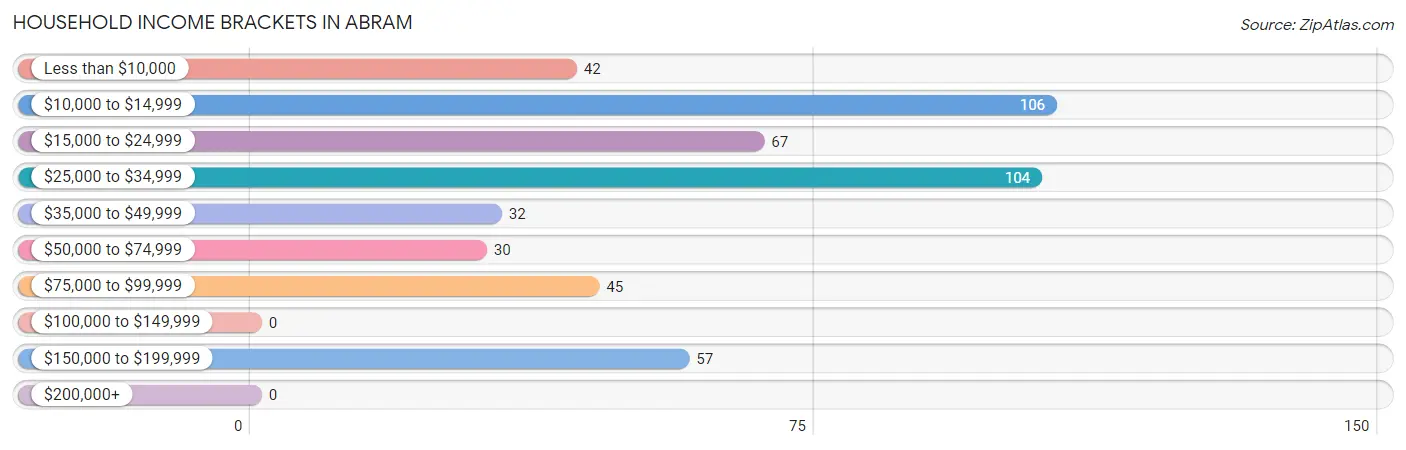
Household Income Brackets in Abram
With 106 households falling in the category, the $10,000 to $14,999 income range is the most frequent in Abram, accounting for 22.0% of all households.
| Income Bracket | # Households | % Households |
| Less than $10,000 | 42 | 8.7% |
| $10,000 to $14,999 | 106 | 21.9% |
| $15,000 to $24,999 | 67 | 13.9% |
| $25,000 to $34,999 | 104 | 21.5% |
| $35,000 to $49,999 | 32 | 6.6% |
| $50,000 to $74,999 | 30 | 6.2% |
| $75,000 to $99,999 | 45 | 9.3% |
| $100,000 to $149,999 | 0 | 0.0% |
| $150,000 to $199,999 | 57 | 11.8% |
| $200,000+ | 0 | 0.0% |
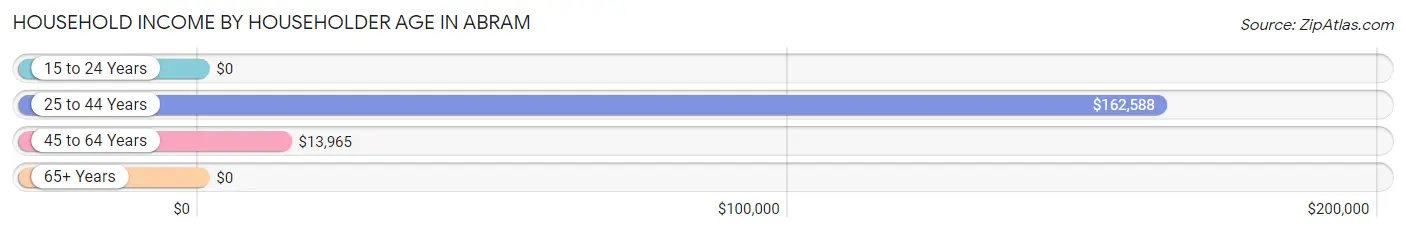
Household Income by Householder Age in Abram
The median household income in Abram is $27,137, with the highest median household income of $162,588 found in the 25 to 44 years age bracket for the primary householder. A total of 110 households (22.8%) fall into this category. Meanwhile, the 15 to 24 years age bracket for the primary householder has the lowest median household income of $0, with 67 households (13.9%) in this group.
| Income Bracket | # Households | Median Income |
| 15 to 24 Years | 67 (13.9%) | $0 |
| 25 to 44 Years | 110 (22.8%) | $162,588 |
| 45 to 64 Years | 215 (44.5%) | $13,965 |
| 65+ Years | 91 (18.8%) | $0 |
| Total | 483 (100.0%) | $27,137 |
Poverty in Abram
Income Below Poverty by Sex and Age in Abram
With 57.5% poverty level for males and 65.3% for females among the residents of Abram, under 5 year old males and under 5 year old females are the most vulnerable to poverty, with 139 males (100.0%) and 157 females (100.0%) in their respective age groups living below the poverty level.
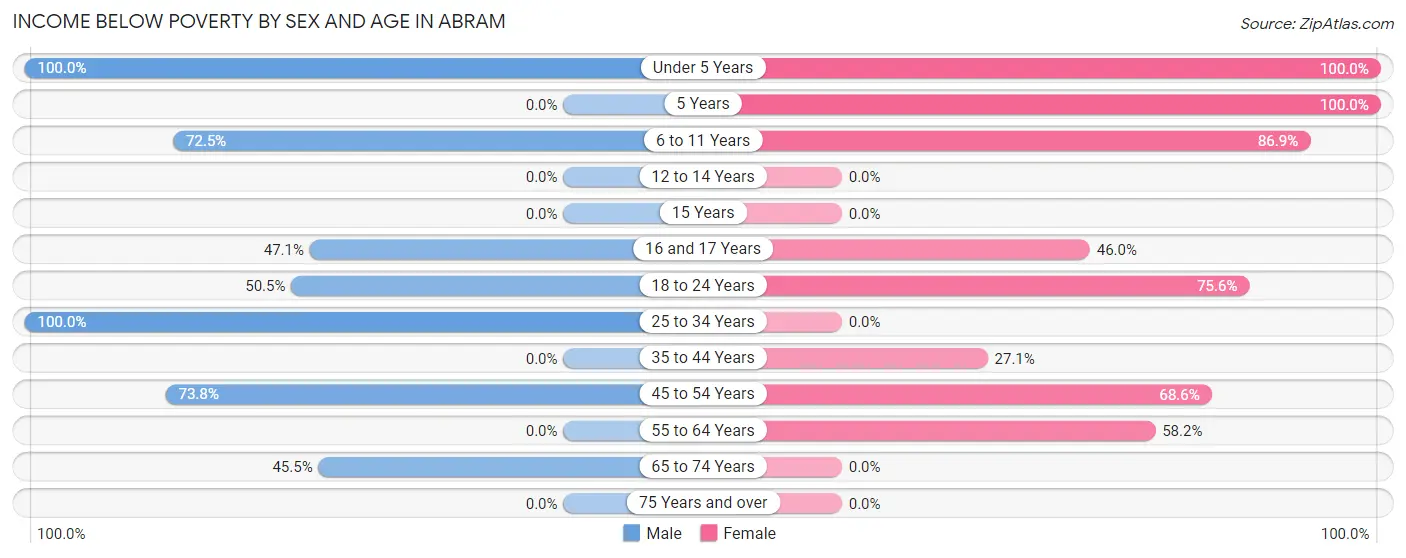
| Age Bracket | Male | Female |
| Under 5 Years | 139 (100.0%) | 157 (100.0%) |
| 5 Years | 0 (0.0%) | 64 (100.0%) |
| 6 to 11 Years | 100 (72.5%) | 73 (86.9%) |
| 12 to 14 Years | 0 (0.0%) | 0 (0.0%) |
| 15 Years | 0 (0.0%) | 0 (0.0%) |
| 16 and 17 Years | 40 (47.1%) | 29 (46.0%) |
| 18 to 24 Years | 52 (50.5%) | 121 (75.6%) |
| 25 to 34 Years | 85 (100.0%) | 0 (0.0%) |
| 35 to 44 Years | 0 (0.0%) | 23 (27.1%) |
| 45 to 54 Years | 79 (73.8%) | 70 (68.6%) |
| 55 to 64 Years | 0 (0.0%) | 96 (58.2%) |
| 65 to 74 Years | 70 (45.5%) | 0 (0.0%) |
| 75 Years and over | 0 (0.0%) | 0 (0.0%) |
| Total | 565 (57.5%) | 633 (65.3%) |
Income Above Poverty by Sex and Age in Abram
According to the poverty statistics in Abram, males aged 12 to 14 years and females aged 12 to 14 years are the age groups that are most secure financially, with 100.0% of males and 100.0% of females in these age groups living above the poverty line.
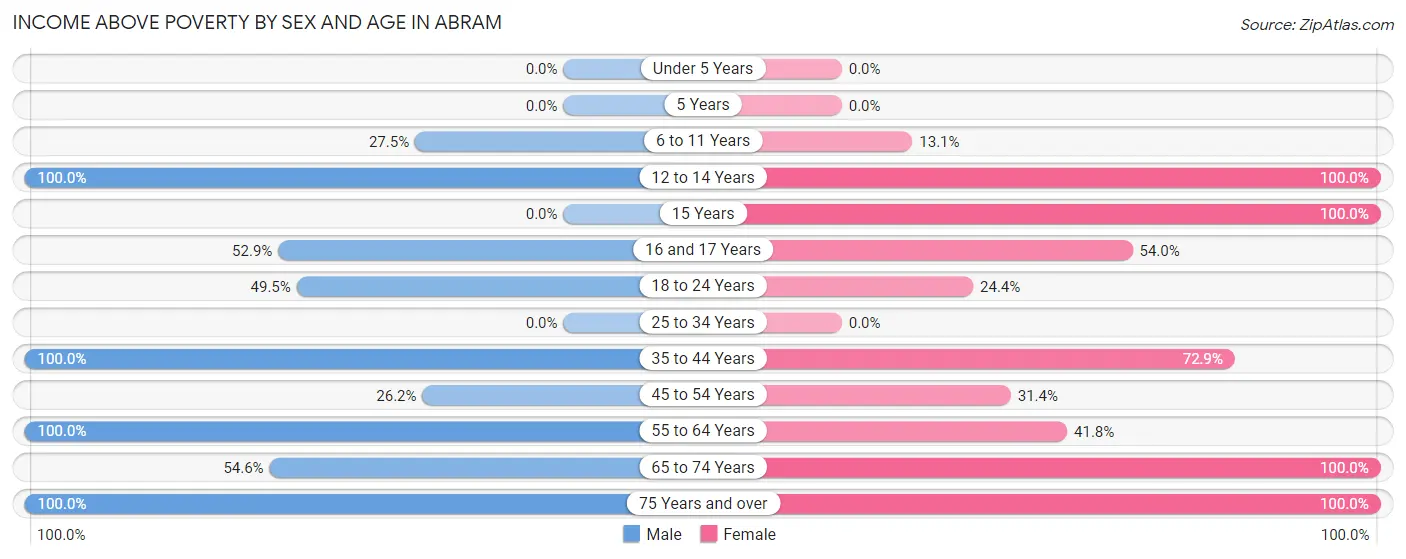
| Age Bracket | Male | Female |
| Under 5 Years | 0 (0.0%) | 0 (0.0%) |
| 5 Years | 0 (0.0%) | 0 (0.0%) |
| 6 to 11 Years | 38 (27.5%) | 11 (13.1%) |
| 12 to 14 Years | 56 (100.0%) | 14 (100.0%) |
| 15 Years | 0 (0.0%) | 36 (100.0%) |
| 16 and 17 Years | 45 (52.9%) | 34 (54.0%) |
| 18 to 24 Years | 51 (49.5%) | 39 (24.4%) |
| 25 to 34 Years | 0 (0.0%) | 0 (0.0%) |
| 35 to 44 Years | 96 (100.0%) | 62 (72.9%) |
| 45 to 54 Years | 28 (26.2%) | 32 (31.4%) |
| 55 to 64 Years | 11 (100.0%) | 69 (41.8%) |
| 65 to 74 Years | 84 (54.5%) | 13 (100.0%) |
| 75 Years and over | 8 (100.0%) | 27 (100.0%) |
| Total | 417 (42.5%) | 337 (34.7%) |
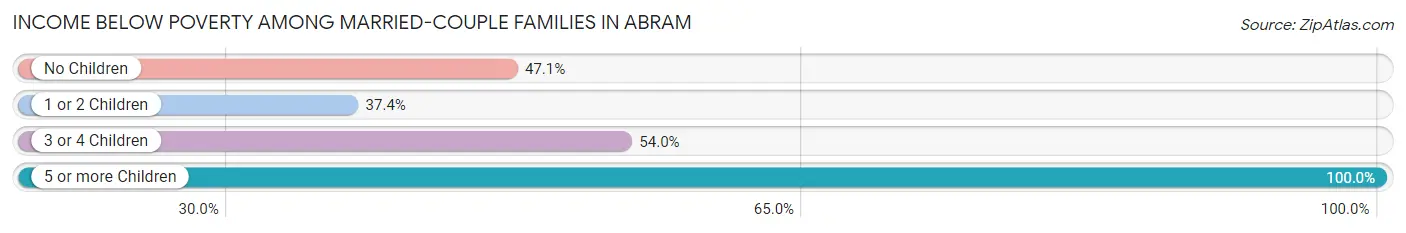
Income Below Poverty Among Married-Couple Families in Abram
The poverty statistics for married-couple families in Abram show that 53.0% or 204 of the total 385 families live below the poverty line. Families with 5 or more children have the highest poverty rate of 100.0%, comprising of 42 families. On the other hand, families with 1 or 2 children have the lowest poverty rate of 37.3%, which includes 31 families.
| Children | Above Poverty | Below Poverty |
| No Children | 72 (52.9%) | 64 (47.1%) |
| 1 or 2 Children | 52 (62.6%) | 31 (37.3%) |
| 3 or 4 Children | 57 (46.0%) | 67 (54.0%) |
| 5 or more Children | 0 (0.0%) | 42 (100.0%) |
| Total | 181 (47.0%) | 204 (53.0%) |
Income Below Poverty Among Single-Parent Households in Abram
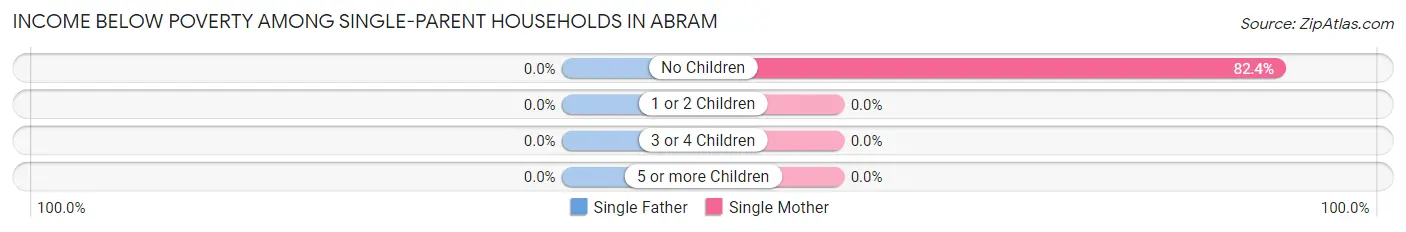
| Children | Single Father | Single Mother |
| No Children | 0 (0.0%) | 28 (82.4%) |
| 1 or 2 Children | 0 (0.0%) | 0 (0.0%) |
| 3 or 4 Children | 0 (0.0%) | 0 (0.0%) |
| 5 or more Children | 0 (0.0%) | 0 (0.0%) |
| Total | 0 (0.0%) | 28 (52.8%) |
Income Below Poverty Among Married-Couple vs Single-Parent Households in Abram
The poverty data for Abram shows that 204 of the married-couple family households (53.0%) and 28 of the single-parent households (40.0%) are living below the poverty level. Within the married-couple family households, those with 5 or more children have the highest poverty rate, with 42 households (100.0%) falling below the poverty line. Among the single-parent households, those with no children have the highest poverty rate, with 28 household (82.4%) living below poverty.
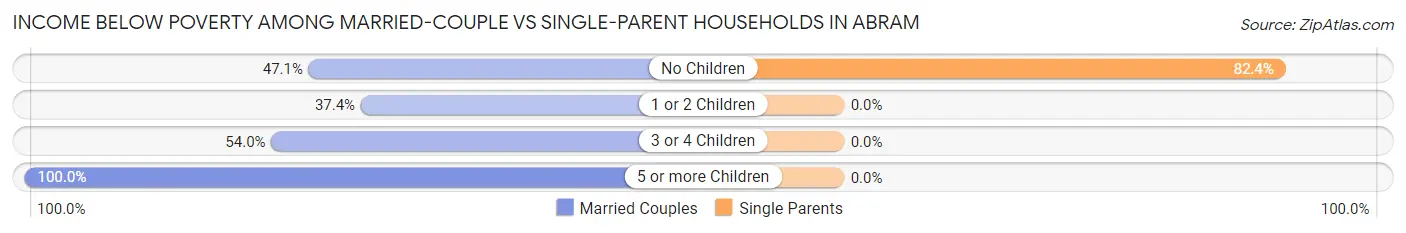
| Children | Married-Couple Families | Single-Parent Households |
| No Children | 64 (47.1%) | 28 (82.4%) |
| 1 or 2 Children | 31 (37.3%) | 0 (0.0%) |
| 3 or 4 Children | 67 (54.0%) | 0 (0.0%) |
| 5 or more Children | 42 (100.0%) | 0 (0.0%) |
| Total | 204 (53.0%) | 28 (40.0%) |
Employment Characteristics in Abram
Employment by Class of Employer in Abram
Among the 492 employed individuals in Abram, private company employees (304 | 61.8%), local government employees (104 | 21.1%), and self-employed (not incorporated) (84 | 17.1%) make up the most common classes of employment.
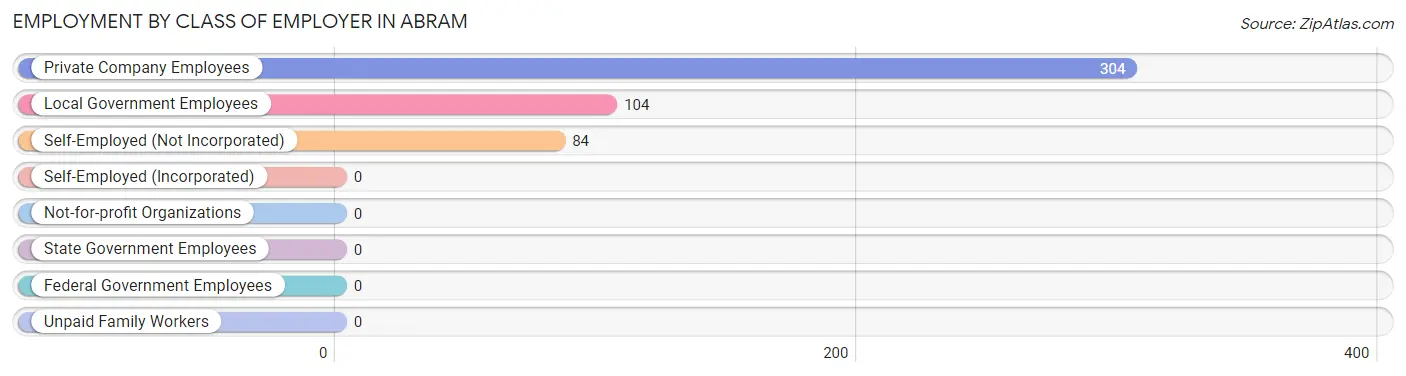
| Employer Class | # Employees | % Employees |
| Private Company Employees | 304 | 61.8% |
| Self-Employed (Incorporated) | 0 | 0.0% |
| Self-Employed (Not Incorporated) | 84 | 17.1% |
| Not-for-profit Organizations | 0 | 0.0% |
| Local Government Employees | 104 | 21.1% |
| State Government Employees | 0 | 0.0% |
| Federal Government Employees | 0 | 0.0% |
| Unpaid Family Workers | 0 | 0.0% |
| Total | 492 | 100.0% |
Employment Status by Age in Abram
According to the labor force statistics for Abram, out of the total population over 16 years of age (1,264), 44.6% or 564 individuals are in the labor force, with 12.8% or 72 of them unemployed. The age group with the highest labor force participation rate is 25 to 29 years, with 83.5% or 71 individuals in the labor force. Within the labor force, the 20 to 24 years age range has the highest percentage of unemployed individuals, with 62.8% or 54 of them being unemployed.
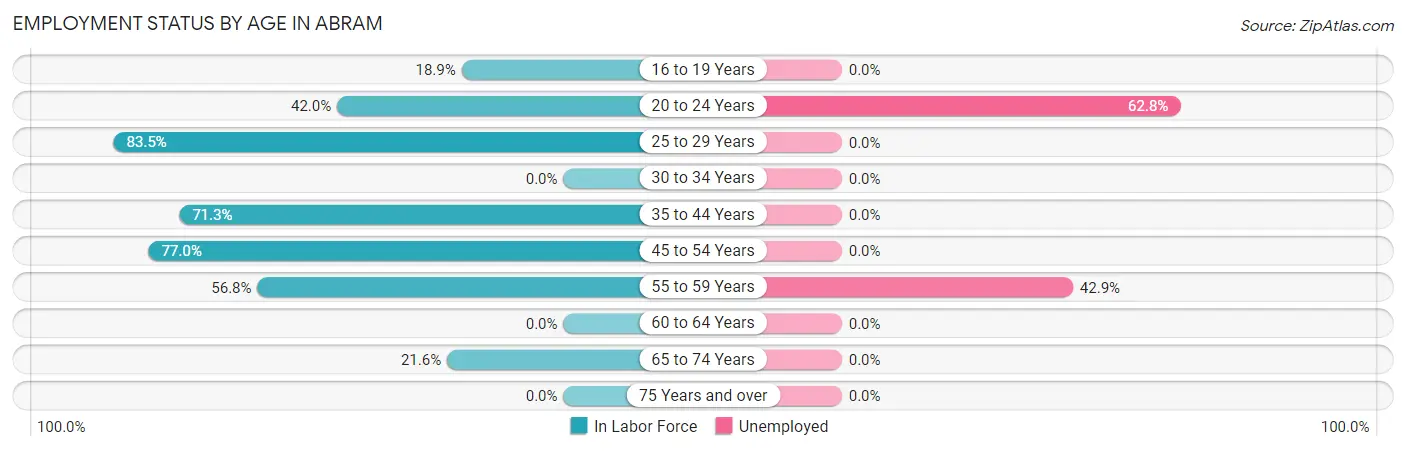
| Age Bracket | In Labor Force | Unemployed |
| 16 to 19 Years | 39 (18.9%) | 0 (0.0%) |
| 20 to 24 Years | 86 (42.0%) | 54 (62.8%) |
| 25 to 29 Years | 71 (83.5%) | 0 (0.0%) |
| 30 to 34 Years | 0 (0.0%) | 0 (0.0%) |
| 35 to 44 Years | 129 (71.3%) | 0 (0.0%) |
| 45 to 54 Years | 161 (77.0%) | 0 (0.0%) |
| 55 to 59 Years | 42 (56.8%) | 18 (42.9%) |
| 60 to 64 Years | 0 (0.0%) | 0 (0.0%) |
| 65 to 74 Years | 36 (21.6%) | 0 (0.0%) |
| 75 Years and over | 0 (0.0%) | 0 (0.0%) |
| Total | 564 (44.6%) | 72 (12.8%) |
Employment Status by Educational Attainment in Abram
According to labor force statistics for Abram, 61.9% of individuals (403) out of the total population between 25 and 64 years of age (651) are in the labor force, with 4.5% or 18 of them being unemployed. The group with the highest labor force participation rate are those with the educational attainment of college / associate degree, with 94.6% or 106 individuals in the labor force. Within the labor force, individuals with high school diploma education have the highest percentage of unemployment, with 13.6% or 18 of them being unemployed.
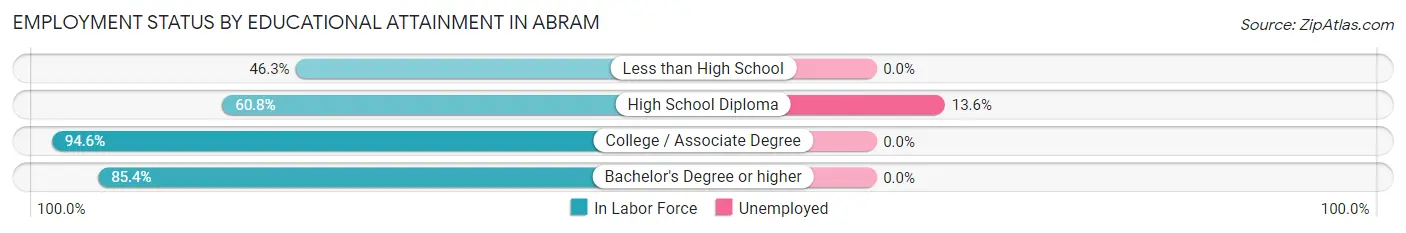
| Educational Attainment | In Labor Force | Unemployed |
| Less than High School | 130 (46.3%) | 0 (0.0%) |
| High School Diploma | 132 (60.8%) | 30 (13.6%) |
| College / Associate Degree | 106 (94.6%) | 0 (0.0%) |
| Bachelor's Degree or higher | 35 (85.4%) | 0 (0.0%) |
| Total | 403 (61.9%) | 29 (4.5%) |
Employment Occupations by Sex in Abram
Management, Business, Science and Arts Occupations
The most common Management, Business, Science and Arts occupations in Abram are Community & Social Service (19 | 3.9%), and Education Instruction & Library (19 | 3.9%).
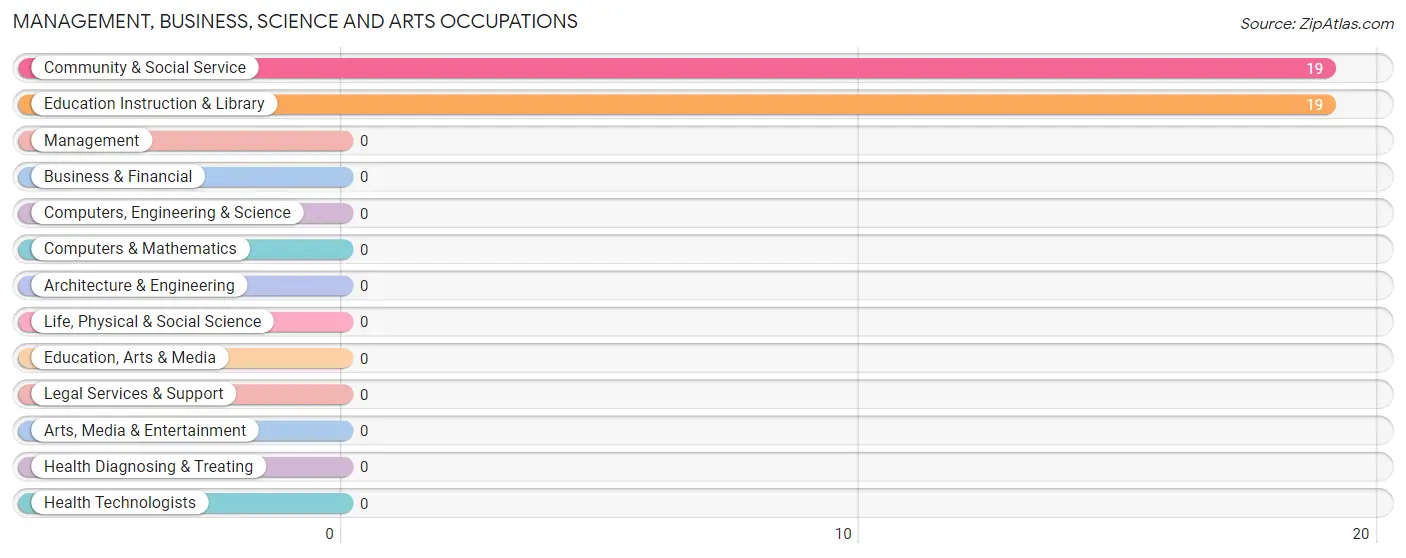
Management, Business, Science and Arts Occupations by Sex
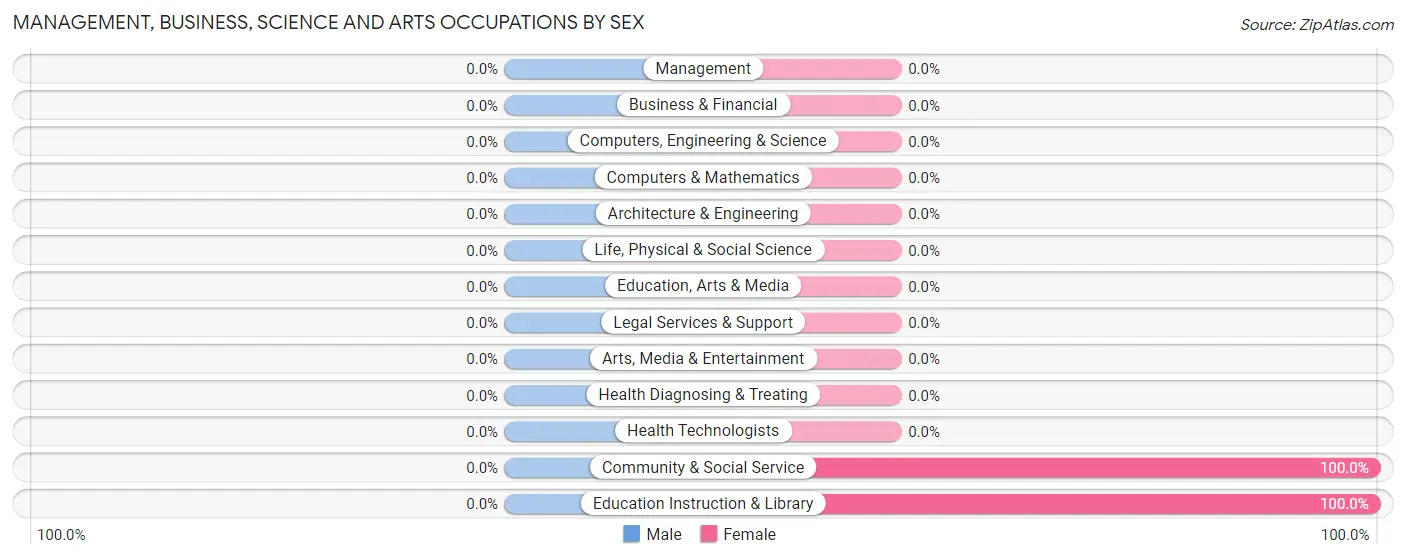
| Occupation | Male | Female |
| Management | 0 (0.0%) | 0 (0.0%) |
| Business & Financial | 0 (0.0%) | 0 (0.0%) |
| Computers, Engineering & Science | 0 (0.0%) | 0 (0.0%) |
| Computers & Mathematics | 0 (0.0%) | 0 (0.0%) |
| Architecture & Engineering | 0 (0.0%) | 0 (0.0%) |
| Life, Physical & Social Science | 0 (0.0%) | 0 (0.0%) |
| Community & Social Service | 0 (0.0%) | 19 (100.0%) |
| Education, Arts & Media | 0 (0.0%) | 0 (0.0%) |
| Legal Services & Support | 0 (0.0%) | 0 (0.0%) |
| Education Instruction & Library | 0 (0.0%) | 19 (100.0%) |
| Arts, Media & Entertainment | 0 (0.0%) | 0 (0.0%) |
| Health Diagnosing & Treating | 0 (0.0%) | 0 (0.0%) |
| Health Technologists | 0 (0.0%) | 0 (0.0%) |
| Total (Category) | 0 (0.0%) | 19 (100.0%) |
| Total (Overall) | 353 (71.8%) | 139 (28.2%) |
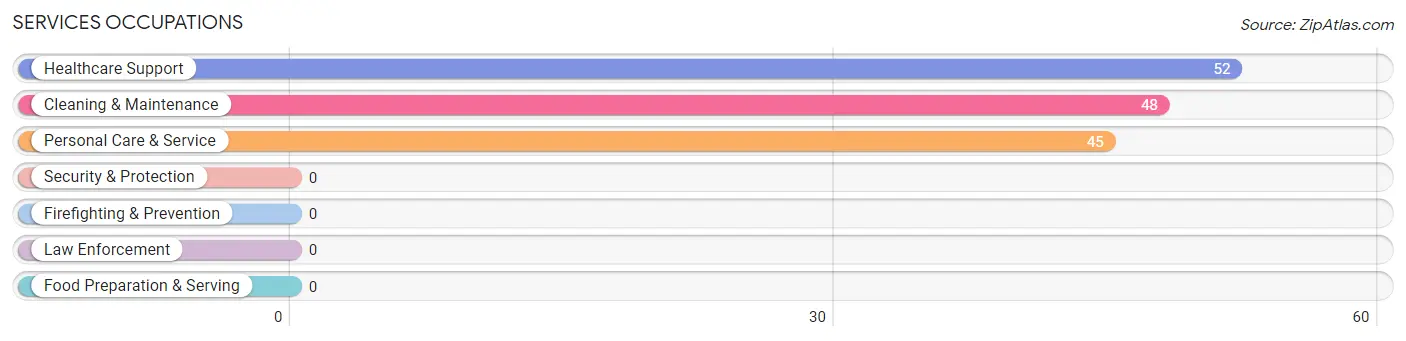
Services Occupations
The most common Services occupations in Abram are Healthcare Support (52 | 10.6%), Cleaning & Maintenance (48 | 9.8%), and Personal Care & Service (45 | 9.1%).
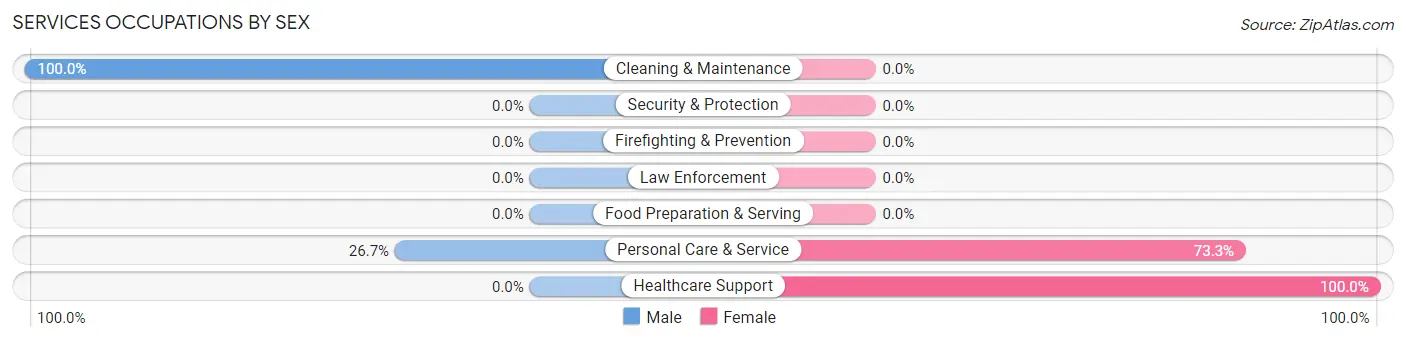
Services Occupations by Sex
Within the Services occupations in Abram, the most male-oriented occupations are Cleaning & Maintenance (100.0%), and Personal Care & Service (26.7%), while the most female-oriented occupations are Healthcare Support (100.0%), and Personal Care & Service (73.3%).
| Occupation | Male | Female |
| Healthcare Support | 0 (0.0%) | 52 (100.0%) |
| Security & Protection | 0 (0.0%) | 0 (0.0%) |
| Firefighting & Prevention | 0 (0.0%) | 0 (0.0%) |
| Law Enforcement | 0 (0.0%) | 0 (0.0%) |
| Food Preparation & Serving | 0 (0.0%) | 0 (0.0%) |
| Cleaning & Maintenance | 48 (100.0%) | 0 (0.0%) |
| Personal Care & Service | 12 (26.7%) | 33 (73.3%) |
| Total (Category) | 60 (41.4%) | 85 (58.6%) |
| Total (Overall) | 353 (71.8%) | 139 (28.2%) |
Sales and Office Occupations
The most common Sales and Office occupations in Abram are Office & Administration (35 | 7.1%), and Sales & Related (16 | 3.3%).
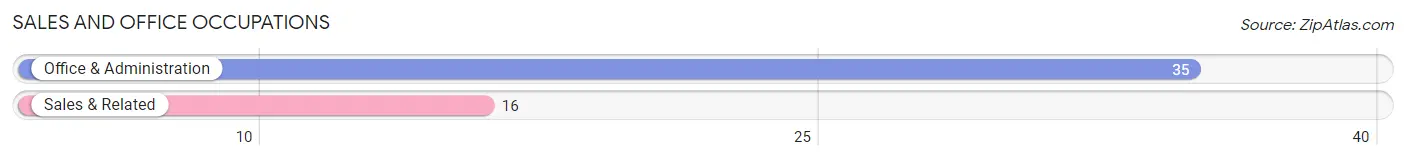
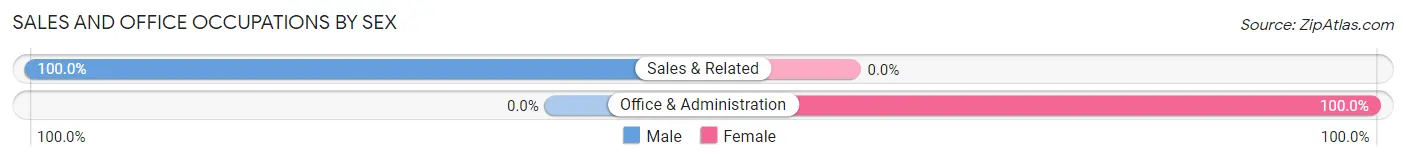
Sales and Office Occupations by Sex
| Occupation | Male | Female |
| Sales & Related | 16 (100.0%) | 0 (0.0%) |
| Office & Administration | 0 (0.0%) | 35 (100.0%) |
| Total (Category) | 16 (31.4%) | 35 (68.6%) |
| Total (Overall) | 353 (71.8%) | 139 (28.2%) |
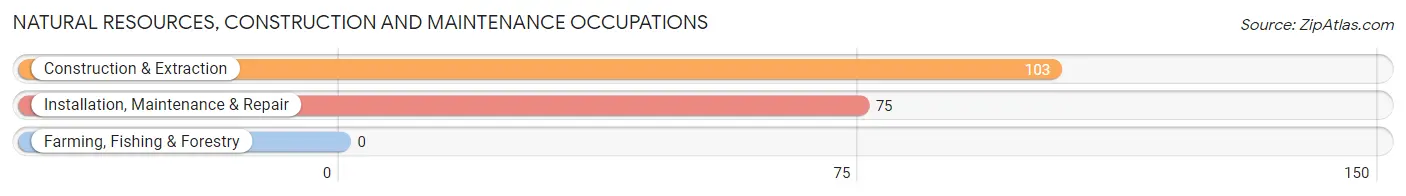
Natural Resources, Construction and Maintenance Occupations
The most common Natural Resources, Construction and Maintenance occupations in Abram are Construction & Extraction (103 | 20.9%), and Installation, Maintenance & Repair (75 | 15.2%).
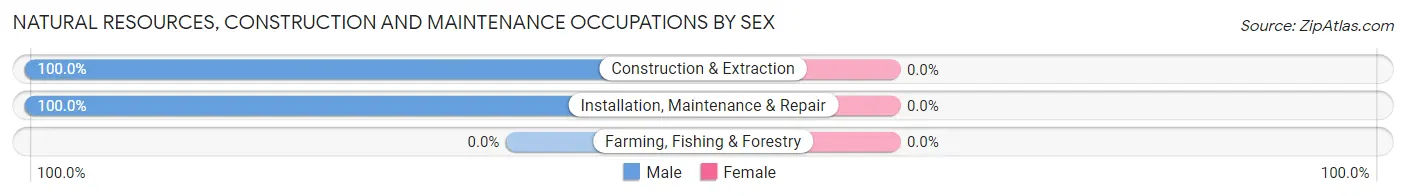
Natural Resources, Construction and Maintenance Occupations by Sex
| Occupation | Male | Female |
| Farming, Fishing & Forestry | 0 (0.0%) | 0 (0.0%) |
| Construction & Extraction | 103 (100.0%) | 0 (0.0%) |
| Installation, Maintenance & Repair | 75 (100.0%) | 0 (0.0%) |
| Total (Category) | 178 (100.0%) | 0 (0.0%) |
| Total (Overall) | 353 (71.8%) | 139 (28.2%) |
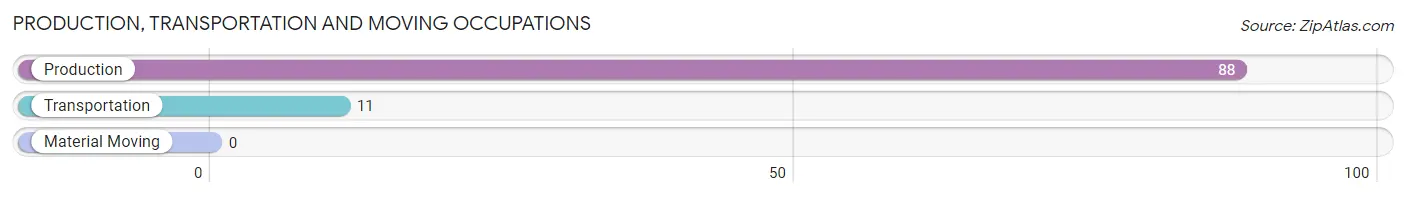
Production, Transportation and Moving Occupations
The most common Production, Transportation and Moving occupations in Abram are Production (88 | 17.9%), and Transportation (11 | 2.2%).
Production, Transportation and Moving Occupations by Sex
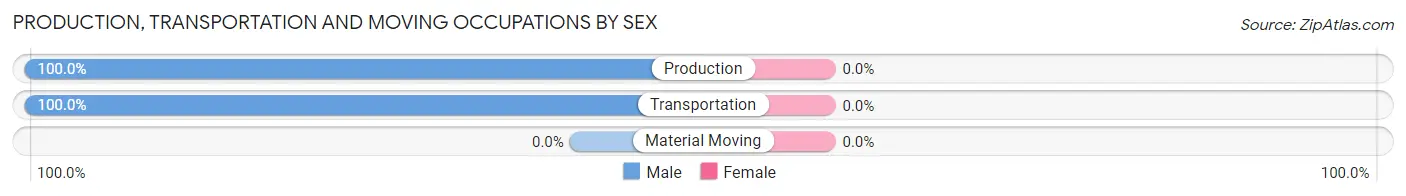
| Occupation | Male | Female |
| Production | 88 (100.0%) | 0 (0.0%) |
| Transportation | 11 (100.0%) | 0 (0.0%) |
| Material Moving | 0 (0.0%) | 0 (0.0%) |
| Total (Category) | 99 (100.0%) | 0 (0.0%) |
| Total (Overall) | 353 (71.8%) | 139 (28.2%) |
Employment Industries by Sex in Abram
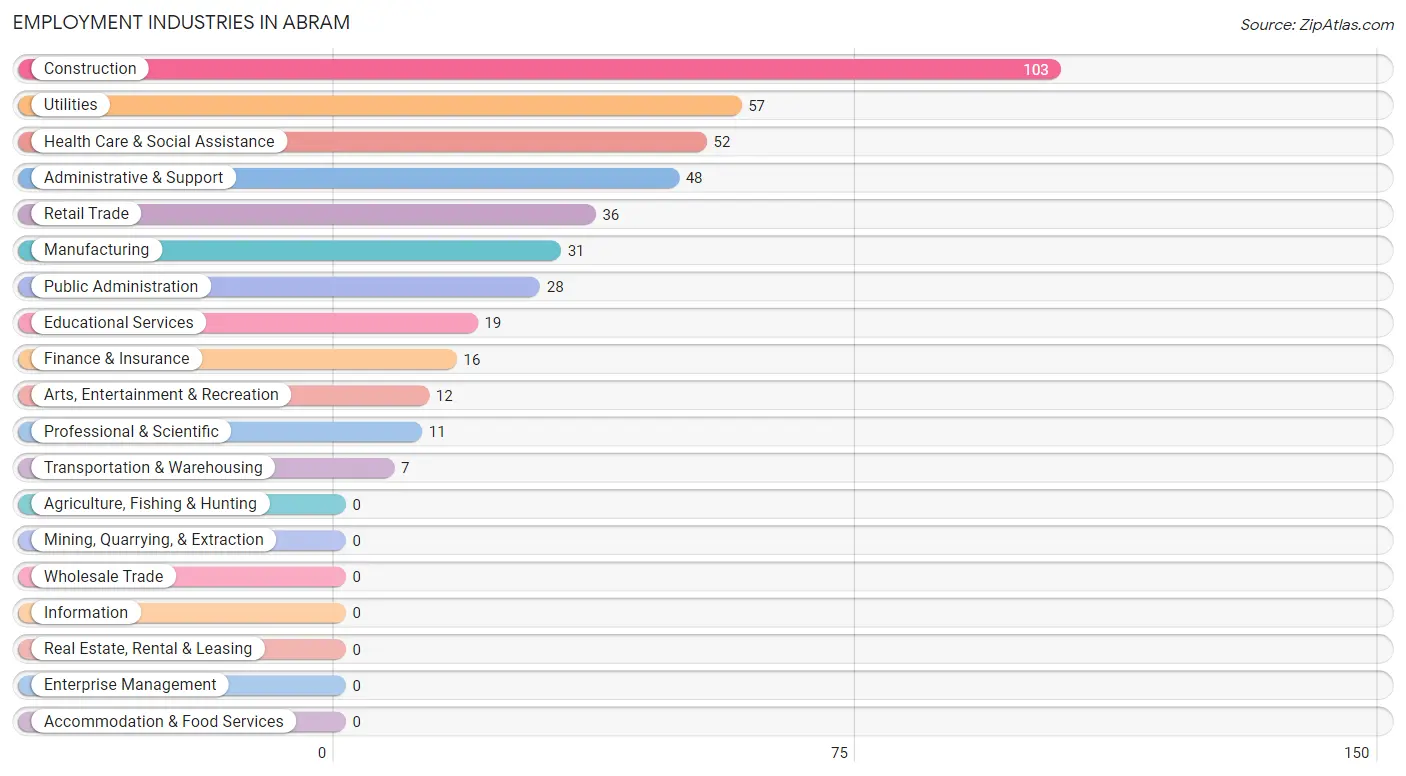
Employment Industries in Abram
The major employment industries in Abram include Construction (103 | 20.9%), Utilities (57 | 11.6%), Health Care & Social Assistance (52 | 10.6%), Administrative & Support (48 | 9.8%), and Retail Trade (36 | 7.3%).
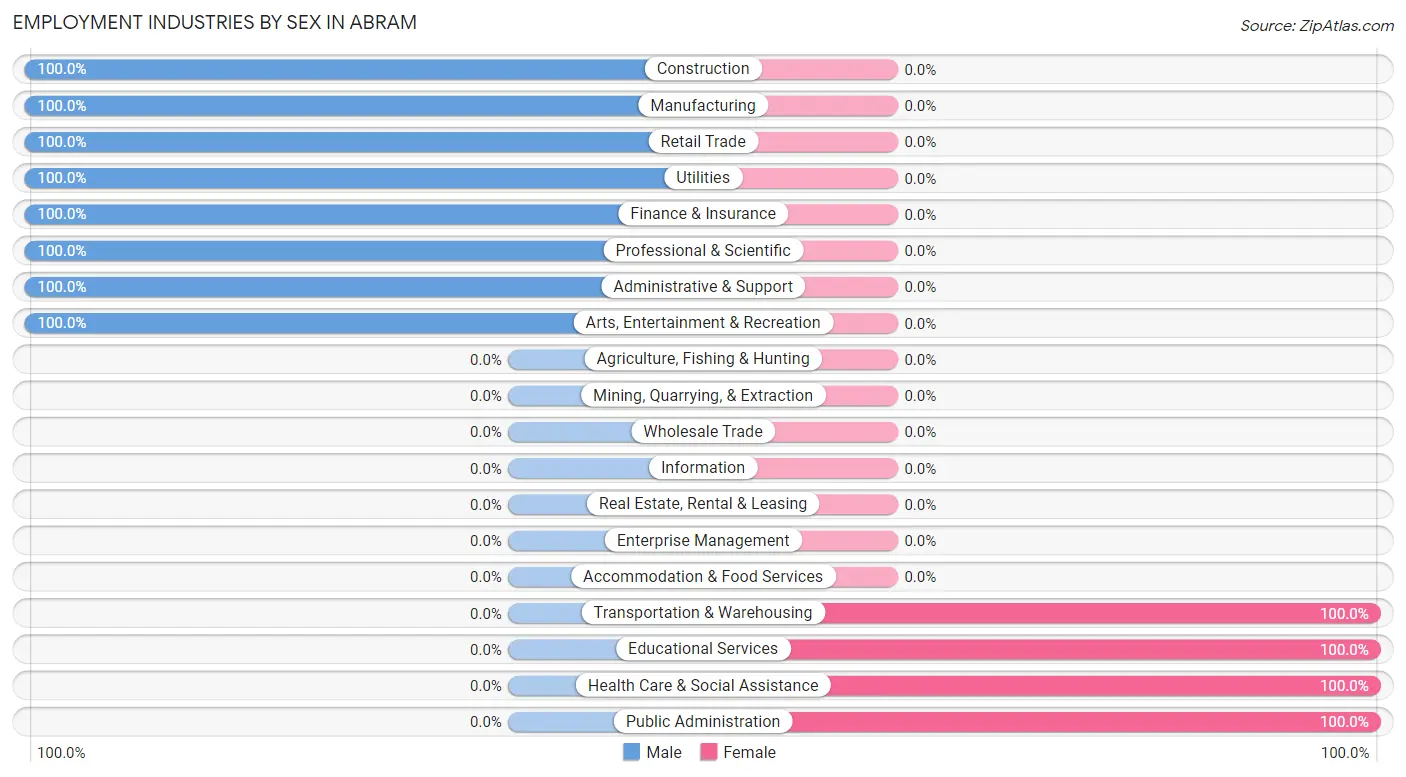
Employment Industries by Sex in Abram
The Abram industries that see more men than women are Construction (100.0%), Manufacturing (100.0%), and Retail Trade (100.0%), whereas the industries that tend to have a higher number of women are Transportation & Warehousing (100.0%), Educational Services (100.0%), and Health Care & Social Assistance (100.0%).
| Industry | Male | Female |
| Agriculture, Fishing & Hunting | 0 (0.0%) | 0 (0.0%) |
| Mining, Quarrying, & Extraction | 0 (0.0%) | 0 (0.0%) |
| Construction | 103 (100.0%) | 0 (0.0%) |
| Manufacturing | 31 (100.0%) | 0 (0.0%) |
| Wholesale Trade | 0 (0.0%) | 0 (0.0%) |
| Retail Trade | 36 (100.0%) | 0 (0.0%) |
| Transportation & Warehousing | 0 (0.0%) | 7 (100.0%) |
| Utilities | 57 (100.0%) | 0 (0.0%) |
| Information | 0 (0.0%) | 0 (0.0%) |
| Finance & Insurance | 16 (100.0%) | 0 (0.0%) |
| Real Estate, Rental & Leasing | 0 (0.0%) | 0 (0.0%) |
| Professional & Scientific | 11 (100.0%) | 0 (0.0%) |
| Enterprise Management | 0 (0.0%) | 0 (0.0%) |
| Administrative & Support | 48 (100.0%) | 0 (0.0%) |
| Educational Services | 0 (0.0%) | 19 (100.0%) |
| Health Care & Social Assistance | 0 (0.0%) | 52 (100.0%) |
| Arts, Entertainment & Recreation | 12 (100.0%) | 0 (0.0%) |
| Accommodation & Food Services | 0 (0.0%) | 0 (0.0%) |
| Public Administration | 0 (0.0%) | 28 (100.0%) |
| Total | 353 (71.8%) | 139 (28.2%) |
Education in Abram
School Enrollment in Abram
The most common levels of schooling among the 519 students in Abram are elementary school (184 | 35.4%), high school (177 | 34.1%), and middle school (75 | 14.4%).
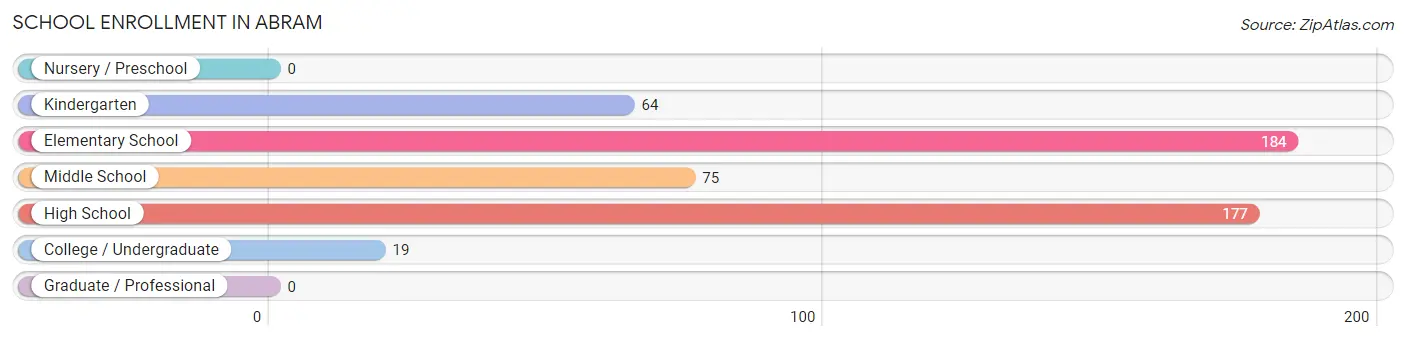
| School Level | # Students | % Students |
| Nursery / Preschool | 0 | 0.0% |
| Kindergarten | 64 | 12.3% |
| Elementary School | 184 | 35.4% |
| Middle School | 75 | 14.4% |
| High School | 177 | 34.1% |
| College / Undergraduate | 19 | 3.7% |
| Graduate / Professional | 0 | 0.0% |
| Total | 519 | 100.0% |
School Enrollment by Age by Funding Source in Abram
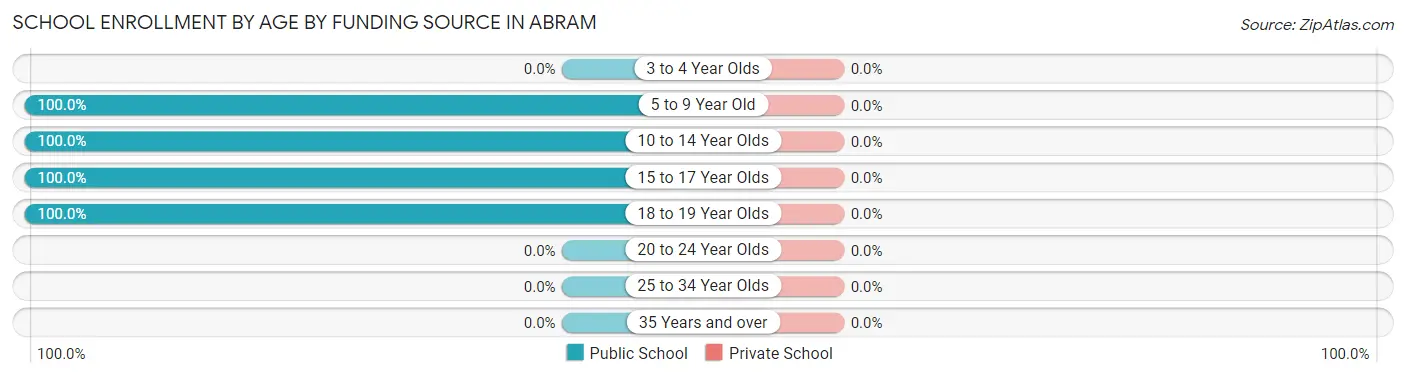
| Age Bracket | Public School | Private School |
| 3 to 4 Year Olds | 0 (0.0%) | 0 (0.0%) |
| 5 to 9 Year Old | 248 (100.0%) | 0 (0.0%) |
| 10 to 14 Year Olds | 108 (100.0%) | 0 (0.0%) |
| 15 to 17 Year Olds | 144 (100.0%) | 0 (0.0%) |
| 18 to 19 Year Olds | 19 (100.0%) | 0 (0.0%) |
| 20 to 24 Year Olds | 0 (0.0%) | 0 (0.0%) |
| 25 to 34 Year Olds | 0 (0.0%) | 0 (0.0%) |
| 35 Years and over | 0 (0.0%) | 0 (0.0%) |
| Total | 519 (100.0%) | 0 (0.0%) |
Educational Attainment by Field of Study in Abram
Business (41 | 71.9%), and computers & mathematics (16 | 28.1%) are the most common fields of study among 57 individuals in Abram who have obtained a bachelor's degree or higher.
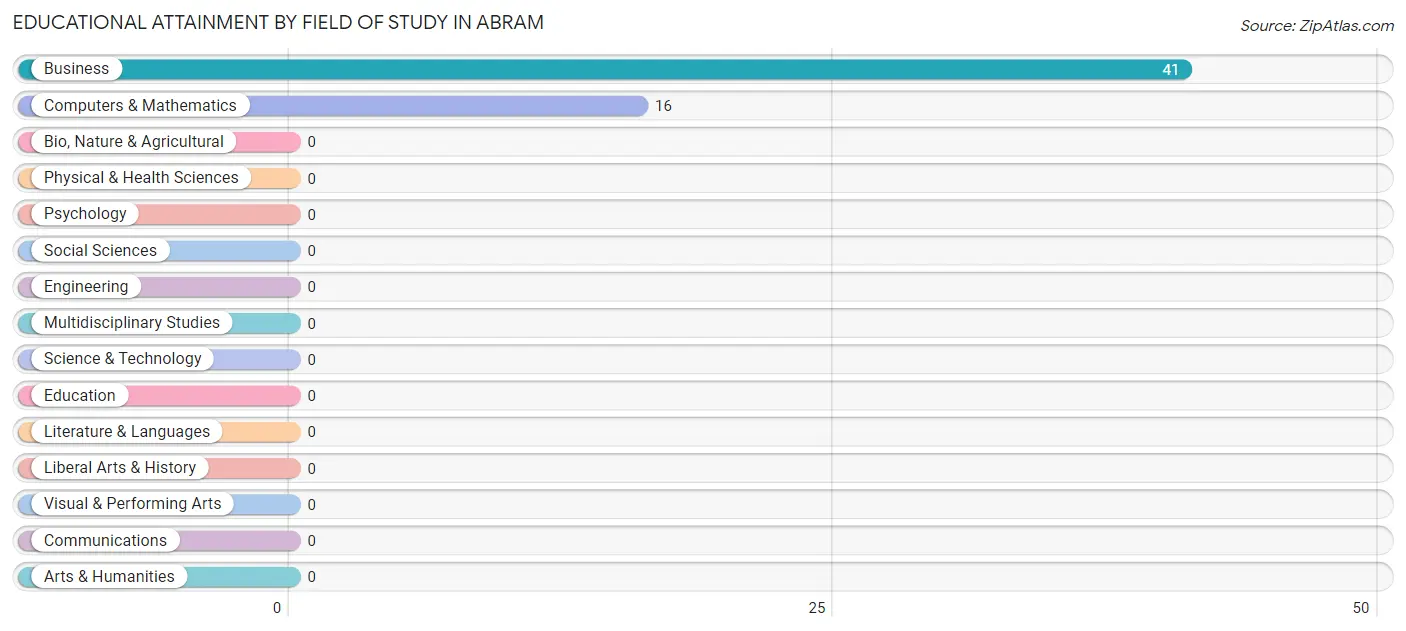
| Field of Study | # Graduates | % Graduates |
| Computers & Mathematics | 16 | 28.1% |
| Bio, Nature & Agricultural | 0 | 0.0% |
| Physical & Health Sciences | 0 | 0.0% |
| Psychology | 0 | 0.0% |
| Social Sciences | 0 | 0.0% |
| Engineering | 0 | 0.0% |
| Multidisciplinary Studies | 0 | 0.0% |
| Science & Technology | 0 | 0.0% |
| Business | 41 | 71.9% |
| Education | 0 | 0.0% |
| Literature & Languages | 0 | 0.0% |
| Liberal Arts & History | 0 | 0.0% |
| Visual & Performing Arts | 0 | 0.0% |
| Communications | 0 | 0.0% |
| Arts & Humanities | 0 | 0.0% |
| Total | 57 | 100.0% |
Transportation & Commute in Abram
Vehicle Availability by Sex in Abram
The most prevalent vehicle ownership categories in Abram are males with 2 vehicles (125, accounting for 35.4%) and females with 2 vehicles (6, making up 89.9%).
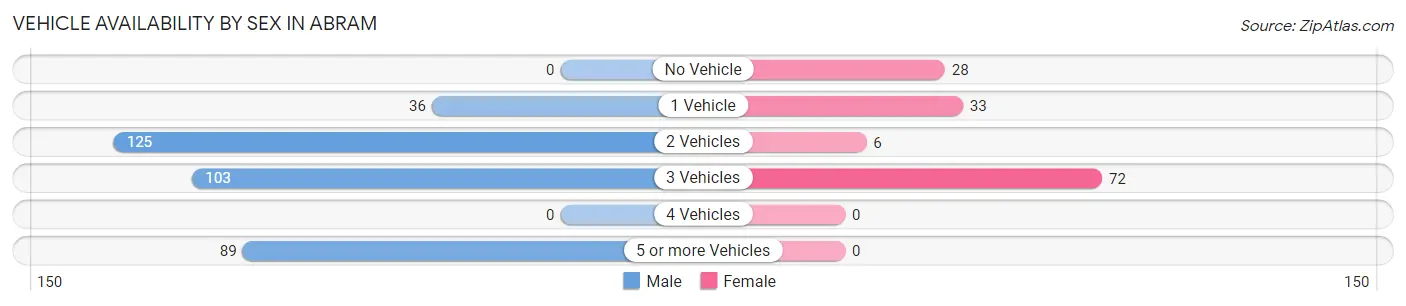
| Vehicles Available | Male | Female |
| No Vehicle | 0 (0.0%) | 28 (20.1%) |
| 1 Vehicle | 36 (10.2%) | 33 (23.7%) |
| 2 Vehicles | 125 (35.4%) | 6 (4.3%) |
| 3 Vehicles | 103 (29.2%) | 72 (51.8%) |
| 4 Vehicles | 0 (0.0%) | 0 (0.0%) |
| 5 or more Vehicles | 89 (25.2%) | 0 (0.0%) |
| Total | 353 (100.0%) | 139 (100.0%) |
Commute Time in Abram
The most frequently occuring commute durations in Abram are 15 to 19 minutes (227 commuters, 49.8%), 30 to 34 minutes (118 commuters, 25.9%), and 10 to 14 minutes (72 commuters, 15.8%).
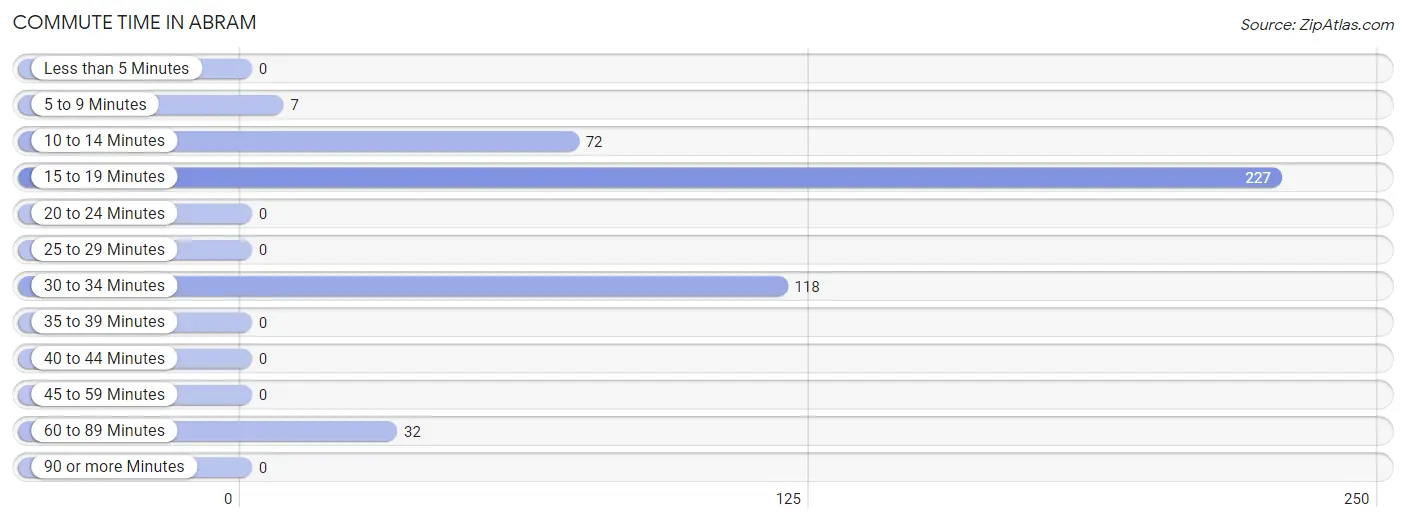
| Commute Time | # Commuters | % Commuters |
| Less than 5 Minutes | 0 | 0.0% |
| 5 to 9 Minutes | 7 | 1.5% |
| 10 to 14 Minutes | 72 | 15.8% |
| 15 to 19 Minutes | 227 | 49.8% |
| 20 to 24 Minutes | 0 | 0.0% |
| 25 to 29 Minutes | 0 | 0.0% |
| 30 to 34 Minutes | 118 | 25.9% |
| 35 to 39 Minutes | 0 | 0.0% |
| 40 to 44 Minutes | 0 | 0.0% |
| 45 to 59 Minutes | 0 | 0.0% |
| 60 to 89 Minutes | 32 | 7.0% |
| 90 or more Minutes | 0 | 0.0% |
Commute Time by Sex in Abram
The most common commute times in Abram are 15 to 19 minutes (186 commuters, 58.7%) for males and 10 to 14 minutes (72 commuters, 51.8%) for females.
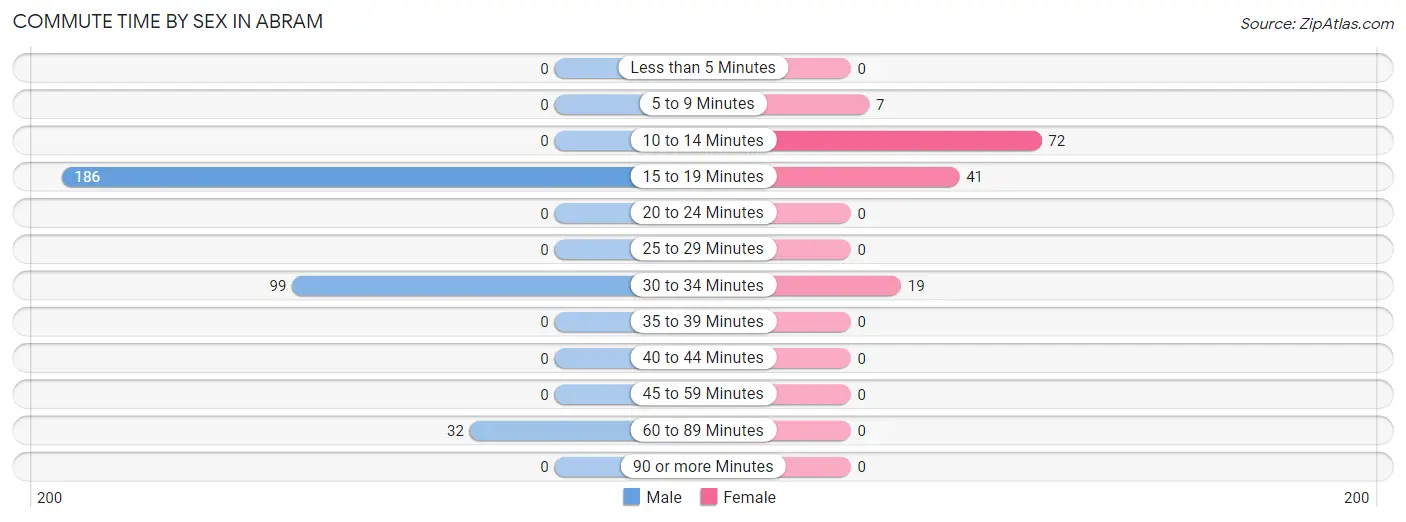
| Commute Time | Male | Female |
| Less than 5 Minutes | 0 (0.0%) | 0 (0.0%) |
| 5 to 9 Minutes | 0 (0.0%) | 7 (5.0%) |
| 10 to 14 Minutes | 0 (0.0%) | 72 (51.8%) |
| 15 to 19 Minutes | 186 (58.7%) | 41 (29.5%) |
| 20 to 24 Minutes | 0 (0.0%) | 0 (0.0%) |
| 25 to 29 Minutes | 0 (0.0%) | 0 (0.0%) |
| 30 to 34 Minutes | 99 (31.2%) | 19 (13.7%) |
| 35 to 39 Minutes | 0 (0.0%) | 0 (0.0%) |
| 40 to 44 Minutes | 0 (0.0%) | 0 (0.0%) |
| 45 to 59 Minutes | 0 (0.0%) | 0 (0.0%) |
| 60 to 89 Minutes | 32 (10.1%) | 0 (0.0%) |
| 90 or more Minutes | 0 (0.0%) | 0 (0.0%) |
Time of Departure to Work by Sex in Abram
The most frequent times of departure to work in Abram are 8:00 AM to 8:29 AM (96, 30.3%) for males and 12:00 PM to 3:59 PM (39, 28.1%) for females.
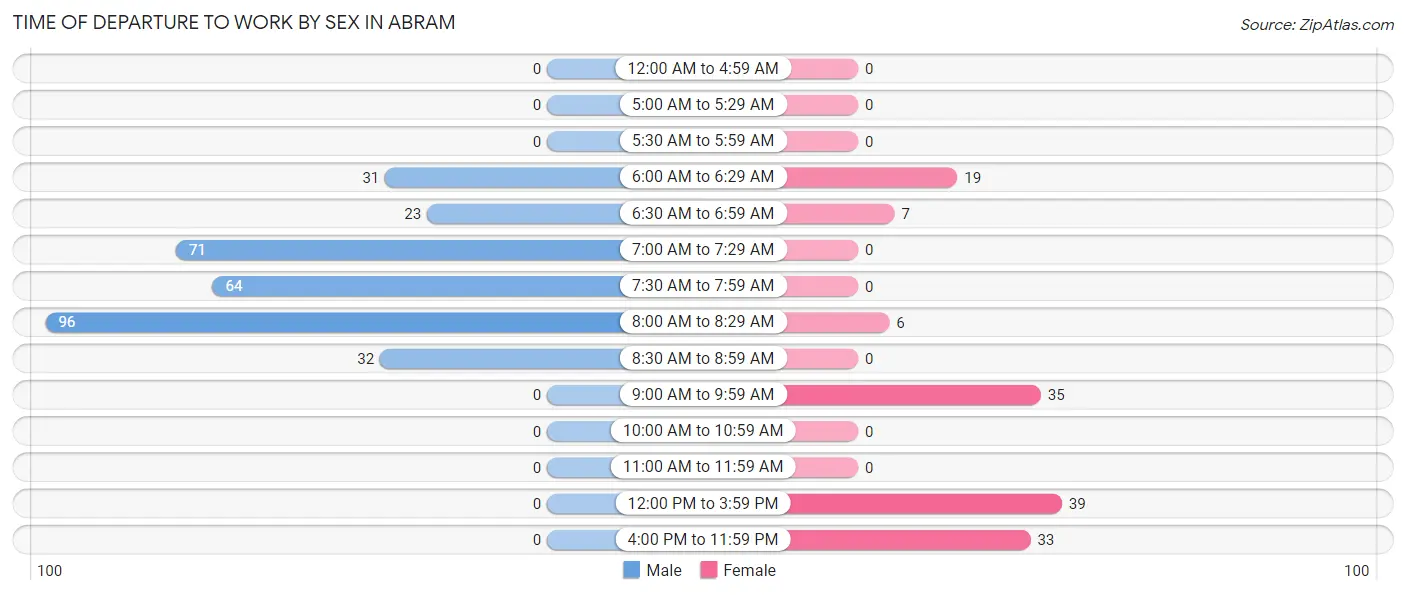
| Time of Departure | Male | Female |
| 12:00 AM to 4:59 AM | 0 (0.0%) | 0 (0.0%) |
| 5:00 AM to 5:29 AM | 0 (0.0%) | 0 (0.0%) |
| 5:30 AM to 5:59 AM | 0 (0.0%) | 0 (0.0%) |
| 6:00 AM to 6:29 AM | 31 (9.8%) | 19 (13.7%) |
| 6:30 AM to 6:59 AM | 23 (7.3%) | 7 (5.0%) |
| 7:00 AM to 7:29 AM | 71 (22.4%) | 0 (0.0%) |
| 7:30 AM to 7:59 AM | 64 (20.2%) | 0 (0.0%) |
| 8:00 AM to 8:29 AM | 96 (30.3%) | 6 (4.3%) |
| 8:30 AM to 8:59 AM | 32 (10.1%) | 0 (0.0%) |
| 9:00 AM to 9:59 AM | 0 (0.0%) | 35 (25.2%) |
| 10:00 AM to 10:59 AM | 0 (0.0%) | 0 (0.0%) |
| 11:00 AM to 11:59 AM | 0 (0.0%) | 0 (0.0%) |
| 12:00 PM to 3:59 PM | 0 (0.0%) | 39 (28.1%) |
| 4:00 PM to 11:59 PM | 0 (0.0%) | 33 (23.7%) |
| Total | 317 (100.0%) | 139 (100.0%) |
Housing Occupancy in Abram
Occupancy by Ownership in Abram
Of the total 483 dwellings in Abram, owner-occupied units account for 452 (93.6%), while renter-occupied units make up 31 (6.4%).
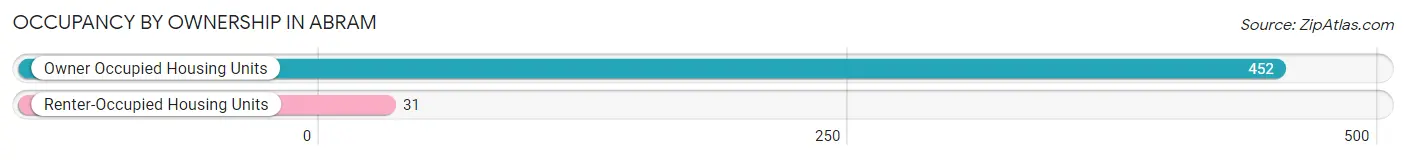
| Occupancy | # Housing Units | % Housing Units |
| Owner Occupied Housing Units | 452 | 93.6% |
| Renter-Occupied Housing Units | 31 | 6.4% |
| Total Occupied Housing Units | 483 | 100.0% |
Occupancy by Household Size in Abram
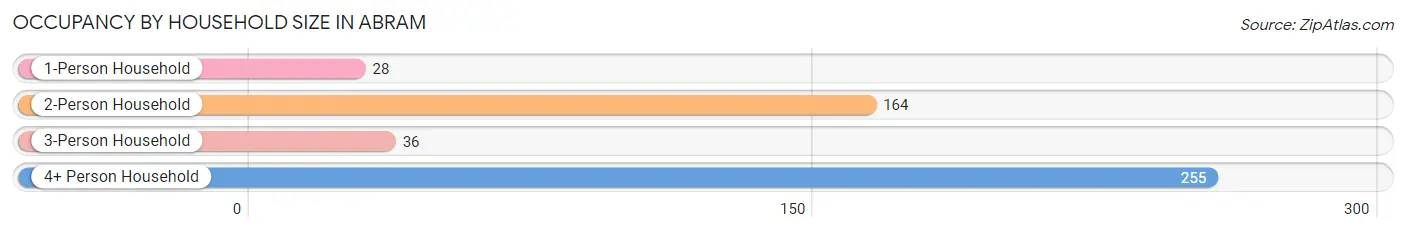
| Household Size | # Housing Units | % Housing Units |
| 1-Person Household | 28 | 5.8% |
| 2-Person Household | 164 | 34.0% |
| 3-Person Household | 36 | 7.4% |
| 4+ Person Household | 255 | 52.8% |
| Total Housing Units | 483 | 100.0% |
Occupancy by Ownership by Household Size in Abram
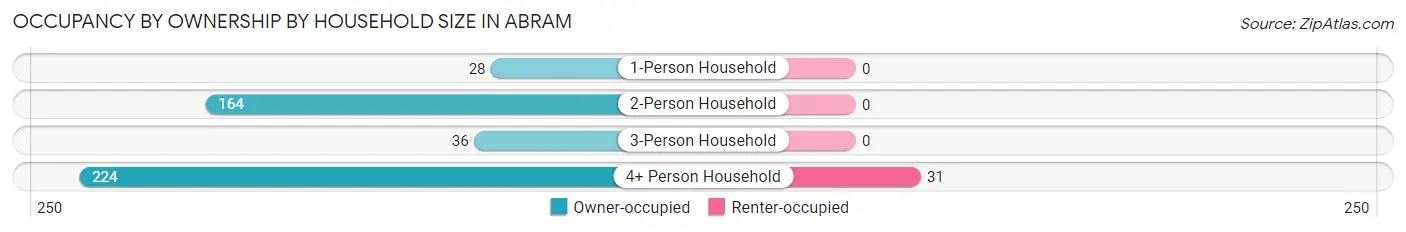
| Household Size | Owner-occupied | Renter-occupied |
| 1-Person Household | 28 (100.0%) | 0 (0.0%) |
| 2-Person Household | 164 (100.0%) | 0 (0.0%) |
| 3-Person Household | 36 (100.0%) | 0 (0.0%) |
| 4+ Person Household | 224 (87.8%) | 31 (12.2%) |
| Total Housing Units | 452 (93.6%) | 31 (6.4%) |
Occupancy by Educational Attainment in Abram
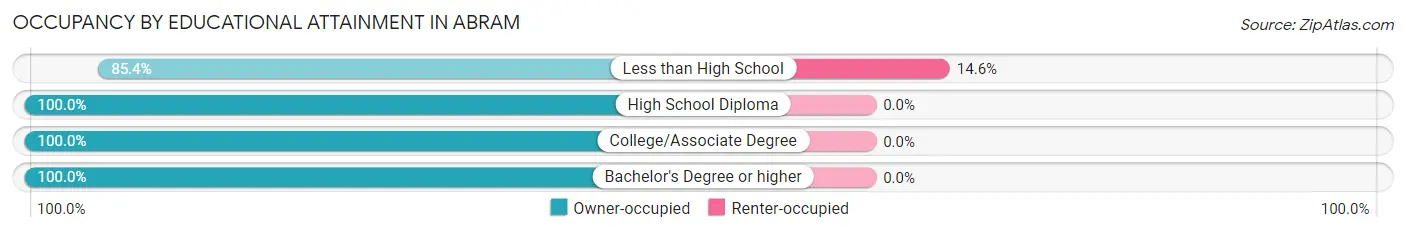
| Household Size | Owner-occupied | Renter-occupied |
| Less than High School | 181 (85.4%) | 31 (14.6%) |
| High School Diploma | 211 (100.0%) | 0 (0.0%) |
| College/Associate Degree | 35 (100.0%) | 0 (0.0%) |
| Bachelor's Degree or higher | 25 (100.0%) | 0 (0.0%) |
Occupancy by Age of Householder in Abram
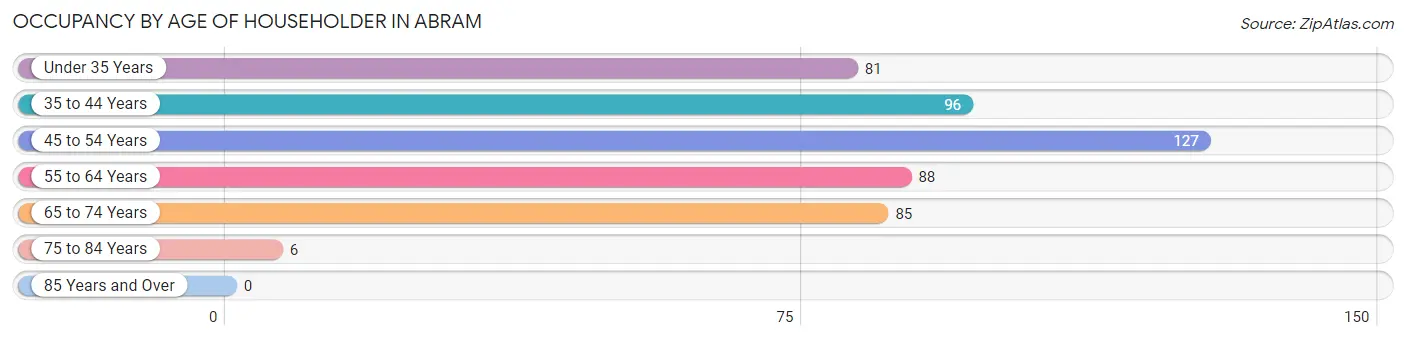
| Age Bracket | # Households | % Households |
| Under 35 Years | 81 | 16.8% |
| 35 to 44 Years | 96 | 19.9% |
| 45 to 54 Years | 127 | 26.3% |
| 55 to 64 Years | 88 | 18.2% |
| 65 to 74 Years | 85 | 17.6% |
| 75 to 84 Years | 6 | 1.2% |
| 85 Years and Over | 0 | 0.0% |
| Total | 483 | 100.0% |
Housing Finances in Abram
Median Income by Occupancy in Abram
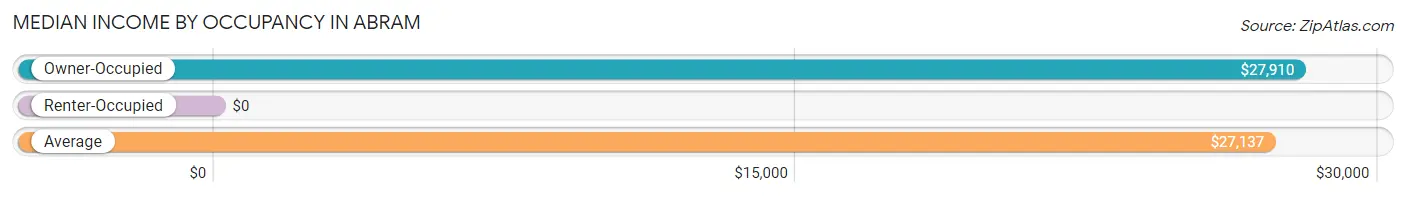
| Occupancy Type | # Households | Median Income |
| Owner-Occupied | 452 (93.6%) | $27,910 |
| Renter-Occupied | 31 (6.4%) | $0 |
| Average | 483 (100.0%) | $27,137 |
Occupancy by Householder Income Bracket in Abram
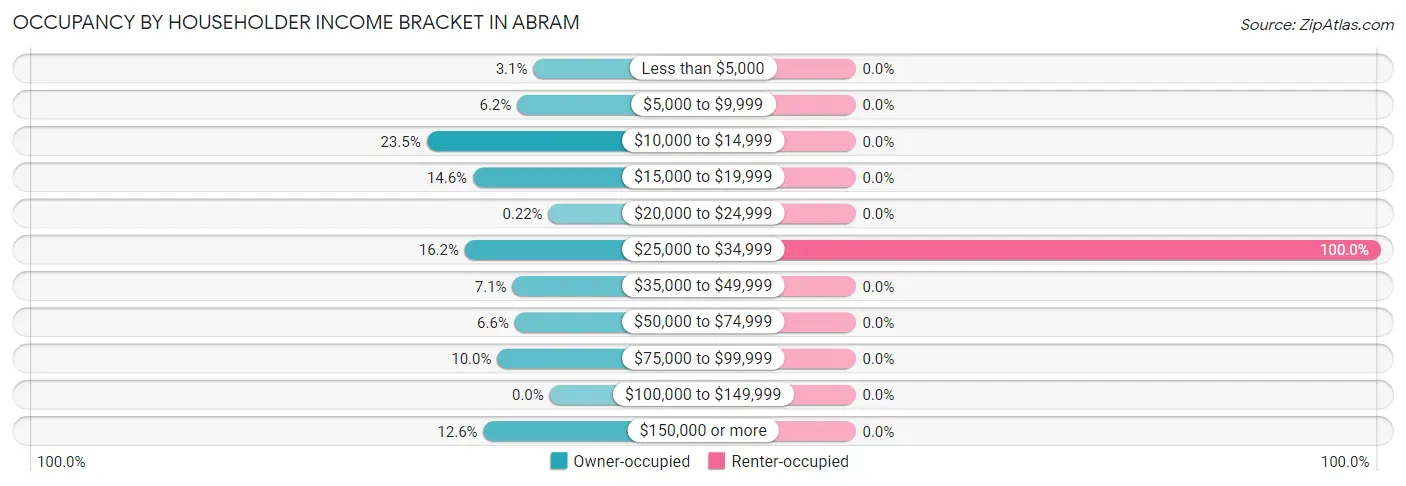
| Income Bracket | Owner-occupied | Renter-occupied |
| Less than $5,000 | 14 (3.1%) | 0 (0.0%) |
| $5,000 to $9,999 | 28 (6.2%) | 0 (0.0%) |
| $10,000 to $14,999 | 106 (23.4%) | 0 (0.0%) |
| $15,000 to $19,999 | 66 (14.6%) | 0 (0.0%) |
| $20,000 to $24,999 | 1 (0.2%) | 0 (0.0%) |
| $25,000 to $34,999 | 73 (16.2%) | 31 (100.0%) |
| $35,000 to $49,999 | 32 (7.1%) | 0 (0.0%) |
| $50,000 to $74,999 | 30 (6.6%) | 0 (0.0%) |
| $75,000 to $99,999 | 45 (10.0%) | 0 (0.0%) |
| $100,000 to $149,999 | 0 (0.0%) | 0 (0.0%) |
| $150,000 or more | 57 (12.6%) | 0 (0.0%) |
| Total | 452 (100.0%) | 31 (100.0%) |
Monthly Housing Cost Tiers in Abram
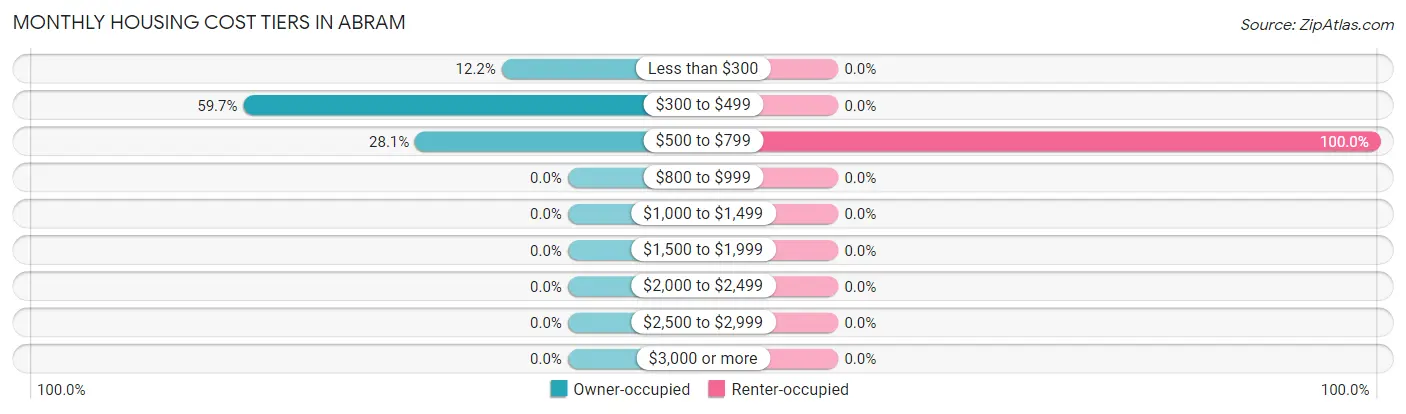
| Monthly Cost | Owner-occupied | Renter-occupied |
| Less than $300 | 55 (12.2%) | 0 (0.0%) |
| $300 to $499 | 270 (59.7%) | 0 (0.0%) |
| $500 to $799 | 127 (28.1%) | 31 (100.0%) |
| $800 to $999 | 0 (0.0%) | 0 (0.0%) |
| $1,000 to $1,499 | 0 (0.0%) | 0 (0.0%) |
| $1,500 to $1,999 | 0 (0.0%) | 0 (0.0%) |
| $2,000 to $2,499 | 0 (0.0%) | 0 (0.0%) |
| $2,500 to $2,999 | 0 (0.0%) | 0 (0.0%) |
| $3,000 or more | 0 (0.0%) | 0 (0.0%) |
| Total | 452 (100.0%) | 31 (100.0%) |
Physical Housing Characteristics in Abram
Housing Structures in Abram
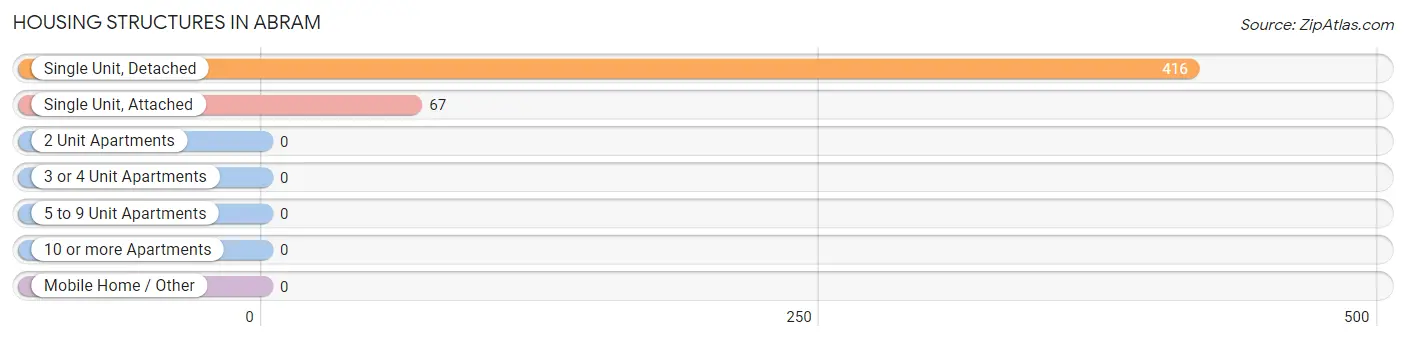
| Structure Type | # Housing Units | % Housing Units |
| Single Unit, Detached | 416 | 86.1% |
| Single Unit, Attached | 67 | 13.9% |
| 2 Unit Apartments | 0 | 0.0% |
| 3 or 4 Unit Apartments | 0 | 0.0% |
| 5 to 9 Unit Apartments | 0 | 0.0% |
| 10 or more Apartments | 0 | 0.0% |
| Mobile Home / Other | 0 | 0.0% |
| Total | 483 | 100.0% |
Housing Structures by Occupancy in Abram
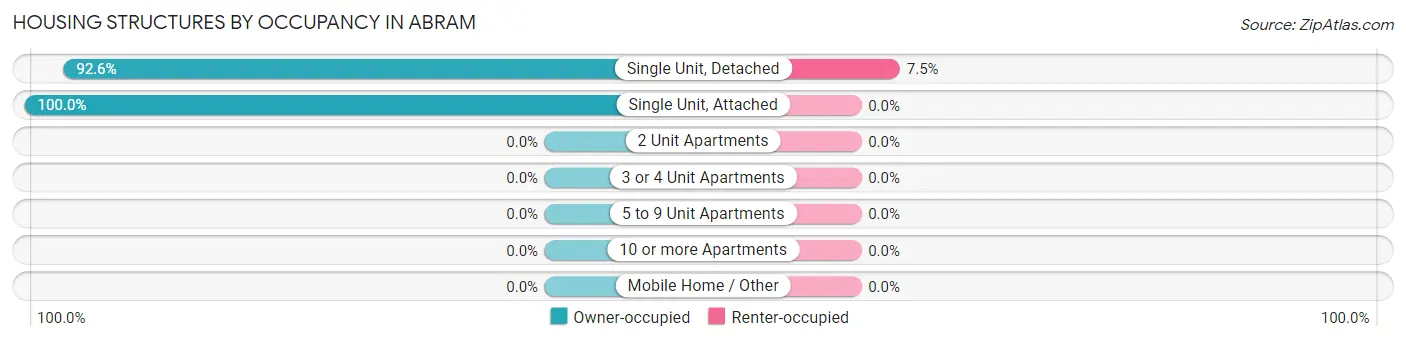
| Structure Type | Owner-occupied | Renter-occupied |
| Single Unit, Detached | 385 (92.5%) | 31 (7.4%) |
| Single Unit, Attached | 67 (100.0%) | 0 (0.0%) |
| 2 Unit Apartments | 0 (0.0%) | 0 (0.0%) |
| 3 or 4 Unit Apartments | 0 (0.0%) | 0 (0.0%) |
| 5 to 9 Unit Apartments | 0 (0.0%) | 0 (0.0%) |
| 10 or more Apartments | 0 (0.0%) | 0 (0.0%) |
| Mobile Home / Other | 0 (0.0%) | 0 (0.0%) |
| Total | 452 (93.6%) | 31 (6.4%) |
Housing Structures by Number of Rooms in Abram
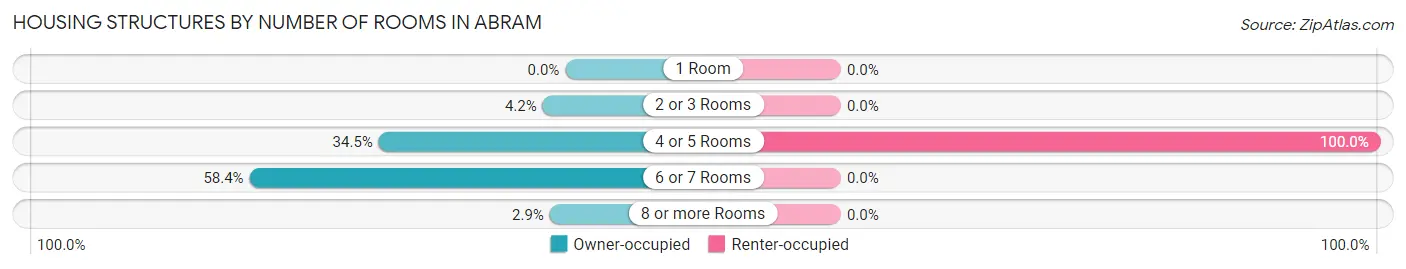
| Number of Rooms | Owner-occupied | Renter-occupied |
| 1 Room | 0 (0.0%) | 0 (0.0%) |
| 2 or 3 Rooms | 19 (4.2%) | 0 (0.0%) |
| 4 or 5 Rooms | 156 (34.5%) | 31 (100.0%) |
| 6 or 7 Rooms | 264 (58.4%) | 0 (0.0%) |
| 8 or more Rooms | 13 (2.9%) | 0 (0.0%) |
| Total | 452 (100.0%) | 31 (100.0%) |
Housing Structure by Heating Type in Abram
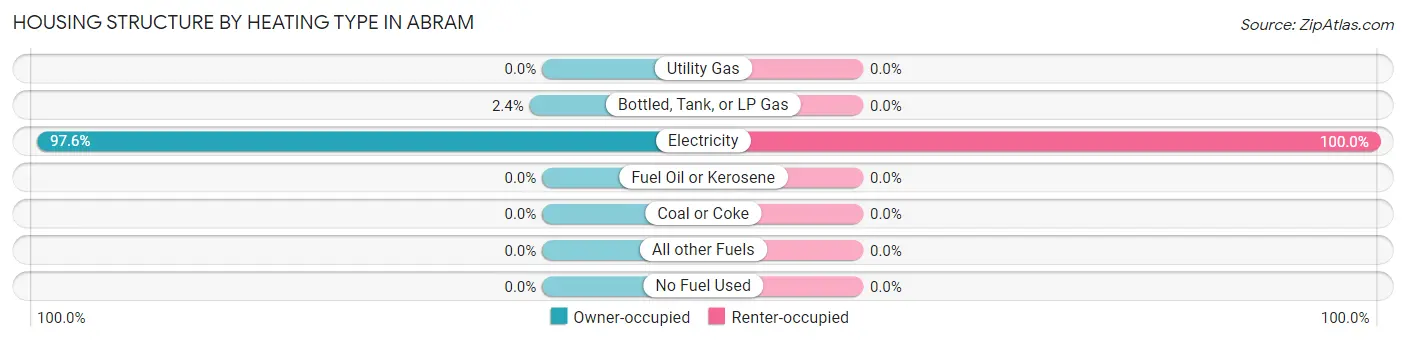
| Heating Type | Owner-occupied | Renter-occupied |
| Utility Gas | 0 (0.0%) | 0 (0.0%) |
| Bottled, Tank, or LP Gas | 11 (2.4%) | 0 (0.0%) |
| Electricity | 441 (97.6%) | 31 (100.0%) |
| Fuel Oil or Kerosene | 0 (0.0%) | 0 (0.0%) |
| Coal or Coke | 0 (0.0%) | 0 (0.0%) |
| All other Fuels | 0 (0.0%) | 0 (0.0%) |
| No Fuel Used | 0 (0.0%) | 0 (0.0%) |
| Total | 452 (100.0%) | 31 (100.0%) |
Household Vehicle Usage in Abram
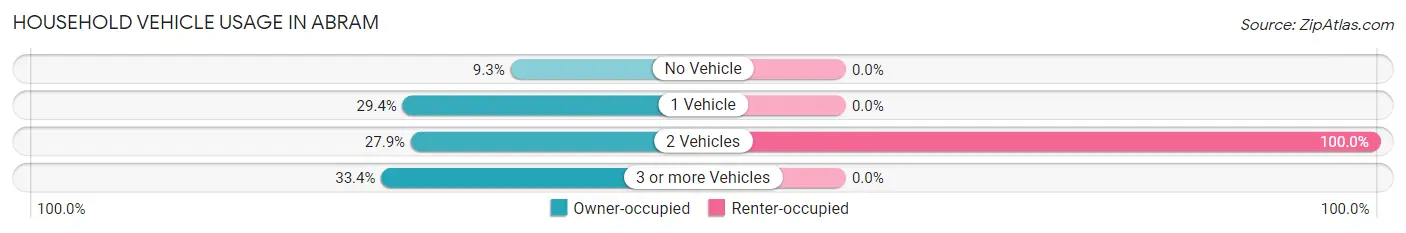
| Vehicles per Household | Owner-occupied | Renter-occupied |
| No Vehicle | 42 (9.3%) | 0 (0.0%) |
| 1 Vehicle | 133 (29.4%) | 0 (0.0%) |
| 2 Vehicles | 126 (27.9%) | 31 (100.0%) |
| 3 or more Vehicles | 151 (33.4%) | 0 (0.0%) |
| Total | 452 (100.0%) | 31 (100.0%) |
Real Estate & Mortgages in Abram
Real Estate and Mortgage Overview in Abram
| Characteristic | Without Mortgage | With Mortgage |
| Housing Units | 452 | 0 |
| Median Property Value | $85,400 | $0 |
| Median Household Income | $27,910 | $0 |
| Monthly Housing Costs | $374 | $0 |
| Real Estate Taxes | $1,315 | $0 |
Property Value by Mortgage Status in Abram
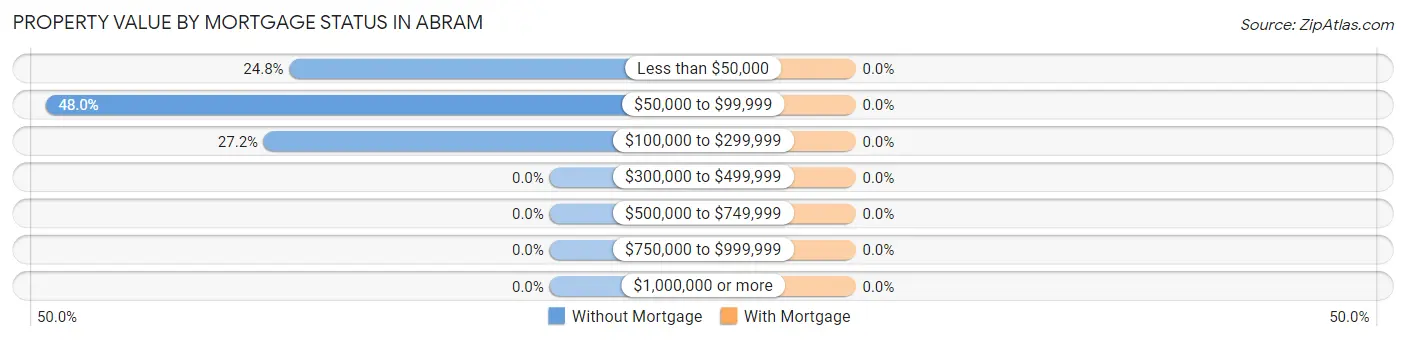
| Property Value | Without Mortgage | With Mortgage |
| Less than $50,000 | 112 (24.8%) | 0 (0.0%) |
| $50,000 to $99,999 | 217 (48.0%) | 0 (0.0%) |
| $100,000 to $299,999 | 123 (27.2%) | 0 (0.0%) |
| $300,000 to $499,999 | 0 (0.0%) | 0 (0.0%) |
| $500,000 to $749,999 | 0 (0.0%) | 0 (0.0%) |
| $750,000 to $999,999 | 0 (0.0%) | 0 (0.0%) |
| $1,000,000 or more | 0 (0.0%) | 0 (0.0%) |
| Total | 452 (100.0%) | 0 (0.0%) |
Household Income by Mortgage Status in Abram
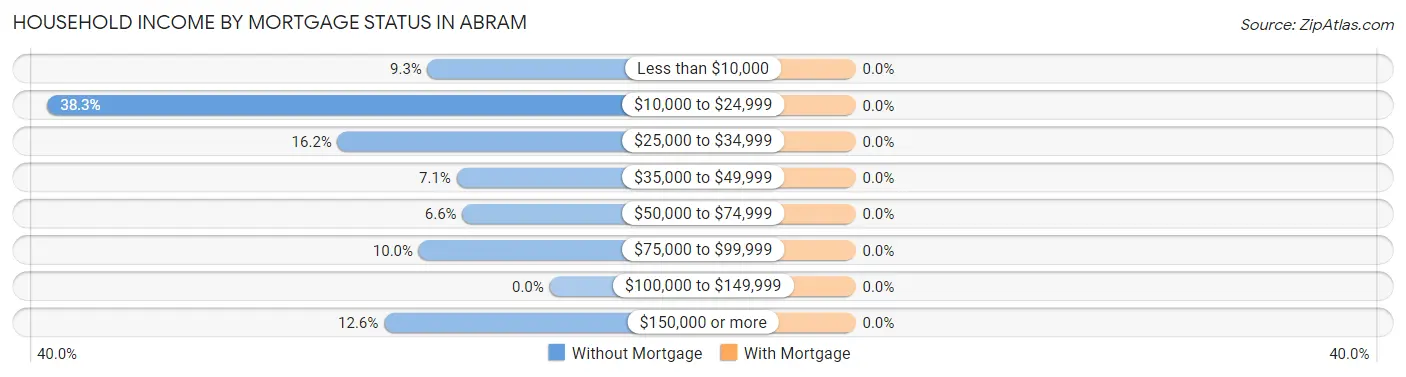
| Household Income | Without Mortgage | With Mortgage |
| Less than $10,000 | 42 (9.3%) | 0 (0.0%) |
| $10,000 to $24,999 | 173 (38.3%) | 0 (0.0%) |
| $25,000 to $34,999 | 73 (16.2%) | 0 (0.0%) |
| $35,000 to $49,999 | 32 (7.1%) | 0 (0.0%) |
| $50,000 to $74,999 | 30 (6.6%) | 0 (0.0%) |
| $75,000 to $99,999 | 45 (10.0%) | 0 (0.0%) |
| $100,000 to $149,999 | 0 (0.0%) | 0 (0.0%) |
| $150,000 or more | 57 (12.6%) | 0 (0.0%) |
| Total | 452 (100.0%) | 0 (0.0%) |
Property Value to Household Income Ratio in Abram
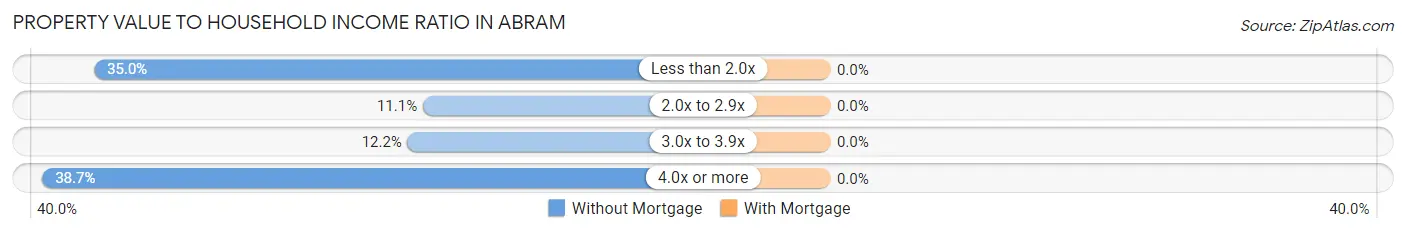
| Value-to-Income Ratio | Without Mortgage | With Mortgage |
| Less than 2.0x | 158 (35.0%) | 0 (0.0%) |
| 2.0x to 2.9x | 50 (11.1%) | 0 (0.0%) |
| 3.0x to 3.9x | 55 (12.2%) | 0 (0.0%) |
| 4.0x or more | 175 (38.7%) | 0 (0.0%) |
| Total | 452 (100.0%) | 0 (0.0%) |
Real Estate Taxes by Mortgage Status in Abram
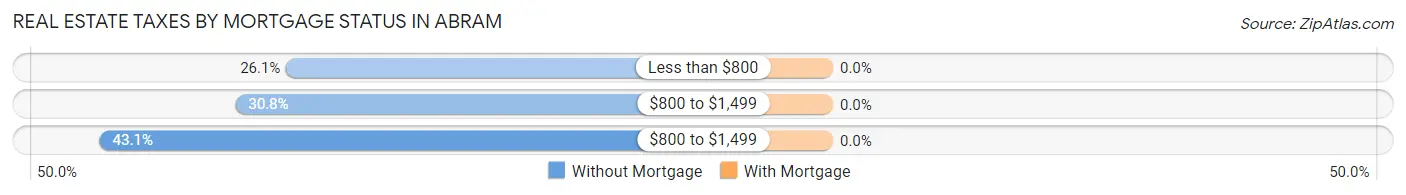
| Property Taxes | Without Mortgage | With Mortgage |
| Less than $800 | 118 (26.1%) | 0 (0.0%) |
| $800 to $1,499 | 139 (30.7%) | 0 (0.0%) |
| $800 to $1,499 | 195 (43.1%) | 0 (0.0%) |
| Total | 452 (100.0%) | 0 (0.0%) |
Health & Disability in Abram
Health Insurance Coverage by Age in Abram
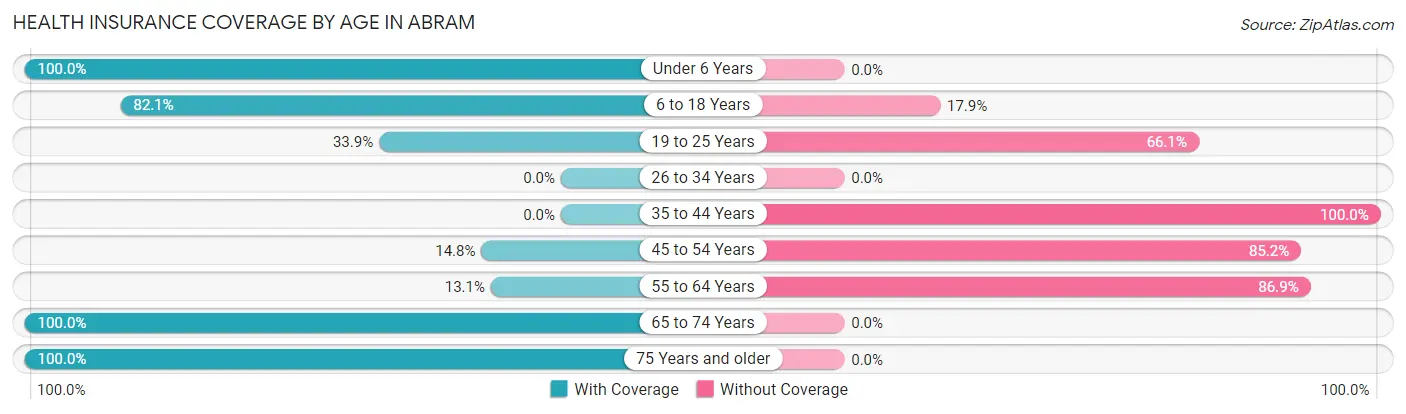
| Age Bracket | With Coverage | Without Coverage |
| Under 6 Years | 360 (100.0%) | 0 (0.0%) |
| 6 to 18 Years | 391 (82.1%) | 85 (17.9%) |
| 19 to 25 Years | 118 (33.9%) | 230 (66.1%) |
| 26 to 34 Years | 0 (0.0%) | 0 (0.0%) |
| 35 to 44 Years | 0 (0.0%) | 181 (100.0%) |
| 45 to 54 Years | 31 (14.8%) | 178 (85.2%) |
| 55 to 64 Years | 23 (13.1%) | 153 (86.9%) |
| 65 to 74 Years | 167 (100.0%) | 0 (0.0%) |
| 75 Years and older | 35 (100.0%) | 0 (0.0%) |
| Total | 1,125 (57.6%) | 827 (42.4%) |
Health Insurance Coverage by Citizenship Status in Abram
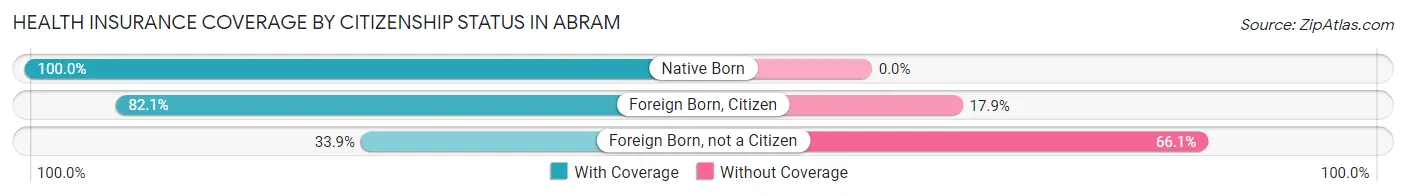
| Citizenship Status | With Coverage | Without Coverage |
| Native Born | 360 (100.0%) | 0 (0.0%) |
| Foreign Born, Citizen | 391 (82.1%) | 85 (17.9%) |
| Foreign Born, not a Citizen | 118 (33.9%) | 230 (66.1%) |
Health Insurance Coverage by Household Income in Abram
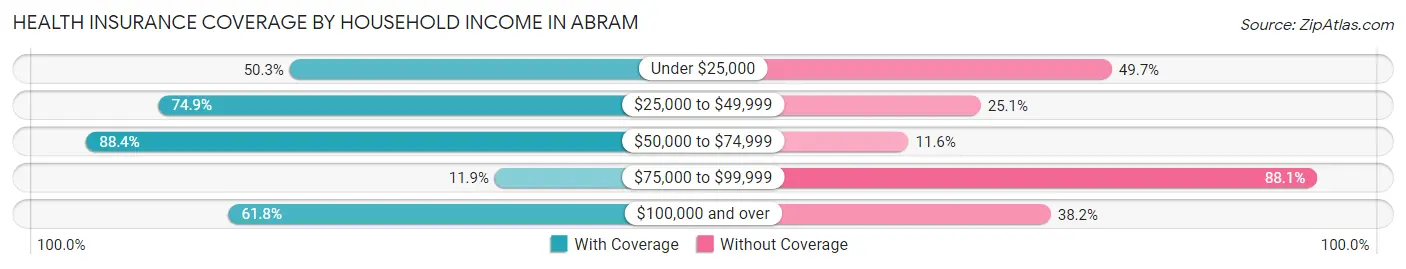
| Household Income | With Coverage | Without Coverage |
| Under $25,000 | 385 (50.3%) | 380 (49.7%) |
| $25,000 to $49,999 | 492 (74.9%) | 165 (25.1%) |
| $50,000 to $74,999 | 84 (88.4%) | 11 (11.6%) |
| $75,000 to $99,999 | 25 (11.9%) | 185 (88.1%) |
| $100,000 and over | 139 (61.8%) | 86 (38.2%) |
Public vs Private Health Insurance Coverage by Age in Abram
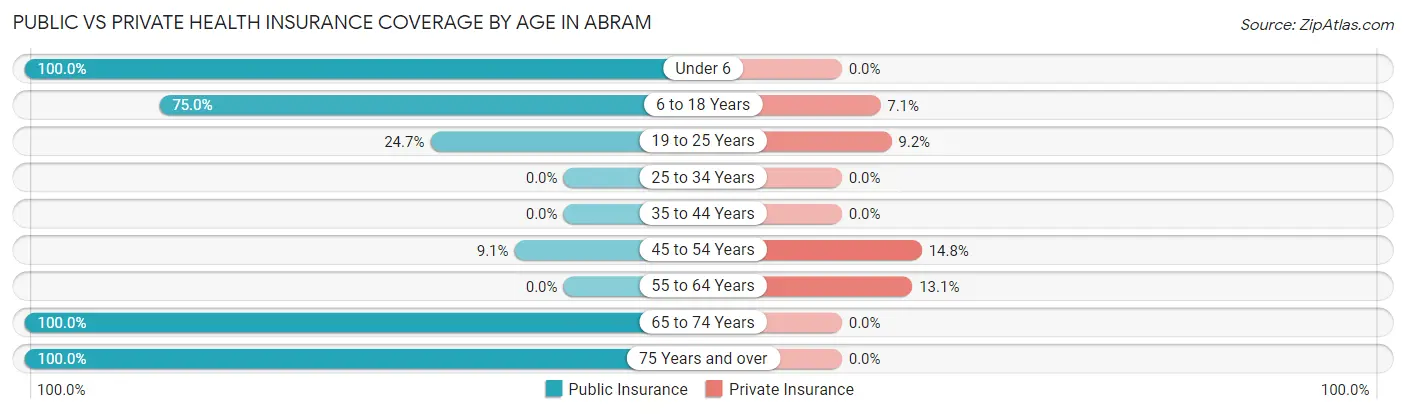
| Age Bracket | Public Insurance | Private Insurance |
| Under 6 | 360 (100.0%) | 0 (0.0%) |
| 6 to 18 Years | 357 (75.0%) | 34 (7.1%) |
| 19 to 25 Years | 86 (24.7%) | 32 (9.2%) |
| 25 to 34 Years | 0 (0.0%) | 0 (0.0%) |
| 35 to 44 Years | 0 (0.0%) | 0 (0.0%) |
| 45 to 54 Years | 19 (9.1%) | 31 (14.8%) |
| 55 to 64 Years | 0 (0.0%) | 23 (13.1%) |
| 65 to 74 Years | 167 (100.0%) | 0 (0.0%) |
| 75 Years and over | 35 (100.0%) | 0 (0.0%) |
| Total | 1,024 (52.5%) | 120 (6.1%) |
Disability Status by Sex by Age in Abram
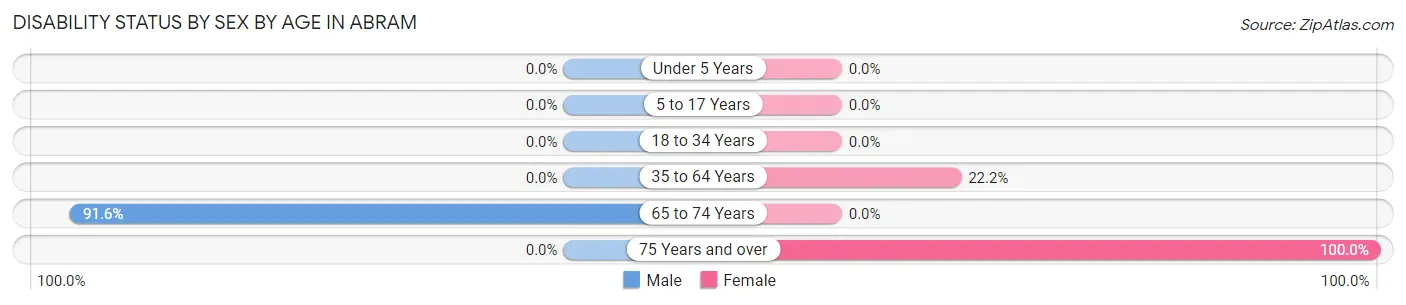
| Age Bracket | Male | Female |
| Under 5 Years | 0 (0.0%) | 0 (0.0%) |
| 5 to 17 Years | 0 (0.0%) | 0 (0.0%) |
| 18 to 34 Years | 0 (0.0%) | 0 (0.0%) |
| 35 to 64 Years | 0 (0.0%) | 78 (22.2%) |
| 65 to 74 Years | 141 (91.6%) | 0 (0.0%) |
| 75 Years and over | 0 (0.0%) | 27 (100.0%) |
Disability Class by Sex by Age in Abram
Disability Class: Hearing Difficulty
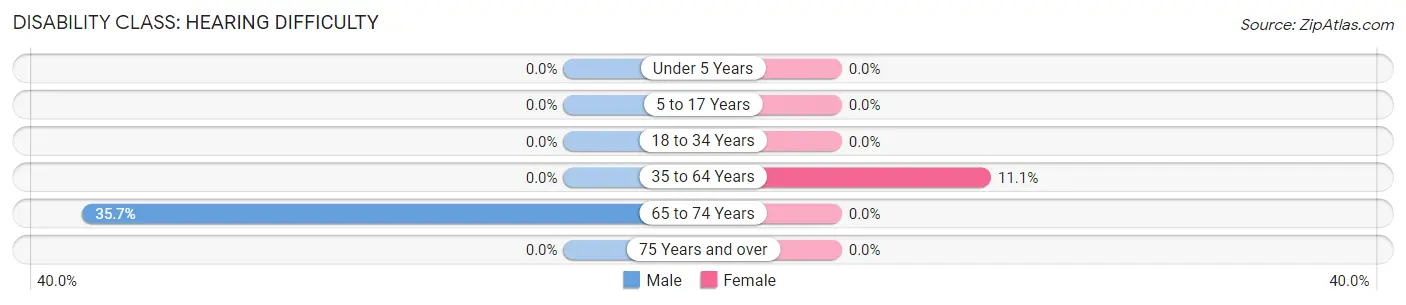
| Age Bracket | Male | Female |
| Under 5 Years | 0 (0.0%) | 0 (0.0%) |
| 5 to 17 Years | 0 (0.0%) | 0 (0.0%) |
| 18 to 34 Years | 0 (0.0%) | 0 (0.0%) |
| 35 to 64 Years | 0 (0.0%) | 39 (11.1%) |
| 65 to 74 Years | 55 (35.7%) | 0 (0.0%) |
| 75 Years and over | 0 (0.0%) | 0 (0.0%) |
Disability Class: Vision Difficulty
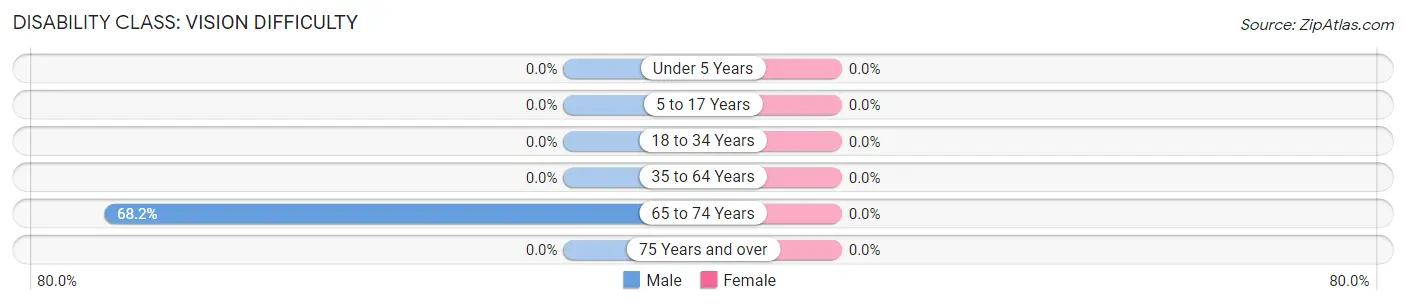
| Age Bracket | Male | Female |
| Under 5 Years | 0 (0.0%) | 0 (0.0%) |
| 5 to 17 Years | 0 (0.0%) | 0 (0.0%) |
| 18 to 34 Years | 0 (0.0%) | 0 (0.0%) |
| 35 to 64 Years | 0 (0.0%) | 0 (0.0%) |
| 65 to 74 Years | 105 (68.2%) | 0 (0.0%) |
| 75 Years and over | 0 (0.0%) | 0 (0.0%) |
Disability Class: Cognitive Difficulty
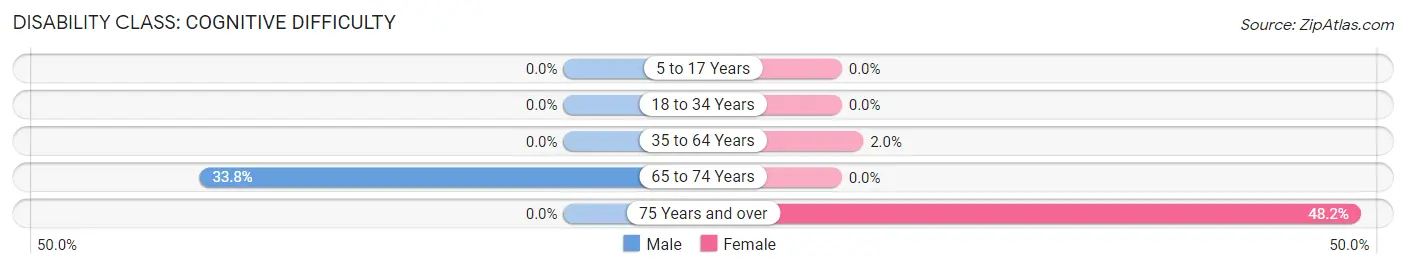
| Age Bracket | Male | Female |
| 5 to 17 Years | 0 (0.0%) | 0 (0.0%) |
| 18 to 34 Years | 0 (0.0%) | 0 (0.0%) |
| 35 to 64 Years | 0 (0.0%) | 7 (2.0%) |
| 65 to 74 Years | 52 (33.8%) | 0 (0.0%) |
| 75 Years and over | 0 (0.0%) | 13 (48.1%) |
Disability Class: Ambulatory Difficulty
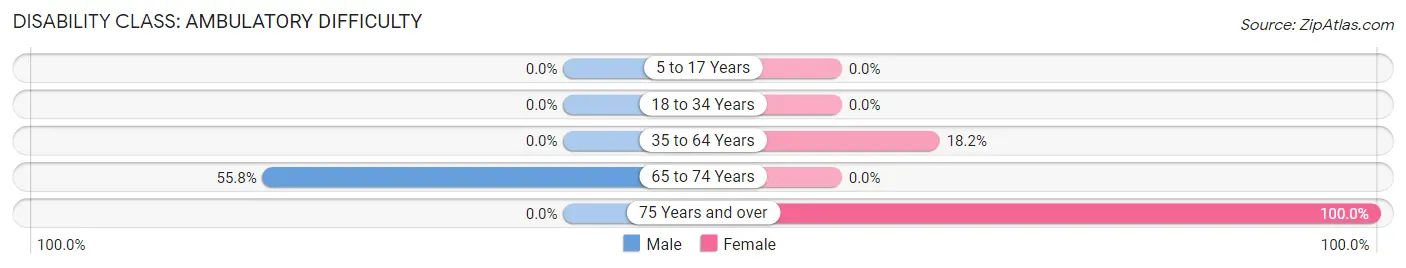
| Age Bracket | Male | Female |
| 5 to 17 Years | 0 (0.0%) | 0 (0.0%) |
| 18 to 34 Years | 0 (0.0%) | 0 (0.0%) |
| 35 to 64 Years | 0 (0.0%) | 64 (18.2%) |
| 65 to 74 Years | 86 (55.8%) | 0 (0.0%) |
| 75 Years and over | 0 (0.0%) | 27 (100.0%) |
Disability Class: Self-Care Difficulty
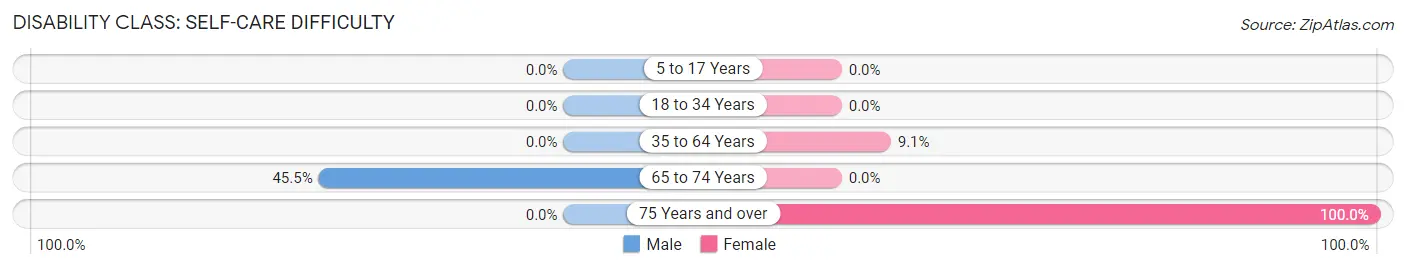
| Age Bracket | Male | Female |
| 5 to 17 Years | 0 (0.0%) | 0 (0.0%) |
| 18 to 34 Years | 0 (0.0%) | 0 (0.0%) |
| 35 to 64 Years | 0 (0.0%) | 32 (9.1%) |
| 65 to 74 Years | 70 (45.5%) | 0 (0.0%) |
| 75 Years and over | 0 (0.0%) | 27 (100.0%) |
Technology Access in Abram
Computing Device Access in Abram
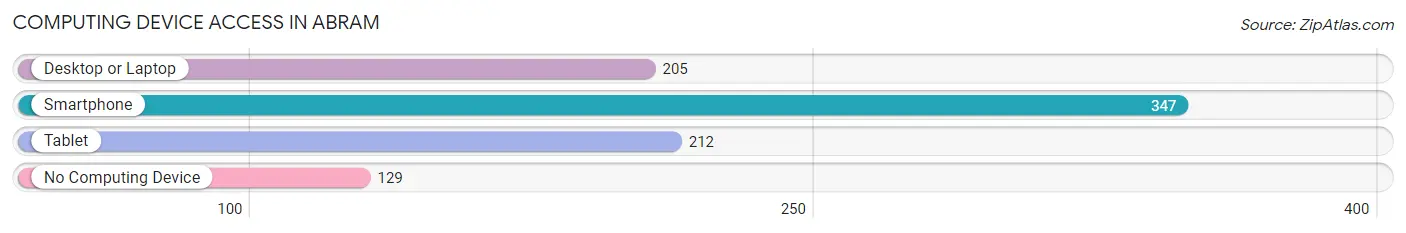
| Device Type | # Households | % Households |
| Desktop or Laptop | 205 | 42.4% |
| Smartphone | 347 | 71.8% |
| Tablet | 212 | 43.9% |
| No Computing Device | 129 | 26.7% |
| Total | 483 | 100.0% |
Internet Access in Abram
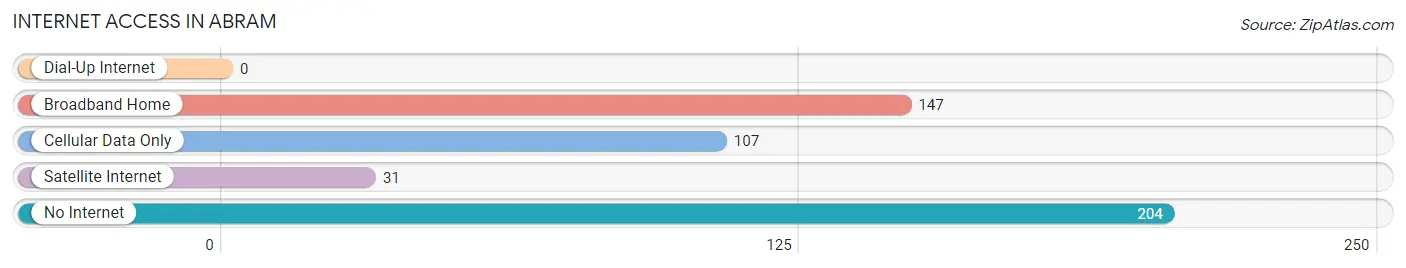
| Internet Type | # Households | % Households |
| Dial-Up Internet | 0 | 0.0% |
| Broadband Home | 147 | 30.4% |
| Cellular Data Only | 107 | 22.2% |
| Satellite Internet | 31 | 6.4% |
| No Internet | 204 | 42.2% |
| Total | 483 | 100.0% |
Abram Summary
Abram, Texas is a small town located in Hidalgo County, Texas. It is situated about 10 miles south of the city of McAllen and is part of the McAllen-Edinburg-Mission Metropolitan Statistical Area. The town was founded in the early 1900s and has a population of approximately 1,000 people.
History
The town of Abram was founded in the early 1900s by a group of settlers from Mexico. The settlers were attracted to the area due to its fertile soil and abundant water supply. The town was named after Abram Gonzales, a prominent local rancher.
In the early 1900s, the town was a small farming community. The main crops grown in the area were cotton, corn, and sorghum. The town also had a few small businesses, such as a general store and a blacksmith shop.
In the 1920s, the town began to grow as more people moved to the area. The population increased from about 200 people in 1920 to over 1,000 people by 1930. During this time, the town also saw the construction of a school, a post office, and a few churches.
In the 1940s, the town experienced a period of growth as the population increased to over 1,500 people. During this time, the town also saw the construction of a new school, a library, and a hospital.
In the 1950s, the town experienced a period of decline as the population decreased to about 1,000 people. This decline was due to the fact that many of the town’s residents moved away to find better job opportunities in larger cities.
In the 1960s, the town experienced a period of growth as the population increased to over 1,500 people. During this time, the town also saw the construction of a new library, a new hospital, and a new school.
In the 1970s, the town experienced a period of decline as the population decreased to about 1,000 people. This decline was due to the fact that many of the town’s residents moved away to find better job opportunities in larger cities.
In the 1980s, the town experienced a period of growth as the population increased to over 1,500 people. During this time, the town also saw the construction of a new library, a new hospital, and a new school.
In the 1990s, the town experienced a period of decline as the population decreased to about 1,000 people. This decline was due to the fact that many of the town’s residents moved away to find better job opportunities in larger cities.
Geography
Abram is located in Hidalgo County, Texas. It is situated about 10 miles south of the city of McAllen and is part of the McAllen-Edinburg-Mission Metropolitan Statistical Area. The town is located in the Rio Grande Valley and is surrounded by farmland.
The climate in Abram is subtropical and semi-arid. The average temperature in the summer is around 90 degrees Fahrenheit and the average temperature in the winter is around 60 degrees Fahrenheit. The town receives an average of about 20 inches of rain per year.
Economy
The economy of Abram is largely based on agriculture. The main crops grown in the area are cotton, corn, and sorghum. The town also has a few small businesses, such as a general store and a blacksmith shop.
Demographics
As of the 2010 census, the population of Abram was 1,000 people. The racial makeup of the town was 94.7% Hispanic or Latino, 4.2% White, and 0.1% African American. The median household income in the town was $25,000 and the median home value was $50,000.
Conclusion
Abram, Texas is a small town located in Hidalgo County, Texas. It was founded in the early 1900s and has a population of approximately 1,000 people. The town’s economy is largely based on agriculture and it has a few small businesses. The town has a diverse population, with 94.7% of the population being Hispanic or Latino.
Common Questions
What is the Total Population of Abram?
Total Population of Abram is 1,952.
What is the Total Male Population of Abram?
Total Male Population of Abram is 982.
What is the Total Female Population of Abram?
Total Female Population of Abram is 970.
What is the Ratio of Males per 100 Females in Abram?
There are 101.24 Males per 100 Females in Abram.
What is the Ratio of Females per 100 Males in Abram?
There are 98.78 Females per 100 Males in Abram.
What is the Median Population Age in Abram?
Median Population Age in Abram is 21.0 Years.
What is the Average Family Size in Abram
Average Family Size in Abram is 4.2 People.
What is the Average Household Size in Abram
Average Household Size in Abram is 4.0 People.
What is Per Capita Income in Abram?
Per Capita income in Abram is $10,249.
What is the Median Family Income in Abram?
Median Family Income in Abram is $27,854.
What is the Median Household income in Abram?
Median Household Income in Abram is $27,137.
What is Income or Wage Gap in Abram?
Income or Wage Gap in Abram is 30.0%.
Women in Abram earn 70.0 cents for every dollar earned by a man.
What is Inequality or Gini Index in Abram?
Inequality or Gini Index in Abram is 0.51.
How Large is the Labor Force in Abram?
There are 564 People in the Labor Forcein in Abram.
What is the Percentage of People in the Labor Force in Abram?
44.6% of People are in the Labor Force in Abram.
What is the Unemployment Rate in Abram?
Unemployment Rate in Abram is 12.8%.