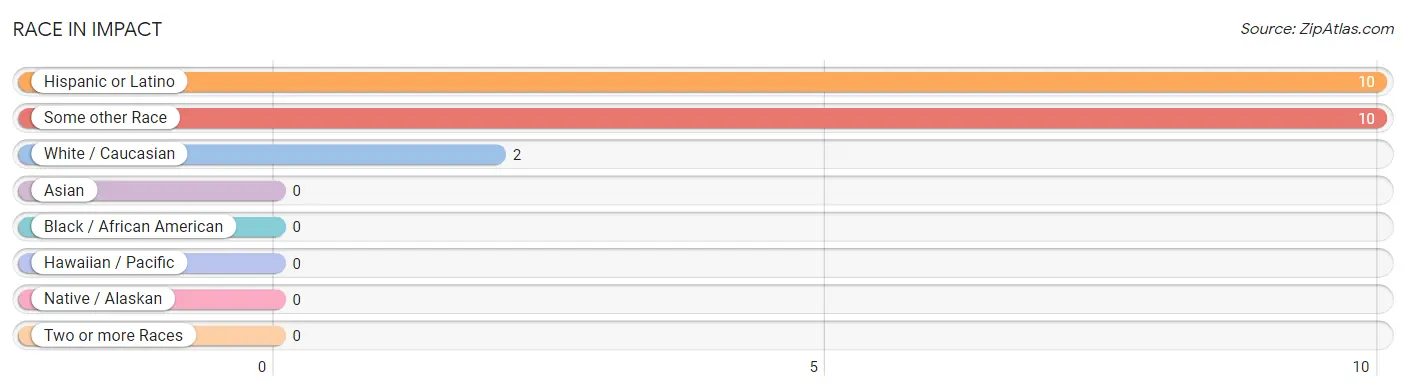
The most populous races in Impact are Hispanic or Latino (10 | 83.3%), Some other Race (10 | 83.3%), and White / Caucasian (2 | 16.7%).
Race
# Population
% Population
Asian
0
0.0%
Black / African American
0
0.0%
Hawaiian / Pacific
0
0.0%
Hispanic or Latino
10
83.3%
Native / Alaskan
0
0.0%
White / Caucasian
2
16.7%
Two or more Races
0
0.0%
Some other Race
10
83.3%
Total
12
100.0%
Ancestry in Impact
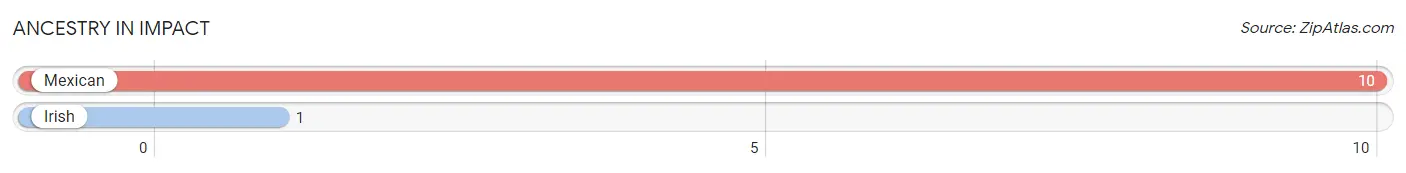
The most populous ancestries reported in Impact are Mexican (10 | 83.3%), and Irish (1 | 8.3%), together accounting for 91.7% of all Impact residents.
Ancestry
# Population
% Population
Irish
1
8.3%
Mexican
10
83.3%
View All 2 Rows
Immigrants in Impact
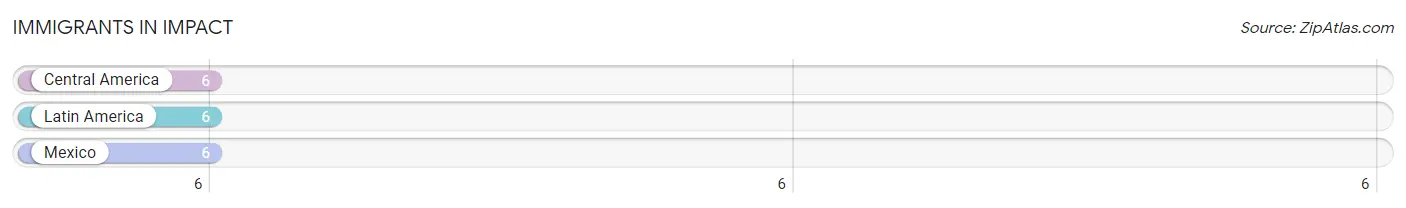
The most numerous immigrant groups reported in Impact came from Central America (6 | 50.0%), Latin America (6 | 50.0%), and Mexico (6 | 50.0%), together accounting for 150.0% of all Impact residents.
Immigration Origin
# Population
% Population
Central America
6
50.0%
Latin America
6
50.0%
Mexico
6
50.0%
View All 3 Rows
Sex and Age in Impact
Sex and Age in Impact
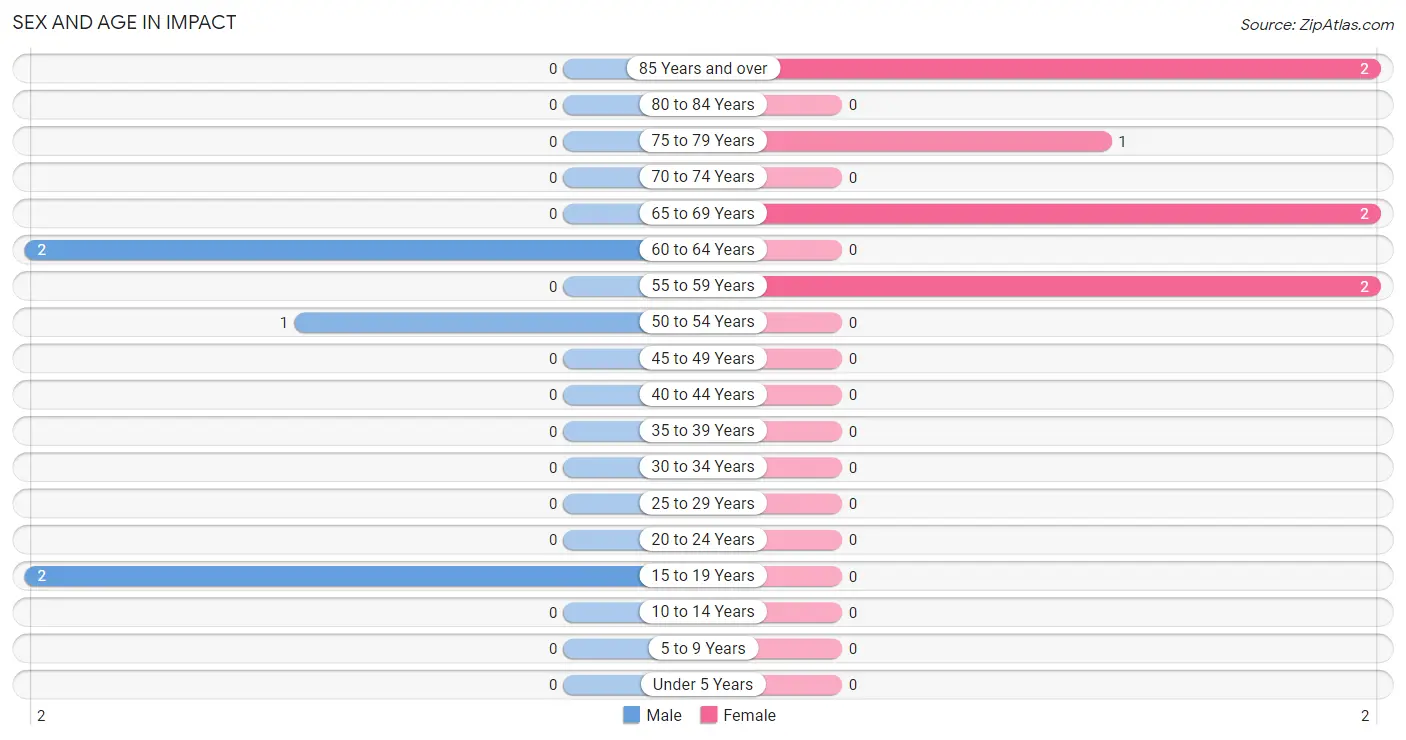
The most populous age groups in Impact are 15 to 19 Years (2 | 40.0%) for men and 55 to 59 Years (2 | 28.6%) for women.
Age Bracket
Male
Female
Under 5 Years
0 (0.0%)
0 (0.0%)
5 to 9 Years
0 (0.0%)
0 (0.0%)
10 to 14 Years
0 (0.0%)
0 (0.0%)
15 to 19 Years
2 (40.0%)
0 (0.0%)
20 to 24 Years
0 (0.0%)
0 (0.0%)
25 to 29 Years
0 (0.0%)
0 (0.0%)
30 to 34 Years
0 (0.0%)
0 (0.0%)
35 to 39 Years
0 (0.0%)
0 (0.0%)
40 to 44 Years
0 (0.0%)
0 (0.0%)
45 to 49 Years
0 (0.0%)
0 (0.0%)
50 to 54 Years
1 (20.0%)
0 (0.0%)
55 to 59 Years
0 (0.0%)
2 (28.6%)
60 to 64 Years
2 (40.0%)
0 (0.0%)
65 to 69 Years
0 (0.0%)
2 (28.6%)
70 to 74 Years
0 (0.0%)
0 (0.0%)
75 to 79 Years
0 (0.0%)
1 (14.3%)
80 to 84 Years
0 (0.0%)
0 (0.0%)
85 Years and over
0 (0.0%)
2 (28.6%)
Total
5 (100.0%)
7 (100.0%)
Families and Households in Impact
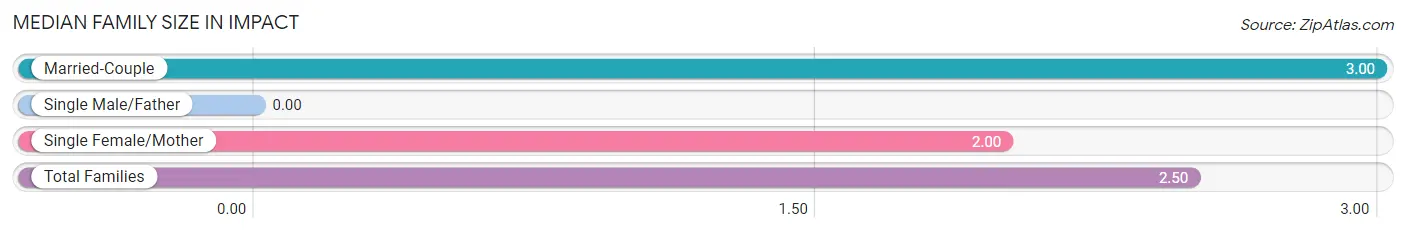
Median Family Size in Impact
Family Type
# Families
Family Size
Married-Couple
2 (50.0%)
3.00
Single Male/Father
0 (0.0%)
-
Single Female/Mother
2 (50.0%)
2.00
Total Families
4 (100.0%)
2.50
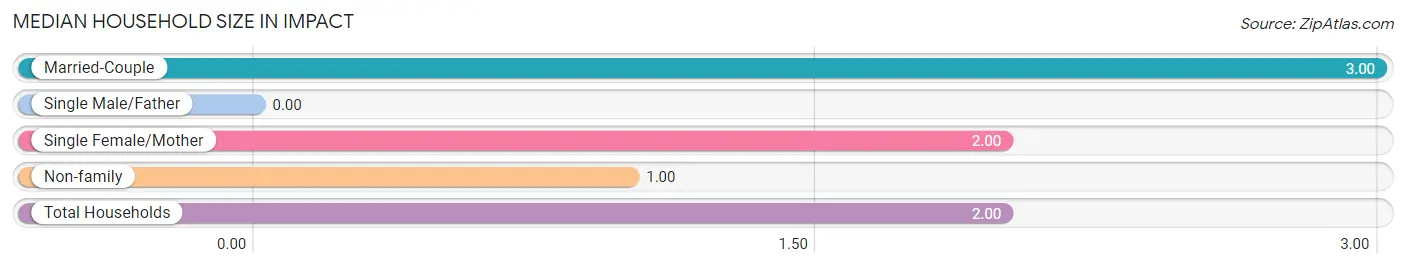
Median Household Size in Impact
Household Type
# Households
Household Size
Married-Couple
2 (33.3%)
3.00
Single Male/Father
0 (0.0%)
-
Single Female/Mother
2 (33.3%)
2.00
Non-family
2 (33.3%)
1.00
Total Households
6 (100.0%)
2.00
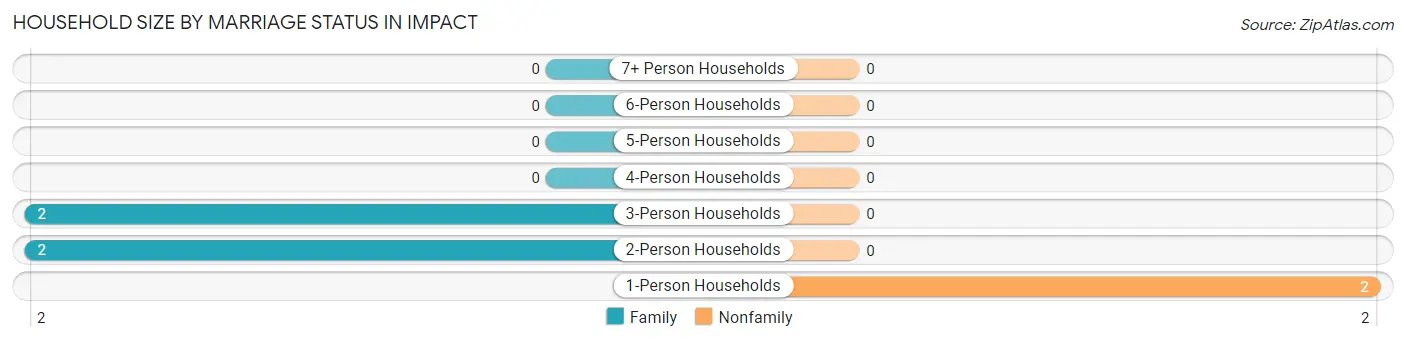
Household Size by Marriage Status in Impact
Out of a total of 6 households in Impact, 4 (66.7%) are family households, while 2 (33.3%) are nonfamily households. The most numerous type of family households are 2-person households, comprising 2, and the most common type of nonfamily households are 1-person households, comprising 2.
Household Size
Family Households
Nonfamily Households
1-Person Households
-
2 (33.3%)
2-Person Households
2 (33.3%)
0 (0.0%)
3-Person Households
2 (33.3%)
0 (0.0%)
4-Person Households
0 (0.0%)
0 (0.0%)
5-Person Households
0 (0.0%)
0 (0.0%)
6-Person Households
0 (0.0%)
0 (0.0%)
7+ Person Households
0 (0.0%)
0 (0.0%)
Total
4 (66.7%)
2 (33.3%)
Female Fertility in Impact
Fertility by Age in Impact
Age Bracket
Women with Births
Births / 1,000 Women
15 to 19 years
0 (0.0%)
0.0
20 to 34 years
0 (0.0%)
0.0
35 to 50 years
0 (0.0%)
0.0
Total
0 (0.0%)
0.0
Fertility by Age by Marriage Status in Impact
Age Bracket
Married
Unmarried
15 to 19 years
0 (0.0%)
0 (0.0%)
20 to 34 years
0 (0.0%)
0 (0.0%)
35 to 50 years
0 (0.0%)
0 (0.0%)
Total
0 (0.0%)
0 (0.0%)
Fertility by Education in Impact
Educational Attainment
Women with Births
Births / 1,000 Women
Less than High School
0 (0.0%)
0.0
High School Diploma
0 (0.0%)
0.0
College or Associate's Degree
0 (0.0%)
0.0
Bachelor's Degree
0 (0.0%)
0.0
Graduate Degree
0 (0.0%)
0.0
Total
0 (0.0%)
0.0
Fertility by Education by Marriage Status in Impact
Educational Attainment
Married
Unmarried
Less than High School
0 (0.0%)
0 (0.0%)
High School Diploma
0 (0.0%)
0 (0.0%)
College or Associate's Degree
0 (0.0%)
0 (0.0%)
Bachelor's Degree
0 (0.0%)
0 (0.0%)
Graduate Degree
0 (0.0%)
0 (0.0%)
Total
0 (0.0%)
0 (0.0%)
Income in Impact
Income Overview in Impact
Characteristic
Number
Measure
Per Capita Income
12
$12,183
Median Family Income
4
$0
Mean Family Income
4
$0
Median Household Income
6
$0
Mean Household Income
6
$24,367
Income Deficit
4
$0
Wage / Income Gap (%)
12
0.00%
Wage / Income Gap ($)
12
100.00¢ per $1
Gini / Inequality Index
12
0.38
Earnings by Sex in Impact
Sex
Number
Average Earnings
Male
0 (0.0%)
$0
Female
0 (0.0%)
$0
Total
0 (0.0%)
$0
Earnings by Sex by Income Bracket in Impact
Income
Male
Female
$2,499 or less
0 (0.0%)
0 (0.0%)
$2,500 to $4,999
0 (0.0%)
0 (0.0%)
$5,000 to $7,499
0 (0.0%)
0 (0.0%)
$7,500 to $9,999
0 (0.0%)
0 (0.0%)
$10,000 to $12,499
0 (0.0%)
0 (0.0%)
$12,500 to $14,999
0 (0.0%)
0 (0.0%)
$15,000 to $17,499
0 (0.0%)
0 (0.0%)
$17,500 to $19,999
0 (0.0%)
0 (0.0%)
$20,000 to $22,499
0 (0.0%)
0 (0.0%)
$22,500 to $24,999
0 (0.0%)
0 (0.0%)
$25,000 to $29,999
0 (0.0%)
0 (0.0%)
$30,000 to $34,999
0 (0.0%)
0 (0.0%)
$35,000 to $39,999
0 (0.0%)
0 (0.0%)
$40,000 to $44,999
0 (0.0%)
0 (0.0%)
$45,000 to $49,999
0 (0.0%)
0 (0.0%)
$50,000 to $54,999
0 (0.0%)
0 (0.0%)
$55,000 to $64,999
0 (0.0%)
0 (0.0%)
$65,000 to $74,999
0 (0.0%)
0 (0.0%)
$75,000 to $99,999
0 (0.0%)
0 (0.0%)
$100,000+
0 (0.0%)
0 (0.0%)
Total
0 (0.0%)
0 (0.0%)
Earnings by Sex by Educational Attainment in Impact
Educational Attainment
Male Income
Female Income
Less than High School
-
-
High School Diploma
-
-
College or Associate's Degree
-
-
Bachelor's Degree
-
-
Graduate Degree
-
-
Total
-
-
Family Income in Impact
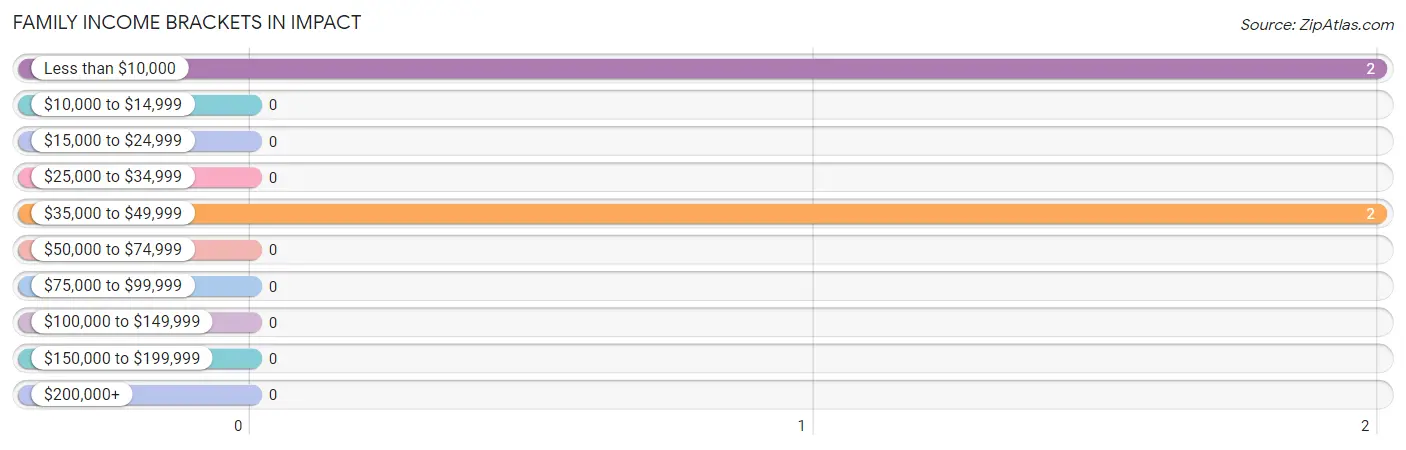
Family Income Brackets in Impact
According to the Impact family income data, there are 2 families falling into the less than $10,000 income range, which is the most common income bracket and makes up 50.0% of all families.
Income Bracket
# Families
% Families
Less than $10,000
2
50.0%
$10,000 to $14,999
0
0.0%
$15,000 to $24,999
0
0.0%
$25,000 to $34,999
0
0.0%
$35,000 to $49,999
2
50.0%
$50,000 to $74,999
0
0.0%
$75,000 to $99,999
0
0.0%
$100,000 to $149,999
0
0.0%
$150,000 to $199,999
0
0.0%
$200,000+
0
0.0%
Family Income by Famaliy Size in Impact
Income Bracket
# Families
Median Income
2-Person Families
2 (50.0%)
$0
3-Person Families
2 (50.0%)
$0
4-Person Families
0 (0.0%)
$0
5-Person Families
0 (0.0%)
$0
6-Person Families
0 (0.0%)
$0
7+ Person Families
0 (0.0%)
$0
Total
4 (100.0%)
$0
Family Income by Number of Earners in Impact
Number of Earners
# Families
Median Income
No Earners
4 (100.0%)
$0
1 Earner
0 (0.0%)
$0
2 Earners
0 (0.0%)
$0
3+ Earners
0 (0.0%)
$0
Total
4 (100.0%)
$0
Household Income in Impact
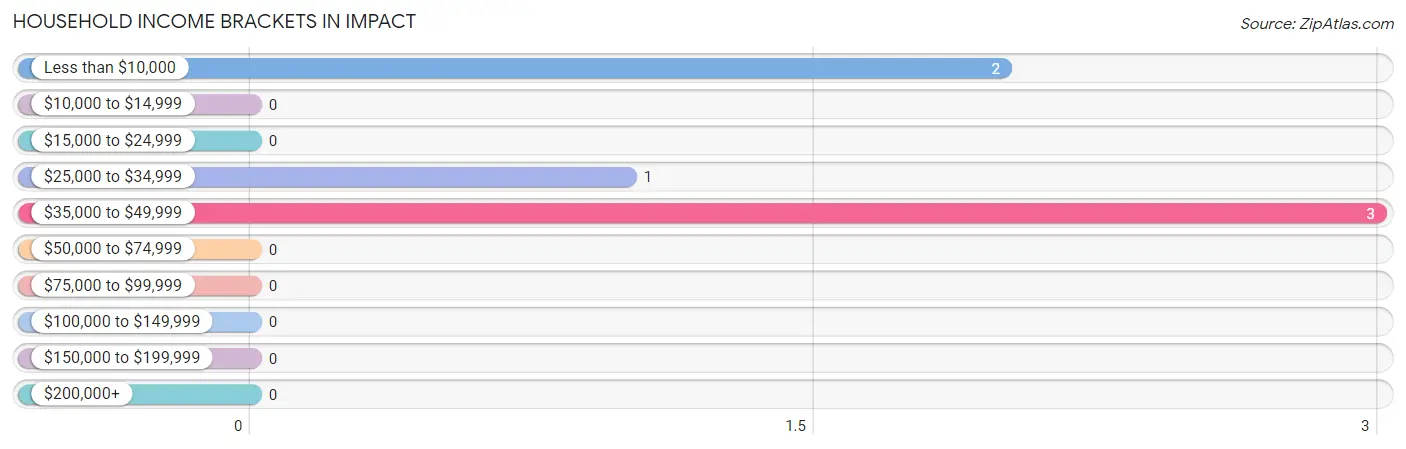
Household Income Brackets in Impact
With 3 households falling in the category, the $35,000 to $49,999 income range is the most frequent in Impact, accounting for 50.0% of all households.
Income Bracket
# Households
% Households
Less than $10,000
2
33.3%
$10,000 to $14,999
0
0.0%
$15,000 to $24,999
0
0.0%
$25,000 to $34,999
1
16.7%
$35,000 to $49,999
3
50.0%
$50,000 to $74,999
0
0.0%
$75,000 to $99,999
0
0.0%
$100,000 to $149,999
0
0.0%
$150,000 to $199,999
0
0.0%
$200,000+
0
0.0%
Household Income by Householder Age in Impact
Income Bracket
# Households
Median Income
15 to 24 Years
0 (0.0%)
$0
25 to 44 Years
0 (0.0%)
$0
45 to 64 Years
3 (50.0%)
$0
65+ Years
3 (50.0%)
$0
Total
6 (100.0%)
$0
Poverty in Impact
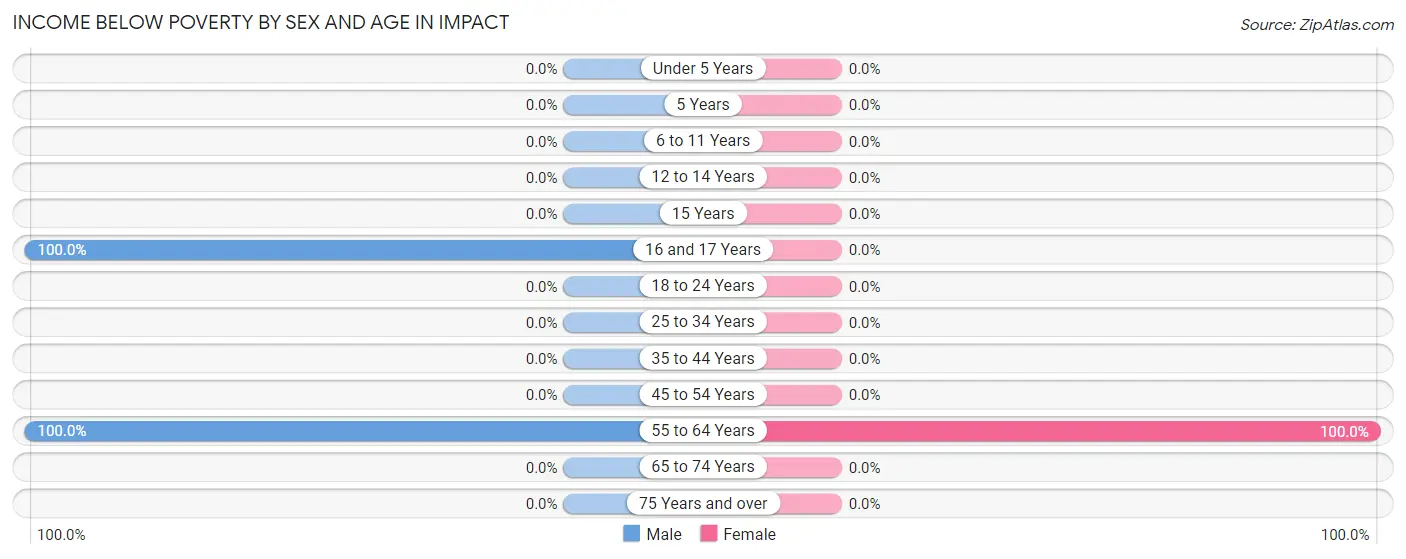
Income Below Poverty by Sex and Age in Impact
With 80.0% poverty level for males and 28.6% for females among the residents of Impact, 16 and 17 year old males and 55 to 64 year old females are the most vulnerable to poverty, with 2 males (100.0%) and 2 females (100.0%) in their respective age groups living below the poverty level.
Age Bracket
Male
Female
Under 5 Years
0 (0.0%)
0 (0.0%)
5 Years
0 (0.0%)
0 (0.0%)
6 to 11 Years
0 (0.0%)
0 (0.0%)
12 to 14 Years
0 (0.0%)
0 (0.0%)
15 Years
0 (0.0%)
0 (0.0%)
16 and 17 Years
2 (100.0%)
0 (0.0%)
18 to 24 Years
0 (0.0%)
0 (0.0%)
25 to 34 Years
0 (0.0%)
0 (0.0%)
35 to 44 Years
0 (0.0%)
0 (0.0%)
45 to 54 Years
0 (0.0%)
0 (0.0%)
55 to 64 Years
2 (100.0%)
2 (100.0%)
65 to 74 Years
0 (0.0%)
0 (0.0%)
75 Years and over
0 (0.0%)
0 (0.0%)
Total
4 (80.0%)
2 (28.6%)
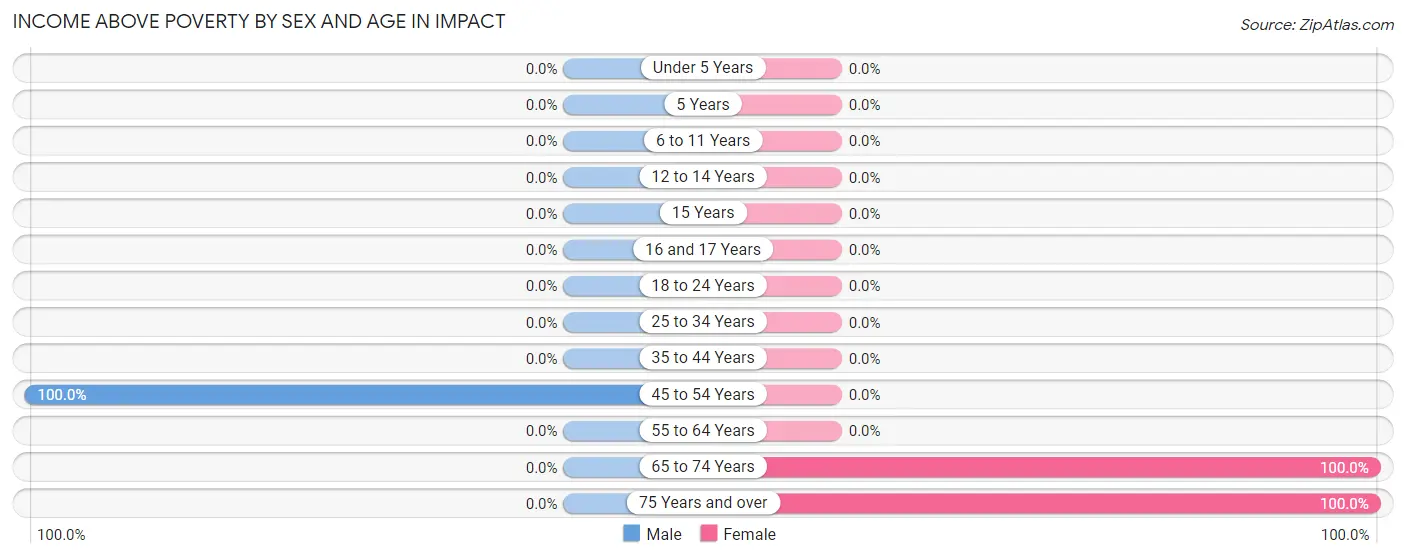
Income Above Poverty by Sex and Age in Impact
According to the poverty statistics in Impact, males aged 45 to 54 years and females aged 65 to 74 years are the age groups that are most secure financially, with 100.0% of males and 100.0% of females in these age groups living above the poverty line.
Age Bracket
Male
Female
Under 5 Years
0 (0.0%)
0 (0.0%)
5 Years
0 (0.0%)
0 (0.0%)
6 to 11 Years
0 (0.0%)
0 (0.0%)
12 to 14 Years
0 (0.0%)
0 (0.0%)
15 Years
0 (0.0%)
0 (0.0%)
16 and 17 Years
0 (0.0%)
0 (0.0%)
18 to 24 Years
0 (0.0%)
0 (0.0%)
25 to 34 Years
0 (0.0%)
0 (0.0%)
35 to 44 Years
0 (0.0%)
0 (0.0%)
45 to 54 Years
1 (100.0%)
0 (0.0%)
55 to 64 Years
0 (0.0%)
0 (0.0%)
65 to 74 Years
0 (0.0%)
2 (100.0%)
75 Years and over
0 (0.0%)
3 (100.0%)
Total
1 (20.0%)
5 (71.4%)
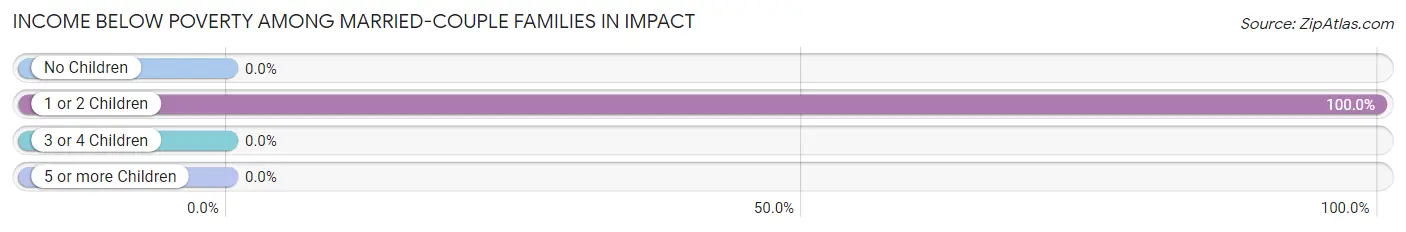
Income Below Poverty Among Married-Couple Families in Impact
The poverty statistics for married-couple families in Impact show that 100.0% or 2 of the total 2 families live below the poverty line. Families with 1 or 2 children have the highest poverty rate of 100.0%, comprising of 2 families. On the other hand, families with 1 or 2 children have the lowest poverty rate of 100.0%, which includes 2 families.
Children
Above Poverty
Below Poverty
No Children
0 (0.0%)
0 (0.0%)
1 or 2 Children
0 (0.0%)
2 (100.0%)
3 or 4 Children
0 (0.0%)
0 (0.0%)
5 or more Children
0 (0.0%)
0 (0.0%)
Total
0 (0.0%)
2 (100.0%)
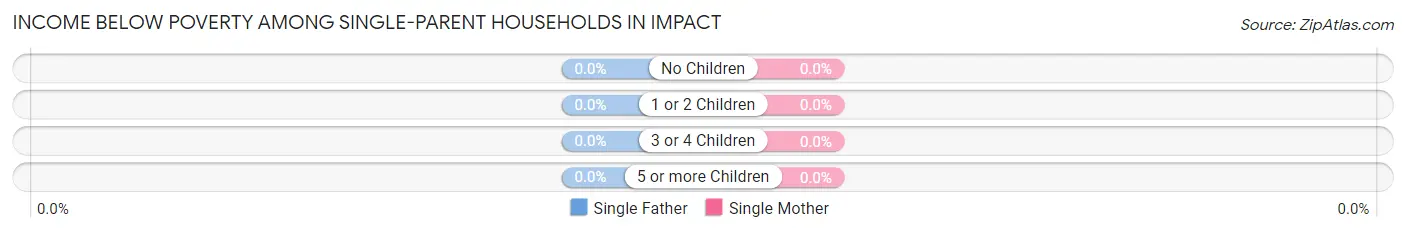
Income Below Poverty Among Single-Parent Households in Impact
Children
Single Father
Single Mother
No Children
0 (0.0%)
0 (0.0%)
1 or 2 Children
0 (0.0%)
0 (0.0%)
3 or 4 Children
0 (0.0%)
0 (0.0%)
5 or more Children
0 (0.0%)
0 (0.0%)
Total
0 (0.0%)
0 (0.0%)
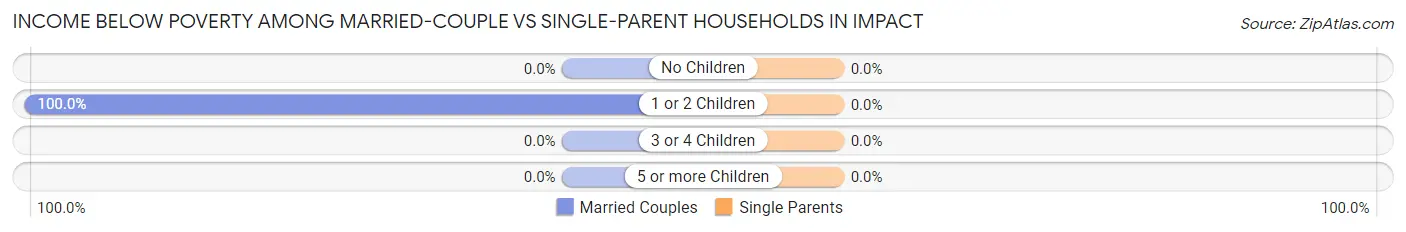
Income Below Poverty Among Married-Couple vs Single-Parent Households in Impact
Children
Married-Couple Families
Single-Parent Households
No Children
0 (0.0%)
0 (0.0%)
1 or 2 Children
2 (100.0%)
0 (0.0%)
3 or 4 Children
0 (0.0%)
0 (0.0%)
5 or more Children
0 (0.0%)
0 (0.0%)
Total
2 (100.0%)
0 (0.0%)
Employment Characteristics in Impact
Employment by Class of Employer in Impact
Employer Class
# Employees
% Employees
Private Company Employees
0
0.0%
Self-Employed (Incorporated)
0
0.0%
Self-Employed (Not Incorporated)
0
0.0%
Not-for-profit Organizations
0
0.0%
Local Government Employees
0
0.0%
State Government Employees
0
0.0%
Federal Government Employees
0
0.0%
Unpaid Family Workers
0
0.0%
Total
0
0.0%
Employment Status by Age in Impact
Age Bracket
In Labor Force
Unemployed
16 to 19 Years
0 (0.0%)
0 (0.0%)
20 to 24 Years
0 (0.0%)
0 (0.0%)
25 to 29 Years
0 (0.0%)
0 (0.0%)
30 to 34 Years
0 (0.0%)
0 (0.0%)
35 to 44 Years
0 (0.0%)
0 (0.0%)
45 to 54 Years
0 (0.0%)
0 (0.0%)
55 to 59 Years
0 (0.0%)
0 (0.0%)
60 to 64 Years
0 (0.0%)
0 (0.0%)
65 to 74 Years
0 (0.0%)
0 (0.0%)
75 Years and over
0 (0.0%)
0 (0.0%)
Total
0 (0.0%)
0 (0.0%)
Employment Status by Educational Attainment in Impact
Educational Attainment
In Labor Force
Unemployed
Less than High School
0 (0.0%)
0 (0.0%)
High School Diploma
0 (0.0%)
0 (0.0%)
College / Associate Degree
0 (0.0%)
0 (0.0%)
Bachelor's Degree or higher
0 (0.0%)
0 (0.0%)
Total
0 (0.0%)
0 (0.0%)
Employment Occupations by Sex in Impact
Management, Business, Science and Arts Occupations
Management, Business, Science and Arts Occupations by Sex
Occupation
Male
Female
Management
0 (0.0%)
0 (0.0%)
Business & Financial
0 (0.0%)
0 (0.0%)
Computers, Engineering & Science
0 (0.0%)
0 (0.0%)
Computers & Mathematics
0 (0.0%)
0 (0.0%)
Architecture & Engineering
0 (0.0%)
0 (0.0%)
Life, Physical & Social Science
0 (0.0%)
0 (0.0%)
Community & Social Service
0 (0.0%)
0 (0.0%)
Education, Arts & Media
0 (0.0%)
0 (0.0%)
Legal Services & Support
0 (0.0%)
0 (0.0%)
Education Instruction & Library
0 (0.0%)
0 (0.0%)
Arts, Media & Entertainment
0 (0.0%)
0 (0.0%)
Health Diagnosing & Treating
0 (0.0%)
0 (0.0%)
Health Technologists
0 (0.0%)
0 (0.0%)
Total (Category)
0 (0.0%)
0 (0.0%)
Total (Overall)
0 (0.0%)
0 (0.0%)
Services Occupations
Services Occupations by Sex
Occupation
Male
Female
Healthcare Support
0 (0.0%)
0 (0.0%)
Security & Protection
0 (0.0%)
0 (0.0%)
Firefighting & Prevention
0 (0.0%)
0 (0.0%)
Law Enforcement
0 (0.0%)
0 (0.0%)
Food Preparation & Serving
0 (0.0%)
0 (0.0%)
Cleaning & Maintenance
0 (0.0%)
0 (0.0%)
Personal Care & Service
0 (0.0%)
0 (0.0%)
Total (Category)
0 (0.0%)
0 (0.0%)
Total (Overall)
0 (0.0%)
0 (0.0%)
Sales and Office Occupations
Sales and Office Occupations by Sex
Occupation
Male
Female
Sales & Related
0 (0.0%)
0 (0.0%)
Office & Administration
0 (0.0%)
0 (0.0%)
Total (Category)
0 (0.0%)
0 (0.0%)
Total (Overall)
0 (0.0%)
0 (0.0%)
Natural Resources, Construction and Maintenance Occupations
Natural Resources, Construction and Maintenance Occupations by Sex
Occupation
Male
Female
Farming, Fishing & Forestry
0 (0.0%)
0 (0.0%)
Construction & Extraction
0 (0.0%)
0 (0.0%)
Installation, Maintenance & Repair
0 (0.0%)
0 (0.0%)
Total (Category)
0 (0.0%)
0 (0.0%)
Total (Overall)
0 (0.0%)
0 (0.0%)
Production, Transportation and Moving Occupations
Production, Transportation and Moving Occupations by Sex
Occupation
Male
Female
Production
0 (0.0%)
0 (0.0%)
Transportation
0 (0.0%)
0 (0.0%)
Material Moving
0 (0.0%)
0 (0.0%)
Total (Category)
0 (0.0%)
0 (0.0%)
Total (Overall)
0 (0.0%)
0 (0.0%)
Employment Industries by Sex in Impact
Employment Industries in Impact
Employment Industries by Sex in Impact
Industry
Male
Female
Agriculture, Fishing & Hunting
0 (0.0%)
0 (0.0%)
Mining, Quarrying, & Extraction
0 (0.0%)
0 (0.0%)
Construction
0 (0.0%)
0 (0.0%)
Manufacturing
0 (0.0%)
0 (0.0%)
Wholesale Trade
0 (0.0%)
0 (0.0%)
Retail Trade
0 (0.0%)
0 (0.0%)
Transportation & Warehousing
0 (0.0%)
0 (0.0%)
Utilities
0 (0.0%)
0 (0.0%)
Information
0 (0.0%)
0 (0.0%)
Finance & Insurance
0 (0.0%)
0 (0.0%)
Real Estate, Rental & Leasing
0 (0.0%)
0 (0.0%)
Professional & Scientific
0 (0.0%)
0 (0.0%)
Enterprise Management
0 (0.0%)
0 (0.0%)
Administrative & Support
0 (0.0%)
0 (0.0%)
Educational Services
0 (0.0%)
0 (0.0%)
Health Care & Social Assistance
0 (0.0%)
0 (0.0%)
Arts, Entertainment & Recreation
0 (0.0%)
0 (0.0%)
Accommodation & Food Services
0 (0.0%)
0 (0.0%)
Public Administration
0 (0.0%)
0 (0.0%)
Total
0 (0.0%)
0 (0.0%)
Education in Impact
School Enrollment in Impact
School Level
# Students
% Students
Nursery / Preschool
0
0.0%
Kindergarten
0
0.0%
Elementary School
0
0.0%
Middle School
0
0.0%
High School
2
100.0%
College / Undergraduate
0
0.0%
Graduate / Professional
0
0.0%
Total
2
100.0%
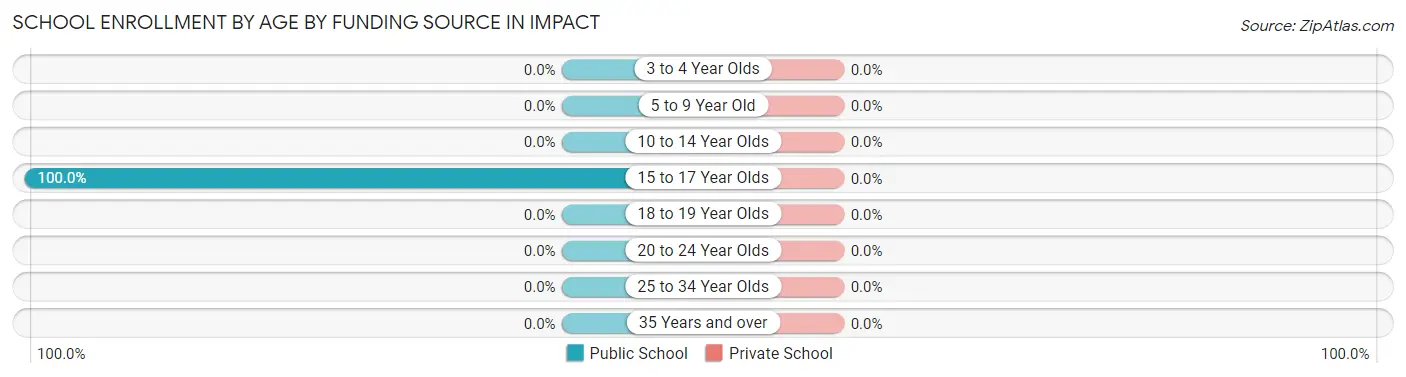
School Enrollment by Age by Funding Source in Impact
Age Bracket
Public School
Private School
3 to 4 Year Olds
0 (0.0%)
0 (0.0%)
5 to 9 Year Old
0 (0.0%)
0 (0.0%)
10 to 14 Year Olds
0 (0.0%)
0 (0.0%)
15 to 17 Year Olds
2 (100.0%)
0 (0.0%)
18 to 19 Year Olds
0 (0.0%)
0 (0.0%)
20 to 24 Year Olds
0 (0.0%)
0 (0.0%)
25 to 34 Year Olds
0 (0.0%)
0 (0.0%)
35 Years and over
0 (0.0%)
0 (0.0%)
Total
2 (100.0%)
0 (0.0%)
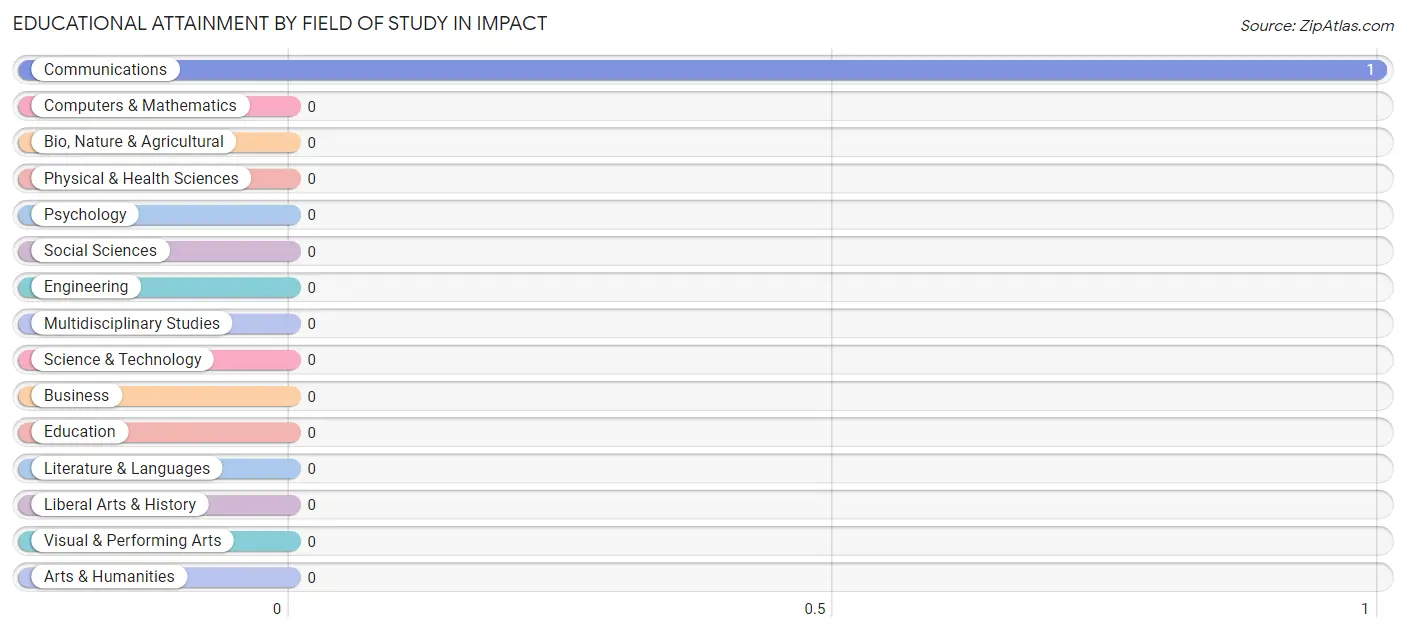
Educational Attainment by Field of Study in Impact
, and communications (1 | 100.0%) are the most common fields of study among 1 individuals in Impact who have obtained a bachelor's degree or higher.
Field of Study
# Graduates
% Graduates
Computers & Mathematics
0
0.0%
Bio, Nature & Agricultural
0
0.0%
Physical & Health Sciences
0
0.0%
Psychology
0
0.0%
Social Sciences
0
0.0%
Engineering
0
0.0%
Multidisciplinary Studies
0
0.0%
Science & Technology
0
0.0%
Business
0
0.0%
Education
0
0.0%
Literature & Languages
0
0.0%
Liberal Arts & History
0
0.0%
Visual & Performing Arts
0
0.0%
Communications
1
100.0%
Arts & Humanities
0
0.0%
Total
1
100.0%
Transportation & Commute in Impact
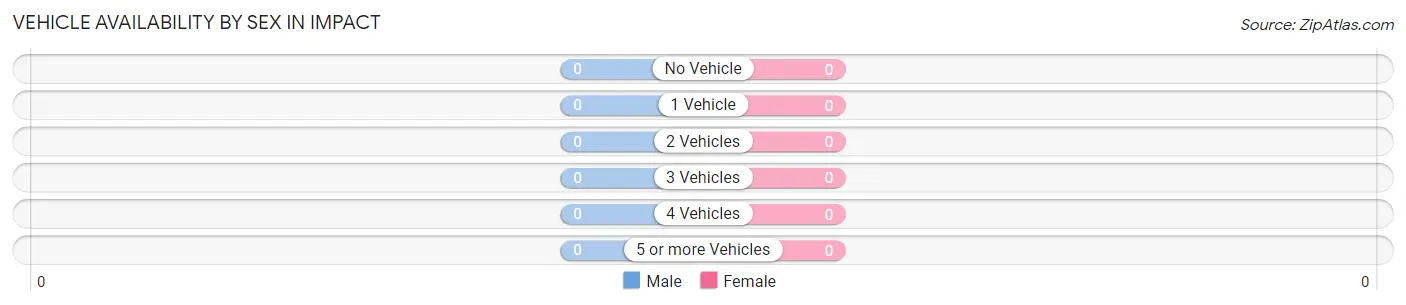
Vehicle Availability by Sex in Impact
Vehicles Available
Male
Female
No Vehicle
0 (0.0%)
0 (0.0%)
1 Vehicle
0 (0.0%)
0 (0.0%)
2 Vehicles
0 (0.0%)
0 (0.0%)
3 Vehicles
0 (0.0%)
0 (0.0%)
4 Vehicles
0 (0.0%)
0 (0.0%)
5 or more Vehicles
0 (0.0%)
0 (0.0%)
Total
0 (0.0%)
0 (0.0%)
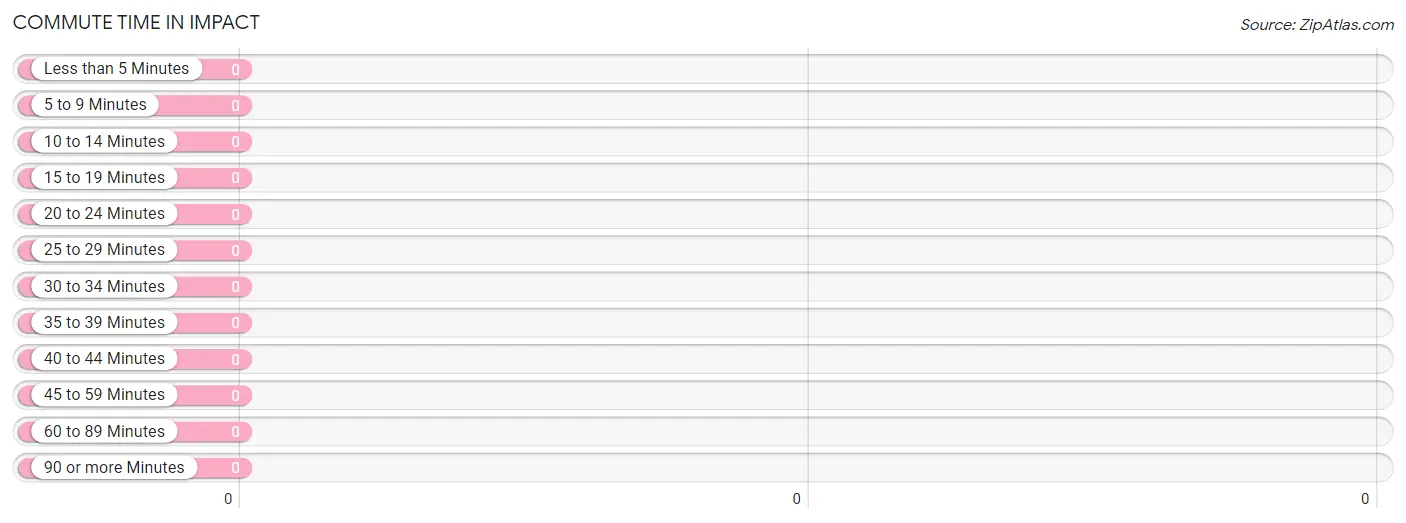
Commute Time in Impact
Commute Time
# Commuters
% Commuters
Less than 5 Minutes
0
0.0%
5 to 9 Minutes
0
0.0%
10 to 14 Minutes
0
0.0%
15 to 19 Minutes
0
0.0%
20 to 24 Minutes
0
0.0%
25 to 29 Minutes
0
0.0%
30 to 34 Minutes
0
0.0%
35 to 39 Minutes
0
0.0%
40 to 44 Minutes
0
0.0%
45 to 59 Minutes
0
0.0%
60 to 89 Minutes
0
0.0%
90 or more Minutes
0
0.0%
Commute Time by Sex in Impact
Commute Time
Male
Female
Less than 5 Minutes
0 (0.0%)
0 (0.0%)
5 to 9 Minutes
0 (0.0%)
0 (0.0%)
10 to 14 Minutes
0 (0.0%)
0 (0.0%)
15 to 19 Minutes
0 (0.0%)
0 (0.0%)
20 to 24 Minutes
0 (0.0%)
0 (0.0%)
25 to 29 Minutes
0 (0.0%)
0 (0.0%)
30 to 34 Minutes
0 (0.0%)
0 (0.0%)
35 to 39 Minutes
0 (0.0%)
0 (0.0%)
40 to 44 Minutes
0 (0.0%)
0 (0.0%)
45 to 59 Minutes
0 (0.0%)
0 (0.0%)
60 to 89 Minutes
0 (0.0%)
0 (0.0%)
90 or more Minutes
0 (0.0%)
0 (0.0%)
Time of Departure to Work by Sex in Impact
Time of Departure
Male
Female
12:00 AM to 4:59 AM
0 (0.0%)
0 (0.0%)
5:00 AM to 5:29 AM
0 (0.0%)
0 (0.0%)
5:30 AM to 5:59 AM
0 (0.0%)
0 (0.0%)
6:00 AM to 6:29 AM
0 (0.0%)
0 (0.0%)
6:30 AM to 6:59 AM
0 (0.0%)
0 (0.0%)
7:00 AM to 7:29 AM
0 (0.0%)
0 (0.0%)
7:30 AM to 7:59 AM
0 (0.0%)
0 (0.0%)
8:00 AM to 8:29 AM
0 (0.0%)
0 (0.0%)
8:30 AM to 8:59 AM
0 (0.0%)
0 (0.0%)
9:00 AM to 9:59 AM
0 (0.0%)
0 (0.0%)
10:00 AM to 10:59 AM
0 (0.0%)
0 (0.0%)
11:00 AM to 11:59 AM
0 (0.0%)
0 (0.0%)
12:00 PM to 3:59 PM
0 (0.0%)
0 (0.0%)
4:00 PM to 11:59 PM
0 (0.0%)
0 (0.0%)
Total
0 (0.0%)
0 (0.0%)
Housing Occupancy in Impact
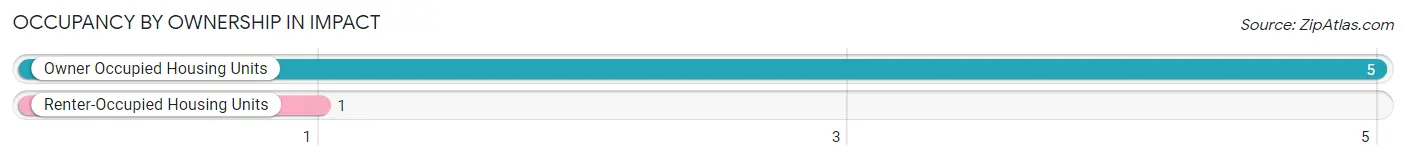
Occupancy by Ownership in Impact
Of the total 6 dwellings in Impact, owner-occupied units account for 5 (83.3%), while renter-occupied units make up 1 (16.7%).
Occupancy
# Housing Units
% Housing Units
Owner Occupied Housing Units
5
83.3%
Renter-Occupied Housing Units
1
16.7%
Total Occupied Housing Units
6
100.0%
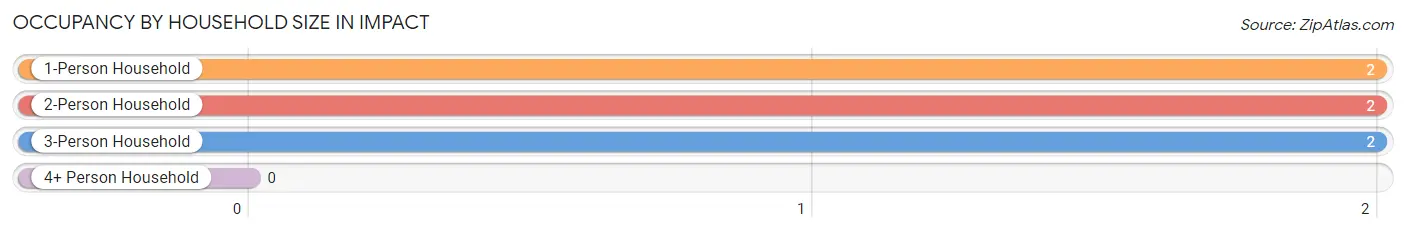
Occupancy by Household Size in Impact
Household Size
# Housing Units
% Housing Units
1-Person Household
2
33.3%
2-Person Household
2
33.3%
3-Person Household
2
33.3%
4+ Person Household
0
0.0%
Total Housing Units
6
100.0%
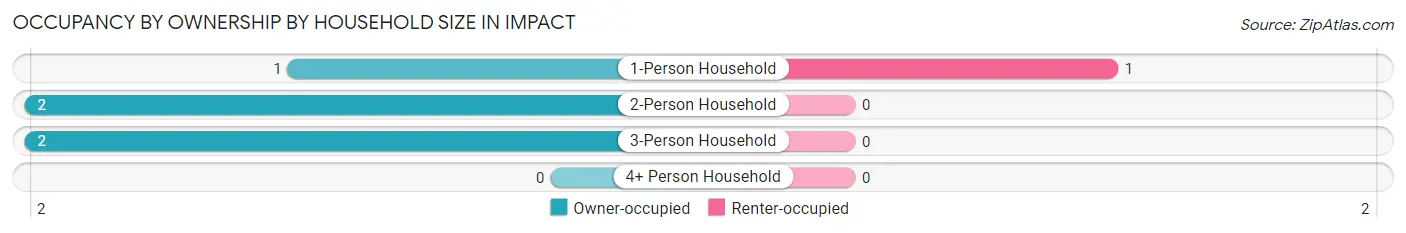
Occupancy by Ownership by Household Size in Impact
Household Size
Owner-occupied
Renter-occupied
1-Person Household
1 (50.0%)
1 (50.0%)
2-Person Household
2 (100.0%)
0 (0.0%)
3-Person Household
2 (100.0%)
0 (0.0%)
4+ Person Household
0 (0.0%)
0 (0.0%)
Total Housing Units
5 (83.3%)
1 (16.7%)
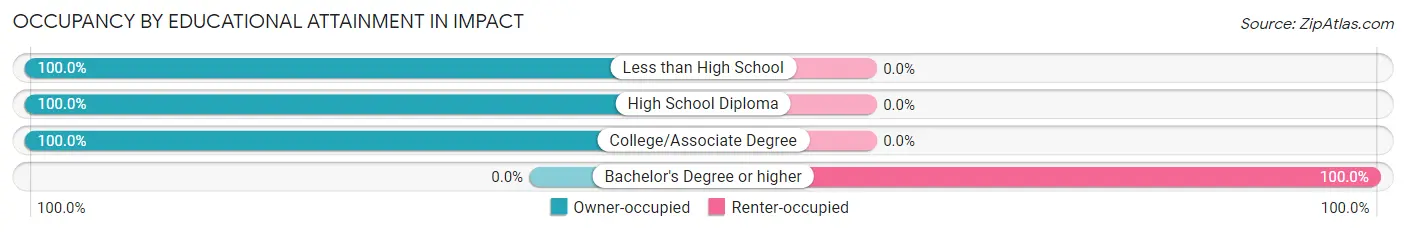
Occupancy by Educational Attainment in Impact
Household Size
Owner-occupied
Renter-occupied
Less than High School
2 (100.0%)
0 (0.0%)
High School Diploma
1 (100.0%)
0 (0.0%)
College/Associate Degree
2 (100.0%)
0 (0.0%)
Bachelor's Degree or higher
0 (0.0%)
1 (100.0%)
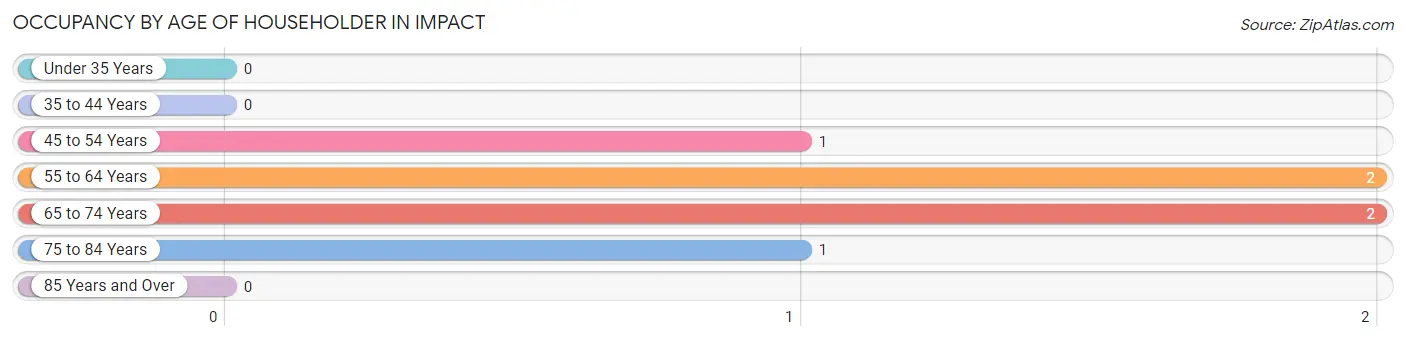
Occupancy by Age of Householder in Impact
Age Bracket
# Households
% Households
Under 35 Years
0
0.0%
35 to 44 Years
0
0.0%
45 to 54 Years
1
16.7%
55 to 64 Years
2
33.3%
65 to 74 Years
2
33.3%
75 to 84 Years
1
16.7%
85 Years and Over
0
0.0%
Total
6
100.0%
Housing Finances in Impact
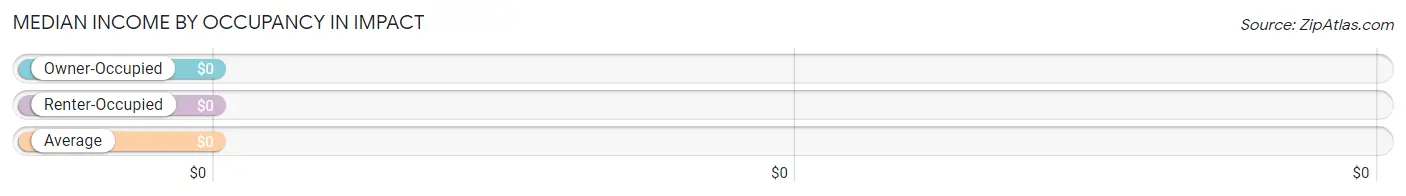
Median Income by Occupancy in Impact
Occupancy Type
# Households
Median Income
Owner-Occupied
5 (83.3%)
$0
Renter-Occupied
1 (16.7%)
$0
Average
6 (100.0%)
$0
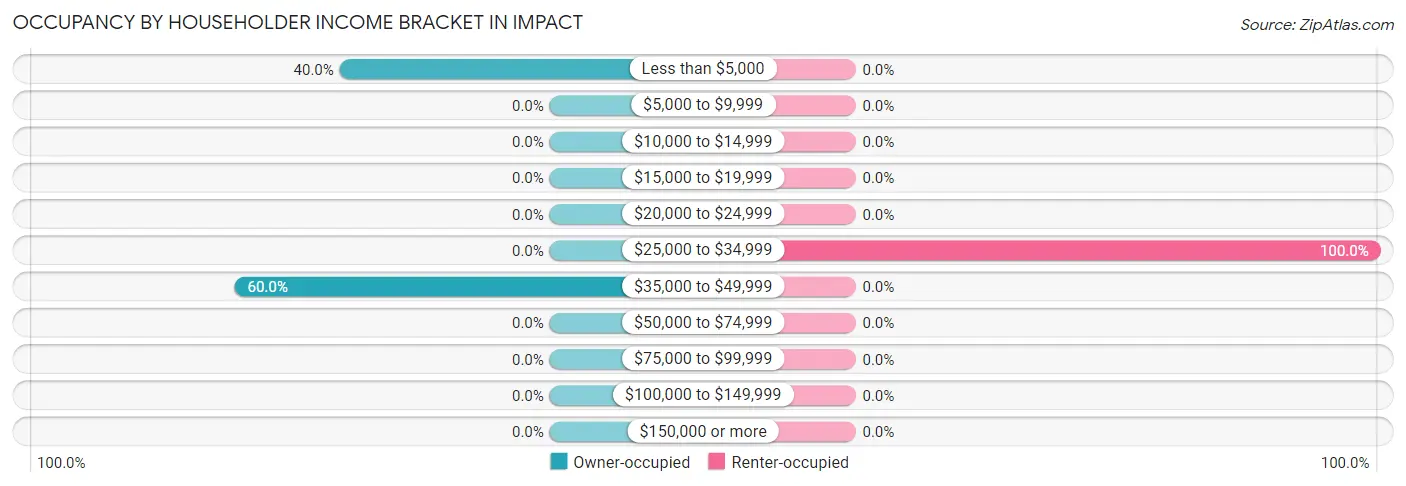
Occupancy by Householder Income Bracket in Impact
Income Bracket
Owner-occupied
Renter-occupied
Less than $5,000
2 (40.0%)
0 (0.0%)
$5,000 to $9,999
0 (0.0%)
0 (0.0%)
$10,000 to $14,999
0 (0.0%)
0 (0.0%)
$15,000 to $19,999
0 (0.0%)
0 (0.0%)
$20,000 to $24,999
0 (0.0%)
0 (0.0%)
$25,000 to $34,999
0 (0.0%)
1 (100.0%)
$35,000 to $49,999
3 (60.0%)
0 (0.0%)
$50,000 to $74,999
0 (0.0%)
0 (0.0%)
$75,000 to $99,999
0 (0.0%)
0 (0.0%)
$100,000 to $149,999
0 (0.0%)
0 (0.0%)
$150,000 or more
0 (0.0%)
0 (0.0%)
Total
5 (100.0%)
1 (100.0%)
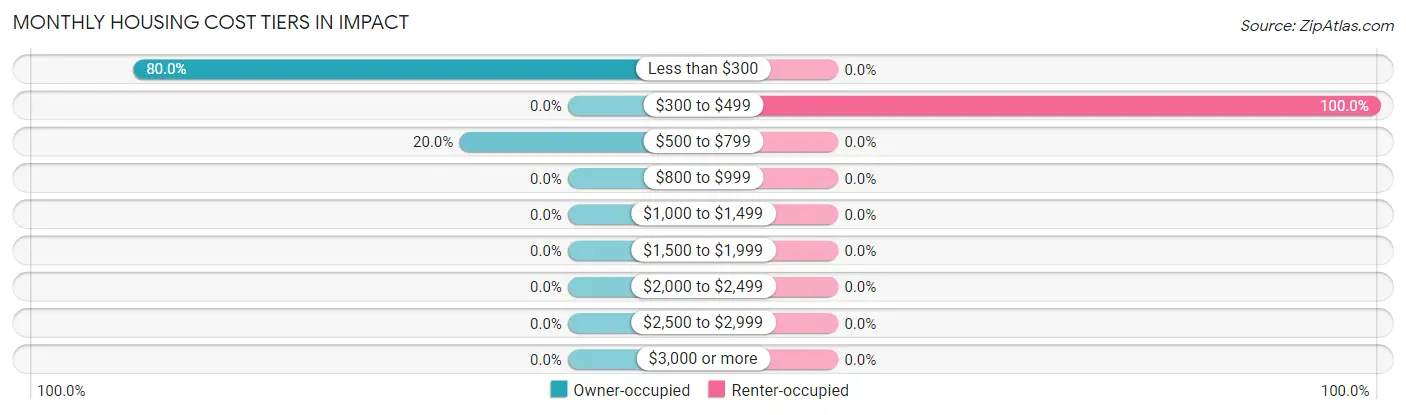
Monthly Housing Cost Tiers in Impact
Monthly Cost
Owner-occupied
Renter-occupied
Less than $300
4 (80.0%)
0 (0.0%)
$300 to $499
0 (0.0%)
1 (100.0%)
$500 to $799
1 (20.0%)
0 (0.0%)
$800 to $999
0 (0.0%)
0 (0.0%)
$1,000 to $1,499
0 (0.0%)
0 (0.0%)
$1,500 to $1,999
0 (0.0%)
0 (0.0%)
$2,000 to $2,499
0 (0.0%)
0 (0.0%)
$2,500 to $2,999
0 (0.0%)
0 (0.0%)
$3,000 or more
0 (0.0%)
0 (0.0%)
Total
5 (100.0%)
1 (100.0%)
Physical Housing Characteristics in Impact
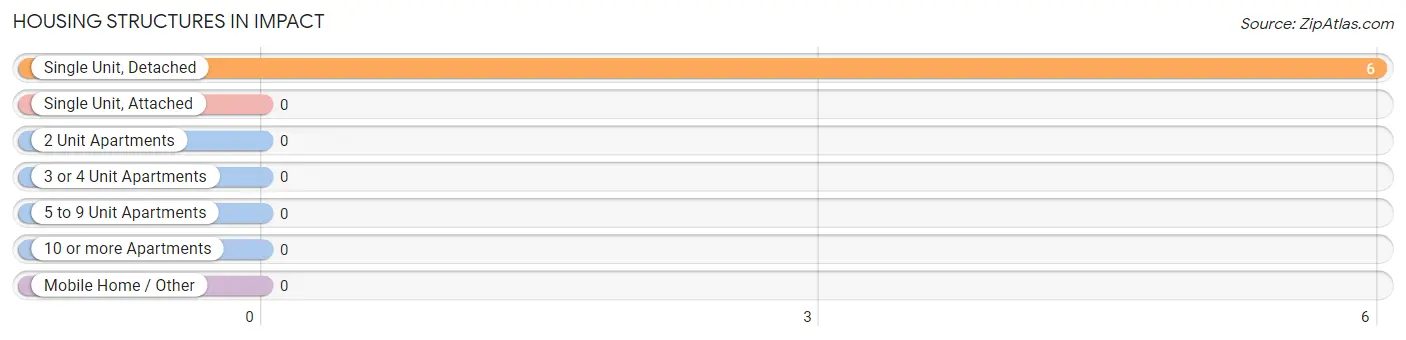
Housing Structures in Impact
Structure Type
# Housing Units
% Housing Units
Single Unit, Detached
6
100.0%
Single Unit, Attached
0
0.0%
2 Unit Apartments
0
0.0%
3 or 4 Unit Apartments
0
0.0%
5 to 9 Unit Apartments
0
0.0%
10 or more Apartments
0
0.0%
Mobile Home / Other
0
0.0%
Total
6
100.0%
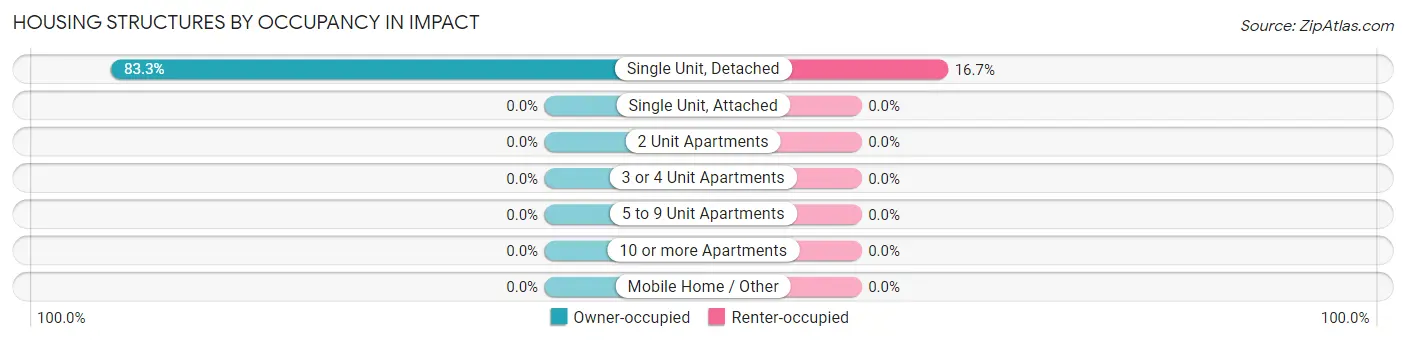
Housing Structures by Occupancy in Impact
Structure Type
Owner-occupied
Renter-occupied
Single Unit, Detached
5 (83.3%)
1 (16.7%)
Single Unit, Attached
0 (0.0%)
0 (0.0%)
2 Unit Apartments
0 (0.0%)
0 (0.0%)
3 or 4 Unit Apartments
0 (0.0%)
0 (0.0%)
5 to 9 Unit Apartments
0 (0.0%)
0 (0.0%)
10 or more Apartments
0 (0.0%)
0 (0.0%)
Mobile Home / Other
0 (0.0%)
0 (0.0%)
Total
5 (83.3%)
1 (16.7%)
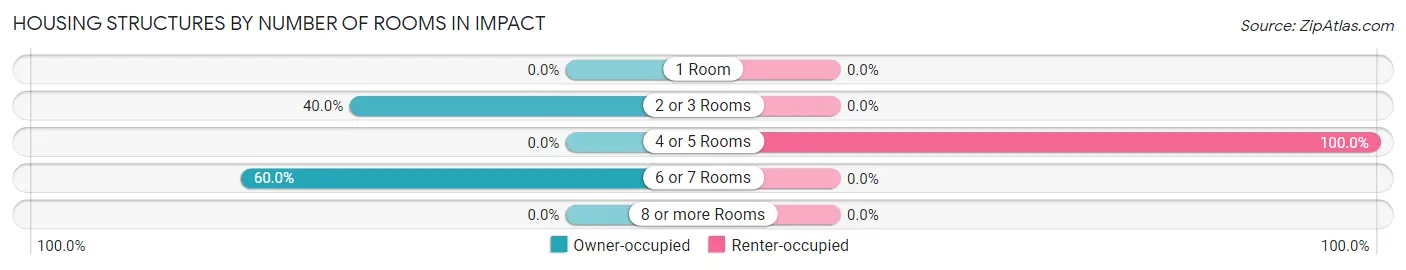
Housing Structures by Number of Rooms in Impact
Number of Rooms
Owner-occupied
Renter-occupied
1 Room
0 (0.0%)
0 (0.0%)
2 or 3 Rooms
2 (40.0%)
0 (0.0%)
4 or 5 Rooms
0 (0.0%)
1 (100.0%)
6 or 7 Rooms
3 (60.0%)
0 (0.0%)
8 or more Rooms
0 (0.0%)
0 (0.0%)
Total
5 (100.0%)
1 (100.0%)
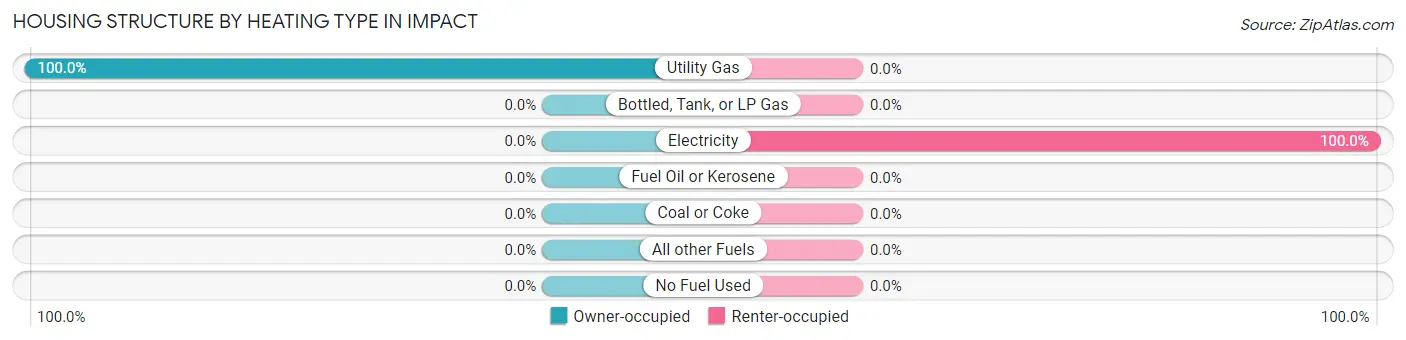
Housing Structure by Heating Type in Impact
Heating Type
Owner-occupied
Renter-occupied
Utility Gas
5 (100.0%)
0 (0.0%)
Bottled, Tank, or LP Gas
0 (0.0%)
0 (0.0%)
Electricity
0 (0.0%)
1 (100.0%)
Fuel Oil or Kerosene
0 (0.0%)
0 (0.0%)
Coal or Coke
0 (0.0%)
0 (0.0%)
All other Fuels
0 (0.0%)
0 (0.0%)
No Fuel Used
0 (0.0%)
0 (0.0%)
Total
5 (100.0%)
1 (100.0%)
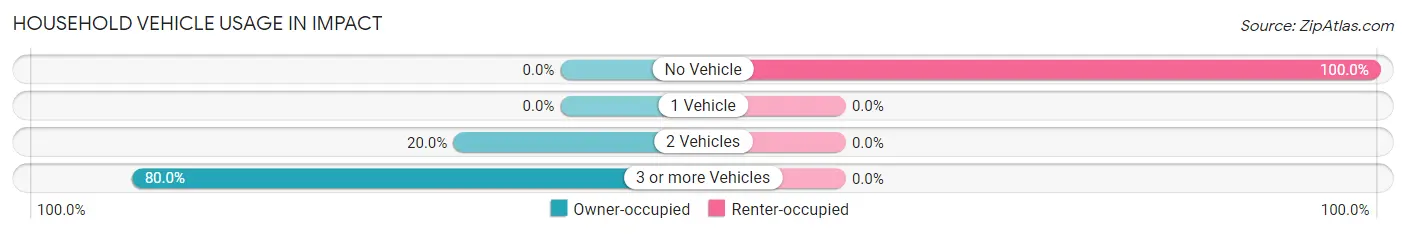
Household Vehicle Usage in Impact
Vehicles per Household
Owner-occupied
Renter-occupied
No Vehicle
0 (0.0%)
1 (100.0%)
1 Vehicle
0 (0.0%)
0 (0.0%)
2 Vehicles
1 (20.0%)
0 (0.0%)
3 or more Vehicles
4 (80.0%)
0 (0.0%)
Total
5 (100.0%)
1 (100.0%)
Real Estate & Mortgages in Impact
Real Estate and Mortgage Overview in Impact
Characteristic
Without Mortgage
With Mortgage
Housing Units
5
0
Median Property Value
-
-
Median Household Income
-
-
Monthly Housing Costs
$281
$0
Real Estate Taxes
$199
$0
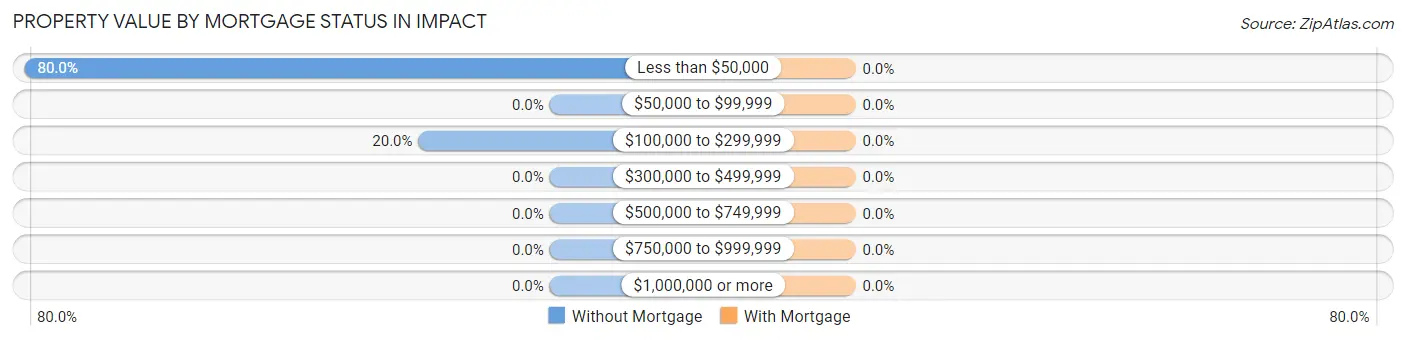
Property Value by Mortgage Status in Impact
Property Value
Without Mortgage
With Mortgage
Less than $50,000
4 (80.0%)
0 (0.0%)
$50,000 to $99,999
0 (0.0%)
0 (0.0%)
$100,000 to $299,999
1 (20.0%)
0 (0.0%)
$300,000 to $499,999
0 (0.0%)
0 (0.0%)
$500,000 to $749,999
0 (0.0%)
0 (0.0%)
$750,000 to $999,999
0 (0.0%)
0 (0.0%)
$1,000,000 or more
0 (0.0%)
0 (0.0%)
Total
5 (100.0%)
0 (0.0%)
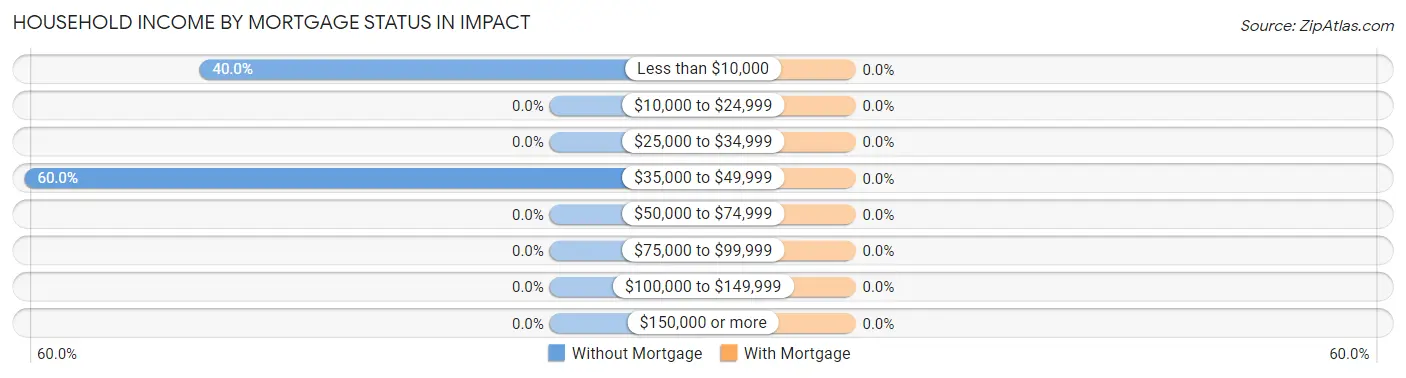
Household Income by Mortgage Status in Impact
Household Income
Without Mortgage
With Mortgage
Less than $10,000
2 (40.0%)
0 (0.0%)
$10,000 to $24,999
0 (0.0%)
0 (0.0%)
$25,000 to $34,999
0 (0.0%)
0 (0.0%)
$35,000 to $49,999
3 (60.0%)
0 (0.0%)
$50,000 to $74,999
0 (0.0%)
0 (0.0%)
$75,000 to $99,999
0 (0.0%)
0 (0.0%)
$100,000 to $149,999
0 (0.0%)
0 (0.0%)
$150,000 or more
0 (0.0%)
0 (0.0%)
Total
5 (100.0%)
0 (0.0%)
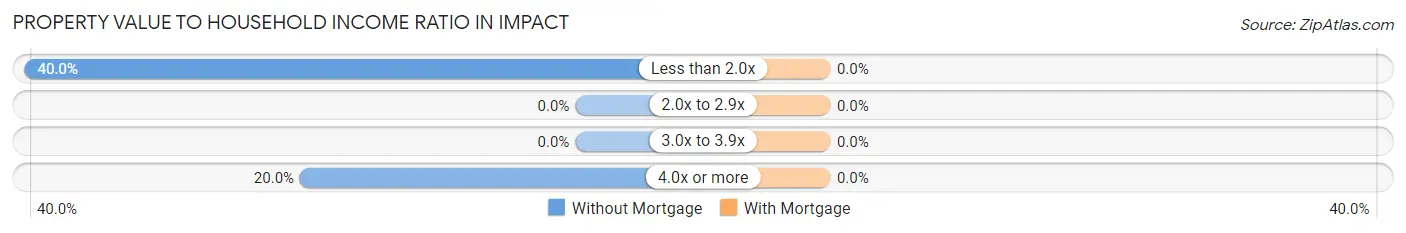
Property Value to Household Income Ratio in Impact
Value-to-Income Ratio
Without Mortgage
With Mortgage
Less than 2.0x
2 (40.0%)
0 (0.0%)
2.0x to 2.9x
0 (0.0%)
0 (0.0%)
3.0x to 3.9x
0 (0.0%)
0 (0.0%)
4.0x or more
1 (20.0%)
0 (0.0%)
Total
5 (100.0%)
0 (0.0%)
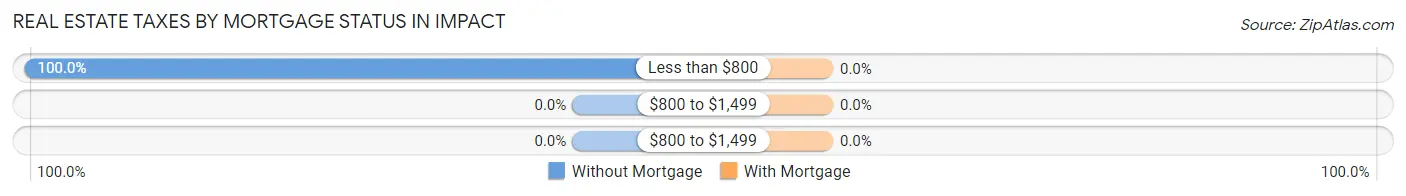
Real Estate Taxes by Mortgage Status in Impact
Property Taxes
Without Mortgage
With Mortgage
Less than $800
5 (100.0%)
0 (0.0%)
$800 to $1,499
0 (0.0%)
0 (0.0%)
$800 to $1,499
0 (0.0%)
0 (0.0%)
Total
5 (100.0%)
0 (0.0%)
Health & Disability in Impact
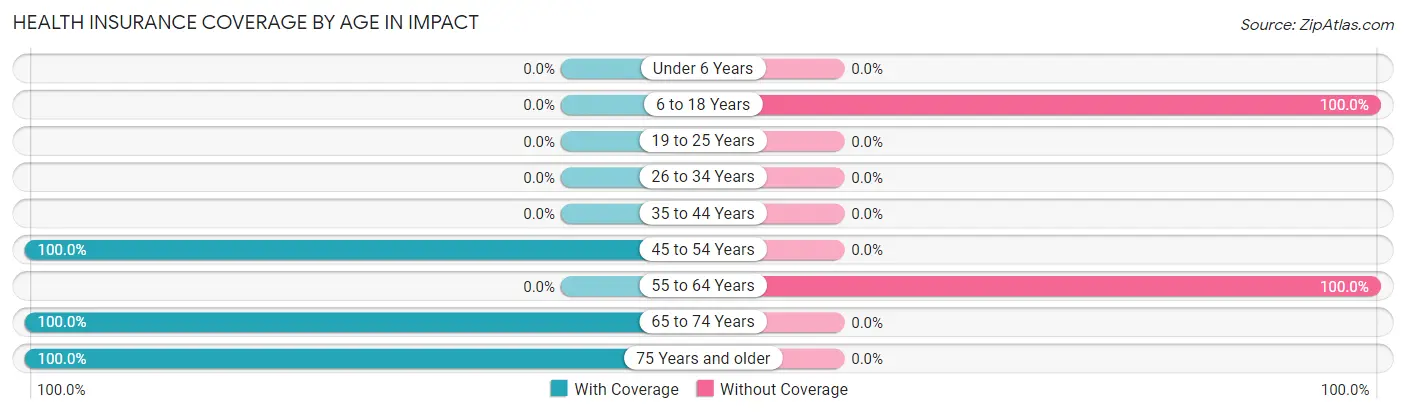
Health Insurance Coverage by Age in Impact
Age Bracket
With Coverage
Without Coverage
Under 6 Years
0 (0.0%)
0 (0.0%)
6 to 18 Years
0 (0.0%)
2 (100.0%)
19 to 25 Years
0 (0.0%)
0 (0.0%)
26 to 34 Years
0 (0.0%)
0 (0.0%)
35 to 44 Years
0 (0.0%)
0 (0.0%)
45 to 54 Years
1 (100.0%)
0 (0.0%)
55 to 64 Years
0 (0.0%)
4 (100.0%)
65 to 74 Years
2 (100.0%)
0 (0.0%)
75 Years and older
3 (100.0%)
0 (0.0%)
Total
6 (50.0%)
6 (50.0%)
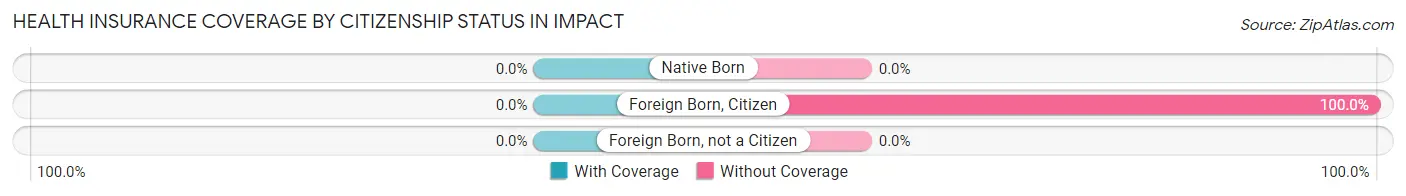
Health Insurance Coverage by Citizenship Status in Impact
Citizenship Status
With Coverage
Without Coverage
Native Born
0 (0.0%)
0 (0.0%)
Foreign Born, Citizen
0 (0.0%)
2 (100.0%)
Foreign Born, not a Citizen
0 (0.0%)
0 (0.0%)
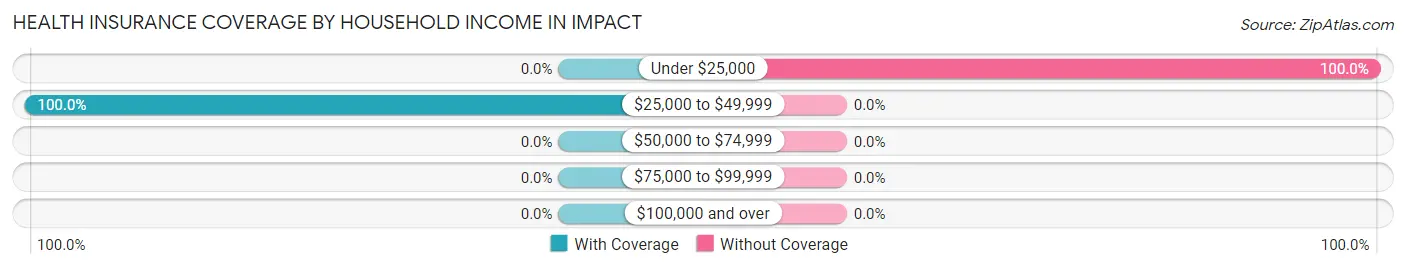
Health Insurance Coverage by Household Income in Impact
Household Income
With Coverage
Without Coverage
Under $25,000
0 (0.0%)
6 (100.0%)
$25,000 to $49,999
6 (100.0%)
0 (0.0%)
$50,000 to $74,999
0 (0.0%)
0 (0.0%)
$75,000 to $99,999
0 (0.0%)
0 (0.0%)
$100,000 and over
0 (0.0%)
0 (0.0%)
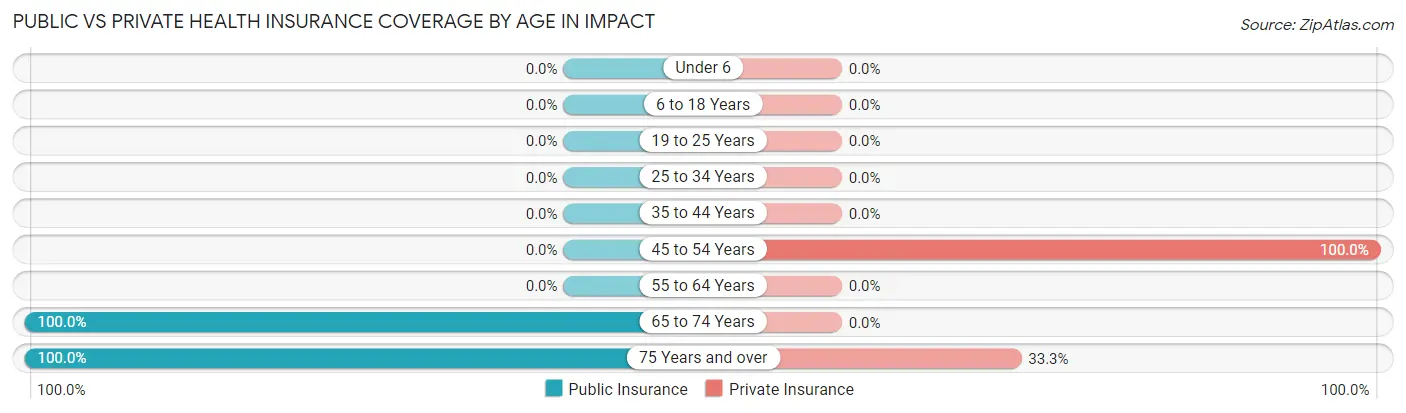
Public vs Private Health Insurance Coverage by Age in Impact
Age Bracket
Public Insurance
Private Insurance
Under 6
0 (0.0%)
0 (0.0%)
6 to 18 Years
0 (0.0%)
0 (0.0%)
19 to 25 Years
0 (0.0%)
0 (0.0%)
25 to 34 Years
0 (0.0%)
0 (0.0%)
35 to 44 Years
0 (0.0%)
0 (0.0%)
45 to 54 Years
0 (0.0%)
1 (100.0%)
55 to 64 Years
0 (0.0%)
0 (0.0%)
65 to 74 Years
2 (100.0%)
0 (0.0%)
75 Years and over
3 (100.0%)
1 (33.3%)
Total
5 (41.7%)
2 (16.7%)
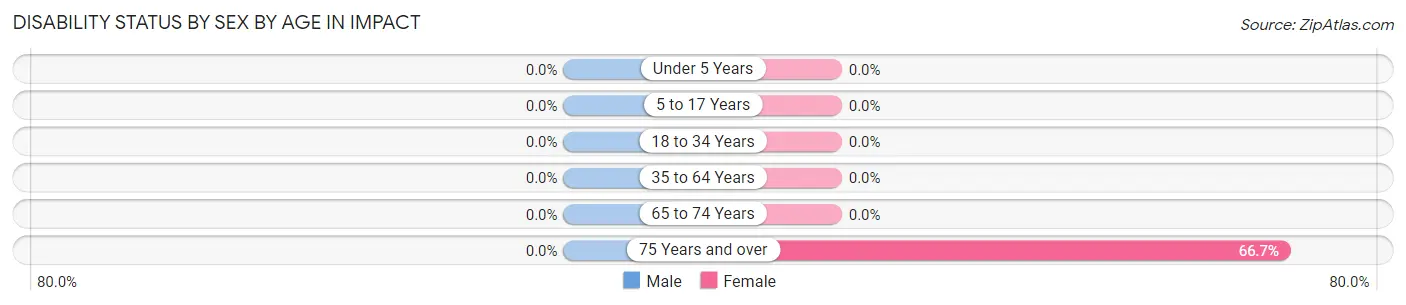
Disability Status by Sex by Age in Impact
Age Bracket
Male
Female
Under 5 Years
0 (0.0%)
0 (0.0%)
5 to 17 Years
0 (0.0%)
0 (0.0%)
18 to 34 Years
0 (0.0%)
0 (0.0%)
35 to 64 Years
0 (0.0%)
0 (0.0%)
65 to 74 Years
0 (0.0%)
0 (0.0%)
75 Years and over
0 (0.0%)
2 (66.7%)
Disability Class by Sex by Age in Impact
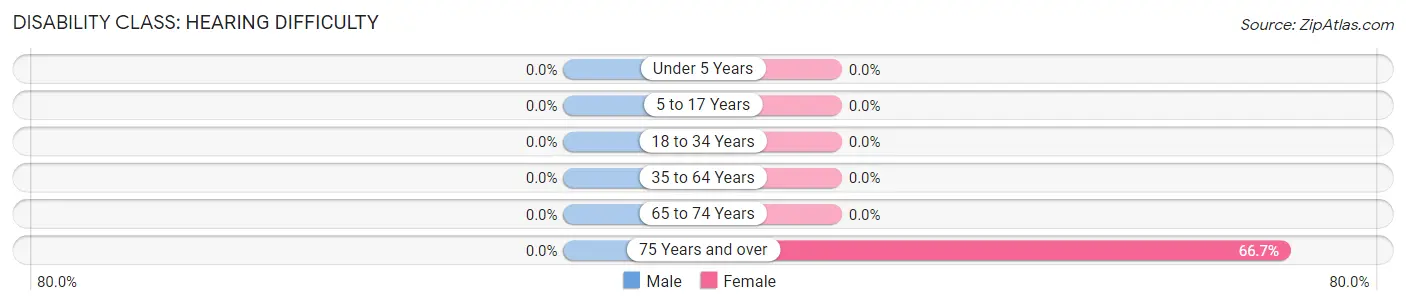
Disability Class: Hearing Difficulty
Age Bracket
Male
Female
Under 5 Years
0 (0.0%)
0 (0.0%)
5 to 17 Years
0 (0.0%)
0 (0.0%)
18 to 34 Years
0 (0.0%)
0 (0.0%)
35 to 64 Years
0 (0.0%)
0 (0.0%)
65 to 74 Years
0 (0.0%)
0 (0.0%)
75 Years and over
0 (0.0%)
2 (66.7%)
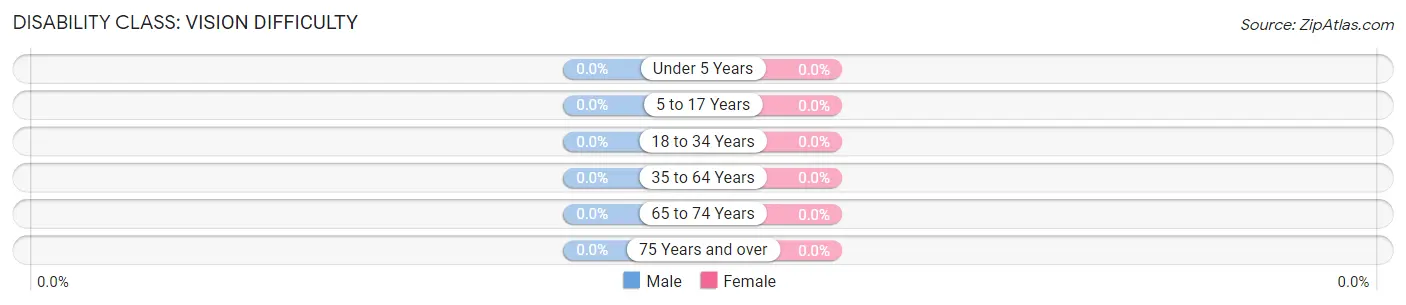
Disability Class: Vision Difficulty
Age Bracket
Male
Female
Under 5 Years
0 (0.0%)
0 (0.0%)
5 to 17 Years
0 (0.0%)
0 (0.0%)
18 to 34 Years
0 (0.0%)
0 (0.0%)
35 to 64 Years
0 (0.0%)
0 (0.0%)
65 to 74 Years
0 (0.0%)
0 (0.0%)
75 Years and over
0 (0.0%)
0 (0.0%)
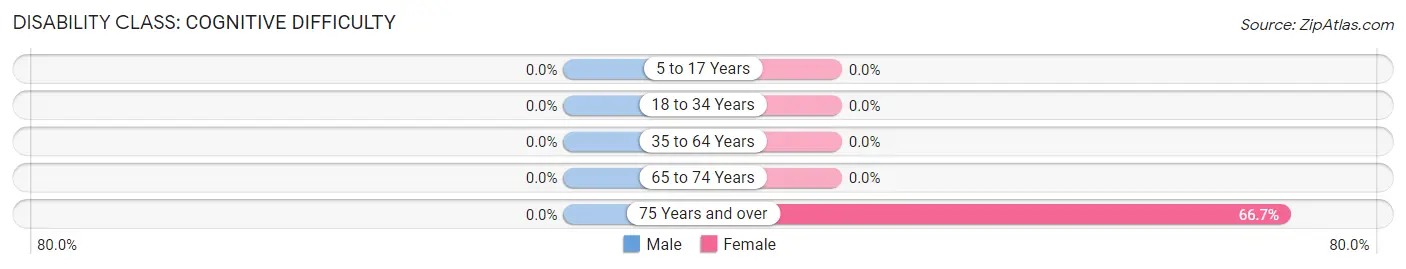
Disability Class: Cognitive Difficulty
Age Bracket
Male
Female
5 to 17 Years
0 (0.0%)
0 (0.0%)
18 to 34 Years
0 (0.0%)
0 (0.0%)
35 to 64 Years
0 (0.0%)
0 (0.0%)
65 to 74 Years
0 (0.0%)
0 (0.0%)
75 Years and over
0 (0.0%)
2 (66.7%)
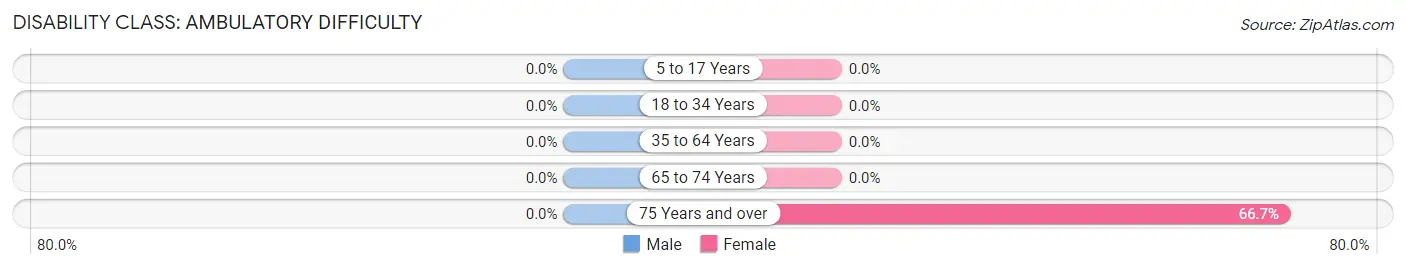
Disability Class: Ambulatory Difficulty
Age Bracket
Male
Female
5 to 17 Years
0 (0.0%)
0 (0.0%)
18 to 34 Years
0 (0.0%)
0 (0.0%)
35 to 64 Years
0 (0.0%)
0 (0.0%)
65 to 74 Years
0 (0.0%)
0 (0.0%)
75 Years and over
0 (0.0%)
2 (66.7%)
Disability Class: Self-Care Difficulty
Age Bracket
Male
Female
5 to 17 Years
0 (0.0%)
0 (0.0%)
18 to 34 Years
0 (0.0%)
0 (0.0%)
35 to 64 Years
0 (0.0%)
0 (0.0%)
65 to 74 Years
0 (0.0%)
0 (0.0%)
75 Years and over
0 (0.0%)
0 (0.0%)
Technology Access in Impact
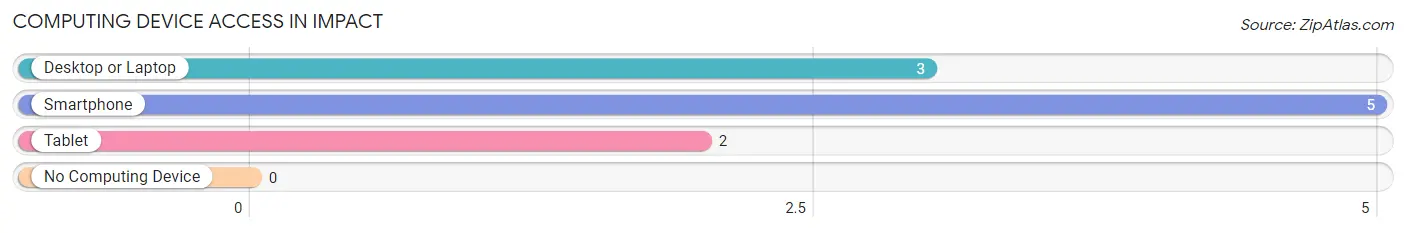
Computing Device Access in Impact
Device Type
# Households
% Households
Desktop or Laptop
3
50.0%
Smartphone
5
83.3%
Tablet
2
33.3%
No Computing Device
0
0.0%
Total
6
100.0%
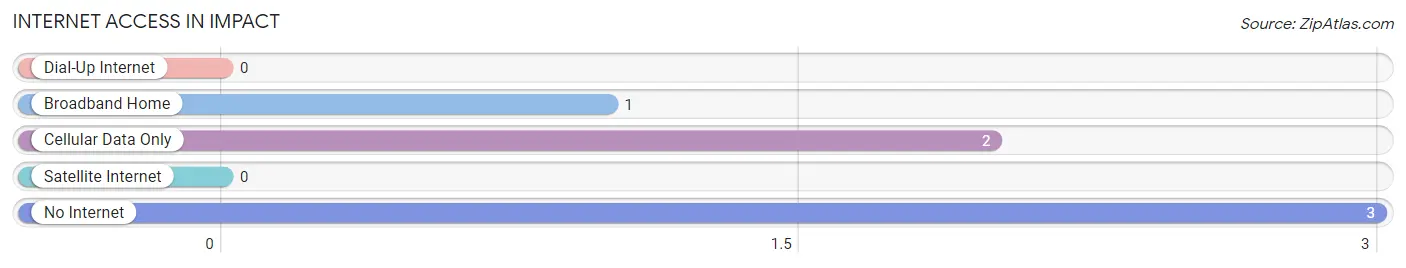
Internet Access in Impact
Internet Type
# Households
% Households
Dial-Up Internet
0
0.0%
Broadband Home
1
16.7%
Cellular Data Only
2
33.3%
Satellite Internet
0
0.0%
No Internet
3
50.0%
Total
6
100.0%
Impact Summary
Impact, Texas is a small unincorporated community located in the western part of the state, in the county of El Paso. It is situated on the banks of the Rio Grande, just south of the city of El Paso. The population of Impact, Texas was estimated to be around 200 people in the year 2000.
Geography
Impact, Texas is located in the western part of the state, in the county of El Paso. It is situated on the banks of the Rio Grande, just south of the city of El Paso. The terrain of the area is mostly flat, with some rolling hills. The climate is semi-arid, with hot summers and mild winters. The average annual precipitation is around 10 inches.
Economy
The economy of Impact, Texas is largely based on agriculture. The main crops grown in the area are cotton, corn, and wheat. Livestock production is also important, with cattle and sheep being the main animals raised. There are also some small businesses in the area, such as convenience stores, auto repair shops, and restaurants.
Demographics
The population of Impact, Texas was estimated to be around 200 people in the year 2000. The racial makeup of the town was predominantly Hispanic, with around 90% of the population being of Hispanic origin. The median household income was estimated to be around $25,000. The unemployment rate was estimated to be around 10%.
History
Impact, Texas was founded in the late 19th century by a group of Mexican settlers. The town was originally called “La Impacta”, which means “the impact” in Spanish. The name was chosen to reflect the impact that the settlers had on the area. The town grew slowly over the years, and by the early 20th century, it had become a small farming community.
In the late 20th century, Impact, Texas began to experience a population boom, as many people from Mexico and other parts of Latin America moved to the area. This influx of people has helped to diversify the population and economy of the town.
Conclusion
Impact, Texas is a small unincorporated community located in the western part of the state, in the county of El Paso. It is situated on the banks of the Rio Grande, just south of the city of El Paso. The population of Impact, Texas was estimated to be around 200 people in the year 2000. The economy of Impact, Texas is largely based on agriculture, with some small businesses also present. The racial makeup of the town was predominantly Hispanic, with around 90% of the population being of Hispanic origin. The median household income was estimated to be around $25,000. Impact, Texas has a long and interesting history, and it continues to be an important part of the El Paso area.
Common Questions
What is the Total Population of Impact?
Total Population of Impact is 12.
What is the Total Male Population of Impact?
Total Male Population of Impact is 5.
What is the Total Female Population of Impact?
Total Female Population of Impact is 7.
What is the Ratio of Males per 100 Females in Impact?
There are 71.43 Males per 100 Females in Impact.
What is the Ratio of Females per 100 Males in Impact?
There are 140.00 Females per 100 Males in Impact.
What is the Median Population Age in Impact?
Median Population Age in Impact is 62.5 Years.
What is the Average Family Size in Impact
Average Family Size in Impact is 2.5 People.
What is the Average Household Size in Impact
Average Household Size in Impact is 2.0 People.
What is Per Capita Income in Impact?
Per Capita income in Impact is $12,183.
What is Inequality or Gini Index in Impact?
Inequality or Gini Index in Impact is 0.38.
Report Title
Report Link
HTML Copy & Paste Link
Social Media
Copy and paste the folowing code into any webpage where you would like this interactive chart to display