Falfurrias, TX
Falfurrias Map
Falfurrias Overview
4,348
TOTAL POPULATION
1,813
MALE POPULATION
2,535
FEMALE POPULATION
71.52
MALES / 100 FEMALES
139.82
FEMALES / 100 MALES
38.8
MEDIAN AGE
3.3
AVG FAMILY SIZE
2.4
AVG HOUSEHOLD SIZE
$20,797
PER CAPITA INCOME
$39,421
AVG FAMILY INCOME
$31,275
AVG HOUSEHOLD INCOME
0.51
INEQUALITY / GINI INDEX
2,067
LABOR FORCE [ PEOPLE ]
59.0%
PERCENT IN LABOR FORCE
0.6%
UNEMPLOYMENT RATE
Falfurrias Zip Codes
Falfurrias Area Codes
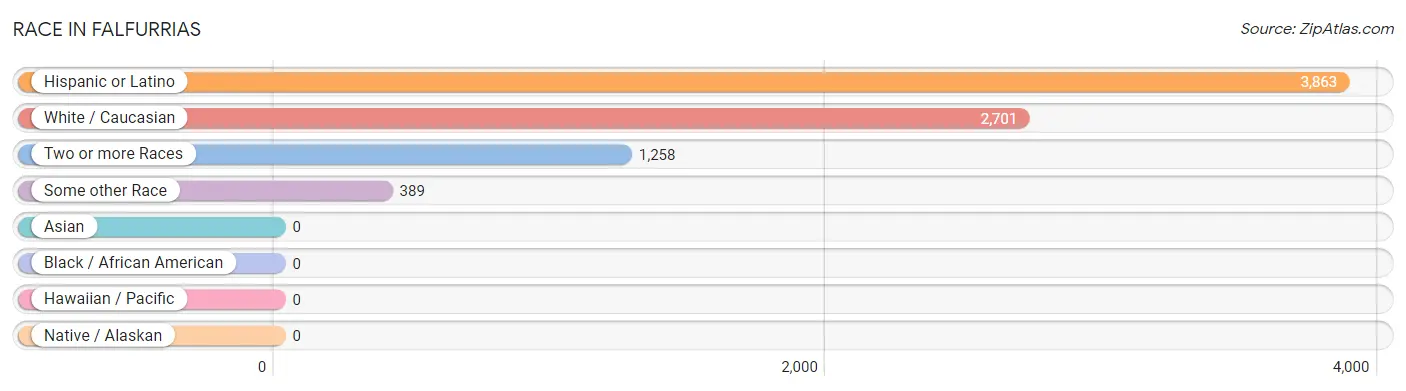
Race in Falfurrias
The most populous races in Falfurrias are Hispanic or Latino (3,863 | 88.8%), White / Caucasian (2,701 | 62.1%), and Two or more Races (1,258 | 28.9%).
| Race | # Population | % Population |
| Asian | 0 | 0.0% |
| Black / African American | 0 | 0.0% |
| Hawaiian / Pacific | 0 | 0.0% |
| Hispanic or Latino | 3,863 | 88.8% |
| Native / Alaskan | 0 | 0.0% |
| White / Caucasian | 2,701 | 62.1% |
| Two or more Races | 1,258 | 28.9% |
| Some other Race | 389 | 8.9% |
| Total | 4,348 | 100.0% |
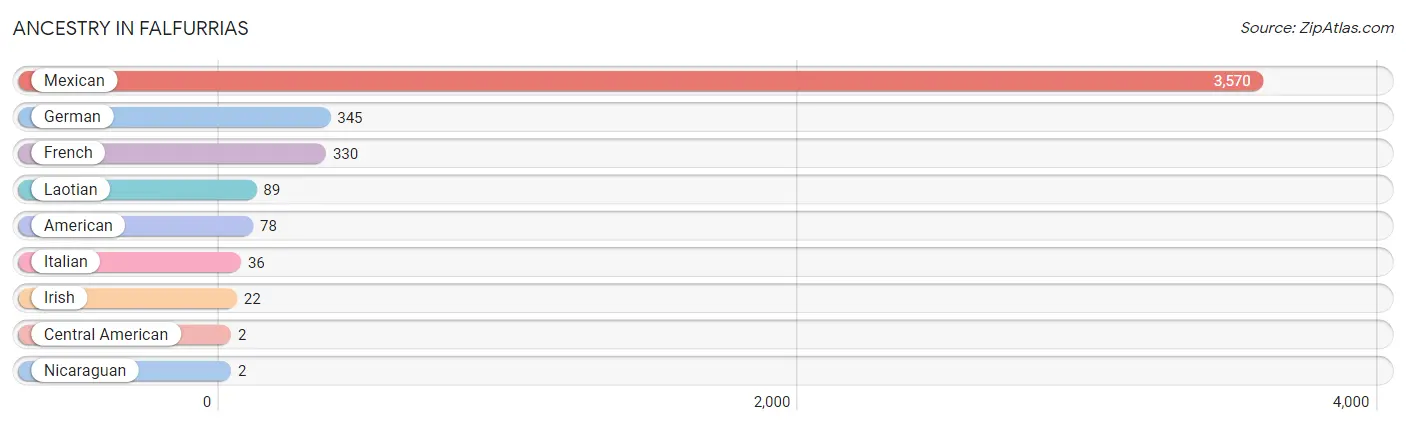
Ancestry in Falfurrias
The most populous ancestries reported in Falfurrias are Mexican (3,570 | 82.1%), German (345 | 7.9%), French (330 | 7.6%), Laotian (89 | 2.1%), and American (78 | 1.8%), together accounting for 101.5% of all Falfurrias residents.
| Ancestry | # Population | % Population |
| American | 78 | 1.8% |
| Central American | 2 | 0.1% |
| French | 330 | 7.6% |
| German | 345 | 7.9% |
| Irish | 22 | 0.5% |
| Italian | 36 | 0.8% |
| Laotian | 89 | 2.1% |
| Mexican | 3,570 | 82.1% |
| Nicaraguan | 2 | 0.1% | View All 9 Rows |
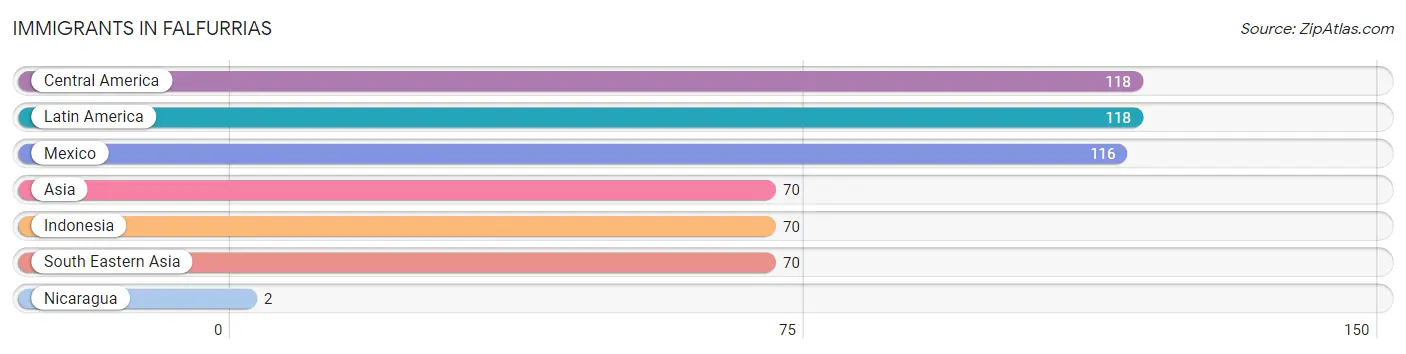
Immigrants in Falfurrias
The most numerous immigrant groups reported in Falfurrias came from Central America (118 | 2.7%), Latin America (118 | 2.7%), Mexico (116 | 2.7%), Asia (70 | 1.6%), and Indonesia (70 | 1.6%), together accounting for 11.3% of all Falfurrias residents.
| Immigration Origin | # Population | % Population |
| Asia | 70 | 1.6% |
| Central America | 118 | 2.7% |
| Indonesia | 70 | 1.6% |
| Latin America | 118 | 2.7% |
| Mexico | 116 | 2.7% |
| Nicaragua | 2 | 0.1% |
| South Eastern Asia | 70 | 1.6% | View All 7 Rows |
Sex and Age in Falfurrias
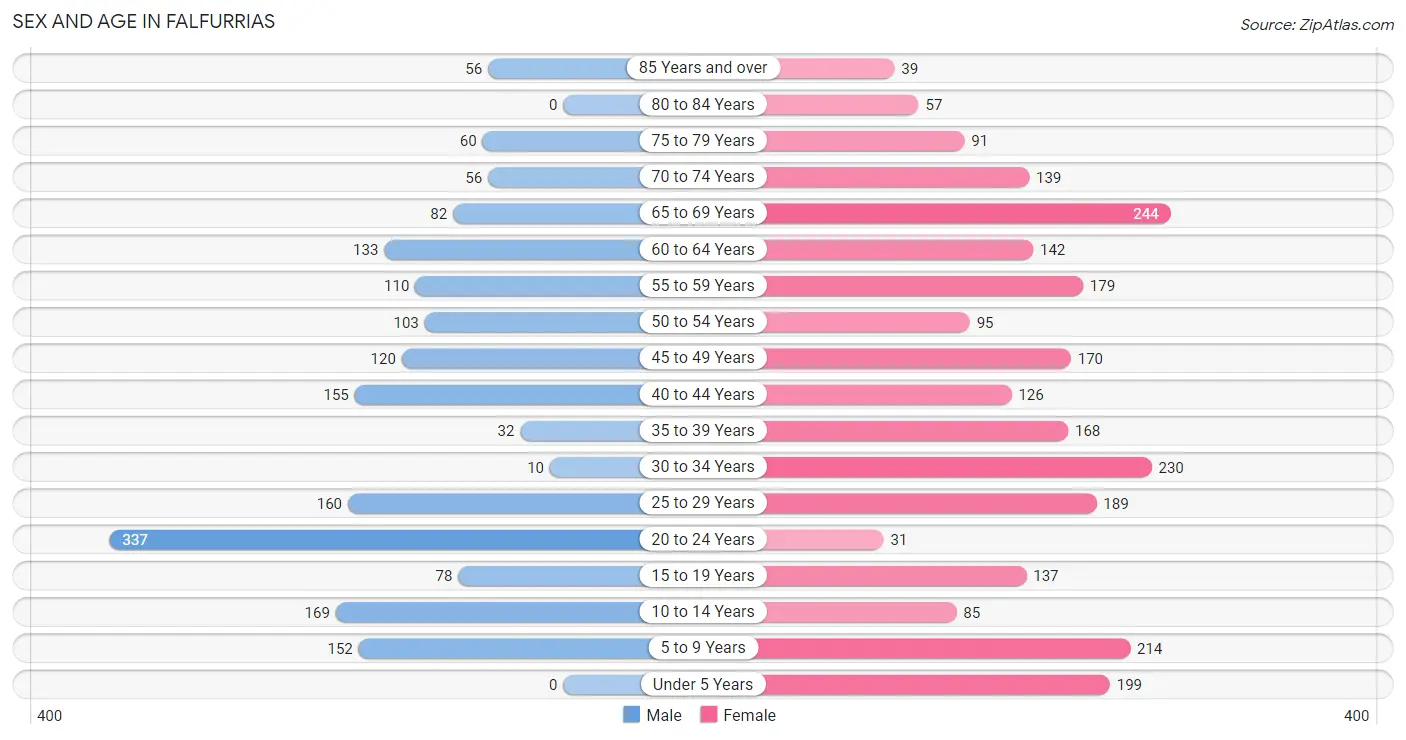
Sex and Age in Falfurrias
The most populous age groups in Falfurrias are 20 to 24 Years (337 | 18.6%) for men and 65 to 69 Years (244 | 9.6%) for women.
| Age Bracket | Male | Female |
| Under 5 Years | 0 (0.0%) | 199 (7.9%) |
| 5 to 9 Years | 152 (8.4%) | 214 (8.4%) |
| 10 to 14 Years | 169 (9.3%) | 85 (3.4%) |
| 15 to 19 Years | 78 (4.3%) | 137 (5.4%) |
| 20 to 24 Years | 337 (18.6%) | 31 (1.2%) |
| 25 to 29 Years | 160 (8.8%) | 189 (7.5%) |
| 30 to 34 Years | 10 (0.5%) | 230 (9.1%) |
| 35 to 39 Years | 32 (1.8%) | 168 (6.6%) |
| 40 to 44 Years | 155 (8.6%) | 126 (5.0%) |
| 45 to 49 Years | 120 (6.6%) | 170 (6.7%) |
| 50 to 54 Years | 103 (5.7%) | 95 (3.7%) |
| 55 to 59 Years | 110 (6.1%) | 179 (7.1%) |
| 60 to 64 Years | 133 (7.3%) | 142 (5.6%) |
| 65 to 69 Years | 82 (4.5%) | 244 (9.6%) |
| 70 to 74 Years | 56 (3.1%) | 139 (5.5%) |
| 75 to 79 Years | 60 (3.3%) | 91 (3.6%) |
| 80 to 84 Years | 0 (0.0%) | 57 (2.2%) |
| 85 Years and over | 56 (3.1%) | 39 (1.5%) |
| Total | 1,813 (100.0%) | 2,535 (100.0%) |
Families and Households in Falfurrias
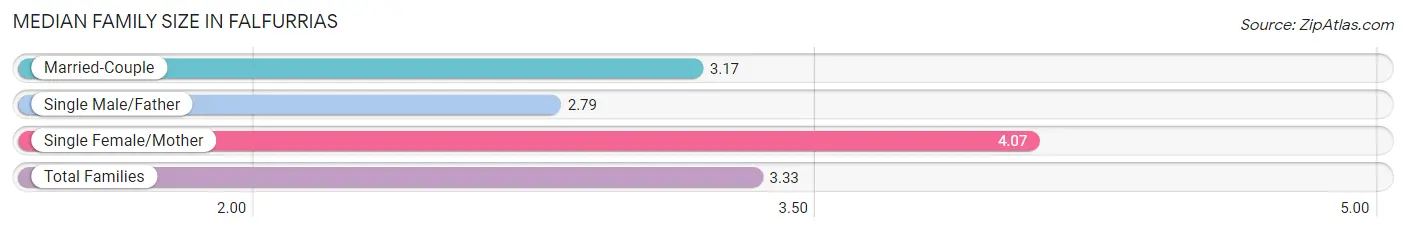
Median Family Size in Falfurrias
The median family size in Falfurrias is 3.33 persons per family, with single female/mother families (208 | 20.7%) accounting for the largest median family size of 4.07 persons per family. On the other hand, single male/father families (71 | 7.0%) represent the smallest median family size with 2.79 persons per family.
| Family Type | # Families | Family Size |
| Married-Couple | 728 (72.3%) | 3.17 |
| Single Male/Father | 71 (7.0%) | 2.79 |
| Single Female/Mother | 208 (20.7%) | 4.07 |
| Total Families | 1,007 (100.0%) | 3.33 |
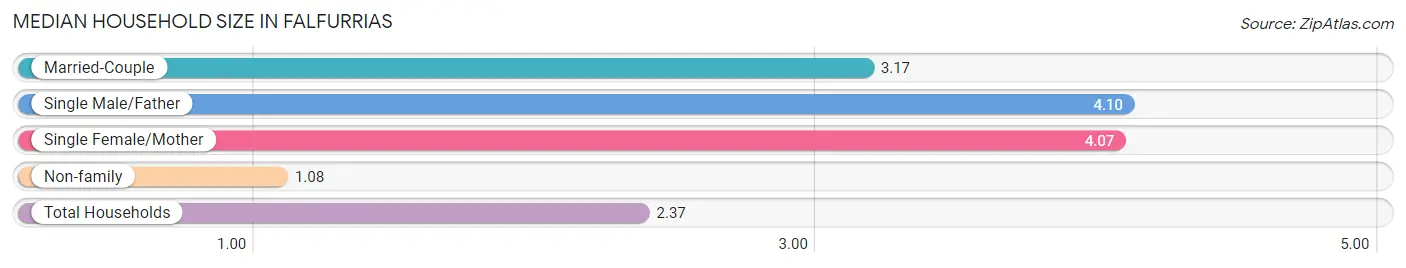
Median Household Size in Falfurrias
The median household size in Falfurrias is 2.37 persons per household, with single male/father households (71 | 3.9%) accounting for the largest median household size of 4.1 persons per household. non-family households (818 | 44.8%) represent the smallest median household size with 1.08 persons per household.
| Household Type | # Households | Household Size |
| Married-Couple | 728 (39.9%) | 3.17 |
| Single Male/Father | 71 (3.9%) | 4.10 |
| Single Female/Mother | 208 (11.4%) | 4.07 |
| Non-family | 818 (44.8%) | 1.08 |
| Total Households | 1,825 (100.0%) | 2.37 |
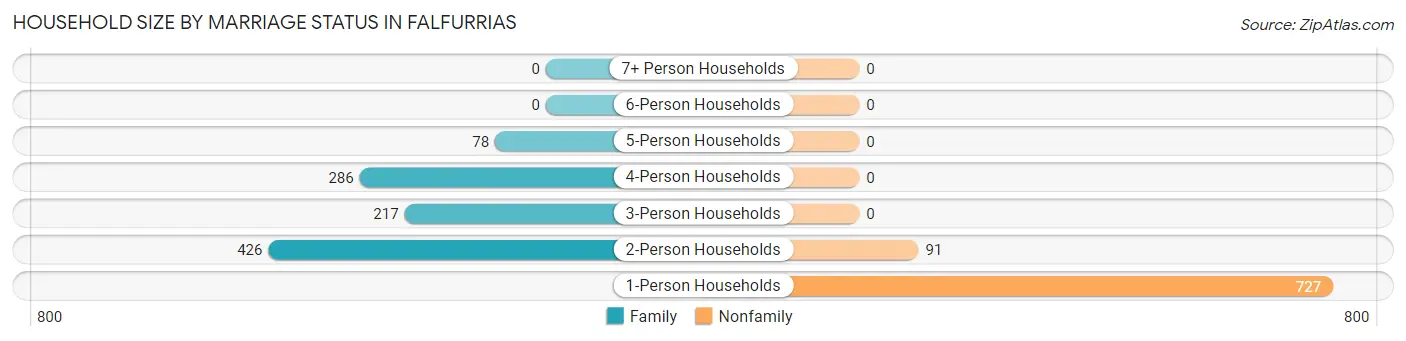
Household Size by Marriage Status in Falfurrias
Out of a total of 1,825 households in Falfurrias, 1,007 (55.2%) are family households, while 818 (44.8%) are nonfamily households. The most numerous type of family households are 2-person households, comprising 426, and the most common type of nonfamily households are 1-person households, comprising 727.
| Household Size | Family Households | Nonfamily Households |
| 1-Person Households | - | 727 (39.8%) |
| 2-Person Households | 426 (23.3%) | 91 (5.0%) |
| 3-Person Households | 217 (11.9%) | 0 (0.0%) |
| 4-Person Households | 286 (15.7%) | 0 (0.0%) |
| 5-Person Households | 78 (4.3%) | 0 (0.0%) |
| 6-Person Households | 0 (0.0%) | 0 (0.0%) |
| 7+ Person Households | 0 (0.0%) | 0 (0.0%) |
| Total | 1,007 (55.2%) | 818 (44.8%) |
Female Fertility in Falfurrias
Fertility by Age in Falfurrias
Average fertility rate in Falfurrias is 38.0 births per 1,000 women. Women in the age bracket of 35 to 50 years have the highest fertility rate with 85.0 births per 1,000 women. Women in the age bracket of 35 to 50 years acount for 100.0% of all women with births.
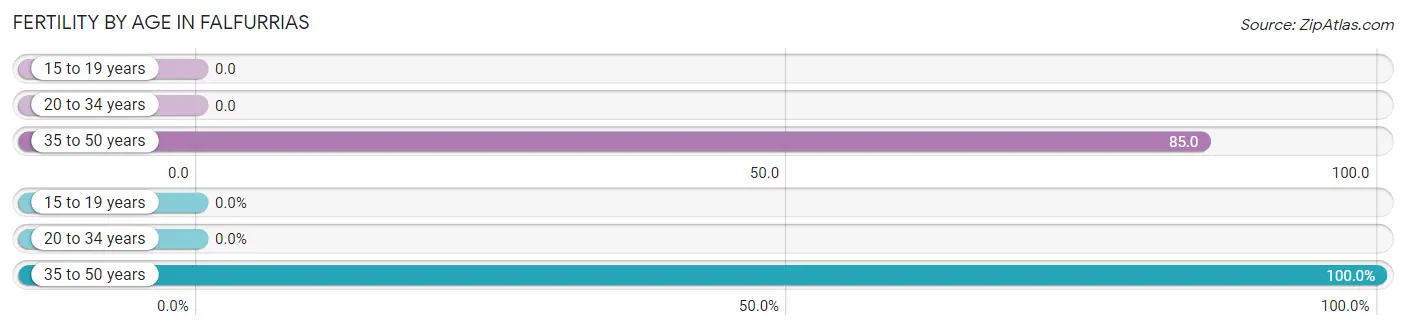
| Age Bracket | Women with Births | Births / 1,000 Women |
| 15 to 19 years | 0 (0.0%) | 0.0 |
| 20 to 34 years | 0 (0.0%) | 0.0 |
| 35 to 50 years | 40 (100.0%) | 85.0 |
| Total | 40 (100.0%) | 38.0 |
Fertility by Age by Marriage Status in Falfurrias
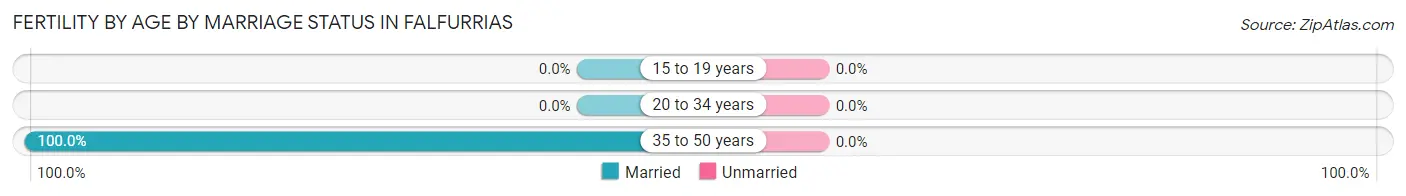
| Age Bracket | Married | Unmarried |
| 15 to 19 years | 0 (0.0%) | 0 (0.0%) |
| 20 to 34 years | 0 (0.0%) | 0 (0.0%) |
| 35 to 50 years | 40 (100.0%) | 0 (0.0%) |
| Total | 40 (100.0%) | 0 (0.0%) |
Fertility by Education in Falfurrias
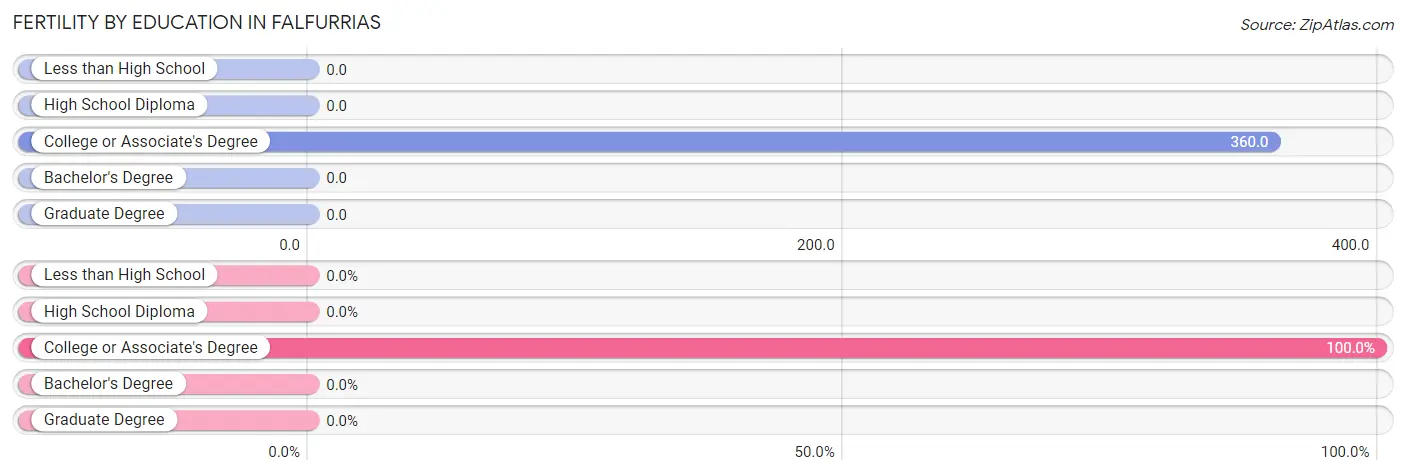
| Educational Attainment | Women with Births | Births / 1,000 Women |
| Less than High School | 0 (0.0%) | 0.0 |
| High School Diploma | 0 (0.0%) | 0.0 |
| College or Associate's Degree | 40 (100.0%) | 360.0 |
| Bachelor's Degree | 0 (0.0%) | 0.0 |
| Graduate Degree | 0 (0.0%) | 0.0 |
| Total | 40 (100.0%) | 38.0 |
Fertility by Education by Marriage Status in Falfurrias
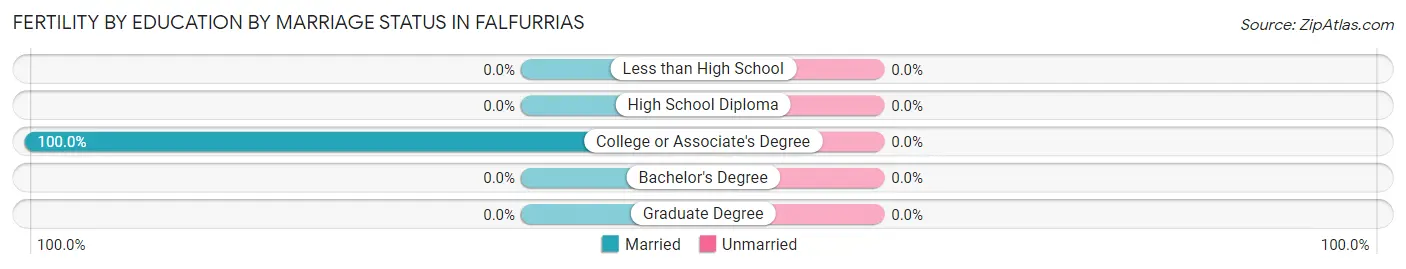
| Educational Attainment | Married | Unmarried |
| Less than High School | 0 (0.0%) | 0 (0.0%) |
| High School Diploma | 0 (0.0%) | 0 (0.0%) |
| College or Associate's Degree | 40 (100.0%) | 0 (0.0%) |
| Bachelor's Degree | 0 (0.0%) | 0 (0.0%) |
| Graduate Degree | 0 (0.0%) | 0 (0.0%) |
| Total | 40 (100.0%) | 0 (0.0%) |
Income in Falfurrias
Income Overview in Falfurrias
Per Capita Income in Falfurrias is $20,797, while median incomes of families and households are $39,421 and $31,275 respectively.
| Characteristic | Number | Measure |
| Per Capita Income | 4,348 | $20,797 |
| Median Family Income | 1,007 | $39,421 |
| Mean Family Income | 1,007 | $57,188 |
| Median Household Income | 1,825 | $31,275 |
| Mean Household Income | 1,825 | $45,066 |
| Income Deficit | 1,007 | $0 |
| Wage / Income Gap (%) | 4,348 | 0.00% |
| Wage / Income Gap ($) | 4,348 | 100.00¢ per $1 |
| Gini / Inequality Index | 4,348 | 0.51 |
Earnings by Sex in Falfurrias
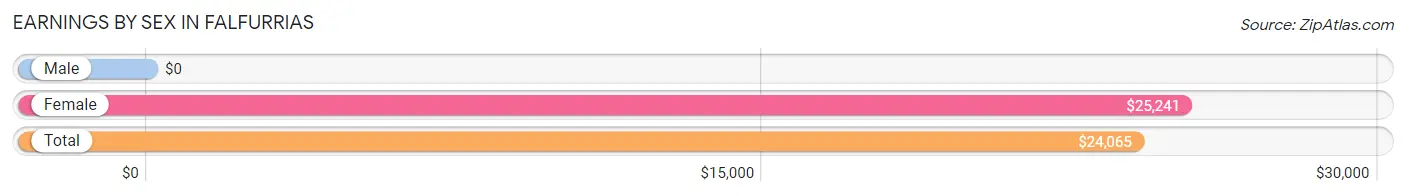
| Sex | Number | Average Earnings |
| Male | 977 (47.6%) | $0 |
| Female | 1,077 (52.4%) | $25,241 |
| Total | 2,054 (100.0%) | $24,065 |
Earnings by Sex by Income Bracket in Falfurrias
The most common earnings brackets in Falfurrias are $2,500 to $4,999 for men (351 | 35.9%) and $55,000 to $64,999 for women (258 | 24.0%).
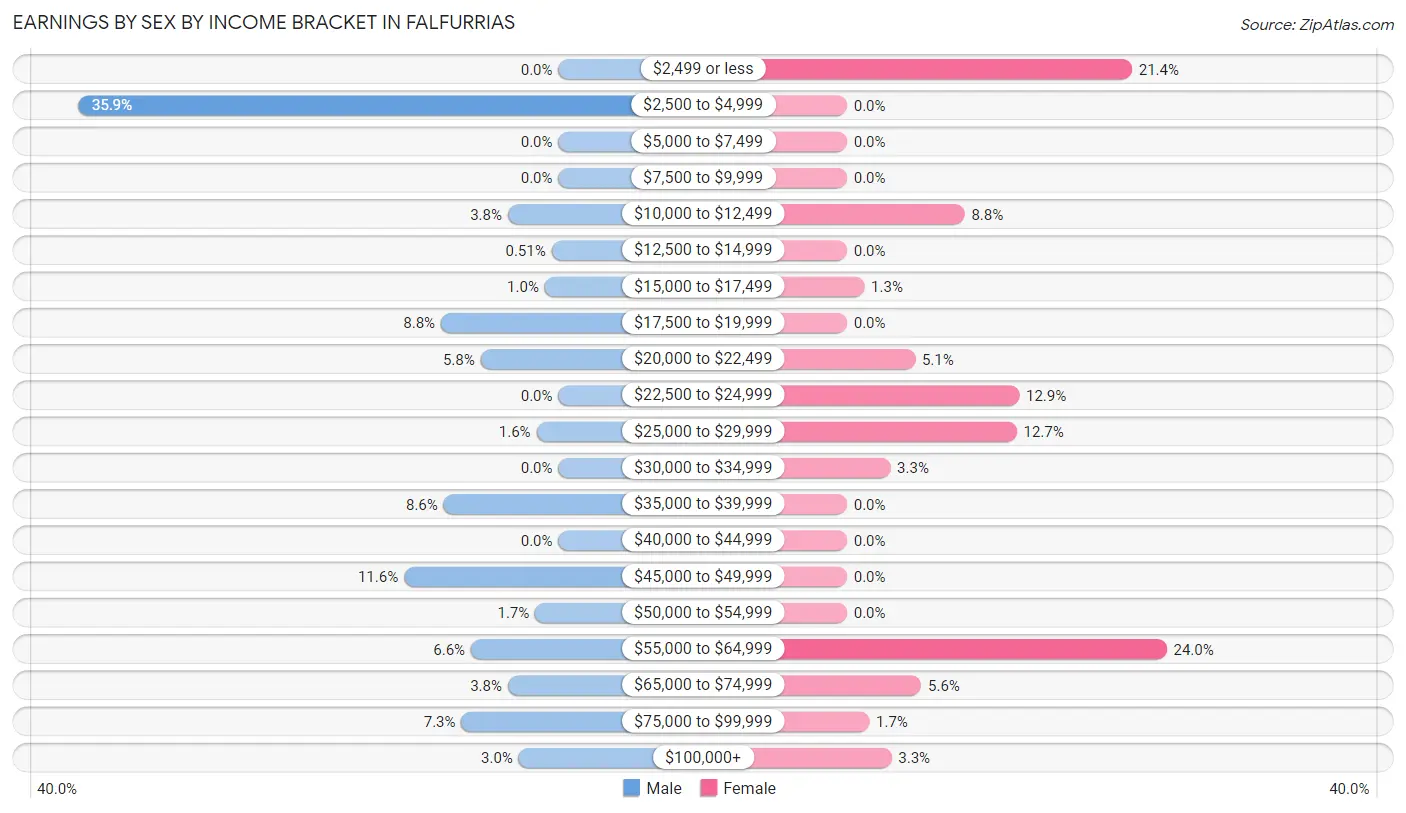
| Income | Male | Female |
| $2,499 or less | 0 (0.0%) | 230 (21.4%) |
| $2,500 to $4,999 | 351 (35.9%) | 0 (0.0%) |
| $5,000 to $7,499 | 0 (0.0%) | 0 (0.0%) |
| $7,500 to $9,999 | 0 (0.0%) | 0 (0.0%) |
| $10,000 to $12,499 | 37 (3.8%) | 95 (8.8%) |
| $12,500 to $14,999 | 5 (0.5%) | 0 (0.0%) |
| $15,000 to $17,499 | 10 (1.0%) | 14 (1.3%) |
| $17,500 to $19,999 | 86 (8.8%) | 0 (0.0%) |
| $20,000 to $22,499 | 57 (5.8%) | 55 (5.1%) |
| $22,500 to $24,999 | 0 (0.0%) | 139 (12.9%) |
| $25,000 to $29,999 | 16 (1.6%) | 137 (12.7%) |
| $30,000 to $34,999 | 0 (0.0%) | 35 (3.3%) |
| $35,000 to $39,999 | 84 (8.6%) | 0 (0.0%) |
| $40,000 to $44,999 | 0 (0.0%) | 0 (0.0%) |
| $45,000 to $49,999 | 113 (11.6%) | 0 (0.0%) |
| $50,000 to $54,999 | 17 (1.7%) | 0 (0.0%) |
| $55,000 to $64,999 | 64 (6.6%) | 258 (24.0%) |
| $65,000 to $74,999 | 37 (3.8%) | 60 (5.6%) |
| $75,000 to $99,999 | 71 (7.3%) | 18 (1.7%) |
| $100,000+ | 29 (3.0%) | 36 (3.3%) |
| Total | 977 (100.0%) | 1,077 (100.0%) |
Earnings by Sex by Educational Attainment in Falfurrias
Average earnings in Falfurrias are $45,410 for men and $25,921 for women, a difference of 42.9%. Men with an educational attainment of high school diploma enjoy the highest average annual earnings of $87,570, while those with college or associate's degree education earn the least with $39,570. Women with an educational attainment of bachelor's degree earn the most with the average annual earnings of $56,652, while those with less than high school education have the smallest earnings of $2,499.
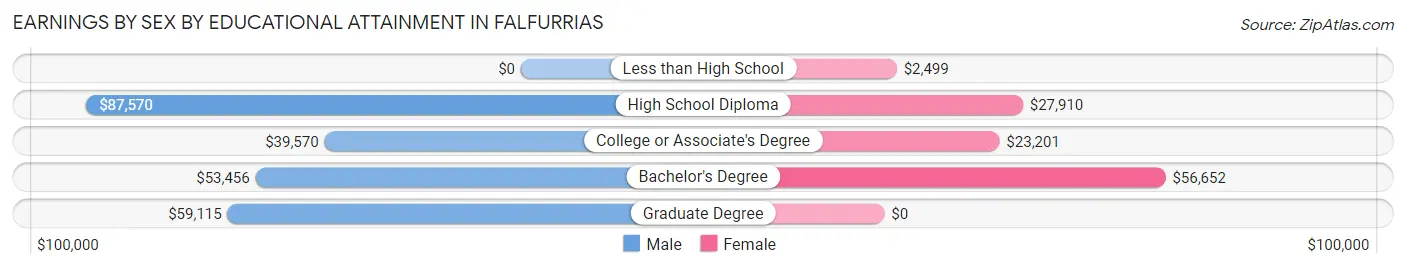
| Educational Attainment | Male Income | Female Income |
| Less than High School | - | - |
| High School Diploma | $87,570 | $27,910 |
| College or Associate's Degree | $39,570 | $23,201 |
| Bachelor's Degree | $53,456 | $56,652 |
| Graduate Degree | $59,115 | $0 |
| Total | $45,410 | $25,921 |
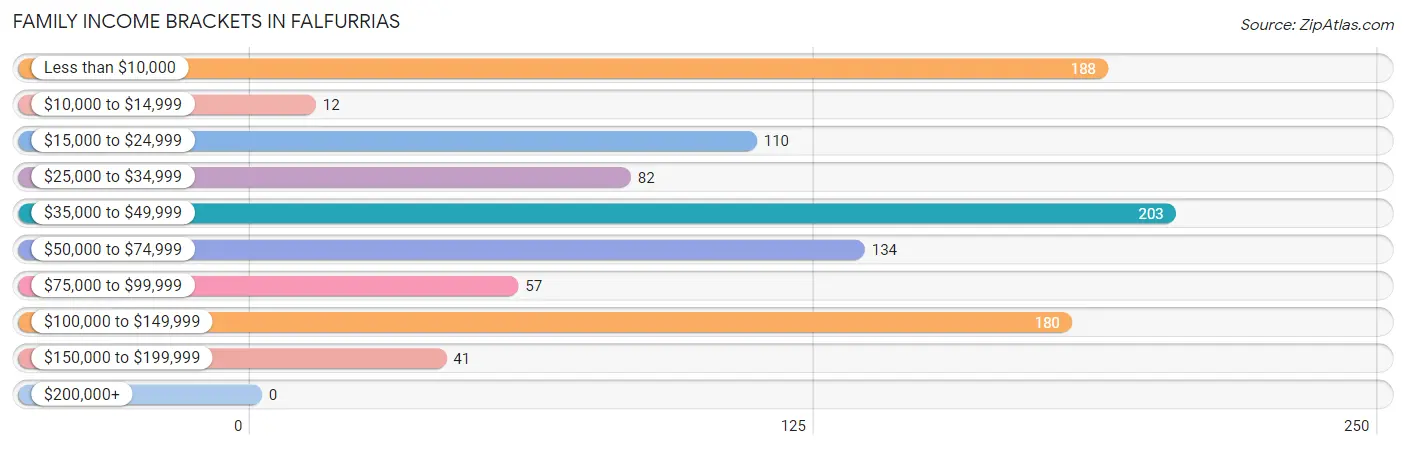
Family Income in Falfurrias
Family Income Brackets in Falfurrias
According to the Falfurrias family income data, there are 203 families falling into the $35,000 to $49,999 income range, which is the most common income bracket and makes up 20.2% of all families.
| Income Bracket | # Families | % Families |
| Less than $10,000 | 188 | 18.7% |
| $10,000 to $14,999 | 12 | 1.2% |
| $15,000 to $24,999 | 110 | 10.9% |
| $25,000 to $34,999 | 82 | 8.1% |
| $35,000 to $49,999 | 203 | 20.2% |
| $50,000 to $74,999 | 134 | 13.3% |
| $75,000 to $99,999 | 57 | 5.7% |
| $100,000 to $149,999 | 180 | 17.9% |
| $150,000 to $199,999 | 41 | 4.1% |
| $200,000+ | 0 | 0.0% |
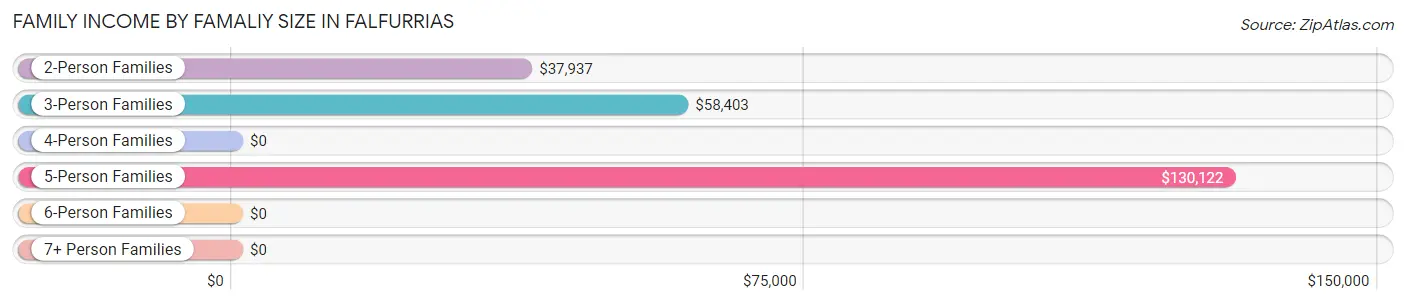
Family Income by Famaliy Size in Falfurrias
5-person families (78 | 7.7%) account for the highest median family income in Falfurrias with $130,122 per family, while 5-person families (78 | 7.7%) have the highest median income of $26,024 per family member.
| Income Bracket | # Families | Median Income |
| 2-Person Families | 478 (47.5%) | $37,937 |
| 3-Person Families | 175 (17.4%) | $58,403 |
| 4-Person Families | 276 (27.4%) | $0 |
| 5-Person Families | 78 (7.7%) | $130,122 |
| 6-Person Families | 0 (0.0%) | $0 |
| 7+ Person Families | 0 (0.0%) | $0 |
| Total | 1,007 (100.0%) | $39,421 |
Family Income by Number of Earners in Falfurrias
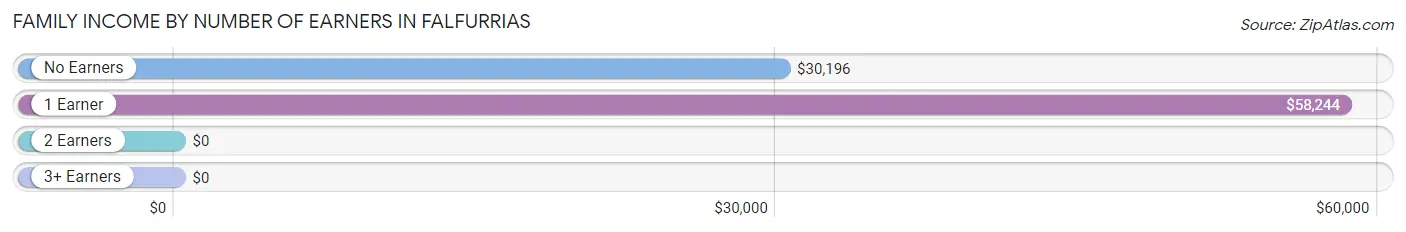
| Number of Earners | # Families | Median Income |
| No Earners | 291 (28.9%) | $30,196 |
| 1 Earner | 361 (35.8%) | $58,244 |
| 2 Earners | 314 (31.2%) | $0 |
| 3+ Earners | 41 (4.1%) | $0 |
| Total | 1,007 (100.0%) | $39,421 |
Household Income in Falfurrias
Household Income Brackets in Falfurrias
With 485 households falling in the category, the less than $10,000 income range is the most frequent in Falfurrias, accounting for 26.6% of all households.
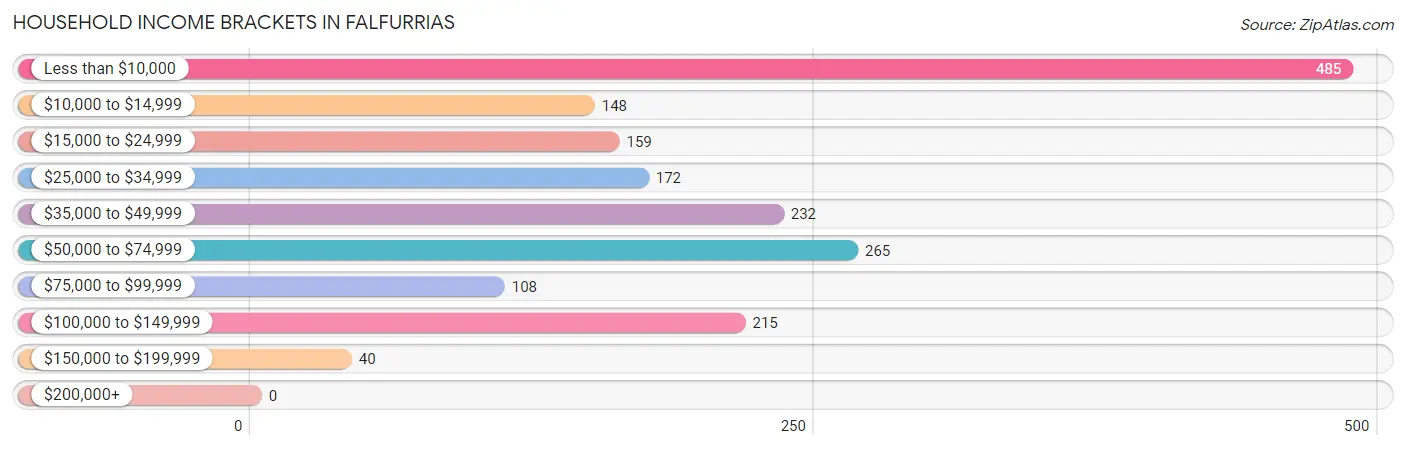
| Income Bracket | # Households | % Households |
| Less than $10,000 | 485 | 26.6% |
| $10,000 to $14,999 | 148 | 8.1% |
| $15,000 to $24,999 | 159 | 8.7% |
| $25,000 to $34,999 | 172 | 9.4% |
| $35,000 to $49,999 | 232 | 12.7% |
| $50,000 to $74,999 | 265 | 14.5% |
| $75,000 to $99,999 | 108 | 5.9% |
| $100,000 to $149,999 | 215 | 11.8% |
| $150,000 to $199,999 | 40 | 2.2% |
| $200,000+ | 0 | 0.0% |
Household Income by Householder Age in Falfurrias
The median household income in Falfurrias is $31,275, with the highest median household income of $44,911 found in the 45 to 64 years age bracket for the primary householder. A total of 737 households (40.4%) fall into this category. Meanwhile, the 15 to 24 years age bracket for the primary householder has the lowest median household income of $0, with 240 households (13.2%) in this group.
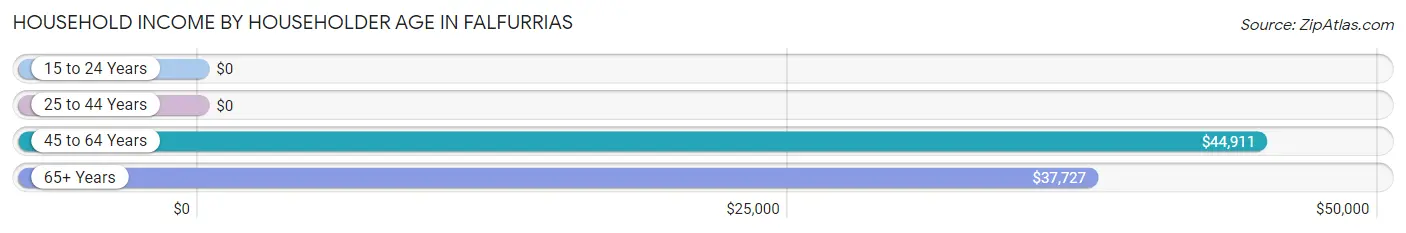
| Income Bracket | # Households | Median Income |
| 15 to 24 Years | 240 (13.2%) | $0 |
| 25 to 44 Years | 376 (20.6%) | $0 |
| 45 to 64 Years | 737 (40.4%) | $44,911 |
| 65+ Years | 472 (25.9%) | $37,727 |
| Total | 1,825 (100.0%) | $31,275 |
Poverty in Falfurrias
Income Below Poverty by Sex and Age in Falfurrias
With 42.6% poverty level for males and 25.4% for females among the residents of Falfurrias, 5 year old males and 12 to 14 year old females are the most vulnerable to poverty, with 77 males (100.0%) and 28 females (100.0%) in their respective age groups living below the poverty level.
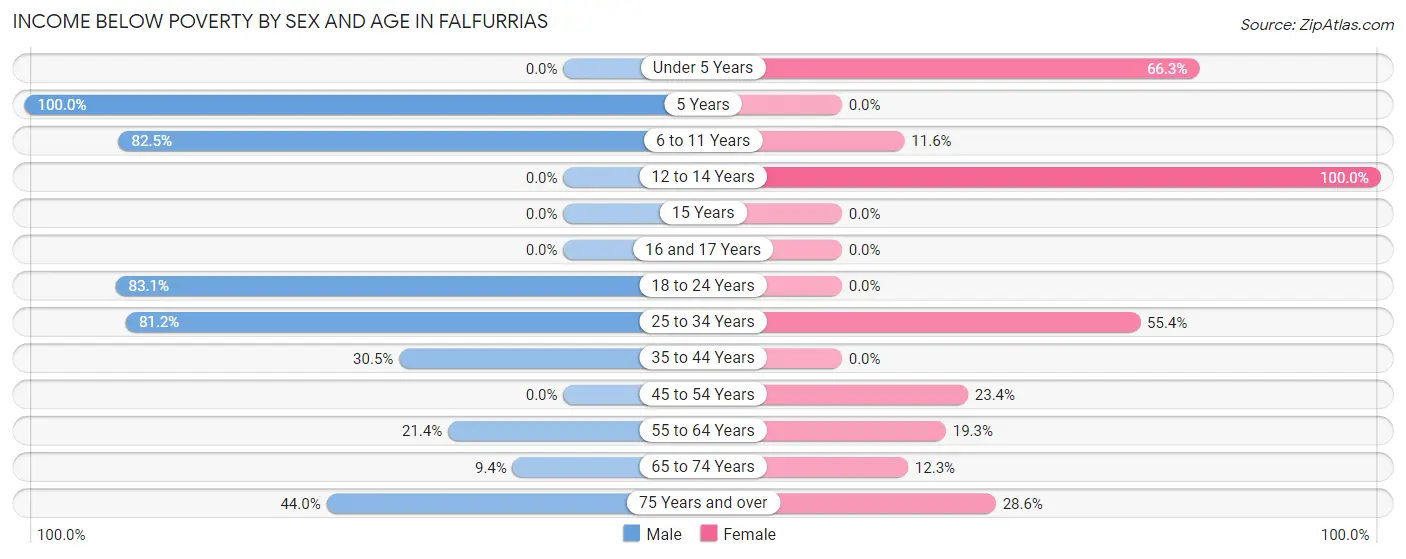
| Age Bracket | Male | Female |
| Under 5 Years | 0 (0.0%) | 132 (66.3%) |
| 5 Years | 77 (100.0%) | 0 (0.0%) |
| 6 to 11 Years | 104 (82.5%) | 28 (11.6%) |
| 12 to 14 Years | 0 (0.0%) | 28 (100.0%) |
| 15 Years | 0 (0.0%) | 0 (0.0%) |
| 16 and 17 Years | 0 (0.0%) | 0 (0.0%) |
| 18 to 24 Years | 280 (83.1%) | 0 (0.0%) |
| 25 to 34 Years | 138 (81.2%) | 232 (55.4%) |
| 35 to 44 Years | 57 (30.5%) | 0 (0.0%) |
| 45 to 54 Years | 0 (0.0%) | 62 (23.4%) |
| 55 to 64 Years | 52 (21.4%) | 62 (19.3%) |
| 65 to 74 Years | 13 (9.4%) | 47 (12.3%) |
| 75 Years and over | 51 (44.0%) | 48 (28.6%) |
| Total | 772 (42.6%) | 639 (25.4%) |
Income Above Poverty by Sex and Age in Falfurrias
According to the poverty statistics in Falfurrias, males aged 12 to 14 years and females aged 5 years are the age groups that are most secure financially, with 100.0% of males and 100.0% of females in these age groups living above the poverty line.
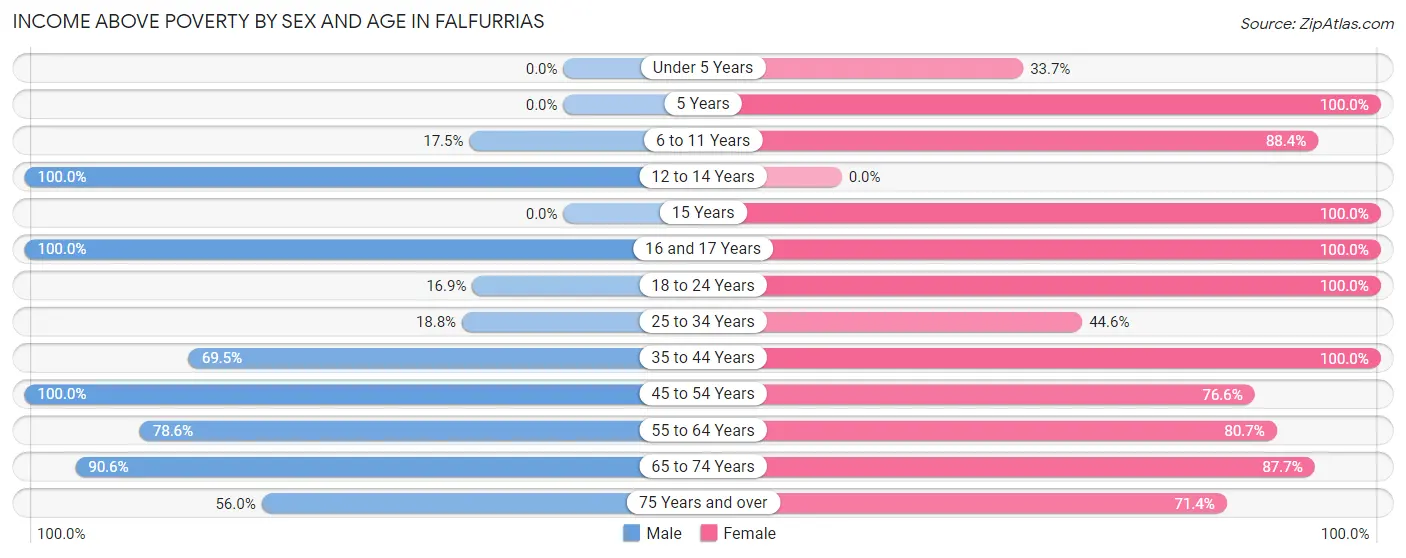
| Age Bracket | Male | Female |
| Under 5 Years | 0 (0.0%) | 67 (33.7%) |
| 5 Years | 0 (0.0%) | 30 (100.0%) |
| 6 to 11 Years | 22 (17.5%) | 213 (88.4%) |
| 12 to 14 Years | 118 (100.0%) | 0 (0.0%) |
| 15 Years | 0 (0.0%) | 25 (100.0%) |
| 16 and 17 Years | 78 (100.0%) | 112 (100.0%) |
| 18 to 24 Years | 57 (16.9%) | 31 (100.0%) |
| 25 to 34 Years | 32 (18.8%) | 187 (44.6%) |
| 35 to 44 Years | 130 (69.5%) | 294 (100.0%) |
| 45 to 54 Years | 223 (100.0%) | 203 (76.6%) |
| 55 to 64 Years | 191 (78.6%) | 259 (80.7%) |
| 65 to 74 Years | 125 (90.6%) | 336 (87.7%) |
| 75 Years and over | 65 (56.0%) | 120 (71.4%) |
| Total | 1,041 (57.4%) | 1,877 (74.6%) |
Income Below Poverty Among Married-Couple Families in Falfurrias
The poverty statistics for married-couple families in Falfurrias show that 23.1% or 168 of the total 728 families live below the poverty line. Families with 3 or 4 children have the highest poverty rate of 40.5%, comprising of 15 families. On the other hand, families with no children have the lowest poverty rate of 7.8%, which includes 27 families.
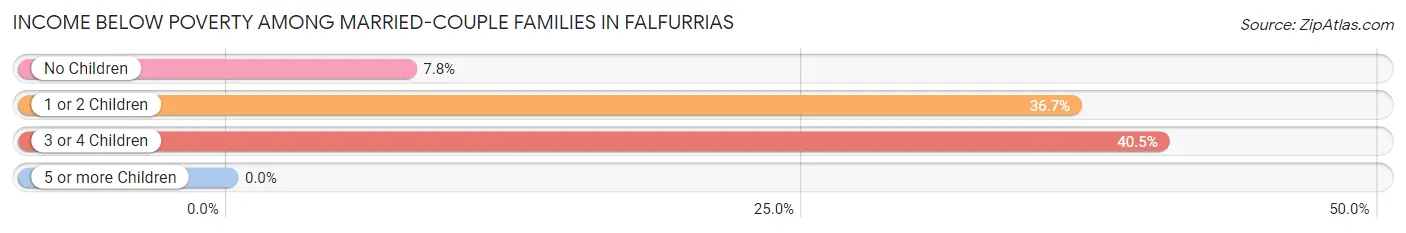
| Children | Above Poverty | Below Poverty |
| No Children | 321 (92.2%) | 27 (7.8%) |
| 1 or 2 Children | 217 (63.3%) | 126 (36.7%) |
| 3 or 4 Children | 22 (59.5%) | 15 (40.5%) |
| 5 or more Children | 0 (0.0%) | 0 (0.0%) |
| Total | 560 (76.9%) | 168 (23.1%) |
Income Below Poverty Among Single-Parent Households in Falfurrias
According to the poverty data in Falfurrias, 14.1% or 10 single-father households and 43.3% or 90 single-mother households are living below the poverty line. Among single-father households, those with 1 or 2 children have the highest poverty rate, with 10 households (14.5%) experiencing poverty. Likewise, among single-mother households, those with 1 or 2 children have the highest poverty rate, with 90 households (73.2%) falling below the poverty line.
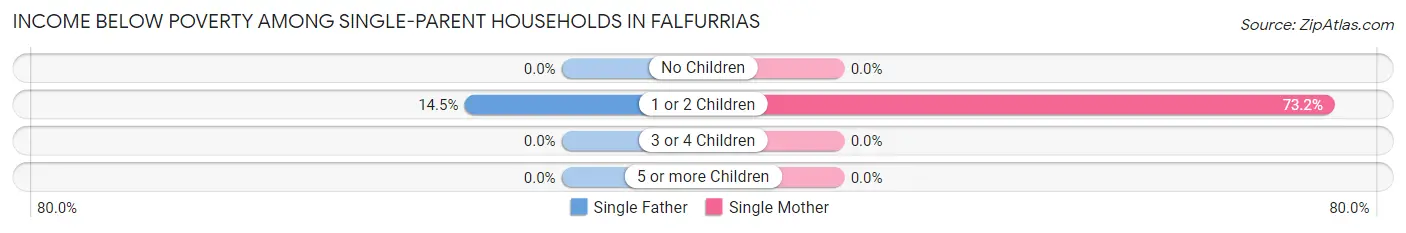
| Children | Single Father | Single Mother |
| No Children | 0 (0.0%) | 0 (0.0%) |
| 1 or 2 Children | 10 (14.5%) | 90 (73.2%) |
| 3 or 4 Children | 0 (0.0%) | 0 (0.0%) |
| 5 or more Children | 0 (0.0%) | 0 (0.0%) |
| Total | 10 (14.1%) | 90 (43.3%) |
Income Below Poverty Among Married-Couple vs Single-Parent Households in Falfurrias
The poverty data for Falfurrias shows that 168 of the married-couple family households (23.1%) and 100 of the single-parent households (35.8%) are living below the poverty level. Within the married-couple family households, those with 3 or 4 children have the highest poverty rate, with 15 households (40.5%) falling below the poverty line. Among the single-parent households, those with 1 or 2 children have the highest poverty rate, with 100 household (52.1%) living below poverty.
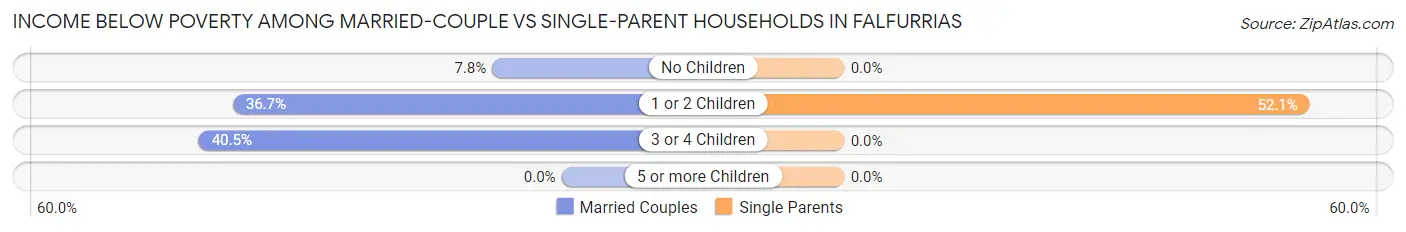
| Children | Married-Couple Families | Single-Parent Households |
| No Children | 27 (7.8%) | 0 (0.0%) |
| 1 or 2 Children | 126 (36.7%) | 100 (52.1%) |
| 3 or 4 Children | 15 (40.5%) | 0 (0.0%) |
| 5 or more Children | 0 (0.0%) | 0 (0.0%) |
| Total | 168 (23.1%) | 100 (35.8%) |
Employment Characteristics in Falfurrias
Employment by Class of Employer in Falfurrias
Among the 1,996 employed individuals in Falfurrias, private company employees (1,141 | 57.2%), local government employees (266 | 13.3%), and state government employees (251 | 12.6%) make up the most common classes of employment.
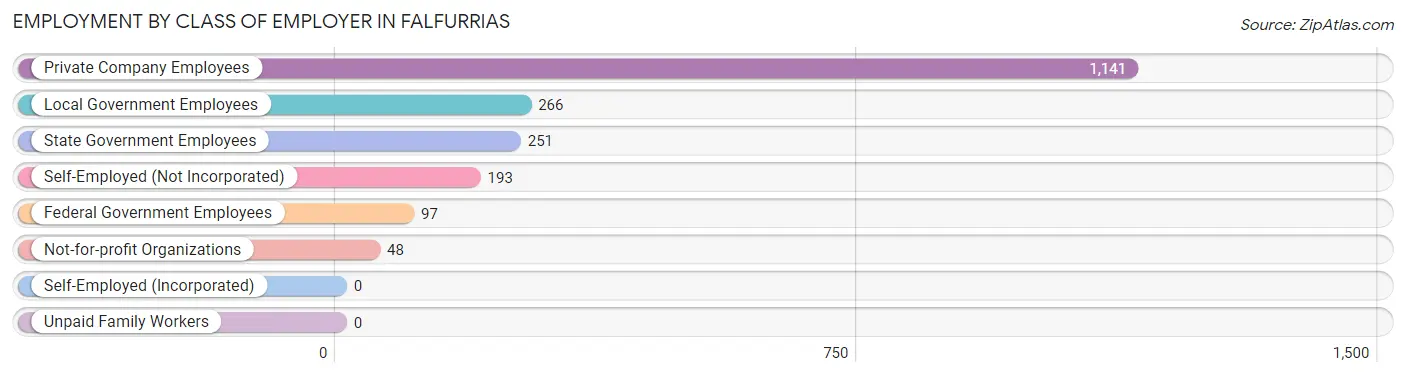
| Employer Class | # Employees | % Employees |
| Private Company Employees | 1,141 | 57.2% |
| Self-Employed (Incorporated) | 0 | 0.0% |
| Self-Employed (Not Incorporated) | 193 | 9.7% |
| Not-for-profit Organizations | 48 | 2.4% |
| Local Government Employees | 266 | 13.3% |
| State Government Employees | 251 | 12.6% |
| Federal Government Employees | 97 | 4.9% |
| Unpaid Family Workers | 0 | 0.0% |
| Total | 1,996 | 100.0% |
Employment Status by Age in Falfurrias
According to the labor force statistics for Falfurrias, out of the total population over 16 years of age (3,504), 59.0% or 2,067 individuals are in the labor force, with 0.6% or 12 of them unemployed. The age group with the highest labor force participation rate is 20 to 24 years, with 100.0% or 368 individuals in the labor force. Within the labor force, the 60 to 64 years age range has the highest percentage of unemployed individuals, with 9.7% or 12 of them being unemployed.
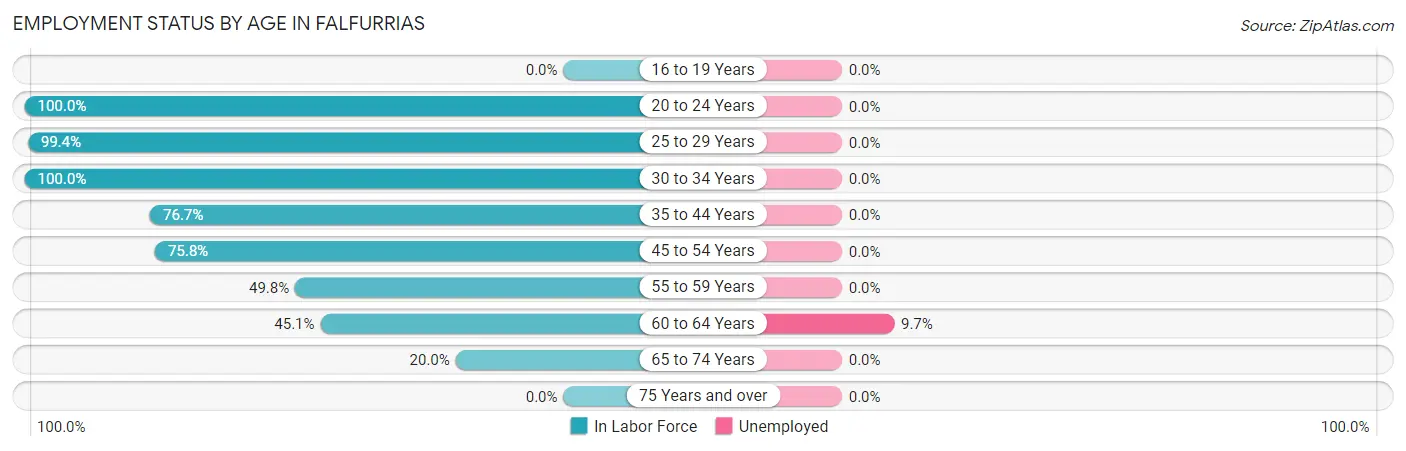
| Age Bracket | In Labor Force | Unemployed |
| 16 to 19 Years | 0 (0.0%) | 0 (0.0%) |
| 20 to 24 Years | 368 (100.0%) | 0 (0.0%) |
| 25 to 29 Years | 347 (99.4%) | 0 (0.0%) |
| 30 to 34 Years | 240 (100.0%) | 0 (0.0%) |
| 35 to 44 Years | 369 (76.7%) | 0 (0.0%) |
| 45 to 54 Years | 370 (75.8%) | 0 (0.0%) |
| 55 to 59 Years | 144 (49.8%) | 0 (0.0%) |
| 60 to 64 Years | 124 (45.1%) | 12 (9.7%) |
| 65 to 74 Years | 104 (20.0%) | 0 (0.0%) |
| 75 Years and over | 0 (0.0%) | 0 (0.0%) |
| Total | 2,067 (59.0%) | 12 (0.6%) |
Employment Status by Educational Attainment in Falfurrias
According to labor force statistics for Falfurrias, 75.1% of individuals (1,594) out of the total population between 25 and 64 years of age (2,122) are in the labor force, with 0.8% or 13 of them being unemployed. The group with the highest labor force participation rate are those with the educational attainment of bachelor's degree or higher, with 96.2% or 588 individuals in the labor force. Within the labor force, individuals with less than high school education have the highest percentage of unemployment, with 3.4% or 12 of them being unemployed.
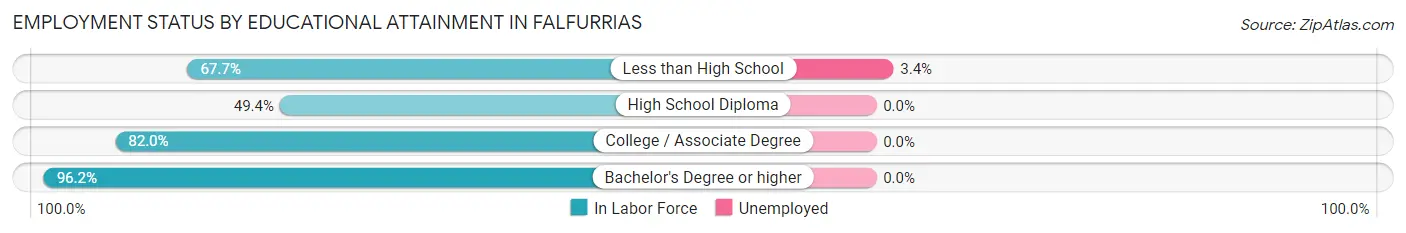
| Educational Attainment | In Labor Force | Unemployed |
| Less than High School | 355 (67.7%) | 18 (3.4%) |
| High School Diploma | 240 (49.4%) | 0 (0.0%) |
| College / Associate Degree | 411 (82.0%) | 0 (0.0%) |
| Bachelor's Degree or higher | 588 (96.2%) | 0 (0.0%) |
| Total | 1,594 (75.1%) | 17 (0.8%) |
Employment Occupations by Sex in Falfurrias
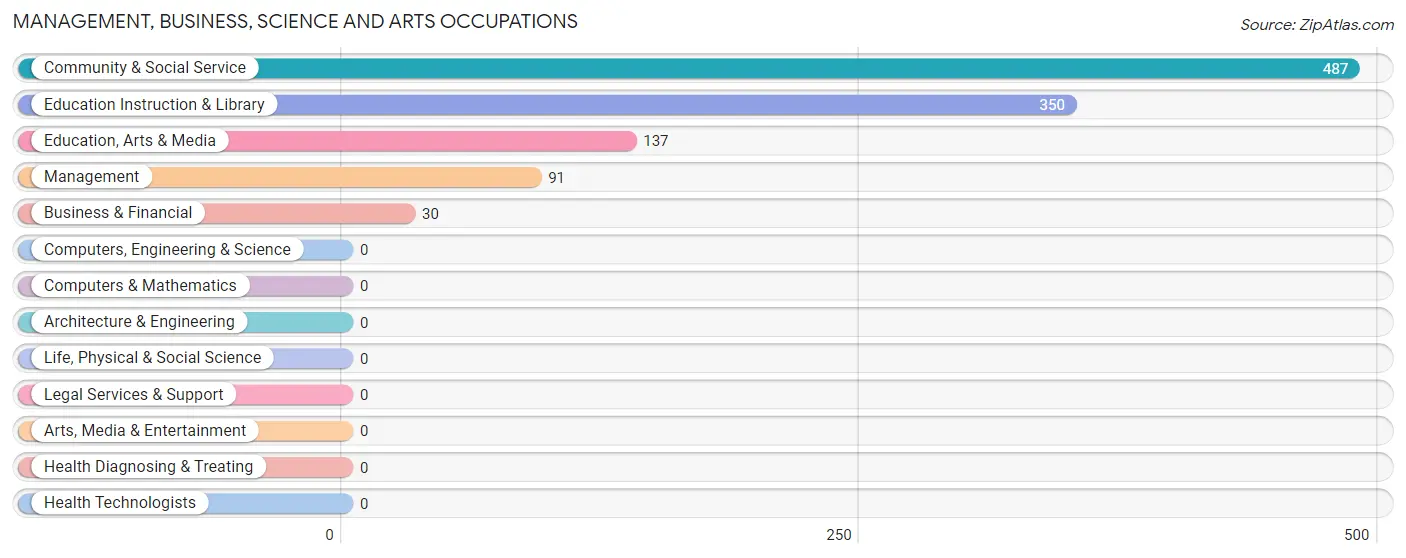
Management, Business, Science and Arts Occupations
The most common Management, Business, Science and Arts occupations in Falfurrias are Community & Social Service (487 | 23.7%), Education Instruction & Library (350 | 17.0%), Education, Arts & Media (137 | 6.7%), Management (91 | 4.4%), and Business & Financial (30 | 1.5%).
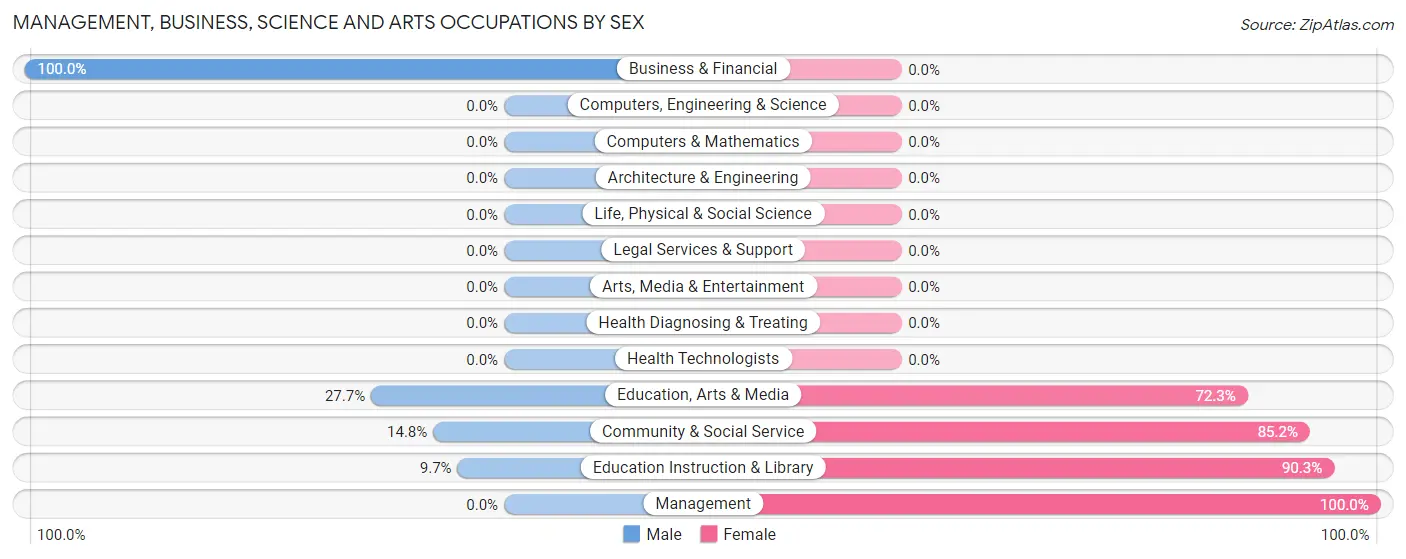
Management, Business, Science and Arts Occupations by Sex
Within the Management, Business, Science and Arts occupations in Falfurrias, the most male-oriented occupations are Business & Financial (100.0%), Education, Arts & Media (27.7%), and Community & Social Service (14.8%), while the most female-oriented occupations are Management (100.0%), Education Instruction & Library (90.3%), and Community & Social Service (85.2%).
| Occupation | Male | Female |
| Management | 0 (0.0%) | 91 (100.0%) |
| Business & Financial | 30 (100.0%) | 0 (0.0%) |
| Computers, Engineering & Science | 0 (0.0%) | 0 (0.0%) |
| Computers & Mathematics | 0 (0.0%) | 0 (0.0%) |
| Architecture & Engineering | 0 (0.0%) | 0 (0.0%) |
| Life, Physical & Social Science | 0 (0.0%) | 0 (0.0%) |
| Community & Social Service | 72 (14.8%) | 415 (85.2%) |
| Education, Arts & Media | 38 (27.7%) | 99 (72.3%) |
| Legal Services & Support | 0 (0.0%) | 0 (0.0%) |
| Education Instruction & Library | 34 (9.7%) | 316 (90.3%) |
| Arts, Media & Entertainment | 0 (0.0%) | 0 (0.0%) |
| Health Diagnosing & Treating | 0 (0.0%) | 0 (0.0%) |
| Health Technologists | 0 (0.0%) | 0 (0.0%) |
| Total (Category) | 102 (16.8%) | 506 (83.2%) |
| Total (Overall) | 977 (47.6%) | 1,077 (52.4%) |
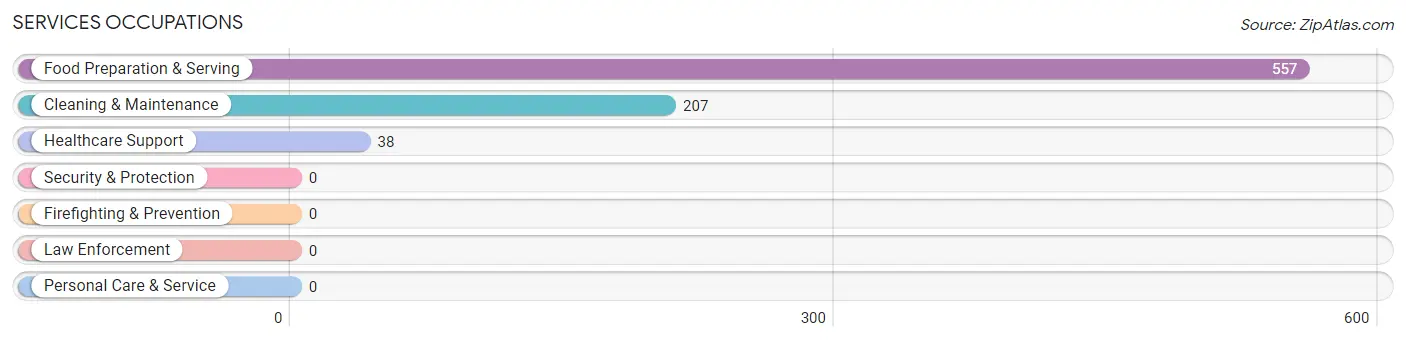
Services Occupations
The most common Services occupations in Falfurrias are Food Preparation & Serving (557 | 27.1%), Cleaning & Maintenance (207 | 10.1%), and Healthcare Support (38 | 1.8%).
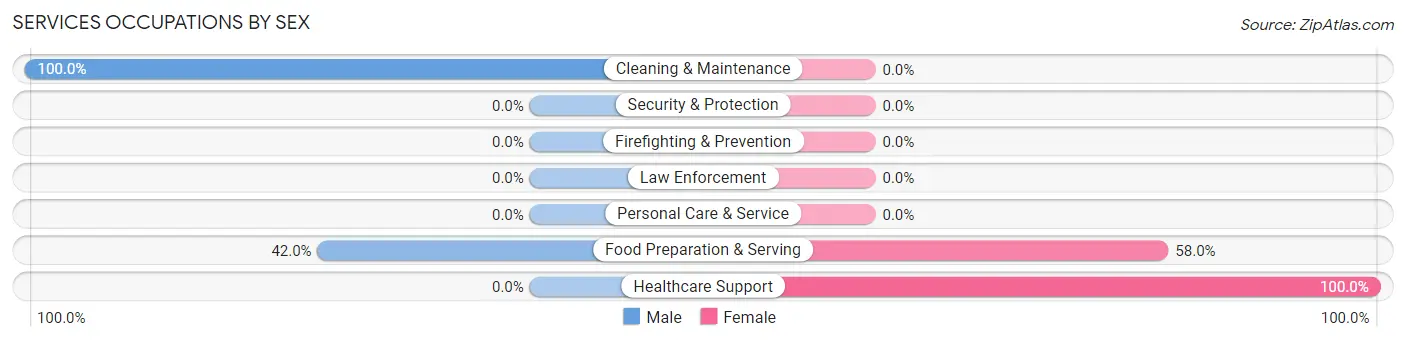
Services Occupations by Sex
Within the Services occupations in Falfurrias, the most male-oriented occupations are Cleaning & Maintenance (100.0%), and Food Preparation & Serving (42.0%), while the most female-oriented occupations are Healthcare Support (100.0%), and Food Preparation & Serving (58.0%).
| Occupation | Male | Female |
| Healthcare Support | 0 (0.0%) | 38 (100.0%) |
| Security & Protection | 0 (0.0%) | 0 (0.0%) |
| Firefighting & Prevention | 0 (0.0%) | 0 (0.0%) |
| Law Enforcement | 0 (0.0%) | 0 (0.0%) |
| Food Preparation & Serving | 234 (42.0%) | 323 (58.0%) |
| Cleaning & Maintenance | 207 (100.0%) | 0 (0.0%) |
| Personal Care & Service | 0 (0.0%) | 0 (0.0%) |
| Total (Category) | 441 (55.0%) | 361 (45.0%) |
| Total (Overall) | 977 (47.6%) | 1,077 (52.4%) |
Sales and Office Occupations
The most common Sales and Office occupations in Falfurrias are Office & Administration (187 | 9.1%), and Sales & Related (71 | 3.5%).

Sales and Office Occupations by Sex

| Occupation | Male | Female |
| Sales & Related | 56 (78.9%) | 15 (21.1%) |
| Office & Administration | 18 (9.6%) | 169 (90.4%) |
| Total (Category) | 74 (28.7%) | 184 (71.3%) |
| Total (Overall) | 977 (47.6%) | 1,077 (52.4%) |
Natural Resources, Construction and Maintenance Occupations
The most common Natural Resources, Construction and Maintenance occupations in Falfurrias are Construction & Extraction (111 | 5.4%), Installation, Maintenance & Repair (67 | 3.3%), and Farming, Fishing & Forestry (4 | 0.2%).
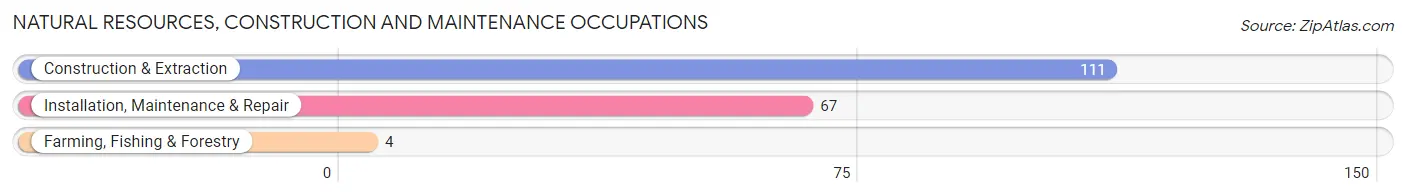
Natural Resources, Construction and Maintenance Occupations by Sex

| Occupation | Male | Female |
| Farming, Fishing & Forestry | 0 (0.0%) | 4 (100.0%) |
| Construction & Extraction | 111 (100.0%) | 0 (0.0%) |
| Installation, Maintenance & Repair | 67 (100.0%) | 0 (0.0%) |
| Total (Category) | 178 (97.8%) | 4 (2.2%) |
| Total (Overall) | 977 (47.6%) | 1,077 (52.4%) |
Production, Transportation and Moving Occupations
The most common Production, Transportation and Moving occupations in Falfurrias are Production (100 | 4.9%), Material Moving (99 | 4.8%), and Transportation (5 | 0.2%).
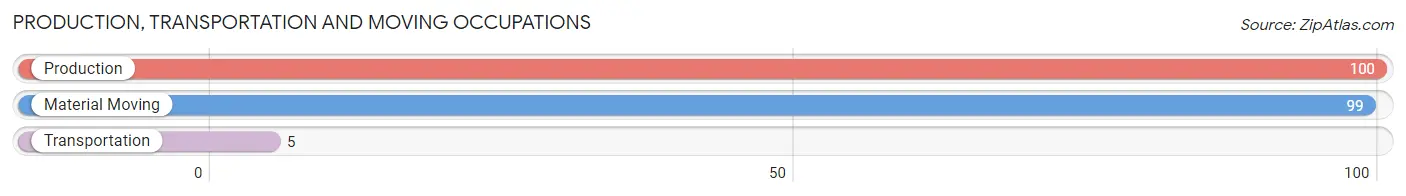
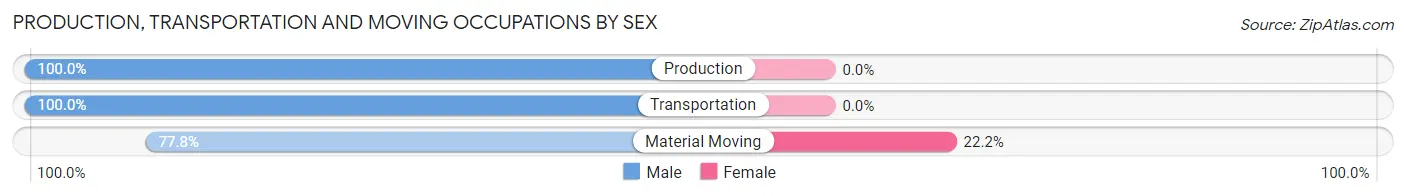
Production, Transportation and Moving Occupations by Sex
| Occupation | Male | Female |
| Production | 100 (100.0%) | 0 (0.0%) |
| Transportation | 5 (100.0%) | 0 (0.0%) |
| Material Moving | 77 (77.8%) | 22 (22.2%) |
| Total (Category) | 182 (89.2%) | 22 (10.8%) |
| Total (Overall) | 977 (47.6%) | 1,077 (52.4%) |
Employment Industries by Sex in Falfurrias
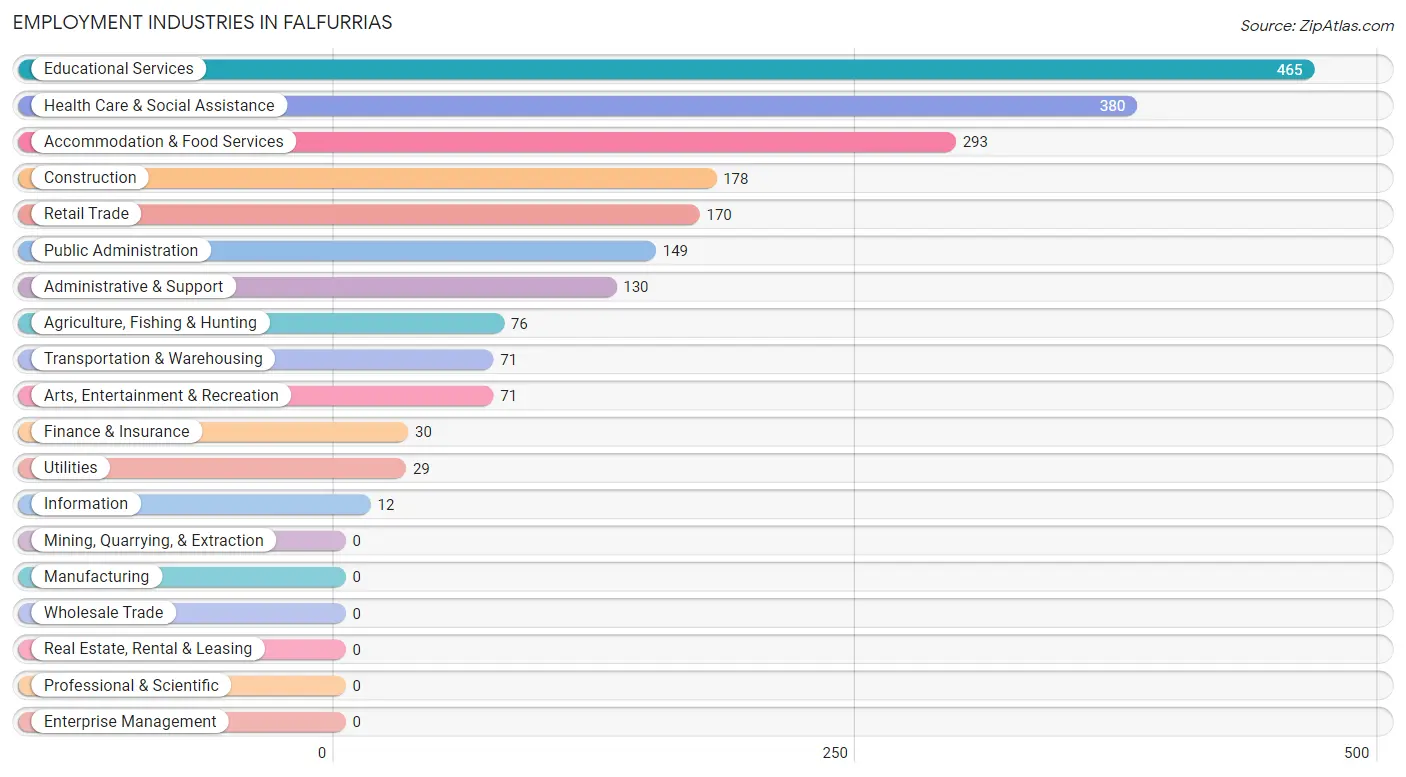
Employment Industries in Falfurrias
The major employment industries in Falfurrias include Educational Services (465 | 22.6%), Health Care & Social Assistance (380 | 18.5%), Accommodation & Food Services (293 | 14.3%), Construction (178 | 8.7%), and Retail Trade (170 | 8.3%).
Employment Industries by Sex in Falfurrias
The Falfurrias industries that see more men than women are Construction (100.0%), Transportation & Warehousing (100.0%), and Utilities (100.0%), whereas the industries that tend to have a higher number of women are Information (100.0%), Educational Services (92.7%), and Health Care & Social Assistance (88.2%).
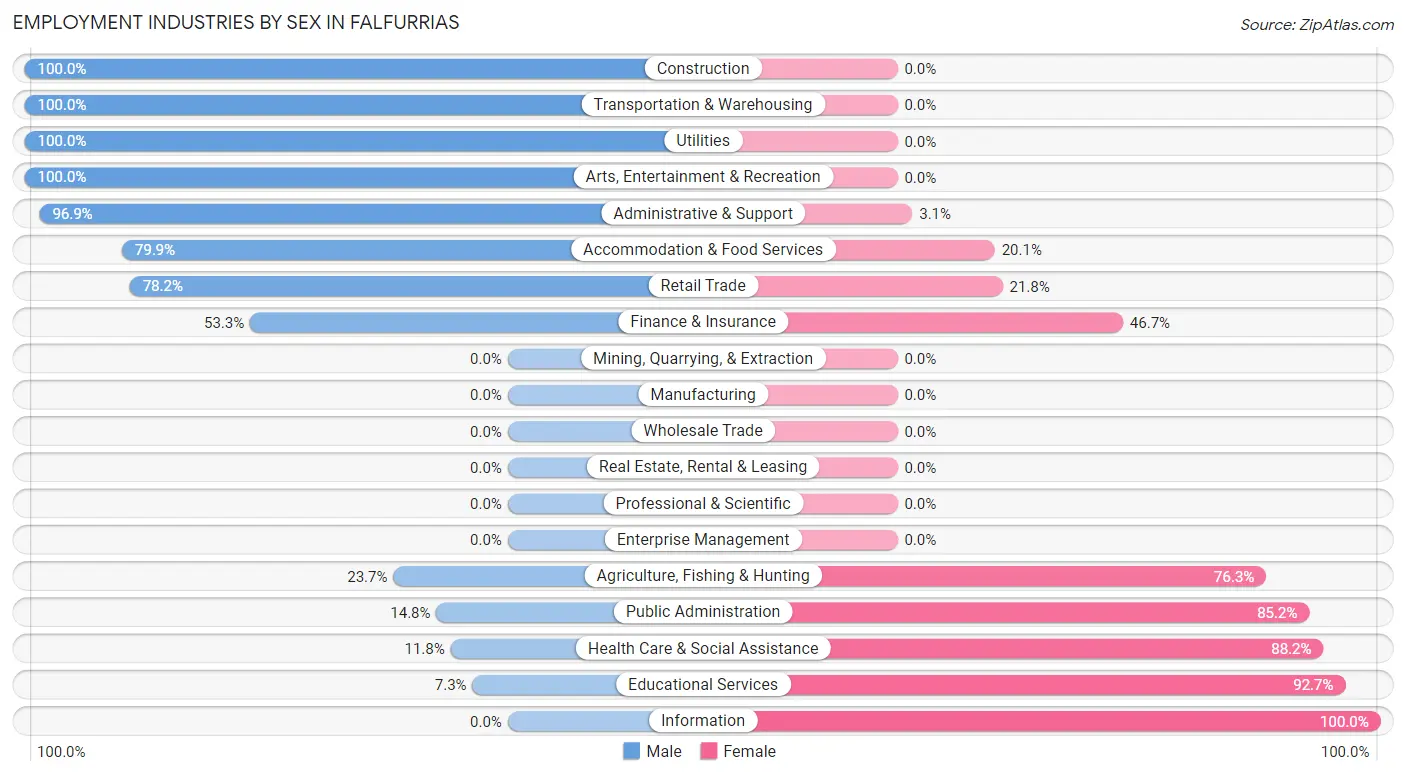
| Industry | Male | Female |
| Agriculture, Fishing & Hunting | 18 (23.7%) | 58 (76.3%) |
| Mining, Quarrying, & Extraction | 0 (0.0%) | 0 (0.0%) |
| Construction | 178 (100.0%) | 0 (0.0%) |
| Manufacturing | 0 (0.0%) | 0 (0.0%) |
| Wholesale Trade | 0 (0.0%) | 0 (0.0%) |
| Retail Trade | 133 (78.2%) | 37 (21.8%) |
| Transportation & Warehousing | 71 (100.0%) | 0 (0.0%) |
| Utilities | 29 (100.0%) | 0 (0.0%) |
| Information | 0 (0.0%) | 12 (100.0%) |
| Finance & Insurance | 16 (53.3%) | 14 (46.7%) |
| Real Estate, Rental & Leasing | 0 (0.0%) | 0 (0.0%) |
| Professional & Scientific | 0 (0.0%) | 0 (0.0%) |
| Enterprise Management | 0 (0.0%) | 0 (0.0%) |
| Administrative & Support | 126 (96.9%) | 4 (3.1%) |
| Educational Services | 34 (7.3%) | 431 (92.7%) |
| Health Care & Social Assistance | 45 (11.8%) | 335 (88.2%) |
| Arts, Entertainment & Recreation | 71 (100.0%) | 0 (0.0%) |
| Accommodation & Food Services | 234 (79.9%) | 59 (20.1%) |
| Public Administration | 22 (14.8%) | 127 (85.2%) |
| Total | 977 (47.6%) | 1,077 (52.4%) |
Education in Falfurrias
School Enrollment in Falfurrias
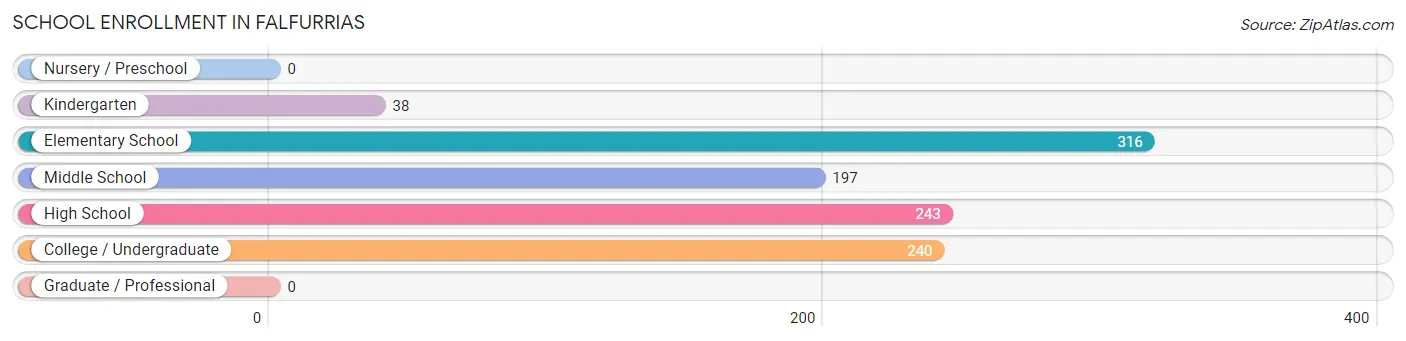
The most common levels of schooling among the 1,034 students in Falfurrias are elementary school (316 | 30.6%), high school (243 | 23.5%), and college / undergraduate (240 | 23.2%).
| School Level | # Students | % Students |
| Nursery / Preschool | 0 | 0.0% |
| Kindergarten | 38 | 3.7% |
| Elementary School | 316 | 30.6% |
| Middle School | 197 | 19.1% |
| High School | 243 | 23.5% |
| College / Undergraduate | 240 | 23.2% |
| Graduate / Professional | 0 | 0.0% |
| Total | 1,034 | 100.0% |
School Enrollment by Age by Funding Source in Falfurrias
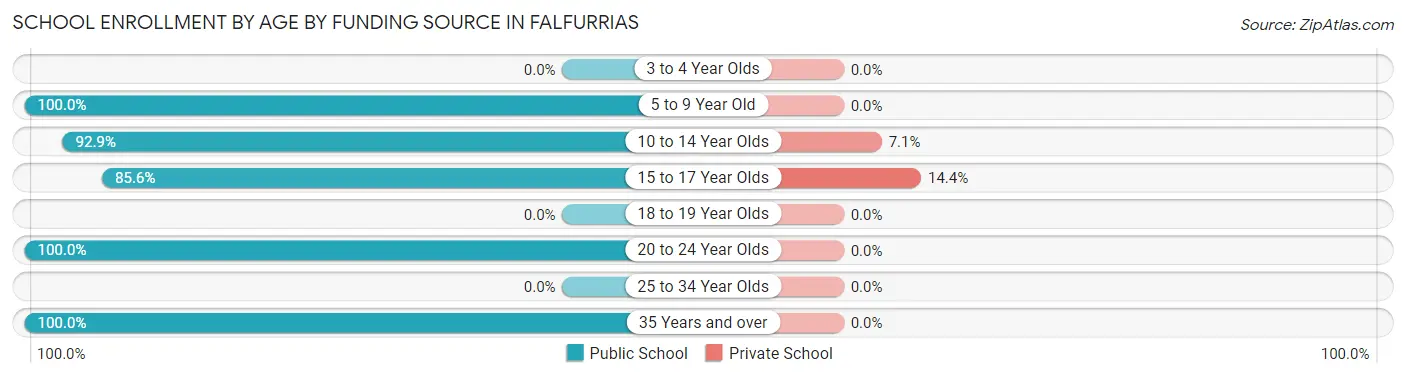
Out of a total of 1,034 students who are enrolled in schools in Falfurrias, 49 (4.7%) attend a private institution, while the remaining 985 (95.3%) are enrolled in public schools. The age group of 15 to 17 year olds has the highest likelihood of being enrolled in private schools, with 31 (14.4% in the age bracket) enrolled. Conversely, the age group of 5 to 9 year old has the lowest likelihood of being enrolled in a private school, with 297 (100.0% in the age bracket) attending a public institution.
| Age Bracket | Public School | Private School |
| 3 to 4 Year Olds | 0 (0.0%) | 0 (0.0%) |
| 5 to 9 Year Old | 297 (100.0%) | 0 (0.0%) |
| 10 to 14 Year Olds | 236 (92.9%) | 18 (7.1%) |
| 15 to 17 Year Olds | 184 (85.6%) | 31 (14.4%) |
| 18 to 19 Year Olds | 0 (0.0%) | 0 (0.0%) |
| 20 to 24 Year Olds | 240 (100.0%) | 0 (0.0%) |
| 25 to 34 Year Olds | 0 (0.0%) | 0 (0.0%) |
| 35 Years and over | 28 (100.0%) | 0 (0.0%) |
| Total | 985 (95.3%) | 49 (4.7%) |
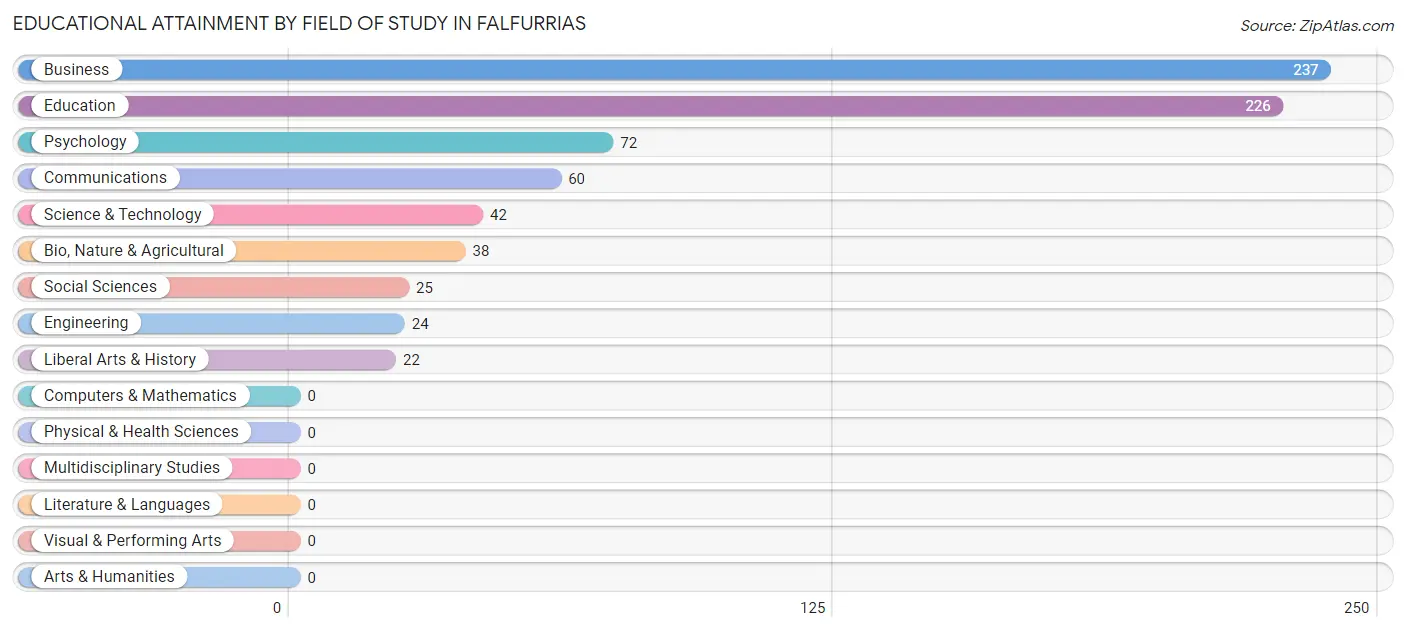
Educational Attainment by Field of Study in Falfurrias
Business (237 | 31.8%), education (226 | 30.3%), psychology (72 | 9.7%), communications (60 | 8.0%), and science & technology (42 | 5.6%) are the most common fields of study among 746 individuals in Falfurrias who have obtained a bachelor's degree or higher.
| Field of Study | # Graduates | % Graduates |
| Computers & Mathematics | 0 | 0.0% |
| Bio, Nature & Agricultural | 38 | 5.1% |
| Physical & Health Sciences | 0 | 0.0% |
| Psychology | 72 | 9.7% |
| Social Sciences | 25 | 3.4% |
| Engineering | 24 | 3.2% |
| Multidisciplinary Studies | 0 | 0.0% |
| Science & Technology | 42 | 5.6% |
| Business | 237 | 31.8% |
| Education | 226 | 30.3% |
| Literature & Languages | 0 | 0.0% |
| Liberal Arts & History | 22 | 2.9% |
| Visual & Performing Arts | 0 | 0.0% |
| Communications | 60 | 8.0% |
| Arts & Humanities | 0 | 0.0% |
| Total | 746 | 100.0% |
Transportation & Commute in Falfurrias
Vehicle Availability by Sex in Falfurrias
The most prevalent vehicle ownership categories in Falfurrias are males with 1 vehicle (621, accounting for 63.6%) and females with 1 vehicle (455, making up 60.9%).
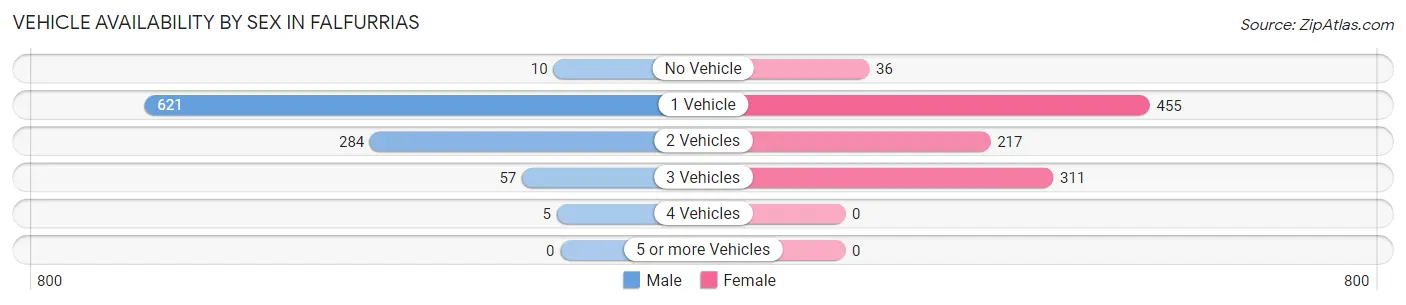
| Vehicles Available | Male | Female |
| No Vehicle | 10 (1.0%) | 36 (3.5%) |
| 1 Vehicle | 621 (63.6%) | 455 (44.7%) |
| 2 Vehicles | 284 (29.1%) | 217 (21.3%) |
| 3 Vehicles | 57 (5.8%) | 311 (30.5%) |
| 4 Vehicles | 5 (0.5%) | 0 (0.0%) |
| 5 or more Vehicles | 0 (0.0%) | 0 (0.0%) |
| Total | 977 (100.0%) | 1,019 (100.0%) |
Commute Time in Falfurrias
The most frequently occuring commute durations in Falfurrias are 5 to 9 minutes (882 commuters, 45.4%), less than 5 minutes (331 commuters, 17.0%), and 10 to 14 minutes (257 commuters, 13.2%).
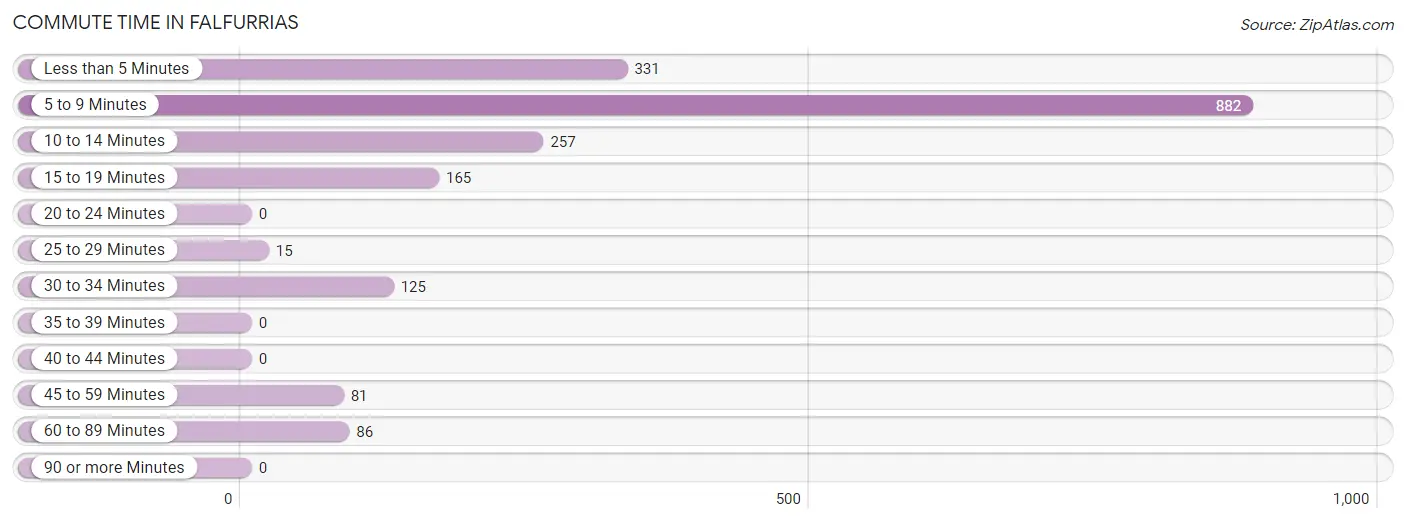
| Commute Time | # Commuters | % Commuters |
| Less than 5 Minutes | 331 | 17.0% |
| 5 to 9 Minutes | 882 | 45.4% |
| 10 to 14 Minutes | 257 | 13.2% |
| 15 to 19 Minutes | 165 | 8.5% |
| 20 to 24 Minutes | 0 | 0.0% |
| 25 to 29 Minutes | 15 | 0.8% |
| 30 to 34 Minutes | 125 | 6.4% |
| 35 to 39 Minutes | 0 | 0.0% |
| 40 to 44 Minutes | 0 | 0.0% |
| 45 to 59 Minutes | 81 | 4.2% |
| 60 to 89 Minutes | 86 | 4.4% |
| 90 or more Minutes | 0 | 0.0% |
Commute Time by Sex in Falfurrias
The most common commute times in Falfurrias are 5 to 9 minutes (495 commuters, 51.3%) for males and 5 to 9 minutes (387 commuters, 39.6%) for females.
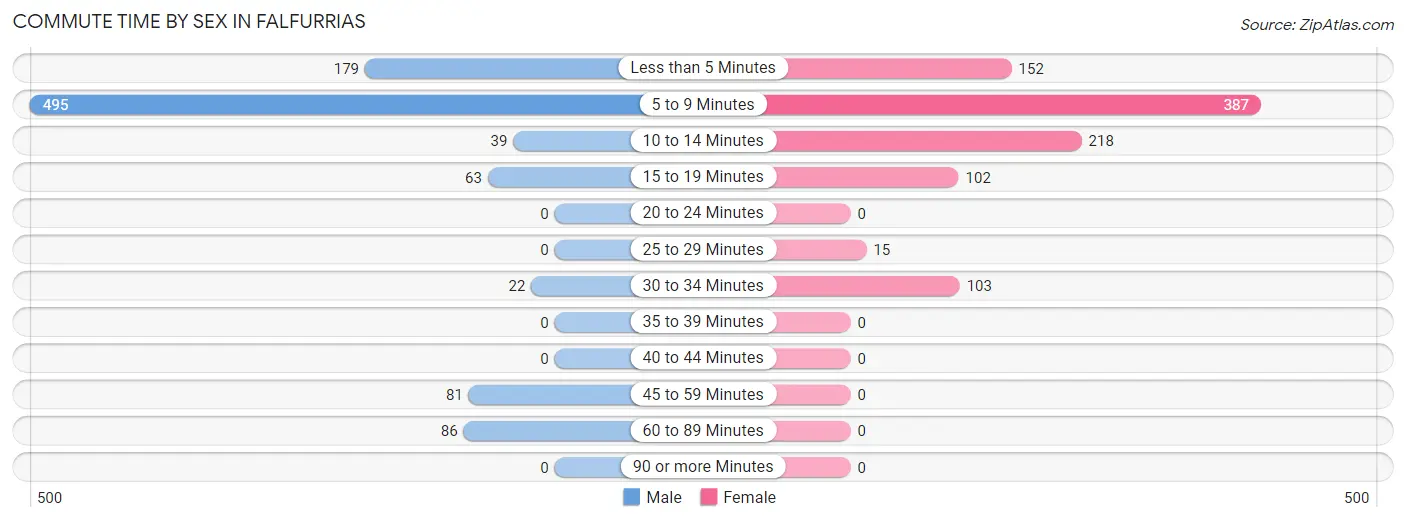
| Commute Time | Male | Female |
| Less than 5 Minutes | 179 (18.5%) | 152 (15.6%) |
| 5 to 9 Minutes | 495 (51.3%) | 387 (39.6%) |
| 10 to 14 Minutes | 39 (4.0%) | 218 (22.3%) |
| 15 to 19 Minutes | 63 (6.5%) | 102 (10.4%) |
| 20 to 24 Minutes | 0 (0.0%) | 0 (0.0%) |
| 25 to 29 Minutes | 0 (0.0%) | 15 (1.5%) |
| 30 to 34 Minutes | 22 (2.3%) | 103 (10.5%) |
| 35 to 39 Minutes | 0 (0.0%) | 0 (0.0%) |
| 40 to 44 Minutes | 0 (0.0%) | 0 (0.0%) |
| 45 to 59 Minutes | 81 (8.4%) | 0 (0.0%) |
| 60 to 89 Minutes | 86 (8.9%) | 0 (0.0%) |
| 90 or more Minutes | 0 (0.0%) | 0 (0.0%) |
Time of Departure to Work by Sex in Falfurrias
The most frequent times of departure to work in Falfurrias are 9:00 AM to 9:59 AM (209, 21.7%) for males and 8:00 AM to 8:29 AM (370, 37.9%) for females.
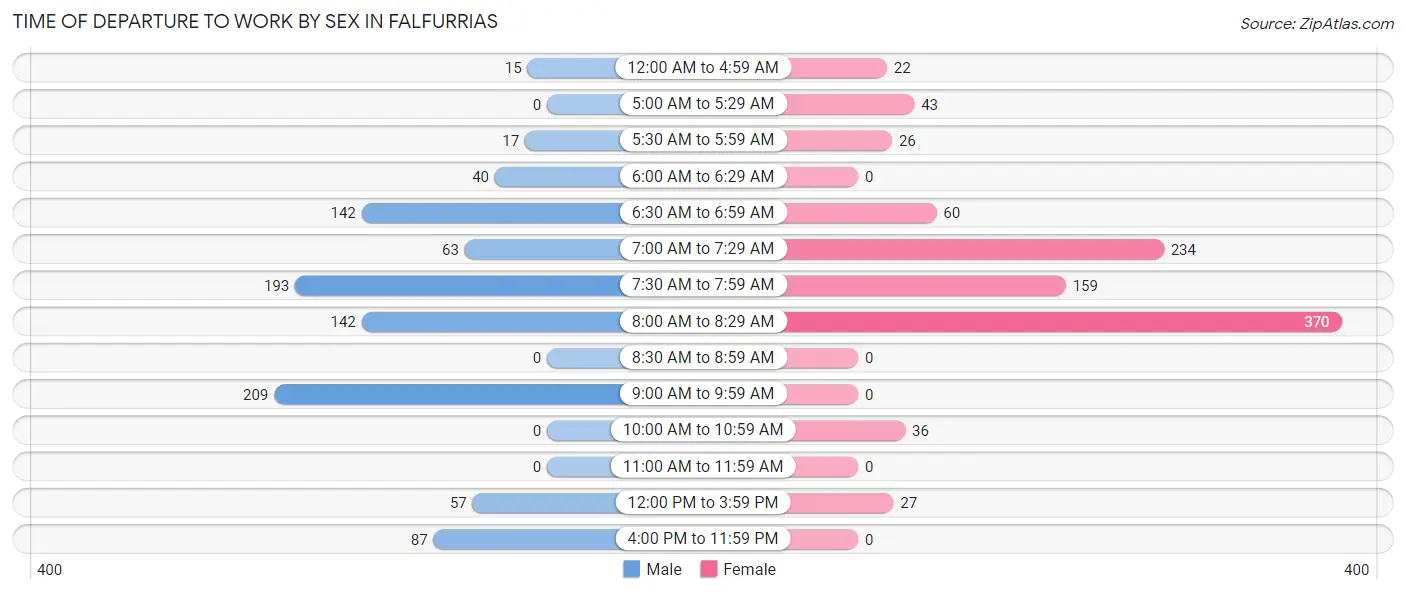
| Time of Departure | Male | Female |
| 12:00 AM to 4:59 AM | 15 (1.5%) | 22 (2.2%) |
| 5:00 AM to 5:29 AM | 0 (0.0%) | 43 (4.4%) |
| 5:30 AM to 5:59 AM | 17 (1.8%) | 26 (2.7%) |
| 6:00 AM to 6:29 AM | 40 (4.2%) | 0 (0.0%) |
| 6:30 AM to 6:59 AM | 142 (14.7%) | 60 (6.1%) |
| 7:00 AM to 7:29 AM | 63 (6.5%) | 234 (23.9%) |
| 7:30 AM to 7:59 AM | 193 (20.0%) | 159 (16.3%) |
| 8:00 AM to 8:29 AM | 142 (14.7%) | 370 (37.9%) |
| 8:30 AM to 8:59 AM | 0 (0.0%) | 0 (0.0%) |
| 9:00 AM to 9:59 AM | 209 (21.7%) | 0 (0.0%) |
| 10:00 AM to 10:59 AM | 0 (0.0%) | 36 (3.7%) |
| 11:00 AM to 11:59 AM | 0 (0.0%) | 0 (0.0%) |
| 12:00 PM to 3:59 PM | 57 (5.9%) | 27 (2.8%) |
| 4:00 PM to 11:59 PM | 87 (9.0%) | 0 (0.0%) |
| Total | 965 (100.0%) | 977 (100.0%) |
Housing Occupancy in Falfurrias
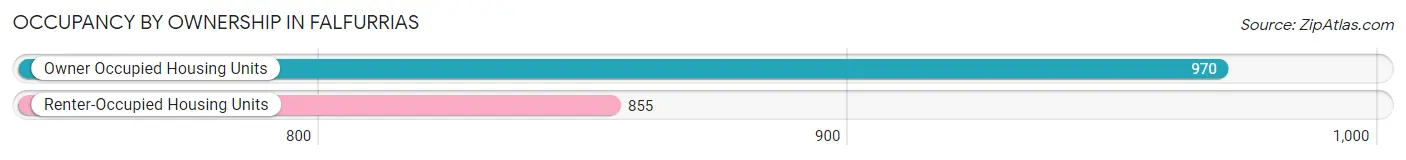
Occupancy by Ownership in Falfurrias
Of the total 1,825 dwellings in Falfurrias, owner-occupied units account for 970 (53.1%), while renter-occupied units make up 855 (46.9%).
| Occupancy | # Housing Units | % Housing Units |
| Owner Occupied Housing Units | 970 | 53.1% |
| Renter-Occupied Housing Units | 855 | 46.9% |
| Total Occupied Housing Units | 1,825 | 100.0% |
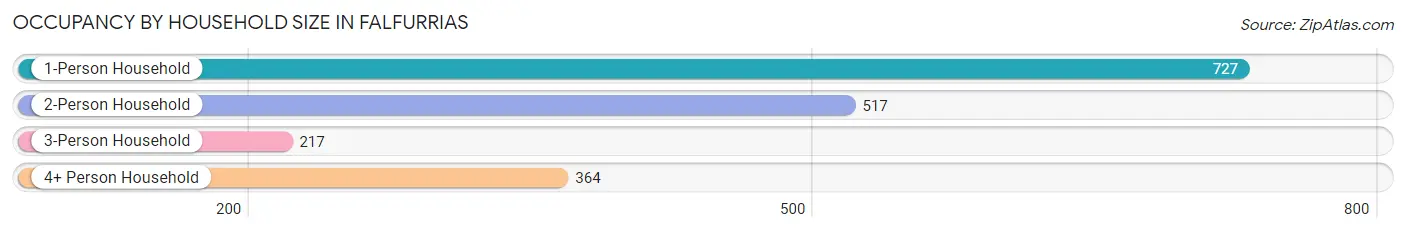
Occupancy by Household Size in Falfurrias
| Household Size | # Housing Units | % Housing Units |
| 1-Person Household | 727 | 39.8% |
| 2-Person Household | 517 | 28.3% |
| 3-Person Household | 217 | 11.9% |
| 4+ Person Household | 364 | 20.0% |
| Total Housing Units | 1,825 | 100.0% |
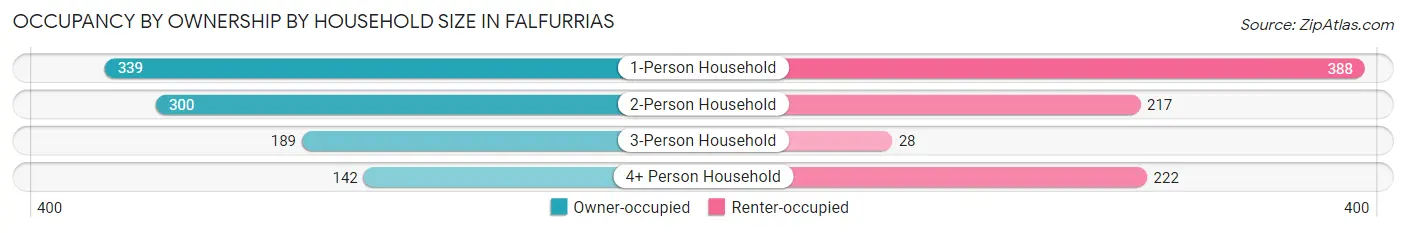
Occupancy by Ownership by Household Size in Falfurrias
| Household Size | Owner-occupied | Renter-occupied |
| 1-Person Household | 339 (46.6%) | 388 (53.4%) |
| 2-Person Household | 300 (58.0%) | 217 (42.0%) |
| 3-Person Household | 189 (87.1%) | 28 (12.9%) |
| 4+ Person Household | 142 (39.0%) | 222 (61.0%) |
| Total Housing Units | 970 (53.1%) | 855 (46.9%) |
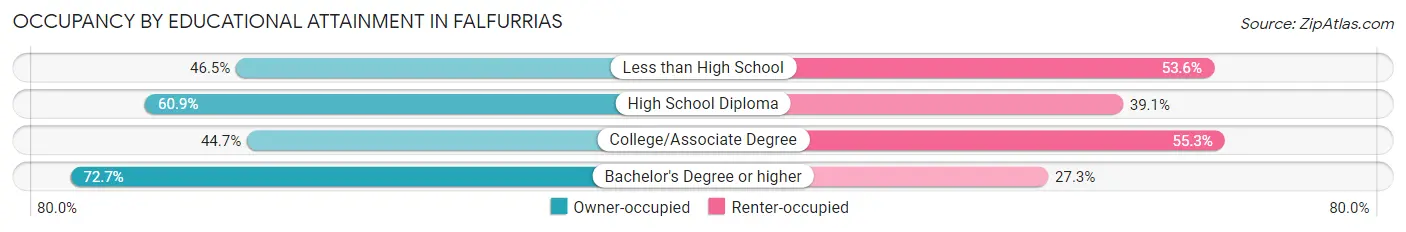
Occupancy by Educational Attainment in Falfurrias
| Household Size | Owner-occupied | Renter-occupied |
| Less than High School | 203 (46.5%) | 234 (53.5%) |
| High School Diploma | 249 (60.9%) | 160 (39.1%) |
| College/Associate Degree | 310 (44.7%) | 383 (55.3%) |
| Bachelor's Degree or higher | 208 (72.7%) | 78 (27.3%) |
Occupancy by Age of Householder in Falfurrias
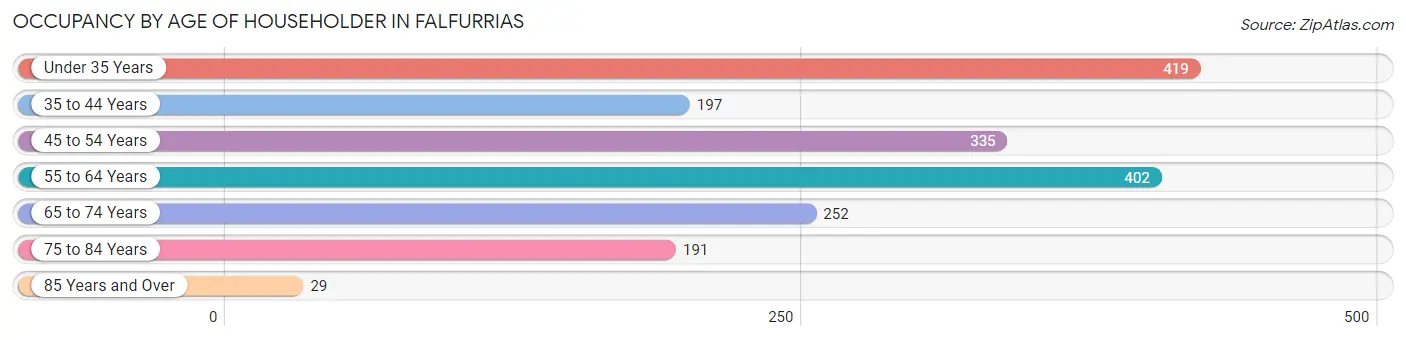
| Age Bracket | # Households | % Households |
| Under 35 Years | 419 | 23.0% |
| 35 to 44 Years | 197 | 10.8% |
| 45 to 54 Years | 335 | 18.4% |
| 55 to 64 Years | 402 | 22.0% |
| 65 to 74 Years | 252 | 13.8% |
| 75 to 84 Years | 191 | 10.5% |
| 85 Years and Over | 29 | 1.6% |
| Total | 1,825 | 100.0% |
Housing Finances in Falfurrias
Median Income by Occupancy in Falfurrias
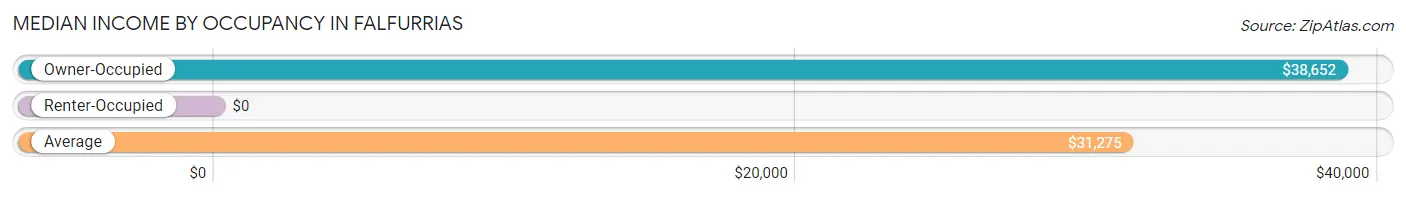
| Occupancy Type | # Households | Median Income |
| Owner-Occupied | 970 (53.1%) | $38,652 |
| Renter-Occupied | 855 (46.9%) | $0 |
| Average | 1,825 (100.0%) | $31,275 |
Occupancy by Householder Income Bracket in Falfurrias
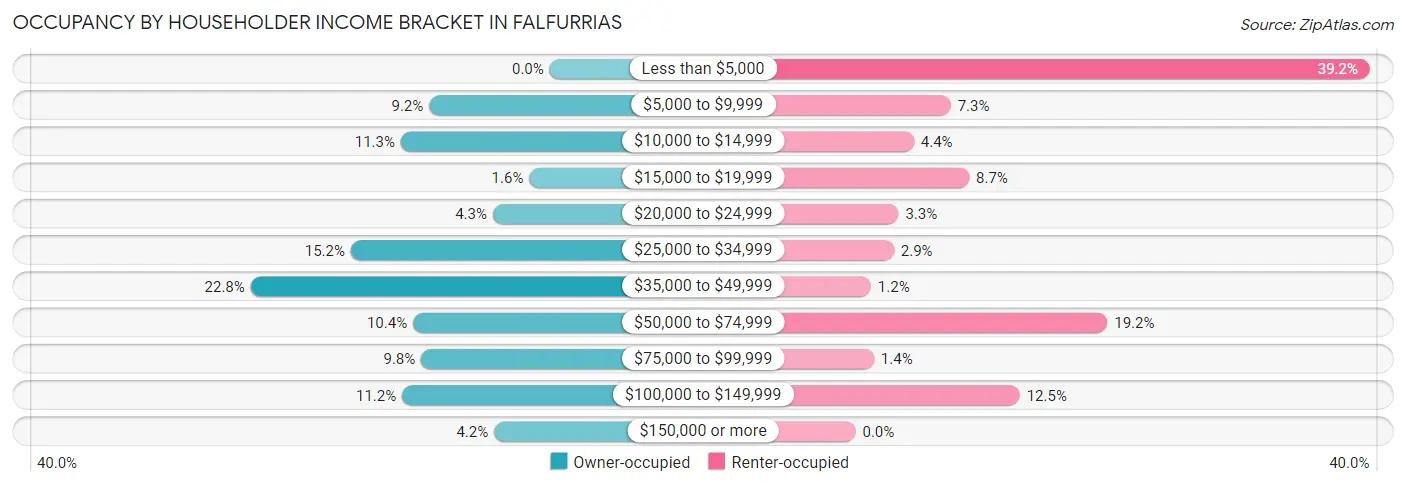
| Income Bracket | Owner-occupied | Renter-occupied |
| Less than $5,000 | 0 (0.0%) | 335 (39.2%) |
| $5,000 to $9,999 | 89 (9.2%) | 62 (7.2%) |
| $10,000 to $14,999 | 110 (11.3%) | 38 (4.4%) |
| $15,000 to $19,999 | 15 (1.5%) | 74 (8.6%) |
| $20,000 to $24,999 | 42 (4.3%) | 28 (3.3%) |
| $25,000 to $34,999 | 147 (15.1%) | 25 (2.9%) |
| $35,000 to $49,999 | 221 (22.8%) | 10 (1.2%) |
| $50,000 to $74,999 | 101 (10.4%) | 164 (19.2%) |
| $75,000 to $99,999 | 95 (9.8%) | 12 (1.4%) |
| $100,000 to $149,999 | 109 (11.2%) | 107 (12.5%) |
| $150,000 or more | 41 (4.2%) | 0 (0.0%) |
| Total | 970 (100.0%) | 855 (100.0%) |
Monthly Housing Cost Tiers in Falfurrias
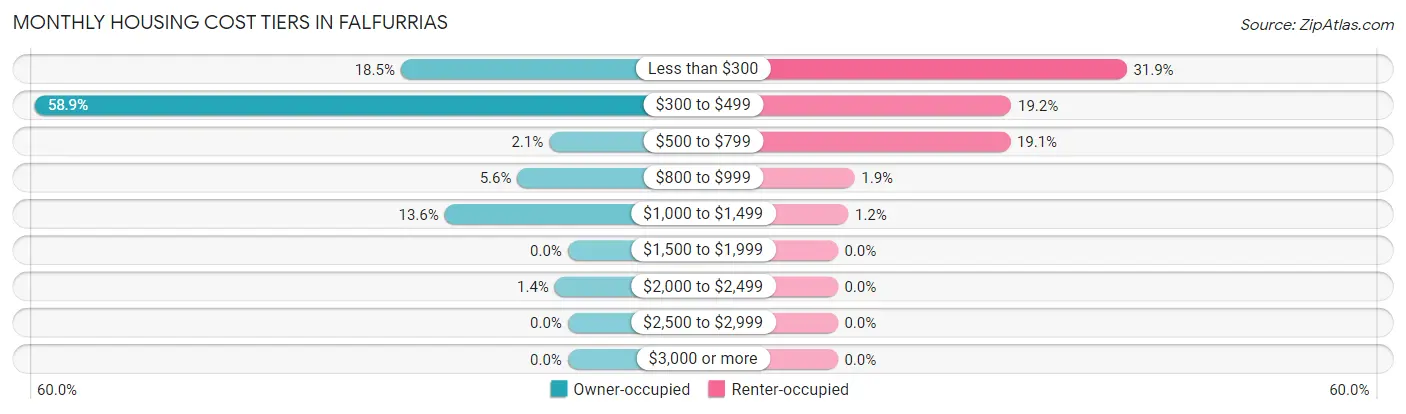
| Monthly Cost | Owner-occupied | Renter-occupied |
| Less than $300 | 179 (18.4%) | 273 (31.9%) |
| $300 to $499 | 571 (58.9%) | 164 (19.2%) |
| $500 to $799 | 20 (2.1%) | 163 (19.1%) |
| $800 to $999 | 54 (5.6%) | 16 (1.9%) |
| $1,000 to $1,499 | 132 (13.6%) | 10 (1.2%) |
| $1,500 to $1,999 | 0 (0.0%) | 0 (0.0%) |
| $2,000 to $2,499 | 14 (1.4%) | 0 (0.0%) |
| $2,500 to $2,999 | 0 (0.0%) | 0 (0.0%) |
| $3,000 or more | 0 (0.0%) | 0 (0.0%) |
| Total | 970 (100.0%) | 855 (100.0%) |
Physical Housing Characteristics in Falfurrias
Housing Structures in Falfurrias
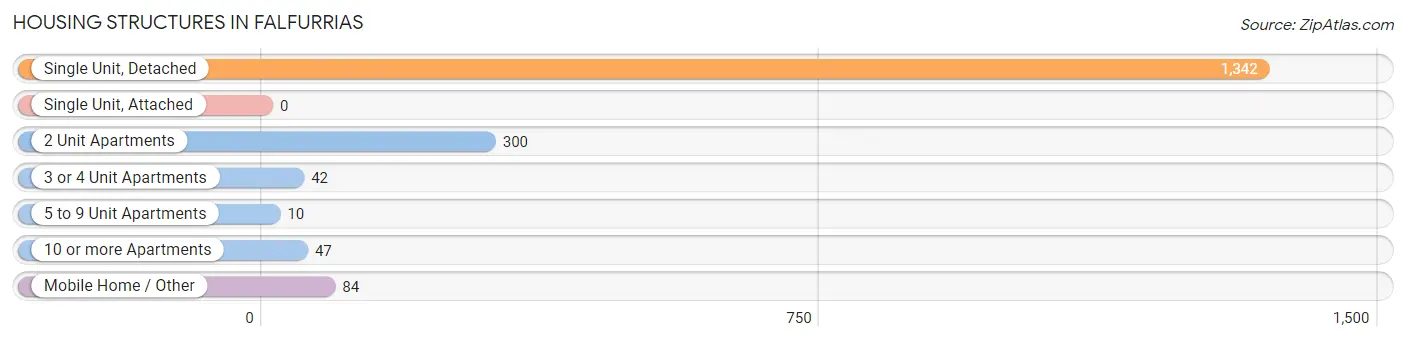
| Structure Type | # Housing Units | % Housing Units |
| Single Unit, Detached | 1,342 | 73.5% |
| Single Unit, Attached | 0 | 0.0% |
| 2 Unit Apartments | 300 | 16.4% |
| 3 or 4 Unit Apartments | 42 | 2.3% |
| 5 to 9 Unit Apartments | 10 | 0.5% |
| 10 or more Apartments | 47 | 2.6% |
| Mobile Home / Other | 84 | 4.6% |
| Total | 1,825 | 100.0% |
Housing Structures by Occupancy in Falfurrias
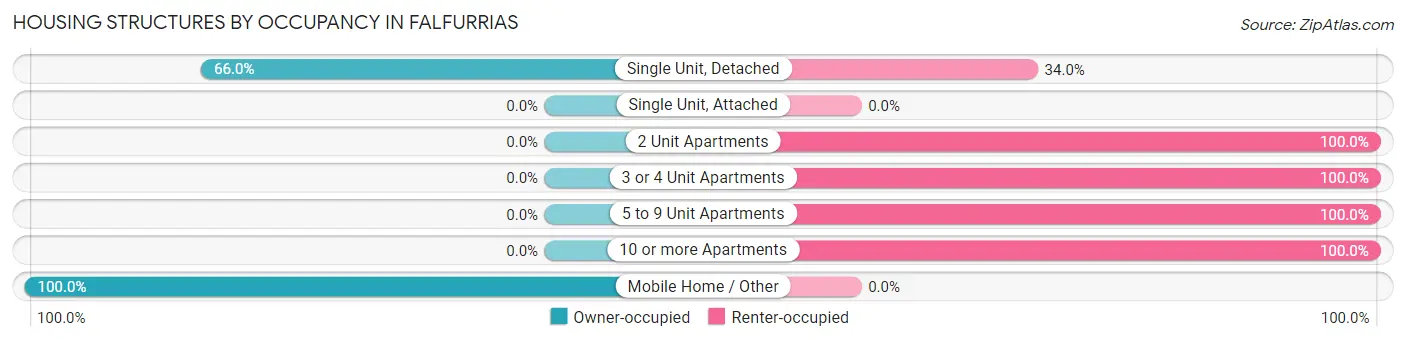
| Structure Type | Owner-occupied | Renter-occupied |
| Single Unit, Detached | 886 (66.0%) | 456 (34.0%) |
| Single Unit, Attached | 0 (0.0%) | 0 (0.0%) |
| 2 Unit Apartments | 0 (0.0%) | 300 (100.0%) |
| 3 or 4 Unit Apartments | 0 (0.0%) | 42 (100.0%) |
| 5 to 9 Unit Apartments | 0 (0.0%) | 10 (100.0%) |
| 10 or more Apartments | 0 (0.0%) | 47 (100.0%) |
| Mobile Home / Other | 84 (100.0%) | 0 (0.0%) |
| Total | 970 (53.1%) | 855 (46.9%) |
Housing Structures by Number of Rooms in Falfurrias
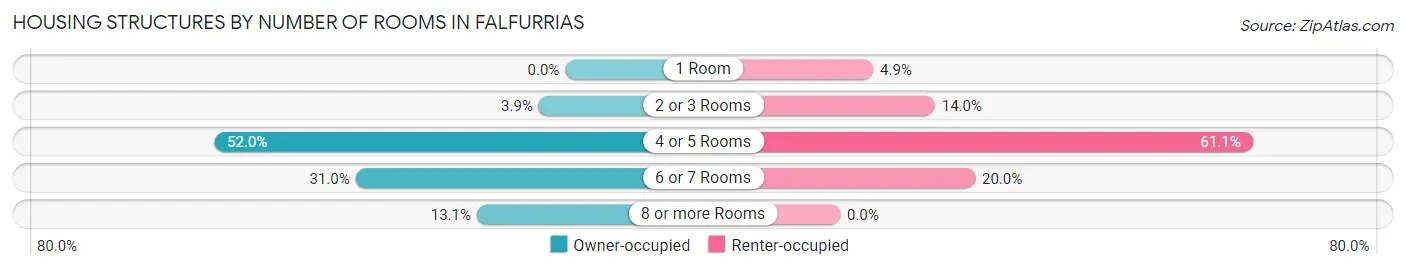
| Number of Rooms | Owner-occupied | Renter-occupied |
| 1 Room | 0 (0.0%) | 42 (4.9%) |
| 2 or 3 Rooms | 38 (3.9%) | 120 (14.0%) |
| 4 or 5 Rooms | 504 (52.0%) | 522 (61.1%) |
| 6 or 7 Rooms | 301 (31.0%) | 171 (20.0%) |
| 8 or more Rooms | 127 (13.1%) | 0 (0.0%) |
| Total | 970 (100.0%) | 855 (100.0%) |
Housing Structure by Heating Type in Falfurrias
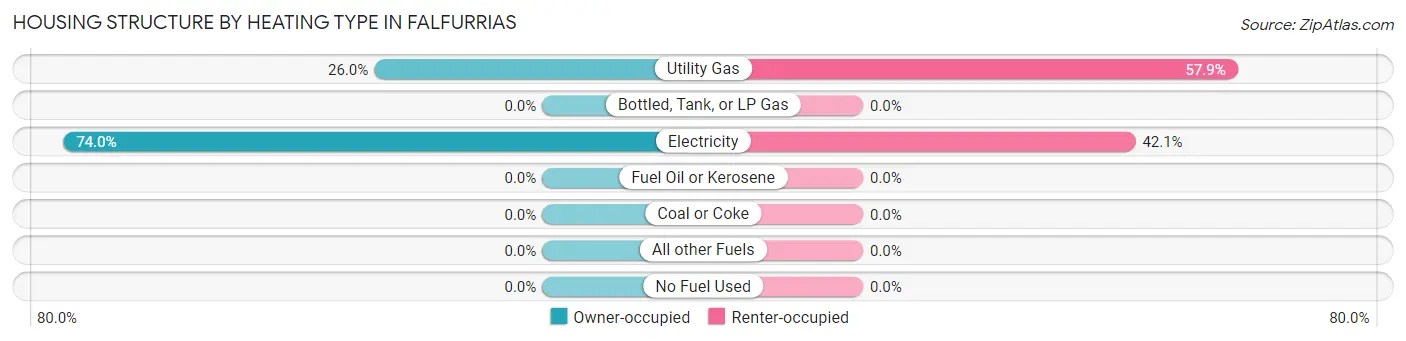
| Heating Type | Owner-occupied | Renter-occupied |
| Utility Gas | 252 (26.0%) | 495 (57.9%) |
| Bottled, Tank, or LP Gas | 0 (0.0%) | 0 (0.0%) |
| Electricity | 718 (74.0%) | 360 (42.1%) |
| Fuel Oil or Kerosene | 0 (0.0%) | 0 (0.0%) |
| Coal or Coke | 0 (0.0%) | 0 (0.0%) |
| All other Fuels | 0 (0.0%) | 0 (0.0%) |
| No Fuel Used | 0 (0.0%) | 0 (0.0%) |
| Total | 970 (100.0%) | 855 (100.0%) |
Household Vehicle Usage in Falfurrias
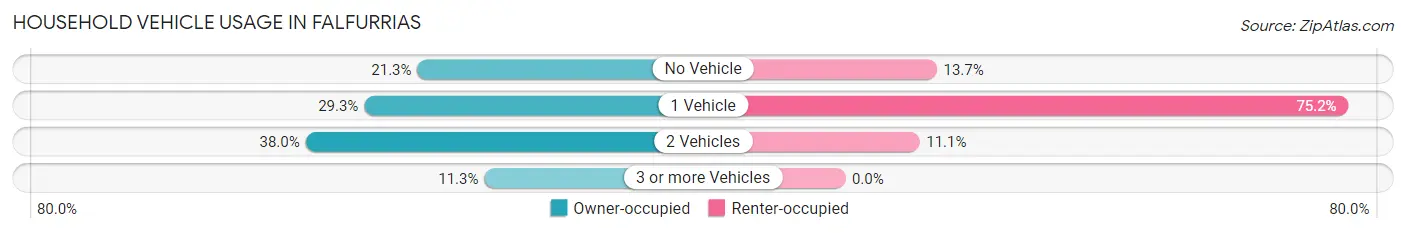
| Vehicles per Household | Owner-occupied | Renter-occupied |
| No Vehicle | 207 (21.3%) | 117 (13.7%) |
| 1 Vehicle | 284 (29.3%) | 643 (75.2%) |
| 2 Vehicles | 369 (38.0%) | 95 (11.1%) |
| 3 or more Vehicles | 110 (11.3%) | 0 (0.0%) |
| Total | 970 (100.0%) | 855 (100.0%) |
Real Estate & Mortgages in Falfurrias
Real Estate and Mortgage Overview in Falfurrias
| Characteristic | Without Mortgage | With Mortgage |
| Housing Units | 785 | 185 |
| Median Property Value | $59,400 | $83,900 |
| Median Household Income | $37,873 | $0 |
| Monthly Housing Costs | $382 | $0 |
| Real Estate Taxes | $597 | $0 |
Property Value by Mortgage Status in Falfurrias
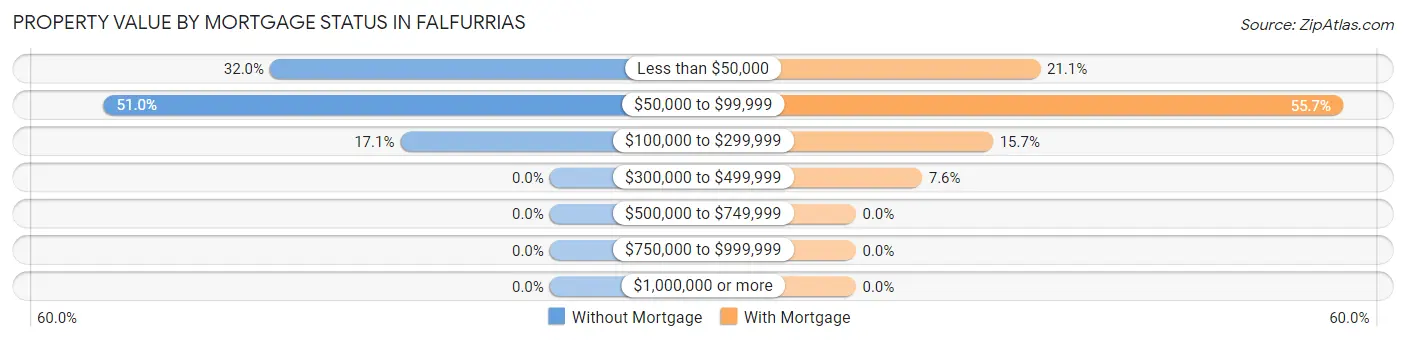
| Property Value | Without Mortgage | With Mortgage |
| Less than $50,000 | 251 (32.0%) | 39 (21.1%) |
| $50,000 to $99,999 | 400 (51.0%) | 103 (55.7%) |
| $100,000 to $299,999 | 134 (17.1%) | 29 (15.7%) |
| $300,000 to $499,999 | 0 (0.0%) | 14 (7.6%) |
| $500,000 to $749,999 | 0 (0.0%) | 0 (0.0%) |
| $750,000 to $999,999 | 0 (0.0%) | 0 (0.0%) |
| $1,000,000 or more | 0 (0.0%) | 0 (0.0%) |
| Total | 785 (100.0%) | 185 (100.0%) |
Household Income by Mortgage Status in Falfurrias
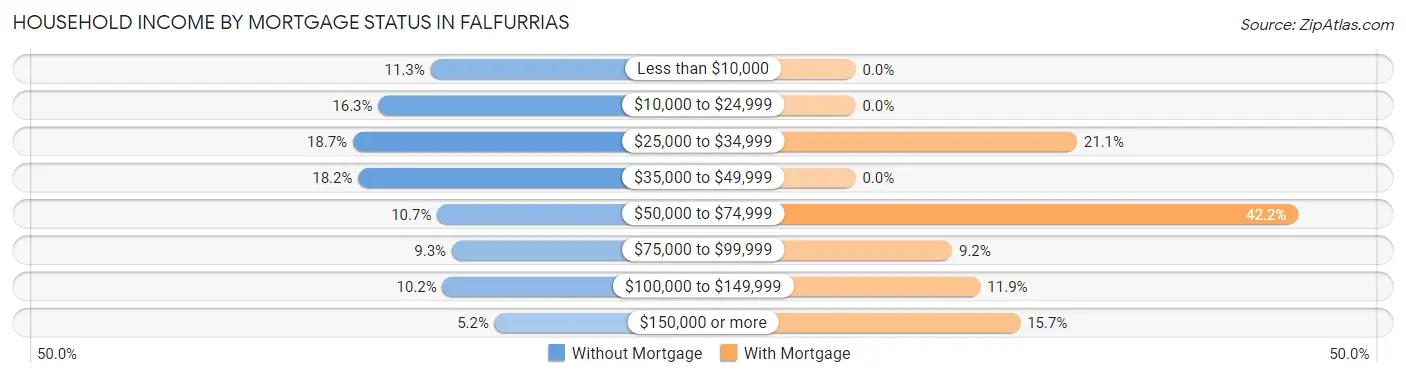
| Household Income | Without Mortgage | With Mortgage |
| Less than $10,000 | 89 (11.3%) | 0 (0.0%) |
| $10,000 to $24,999 | 128 (16.3%) | 0 (0.0%) |
| $25,000 to $34,999 | 147 (18.7%) | 39 (21.1%) |
| $35,000 to $49,999 | 143 (18.2%) | 0 (0.0%) |
| $50,000 to $74,999 | 84 (10.7%) | 78 (42.2%) |
| $75,000 to $99,999 | 73 (9.3%) | 17 (9.2%) |
| $100,000 to $149,999 | 80 (10.2%) | 22 (11.9%) |
| $150,000 or more | 41 (5.2%) | 29 (15.7%) |
| Total | 785 (100.0%) | 185 (100.0%) |
Property Value to Household Income Ratio in Falfurrias
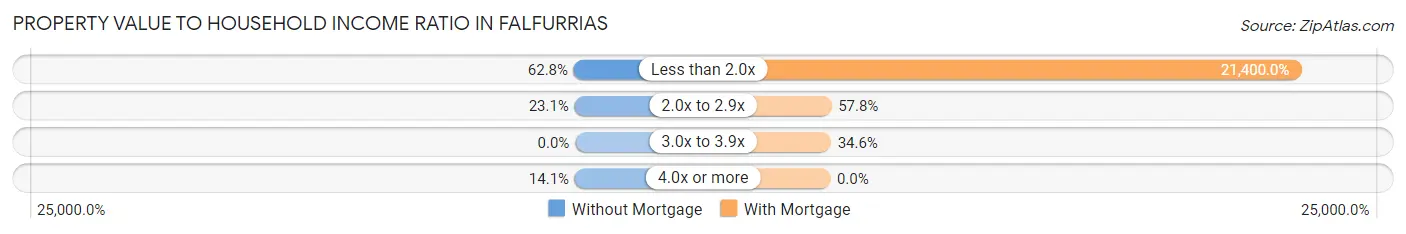
| Value-to-Income Ratio | Without Mortgage | With Mortgage |
| Less than 2.0x | 493 (62.8%) | 39,590 (21,400.0%) |
| 2.0x to 2.9x | 181 (23.1%) | 107 (57.8%) |
| 3.0x to 3.9x | 0 (0.0%) | 64 (34.6%) |
| 4.0x or more | 111 (14.1%) | 0 (0.0%) |
| Total | 785 (100.0%) | 185 (100.0%) |
Real Estate Taxes by Mortgage Status in Falfurrias
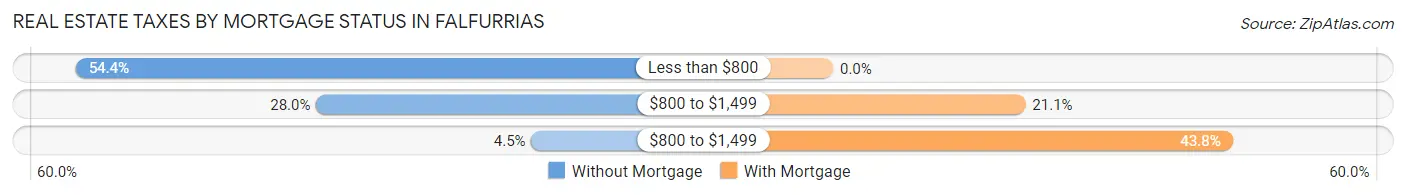
| Property Taxes | Without Mortgage | With Mortgage |
| Less than $800 | 427 (54.4%) | 0 (0.0%) |
| $800 to $1,499 | 220 (28.0%) | 39 (21.1%) |
| $800 to $1,499 | 35 (4.5%) | 81 (43.8%) |
| Total | 785 (100.0%) | 185 (100.0%) |
Health & Disability in Falfurrias
Health Insurance Coverage by Age in Falfurrias
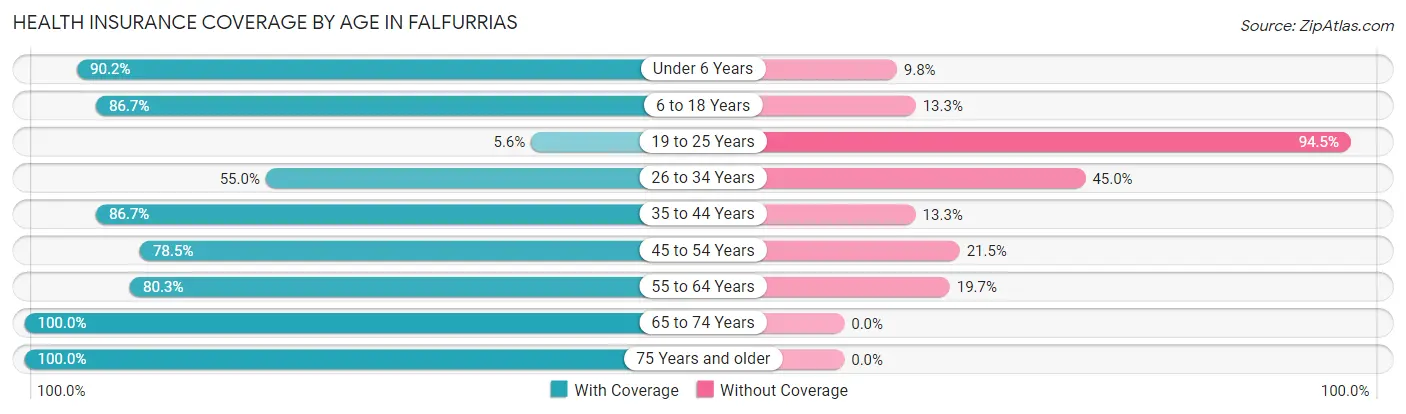
| Age Bracket | With Coverage | Without Coverage |
| Under 6 Years | 276 (90.2%) | 30 (9.8%) |
| 6 to 18 Years | 631 (86.7%) | 97 (13.3%) |
| 19 to 25 Years | 31 (5.6%) | 528 (94.5%) |
| 26 to 34 Years | 219 (55.0%) | 179 (45.0%) |
| 35 to 44 Years | 417 (86.7%) | 64 (13.3%) |
| 45 to 54 Years | 383 (78.5%) | 105 (21.5%) |
| 55 to 64 Years | 453 (80.3%) | 111 (19.7%) |
| 65 to 74 Years | 521 (100.0%) | 0 (0.0%) |
| 75 Years and older | 284 (100.0%) | 0 (0.0%) |
| Total | 3,215 (74.3%) | 1,114 (25.7%) |
Health Insurance Coverage by Citizenship Status in Falfurrias

| Citizenship Status | With Coverage | Without Coverage |
| Native Born | 276 (90.2%) | 30 (9.8%) |
| Foreign Born, Citizen | 631 (86.7%) | 97 (13.3%) |
| Foreign Born, not a Citizen | 31 (5.6%) | 528 (94.5%) |
Health Insurance Coverage by Household Income in Falfurrias
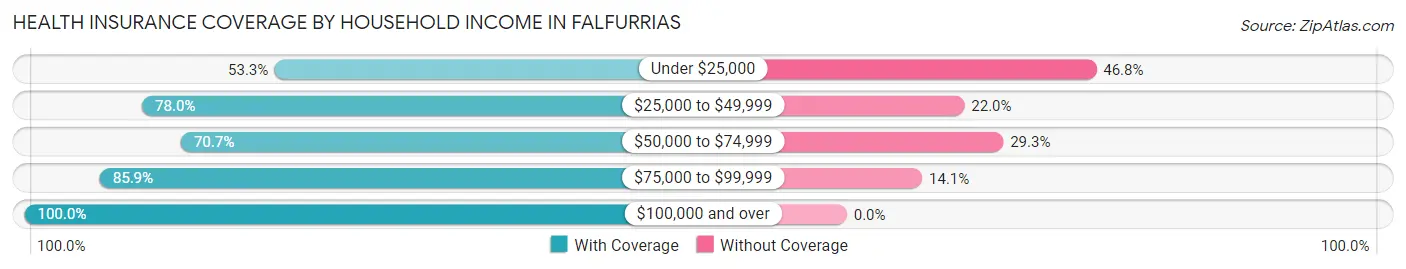
| Household Income | With Coverage | Without Coverage |
| Under $25,000 | 769 (53.2%) | 675 (46.8%) |
| $25,000 to $49,999 | 761 (78.0%) | 215 (22.0%) |
| $50,000 to $74,999 | 451 (70.7%) | 187 (29.3%) |
| $75,000 to $99,999 | 213 (85.9%) | 35 (14.1%) |
| $100,000 and over | 1,021 (100.0%) | 0 (0.0%) |
Public vs Private Health Insurance Coverage by Age in Falfurrias
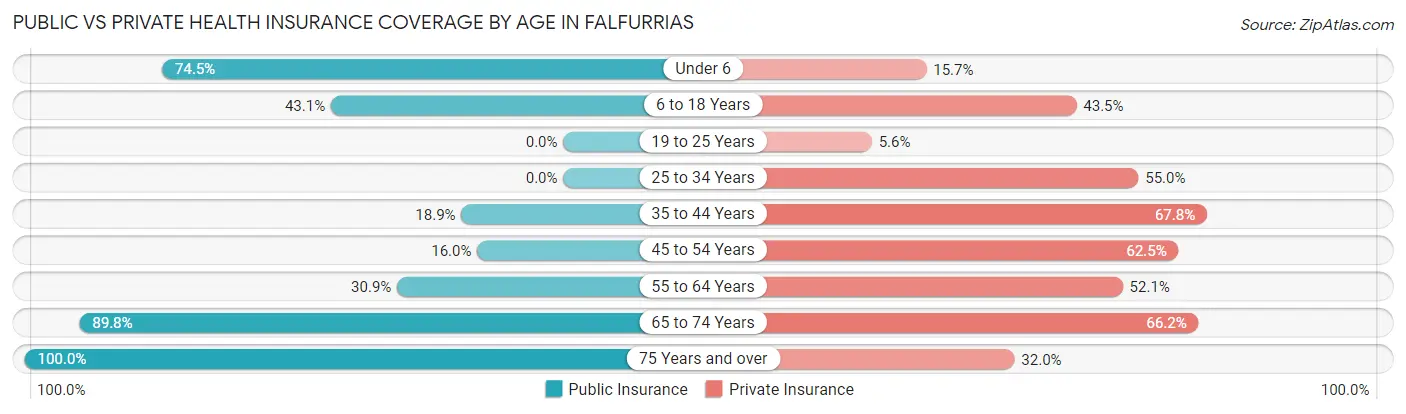
| Age Bracket | Public Insurance | Private Insurance |
| Under 6 | 228 (74.5%) | 48 (15.7%) |
| 6 to 18 Years | 314 (43.1%) | 317 (43.5%) |
| 19 to 25 Years | 0 (0.0%) | 31 (5.6%) |
| 25 to 34 Years | 0 (0.0%) | 219 (55.0%) |
| 35 to 44 Years | 91 (18.9%) | 326 (67.8%) |
| 45 to 54 Years | 78 (16.0%) | 305 (62.5%) |
| 55 to 64 Years | 174 (30.8%) | 294 (52.1%) |
| 65 to 74 Years | 468 (89.8%) | 345 (66.2%) |
| 75 Years and over | 284 (100.0%) | 91 (32.0%) |
| Total | 1,637 (37.8%) | 1,976 (45.7%) |
Disability Status by Sex by Age in Falfurrias
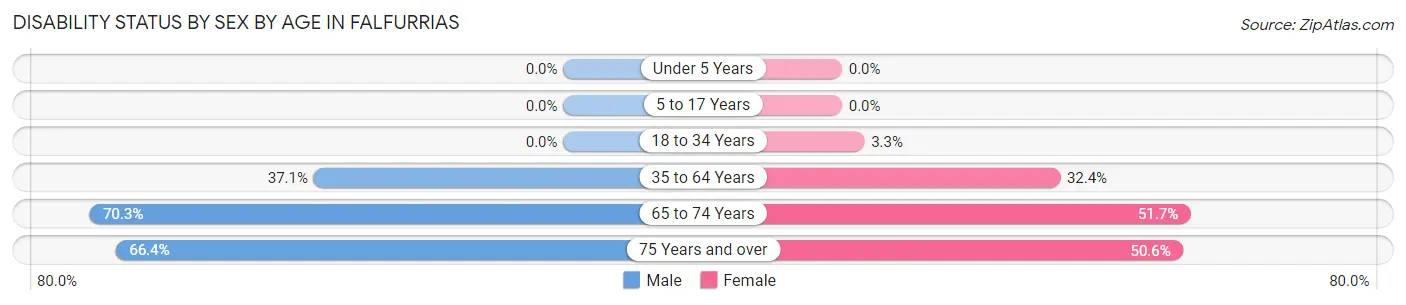
| Age Bracket | Male | Female |
| Under 5 Years | 0 (0.0%) | 0 (0.0%) |
| 5 to 17 Years | 0 (0.0%) | 0 (0.0%) |
| 18 to 34 Years | 0 (0.0%) | 15 (3.3%) |
| 35 to 64 Years | 242 (37.1%) | 285 (32.4%) |
| 65 to 74 Years | 97 (70.3%) | 198 (51.7%) |
| 75 Years and over | 77 (66.4%) | 85 (50.6%) |
Disability Class by Sex by Age in Falfurrias
Disability Class: Hearing Difficulty
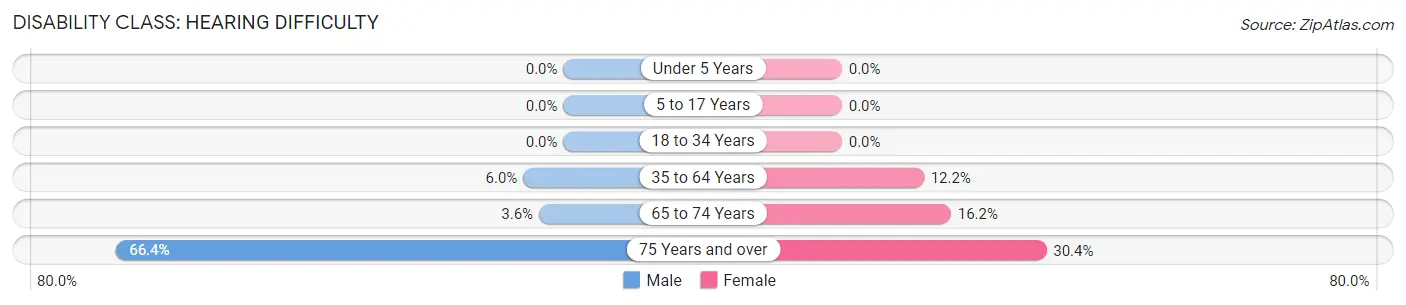
| Age Bracket | Male | Female |
| Under 5 Years | 0 (0.0%) | 0 (0.0%) |
| 5 to 17 Years | 0 (0.0%) | 0 (0.0%) |
| 18 to 34 Years | 0 (0.0%) | 0 (0.0%) |
| 35 to 64 Years | 39 (6.0%) | 107 (12.2%) |
| 65 to 74 Years | 5 (3.6%) | 62 (16.2%) |
| 75 Years and over | 77 (66.4%) | 51 (30.4%) |
Disability Class: Vision Difficulty
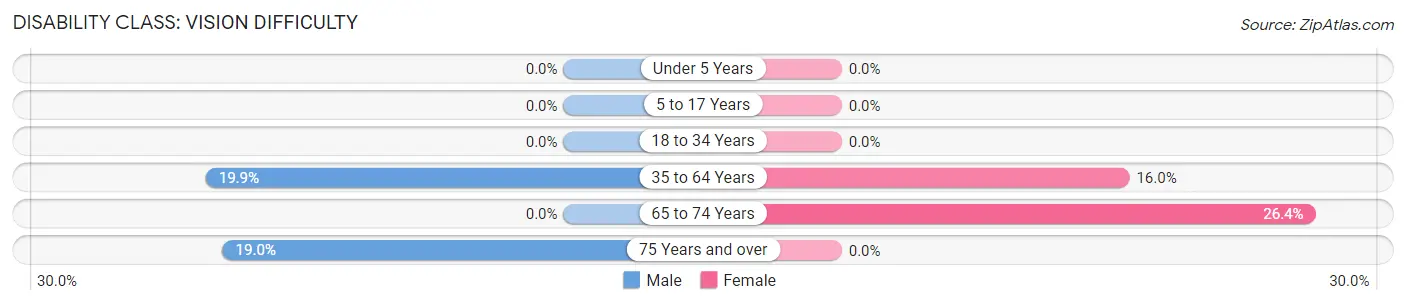
| Age Bracket | Male | Female |
| Under 5 Years | 0 (0.0%) | 0 (0.0%) |
| 5 to 17 Years | 0 (0.0%) | 0 (0.0%) |
| 18 to 34 Years | 0 (0.0%) | 0 (0.0%) |
| 35 to 64 Years | 130 (19.9%) | 141 (16.0%) |
| 65 to 74 Years | 0 (0.0%) | 101 (26.4%) |
| 75 Years and over | 22 (19.0%) | 0 (0.0%) |
Disability Class: Cognitive Difficulty
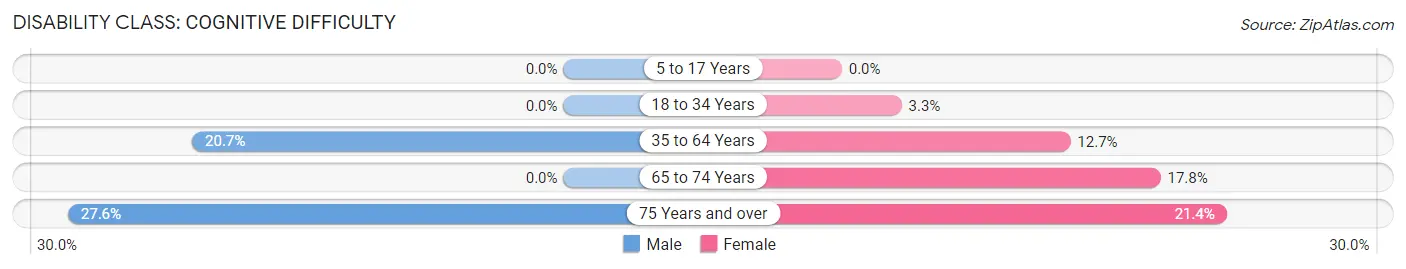
| Age Bracket | Male | Female |
| 5 to 17 Years | 0 (0.0%) | 0 (0.0%) |
| 18 to 34 Years | 0 (0.0%) | 15 (3.3%) |
| 35 to 64 Years | 135 (20.7%) | 112 (12.7%) |
| 65 to 74 Years | 0 (0.0%) | 68 (17.7%) |
| 75 Years and over | 32 (27.6%) | 36 (21.4%) |
Disability Class: Ambulatory Difficulty
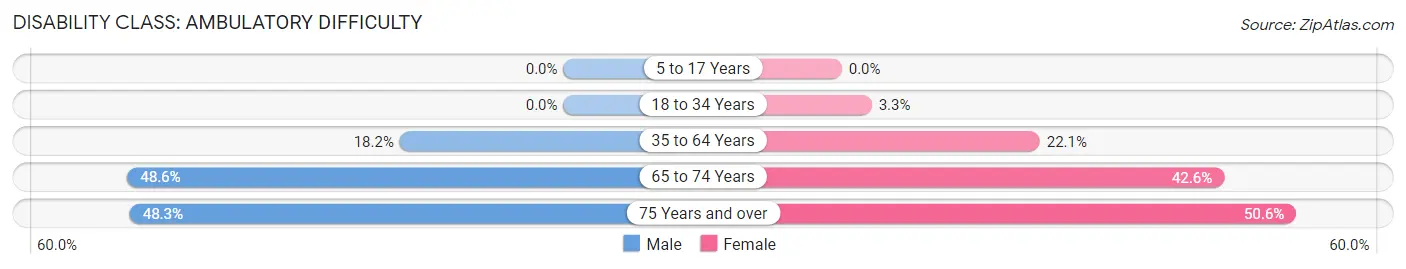
| Age Bracket | Male | Female |
| 5 to 17 Years | 0 (0.0%) | 0 (0.0%) |
| 18 to 34 Years | 0 (0.0%) | 15 (3.3%) |
| 35 to 64 Years | 119 (18.2%) | 194 (22.1%) |
| 65 to 74 Years | 67 (48.5%) | 163 (42.6%) |
| 75 Years and over | 56 (48.3%) | 85 (50.6%) |
Disability Class: Self-Care Difficulty
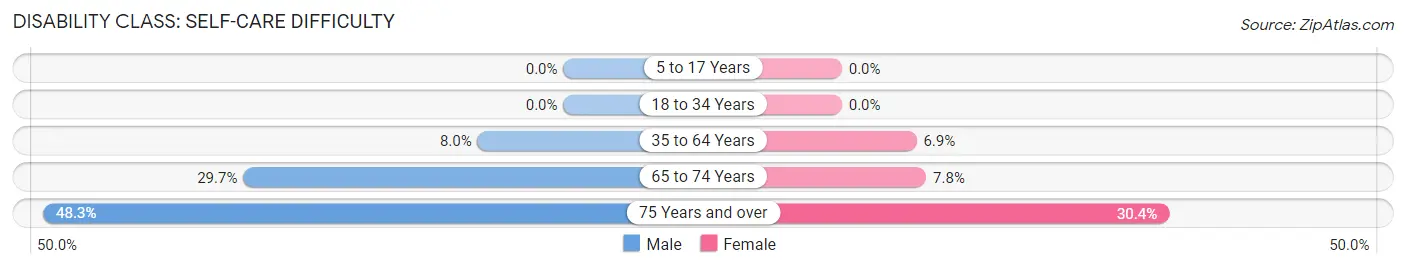
| Age Bracket | Male | Female |
| 5 to 17 Years | 0 (0.0%) | 0 (0.0%) |
| 18 to 34 Years | 0 (0.0%) | 0 (0.0%) |
| 35 to 64 Years | 52 (8.0%) | 61 (6.9%) |
| 65 to 74 Years | 41 (29.7%) | 30 (7.8%) |
| 75 Years and over | 56 (48.3%) | 51 (30.4%) |
Technology Access in Falfurrias
Computing Device Access in Falfurrias
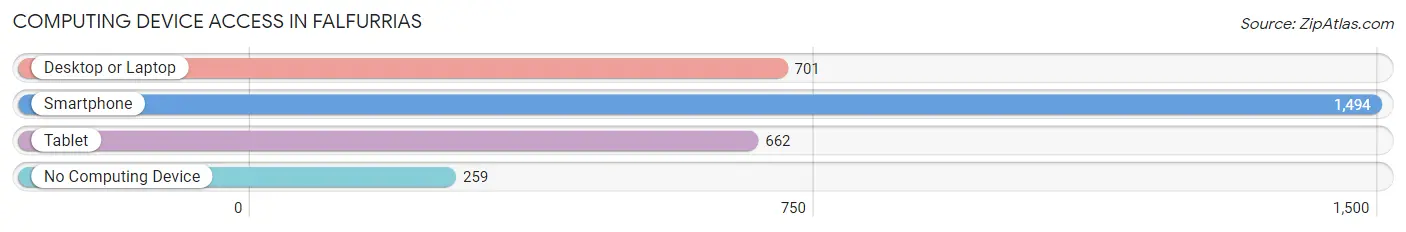
| Device Type | # Households | % Households |
| Desktop or Laptop | 701 | 38.4% |
| Smartphone | 1,494 | 81.9% |
| Tablet | 662 | 36.3% |
| No Computing Device | 259 | 14.2% |
| Total | 1,825 | 100.0% |
Internet Access in Falfurrias
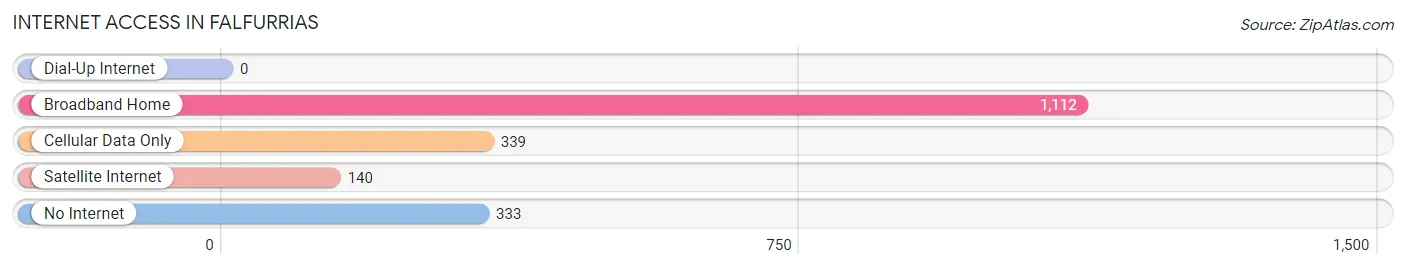
| Internet Type | # Households | % Households |
| Dial-Up Internet | 0 | 0.0% |
| Broadband Home | 1,112 | 60.9% |
| Cellular Data Only | 339 | 18.6% |
| Satellite Internet | 140 | 7.7% |
| No Internet | 333 | 18.2% |
| Total | 1,825 | 100.0% |
Falfurrias Summary
Falfurrias, Texas is a small town located in the southern part of the state, in Brooks County. It is situated about 80 miles south of Corpus Christi and about 70 miles north of the Mexican border. The town was founded in 1904 by Edward Cunningham Lasater, a rancher from San Antonio, and was named after his daughter, Falfurrias. The town has a population of about 5,000 people and is the county seat of Brooks County.
History
Falfurrias was founded in 1904 by Edward Cunningham Lasater, a rancher from San Antonio. He named the town after his daughter, Falfurrias. The town was originally a small ranching community, but it soon grew to become a major center for cotton production. In the early 1900s, the town was home to several cotton gins, a bank, a hotel, and a post office.
In the 1920s, the town experienced a period of growth and prosperity. The population increased from 1,000 to 3,000, and the town was home to several businesses, including a movie theater, a hospital, and a school.
In the 1930s, the Great Depression hit the town hard. Many businesses closed, and the population decreased to 1,500. The town was able to recover in the 1940s, when the economy improved and the population increased to 3,000.
In the 1950s, the town experienced a period of growth and prosperity. The population increased to 5,000, and the town was home to several businesses, including a movie theater, a hospital, and a school.
In the 1960s, the town experienced a period of decline. The population decreased to 4,000, and the town was home to fewer businesses.
In the 1970s, the town experienced a period of growth and prosperity. The population increased to 5,000, and the town was home to several businesses, including a movie theater, a hospital, and a school.
In the 1980s, the town experienced a period of decline. The population decreased to 4,000, and the town was home to fewer businesses.
In the 1990s, the town experienced a period of growth and prosperity. The population increased to 5,000, and the town was home to several businesses, including a movie theater, a hospital, and a school.
Geography
Falfurrias is located in the southern part of Texas, in Brooks County. It is situated about 80 miles south of Corpus Christi and about 70 miles north of the Mexican border. The town is located in the Rio Grande Valley, and is surrounded by agricultural land. The climate is semi-arid, with hot summers and mild winters.
Economy
Falfurrias is a small town with a population of about 5,000 people. The town is home to several businesses, including a movie theater, a hospital, and a school. The economy of the town is largely based on agriculture, with cotton, sorghum, and vegetables being the main crops. The town is also home to several oil and gas companies, as well as a few manufacturing companies.
Demographics
As of the 2010 census, the population of Falfurrias was 5,297. The racial makeup of the town was 79.3% White, 0.3% African American, 0.2% Native American, 0.2% Asian, 0.1% Pacific Islander, 18.7% from other races, and 1.4% from two or more races. Hispanic or Latino of any race were 95.2% of the population.
The median income for a household in the town was $20,972, and the median income for a family was $25,000. The per capita income for the town was $9,845. About 28.3% of the population was below the poverty line.
Common Questions
What is the Total Population of Falfurrias?
Total Population of Falfurrias is 4,348.
What is the Total Male Population of Falfurrias?
Total Male Population of Falfurrias is 1,813.
What is the Total Female Population of Falfurrias?
Total Female Population of Falfurrias is 2,535.
What is the Ratio of Males per 100 Females in Falfurrias?
There are 71.52 Males per 100 Females in Falfurrias.
What is the Ratio of Females per 100 Males in Falfurrias?
There are 139.82 Females per 100 Males in Falfurrias.
What is the Median Population Age in Falfurrias?
Median Population Age in Falfurrias is 38.8 Years.
What is the Average Family Size in Falfurrias
Average Family Size in Falfurrias is 3.3 People.
What is the Average Household Size in Falfurrias
Average Household Size in Falfurrias is 2.4 People.
What is Per Capita Income in Falfurrias?
Per Capita income in Falfurrias is $20,797.
What is the Median Family Income in Falfurrias?
Median Family Income in Falfurrias is $39,421.
What is the Median Household income in Falfurrias?
Median Household Income in Falfurrias is $31,275.
What is Inequality or Gini Index in Falfurrias?
Inequality or Gini Index in Falfurrias is 0.51.
How Large is the Labor Force in Falfurrias?
There are 2,067 People in the Labor Forcein in Falfurrias.
What is the Percentage of People in the Labor Force in Falfurrias?
59.0% of People are in the Labor Force in Falfurrias.
What is the Unemployment Rate in Falfurrias?
Unemployment Rate in Falfurrias is 0.6%.