Cameron Park, TX
Cameron Park Map
Cameron Park Overview
5,830
TOTAL POPULATION
3,189
MALE POPULATION
2,641
FEMALE POPULATION
120.75
MALES / 100 FEMALES
82.82
FEMALES / 100 MALES
27.6
MEDIAN AGE
4.5
AVG FAMILY SIZE
3.9
AVG HOUSEHOLD SIZE
$12,913
PER CAPITA INCOME
$34,684
AVG FAMILY INCOME
$34,248
AVG HOUSEHOLD INCOME
2.5%
WAGE / INCOME GAP [ % ]
97.5¢/ $1
WAGE / INCOME GAP [ $ ]
0.43
INEQUALITY / GINI INDEX
2,252
LABOR FORCE [ PEOPLE ]
52.4%
PERCENT IN LABOR FORCE
10.2%
UNEMPLOYMENT RATE
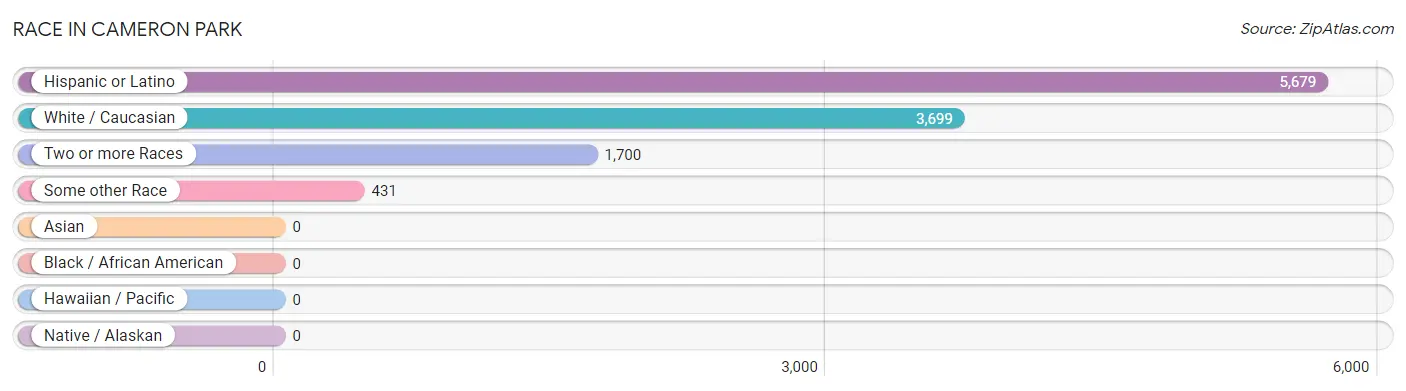
Race in Cameron Park
The most populous races in Cameron Park are Hispanic or Latino (5,679 | 97.4%), White / Caucasian (3,699 | 63.4%), and Two or more Races (1,700 | 29.2%).
| Race | # Population | % Population |
| Asian | 0 | 0.0% |
| Black / African American | 0 | 0.0% |
| Hawaiian / Pacific | 0 | 0.0% |
| Hispanic or Latino | 5,679 | 97.4% |
| Native / Alaskan | 0 | 0.0% |
| White / Caucasian | 3,699 | 63.4% |
| Two or more Races | 1,700 | 29.2% |
| Some other Race | 431 | 7.4% |
| Total | 5,830 | 100.0% |
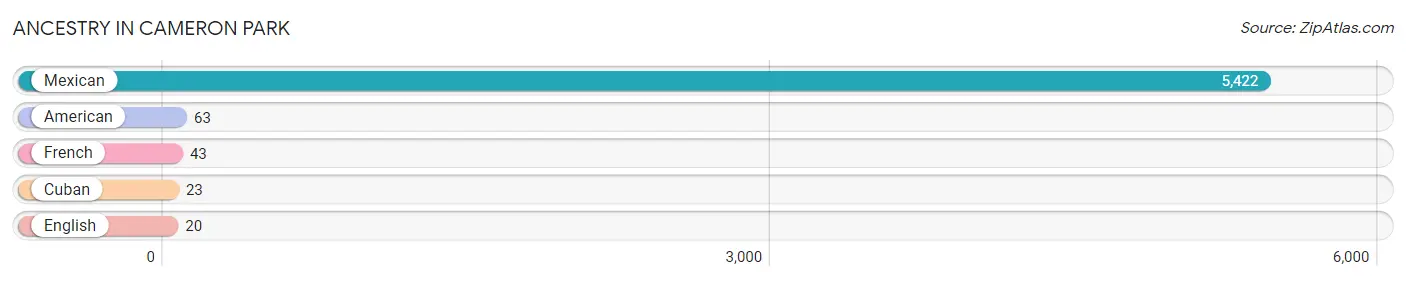
Ancestry in Cameron Park
The most populous ancestries reported in Cameron Park are Mexican (5,422 | 93.0%), American (63 | 1.1%), French (43 | 0.7%), Cuban (23 | 0.4%), and English (20 | 0.3%), together accounting for 95.6% of all Cameron Park residents.
| Ancestry | # Population | % Population |
| American | 63 | 1.1% |
| Cuban | 23 | 0.4% |
| English | 20 | 0.3% |
| French | 43 | 0.7% |
| Mexican | 5,422 | 93.0% | View All 5 Rows |
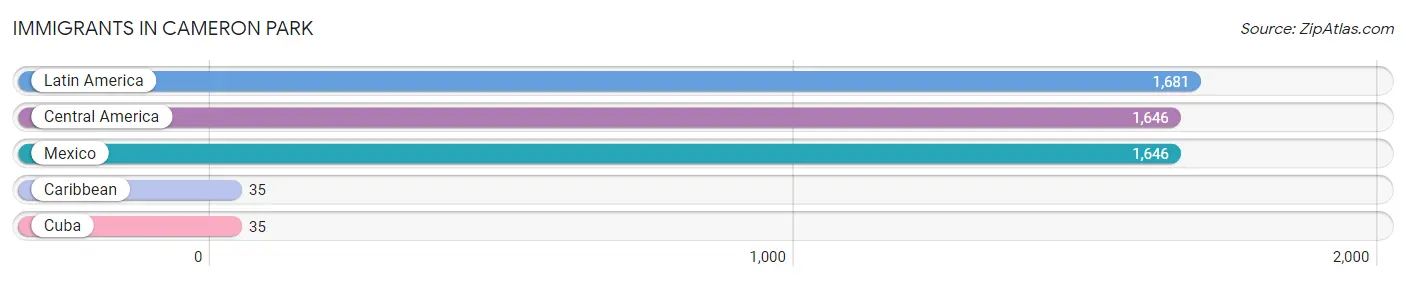
Immigrants in Cameron Park
The most numerous immigrant groups reported in Cameron Park came from Latin America (1,681 | 28.8%), Central America (1,646 | 28.2%), Mexico (1,646 | 28.2%), Caribbean (35 | 0.6%), and Cuba (35 | 0.6%), together accounting for 86.5% of all Cameron Park residents.
| Immigration Origin | # Population | % Population |
| Caribbean | 35 | 0.6% |
| Central America | 1,646 | 28.2% |
| Cuba | 35 | 0.6% |
| Latin America | 1,681 | 28.8% |
| Mexico | 1,646 | 28.2% | View All 5 Rows |
Sex and Age in Cameron Park
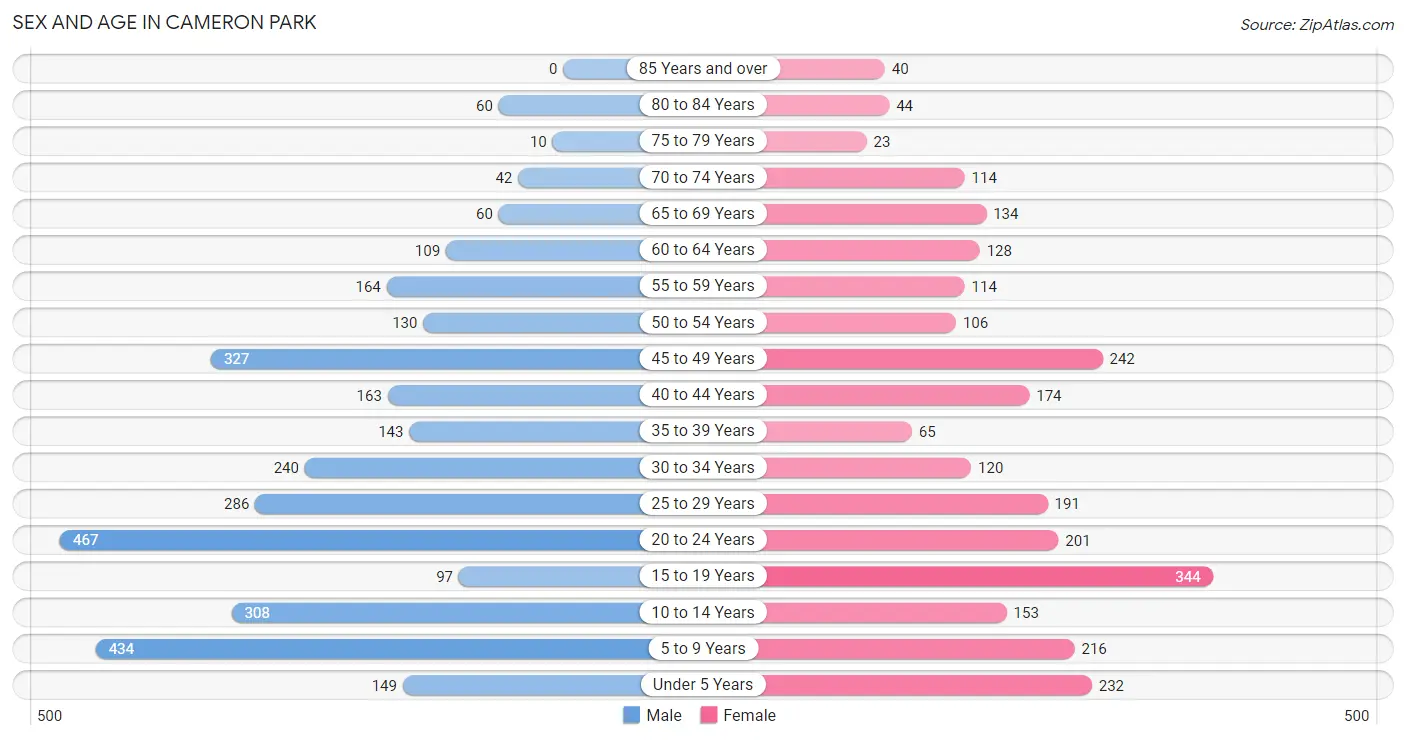
Sex and Age in Cameron Park
The most populous age groups in Cameron Park are 20 to 24 Years (467 | 14.6%) for men and 15 to 19 Years (344 | 13.0%) for women.
| Age Bracket | Male | Female |
| Under 5 Years | 149 (4.7%) | 232 (8.8%) |
| 5 to 9 Years | 434 (13.6%) | 216 (8.2%) |
| 10 to 14 Years | 308 (9.7%) | 153 (5.8%) |
| 15 to 19 Years | 97 (3.0%) | 344 (13.0%) |
| 20 to 24 Years | 467 (14.6%) | 201 (7.6%) |
| 25 to 29 Years | 286 (9.0%) | 191 (7.2%) |
| 30 to 34 Years | 240 (7.5%) | 120 (4.5%) |
| 35 to 39 Years | 143 (4.5%) | 65 (2.5%) |
| 40 to 44 Years | 163 (5.1%) | 174 (6.6%) |
| 45 to 49 Years | 327 (10.2%) | 242 (9.2%) |
| 50 to 54 Years | 130 (4.1%) | 106 (4.0%) |
| 55 to 59 Years | 164 (5.1%) | 114 (4.3%) |
| 60 to 64 Years | 109 (3.4%) | 128 (4.9%) |
| 65 to 69 Years | 60 (1.9%) | 134 (5.1%) |
| 70 to 74 Years | 42 (1.3%) | 114 (4.3%) |
| 75 to 79 Years | 10 (0.3%) | 23 (0.9%) |
| 80 to 84 Years | 60 (1.9%) | 44 (1.7%) |
| 85 Years and over | 0 (0.0%) | 40 (1.5%) |
| Total | 3,189 (100.0%) | 2,641 (100.0%) |
Families and Households in Cameron Park
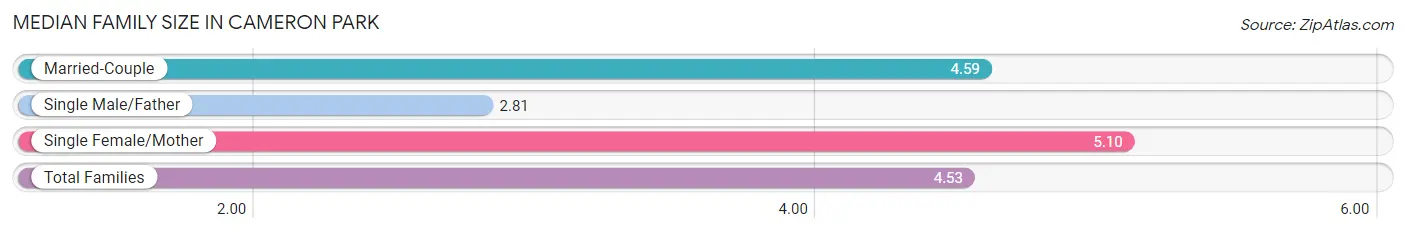
Median Family Size in Cameron Park
The median family size in Cameron Park is 4.53 persons per family, with single female/mother families (337 | 27.9%) accounting for the largest median family size of 5.1 persons per family. On the other hand, single male/father families (137 | 11.3%) represent the smallest median family size with 2.81 persons per family.
| Family Type | # Families | Family Size |
| Married-Couple | 736 (60.8%) | 4.59 |
| Single Male/Father | 137 (11.3%) | 2.81 |
| Single Female/Mother | 337 (27.9%) | 5.10 |
| Total Families | 1,210 (100.0%) | 4.53 |
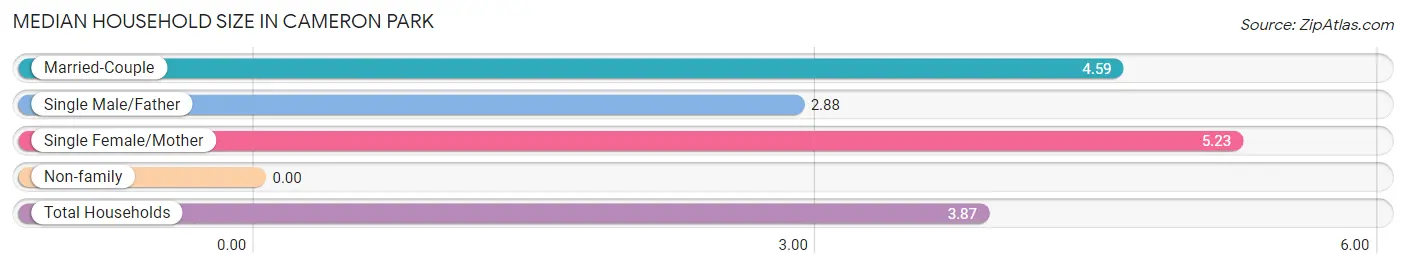
Median Household Size in Cameron Park
| Household Type | # Households | Household Size |
| Married-Couple | 736 (48.9%) | 4.59 |
| Single Male/Father | 137 (9.1%) | 2.88 |
| Single Female/Mother | 337 (22.4%) | 5.23 |
| Non-family | 295 (19.6%) | - |
| Total Households | 1,505 (100.0%) | 3.87 |
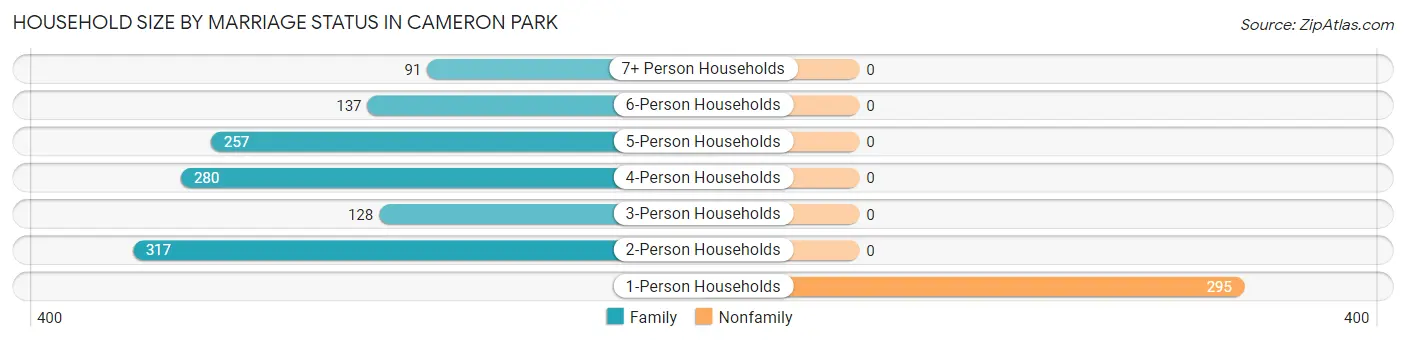
Household Size by Marriage Status in Cameron Park
Out of a total of 1,505 households in Cameron Park, 1,210 (80.4%) are family households, while 295 (19.6%) are nonfamily households. The most numerous type of family households are 2-person households, comprising 317, and the most common type of nonfamily households are 1-person households, comprising 295.
| Household Size | Family Households | Nonfamily Households |
| 1-Person Households | - | 295 (19.6%) |
| 2-Person Households | 317 (21.1%) | 0 (0.0%) |
| 3-Person Households | 128 (8.5%) | 0 (0.0%) |
| 4-Person Households | 280 (18.6%) | 0 (0.0%) |
| 5-Person Households | 257 (17.1%) | 0 (0.0%) |
| 6-Person Households | 137 (9.1%) | 0 (0.0%) |
| 7+ Person Households | 91 (6.0%) | 0 (0.0%) |
| Total | 1,210 (80.4%) | 295 (19.6%) |
Female Fertility in Cameron Park
Fertility by Age in Cameron Park
| Age Bracket | Women with Births | Births / 1,000 Women |
| 15 to 19 years | 0 (0.0%) | 0.0 |
| 20 to 34 years | 0 (0.0%) | 0.0 |
| 35 to 50 years | 0 (0.0%) | 0.0 |
| Total | 0 (0.0%) | 0.0 |
Fertility by Age by Marriage Status in Cameron Park
| Age Bracket | Married | Unmarried |
| 15 to 19 years | 0 (0.0%) | 0 (0.0%) |
| 20 to 34 years | 0 (0.0%) | 0 (0.0%) |
| 35 to 50 years | 0 (0.0%) | 0 (0.0%) |
| Total | 0 (0.0%) | 0 (0.0%) |
Fertility by Education in Cameron Park
| Educational Attainment | Women with Births | Births / 1,000 Women |
| Less than High School | 0 (0.0%) | 0.0 |
| High School Diploma | 0 (0.0%) | 0.0 |
| College or Associate's Degree | 0 (0.0%) | 0.0 |
| Bachelor's Degree | 0 (0.0%) | 0.0 |
| Graduate Degree | 0 (0.0%) | 0.0 |
| Total | 0 (0.0%) | 0.0 |
Fertility by Education by Marriage Status in Cameron Park
| Educational Attainment | Married | Unmarried |
| Less than High School | 0 (0.0%) | 0 (0.0%) |
| High School Diploma | 0 (0.0%) | 0 (0.0%) |
| College or Associate's Degree | 0 (0.0%) | 0 (0.0%) |
| Bachelor's Degree | 0 (0.0%) | 0 (0.0%) |
| Graduate Degree | 0 (0.0%) | 0 (0.0%) |
| Total | 0 (0.0%) | 0 (0.0%) |
Income in Cameron Park
Income Overview in Cameron Park
Per Capita Income in Cameron Park is $12,913, while median incomes of families and households are $34,684 and $34,248 respectively.
| Characteristic | Number | Measure |
| Per Capita Income | 5,830 | $12,913 |
| Median Family Income | 1,210 | $34,684 |
| Mean Family Income | 1,210 | $50,644 |
| Median Household Income | 1,505 | $34,248 |
| Mean Household Income | 1,505 | $46,171 |
| Income Deficit | 1,210 | $0 |
| Wage / Income Gap (%) | 5,830 | 2.50% |
| Wage / Income Gap ($) | 5,830 | 97.50¢ per $1 |
| Gini / Inequality Index | 5,830 | 0.43 |
Earnings by Sex in Cameron Park
Average Earnings in Cameron Park are $24,280, $24,408 for men and $23,799 for women, a difference of 2.5%.
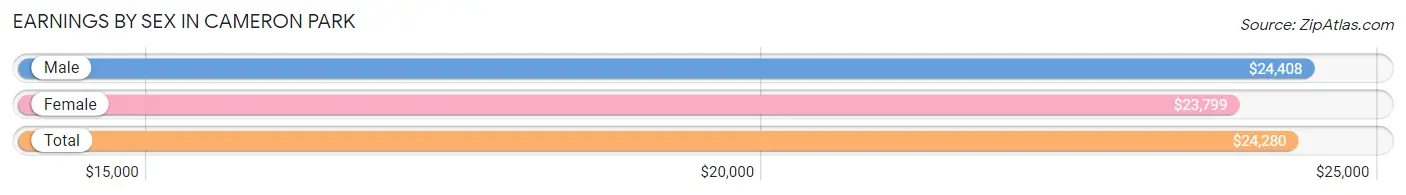
| Sex | Number | Average Earnings |
| Male | 1,479 (63.7%) | $24,408 |
| Female | 841 (36.2%) | $23,799 |
| Total | 2,320 (100.0%) | $24,280 |
Earnings by Sex by Income Bracket in Cameron Park
The most common earnings brackets in Cameron Park are $22,500 to $24,999 for men (192 | 13.0%) and $25,000 to $29,999 for women (132 | 15.7%).
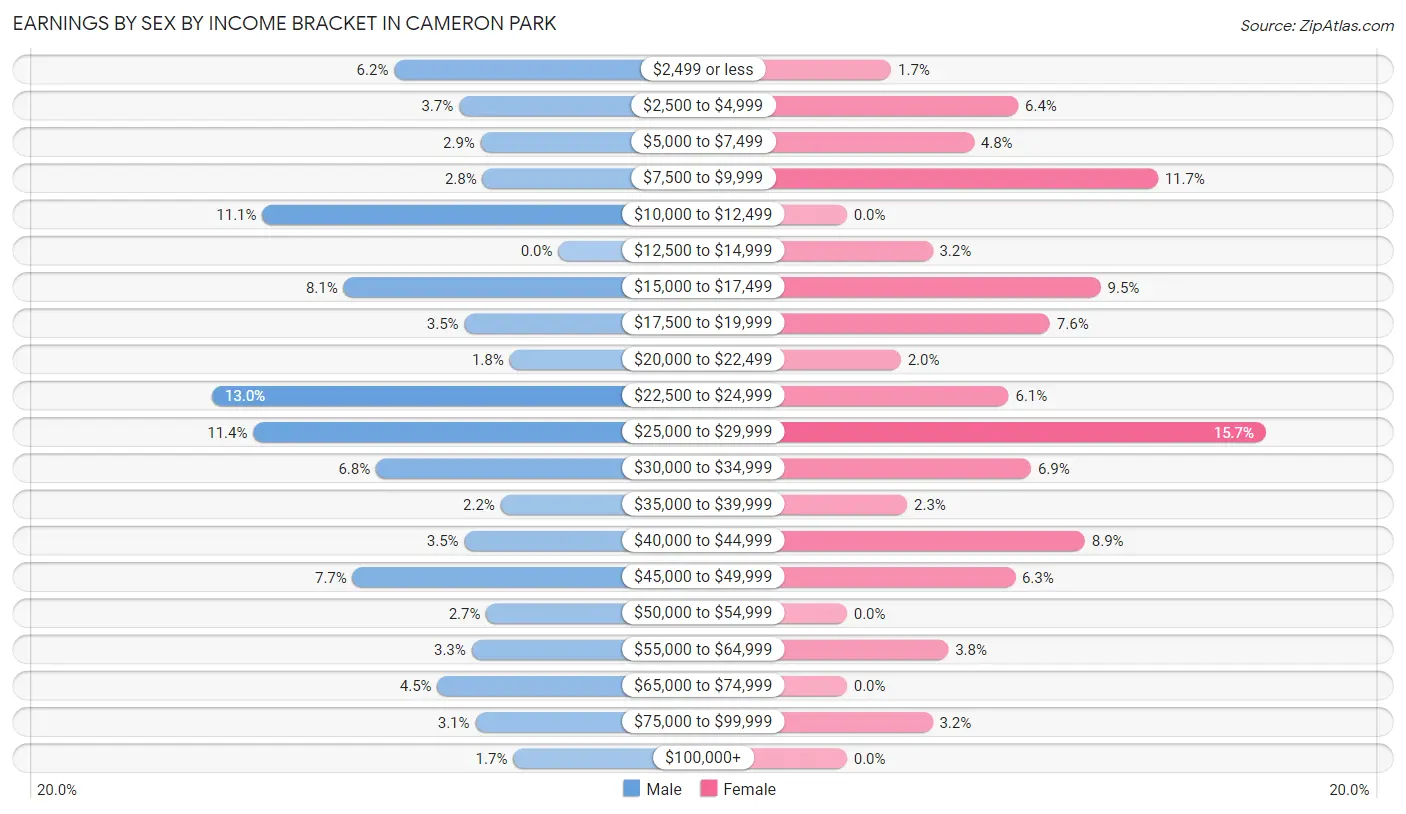
| Income | Male | Female |
| $2,499 or less | 91 (6.1%) | 14 (1.7%) |
| $2,500 to $4,999 | 55 (3.7%) | 54 (6.4%) |
| $5,000 to $7,499 | 43 (2.9%) | 40 (4.8%) |
| $7,500 to $9,999 | 42 (2.8%) | 98 (11.7%) |
| $10,000 to $12,499 | 164 (11.1%) | 0 (0.0%) |
| $12,500 to $14,999 | 0 (0.0%) | 27 (3.2%) |
| $15,000 to $17,499 | 119 (8.1%) | 80 (9.5%) |
| $17,500 to $19,999 | 52 (3.5%) | 64 (7.6%) |
| $20,000 to $22,499 | 27 (1.8%) | 17 (2.0%) |
| $22,500 to $24,999 | 192 (13.0%) | 51 (6.1%) |
| $25,000 to $29,999 | 169 (11.4%) | 132 (15.7%) |
| $30,000 to $34,999 | 101 (6.8%) | 58 (6.9%) |
| $35,000 to $39,999 | 32 (2.2%) | 19 (2.3%) |
| $40,000 to $44,999 | 52 (3.5%) | 75 (8.9%) |
| $45,000 to $49,999 | 114 (7.7%) | 53 (6.3%) |
| $50,000 to $54,999 | 40 (2.7%) | 0 (0.0%) |
| $55,000 to $64,999 | 48 (3.3%) | 32 (3.8%) |
| $65,000 to $74,999 | 67 (4.5%) | 0 (0.0%) |
| $75,000 to $99,999 | 46 (3.1%) | 27 (3.2%) |
| $100,000+ | 25 (1.7%) | 0 (0.0%) |
| Total | 1,479 (100.0%) | 841 (100.0%) |
Earnings by Sex by Educational Attainment in Cameron Park
Average earnings in Cameron Park are $24,571 for men and $26,563 for women, a difference of 7.5%. Men with an educational attainment of bachelor's degree enjoy the highest average annual earnings of $46,250, while those with less than high school education earn the least with $22,742. Women with an educational attainment of high school diploma earn the most with the average annual earnings of $45,347, while those with less than high school education have the smallest earnings of $23,429.
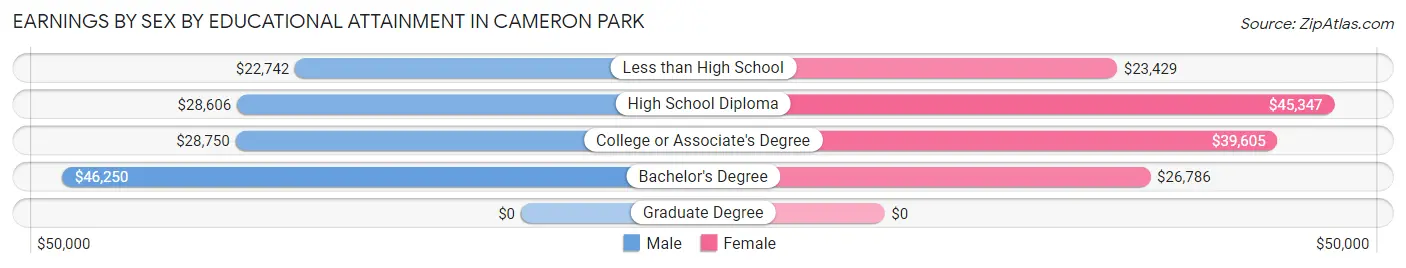
| Educational Attainment | Male Income | Female Income |
| Less than High School | $22,742 | $23,429 |
| High School Diploma | $28,606 | $45,347 |
| College or Associate's Degree | $28,750 | $39,605 |
| Bachelor's Degree | $46,250 | $26,786 |
| Graduate Degree | - | - |
| Total | $24,571 | $26,563 |
Family Income in Cameron Park
Family Income Brackets in Cameron Park
According to the Cameron Park family income data, there are 278 families falling into the $50,000 to $74,999 income range, which is the most common income bracket and makes up 23.0% of all families.
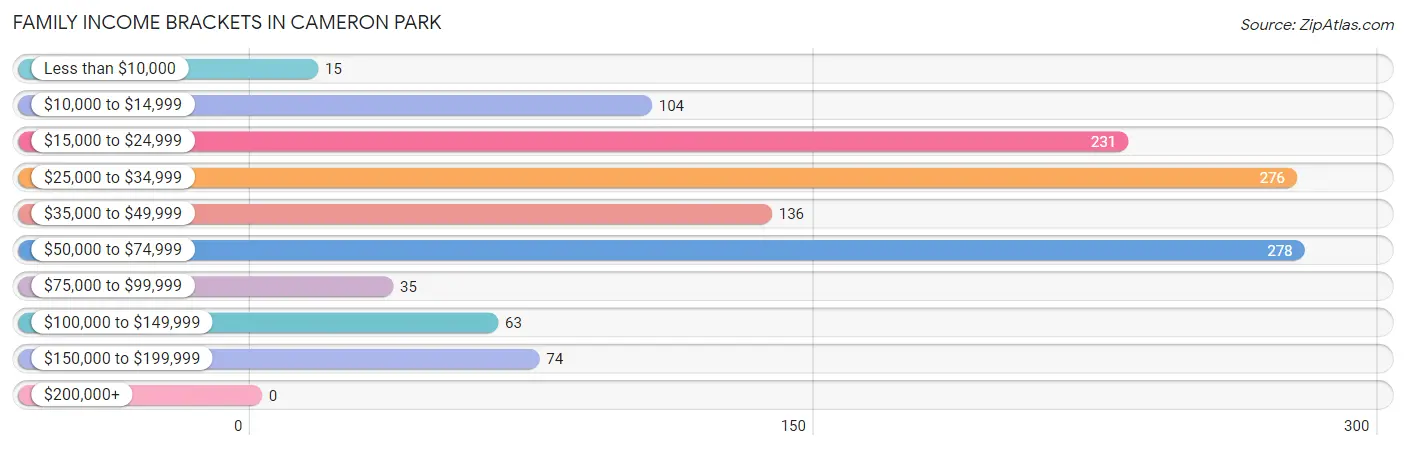
| Income Bracket | # Families | % Families |
| Less than $10,000 | 15 | 1.2% |
| $10,000 to $14,999 | 104 | 8.6% |
| $15,000 to $24,999 | 231 | 19.1% |
| $25,000 to $34,999 | 276 | 22.8% |
| $35,000 to $49,999 | 136 | 11.2% |
| $50,000 to $74,999 | 278 | 23.0% |
| $75,000 to $99,999 | 35 | 2.9% |
| $100,000 to $149,999 | 63 | 5.2% |
| $150,000 to $199,999 | 74 | 6.1% |
| $200,000+ | 0 | 0.0% |
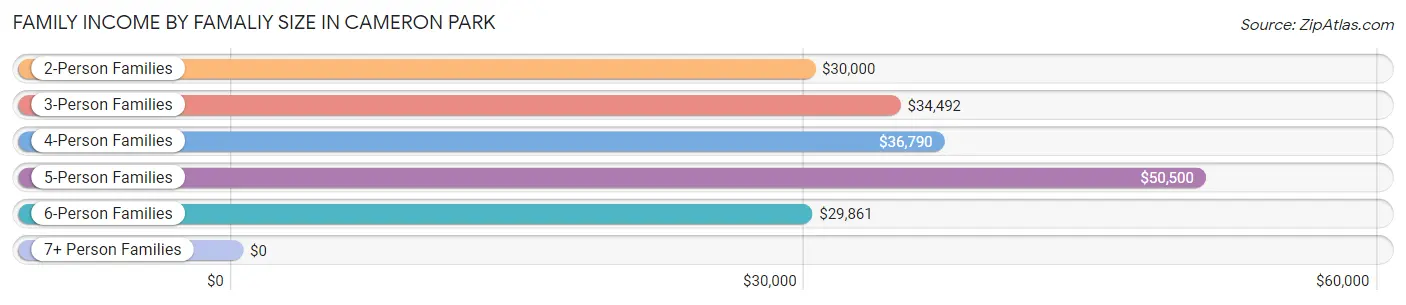
Family Income by Famaliy Size in Cameron Park
5-person families (246 | 20.3%) account for the highest median family income in Cameron Park with $50,500 per family, while 2-person families (330 | 27.3%) have the highest median income of $15,000 per family member.
| Income Bracket | # Families | Median Income |
| 2-Person Families | 330 (27.3%) | $30,000 |
| 3-Person Families | 117 (9.7%) | $34,492 |
| 4-Person Families | 289 (23.9%) | $36,790 |
| 5-Person Families | 246 (20.3%) | $50,500 |
| 6-Person Families | 159 (13.1%) | $29,861 |
| 7+ Person Families | 69 (5.7%) | $0 |
| Total | 1,210 (100.0%) | $34,684 |
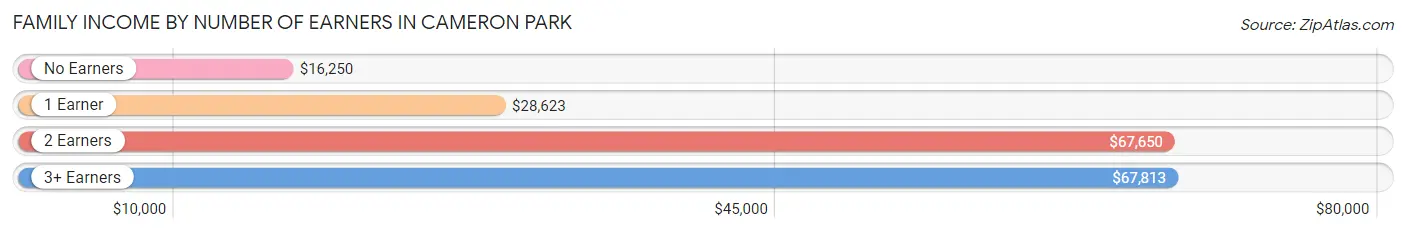
Family Income by Number of Earners in Cameron Park
The median family income in Cameron Park is $34,684, with families comprising 3+ earners (209) having the highest median family income of $67,813, while families with no earners (177) have the lowest median family income of $16,250, accounting for 17.3% and 14.6% of families, respectively.
| Number of Earners | # Families | Median Income |
| No Earners | 177 (14.6%) | $16,250 |
| 1 Earner | 484 (40.0%) | $28,623 |
| 2 Earners | 340 (28.1%) | $67,650 |
| 3+ Earners | 209 (17.3%) | $67,813 |
| Total | 1,210 (100.0%) | $34,684 |
Household Income in Cameron Park
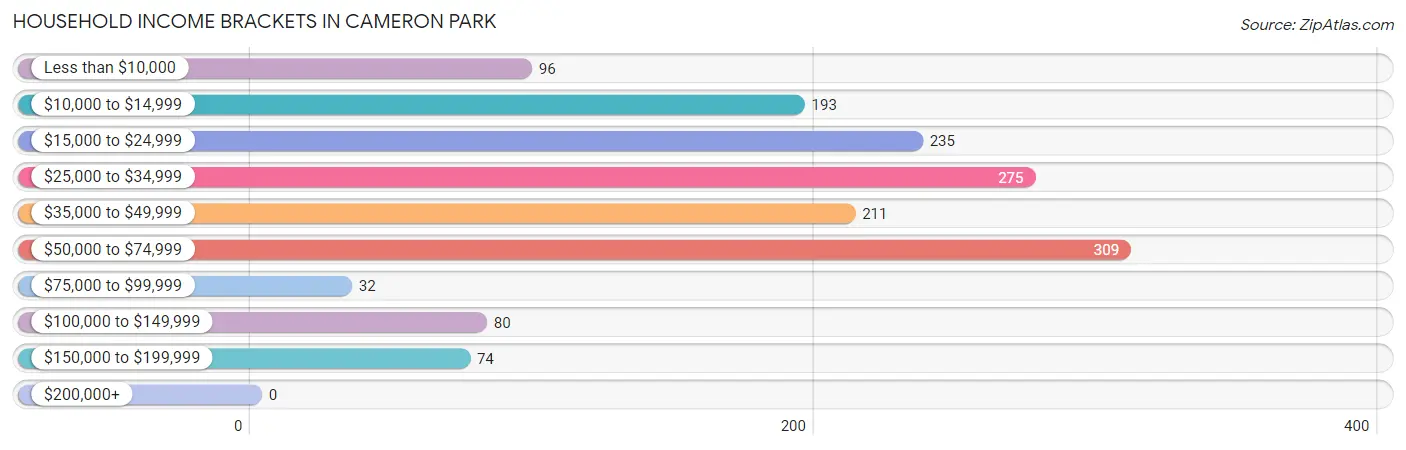
Household Income Brackets in Cameron Park
With 309 households falling in the category, the $50,000 to $74,999 income range is the most frequent in Cameron Park, accounting for 20.5% of all households.
| Income Bracket | # Households | % Households |
| Less than $10,000 | 96 | 6.4% |
| $10,000 to $14,999 | 193 | 12.8% |
| $15,000 to $24,999 | 235 | 15.6% |
| $25,000 to $34,999 | 275 | 18.3% |
| $35,000 to $49,999 | 211 | 14.0% |
| $50,000 to $74,999 | 309 | 20.5% |
| $75,000 to $99,999 | 32 | 2.1% |
| $100,000 to $149,999 | 80 | 5.3% |
| $150,000 to $199,999 | 74 | 4.9% |
| $200,000+ | 0 | 0.0% |
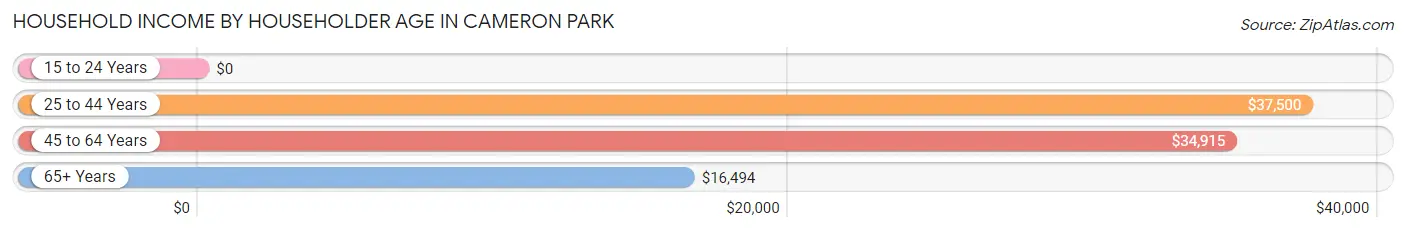
Household Income by Householder Age in Cameron Park
The median household income in Cameron Park is $34,248, with the highest median household income of $37,500 found in the 25 to 44 years age bracket for the primary householder. A total of 506 households (33.6%) fall into this category.
| Income Bracket | # Households | Median Income |
| 15 to 24 Years | 0 (0.0%) | $0 |
| 25 to 44 Years | 506 (33.6%) | $37,500 |
| 45 to 64 Years | 616 (40.9%) | $34,915 |
| 65+ Years | 383 (25.5%) | $16,494 |
| Total | 1,505 (100.0%) | $34,248 |
Poverty in Cameron Park
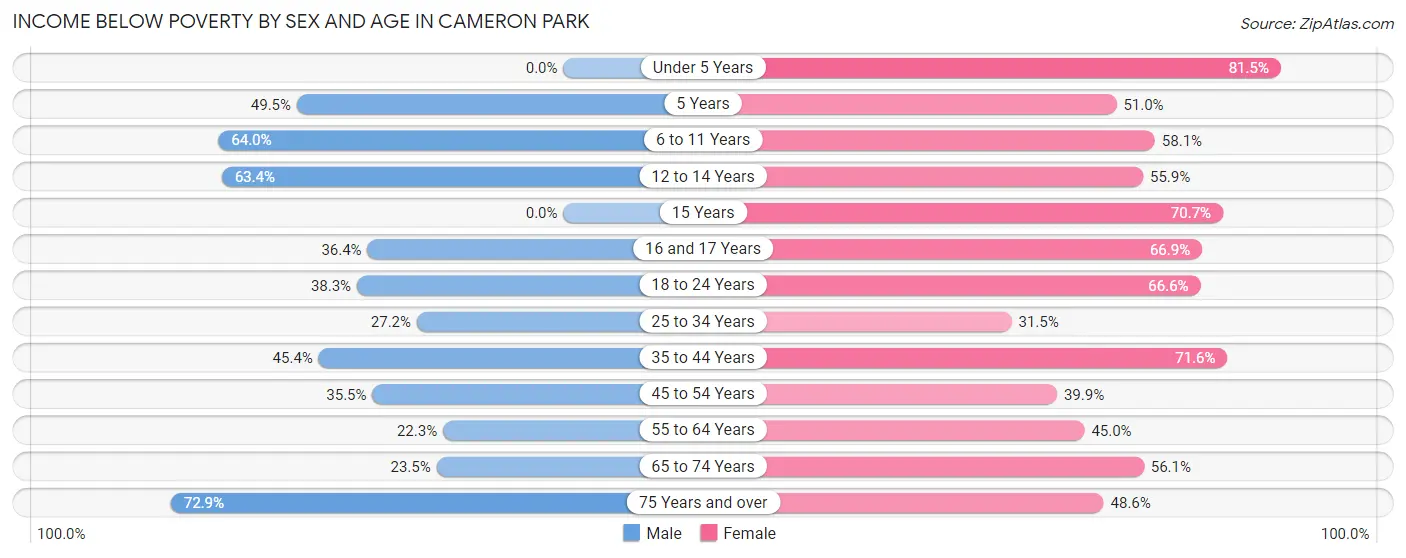
Income Below Poverty by Sex and Age in Cameron Park
With 39.4% poverty level for males and 55.7% for females among the residents of Cameron Park, 75 year old and over males and under 5 year old females are the most vulnerable to poverty, with 51 males (72.9%) and 189 females (81.5%) in their respective age groups living below the poverty level.
| Age Bracket | Male | Female |
| Under 5 Years | 0 (0.0%) | 189 (81.5%) |
| 5 Years | 47 (49.5%) | 26 (51.0%) |
| 6 to 11 Years | 283 (64.0%) | 111 (58.1%) |
| 12 to 14 Years | 130 (63.4%) | 71 (55.9%) |
| 15 Years | 0 (0.0%) | 29 (70.7%) |
| 16 and 17 Years | 20 (36.4%) | 123 (66.8%) |
| 18 to 24 Years | 195 (38.3%) | 213 (66.6%) |
| 25 to 34 Years | 143 (27.2%) | 98 (31.5%) |
| 35 to 44 Years | 139 (45.4%) | 171 (71.6%) |
| 45 to 54 Years | 162 (35.4%) | 139 (39.9%) |
| 55 to 64 Years | 61 (22.3%) | 109 (45.0%) |
| 65 to 74 Years | 24 (23.5%) | 139 (56.0%) |
| 75 Years and over | 51 (72.9%) | 52 (48.6%) |
| Total | 1,255 (39.4%) | 1,470 (55.7%) |
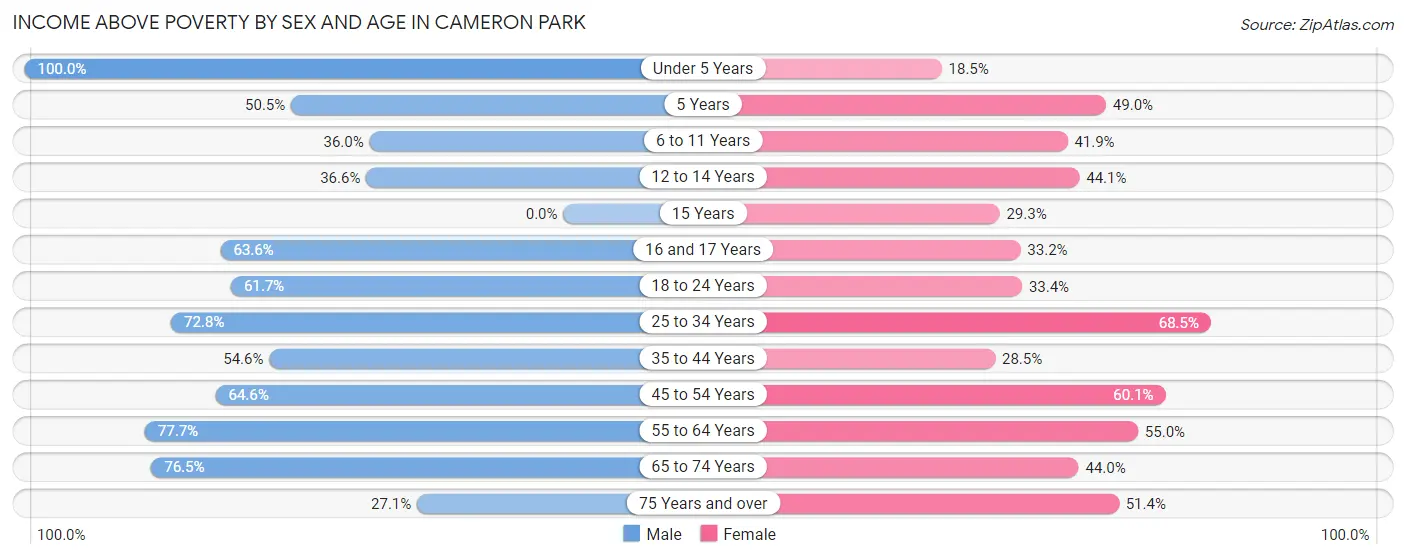
Income Above Poverty by Sex and Age in Cameron Park
According to the poverty statistics in Cameron Park, males aged under 5 years and females aged 25 to 34 years are the age groups that are most secure financially, with 100.0% of males and 68.5% of females in these age groups living above the poverty line.
| Age Bracket | Male | Female |
| Under 5 Years | 149 (100.0%) | 43 (18.5%) |
| 5 Years | 48 (50.5%) | 25 (49.0%) |
| 6 to 11 Years | 159 (36.0%) | 80 (41.9%) |
| 12 to 14 Years | 75 (36.6%) | 56 (44.1%) |
| 15 Years | 0 (0.0%) | 12 (29.3%) |
| 16 and 17 Years | 35 (63.6%) | 61 (33.2%) |
| 18 to 24 Years | 314 (61.7%) | 107 (33.4%) |
| 25 to 34 Years | 383 (72.8%) | 213 (68.5%) |
| 35 to 44 Years | 167 (54.6%) | 68 (28.4%) |
| 45 to 54 Years | 295 (64.5%) | 209 (60.1%) |
| 55 to 64 Years | 212 (77.7%) | 133 (55.0%) |
| 65 to 74 Years | 78 (76.5%) | 109 (44.0%) |
| 75 Years and over | 19 (27.1%) | 55 (51.4%) |
| Total | 1,934 (60.7%) | 1,171 (44.3%) |
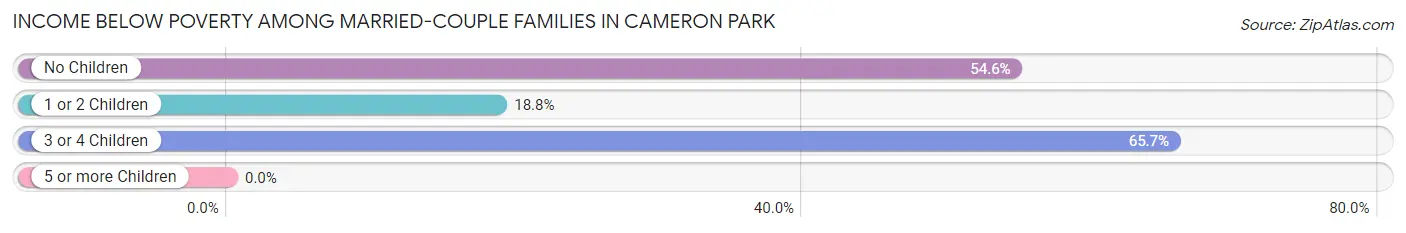
Income Below Poverty Among Married-Couple Families in Cameron Park
The poverty statistics for married-couple families in Cameron Park show that 43.5% or 320 of the total 736 families live below the poverty line. Families with 3 or 4 children have the highest poverty rate of 65.6%, comprising of 86 families. On the other hand, families with 5 or more children have the lowest poverty rate of 0.0%, which includes 0 families.
| Children | Above Poverty | Below Poverty |
| No Children | 157 (45.4%) | 189 (54.6%) |
| 1 or 2 Children | 195 (81.2%) | 45 (18.8%) |
| 3 or 4 Children | 45 (34.4%) | 86 (65.6%) |
| 5 or more Children | 19 (100.0%) | 0 (0.0%) |
| Total | 416 (56.5%) | 320 (43.5%) |
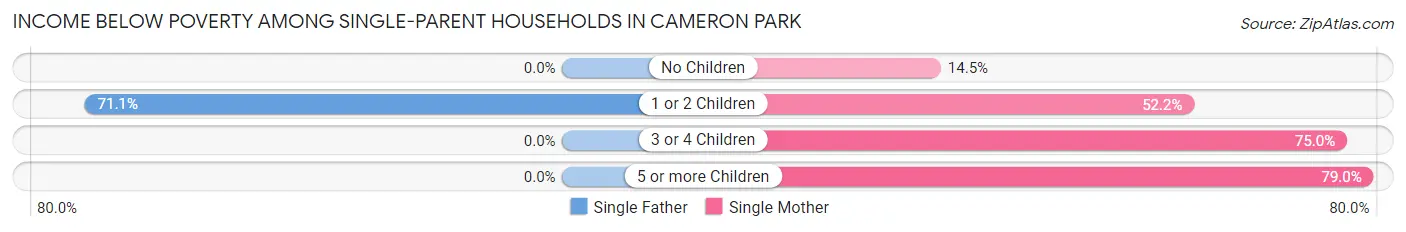
Income Below Poverty Among Single-Parent Households in Cameron Park
According to the poverty data in Cameron Park, 19.7% or 27 single-father households and 52.2% or 176 single-mother households are living below the poverty line. Among single-father households, those with 1 or 2 children have the highest poverty rate, with 27 households (71.1%) experiencing poverty. Likewise, among single-mother households, those with 5 or more children have the highest poverty rate, with 15 households (78.9%) falling below the poverty line.
| Children | Single Father | Single Mother |
| No Children | 0 (0.0%) | 10 (14.5%) |
| 1 or 2 Children | 27 (71.1%) | 82 (52.2%) |
| 3 or 4 Children | 0 (0.0%) | 69 (75.0%) |
| 5 or more Children | 0 (0.0%) | 15 (78.9%) |
| Total | 27 (19.7%) | 176 (52.2%) |
Income Below Poverty Among Married-Couple vs Single-Parent Households in Cameron Park
The poverty data for Cameron Park shows that 320 of the married-couple family households (43.5%) and 203 of the single-parent households (42.8%) are living below the poverty level. Within the married-couple family households, those with 3 or 4 children have the highest poverty rate, with 86 households (65.6%) falling below the poverty line. Among the single-parent households, those with 5 or more children have the highest poverty rate, with 15 household (78.9%) living below poverty.
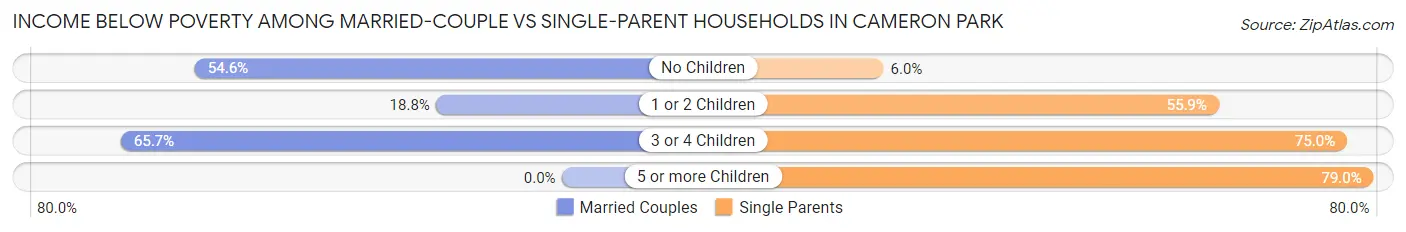
| Children | Married-Couple Families | Single-Parent Households |
| No Children | 189 (54.6%) | 10 (5.9%) |
| 1 or 2 Children | 45 (18.8%) | 109 (55.9%) |
| 3 or 4 Children | 86 (65.6%) | 69 (75.0%) |
| 5 or more Children | 0 (0.0%) | 15 (78.9%) |
| Total | 320 (43.5%) | 203 (42.8%) |
Employment Characteristics in Cameron Park
Employment by Class of Employer in Cameron Park
Among the 1,984 employed individuals in Cameron Park, private company employees (1,549 | 78.1%), self-employed (incorporated) (132 | 6.7%), and not-for-profit organizations (125 | 6.3%) make up the most common classes of employment.
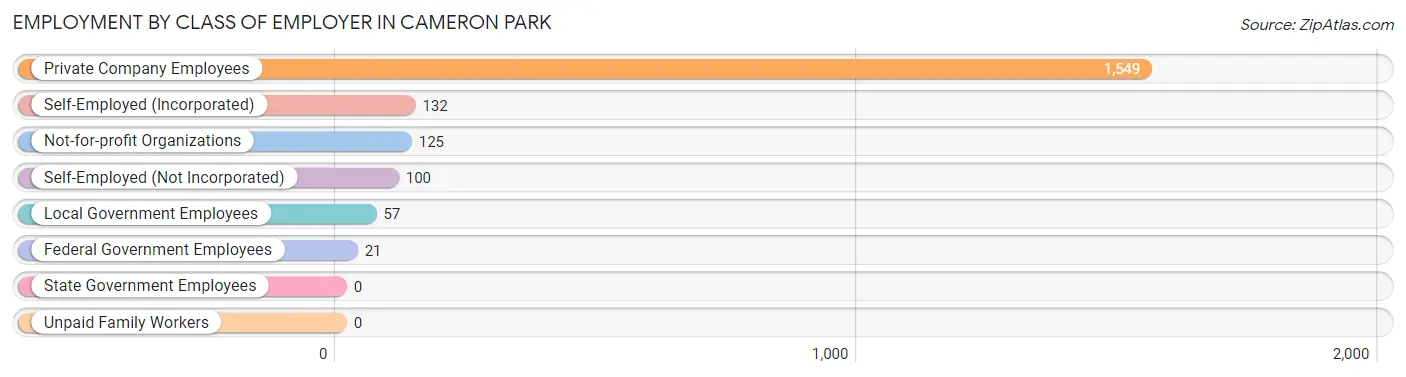
| Employer Class | # Employees | % Employees |
| Private Company Employees | 1,549 | 78.1% |
| Self-Employed (Incorporated) | 132 | 6.7% |
| Self-Employed (Not Incorporated) | 100 | 5.0% |
| Not-for-profit Organizations | 125 | 6.3% |
| Local Government Employees | 57 | 2.9% |
| State Government Employees | 0 | 0.0% |
| Federal Government Employees | 21 | 1.1% |
| Unpaid Family Workers | 0 | 0.0% |
| Total | 1,984 | 100.0% |
Employment Status by Age in Cameron Park
According to the labor force statistics for Cameron Park, out of the total population over 16 years of age (4,297), 52.4% or 2,252 individuals are in the labor force, with 10.2% or 230 of them unemployed. The age group with the highest labor force participation rate is 25 to 29 years, with 79.0% or 377 individuals in the labor force. Within the labor force, the 25 to 29 years age range has the highest percentage of unemployed individuals, with 19.9% or 75 of them being unemployed.
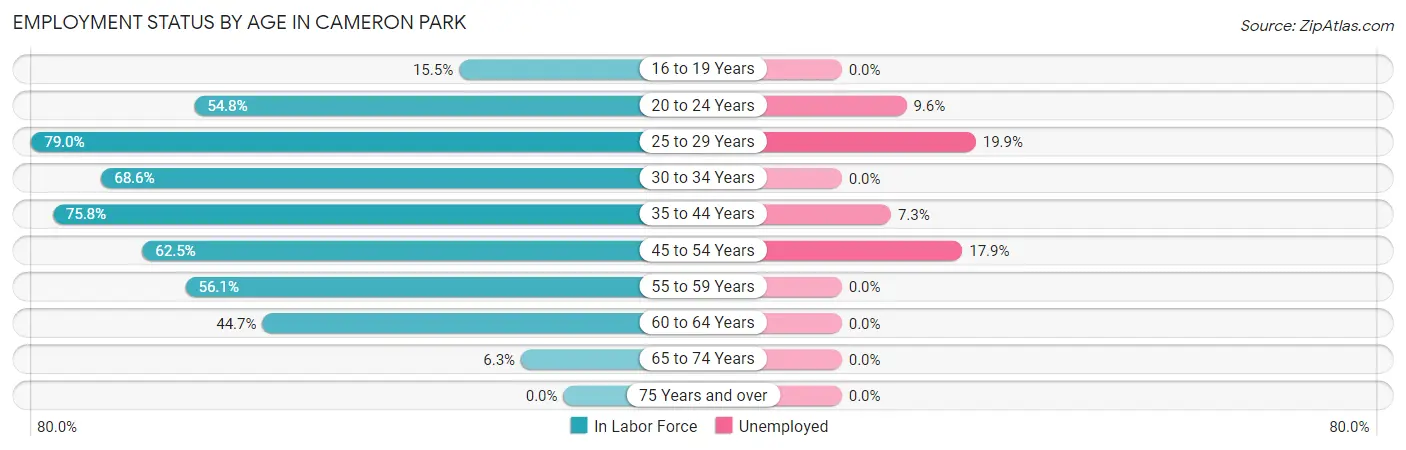
| Age Bracket | In Labor Force | Unemployed |
| 16 to 19 Years | 62 (15.5%) | 0 (0.0%) |
| 20 to 24 Years | 366 (54.8%) | 35 (9.6%) |
| 25 to 29 Years | 377 (79.0%) | 75 (19.9%) |
| 30 to 34 Years | 247 (68.6%) | 0 (0.0%) |
| 35 to 44 Years | 413 (75.8%) | 30 (7.3%) |
| 45 to 54 Years | 503 (62.5%) | 90 (17.9%) |
| 55 to 59 Years | 156 (56.1%) | 0 (0.0%) |
| 60 to 64 Years | 106 (44.7%) | 0 (0.0%) |
| 65 to 74 Years | 22 (6.3%) | 0 (0.0%) |
| 75 Years and over | 0 (0.0%) | 0 (0.0%) |
| Total | 2,252 (52.4%) | 230 (10.2%) |
Employment Status by Educational Attainment in Cameron Park
According to labor force statistics for Cameron Park, 66.7% of individuals (1,802) out of the total population between 25 and 64 years of age (2,702) are in the labor force, with 10.8% or 195 of them being unemployed. The group with the highest labor force participation rate are those with the educational attainment of bachelor's degree or higher, with 90.4% or 141 individuals in the labor force. Within the labor force, individuals with less than high school education have the highest percentage of unemployment, with 17.4% or 134 of them being unemployed.
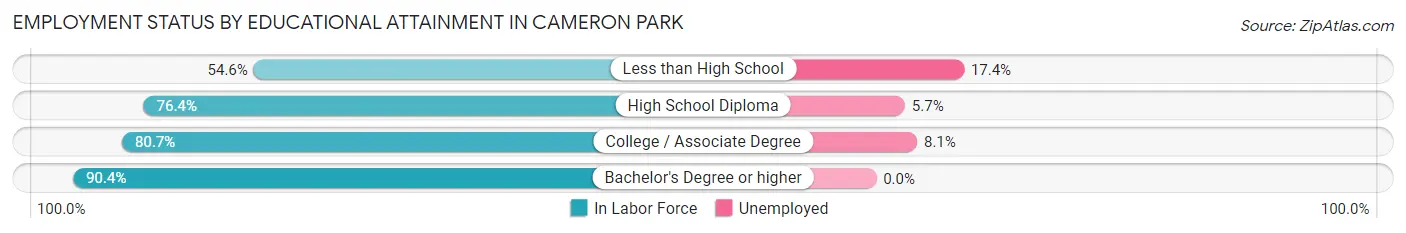
| Educational Attainment | In Labor Force | Unemployed |
| Less than High School | 769 (54.6%) | 245 (17.4%) |
| High School Diploma | 470 (76.4%) | 35 (5.7%) |
| College / Associate Degree | 421 (80.7%) | 42 (8.1%) |
| Bachelor's Degree or higher | 141 (90.4%) | 0 (0.0%) |
| Total | 1,802 (66.7%) | 292 (10.8%) |
Employment Occupations by Sex in Cameron Park
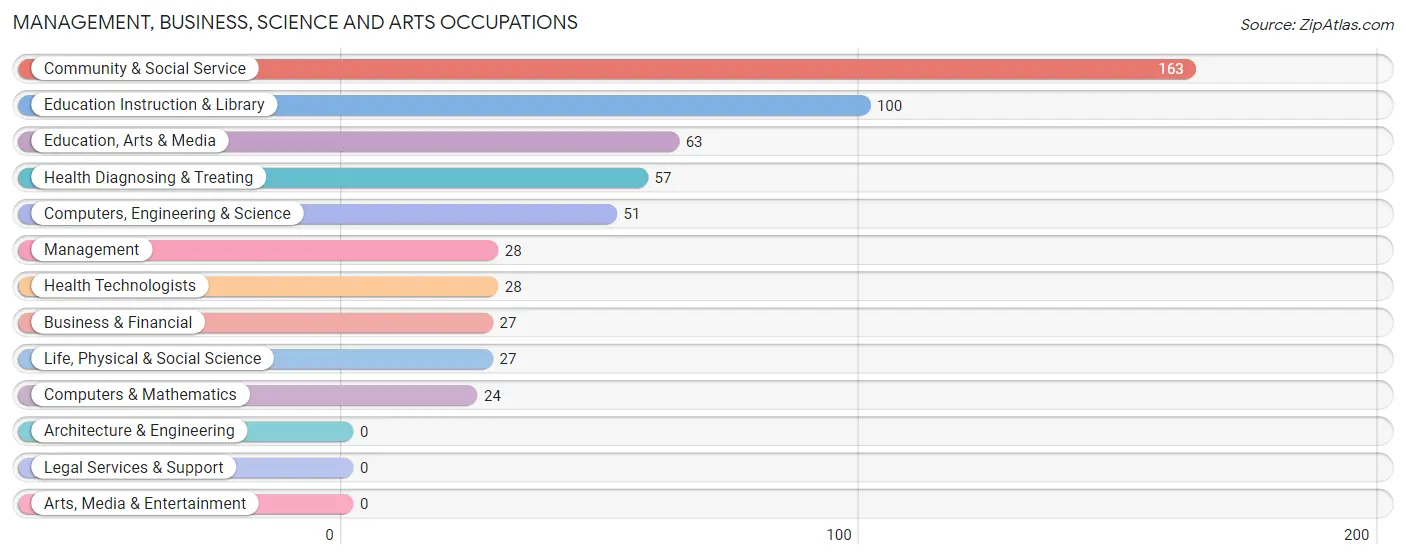
Management, Business, Science and Arts Occupations
The most common Management, Business, Science and Arts occupations in Cameron Park are Community & Social Service (163 | 8.1%), Education Instruction & Library (100 | 5.0%), Education, Arts & Media (63 | 3.1%), Health Diagnosing & Treating (57 | 2.8%), and Computers, Engineering & Science (51 | 2.5%).
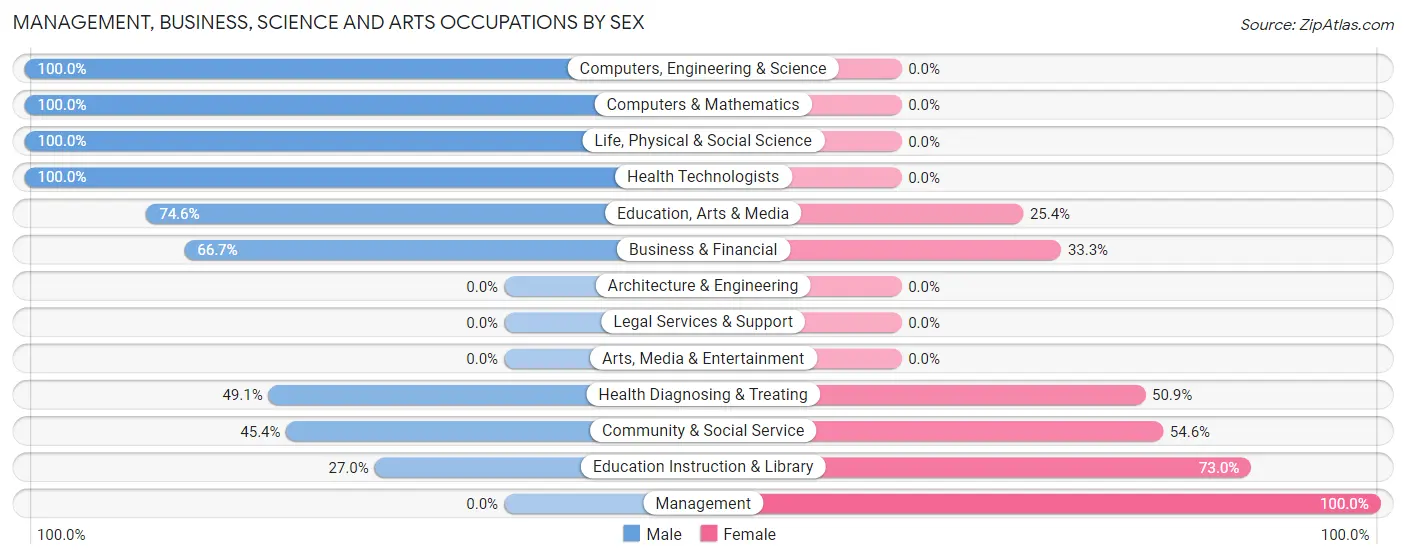
Management, Business, Science and Arts Occupations by Sex
Within the Management, Business, Science and Arts occupations in Cameron Park, the most male-oriented occupations are Computers, Engineering & Science (100.0%), Computers & Mathematics (100.0%), and Life, Physical & Social Science (100.0%), while the most female-oriented occupations are Management (100.0%), Education Instruction & Library (73.0%), and Community & Social Service (54.6%).
| Occupation | Male | Female |
| Management | 0 (0.0%) | 28 (100.0%) |
| Business & Financial | 18 (66.7%) | 9 (33.3%) |
| Computers, Engineering & Science | 51 (100.0%) | 0 (0.0%) |
| Computers & Mathematics | 24 (100.0%) | 0 (0.0%) |
| Architecture & Engineering | 0 (0.0%) | 0 (0.0%) |
| Life, Physical & Social Science | 27 (100.0%) | 0 (0.0%) |
| Community & Social Service | 74 (45.4%) | 89 (54.6%) |
| Education, Arts & Media | 47 (74.6%) | 16 (25.4%) |
| Legal Services & Support | 0 (0.0%) | 0 (0.0%) |
| Education Instruction & Library | 27 (27.0%) | 73 (73.0%) |
| Arts, Media & Entertainment | 0 (0.0%) | 0 (0.0%) |
| Health Diagnosing & Treating | 28 (49.1%) | 29 (50.9%) |
| Health Technologists | 28 (100.0%) | 0 (0.0%) |
| Total (Category) | 171 (52.4%) | 155 (47.5%) |
| Total (Overall) | 1,291 (63.8%) | 731 (36.1%) |
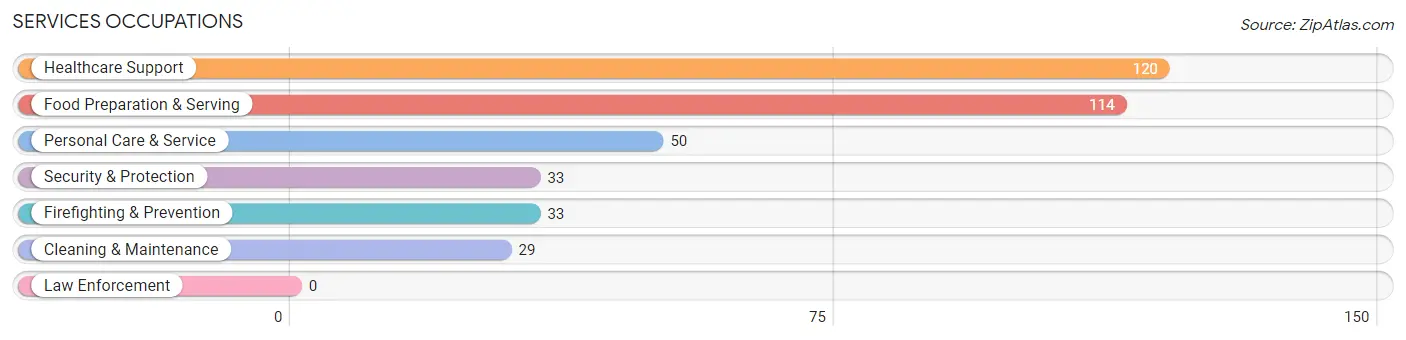
Services Occupations
The most common Services occupations in Cameron Park are Healthcare Support (120 | 5.9%), Food Preparation & Serving (114 | 5.6%), Personal Care & Service (50 | 2.5%), Security & Protection (33 | 1.6%), and Firefighting & Prevention (33 | 1.6%).
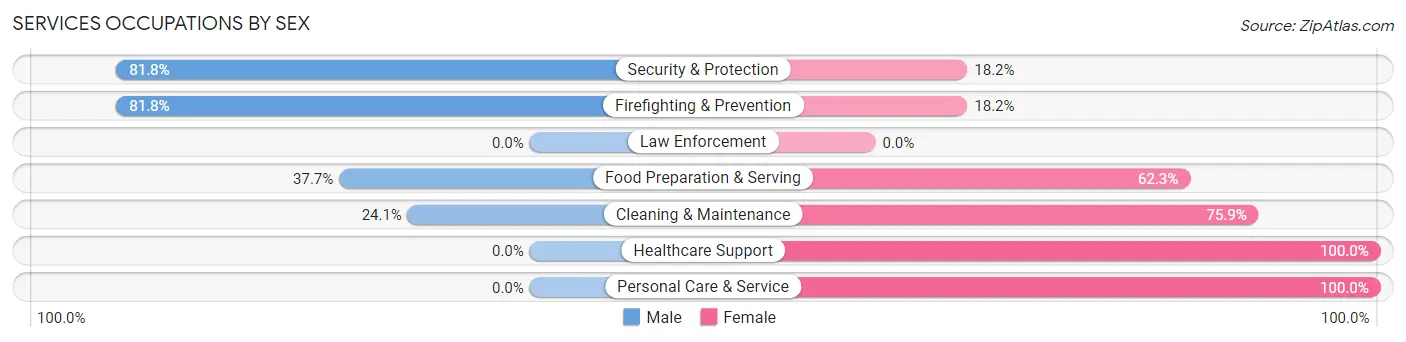
Services Occupations by Sex
Within the Services occupations in Cameron Park, the most male-oriented occupations are Security & Protection (81.8%), Firefighting & Prevention (81.8%), and Food Preparation & Serving (37.7%), while the most female-oriented occupations are Healthcare Support (100.0%), Personal Care & Service (100.0%), and Cleaning & Maintenance (75.9%).
| Occupation | Male | Female |
| Healthcare Support | 0 (0.0%) | 120 (100.0%) |
| Security & Protection | 27 (81.8%) | 6 (18.2%) |
| Firefighting & Prevention | 27 (81.8%) | 6 (18.2%) |
| Law Enforcement | 0 (0.0%) | 0 (0.0%) |
| Food Preparation & Serving | 43 (37.7%) | 71 (62.3%) |
| Cleaning & Maintenance | 7 (24.1%) | 22 (75.9%) |
| Personal Care & Service | 0 (0.0%) | 50 (100.0%) |
| Total (Category) | 77 (22.3%) | 269 (77.7%) |
| Total (Overall) | 1,291 (63.8%) | 731 (36.1%) |
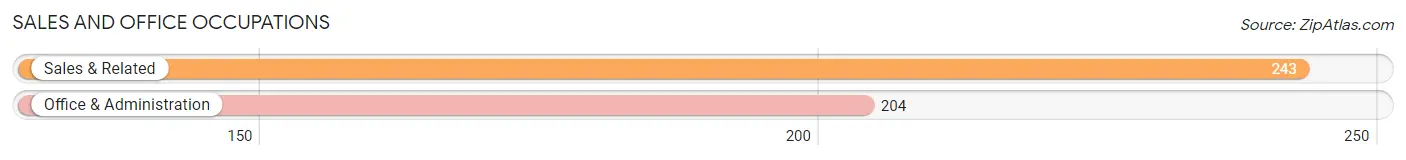
Sales and Office Occupations
The most common Sales and Office occupations in Cameron Park are Sales & Related (243 | 12.0%), and Office & Administration (204 | 10.1%).
Sales and Office Occupations by Sex
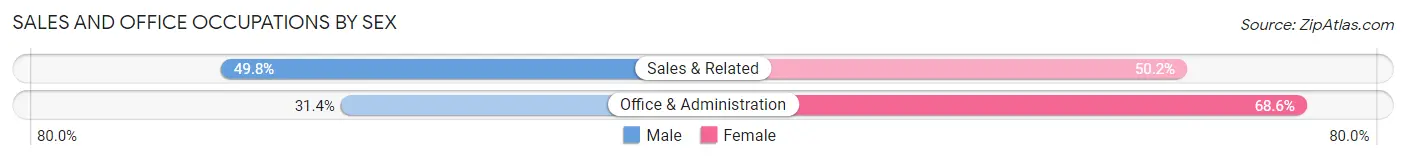
| Occupation | Male | Female |
| Sales & Related | 121 (49.8%) | 122 (50.2%) |
| Office & Administration | 64 (31.4%) | 140 (68.6%) |
| Total (Category) | 185 (41.4%) | 262 (58.6%) |
| Total (Overall) | 1,291 (63.8%) | 731 (36.1%) |
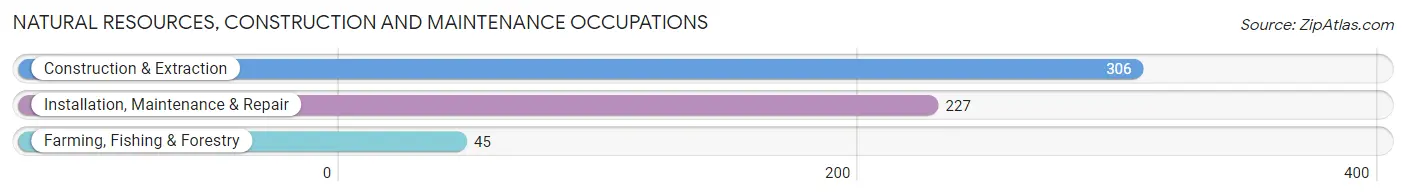
Natural Resources, Construction and Maintenance Occupations
The most common Natural Resources, Construction and Maintenance occupations in Cameron Park are Construction & Extraction (306 | 15.1%), Installation, Maintenance & Repair (227 | 11.2%), and Farming, Fishing & Forestry (45 | 2.2%).
Natural Resources, Construction and Maintenance Occupations by Sex
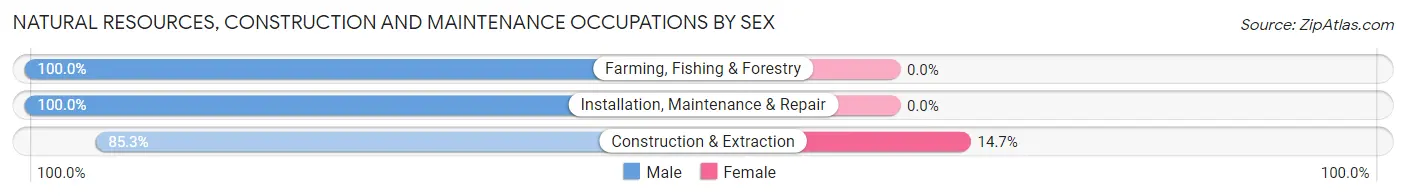
| Occupation | Male | Female |
| Farming, Fishing & Forestry | 45 (100.0%) | 0 (0.0%) |
| Construction & Extraction | 261 (85.3%) | 45 (14.7%) |
| Installation, Maintenance & Repair | 227 (100.0%) | 0 (0.0%) |
| Total (Category) | 533 (92.2%) | 45 (7.8%) |
| Total (Overall) | 1,291 (63.8%) | 731 (36.1%) |
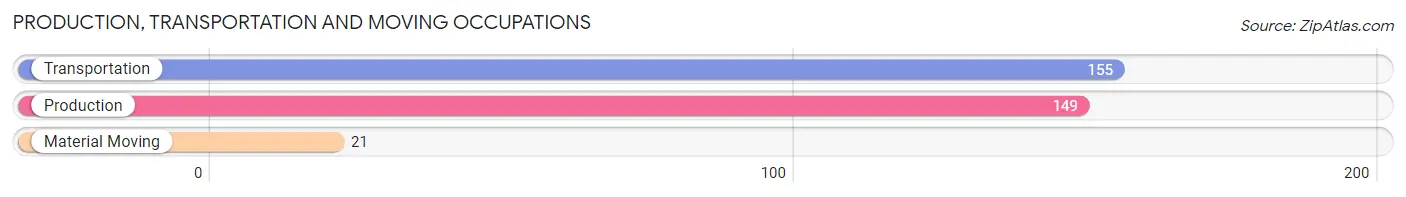
Production, Transportation and Moving Occupations
The most common Production, Transportation and Moving occupations in Cameron Park are Transportation (155 | 7.7%), Production (149 | 7.4%), and Material Moving (21 | 1.0%).
Production, Transportation and Moving Occupations by Sex
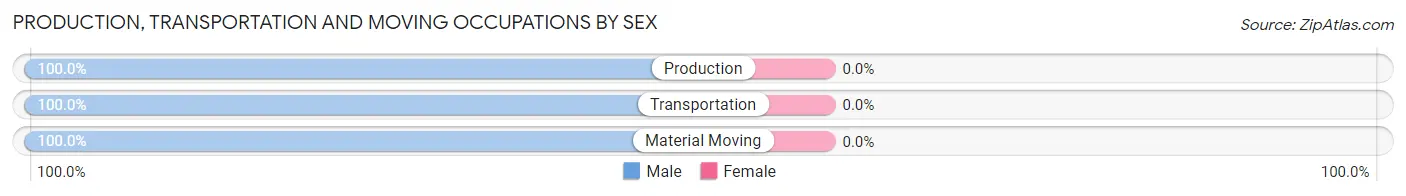
| Occupation | Male | Female |
| Production | 149 (100.0%) | 0 (0.0%) |
| Transportation | 155 (100.0%) | 0 (0.0%) |
| Material Moving | 21 (100.0%) | 0 (0.0%) |
| Total (Category) | 325 (100.0%) | 0 (0.0%) |
| Total (Overall) | 1,291 (63.8%) | 731 (36.1%) |
Employment Industries by Sex in Cameron Park
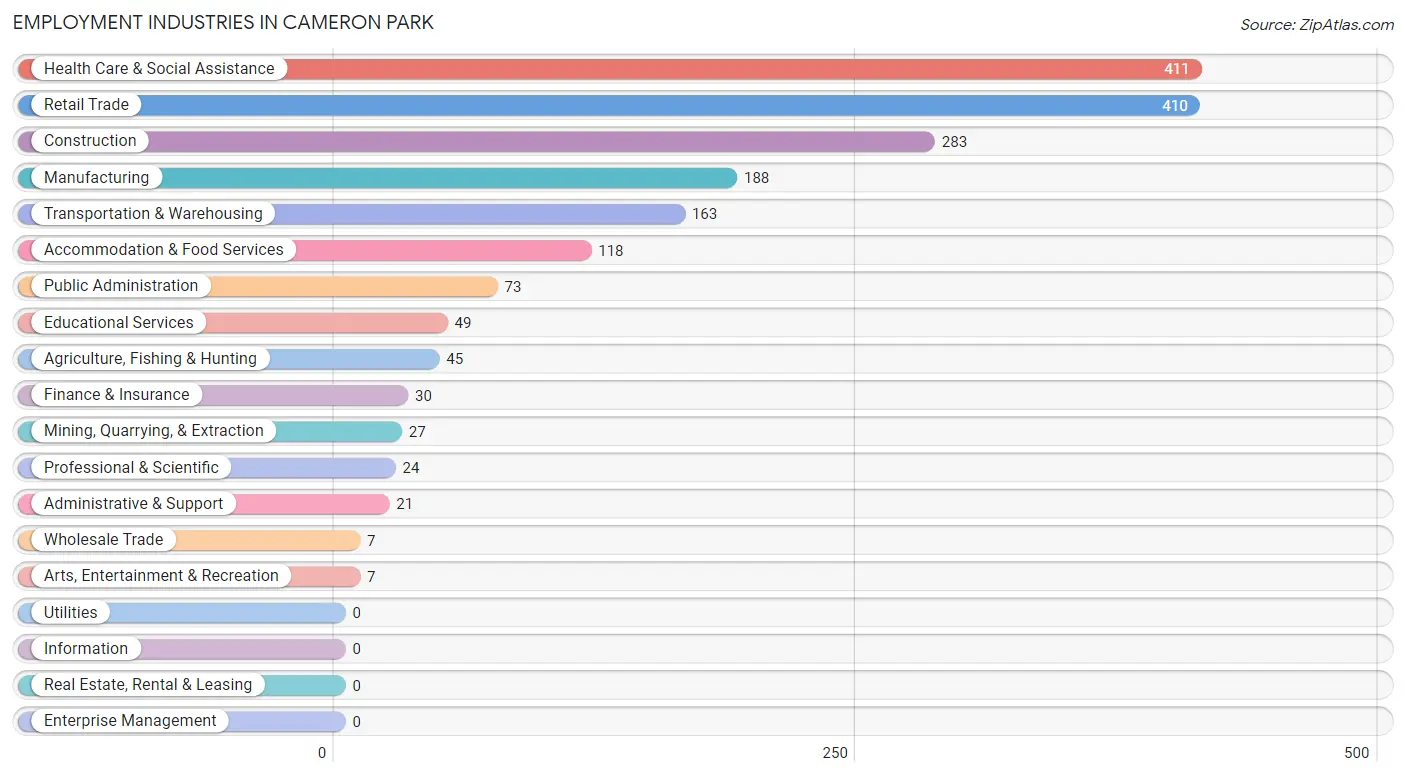
Employment Industries in Cameron Park
The major employment industries in Cameron Park include Health Care & Social Assistance (411 | 20.3%), Retail Trade (410 | 20.3%), Construction (283 | 14.0%), Manufacturing (188 | 9.3%), and Transportation & Warehousing (163 | 8.1%).
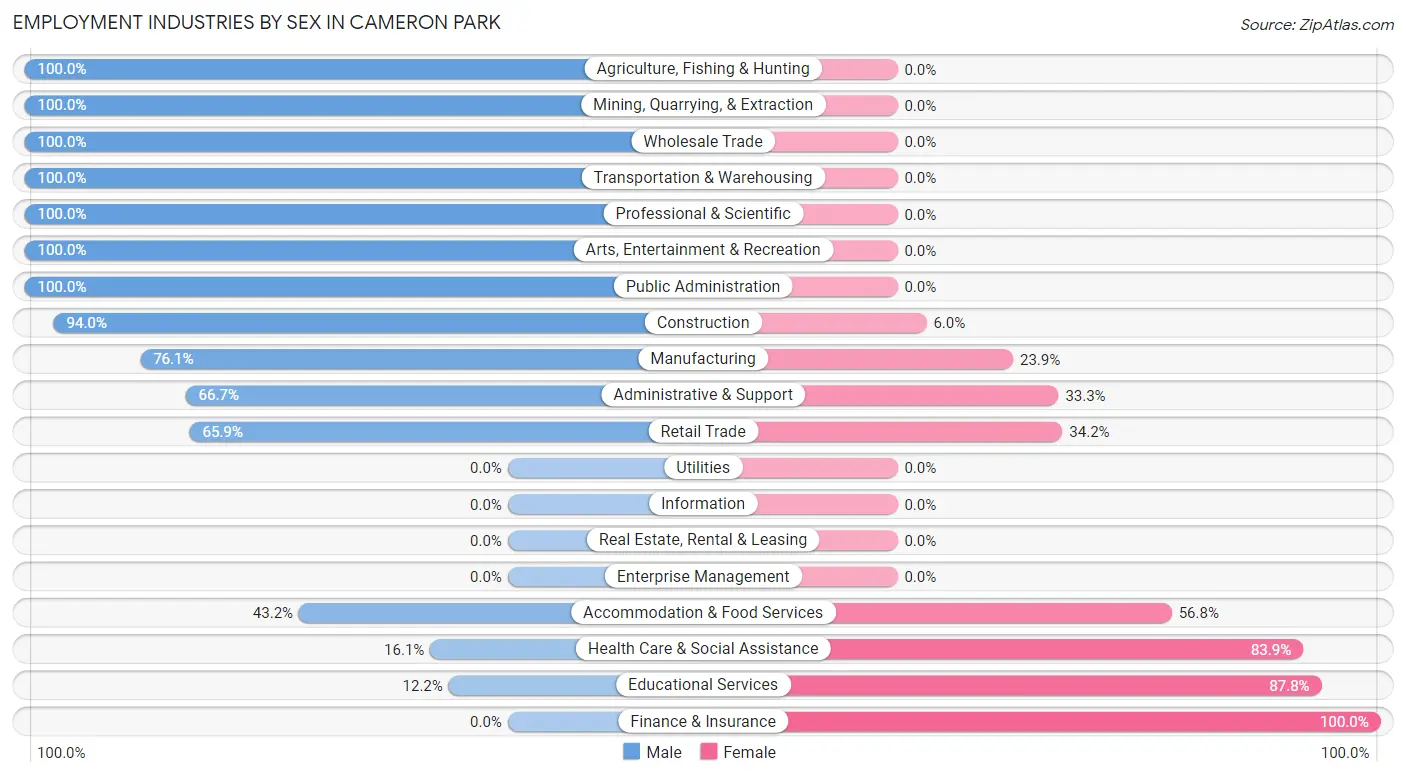
Employment Industries by Sex in Cameron Park
The Cameron Park industries that see more men than women are Agriculture, Fishing & Hunting (100.0%), Mining, Quarrying, & Extraction (100.0%), and Wholesale Trade (100.0%), whereas the industries that tend to have a higher number of women are Finance & Insurance (100.0%), Educational Services (87.8%), and Health Care & Social Assistance (83.9%).
| Industry | Male | Female |
| Agriculture, Fishing & Hunting | 45 (100.0%) | 0 (0.0%) |
| Mining, Quarrying, & Extraction | 27 (100.0%) | 0 (0.0%) |
| Construction | 266 (94.0%) | 17 (6.0%) |
| Manufacturing | 143 (76.1%) | 45 (23.9%) |
| Wholesale Trade | 7 (100.0%) | 0 (0.0%) |
| Retail Trade | 270 (65.8%) | 140 (34.2%) |
| Transportation & Warehousing | 163 (100.0%) | 0 (0.0%) |
| Utilities | 0 (0.0%) | 0 (0.0%) |
| Information | 0 (0.0%) | 0 (0.0%) |
| Finance & Insurance | 0 (0.0%) | 30 (100.0%) |
| Real Estate, Rental & Leasing | 0 (0.0%) | 0 (0.0%) |
| Professional & Scientific | 24 (100.0%) | 0 (0.0%) |
| Enterprise Management | 0 (0.0%) | 0 (0.0%) |
| Administrative & Support | 14 (66.7%) | 7 (33.3%) |
| Educational Services | 6 (12.2%) | 43 (87.8%) |
| Health Care & Social Assistance | 66 (16.1%) | 345 (83.9%) |
| Arts, Entertainment & Recreation | 7 (100.0%) | 0 (0.0%) |
| Accommodation & Food Services | 51 (43.2%) | 67 (56.8%) |
| Public Administration | 73 (100.0%) | 0 (0.0%) |
| Total | 1,291 (63.8%) | 731 (36.1%) |
Education in Cameron Park
School Enrollment in Cameron Park
The most common levels of schooling among the 1,791 students in Cameron Park are elementary school (436 | 24.3%), high school (430 | 24.0%), and middle school (367 | 20.5%).
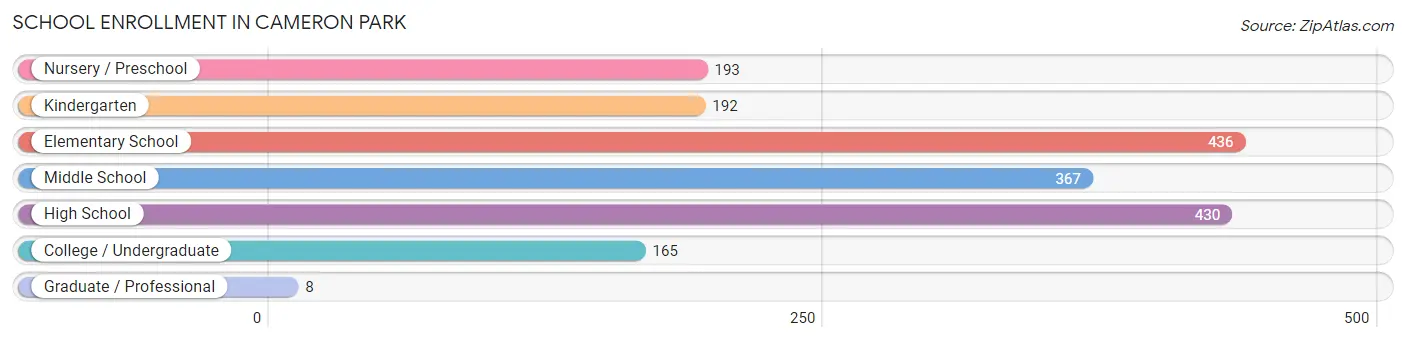
| School Level | # Students | % Students |
| Nursery / Preschool | 193 | 10.8% |
| Kindergarten | 192 | 10.7% |
| Elementary School | 436 | 24.3% |
| Middle School | 367 | 20.5% |
| High School | 430 | 24.0% |
| College / Undergraduate | 165 | 9.2% |
| Graduate / Professional | 8 | 0.4% |
| Total | 1,791 | 100.0% |
School Enrollment by Age by Funding Source in Cameron Park
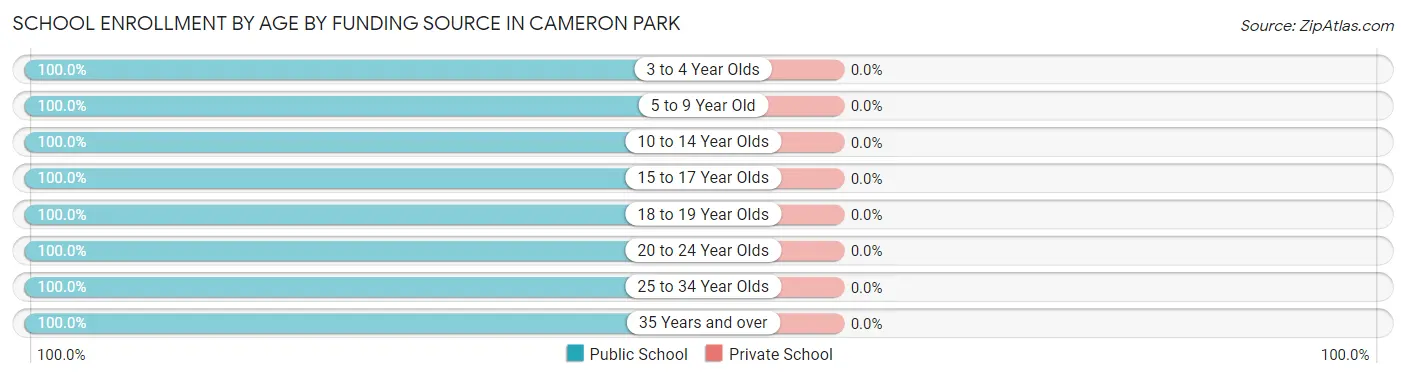
| Age Bracket | Public School | Private School |
| 3 to 4 Year Olds | 151 (100.0%) | 0 (0.0%) |
| 5 to 9 Year Old | 645 (100.0%) | 0 (0.0%) |
| 10 to 14 Year Olds | 461 (100.0%) | 0 (0.0%) |
| 15 to 17 Year Olds | 280 (100.0%) | 0 (0.0%) |
| 18 to 19 Year Olds | 125 (100.0%) | 0 (0.0%) |
| 20 to 24 Year Olds | 66 (100.0%) | 0 (0.0%) |
| 25 to 34 Year Olds | 58 (100.0%) | 0 (0.0%) |
| 35 Years and over | 5 (100.0%) | 0 (0.0%) |
| Total | 1,791 (100.0%) | 0 (0.0%) |
Educational Attainment by Field of Study in Cameron Park
Business (67 | 35.6%), education (51 | 27.1%), engineering (33 | 17.5%), social sciences (26 | 13.8%), and science & technology (11 | 5.9%) are the most common fields of study among 188 individuals in Cameron Park who have obtained a bachelor's degree or higher.
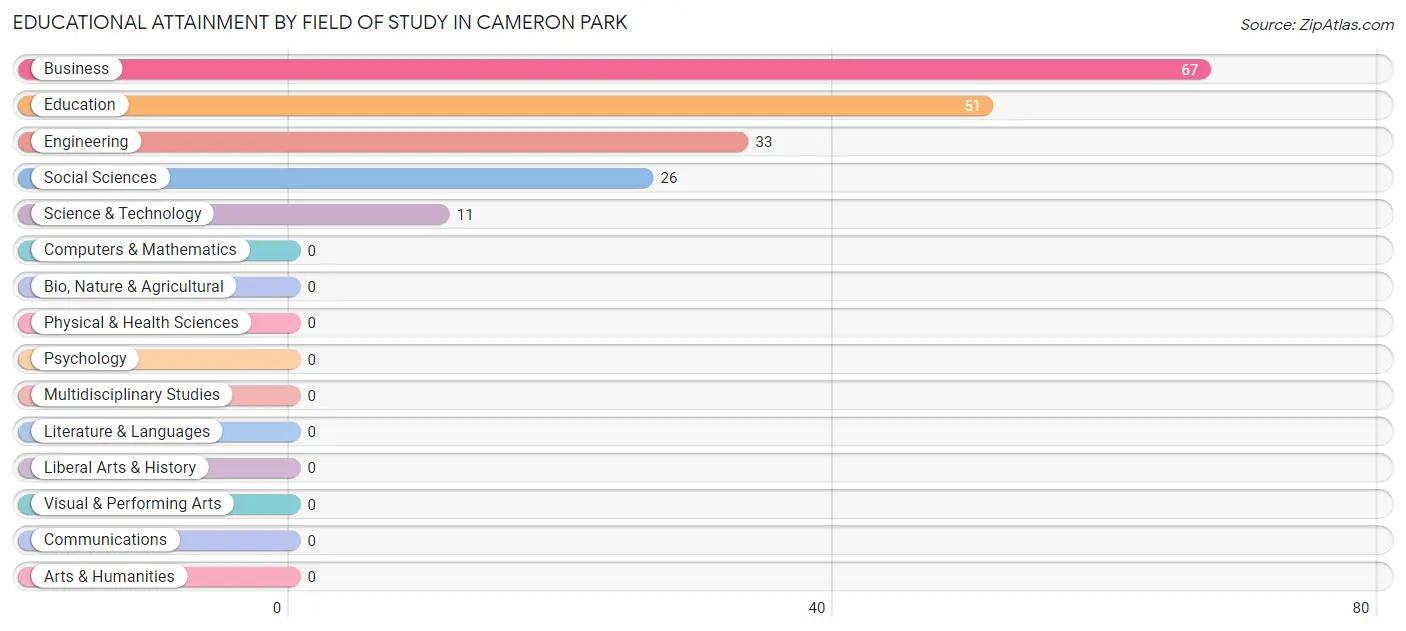
| Field of Study | # Graduates | % Graduates |
| Computers & Mathematics | 0 | 0.0% |
| Bio, Nature & Agricultural | 0 | 0.0% |
| Physical & Health Sciences | 0 | 0.0% |
| Psychology | 0 | 0.0% |
| Social Sciences | 26 | 13.8% |
| Engineering | 33 | 17.5% |
| Multidisciplinary Studies | 0 | 0.0% |
| Science & Technology | 11 | 5.9% |
| Business | 67 | 35.6% |
| Education | 51 | 27.1% |
| Literature & Languages | 0 | 0.0% |
| Liberal Arts & History | 0 | 0.0% |
| Visual & Performing Arts | 0 | 0.0% |
| Communications | 0 | 0.0% |
| Arts & Humanities | 0 | 0.0% |
| Total | 188 | 100.0% |
Transportation & Commute in Cameron Park
Vehicle Availability by Sex in Cameron Park
The most prevalent vehicle ownership categories in Cameron Park are males with 2 vehicles (336, accounting for 26.7%) and females with 2 vehicles (238, making up 46.4%).
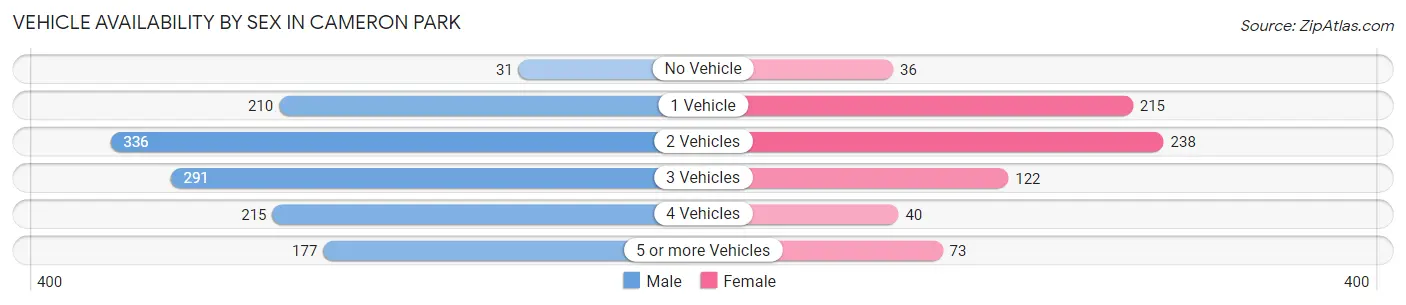
| Vehicles Available | Male | Female |
| No Vehicle | 31 (2.5%) | 36 (5.0%) |
| 1 Vehicle | 210 (16.7%) | 215 (29.7%) |
| 2 Vehicles | 336 (26.7%) | 238 (32.9%) |
| 3 Vehicles | 291 (23.1%) | 122 (16.9%) |
| 4 Vehicles | 215 (17.1%) | 40 (5.5%) |
| 5 or more Vehicles | 177 (14.1%) | 73 (10.1%) |
| Total | 1,260 (100.0%) | 724 (100.0%) |
Commute Time in Cameron Park
The most frequently occuring commute durations in Cameron Park are 20 to 24 minutes (486 commuters, 27.1%), 15 to 19 minutes (416 commuters, 23.2%), and 10 to 14 minutes (388 commuters, 21.6%).
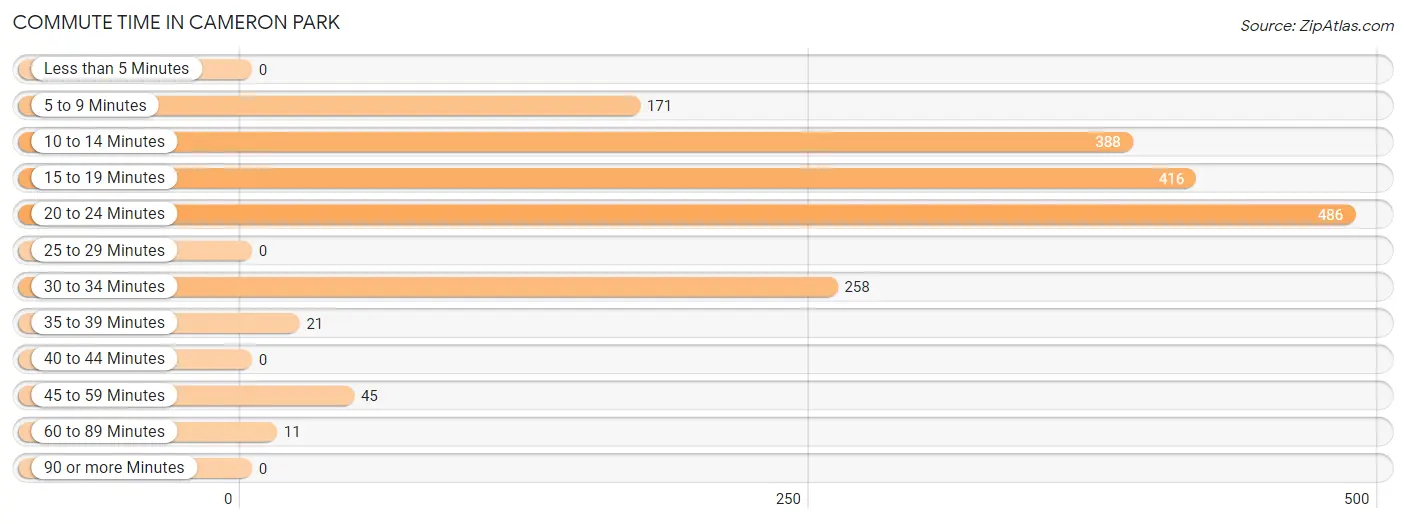
| Commute Time | # Commuters | % Commuters |
| Less than 5 Minutes | 0 | 0.0% |
| 5 to 9 Minutes | 171 | 9.5% |
| 10 to 14 Minutes | 388 | 21.6% |
| 15 to 19 Minutes | 416 | 23.2% |
| 20 to 24 Minutes | 486 | 27.1% |
| 25 to 29 Minutes | 0 | 0.0% |
| 30 to 34 Minutes | 258 | 14.4% |
| 35 to 39 Minutes | 21 | 1.2% |
| 40 to 44 Minutes | 0 | 0.0% |
| 45 to 59 Minutes | 45 | 2.5% |
| 60 to 89 Minutes | 11 | 0.6% |
| 90 or more Minutes | 0 | 0.0% |
Commute Time by Sex in Cameron Park
The most common commute times in Cameron Park are 15 to 19 minutes (309 commuters, 27.1%) for males and 20 to 24 minutes (225 commuters, 34.3%) for females.
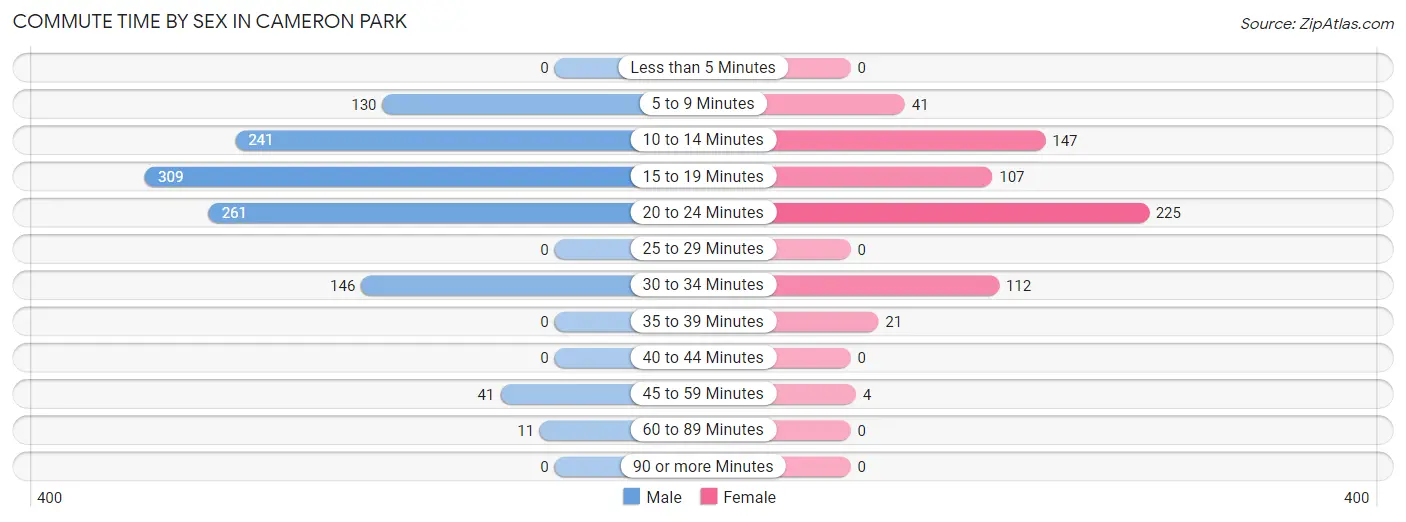
| Commute Time | Male | Female |
| Less than 5 Minutes | 0 (0.0%) | 0 (0.0%) |
| 5 to 9 Minutes | 130 (11.4%) | 41 (6.2%) |
| 10 to 14 Minutes | 241 (21.2%) | 147 (22.4%) |
| 15 to 19 Minutes | 309 (27.1%) | 107 (16.3%) |
| 20 to 24 Minutes | 261 (22.9%) | 225 (34.3%) |
| 25 to 29 Minutes | 0 (0.0%) | 0 (0.0%) |
| 30 to 34 Minutes | 146 (12.8%) | 112 (17.1%) |
| 35 to 39 Minutes | 0 (0.0%) | 21 (3.2%) |
| 40 to 44 Minutes | 0 (0.0%) | 0 (0.0%) |
| 45 to 59 Minutes | 41 (3.6%) | 4 (0.6%) |
| 60 to 89 Minutes | 11 (1.0%) | 0 (0.0%) |
| 90 or more Minutes | 0 (0.0%) | 0 (0.0%) |
Time of Departure to Work by Sex in Cameron Park
The most frequent times of departure to work in Cameron Park are 8:00 AM to 8:29 AM (167, 14.7%) for males and 7:30 AM to 7:59 AM (193, 29.4%) for females.
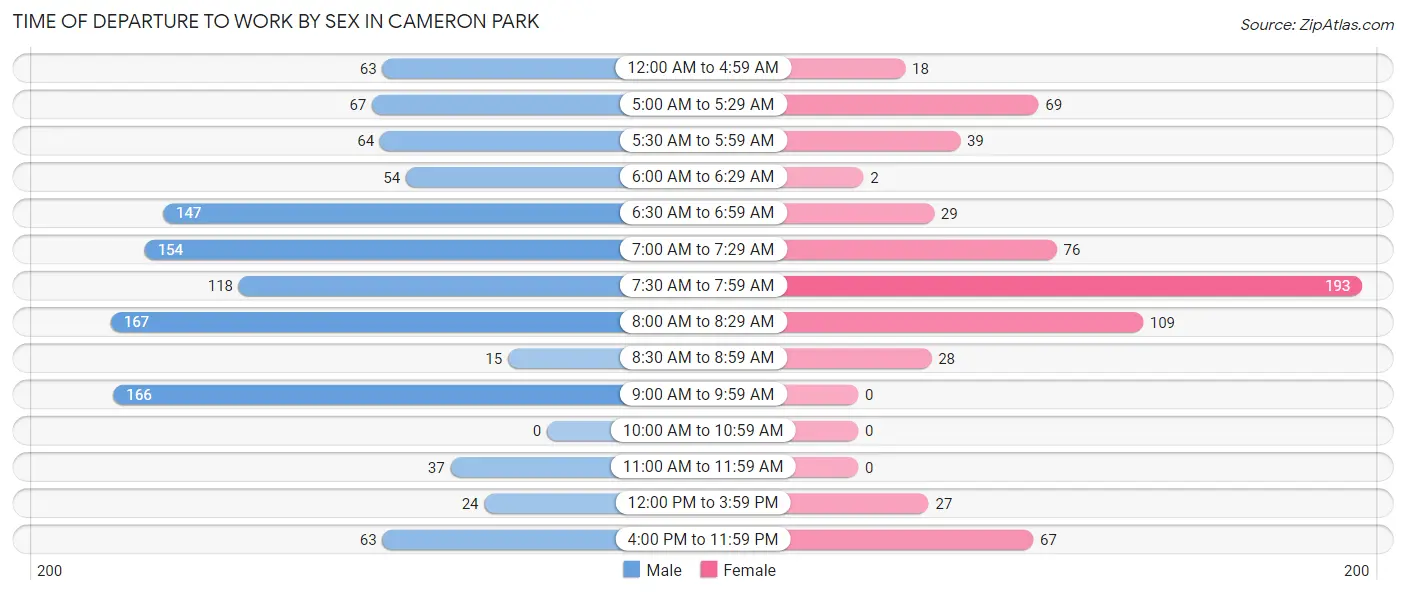
| Time of Departure | Male | Female |
| 12:00 AM to 4:59 AM | 63 (5.5%) | 18 (2.7%) |
| 5:00 AM to 5:29 AM | 67 (5.9%) | 69 (10.5%) |
| 5:30 AM to 5:59 AM | 64 (5.6%) | 39 (5.9%) |
| 6:00 AM to 6:29 AM | 54 (4.7%) | 2 (0.3%) |
| 6:30 AM to 6:59 AM | 147 (12.9%) | 29 (4.4%) |
| 7:00 AM to 7:29 AM | 154 (13.5%) | 76 (11.6%) |
| 7:30 AM to 7:59 AM | 118 (10.4%) | 193 (29.4%) |
| 8:00 AM to 8:29 AM | 167 (14.7%) | 109 (16.6%) |
| 8:30 AM to 8:59 AM | 15 (1.3%) | 28 (4.3%) |
| 9:00 AM to 9:59 AM | 166 (14.6%) | 0 (0.0%) |
| 10:00 AM to 10:59 AM | 0 (0.0%) | 0 (0.0%) |
| 11:00 AM to 11:59 AM | 37 (3.3%) | 0 (0.0%) |
| 12:00 PM to 3:59 PM | 24 (2.1%) | 27 (4.1%) |
| 4:00 PM to 11:59 PM | 63 (5.5%) | 67 (10.2%) |
| Total | 1,139 (100.0%) | 657 (100.0%) |
Housing Occupancy in Cameron Park
Occupancy by Ownership in Cameron Park
Of the total 1,505 dwellings in Cameron Park, owner-occupied units account for 975 (64.8%), while renter-occupied units make up 530 (35.2%).
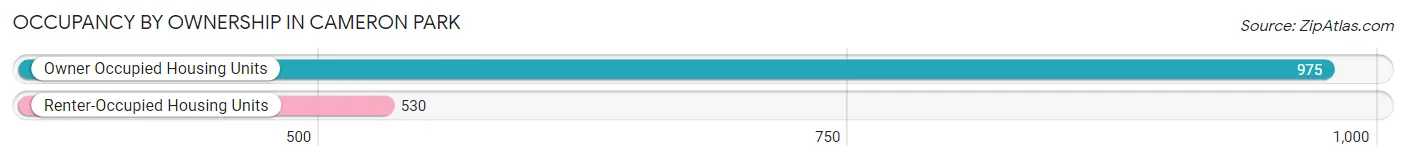
| Occupancy | # Housing Units | % Housing Units |
| Owner Occupied Housing Units | 975 | 64.8% |
| Renter-Occupied Housing Units | 530 | 35.2% |
| Total Occupied Housing Units | 1,505 | 100.0% |
Occupancy by Household Size in Cameron Park
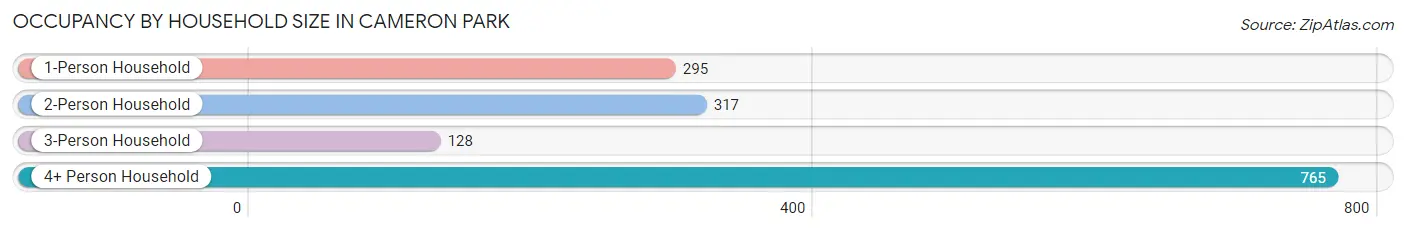
| Household Size | # Housing Units | % Housing Units |
| 1-Person Household | 295 | 19.6% |
| 2-Person Household | 317 | 21.1% |
| 3-Person Household | 128 | 8.5% |
| 4+ Person Household | 765 | 50.8% |
| Total Housing Units | 1,505 | 100.0% |
Occupancy by Ownership by Household Size in Cameron Park
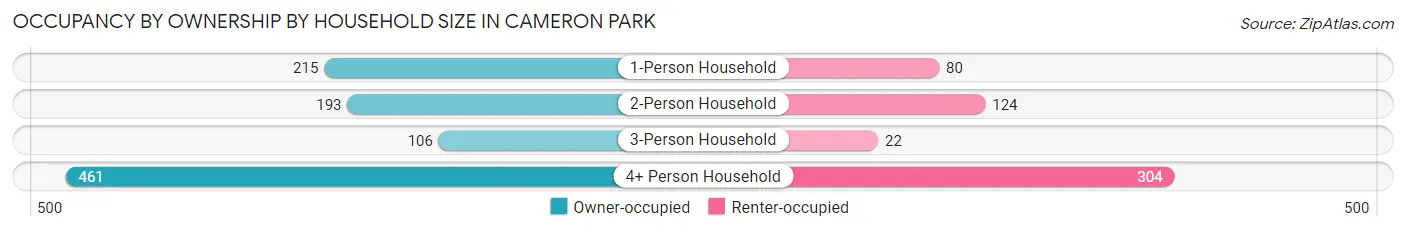
| Household Size | Owner-occupied | Renter-occupied |
| 1-Person Household | 215 (72.9%) | 80 (27.1%) |
| 2-Person Household | 193 (60.9%) | 124 (39.1%) |
| 3-Person Household | 106 (82.8%) | 22 (17.2%) |
| 4+ Person Household | 461 (60.3%) | 304 (39.7%) |
| Total Housing Units | 975 (64.8%) | 530 (35.2%) |
Occupancy by Educational Attainment in Cameron Park
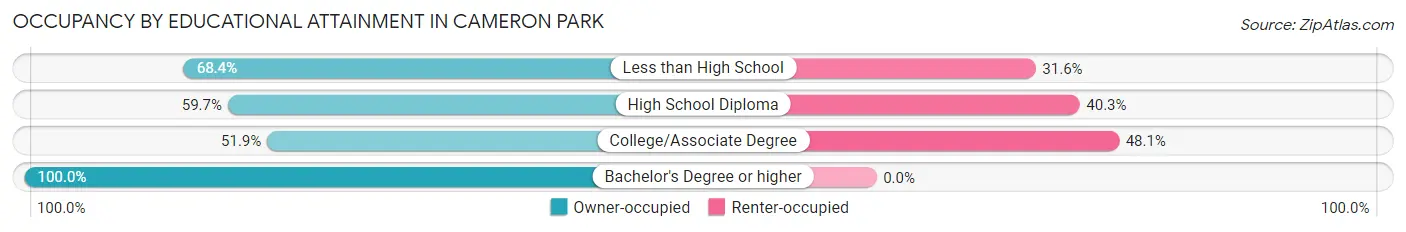
| Household Size | Owner-occupied | Renter-occupied |
| Less than High School | 635 (68.4%) | 293 (31.6%) |
| High School Diploma | 166 (59.7%) | 112 (40.3%) |
| College/Associate Degree | 135 (51.9%) | 125 (48.1%) |
| Bachelor's Degree or higher | 39 (100.0%) | 0 (0.0%) |
Occupancy by Age of Householder in Cameron Park
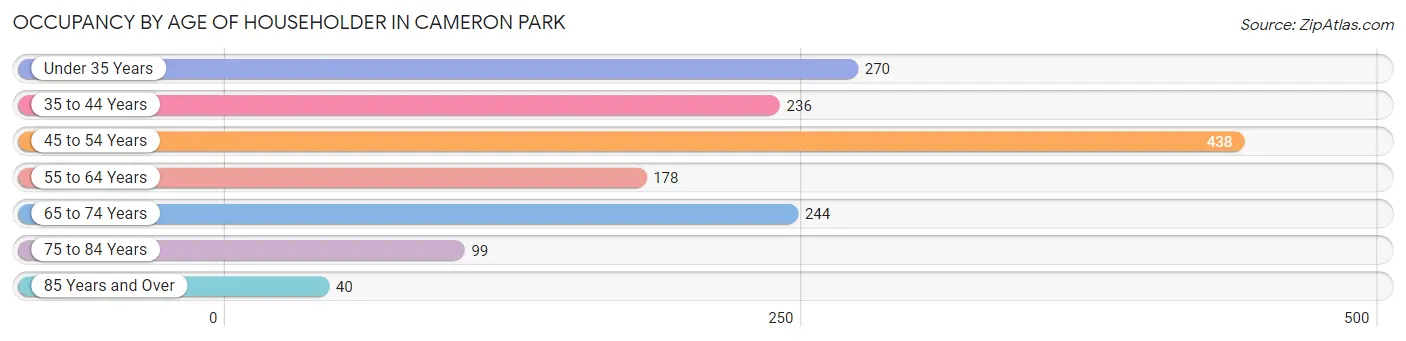
| Age Bracket | # Households | % Households |
| Under 35 Years | 270 | 17.9% |
| 35 to 44 Years | 236 | 15.7% |
| 45 to 54 Years | 438 | 29.1% |
| 55 to 64 Years | 178 | 11.8% |
| 65 to 74 Years | 244 | 16.2% |
| 75 to 84 Years | 99 | 6.6% |
| 85 Years and Over | 40 | 2.7% |
| Total | 1,505 | 100.0% |
Housing Finances in Cameron Park
Median Income by Occupancy in Cameron Park
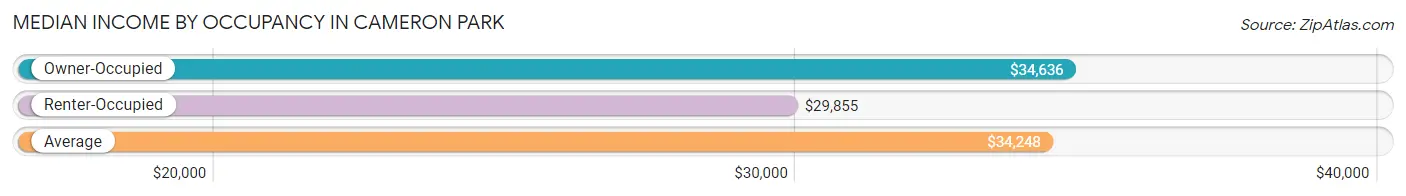
| Occupancy Type | # Households | Median Income |
| Owner-Occupied | 975 (64.8%) | $34,636 |
| Renter-Occupied | 530 (35.2%) | $29,855 |
| Average | 1,505 (100.0%) | $34,248 |
Occupancy by Householder Income Bracket in Cameron Park
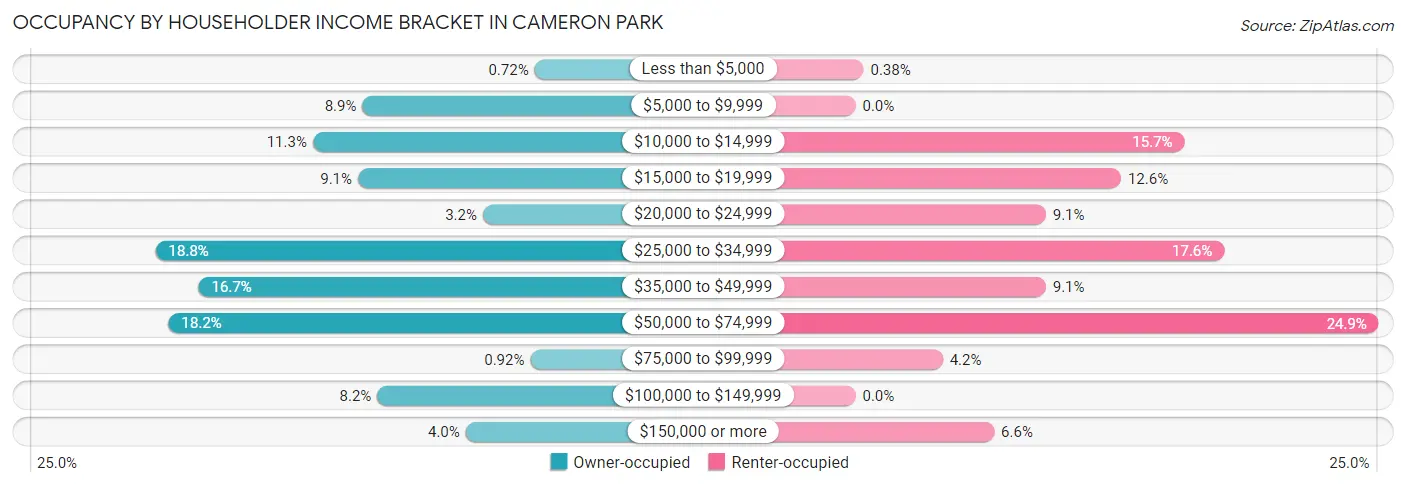
| Income Bracket | Owner-occupied | Renter-occupied |
| Less than $5,000 | 7 (0.7%) | 2 (0.4%) |
| $5,000 to $9,999 | 87 (8.9%) | 0 (0.0%) |
| $10,000 to $14,999 | 110 (11.3%) | 83 (15.7%) |
| $15,000 to $19,999 | 89 (9.1%) | 67 (12.6%) |
| $20,000 to $24,999 | 31 (3.2%) | 48 (9.1%) |
| $25,000 to $34,999 | 183 (18.8%) | 93 (17.5%) |
| $35,000 to $49,999 | 163 (16.7%) | 48 (9.1%) |
| $50,000 to $74,999 | 177 (18.1%) | 132 (24.9%) |
| $75,000 to $99,999 | 9 (0.9%) | 22 (4.2%) |
| $100,000 to $149,999 | 80 (8.2%) | 0 (0.0%) |
| $150,000 or more | 39 (4.0%) | 35 (6.6%) |
| Total | 975 (100.0%) | 530 (100.0%) |
Monthly Housing Cost Tiers in Cameron Park
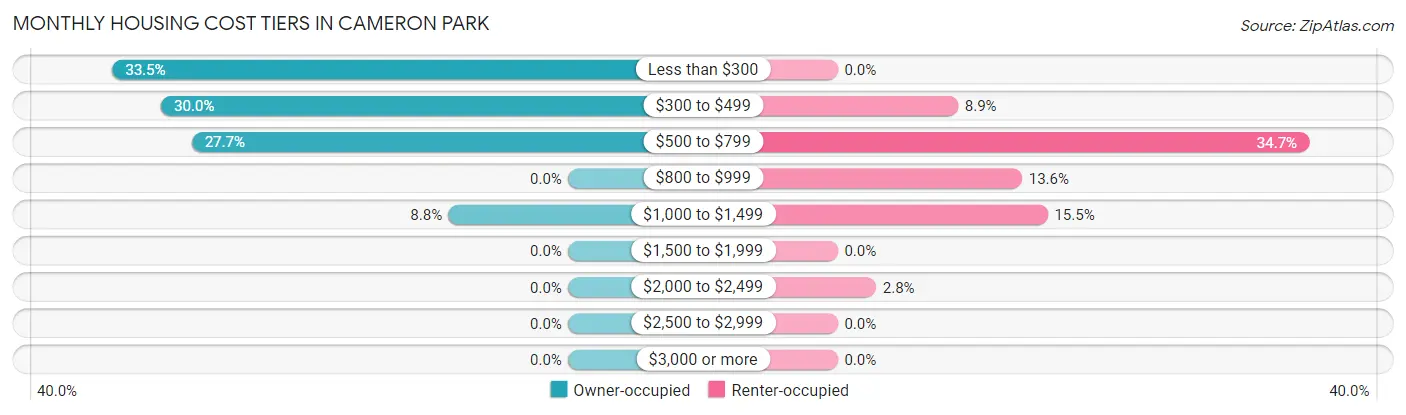
| Monthly Cost | Owner-occupied | Renter-occupied |
| Less than $300 | 327 (33.5%) | 0 (0.0%) |
| $300 to $499 | 292 (29.9%) | 47 (8.9%) |
| $500 to $799 | 270 (27.7%) | 184 (34.7%) |
| $800 to $999 | 0 (0.0%) | 72 (13.6%) |
| $1,000 to $1,499 | 86 (8.8%) | 82 (15.5%) |
| $1,500 to $1,999 | 0 (0.0%) | 0 (0.0%) |
| $2,000 to $2,499 | 0 (0.0%) | 15 (2.8%) |
| $2,500 to $2,999 | 0 (0.0%) | 0 (0.0%) |
| $3,000 or more | 0 (0.0%) | 0 (0.0%) |
| Total | 975 (100.0%) | 530 (100.0%) |
Physical Housing Characteristics in Cameron Park
Housing Structures in Cameron Park
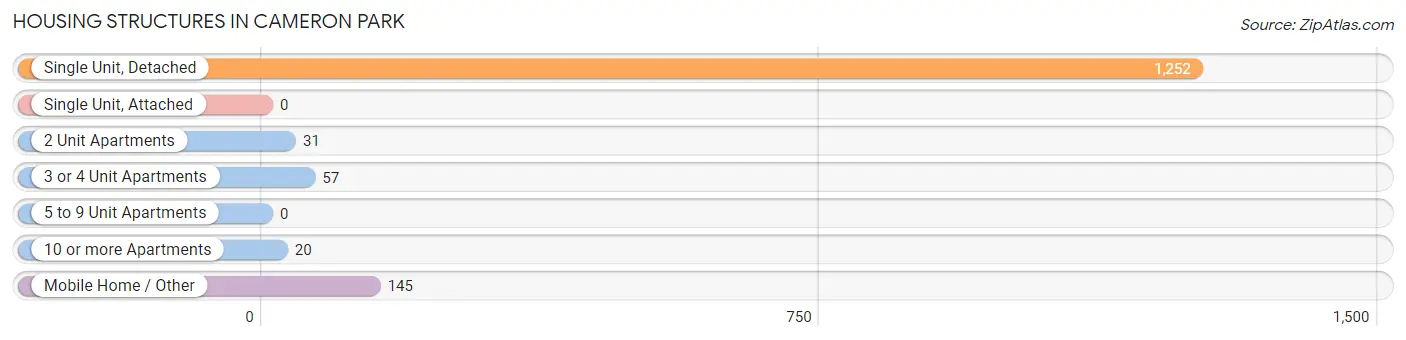
| Structure Type | # Housing Units | % Housing Units |
| Single Unit, Detached | 1,252 | 83.2% |
| Single Unit, Attached | 0 | 0.0% |
| 2 Unit Apartments | 31 | 2.1% |
| 3 or 4 Unit Apartments | 57 | 3.8% |
| 5 to 9 Unit Apartments | 0 | 0.0% |
| 10 or more Apartments | 20 | 1.3% |
| Mobile Home / Other | 145 | 9.6% |
| Total | 1,505 | 100.0% |
Housing Structures by Occupancy in Cameron Park
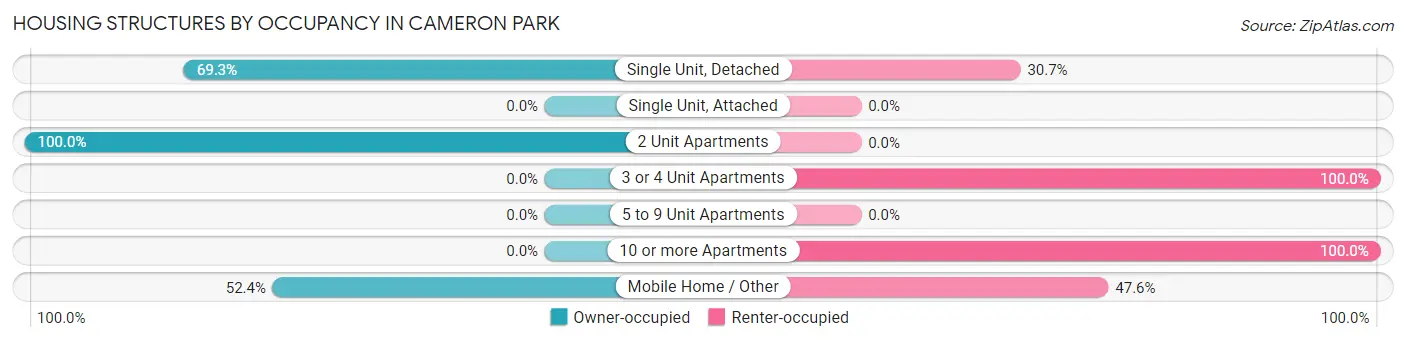
| Structure Type | Owner-occupied | Renter-occupied |
| Single Unit, Detached | 868 (69.3%) | 384 (30.7%) |
| Single Unit, Attached | 0 (0.0%) | 0 (0.0%) |
| 2 Unit Apartments | 31 (100.0%) | 0 (0.0%) |
| 3 or 4 Unit Apartments | 0 (0.0%) | 57 (100.0%) |
| 5 to 9 Unit Apartments | 0 (0.0%) | 0 (0.0%) |
| 10 or more Apartments | 0 (0.0%) | 20 (100.0%) |
| Mobile Home / Other | 76 (52.4%) | 69 (47.6%) |
| Total | 975 (64.8%) | 530 (35.2%) |
Housing Structures by Number of Rooms in Cameron Park
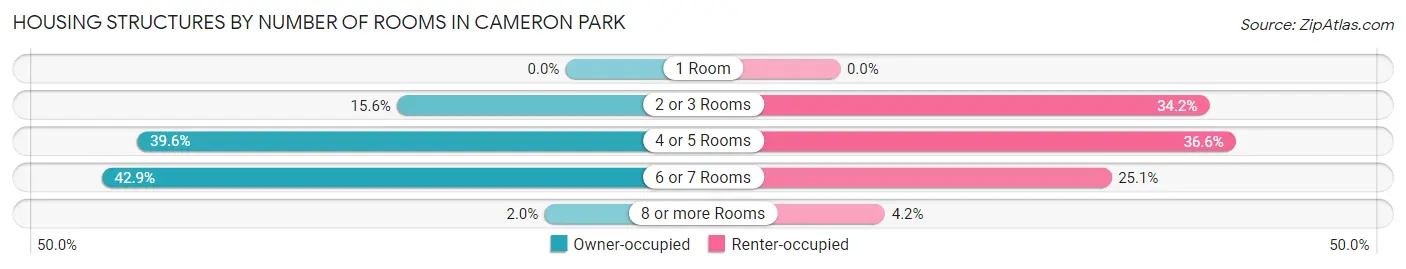
| Number of Rooms | Owner-occupied | Renter-occupied |
| 1 Room | 0 (0.0%) | 0 (0.0%) |
| 2 or 3 Rooms | 152 (15.6%) | 181 (34.2%) |
| 4 or 5 Rooms | 386 (39.6%) | 194 (36.6%) |
| 6 or 7 Rooms | 418 (42.9%) | 133 (25.1%) |
| 8 or more Rooms | 19 (1.9%) | 22 (4.2%) |
| Total | 975 (100.0%) | 530 (100.0%) |
Housing Structure by Heating Type in Cameron Park
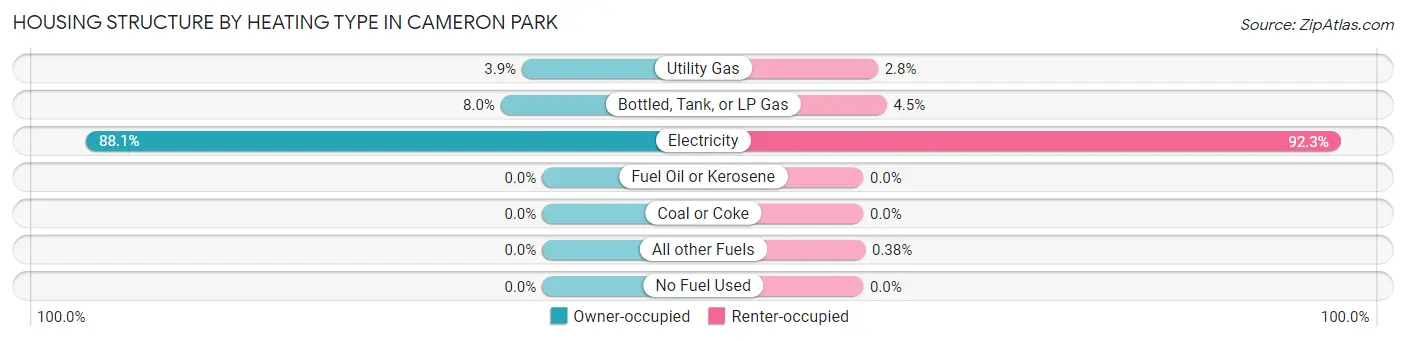
| Heating Type | Owner-occupied | Renter-occupied |
| Utility Gas | 38 (3.9%) | 15 (2.8%) |
| Bottled, Tank, or LP Gas | 78 (8.0%) | 24 (4.5%) |
| Electricity | 859 (88.1%) | 489 (92.3%) |
| Fuel Oil or Kerosene | 0 (0.0%) | 0 (0.0%) |
| Coal or Coke | 0 (0.0%) | 0 (0.0%) |
| All other Fuels | 0 (0.0%) | 2 (0.4%) |
| No Fuel Used | 0 (0.0%) | 0 (0.0%) |
| Total | 975 (100.0%) | 530 (100.0%) |
Household Vehicle Usage in Cameron Park
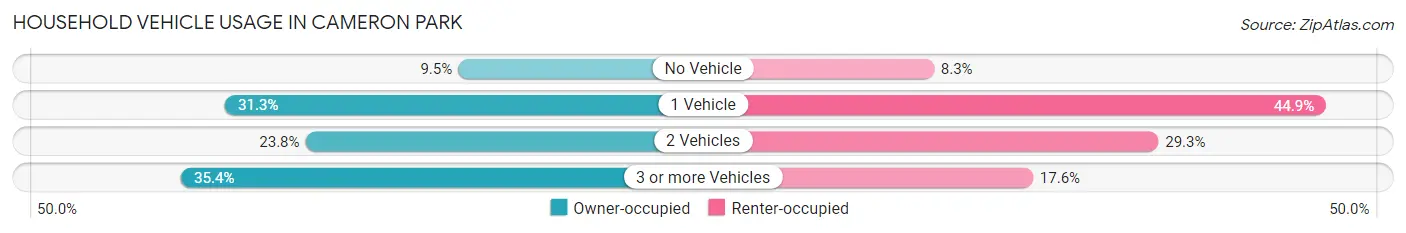
| Vehicles per Household | Owner-occupied | Renter-occupied |
| No Vehicle | 93 (9.5%) | 44 (8.3%) |
| 1 Vehicle | 305 (31.3%) | 238 (44.9%) |
| 2 Vehicles | 232 (23.8%) | 155 (29.2%) |
| 3 or more Vehicles | 345 (35.4%) | 93 (17.5%) |
| Total | 975 (100.0%) | 530 (100.0%) |
Real Estate & Mortgages in Cameron Park
Real Estate and Mortgage Overview in Cameron Park
| Characteristic | Without Mortgage | With Mortgage |
| Housing Units | 771 | 204 |
| Median Property Value | $67,700 | $78,000 |
| Median Household Income | $35,540 | $0 |
| Monthly Housing Costs | $324 | $0 |
| Real Estate Taxes | $905 | $0 |
Property Value by Mortgage Status in Cameron Park
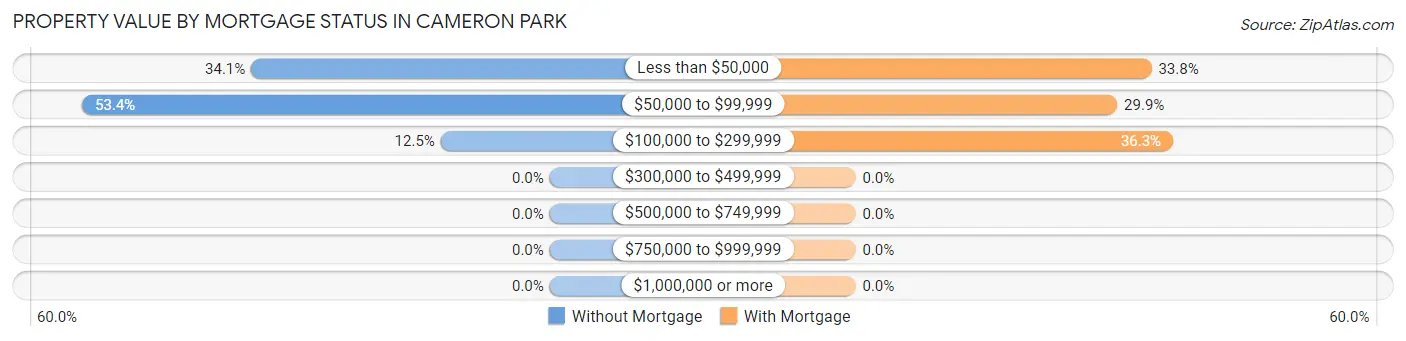
| Property Value | Without Mortgage | With Mortgage |
| Less than $50,000 | 263 (34.1%) | 69 (33.8%) |
| $50,000 to $99,999 | 412 (53.4%) | 61 (29.9%) |
| $100,000 to $299,999 | 96 (12.4%) | 74 (36.3%) |
| $300,000 to $499,999 | 0 (0.0%) | 0 (0.0%) |
| $500,000 to $749,999 | 0 (0.0%) | 0 (0.0%) |
| $750,000 to $999,999 | 0 (0.0%) | 0 (0.0%) |
| $1,000,000 or more | 0 (0.0%) | 0 (0.0%) |
| Total | 771 (100.0%) | 204 (100.0%) |
Household Income by Mortgage Status in Cameron Park
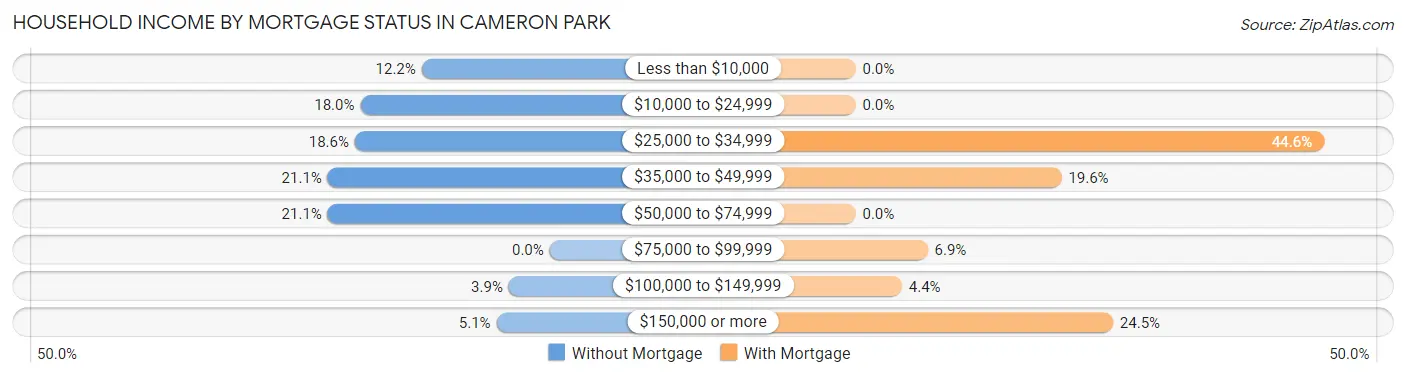
| Household Income | Without Mortgage | With Mortgage |
| Less than $10,000 | 94 (12.2%) | 0 (0.0%) |
| $10,000 to $24,999 | 139 (18.0%) | 0 (0.0%) |
| $25,000 to $34,999 | 143 (18.5%) | 91 (44.6%) |
| $35,000 to $49,999 | 163 (21.1%) | 40 (19.6%) |
| $50,000 to $74,999 | 163 (21.1%) | 0 (0.0%) |
| $75,000 to $99,999 | 0 (0.0%) | 14 (6.9%) |
| $100,000 to $149,999 | 30 (3.9%) | 9 (4.4%) |
| $150,000 or more | 39 (5.1%) | 50 (24.5%) |
| Total | 771 (100.0%) | 204 (100.0%) |
Property Value to Household Income Ratio in Cameron Park
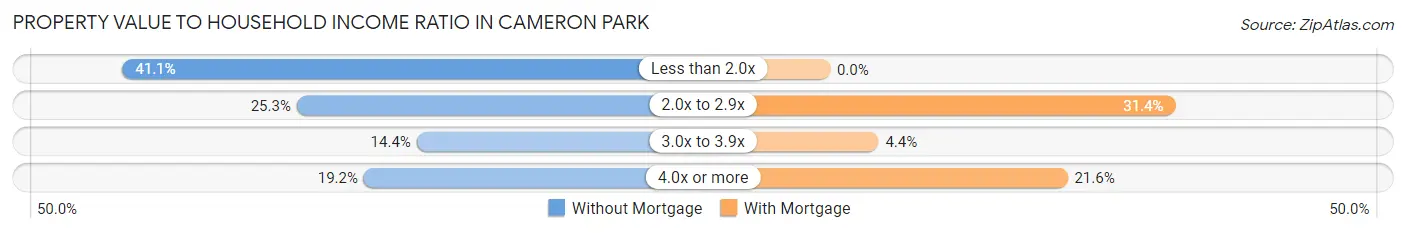
| Value-to-Income Ratio | Without Mortgage | With Mortgage |
| Less than 2.0x | 317 (41.1%) | 0 (0.0%) |
| 2.0x to 2.9x | 195 (25.3%) | 64 (31.4%) |
| 3.0x to 3.9x | 111 (14.4%) | 9 (4.4%) |
| 4.0x or more | 148 (19.2%) | 44 (21.6%) |
| Total | 771 (100.0%) | 204 (100.0%) |
Real Estate Taxes by Mortgage Status in Cameron Park
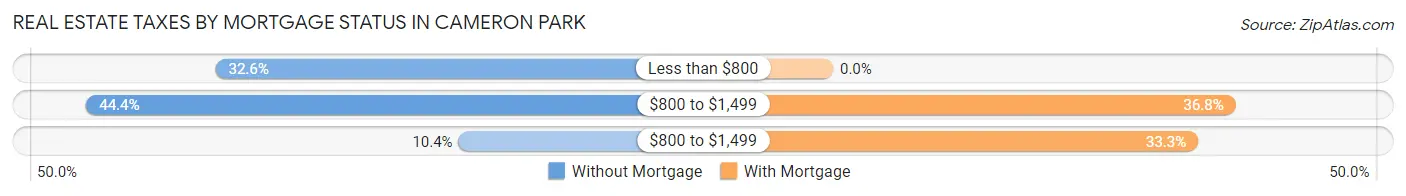
| Property Taxes | Without Mortgage | With Mortgage |
| Less than $800 | 251 (32.6%) | 0 (0.0%) |
| $800 to $1,499 | 342 (44.4%) | 75 (36.8%) |
| $800 to $1,499 | 80 (10.4%) | 68 (33.3%) |
| Total | 771 (100.0%) | 204 (100.0%) |
Health & Disability in Cameron Park
Health Insurance Coverage by Age in Cameron Park
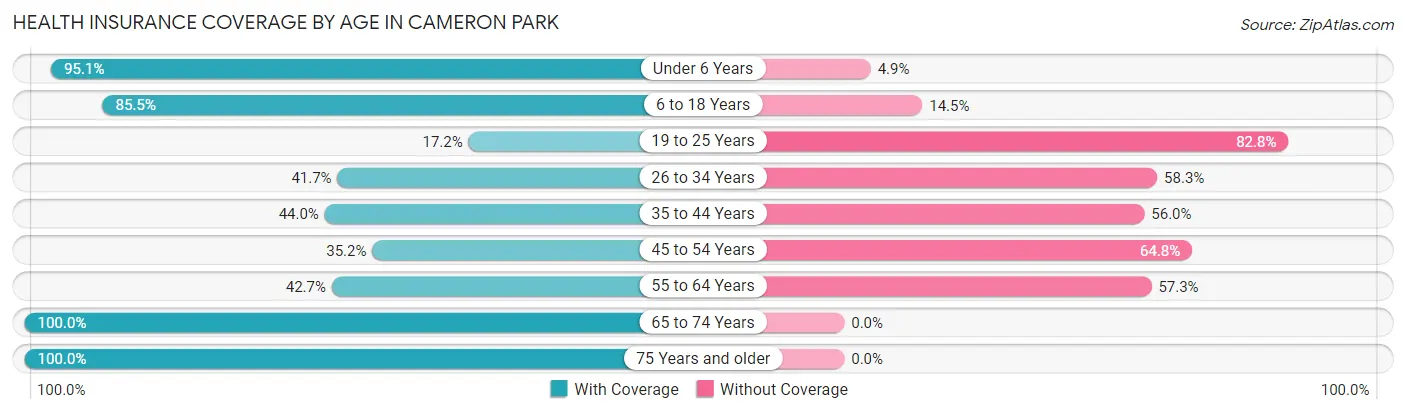
| Age Bracket | With Coverage | Without Coverage |
| Under 6 Years | 501 (95.1%) | 26 (4.9%) |
| 6 to 18 Years | 1,152 (85.5%) | 196 (14.5%) |
| 19 to 25 Years | 136 (17.2%) | 654 (82.8%) |
| 26 to 34 Years | 322 (41.7%) | 451 (58.3%) |
| 35 to 44 Years | 240 (44.0%) | 305 (56.0%) |
| 45 to 54 Years | 283 (35.2%) | 522 (64.8%) |
| 55 to 64 Years | 220 (42.7%) | 295 (57.3%) |
| 65 to 74 Years | 350 (100.0%) | 0 (0.0%) |
| 75 Years and older | 177 (100.0%) | 0 (0.0%) |
| Total | 3,381 (58.0%) | 2,449 (42.0%) |
Health Insurance Coverage by Citizenship Status in Cameron Park
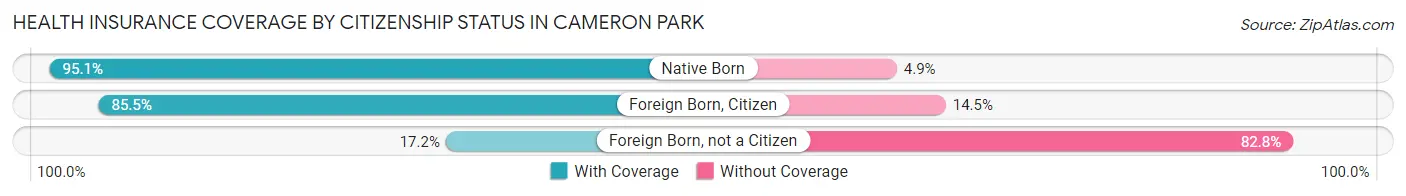
| Citizenship Status | With Coverage | Without Coverage |
| Native Born | 501 (95.1%) | 26 (4.9%) |
| Foreign Born, Citizen | 1,152 (85.5%) | 196 (14.5%) |
| Foreign Born, not a Citizen | 136 (17.2%) | 654 (82.8%) |
Health Insurance Coverage by Household Income in Cameron Park
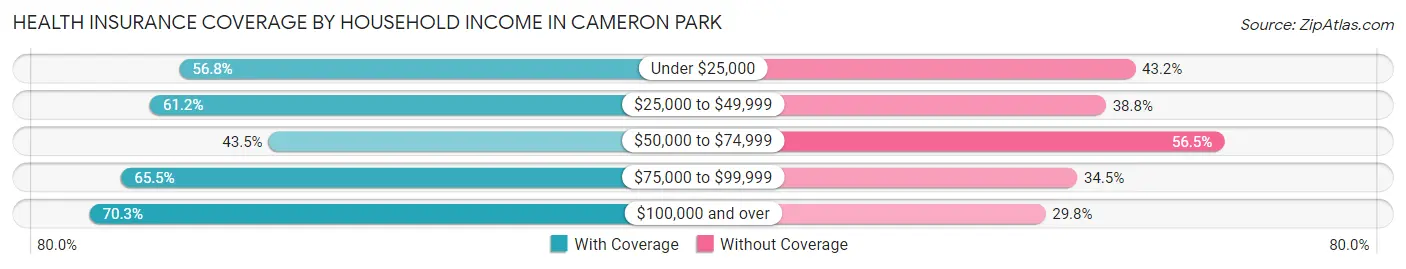
| Household Income | With Coverage | Without Coverage |
| Under $25,000 | 862 (56.8%) | 656 (43.2%) |
| $25,000 to $49,999 | 1,348 (61.2%) | 855 (38.8%) |
| $50,000 to $74,999 | 495 (43.5%) | 644 (56.5%) |
| $75,000 to $99,999 | 74 (65.5%) | 39 (34.5%) |
| $100,000 and over | 602 (70.3%) | 255 (29.7%) |
Public vs Private Health Insurance Coverage by Age in Cameron Park
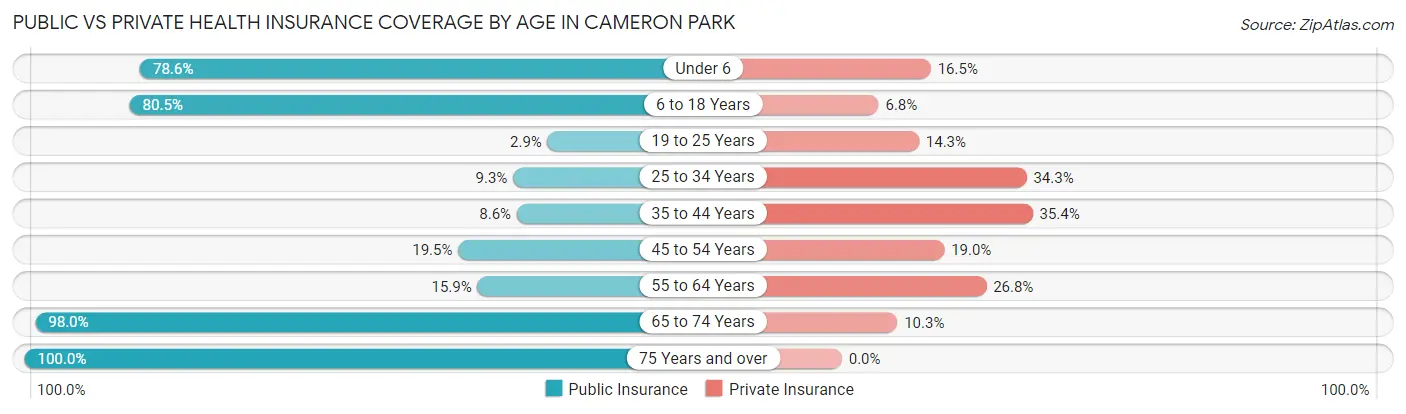
| Age Bracket | Public Insurance | Private Insurance |
| Under 6 | 414 (78.6%) | 87 (16.5%) |
| 6 to 18 Years | 1,085 (80.5%) | 92 (6.8%) |
| 19 to 25 Years | 23 (2.9%) | 113 (14.3%) |
| 25 to 34 Years | 72 (9.3%) | 265 (34.3%) |
| 35 to 44 Years | 47 (8.6%) | 193 (35.4%) |
| 45 to 54 Years | 157 (19.5%) | 153 (19.0%) |
| 55 to 64 Years | 82 (15.9%) | 138 (26.8%) |
| 65 to 74 Years | 343 (98.0%) | 36 (10.3%) |
| 75 Years and over | 177 (100.0%) | 0 (0.0%) |
| Total | 2,400 (41.2%) | 1,077 (18.5%) |
Disability Status by Sex by Age in Cameron Park
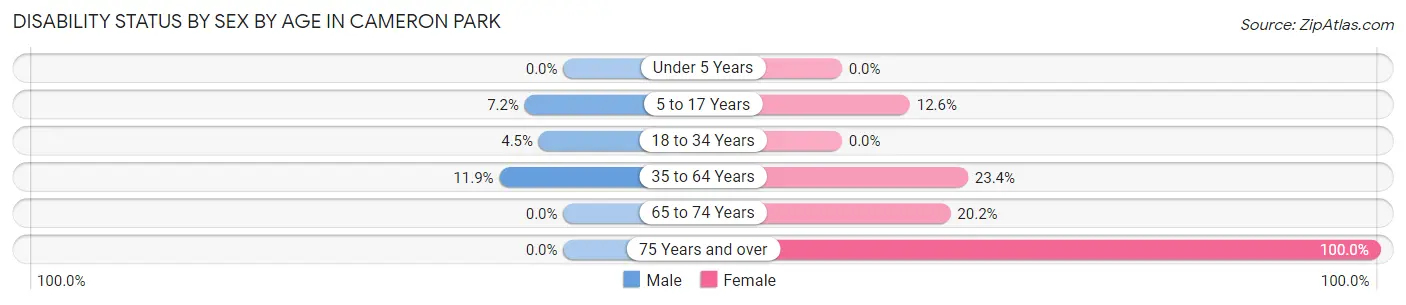
| Age Bracket | Male | Female |
| Under 5 Years | 0 (0.0%) | 0 (0.0%) |
| 5 to 17 Years | 57 (7.1%) | 75 (12.6%) |
| 18 to 34 Years | 47 (4.5%) | 0 (0.0%) |
| 35 to 64 Years | 123 (11.9%) | 194 (23.4%) |
| 65 to 74 Years | 0 (0.0%) | 50 (20.2%) |
| 75 Years and over | 0 (0.0%) | 107 (100.0%) |
Disability Class by Sex by Age in Cameron Park
Disability Class: Hearing Difficulty
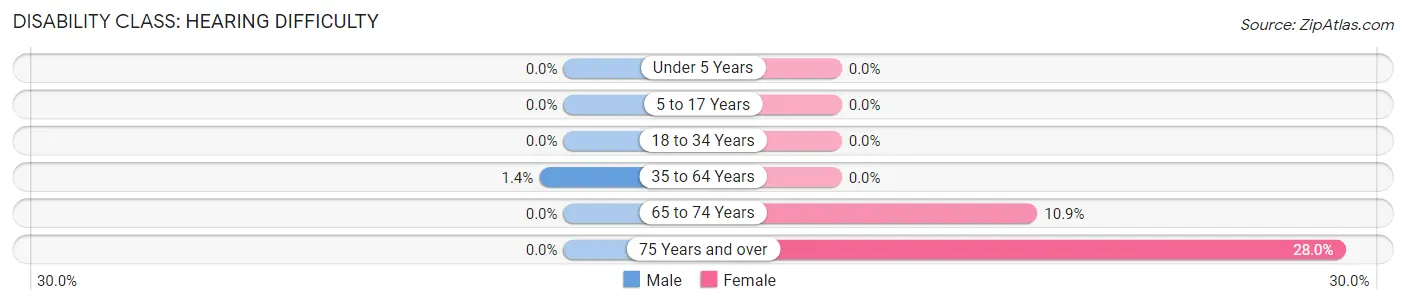
| Age Bracket | Male | Female |
| Under 5 Years | 0 (0.0%) | 0 (0.0%) |
| 5 to 17 Years | 0 (0.0%) | 0 (0.0%) |
| 18 to 34 Years | 0 (0.0%) | 0 (0.0%) |
| 35 to 64 Years | 14 (1.3%) | 0 (0.0%) |
| 65 to 74 Years | 0 (0.0%) | 27 (10.9%) |
| 75 Years and over | 0 (0.0%) | 30 (28.0%) |
Disability Class: Vision Difficulty
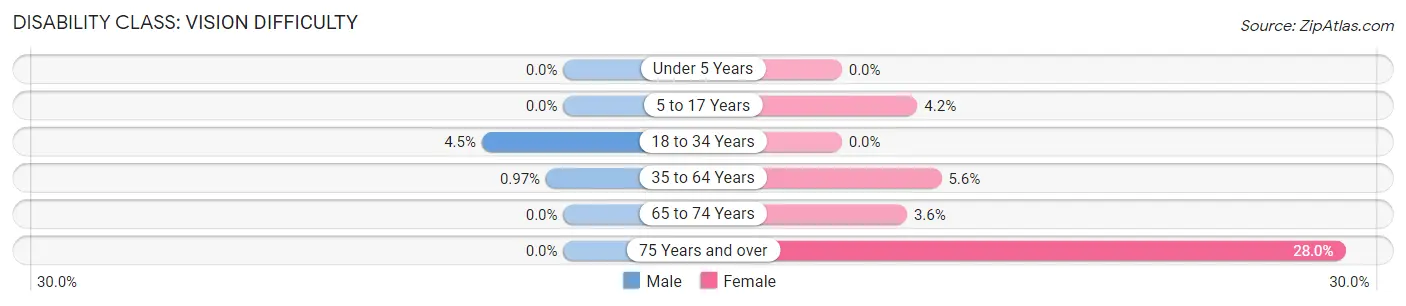
| Age Bracket | Male | Female |
| Under 5 Years | 0 (0.0%) | 0 (0.0%) |
| 5 to 17 Years | 0 (0.0%) | 25 (4.2%) |
| 18 to 34 Years | 47 (4.5%) | 0 (0.0%) |
| 35 to 64 Years | 10 (1.0%) | 46 (5.6%) |
| 65 to 74 Years | 0 (0.0%) | 9 (3.6%) |
| 75 Years and over | 0 (0.0%) | 30 (28.0%) |
Disability Class: Cognitive Difficulty
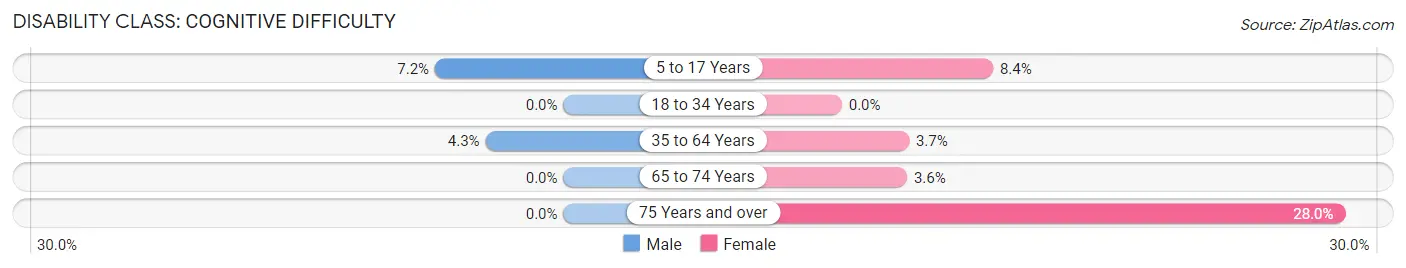
| Age Bracket | Male | Female |
| 5 to 17 Years | 57 (7.1%) | 50 (8.4%) |
| 18 to 34 Years | 0 (0.0%) | 0 (0.0%) |
| 35 to 64 Years | 45 (4.3%) | 31 (3.7%) |
| 65 to 74 Years | 0 (0.0%) | 9 (3.6%) |
| 75 Years and over | 0 (0.0%) | 30 (28.0%) |
Disability Class: Ambulatory Difficulty
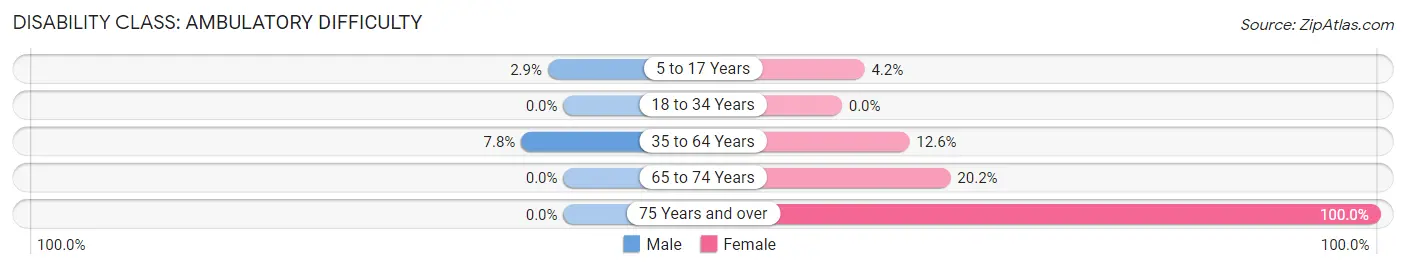
| Age Bracket | Male | Female |
| 5 to 17 Years | 23 (2.9%) | 25 (4.2%) |
| 18 to 34 Years | 0 (0.0%) | 0 (0.0%) |
| 35 to 64 Years | 81 (7.8%) | 104 (12.6%) |
| 65 to 74 Years | 0 (0.0%) | 50 (20.2%) |
| 75 Years and over | 0 (0.0%) | 107 (100.0%) |
Disability Class: Self-Care Difficulty
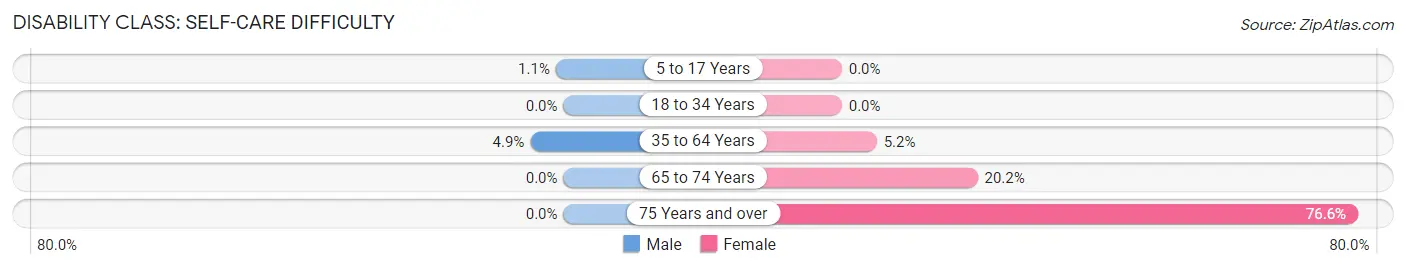
| Age Bracket | Male | Female |
| 5 to 17 Years | 9 (1.1%) | 0 (0.0%) |
| 18 to 34 Years | 0 (0.0%) | 0 (0.0%) |
| 35 to 64 Years | 51 (4.9%) | 43 (5.2%) |
| 65 to 74 Years | 0 (0.0%) | 50 (20.2%) |
| 75 Years and over | 0 (0.0%) | 82 (76.6%) |
Technology Access in Cameron Park
Computing Device Access in Cameron Park
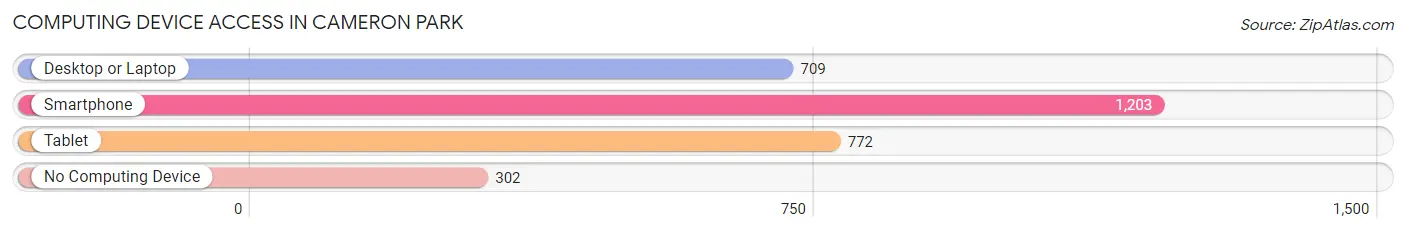
| Device Type | # Households | % Households |
| Desktop or Laptop | 709 | 47.1% |
| Smartphone | 1,203 | 79.9% |
| Tablet | 772 | 51.3% |
| No Computing Device | 302 | 20.1% |
| Total | 1,505 | 100.0% |
Internet Access in Cameron Park
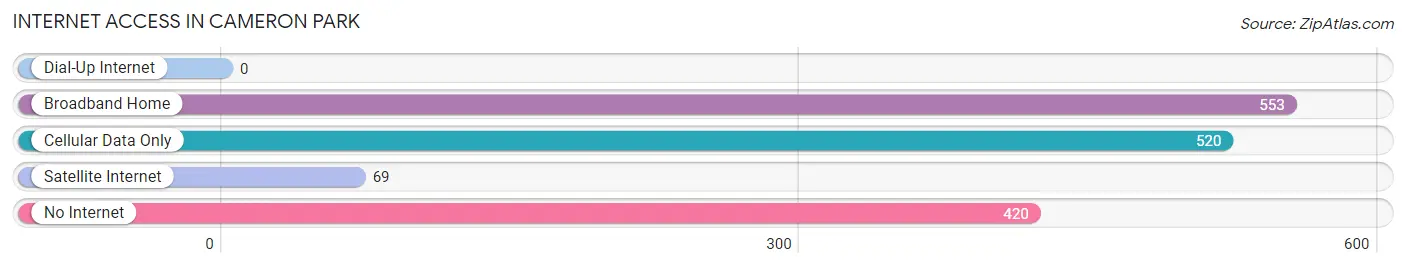
| Internet Type | # Households | % Households |
| Dial-Up Internet | 0 | 0.0% |
| Broadband Home | 553 | 36.7% |
| Cellular Data Only | 520 | 34.5% |
| Satellite Internet | 69 | 4.6% |
| No Internet | 420 | 27.9% |
| Total | 1,505 | 100.0% |
Cameron Park Summary
Cameron Park is a census-designated place (CDP) located in Hays County, Texas, United States. It is situated approximately 20 miles southwest of Austin, the state capital. As of the 2010 census, the population of Cameron Park was 1,945.
Geography
Cameron Park is located at 30°04'45"N 97°54'45"W (30.07917, -97.91250). It has an elevation of 645 feet (196 m). The CDP has a total area of 2.3 square miles (6.0 km2), all of which is land.
History
Cameron Park was first settled in the late 1800s by German immigrants. The area was originally known as “German Settlement” and was later renamed “Cameron Park” in honor of the local Cameron family. The area was officially incorporated as a CDP in the early 2000s.
Economy
Cameron Park is primarily a residential community, with most of its residents commuting to nearby cities for work. The local economy is largely supported by the retail and service industries. The area is home to several small businesses, including restaurants, convenience stores, and auto repair shops.
Demographics
As of the 2010 census, there were 1,945 people, 745 households, and 545 families residing in Cameron Park. The population density was 845.2 people per square mile (326.2/km2). The racial makeup of the CDP was 81.2% White, 8.2% African American, 0.2% Native American, 0.7% Asian, 0.1% Pacific Islander, 7.2% from other races, and 2.6% from two or more races. Hispanic or Latino of any race were 18.2% of the population.
The median income for a household in Cameron Park was $50,000, and the median income for a family was $54,000. About 11.2% of families and 14.2% of the population were below the poverty line, including 18.2% of those under age 18 and 8.2% of those age 65 or over.
Conclusion
Cameron Park is a small, residential community located in Hays County, Texas. It is situated approximately 20 miles southwest of Austin, the state capital. As of the 2010 census, the population of Cameron Park was 1,945. The local economy is largely supported by the retail and service industries, and the area is home to several small businesses. The racial makeup of the CDP was 81.2% White, 8.2% African American, 0.2% Native American, 0.7% Asian, 0.1% Pacific Islander, 7.2% from other races, and 2.6% from two or more races. The median income for a household in Cameron Park was $50,000, and the median income for a family was $54,000.
Common Questions
What is the Total Population of Cameron Park?
Total Population of Cameron Park is 5,830.
What is the Total Male Population of Cameron Park?
Total Male Population of Cameron Park is 3,189.
What is the Total Female Population of Cameron Park?
Total Female Population of Cameron Park is 2,641.
What is the Ratio of Males per 100 Females in Cameron Park?
There are 120.75 Males per 100 Females in Cameron Park.
What is the Ratio of Females per 100 Males in Cameron Park?
There are 82.82 Females per 100 Males in Cameron Park.
What is the Median Population Age in Cameron Park?
Median Population Age in Cameron Park is 27.6 Years.
What is the Average Family Size in Cameron Park
Average Family Size in Cameron Park is 4.5 People.
What is the Average Household Size in Cameron Park
Average Household Size in Cameron Park is 3.9 People.
What is Per Capita Income in Cameron Park?
Per Capita income in Cameron Park is $12,913.
What is the Median Family Income in Cameron Park?
Median Family Income in Cameron Park is $34,684.
What is the Median Household income in Cameron Park?
Median Household Income in Cameron Park is $34,248.
What is Income or Wage Gap in Cameron Park?
Income or Wage Gap in Cameron Park is 2.5%.
Women in Cameron Park earn 97.5 cents for every dollar earned by a man.
What is Inequality or Gini Index in Cameron Park?
Inequality or Gini Index in Cameron Park is 0.43.
How Large is the Labor Force in Cameron Park?
There are 2,252 People in the Labor Forcein in Cameron Park.
What is the Percentage of People in the Labor Force in Cameron Park?
52.4% of People are in the Labor Force in Cameron Park.
What is the Unemployment Rate in Cameron Park?
Unemployment Rate in Cameron Park is 10.2%.