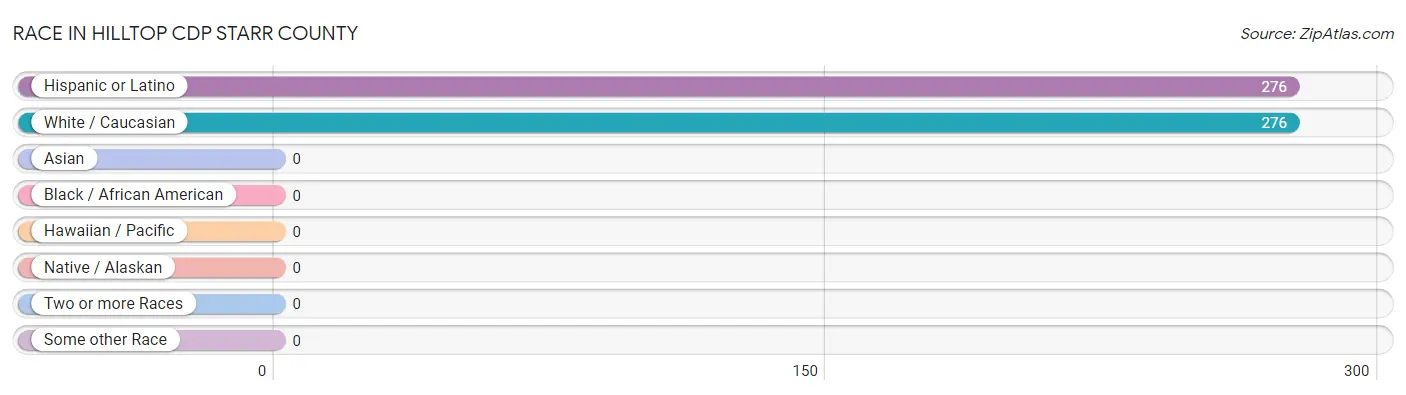
The most populous races in Hilltop CDP Starr County are Hispanic or Latino (276 | 100.0%), and White / Caucasian (276 | 100.0%).
Race
# Population
% Population
Asian
0
0.0%
Black / African American
0
0.0%
Hawaiian / Pacific
0
0.0%
Hispanic or Latino
276
100.0%
Native / Alaskan
0
0.0%
White / Caucasian
276
100.0%
Two or more Races
0
0.0%
Some other Race
0
0.0%
Total
276
100.0%
Ancestry in Hilltop CDP Starr County
The most populous ancestries reported in Hilltop CDP Starr County are , and Mexican (276 | 100.0%), together accounting for 100.0% of all Hilltop CDP Starr County residents.
Ancestry
# Population
% Population
Mexican
276
100.0%
View All 1 Rows
Immigrants in Hilltop CDP Starr County
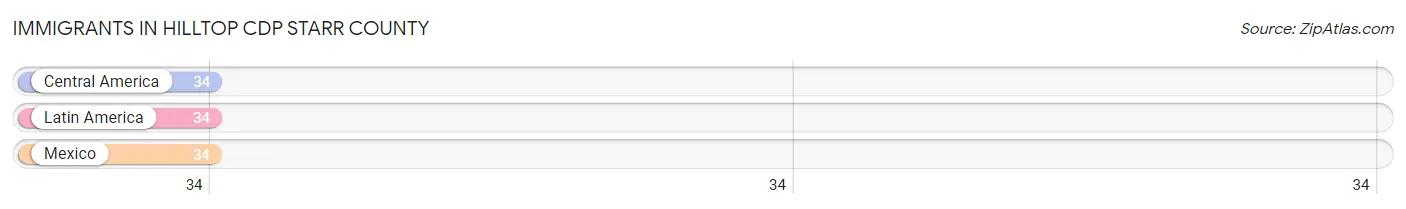
The most numerous immigrant groups reported in Hilltop CDP Starr County came from Central America (34 | 12.3%), Latin America (34 | 12.3%), and Mexico (34 | 12.3%), together accounting for 37.0% of all Hilltop CDP Starr County residents.
Immigration Origin
# Population
% Population
Central America
34
12.3%
Latin America
34
12.3%
Mexico
34
12.3%
View All 3 Rows
Sex and Age in Hilltop CDP Starr County
Sex and Age in Hilltop CDP Starr County
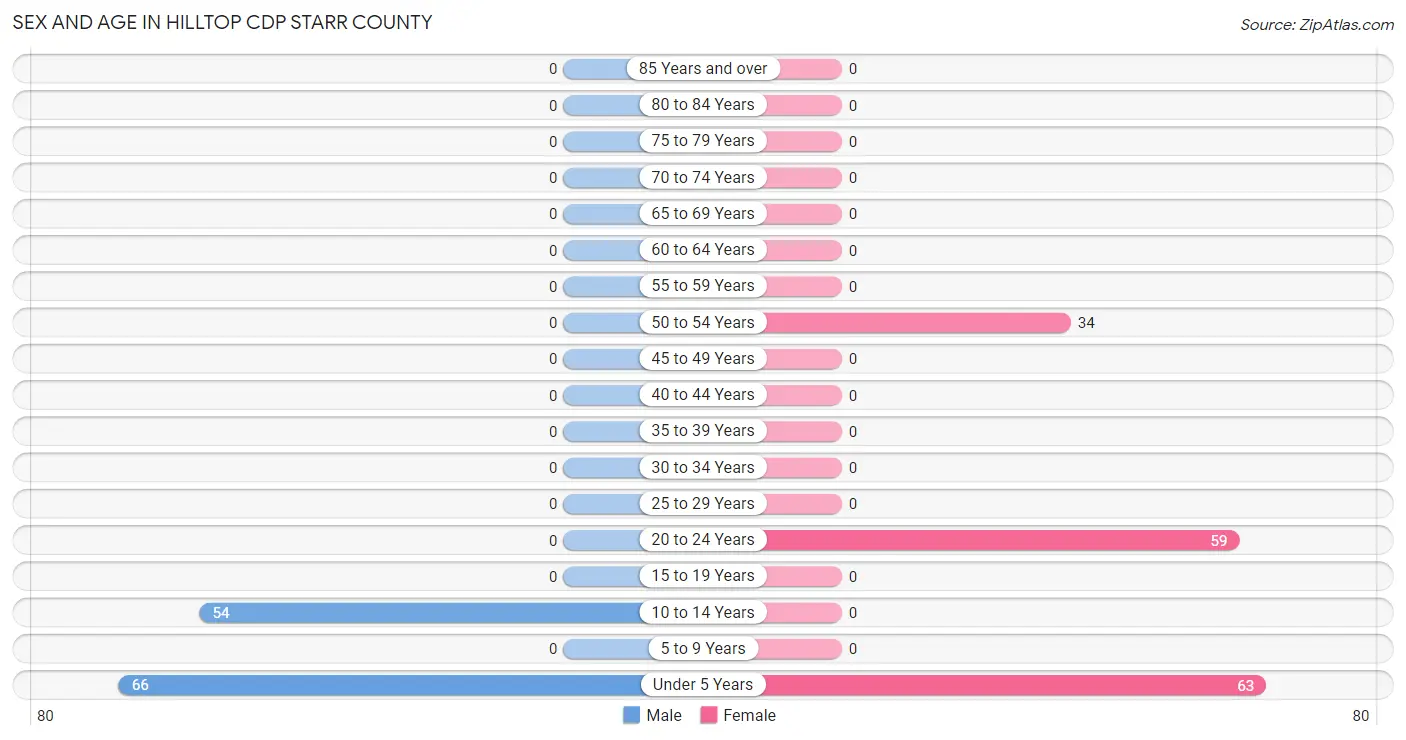
The most populous age groups in Hilltop CDP Starr County are Under 5 Years (66 | 55.0%) for men and Under 5 Years (63 | 40.4%) for women.
Age Bracket
Male
Female
Under 5 Years
66 (55.0%)
63 (40.4%)
5 to 9 Years
0 (0.0%)
0 (0.0%)
10 to 14 Years
54 (45.0%)
0 (0.0%)
15 to 19 Years
0 (0.0%)
0 (0.0%)
20 to 24 Years
0 (0.0%)
59 (37.8%)
25 to 29 Years
0 (0.0%)
0 (0.0%)
30 to 34 Years
0 (0.0%)
0 (0.0%)
35 to 39 Years
0 (0.0%)
0 (0.0%)
40 to 44 Years
0 (0.0%)
0 (0.0%)
45 to 49 Years
0 (0.0%)
0 (0.0%)
50 to 54 Years
0 (0.0%)
34 (21.8%)
55 to 59 Years
0 (0.0%)
0 (0.0%)
60 to 64 Years
0 (0.0%)
0 (0.0%)
65 to 69 Years
0 (0.0%)
0 (0.0%)
70 to 74 Years
0 (0.0%)
0 (0.0%)
75 to 79 Years
0 (0.0%)
0 (0.0%)
80 to 84 Years
0 (0.0%)
0 (0.0%)
85 Years and over
0 (0.0%)
0 (0.0%)
Total
120 (100.0%)
156 (100.0%)
Families and Households in Hilltop CDP Starr County
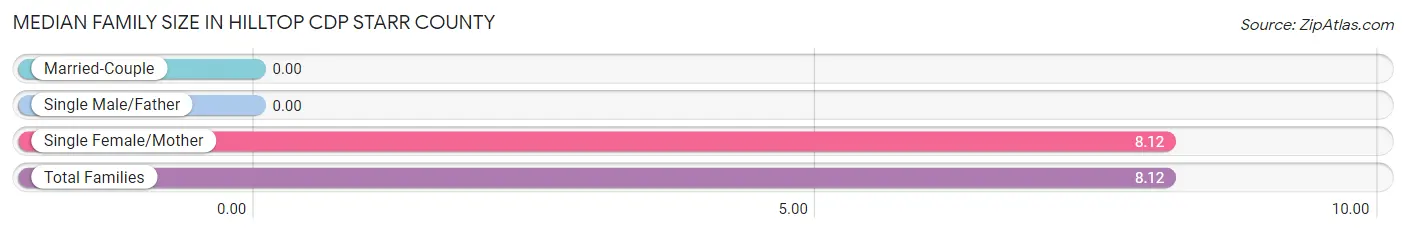
Median Family Size in Hilltop CDP Starr County
Family Type
# Families
Family Size
Married-Couple
0 (0.0%)
-
Single Male/Father
0 (0.0%)
-
Single Female/Mother
34 (100.0%)
8.12
Total Families
34 (100.0%)
8.12
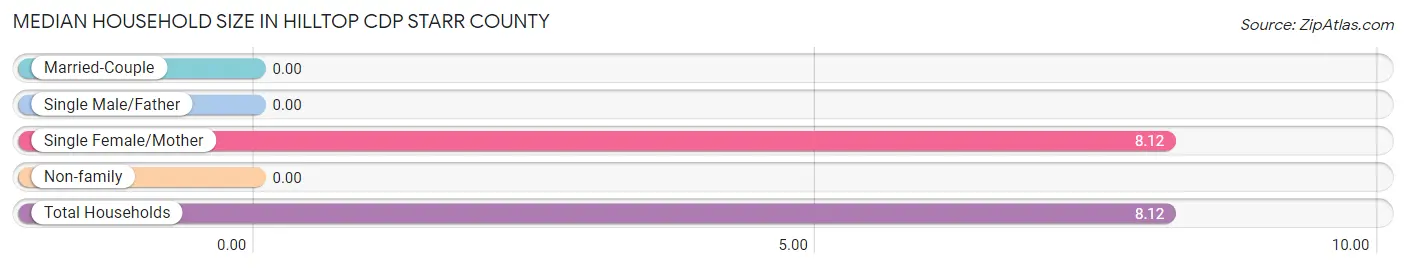
Median Household Size in Hilltop CDP Starr County
Household Type
# Households
Household Size
Married-Couple
0 (0.0%)
-
Single Male/Father
0 (0.0%)
-
Single Female/Mother
34 (100.0%)
8.12
Non-family
0 (0.0%)
-
Total Households
34 (100.0%)
8.12
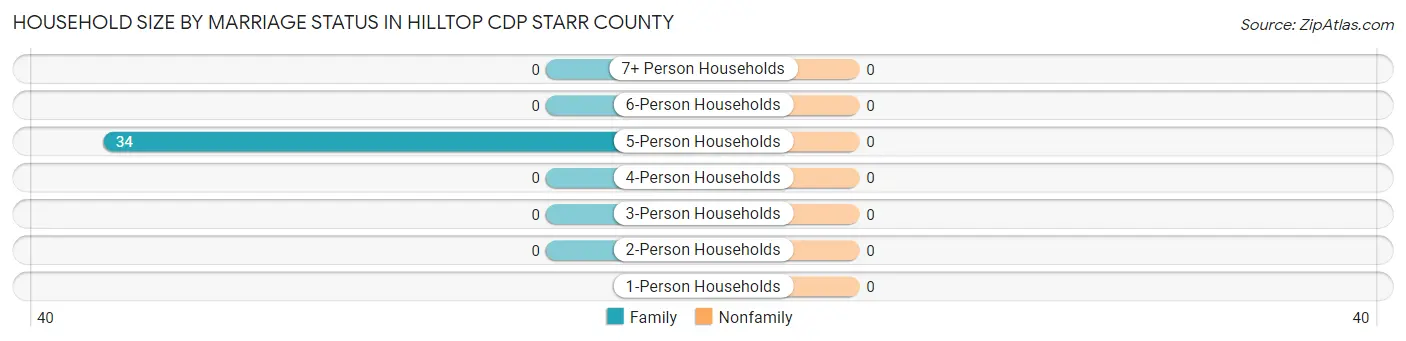
Household Size by Marriage Status in Hilltop CDP Starr County
Household Size
Family Households
Nonfamily Households
1-Person Households
-
0 (0.0%)
2-Person Households
0 (0.0%)
0 (0.0%)
3-Person Households
0 (0.0%)
0 (0.0%)
4-Person Households
0 (0.0%)
0 (0.0%)
5-Person Households
34 (100.0%)
0 (0.0%)
6-Person Households
0 (0.0%)
0 (0.0%)
7+ Person Households
0 (0.0%)
0 (0.0%)
Total
34 (100.0%)
0 (0.0%)
Female Fertility in Hilltop CDP Starr County
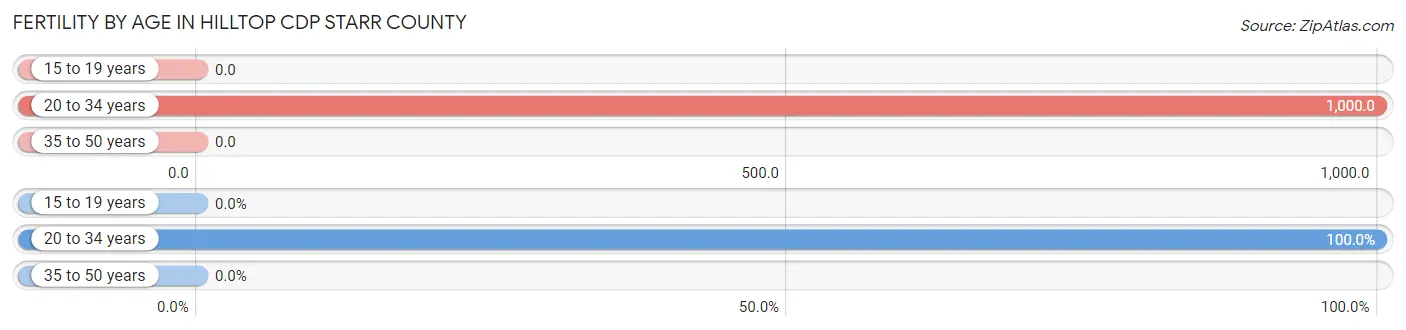
Fertility by Age in Hilltop CDP Starr County
Average fertility rate in Hilltop CDP Starr County is 1,000.0 births per 1,000 women. Women in the age bracket of 20 to 34 years have the highest fertility rate with 1,000.0 births per 1,000 women. Women in the age bracket of 20 to 34 years acount for 100.0% of all women with births.
Age Bracket
Women with Births
Births / 1,000 Women
15 to 19 years
0 (0.0%)
0.0
20 to 34 years
59 (100.0%)
1,000.0
35 to 50 years
0 (0.0%)
0.0
Total
59 (100.0%)
1,000.0
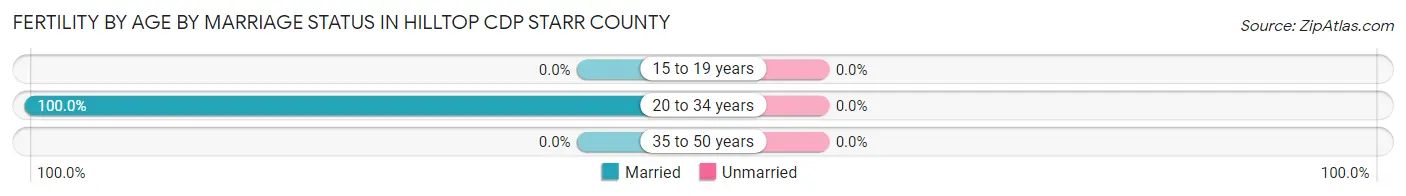
Fertility by Age by Marriage Status in Hilltop CDP Starr County
Age Bracket
Married
Unmarried
15 to 19 years
0 (0.0%)
0 (0.0%)
20 to 34 years
59 (100.0%)
0 (0.0%)
35 to 50 years
0 (0.0%)
0 (0.0%)
Total
59 (100.0%)
0 (0.0%)
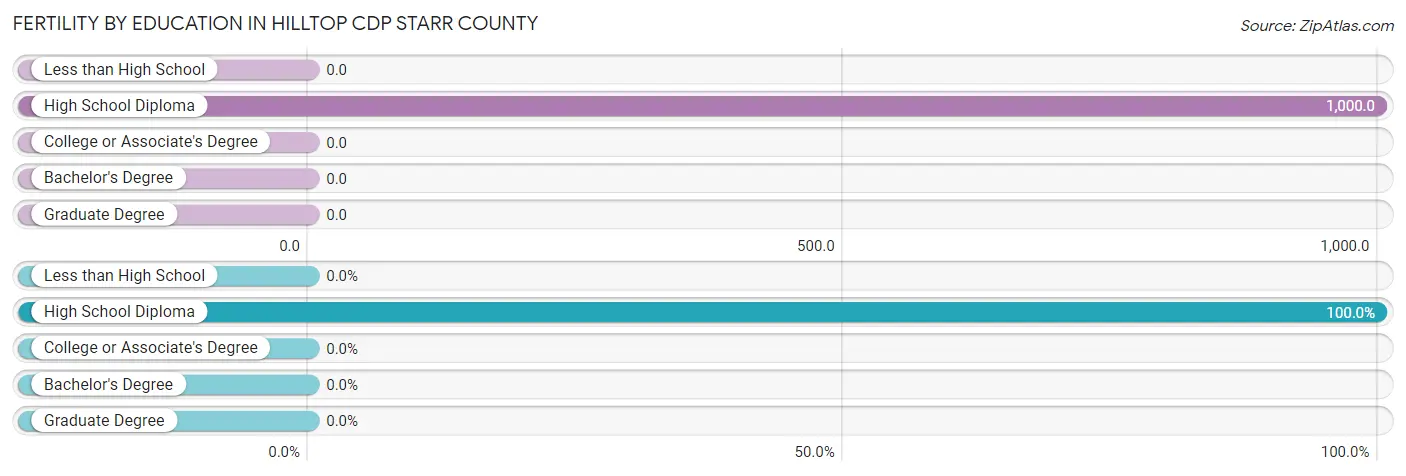
Fertility by Education in Hilltop CDP Starr County
Educational Attainment
Women with Births
Births / 1,000 Women
Less than High School
0 (0.0%)
0.0
High School Diploma
59 (100.0%)
1,000.0
College or Associate's Degree
0 (0.0%)
0.0
Bachelor's Degree
0 (0.0%)
0.0
Graduate Degree
0 (0.0%)
0.0
Total
59 (100.0%)
1,000.0
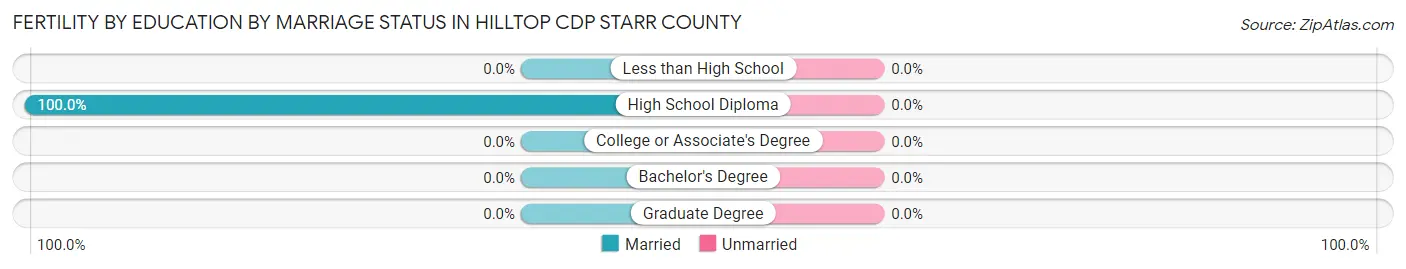
Fertility by Education by Marriage Status in Hilltop CDP Starr County
Educational Attainment
Married
Unmarried
Less than High School
0 (0.0%)
0 (0.0%)
High School Diploma
59 (100.0%)
0 (0.0%)
College or Associate's Degree
0 (0.0%)
0 (0.0%)
Bachelor's Degree
0 (0.0%)
0 (0.0%)
Graduate Degree
0 (0.0%)
0 (0.0%)
Total
59 (100.0%)
0 (0.0%)
Income in Hilltop CDP Starr County
Income Overview in Hilltop CDP Starr County
Characteristic
Number
Measure
Per Capita Income
276
$0
Median Family Income
34
$0
Mean Family Income
34
$0
Median Household Income
34
$0
Mean Household Income
34
$0
Income Deficit
34
$0
Wage / Income Gap (%)
276
0.00%
Wage / Income Gap ($)
276
100.00¢ per $1
Gini / Inequality Index
276
0.00
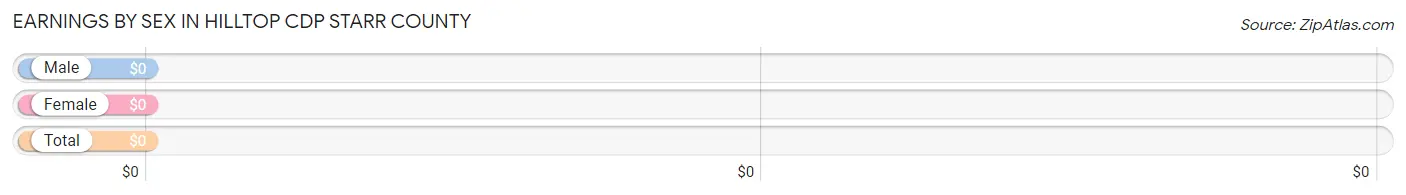
Earnings by Sex in Hilltop CDP Starr County
Sex
Number
Average Earnings
Male
0 (0.0%)
$0
Female
93 (100.0%)
$0
Total
93 (100.0%)
$0
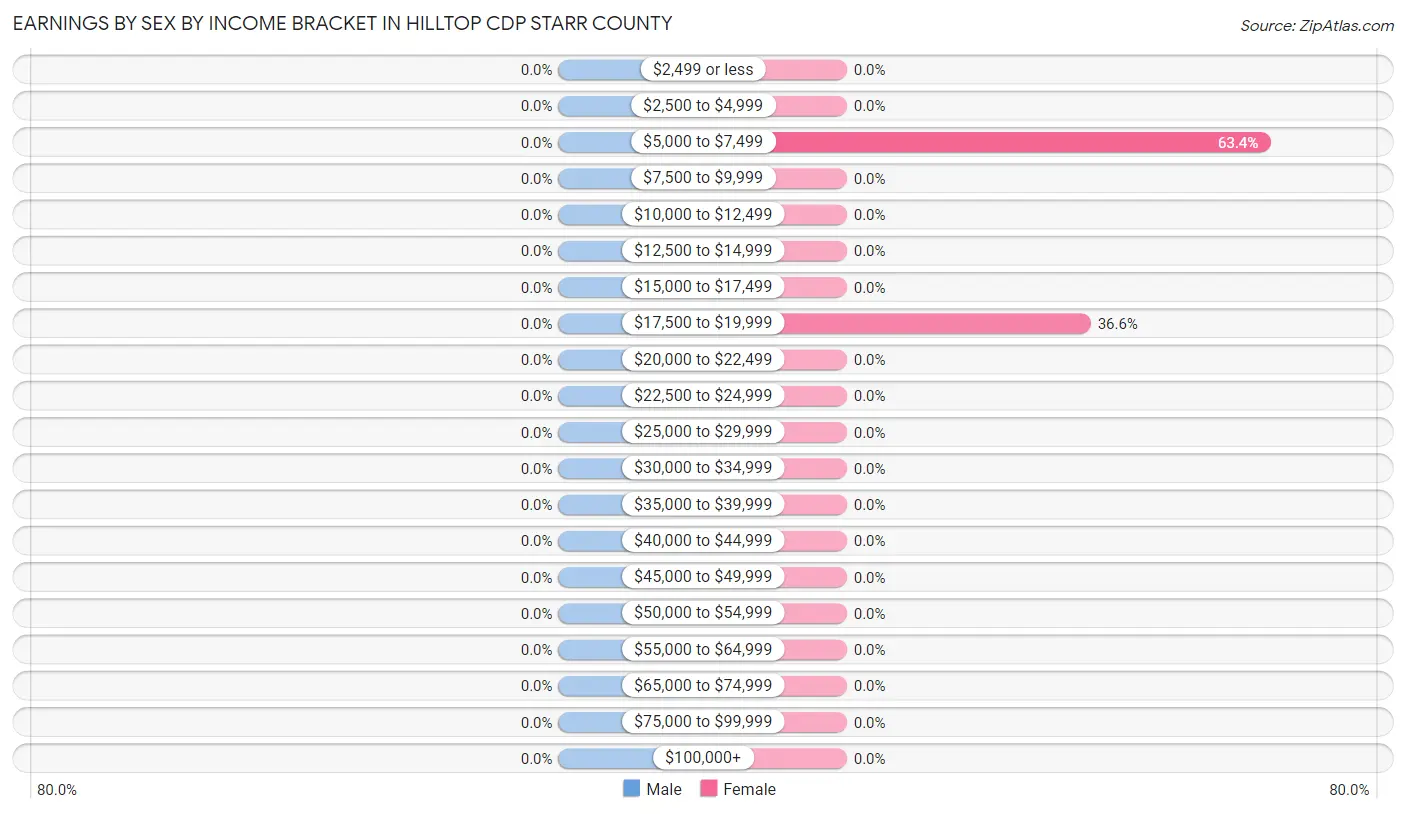
Earnings by Sex by Income Bracket in Hilltop CDP Starr County
Income
Male
Female
$2,499 or less
0 (0.0%)
0 (0.0%)
$2,500 to $4,999
0 (0.0%)
0 (0.0%)
$5,000 to $7,499
0 (0.0%)
59 (63.4%)
$7,500 to $9,999
0 (0.0%)
0 (0.0%)
$10,000 to $12,499
0 (0.0%)
0 (0.0%)
$12,500 to $14,999
0 (0.0%)
0 (0.0%)
$15,000 to $17,499
0 (0.0%)
0 (0.0%)
$17,500 to $19,999
0 (0.0%)
34 (36.6%)
$20,000 to $22,499
0 (0.0%)
0 (0.0%)
$22,500 to $24,999
0 (0.0%)
0 (0.0%)
$25,000 to $29,999
0 (0.0%)
0 (0.0%)
$30,000 to $34,999
0 (0.0%)
0 (0.0%)
$35,000 to $39,999
0 (0.0%)
0 (0.0%)
$40,000 to $44,999
0 (0.0%)
0 (0.0%)
$45,000 to $49,999
0 (0.0%)
0 (0.0%)
$50,000 to $54,999
0 (0.0%)
0 (0.0%)
$55,000 to $64,999
0 (0.0%)
0 (0.0%)
$65,000 to $74,999
0 (0.0%)
0 (0.0%)
$75,000 to $99,999
0 (0.0%)
0 (0.0%)
$100,000+
0 (0.0%)
0 (0.0%)
Total
0 (0.0%)
93 (100.0%)
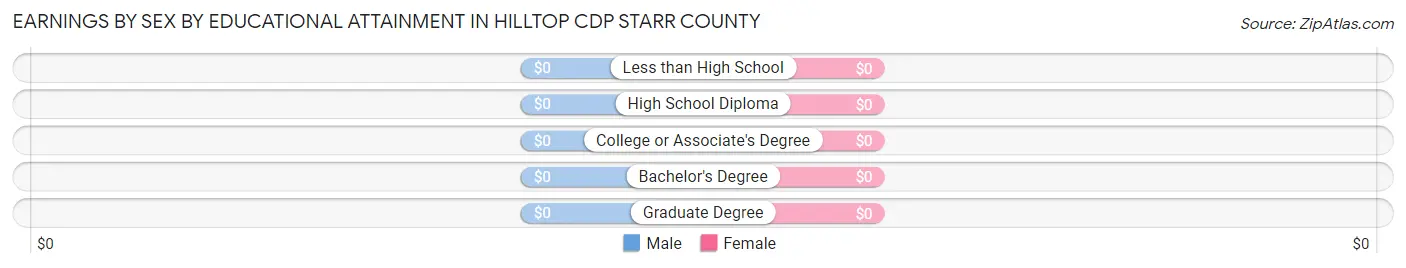
Earnings by Sex by Educational Attainment in Hilltop CDP Starr County
Educational Attainment
Male Income
Female Income
Less than High School
-
-
High School Diploma
-
-
College or Associate's Degree
-
-
Bachelor's Degree
-
-
Graduate Degree
-
-
Total
-
-
Family Income in Hilltop CDP Starr County
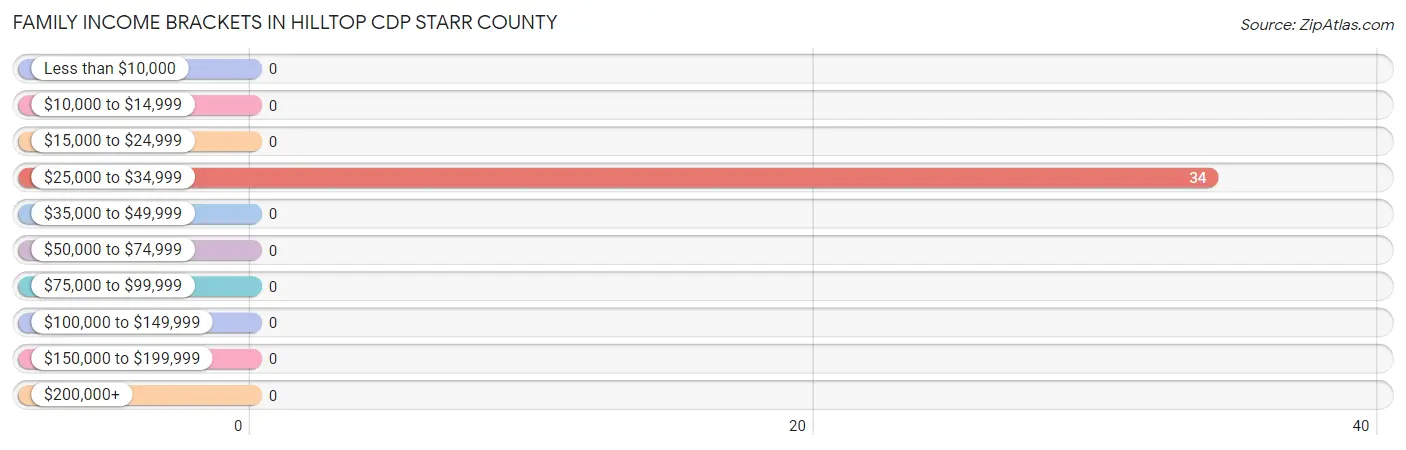
Family Income Brackets in Hilltop CDP Starr County
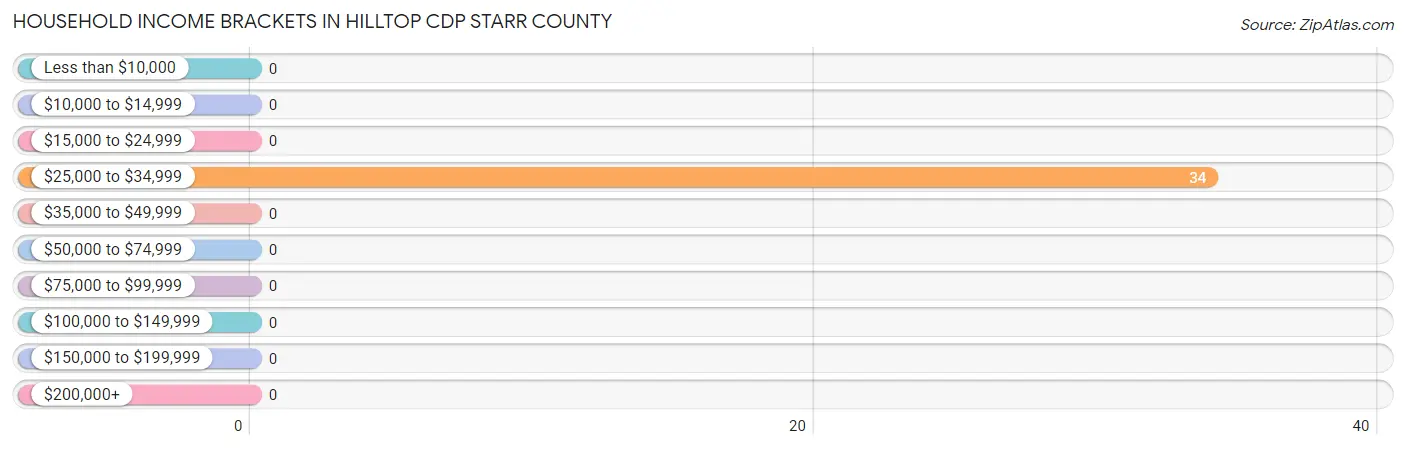
According to the Hilltop CDP Starr County family income data, there are 34 families falling into the $25,000 to $34,999 income range, which is the most common income bracket and makes up 100.0% of all families.
Income Bracket
# Families
% Families
Less than $10,000
0
0.0%
$10,000 to $14,999
0
0.0%
$15,000 to $24,999
0
0.0%
$25,000 to $34,999
34
100.0%
$35,000 to $49,999
0
0.0%
$50,000 to $74,999
0
0.0%
$75,000 to $99,999
0
0.0%
$100,000 to $149,999
0
0.0%
$150,000 to $199,999
0
0.0%
$200,000+
0
0.0%
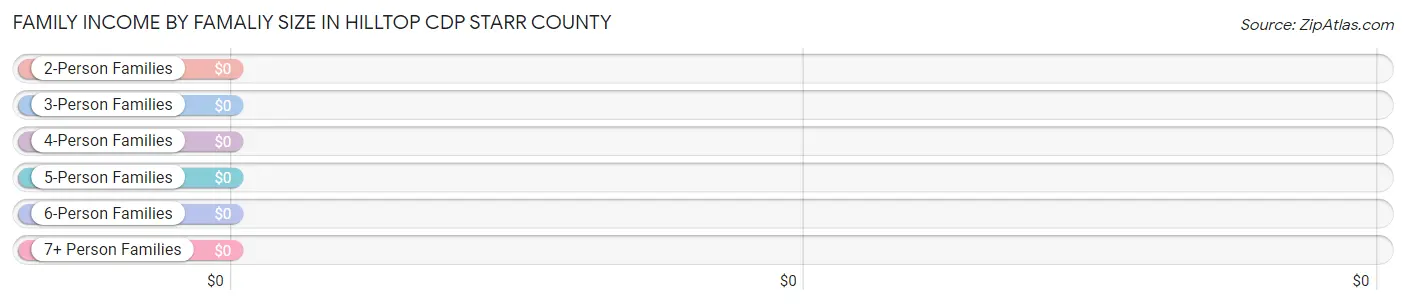
Family Income by Famaliy Size in Hilltop CDP Starr County
Income Bracket
# Families
Median Income
2-Person Families
0 (0.0%)
$0
3-Person Families
0 (0.0%)
$0
4-Person Families
0 (0.0%)
$0
5-Person Families
34 (100.0%)
$0
6-Person Families
0 (0.0%)
$0
7+ Person Families
0 (0.0%)
$0
Total
34 (100.0%)
$0
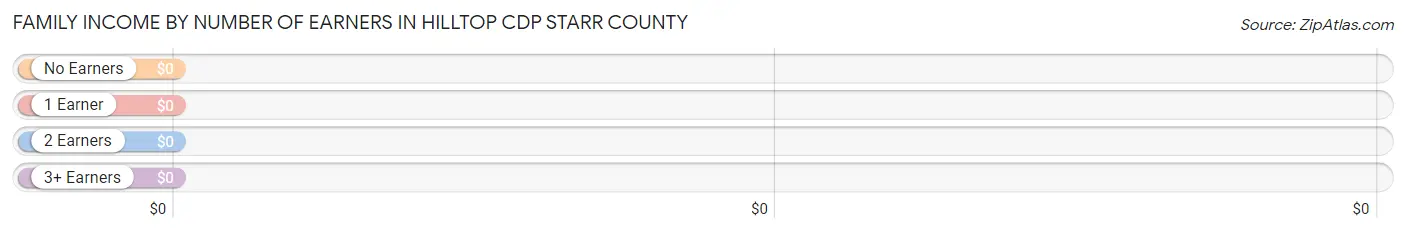
Family Income by Number of Earners in Hilltop CDP Starr County
Number of Earners
# Families
Median Income
No Earners
0 (0.0%)
$0
1 Earner
0 (0.0%)
$0
2 Earners
34 (100.0%)
$0
3+ Earners
0 (0.0%)
$0
Total
34 (100.0%)
$0
Household Income in Hilltop CDP Starr County
Household Income Brackets in Hilltop CDP Starr County
With 34 households falling in the category, the $25,000 to $34,999 income range is the most frequent in Hilltop CDP Starr County, accounting for 100.0% of all households.
Income Bracket
# Households
% Households
Less than $10,000
0
0.0%
$10,000 to $14,999
0
0.0%
$15,000 to $24,999
0
0.0%
$25,000 to $34,999
34
100.0%
$35,000 to $49,999
0
0.0%
$50,000 to $74,999
0
0.0%
$75,000 to $99,999
0
0.0%
$100,000 to $149,999
0
0.0%
$150,000 to $199,999
0
0.0%
$200,000+
0
0.0%
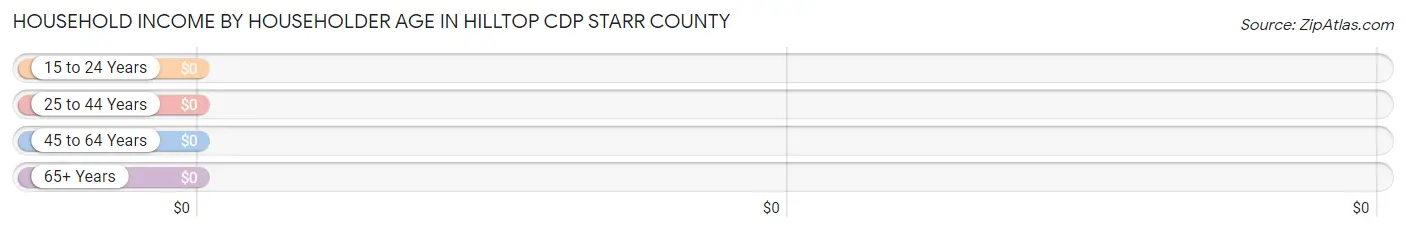
Household Income by Householder Age in Hilltop CDP Starr County
Income Bracket
# Households
Median Income
15 to 24 Years
0 (0.0%)
$0
25 to 44 Years
0 (0.0%)
$0
45 to 64 Years
34 (100.0%)
$0
65+ Years
0 (0.0%)
$0
Total
34 (100.0%)
$0
Poverty in Hilltop CDP Starr County
Income Below Poverty by Sex and Age in Hilltop CDP Starr County
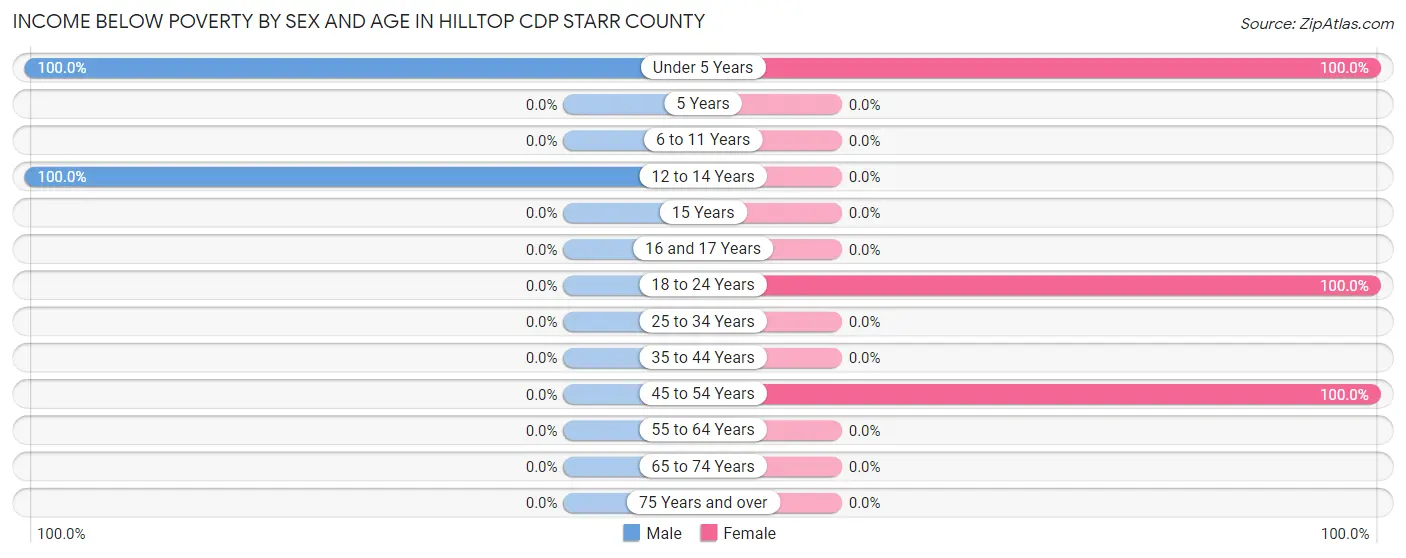
With 100.0% poverty level for males and 100.0% for females among the residents of Hilltop CDP Starr County, under 5 year old males and under 5 year old females are the most vulnerable to poverty, with 66 males (100.0%) and 63 females (100.0%) in their respective age groups living below the poverty level.
Age Bracket
Male
Female
Under 5 Years
66 (100.0%)
63 (100.0%)
5 Years
0 (0.0%)
0 (0.0%)
6 to 11 Years
0 (0.0%)
0 (0.0%)
12 to 14 Years
54 (100.0%)
0 (0.0%)
15 Years
0 (0.0%)
0 (0.0%)
16 and 17 Years
0 (0.0%)
0 (0.0%)
18 to 24 Years
0 (0.0%)
59 (100.0%)
25 to 34 Years
0 (0.0%)
0 (0.0%)
35 to 44 Years
0 (0.0%)
0 (0.0%)
45 to 54 Years
0 (0.0%)
34 (100.0%)
55 to 64 Years
0 (0.0%)
0 (0.0%)
65 to 74 Years
0 (0.0%)
0 (0.0%)
75 Years and over
0 (0.0%)
0 (0.0%)
Total
120 (100.0%)
156 (100.0%)
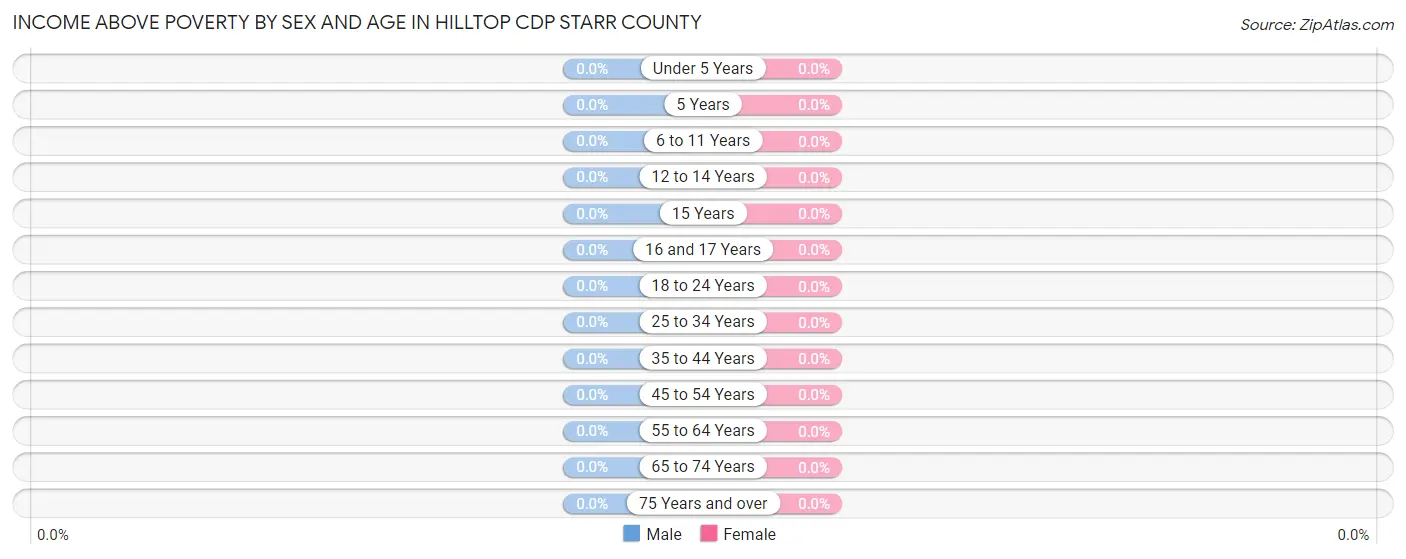
Income Above Poverty by Sex and Age in Hilltop CDP Starr County
Age Bracket
Male
Female
Under 5 Years
0 (0.0%)
0 (0.0%)
5 Years
0 (0.0%)
0 (0.0%)
6 to 11 Years
0 (0.0%)
0 (0.0%)
12 to 14 Years
0 (0.0%)
0 (0.0%)
15 Years
0 (0.0%)
0 (0.0%)
16 and 17 Years
0 (0.0%)
0 (0.0%)
18 to 24 Years
0 (0.0%)
0 (0.0%)
25 to 34 Years
0 (0.0%)
0 (0.0%)
35 to 44 Years
0 (0.0%)
0 (0.0%)
45 to 54 Years
0 (0.0%)
0 (0.0%)
55 to 64 Years
0 (0.0%)
0 (0.0%)
65 to 74 Years
0 (0.0%)
0 (0.0%)
75 Years and over
0 (0.0%)
0 (0.0%)
Total
0 (0.0%)
0 (0.0%)
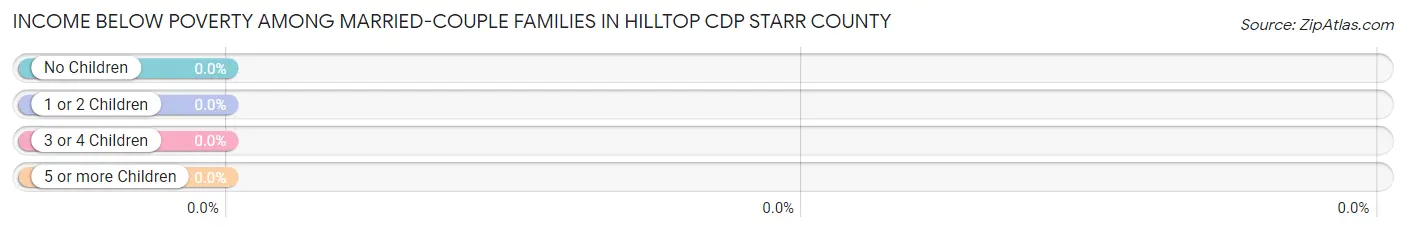
Income Below Poverty Among Married-Couple Families in Hilltop CDP Starr County
Children
Above Poverty
Below Poverty
No Children
0 (0.0%)
0 (0.0%)
1 or 2 Children
0 (0.0%)
0 (0.0%)
3 or 4 Children
0 (0.0%)
0 (0.0%)
5 or more Children
0 (0.0%)
0 (0.0%)
Total
0 (0.0%)
0 (0.0%)
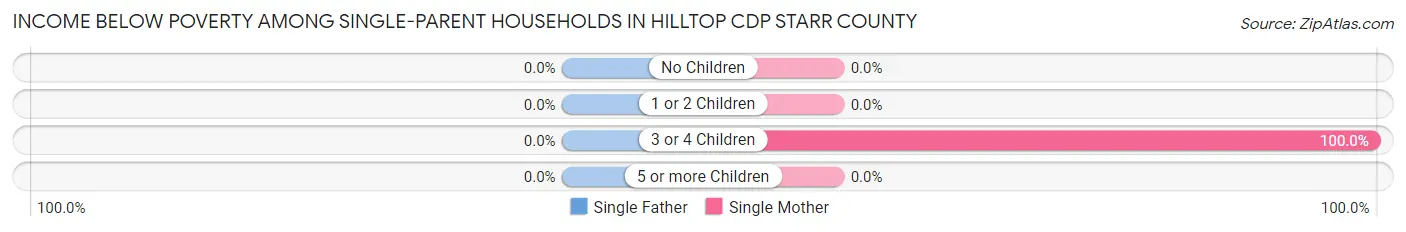
Income Below Poverty Among Single-Parent Households in Hilltop CDP Starr County
Children
Single Father
Single Mother
No Children
0 (0.0%)
0 (0.0%)
1 or 2 Children
0 (0.0%)
0 (0.0%)
3 or 4 Children
0 (0.0%)
34 (100.0%)
5 or more Children
0 (0.0%)
0 (0.0%)
Total
0 (0.0%)
34 (100.0%)
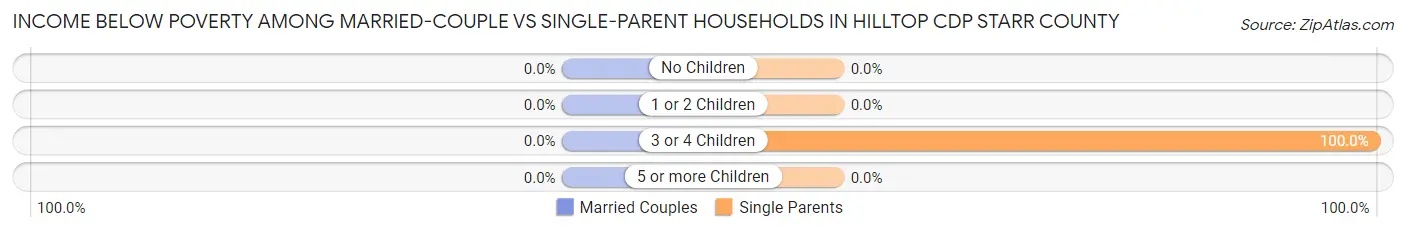
Income Below Poverty Among Married-Couple vs Single-Parent Households in Hilltop CDP Starr County
Children
Married-Couple Families
Single-Parent Households
No Children
0 (0.0%)
0 (0.0%)
1 or 2 Children
0 (0.0%)
0 (0.0%)
3 or 4 Children
0 (0.0%)
34 (100.0%)
5 or more Children
0 (0.0%)
0 (0.0%)
Total
0 (0.0%)
34 (100.0%)
Employment Characteristics in Hilltop CDP Starr County
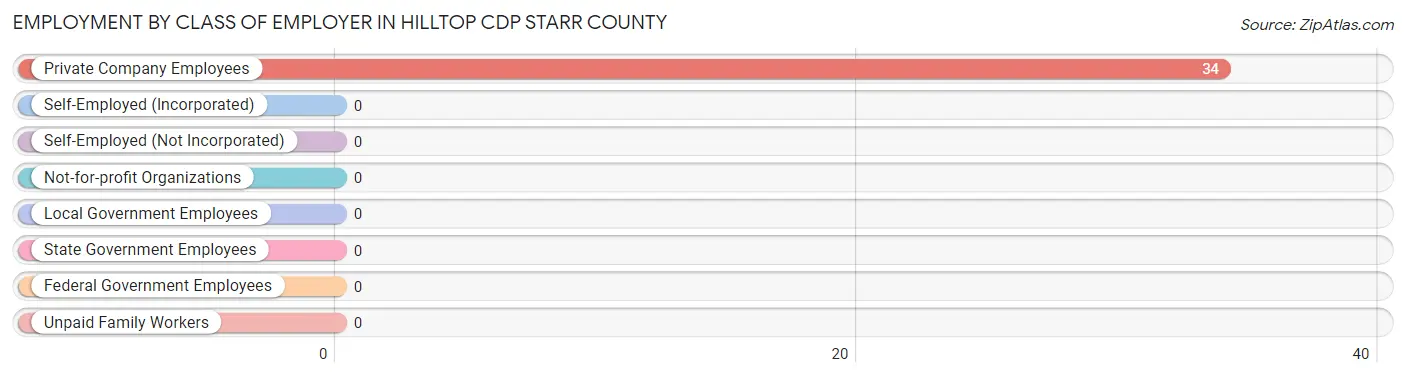
Employment by Class of Employer in Hilltop CDP Starr County
Among the 34 employed individuals in Hilltop CDP Starr County, , and private company employees (34 | 100.0%) make up the most common classes of employment.
Employer Class
# Employees
% Employees
Private Company Employees
34
100.0%
Self-Employed (Incorporated)
0
0.0%
Self-Employed (Not Incorporated)
0
0.0%
Not-for-profit Organizations
0
0.0%
Local Government Employees
0
0.0%
State Government Employees
0
0.0%
Federal Government Employees
0
0.0%
Unpaid Family Workers
0
0.0%
Total
34
100.0%
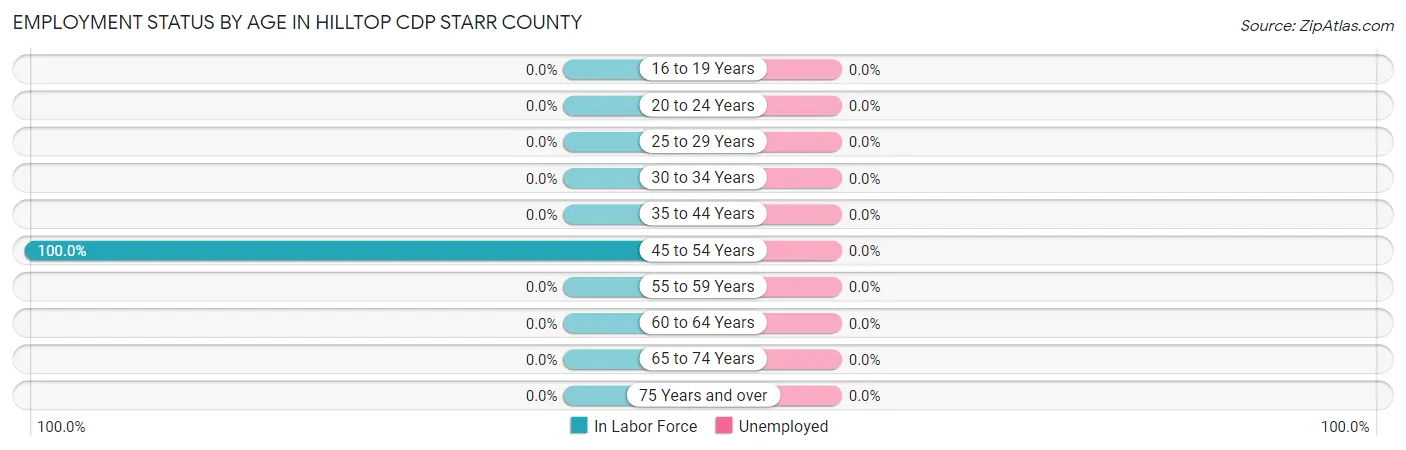
Employment Status by Age in Hilltop CDP Starr County
Age Bracket
In Labor Force
Unemployed
16 to 19 Years
0 (0.0%)
0 (0.0%)
20 to 24 Years
0 (0.0%)
0 (0.0%)
25 to 29 Years
0 (0.0%)
0 (0.0%)
30 to 34 Years
0 (0.0%)
0 (0.0%)
35 to 44 Years
0 (0.0%)
0 (0.0%)
45 to 54 Years
34 (100.0%)
0 (0.0%)
55 to 59 Years
0 (0.0%)
0 (0.0%)
60 to 64 Years
0 (0.0%)
0 (0.0%)
65 to 74 Years
0 (0.0%)
0 (0.0%)
75 Years and over
0 (0.0%)
0 (0.0%)
Total
34 (36.6%)
0 (0.0%)
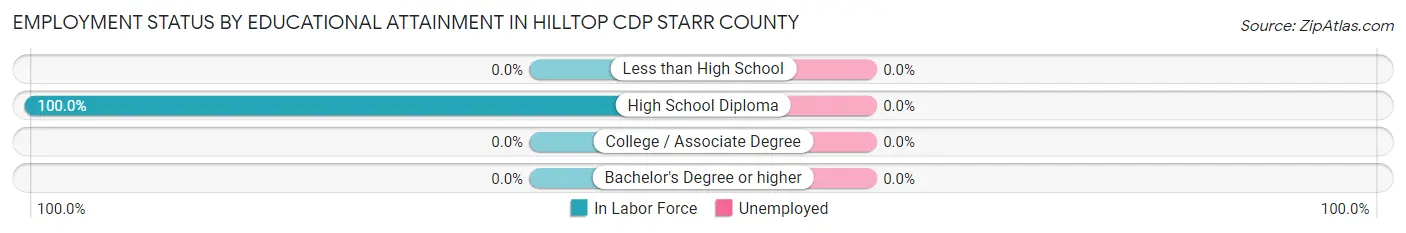
Employment Status by Educational Attainment in Hilltop CDP Starr County
Educational Attainment
In Labor Force
Unemployed
Less than High School
0 (0.0%)
0 (0.0%)
High School Diploma
34 (100.0%)
0 (0.0%)
College / Associate Degree
0 (0.0%)
0 (0.0%)
Bachelor's Degree or higher
0 (0.0%)
0 (0.0%)
Total
34 (100.0%)
0 (0.0%)
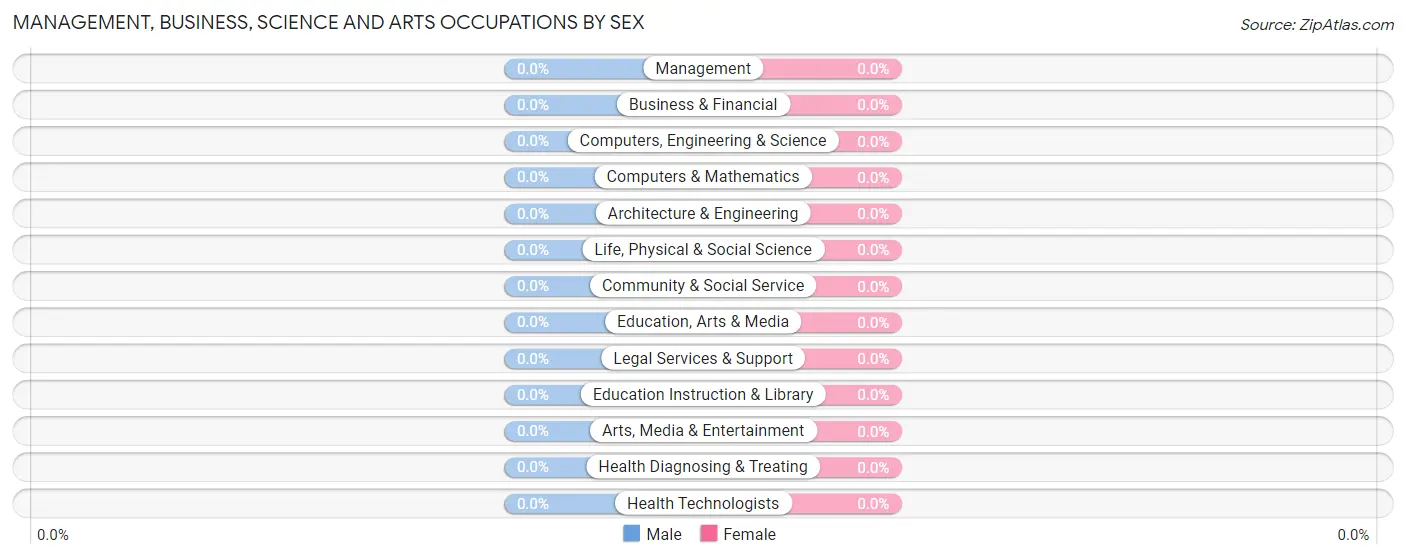
Employment Occupations by Sex in Hilltop CDP Starr County
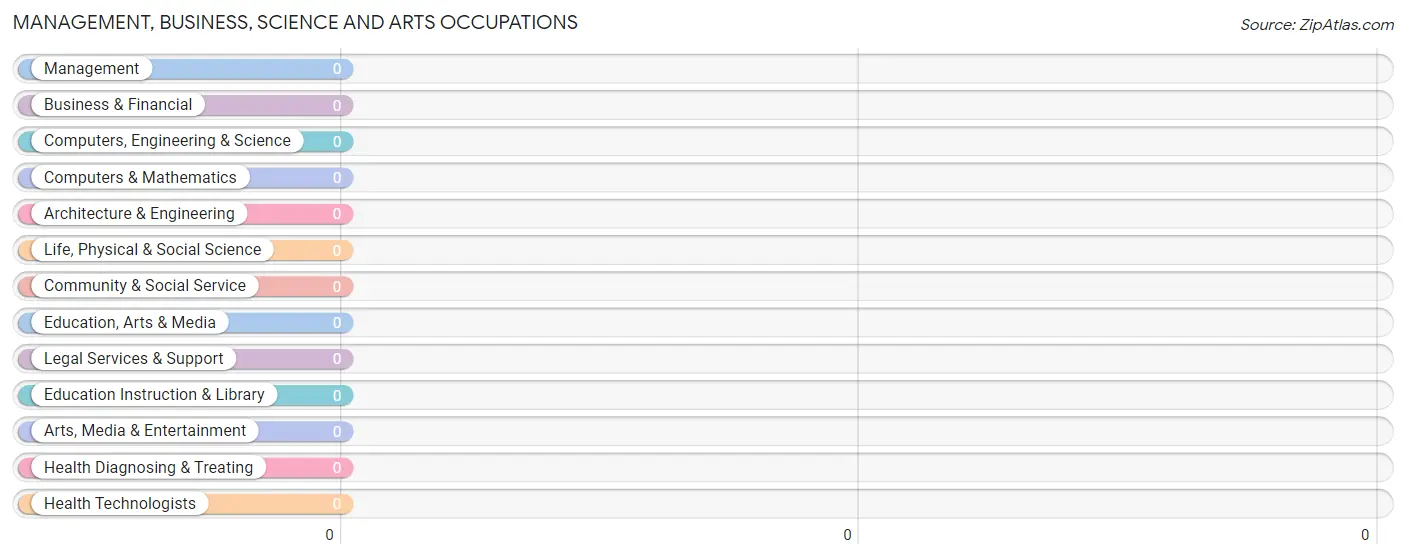
Management, Business, Science and Arts Occupations
Management, Business, Science and Arts Occupations by Sex
Occupation
Male
Female
Management
0 (0.0%)
0 (0.0%)
Business & Financial
0 (0.0%)
0 (0.0%)
Computers, Engineering & Science
0 (0.0%)
0 (0.0%)
Computers & Mathematics
0 (0.0%)
0 (0.0%)
Architecture & Engineering
0 (0.0%)
0 (0.0%)
Life, Physical & Social Science
0 (0.0%)
0 (0.0%)
Community & Social Service
0 (0.0%)
0 (0.0%)
Education, Arts & Media
0 (0.0%)
0 (0.0%)
Legal Services & Support
0 (0.0%)
0 (0.0%)
Education Instruction & Library
0 (0.0%)
0 (0.0%)
Arts, Media & Entertainment
0 (0.0%)
0 (0.0%)
Health Diagnosing & Treating
0 (0.0%)
0 (0.0%)
Health Technologists
0 (0.0%)
0 (0.0%)
Total (Category)
0 (0.0%)
0 (0.0%)
Total (Overall)
0 (0.0%)
34 (100.0%)
Services Occupations
Services Occupations by Sex
Occupation
Male
Female
Healthcare Support
0 (0.0%)
0 (0.0%)
Security & Protection
0 (0.0%)
0 (0.0%)
Firefighting & Prevention
0 (0.0%)
0 (0.0%)
Law Enforcement
0 (0.0%)
0 (0.0%)
Food Preparation & Serving
0 (0.0%)
0 (0.0%)
Cleaning & Maintenance
0 (0.0%)
0 (0.0%)
Personal Care & Service
0 (0.0%)
0 (0.0%)
Total (Category)
0 (0.0%)
0 (0.0%)
Total (Overall)
0 (0.0%)
34 (100.0%)
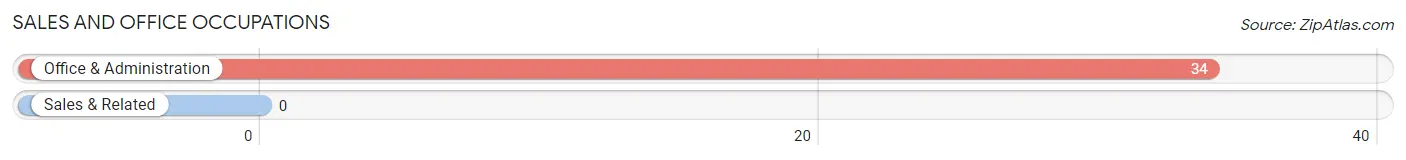
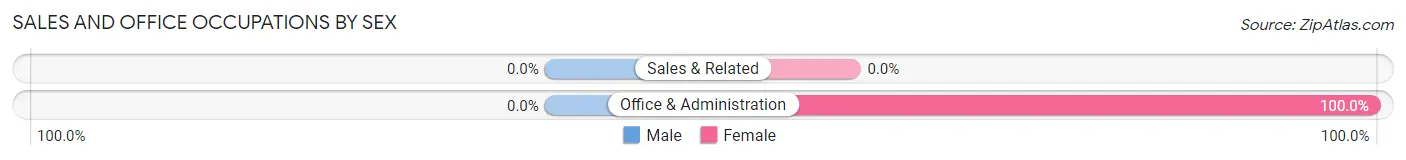
Sales and Office Occupations
The most common Sales and Office occupations in Hilltop CDP Starr County are , and Office & Administration (34 | 100.0%).
Sales and Office Occupations by Sex
Occupation
Male
Female
Sales & Related
0 (0.0%)
0 (0.0%)
Office & Administration
0 (0.0%)
34 (100.0%)
Total (Category)
0 (0.0%)
34 (100.0%)
Total (Overall)
0 (0.0%)
34 (100.0%)
Natural Resources, Construction and Maintenance Occupations
Natural Resources, Construction and Maintenance Occupations by Sex
Occupation
Male
Female
Farming, Fishing & Forestry
0 (0.0%)
0 (0.0%)
Construction & Extraction
0 (0.0%)
0 (0.0%)
Installation, Maintenance & Repair
0 (0.0%)
0 (0.0%)
Total (Category)
0 (0.0%)
0 (0.0%)
Total (Overall)
0 (0.0%)
34 (100.0%)
Production, Transportation and Moving Occupations
Production, Transportation and Moving Occupations by Sex
Occupation
Male
Female
Production
0 (0.0%)
0 (0.0%)
Transportation
0 (0.0%)
0 (0.0%)
Material Moving
0 (0.0%)
0 (0.0%)
Total (Category)
0 (0.0%)
0 (0.0%)
Total (Overall)
0 (0.0%)
34 (100.0%)
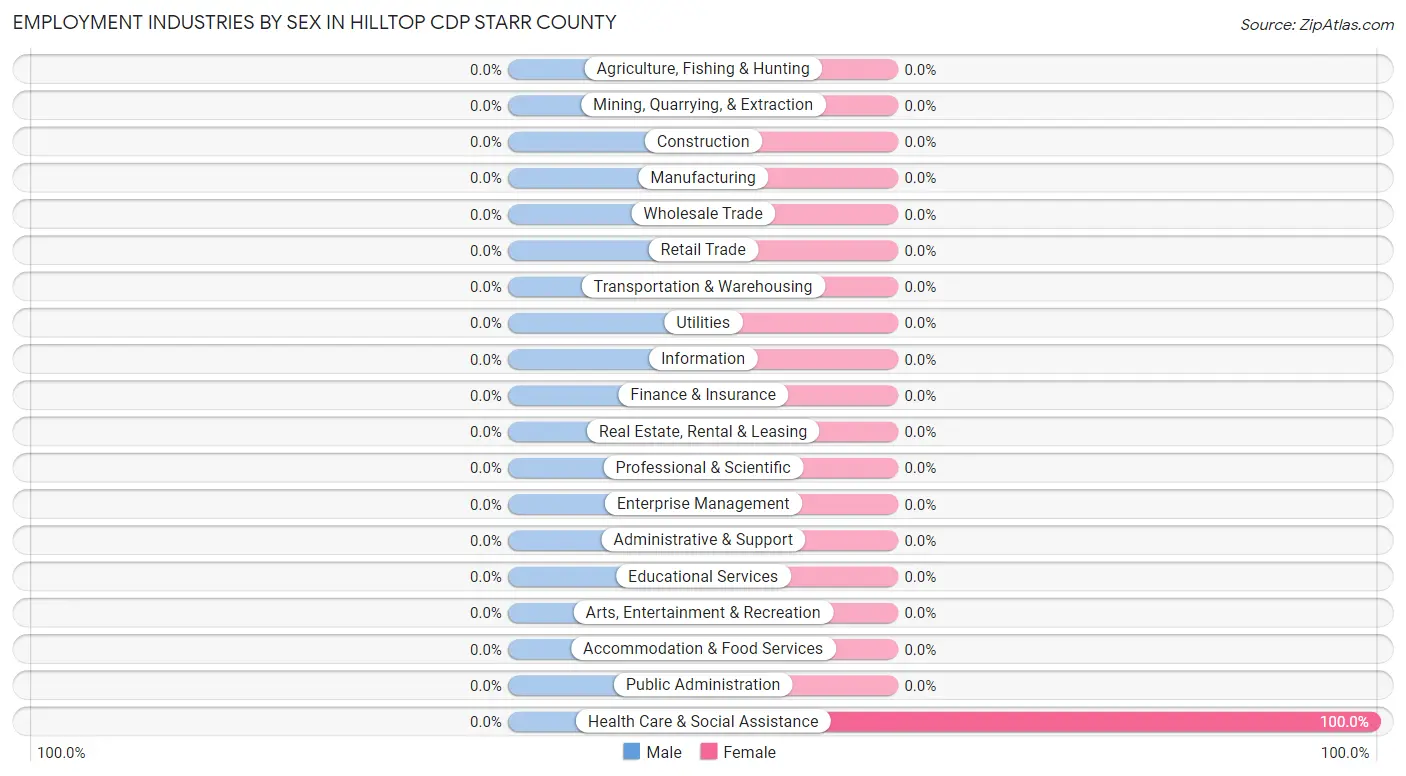
Employment Industries by Sex in Hilltop CDP Starr County
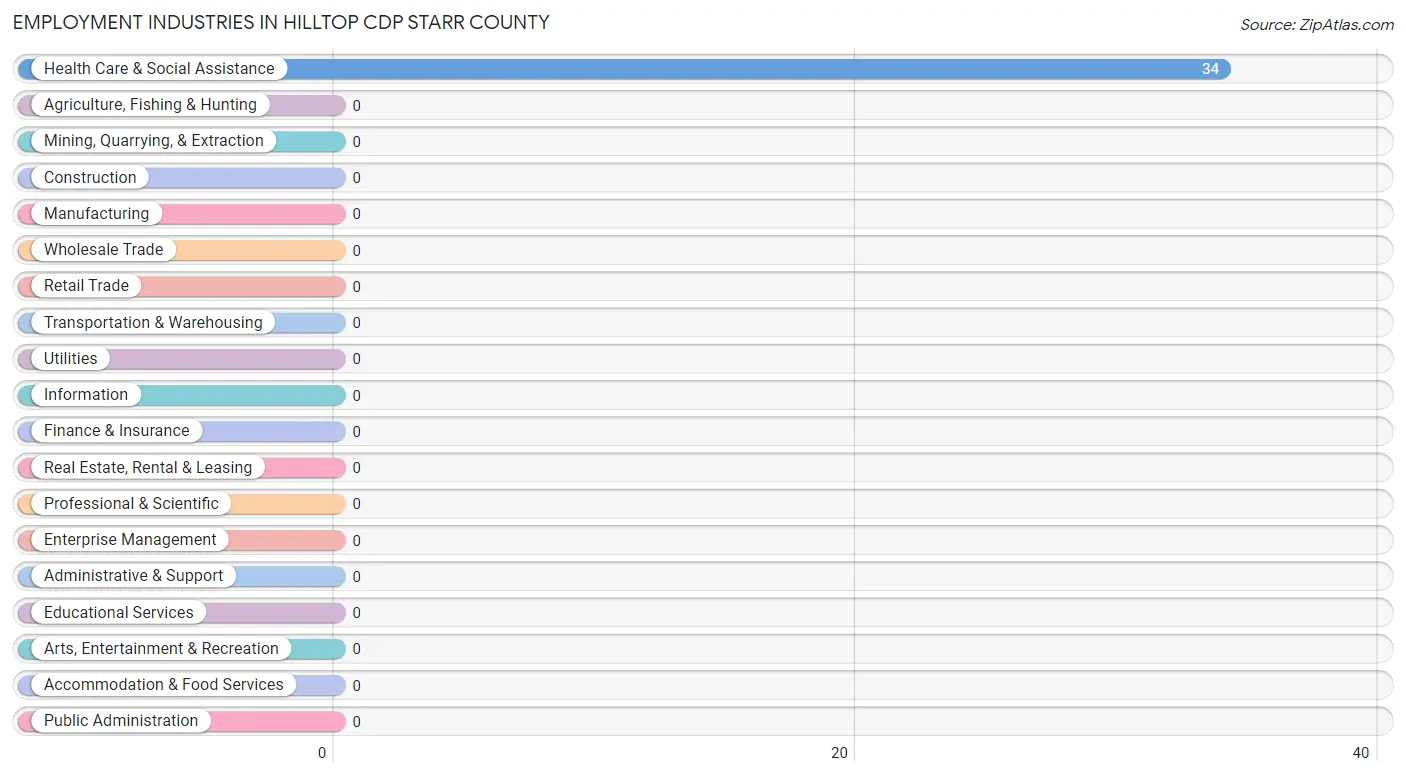
Employment Industries in Hilltop CDP Starr County
The major employment industries in Hilltop CDP Starr County include , and Health Care & Social Assistance (34 | 100.0%).
Employment Industries by Sex in Hilltop CDP Starr County
Industry
Male
Female
Agriculture, Fishing & Hunting
0 (0.0%)
0 (0.0%)
Mining, Quarrying, & Extraction
0 (0.0%)
0 (0.0%)
Construction
0 (0.0%)
0 (0.0%)
Manufacturing
0 (0.0%)
0 (0.0%)
Wholesale Trade
0 (0.0%)
0 (0.0%)
Retail Trade
0 (0.0%)
0 (0.0%)
Transportation & Warehousing
0 (0.0%)
0 (0.0%)
Utilities
0 (0.0%)
0 (0.0%)
Information
0 (0.0%)
0 (0.0%)
Finance & Insurance
0 (0.0%)
0 (0.0%)
Real Estate, Rental & Leasing
0 (0.0%)
0 (0.0%)
Professional & Scientific
0 (0.0%)
0 (0.0%)
Enterprise Management
0 (0.0%)
0 (0.0%)
Administrative & Support
0 (0.0%)
0 (0.0%)
Educational Services
0 (0.0%)
0 (0.0%)
Health Care & Social Assistance
0 (0.0%)
34 (100.0%)
Arts, Entertainment & Recreation
0 (0.0%)
0 (0.0%)
Accommodation & Food Services
0 (0.0%)
0 (0.0%)
Public Administration
0 (0.0%)
0 (0.0%)
Total
0 (0.0%)
34 (100.0%)
Education in Hilltop CDP Starr County
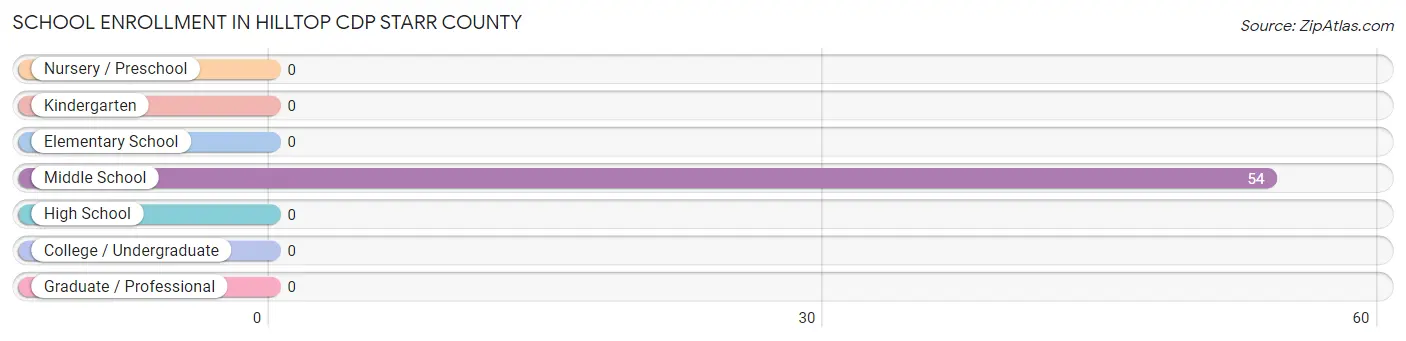
School Enrollment in Hilltop CDP Starr County
School Level
# Students
% Students
Nursery / Preschool
0
0.0%
Kindergarten
0
0.0%
Elementary School
0
0.0%
Middle School
54
100.0%
High School
0
0.0%
College / Undergraduate
0
0.0%
Graduate / Professional
0
0.0%
Total
54
100.0%
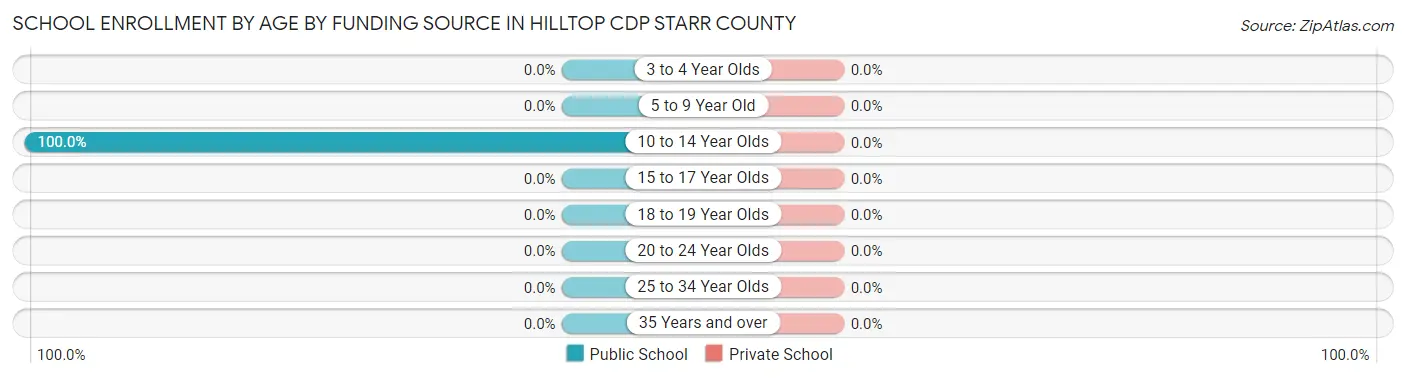
School Enrollment by Age by Funding Source in Hilltop CDP Starr County
Age Bracket
Public School
Private School
3 to 4 Year Olds
0 (0.0%)
0 (0.0%)
5 to 9 Year Old
0 (0.0%)
0 (0.0%)
10 to 14 Year Olds
54 (100.0%)
0 (0.0%)
15 to 17 Year Olds
0 (0.0%)
0 (0.0%)
18 to 19 Year Olds
0 (0.0%)
0 (0.0%)
20 to 24 Year Olds
0 (0.0%)
0 (0.0%)
25 to 34 Year Olds
0 (0.0%)
0 (0.0%)
35 Years and over
0 (0.0%)
0 (0.0%)
Total
54 (100.0%)
0 (0.0%)
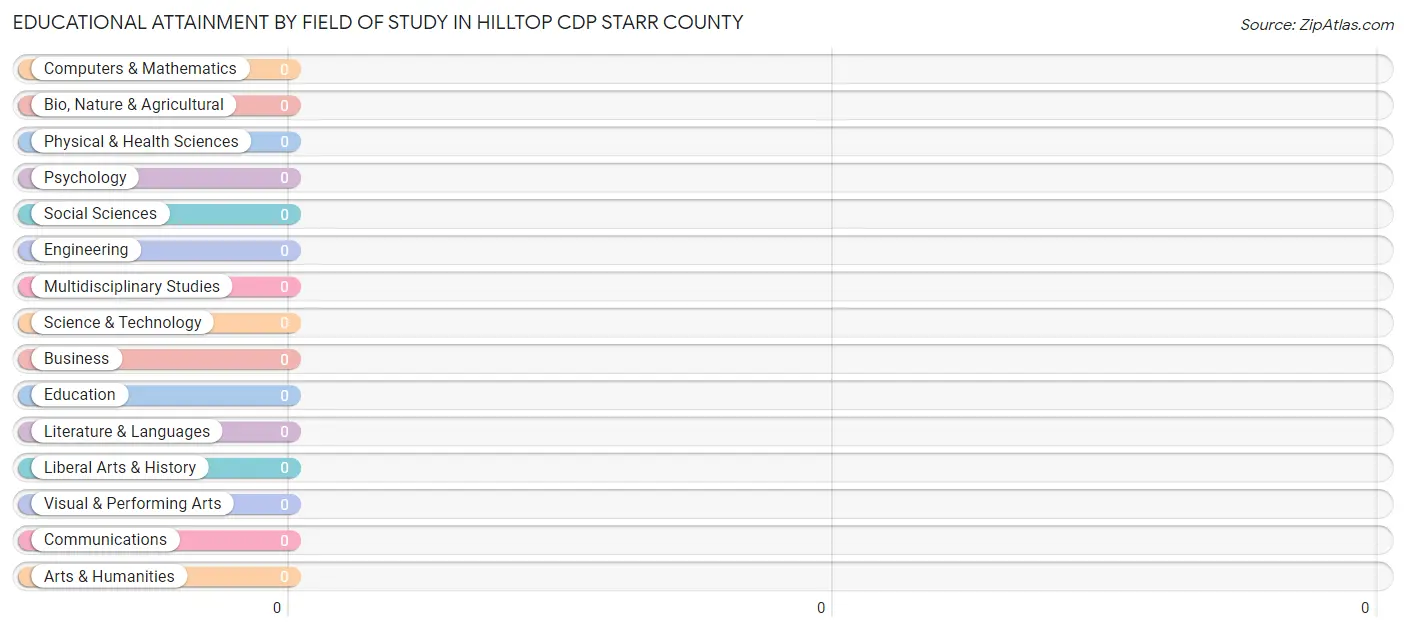
Educational Attainment by Field of Study in Hilltop CDP Starr County
Field of Study
# Graduates
% Graduates
Computers & Mathematics
0
0.0%
Bio, Nature & Agricultural
0
0.0%
Physical & Health Sciences
0
0.0%
Psychology
0
0.0%
Social Sciences
0
0.0%
Engineering
0
0.0%
Multidisciplinary Studies
0
0.0%
Science & Technology
0
0.0%
Business
0
0.0%
Education
0
0.0%
Literature & Languages
0
0.0%
Liberal Arts & History
0
0.0%
Visual & Performing Arts
0
0.0%
Communications
0
0.0%
Arts & Humanities
0
0.0%
Total
0
0.0%
Transportation & Commute in Hilltop CDP Starr County
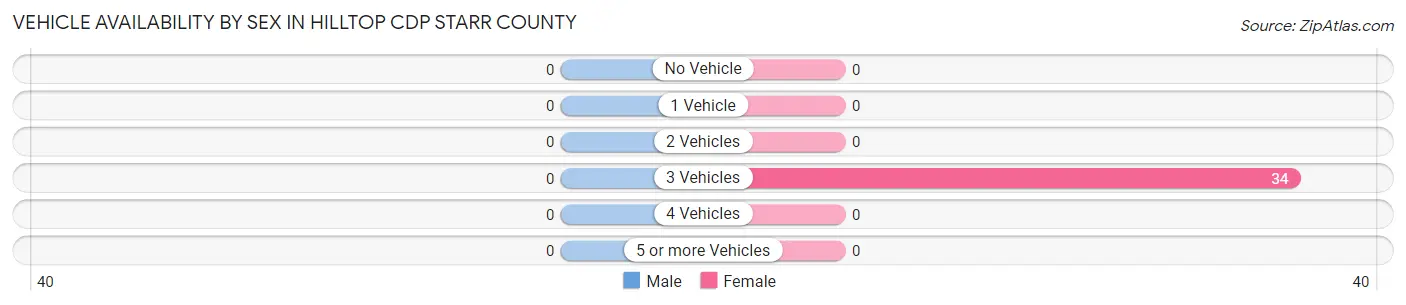
Vehicle Availability by Sex in Hilltop CDP Starr County
Vehicles Available
Male
Female
No Vehicle
0 (0.0%)
0 (0.0%)
1 Vehicle
0 (0.0%)
0 (0.0%)
2 Vehicles
0 (0.0%)
0 (0.0%)
3 Vehicles
0 (0.0%)
34 (100.0%)
4 Vehicles
0 (0.0%)
0 (0.0%)
5 or more Vehicles
0 (0.0%)
0 (0.0%)
Total
0 (0.0%)
34 (100.0%)
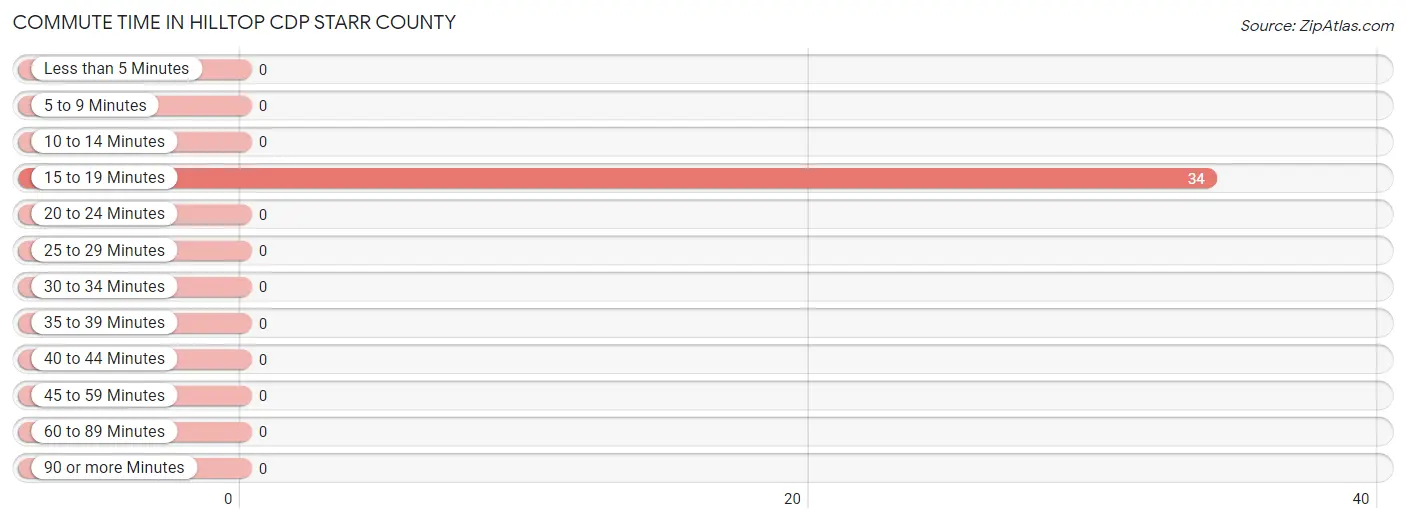
Commute Time in Hilltop CDP Starr County
The most frequently occuring commute durations in Hilltop CDP Starr County are 15 to 19 minutes (34 commuters, 100.0%), less than 5 minutes (0 commuters, 0.0%), and 5 to 9 minutes (0 commuters, 0.0%).
Commute Time
# Commuters
% Commuters
Less than 5 Minutes
0
0.0%
5 to 9 Minutes
0
0.0%
10 to 14 Minutes
0
0.0%
15 to 19 Minutes
34
100.0%
20 to 24 Minutes
0
0.0%
25 to 29 Minutes
0
0.0%
30 to 34 Minutes
0
0.0%
35 to 39 Minutes
0
0.0%
40 to 44 Minutes
0
0.0%
45 to 59 Minutes
0
0.0%
60 to 89 Minutes
0
0.0%
90 or more Minutes
0
0.0%
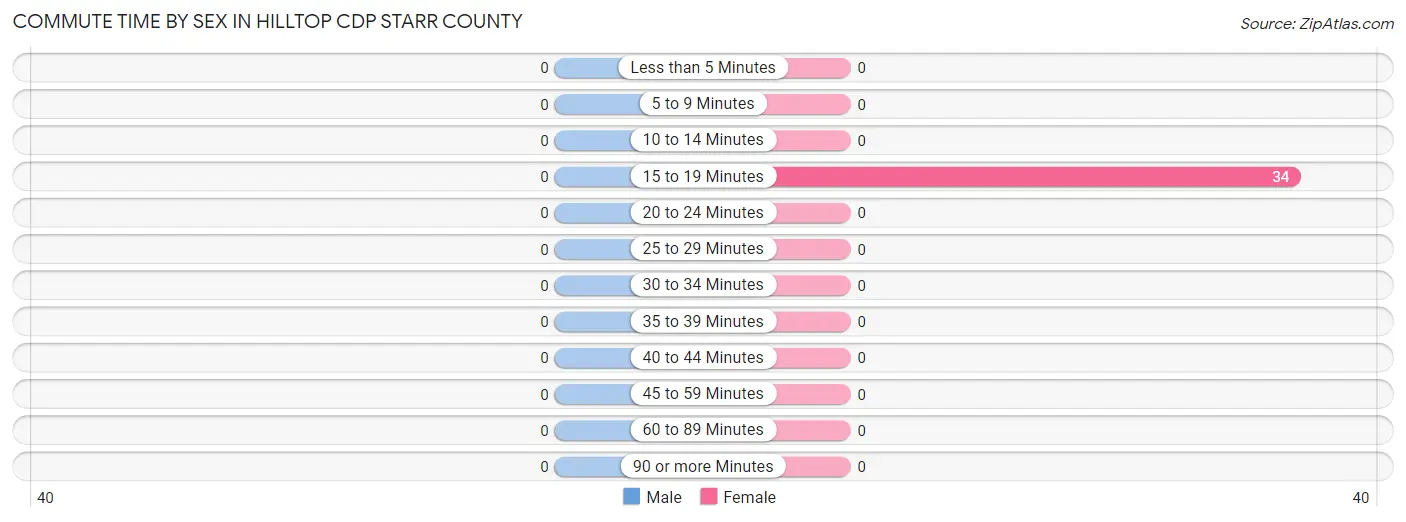
Commute Time by Sex in Hilltop CDP Starr County
Commute Time
Male
Female
Less than 5 Minutes
0 (0.0%)
0 (0.0%)
5 to 9 Minutes
0 (0.0%)
0 (0.0%)
10 to 14 Minutes
0 (0.0%)
0 (0.0%)
15 to 19 Minutes
0 (0.0%)
34 (100.0%)
20 to 24 Minutes
0 (0.0%)
0 (0.0%)
25 to 29 Minutes
0 (0.0%)
0 (0.0%)
30 to 34 Minutes
0 (0.0%)
0 (0.0%)
35 to 39 Minutes
0 (0.0%)
0 (0.0%)
40 to 44 Minutes
0 (0.0%)
0 (0.0%)
45 to 59 Minutes
0 (0.0%)
0 (0.0%)
60 to 89 Minutes
0 (0.0%)
0 (0.0%)
90 or more Minutes
0 (0.0%)
0 (0.0%)
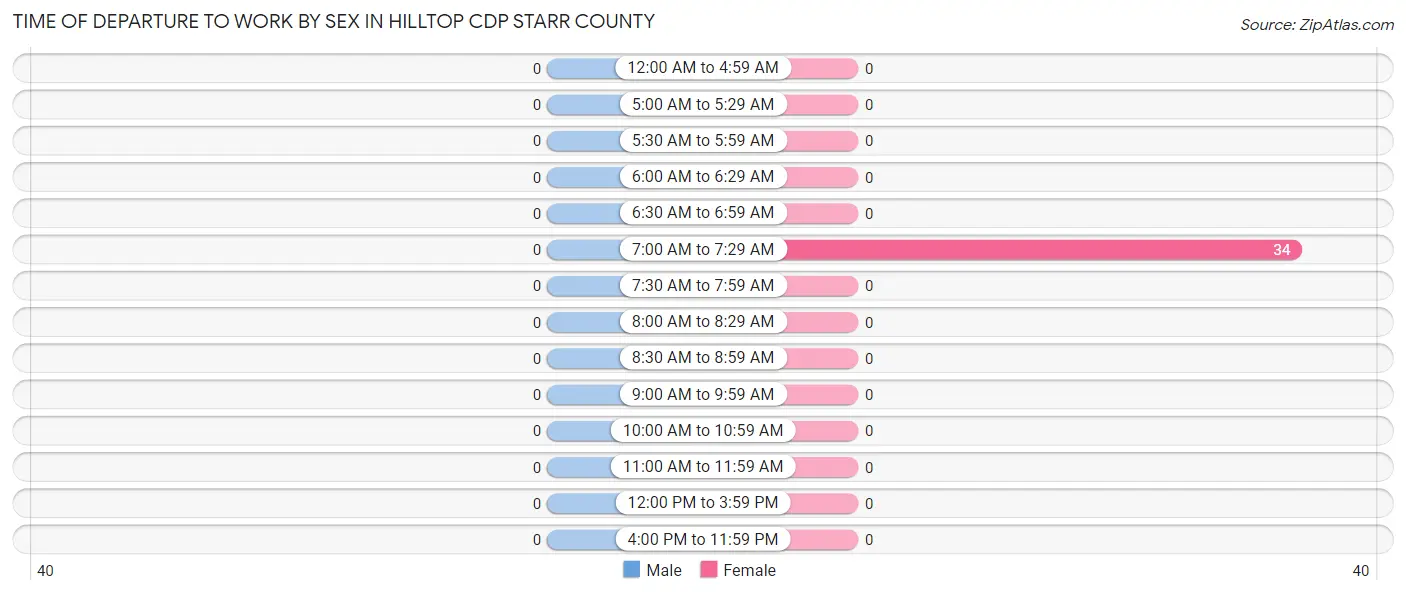
Time of Departure to Work by Sex in Hilltop CDP Starr County
Time of Departure
Male
Female
12:00 AM to 4:59 AM
0 (0.0%)
0 (0.0%)
5:00 AM to 5:29 AM
0 (0.0%)
0 (0.0%)
5:30 AM to 5:59 AM
0 (0.0%)
0 (0.0%)
6:00 AM to 6:29 AM
0 (0.0%)
0 (0.0%)
6:30 AM to 6:59 AM
0 (0.0%)
0 (0.0%)
7:00 AM to 7:29 AM
0 (0.0%)
34 (100.0%)
7:30 AM to 7:59 AM
0 (0.0%)
0 (0.0%)
8:00 AM to 8:29 AM
0 (0.0%)
0 (0.0%)
8:30 AM to 8:59 AM
0 (0.0%)
0 (0.0%)
9:00 AM to 9:59 AM
0 (0.0%)
0 (0.0%)
10:00 AM to 10:59 AM
0 (0.0%)
0 (0.0%)
11:00 AM to 11:59 AM
0 (0.0%)
0 (0.0%)
12:00 PM to 3:59 PM
0 (0.0%)
0 (0.0%)
4:00 PM to 11:59 PM
0 (0.0%)
0 (0.0%)
Total
0 (0.0%)
34 (100.0%)
Housing Occupancy in Hilltop CDP Starr County
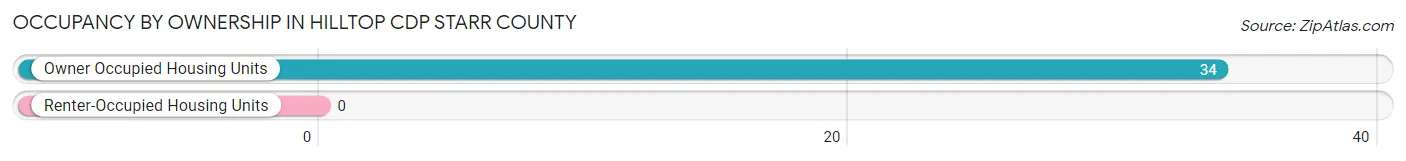
Occupancy by Ownership in Hilltop CDP Starr County
Of the total 34 dwellings in Hilltop CDP Starr County, owner-occupied units account for 34 (100.0%), while renter-occupied units make up 0 (0.0%).
Occupancy
# Housing Units
% Housing Units
Owner Occupied Housing Units
34
100.0%
Renter-Occupied Housing Units
0
0.0%
Total Occupied Housing Units
34
100.0%
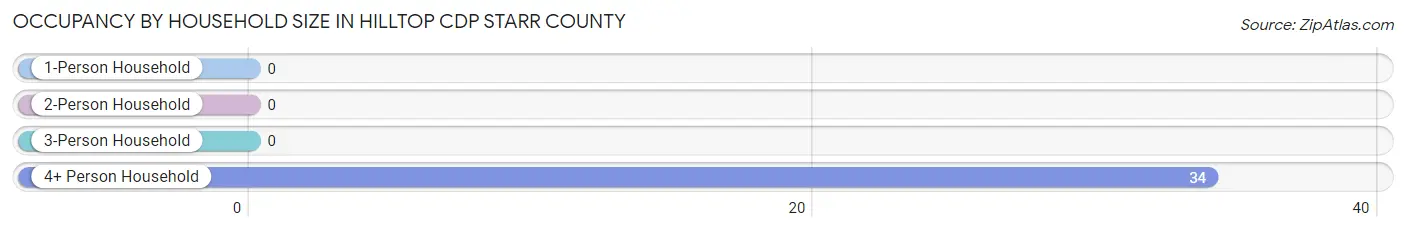
Occupancy by Household Size in Hilltop CDP Starr County
Household Size
# Housing Units
% Housing Units
1-Person Household
0
0.0%
2-Person Household
0
0.0%
3-Person Household
0
0.0%
4+ Person Household
34
100.0%
Total Housing Units
34
100.0%
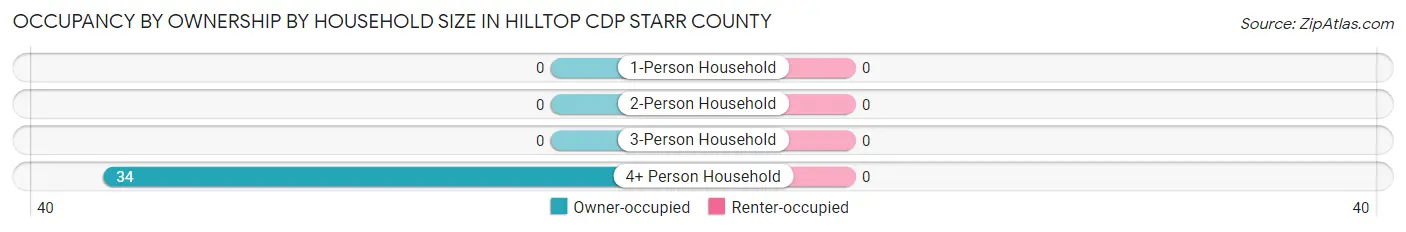
Occupancy by Ownership by Household Size in Hilltop CDP Starr County
Household Size
Owner-occupied
Renter-occupied
1-Person Household
0 (0.0%)
0 (0.0%)
2-Person Household
0 (0.0%)
0 (0.0%)
3-Person Household
0 (0.0%)
0 (0.0%)
4+ Person Household
34 (100.0%)
0 (0.0%)
Total Housing Units
34 (100.0%)
0 (0.0%)
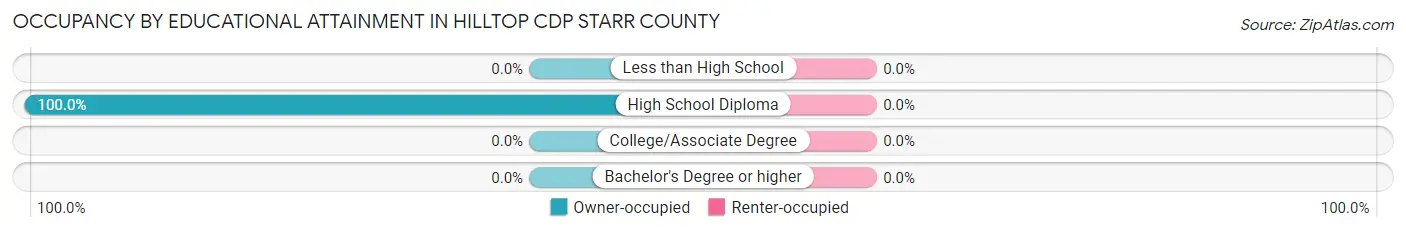
Occupancy by Educational Attainment in Hilltop CDP Starr County
Household Size
Owner-occupied
Renter-occupied
Less than High School
0 (0.0%)
0 (0.0%)
High School Diploma
34 (100.0%)
0 (0.0%)
College/Associate Degree
0 (0.0%)
0 (0.0%)
Bachelor's Degree or higher
0 (0.0%)
0 (0.0%)
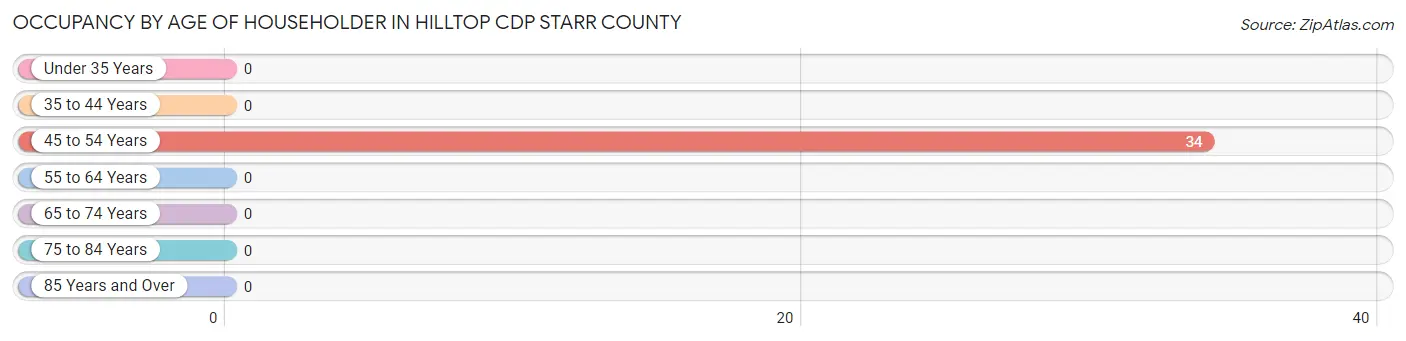
Occupancy by Age of Householder in Hilltop CDP Starr County
Age Bracket
# Households
% Households
Under 35 Years
0
0.0%
35 to 44 Years
0
0.0%
45 to 54 Years
34
100.0%
55 to 64 Years
0
0.0%
65 to 74 Years
0
0.0%
75 to 84 Years
0
0.0%
85 Years and Over
0
0.0%
Total
34
100.0%
Housing Finances in Hilltop CDP Starr County
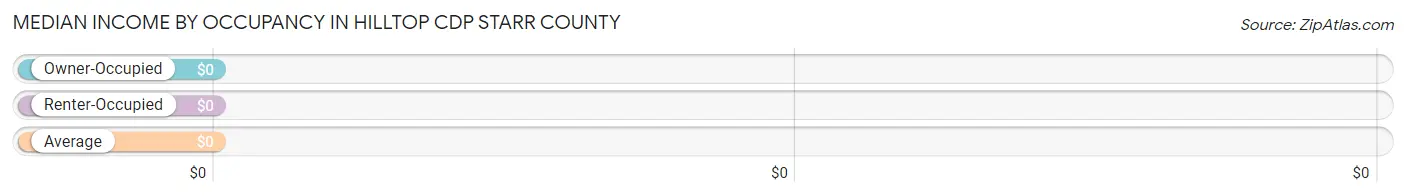
Median Income by Occupancy in Hilltop CDP Starr County
Occupancy Type
# Households
Median Income
Owner-Occupied
34 (100.0%)
$0
Renter-Occupied
0 (0.0%)
$0
Average
34 (100.0%)
$0
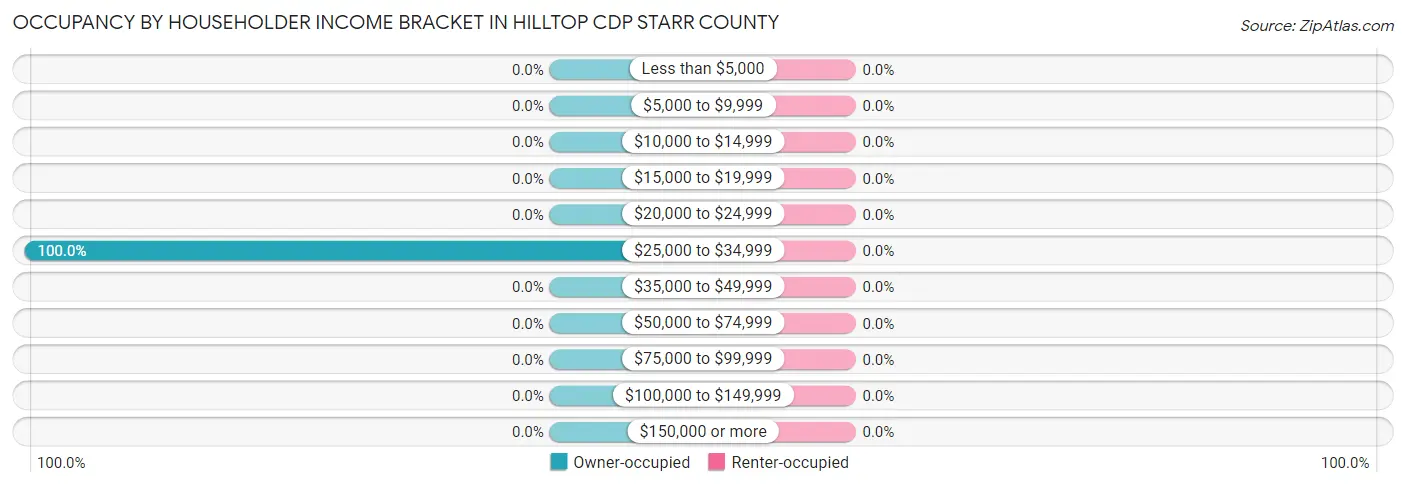
Occupancy by Householder Income Bracket in Hilltop CDP Starr County
Income Bracket
Owner-occupied
Renter-occupied
Less than $5,000
0 (0.0%)
0 (0.0%)
$5,000 to $9,999
0 (0.0%)
0 (0.0%)
$10,000 to $14,999
0 (0.0%)
0 (0.0%)
$15,000 to $19,999
0 (0.0%)
0 (0.0%)
$20,000 to $24,999
0 (0.0%)
0 (0.0%)
$25,000 to $34,999
34 (100.0%)
0 (0.0%)
$35,000 to $49,999
0 (0.0%)
0 (0.0%)
$50,000 to $74,999
0 (0.0%)
0 (0.0%)
$75,000 to $99,999
0 (0.0%)
0 (0.0%)
$100,000 to $149,999
0 (0.0%)
0 (0.0%)
$150,000 or more
0 (0.0%)
0 (0.0%)
Total
34 (100.0%)
0 (0.0%)
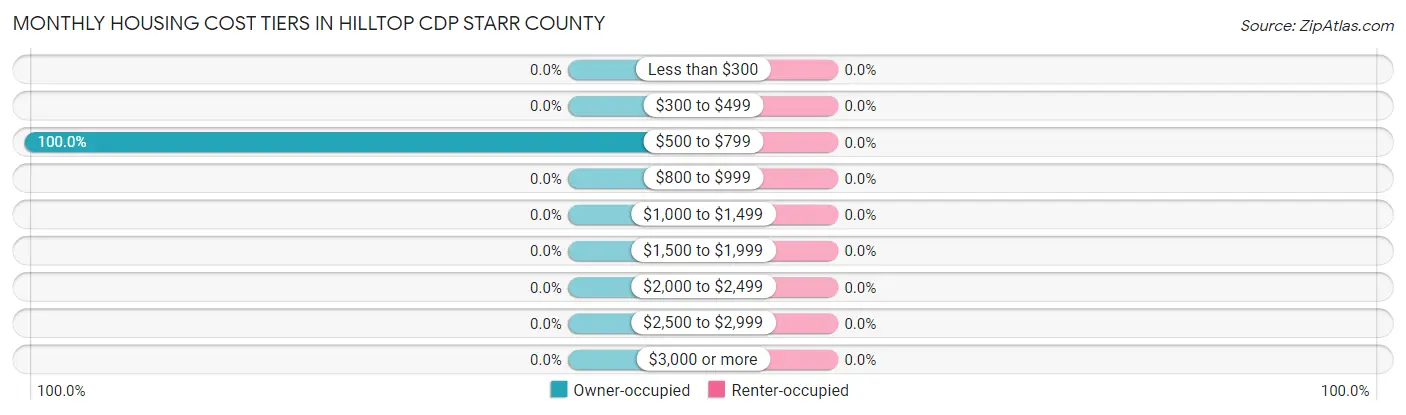
Monthly Housing Cost Tiers in Hilltop CDP Starr County
Monthly Cost
Owner-occupied
Renter-occupied
Less than $300
0 (0.0%)
0 (0.0%)
$300 to $499
0 (0.0%)
0 (0.0%)
$500 to $799
34 (100.0%)
0 (0.0%)
$800 to $999
0 (0.0%)
0 (0.0%)
$1,000 to $1,499
0 (0.0%)
0 (0.0%)
$1,500 to $1,999
0 (0.0%)
0 (0.0%)
$2,000 to $2,499
0 (0.0%)
0 (0.0%)
$2,500 to $2,999
0 (0.0%)
0 (0.0%)
$3,000 or more
0 (0.0%)
0 (0.0%)
Total
34 (100.0%)
0 (0.0%)
Physical Housing Characteristics in Hilltop CDP Starr County
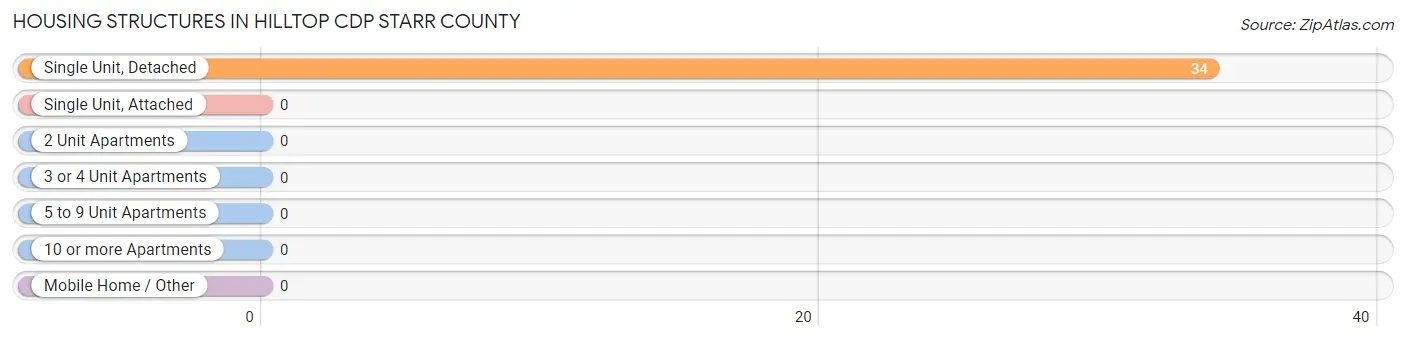
Housing Structures in Hilltop CDP Starr County
Structure Type
# Housing Units
% Housing Units
Single Unit, Detached
34
100.0%
Single Unit, Attached
0
0.0%
2 Unit Apartments
0
0.0%
3 or 4 Unit Apartments
0
0.0%
5 to 9 Unit Apartments
0
0.0%
10 or more Apartments
0
0.0%
Mobile Home / Other
0
0.0%
Total
34
100.0%
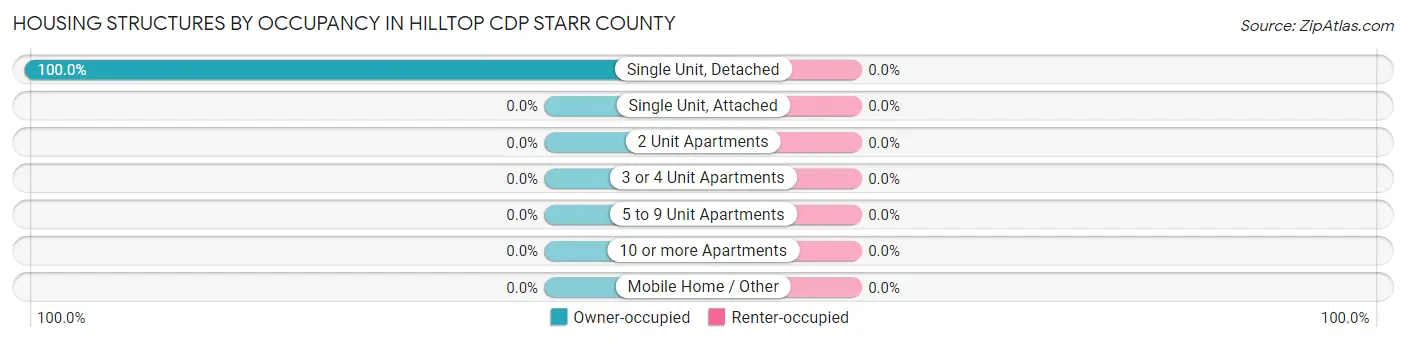
Housing Structures by Occupancy in Hilltop CDP Starr County
Structure Type
Owner-occupied
Renter-occupied
Single Unit, Detached
34 (100.0%)
0 (0.0%)
Single Unit, Attached
0 (0.0%)
0 (0.0%)
2 Unit Apartments
0 (0.0%)
0 (0.0%)
3 or 4 Unit Apartments
0 (0.0%)
0 (0.0%)
5 to 9 Unit Apartments
0 (0.0%)
0 (0.0%)
10 or more Apartments
0 (0.0%)
0 (0.0%)
Mobile Home / Other
0 (0.0%)
0 (0.0%)
Total
34 (100.0%)
0 (0.0%)
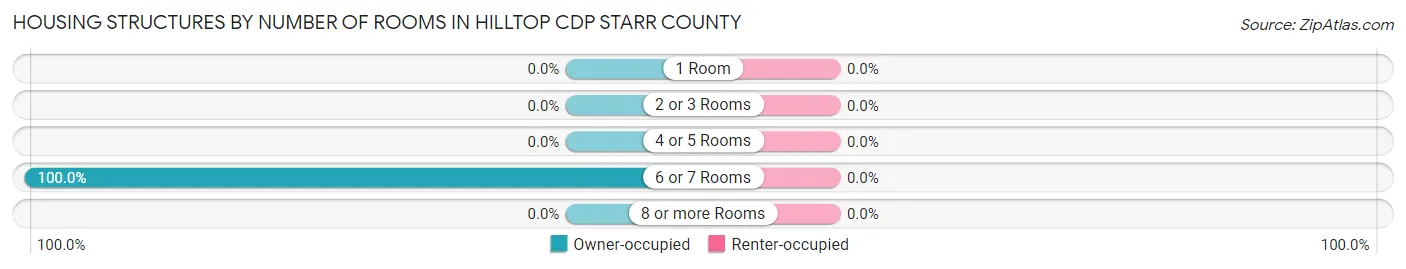
Housing Structures by Number of Rooms in Hilltop CDP Starr County
Number of Rooms
Owner-occupied
Renter-occupied
1 Room
0 (0.0%)
0 (0.0%)
2 or 3 Rooms
0 (0.0%)
0 (0.0%)
4 or 5 Rooms
0 (0.0%)
0 (0.0%)
6 or 7 Rooms
34 (100.0%)
0 (0.0%)
8 or more Rooms
0 (0.0%)
0 (0.0%)
Total
34 (100.0%)
0 (0.0%)
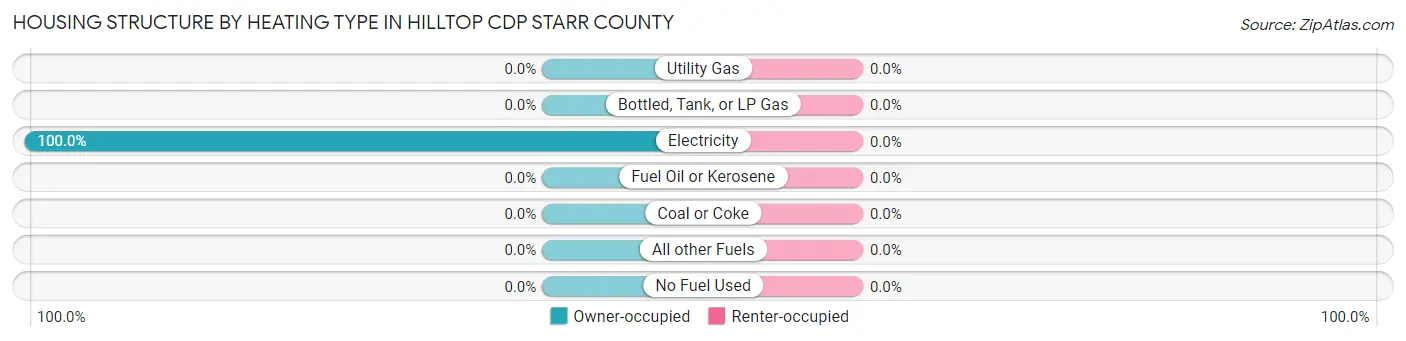
Housing Structure by Heating Type in Hilltop CDP Starr County
Heating Type
Owner-occupied
Renter-occupied
Utility Gas
0 (0.0%)
0 (0.0%)
Bottled, Tank, or LP Gas
0 (0.0%)
0 (0.0%)
Electricity
34 (100.0%)
0 (0.0%)
Fuel Oil or Kerosene
0 (0.0%)
0 (0.0%)
Coal or Coke
0 (0.0%)
0 (0.0%)
All other Fuels
0 (0.0%)
0 (0.0%)
No Fuel Used
0 (0.0%)
0 (0.0%)
Total
34 (100.0%)
0 (0.0%)
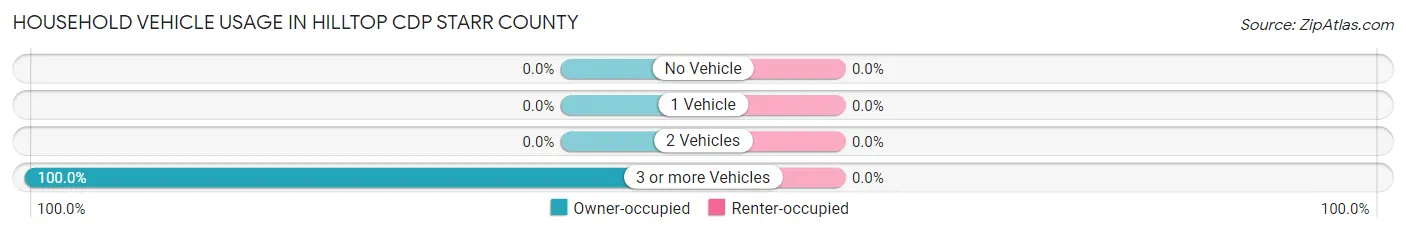
Household Vehicle Usage in Hilltop CDP Starr County
Vehicles per Household
Owner-occupied
Renter-occupied
No Vehicle
0 (0.0%)
0 (0.0%)
1 Vehicle
0 (0.0%)
0 (0.0%)
2 Vehicles
0 (0.0%)
0 (0.0%)
3 or more Vehicles
34 (100.0%)
0 (0.0%)
Total
34 (100.0%)
0 (0.0%)
Real Estate & Mortgages in Hilltop CDP Starr County
Real Estate and Mortgage Overview in Hilltop CDP Starr County
Characteristic
Without Mortgage
With Mortgage
Housing Units
34
0
Median Property Value
-
-
Median Household Income
-
-
Monthly Housing Costs
-
-
Real Estate Taxes
-
-
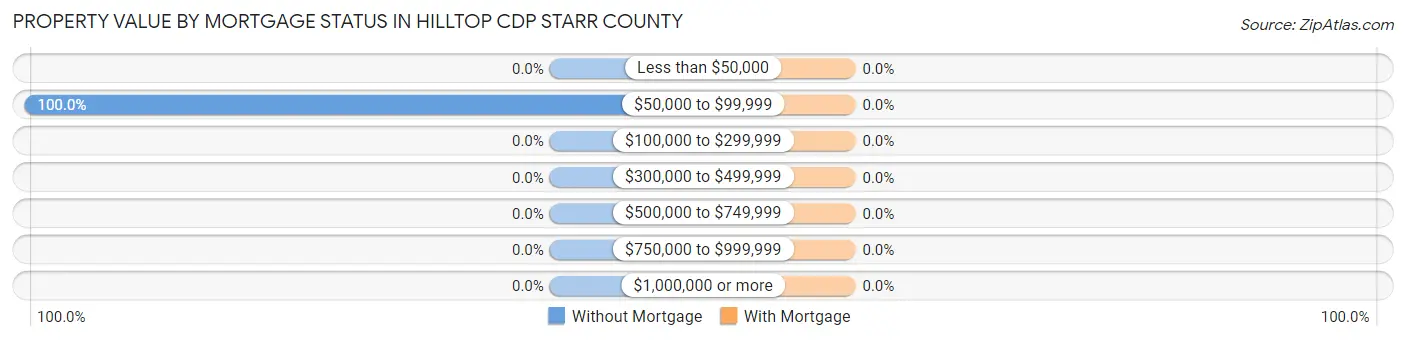
Property Value by Mortgage Status in Hilltop CDP Starr County
Property Value
Without Mortgage
With Mortgage
Less than $50,000
0 (0.0%)
0 (0.0%)
$50,000 to $99,999
34 (100.0%)
0 (0.0%)
$100,000 to $299,999
0 (0.0%)
0 (0.0%)
$300,000 to $499,999
0 (0.0%)
0 (0.0%)
$500,000 to $749,999
0 (0.0%)
0 (0.0%)
$750,000 to $999,999
0 (0.0%)
0 (0.0%)
$1,000,000 or more
0 (0.0%)
0 (0.0%)
Total
34 (100.0%)
0 (0.0%)
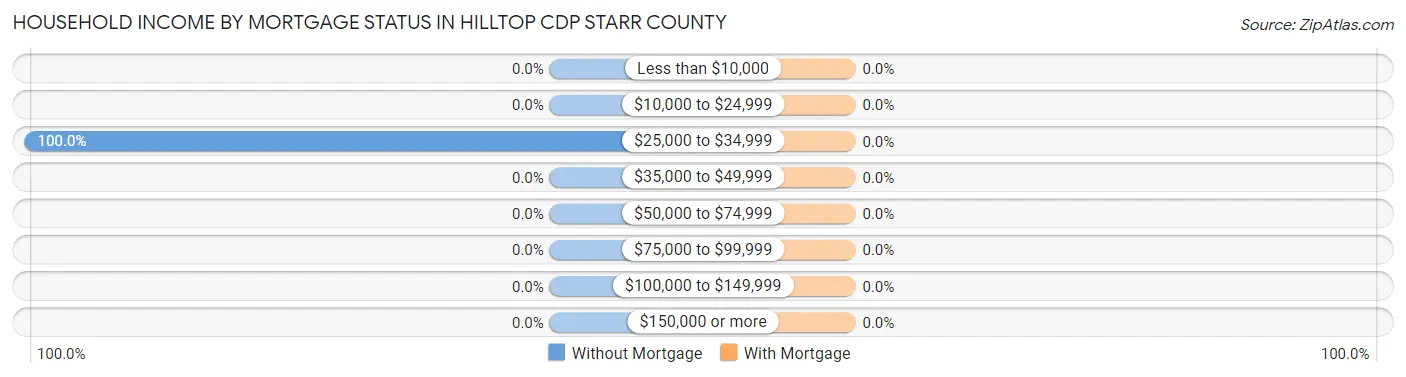
Household Income by Mortgage Status in Hilltop CDP Starr County
Household Income
Without Mortgage
With Mortgage
Less than $10,000
0 (0.0%)
0 (0.0%)
$10,000 to $24,999
0 (0.0%)
0 (0.0%)
$25,000 to $34,999
34 (100.0%)
0 (0.0%)
$35,000 to $49,999
0 (0.0%)
0 (0.0%)
$50,000 to $74,999
0 (0.0%)
0 (0.0%)
$75,000 to $99,999
0 (0.0%)
0 (0.0%)
$100,000 to $149,999
0 (0.0%)
0 (0.0%)
$150,000 or more
0 (0.0%)
0 (0.0%)
Total
34 (100.0%)
0 (0.0%)
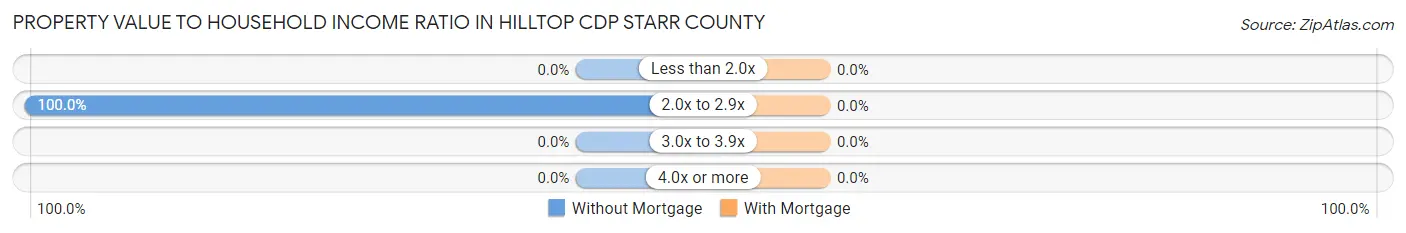
Property Value to Household Income Ratio in Hilltop CDP Starr County
Value-to-Income Ratio
Without Mortgage
With Mortgage
Less than 2.0x
0 (0.0%)
0 (0.0%)
2.0x to 2.9x
34 (100.0%)
0 (0.0%)
3.0x to 3.9x
0 (0.0%)
0 (0.0%)
4.0x or more
0 (0.0%)
0 (0.0%)
Total
34 (100.0%)
0 (0.0%)
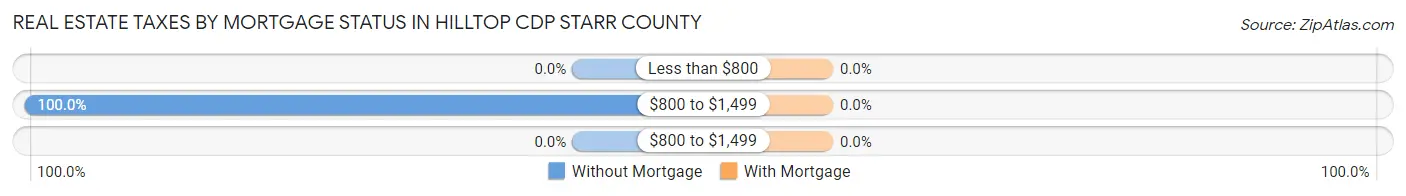
Real Estate Taxes by Mortgage Status in Hilltop CDP Starr County
Property Taxes
Without Mortgage
With Mortgage
Less than $800
0 (0.0%)
0 (0.0%)
$800 to $1,499
34 (100.0%)
0 (0.0%)
$800 to $1,499
0 (0.0%)
0 (0.0%)
Total
34 (100.0%)
0 (0.0%)
Health & Disability in Hilltop CDP Starr County
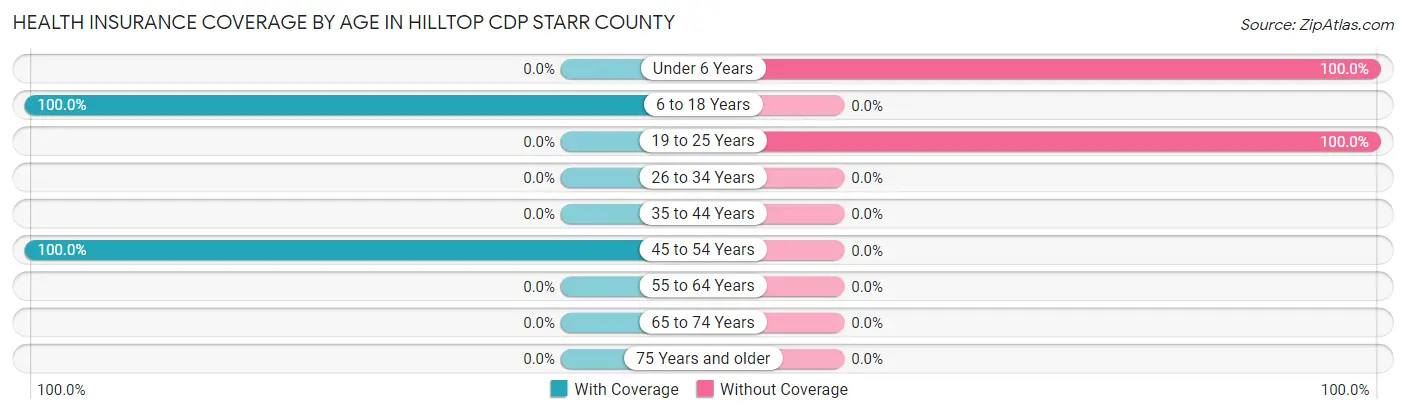
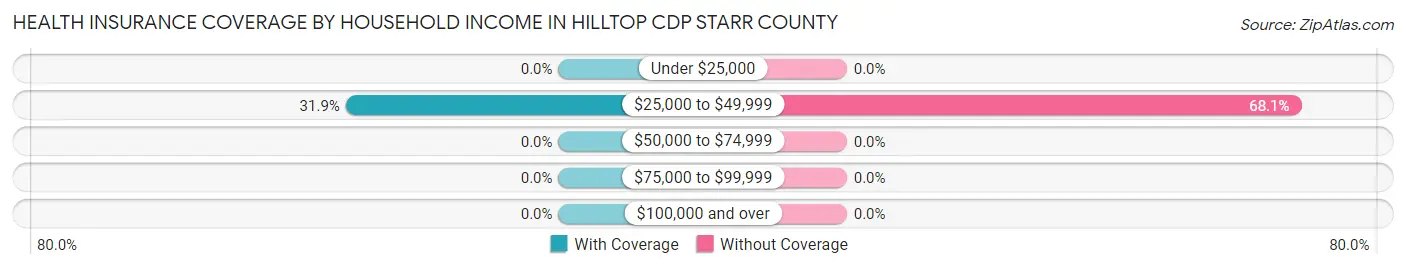
Health Insurance Coverage by Age in Hilltop CDP Starr County
Age Bracket
With Coverage
Without Coverage
Under 6 Years
0 (0.0%)
129 (100.0%)
6 to 18 Years
54 (100.0%)
0 (0.0%)
19 to 25 Years
0 (0.0%)
59 (100.0%)
26 to 34 Years
0 (0.0%)
0 (0.0%)
35 to 44 Years
0 (0.0%)
0 (0.0%)
45 to 54 Years
34 (100.0%)
0 (0.0%)
55 to 64 Years
0 (0.0%)
0 (0.0%)
65 to 74 Years
0 (0.0%)
0 (0.0%)
75 Years and older
0 (0.0%)
0 (0.0%)
Total
88 (31.9%)
188 (68.1%)
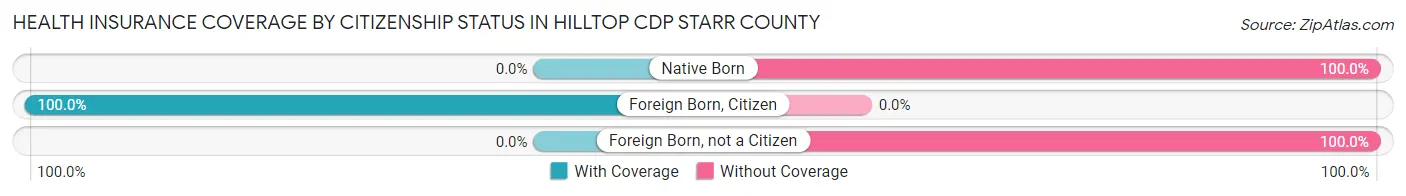
Health Insurance Coverage by Citizenship Status in Hilltop CDP Starr County
Citizenship Status
With Coverage
Without Coverage
Native Born
0 (0.0%)
129 (100.0%)
Foreign Born, Citizen
54 (100.0%)
0 (0.0%)
Foreign Born, not a Citizen
0 (0.0%)
59 (100.0%)
Health Insurance Coverage by Household Income in Hilltop CDP Starr County
Household Income
With Coverage
Without Coverage
Under $25,000
0 (0.0%)
0 (0.0%)
$25,000 to $49,999
88 (31.9%)
188 (68.1%)
$50,000 to $74,999
0 (0.0%)
0 (0.0%)
$75,000 to $99,999
0 (0.0%)
0 (0.0%)
$100,000 and over
0 (0.0%)
0 (0.0%)
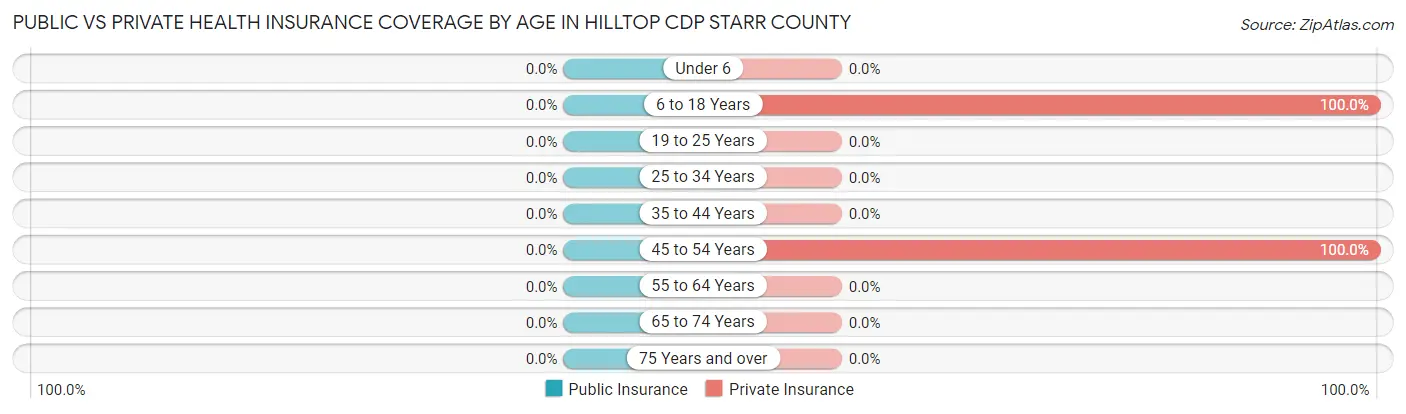
Public vs Private Health Insurance Coverage by Age in Hilltop CDP Starr County
Age Bracket
Public Insurance
Private Insurance
Under 6
0 (0.0%)
0 (0.0%)
6 to 18 Years
0 (0.0%)
54 (100.0%)
19 to 25 Years
0 (0.0%)
0 (0.0%)
25 to 34 Years
0 (0.0%)
0 (0.0%)
35 to 44 Years
0 (0.0%)
0 (0.0%)
45 to 54 Years
0 (0.0%)
34 (100.0%)
55 to 64 Years
0 (0.0%)
0 (0.0%)
65 to 74 Years
0 (0.0%)
0 (0.0%)
75 Years and over
0 (0.0%)
0 (0.0%)
Total
0 (0.0%)
88 (31.9%)
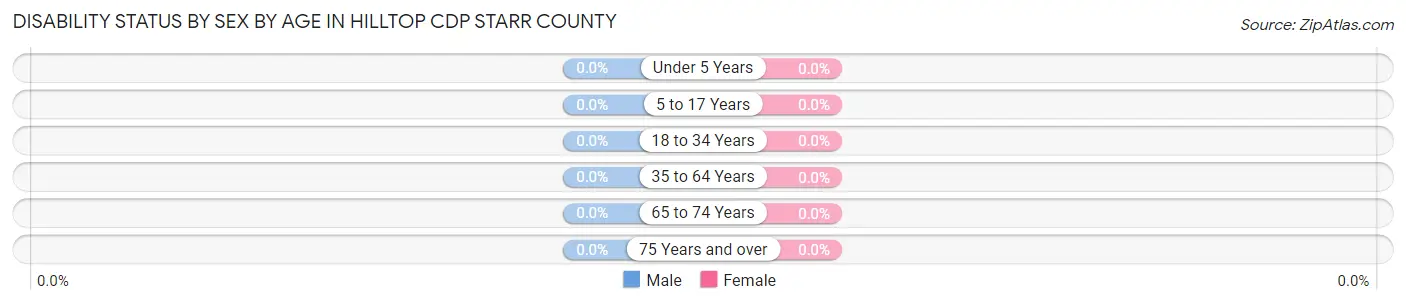
Disability Status by Sex by Age in Hilltop CDP Starr County
Age Bracket
Male
Female
Under 5 Years
0 (0.0%)
0 (0.0%)
5 to 17 Years
0 (0.0%)
0 (0.0%)
18 to 34 Years
0 (0.0%)
0 (0.0%)
35 to 64 Years
0 (0.0%)
0 (0.0%)
65 to 74 Years
0 (0.0%)
0 (0.0%)
75 Years and over
0 (0.0%)
0 (0.0%)
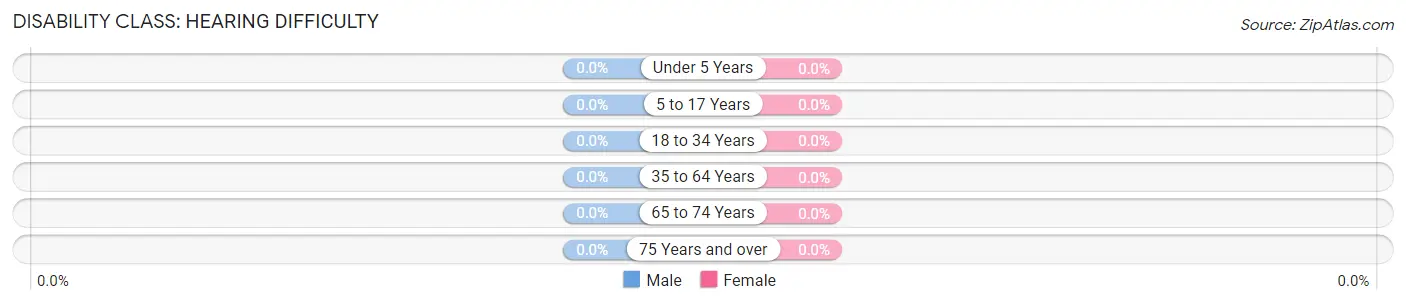
Disability Class by Sex by Age in Hilltop CDP Starr County
Disability Class: Hearing Difficulty
Age Bracket
Male
Female
Under 5 Years
0 (0.0%)
0 (0.0%)
5 to 17 Years
0 (0.0%)
0 (0.0%)
18 to 34 Years
0 (0.0%)
0 (0.0%)
35 to 64 Years
0 (0.0%)
0 (0.0%)
65 to 74 Years
0 (0.0%)
0 (0.0%)
75 Years and over
0 (0.0%)
0 (0.0%)
Disability Class: Vision Difficulty
Age Bracket
Male
Female
Under 5 Years
0 (0.0%)
0 (0.0%)
5 to 17 Years
0 (0.0%)
0 (0.0%)
18 to 34 Years
0 (0.0%)
0 (0.0%)
35 to 64 Years
0 (0.0%)
0 (0.0%)
65 to 74 Years
0 (0.0%)
0 (0.0%)
75 Years and over
0 (0.0%)
0 (0.0%)
Disability Class: Cognitive Difficulty
Age Bracket
Male
Female
5 to 17 Years
0 (0.0%)
0 (0.0%)
18 to 34 Years
0 (0.0%)
0 (0.0%)
35 to 64 Years
0 (0.0%)
0 (0.0%)
65 to 74 Years
0 (0.0%)
0 (0.0%)
75 Years and over
0 (0.0%)
0 (0.0%)
Disability Class: Ambulatory Difficulty
Age Bracket
Male
Female
5 to 17 Years
0 (0.0%)
0 (0.0%)
18 to 34 Years
0 (0.0%)
0 (0.0%)
35 to 64 Years
0 (0.0%)
0 (0.0%)
65 to 74 Years
0 (0.0%)
0 (0.0%)
75 Years and over
0 (0.0%)
0 (0.0%)
Disability Class: Self-Care Difficulty
Age Bracket
Male
Female
5 to 17 Years
0 (0.0%)
0 (0.0%)
18 to 34 Years
0 (0.0%)
0 (0.0%)
35 to 64 Years
0 (0.0%)
0 (0.0%)
65 to 74 Years
0 (0.0%)
0 (0.0%)
75 Years and over
0 (0.0%)
0 (0.0%)
Technology Access in Hilltop CDP Starr County
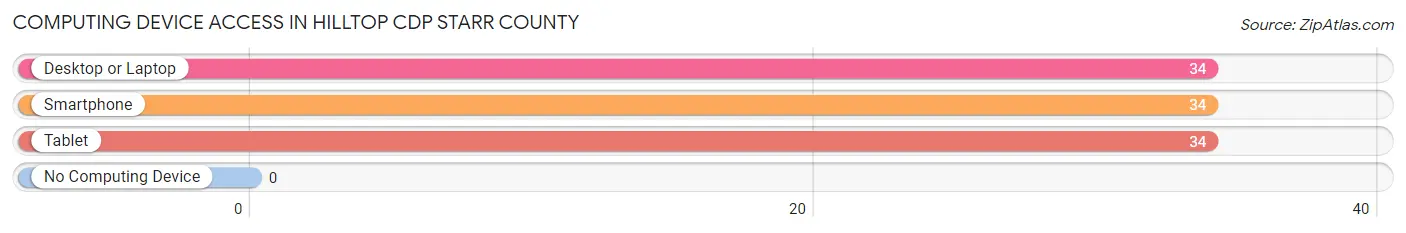
Computing Device Access in Hilltop CDP Starr County
Device Type
# Households
% Households
Desktop or Laptop
34
100.0%
Smartphone
34
100.0%
Tablet
34
100.0%
No Computing Device
0
0.0%
Total
34
100.0%
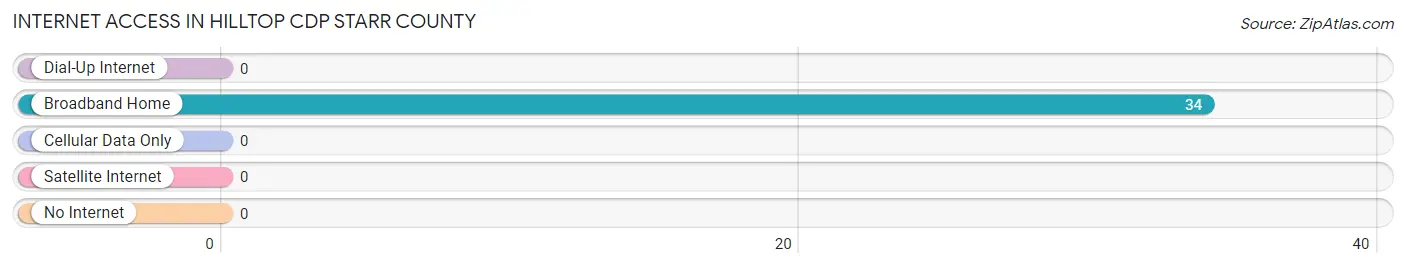
Internet Access in Hilltop CDP Starr County
Internet Type
# Households
% Households
Dial-Up Internet
0
0.0%
Broadband Home
34
100.0%
Cellular Data Only
0
0.0%
Satellite Internet
0
0.0%
No Internet
0
0.0%
Total
34
100.0%
Hilltop CDP Starr County Summary
Hilltop Cdp is a census-designated place (CDP) located in Starr County, Texas. It is located in the Rio Grande Valley region of South Texas, and is part of the larger McAllen-Edinburg-Mission Metropolitan Statistical Area. As of the 2010 census, the population of Hilltop Cdp was 1,845.
Geography
Hilltop Cdp is located at 26°17'17" North, 98°20'17" West (26.288, -98.338). It is situated at an elevation of approximately 100 feet (30 m) above sea level. The CDP has a total area of 0.7 square miles (1.8 km2), all of which is land.
History
The area that is now Hilltop Cdp was originally inhabited by the Coahuiltecan Indians. The first European settlers arrived in the area in the late 1700s, and the area was part of the Mexican state of Tamaulipas until 1848, when it became part of the United States following the Mexican-American War.
In the late 1800s, the area was settled by a number of German and Czech immigrants, who established farms and ranches in the area. The area was known as “Hilltop” due to its location on a hill overlooking the Rio Grande Valley.
In the early 1900s, the area began to develop as a small farming and ranching community. The first school in the area was established in 1910, and the first post office was established in 1912.
In the 1950s, the area began to experience rapid growth due to the influx of Mexican immigrants. The population of Hilltop Cdp increased from 1,000 in 1950 to 1,845 in 2010.
Economy
The economy of Hilltop Cdp is largely based on agriculture and ranching. The area is home to a number of farms and ranches, which produce a variety of crops, including cotton, corn, sorghum, and wheat. The area is also home to a number of small businesses, including restaurants, grocery stores, and auto repair shops.
Demographics
As of the 2010 census, the population of Hilltop Cdp was 1,845. The racial makeup of the CDP was 94.2% Hispanic or Latino, 4.2% White, 0.2% African American, 0.2% Native American, 0.2% Asian, and 0.9% from other races.
The median household income in Hilltop Cdp was $20,938, and the median family income was $22,813. The per capita income was $9,845. About 28.2% of the population was below the poverty line.
Conclusion
Hilltop Cdp is a small census-designated place located in Starr County, Texas. It is situated in the Rio Grande Valley region of South Texas, and is part of the larger McAllen-Edinburg-Mission Metropolitan Statistical Area. The area was originally inhabited by the Coahuiltecan Indians, and was later settled by German and Czech immigrants in the late 1800s. The economy of Hilltop Cdp is largely based on agriculture and ranching, and the population of the CDP was 1,845 as of the 2010 census. The racial makeup of the CDP was 94.2% Hispanic or Latino, 4.2% White, 0.2% African American, 0.2% Native American, 0.2% Asian, and 0.9% from other races. The median household income in Hilltop Cdp was $20,938, and the median family income was $22,813. About 28.2% of the population was below the poverty line.
Common Questions
What is the Total Population of Hilltop CDP Starr County?
Total Population of Hilltop CDP Starr County is 276.
What is the Total Male Population of Hilltop CDP Starr County?
Total Male Population of Hilltop CDP Starr County is 120.
What is the Total Female Population of Hilltop CDP Starr County?
Total Female Population of Hilltop CDP Starr County is 156.
What is the Ratio of Males per 100 Females in Hilltop CDP Starr County?
There are 76.92 Males per 100 Females in Hilltop CDP Starr County.
What is the Ratio of Females per 100 Males in Hilltop CDP Starr County?
There are 130.00 Females per 100 Males in Hilltop CDP Starr County.
What is the Median Population Age in Hilltop CDP Starr County?
Median Population Age in Hilltop CDP Starr County is 14.2 Years.
What is the Average Family Size in Hilltop CDP Starr County
Average Family Size in Hilltop CDP Starr County is 8.1 People.
What is the Average Household Size in Hilltop CDP Starr County
Average Household Size in Hilltop CDP Starr County is 8.1 People.
How Large is the Labor Force in Hilltop CDP Starr County?
There are 34 People in the Labor Forcein in Hilltop CDP Starr County.
What is the Percentage of People in the Labor Force in Hilltop CDP Starr County?
36.6% of People are in the Labor Force in Hilltop CDP Starr County.
Report Title
Report Link
HTML Copy & Paste Link
Social Media
Copy and paste the folowing code into any webpage where you would like this interactive chart to display