Escobares, TX
Escobares Map
Escobares Overview
2,578
TOTAL POPULATION
1,215
MALE POPULATION
1,363
FEMALE POPULATION
89.14
MALES / 100 FEMALES
112.18
FEMALES / 100 MALES
28.8
MEDIAN AGE
4.1
AVG FAMILY SIZE
3.6
AVG HOUSEHOLD SIZE
$13,488
PER CAPITA INCOME
$30,938
AVG FAMILY INCOME
$29,141
AVG HOUSEHOLD INCOME
3.6%
WAGE / INCOME GAP [ % ]
96.4¢/ $1
WAGE / INCOME GAP [ $ ]
0.48
INEQUALITY / GINI INDEX
1,017
LABOR FORCE [ PEOPLE ]
55.6%
PERCENT IN LABOR FORCE
9.9%
UNEMPLOYMENT RATE
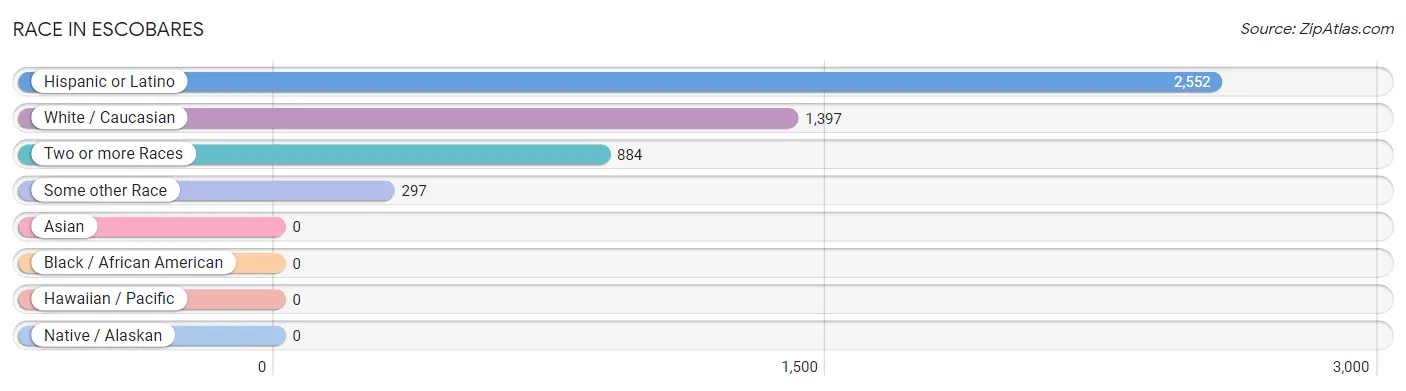
Race in Escobares
The most populous races in Escobares are Hispanic or Latino (2,552 | 99.0%), White / Caucasian (1,397 | 54.2%), and Two or more Races (884 | 34.3%).
| Race | # Population | % Population |
| Asian | 0 | 0.0% |
| Black / African American | 0 | 0.0% |
| Hawaiian / Pacific | 0 | 0.0% |
| Hispanic or Latino | 2,552 | 99.0% |
| Native / Alaskan | 0 | 0.0% |
| White / Caucasian | 1,397 | 54.2% |
| Two or more Races | 884 | 34.3% |
| Some other Race | 297 | 11.5% |
| Total | 2,578 | 100.0% |
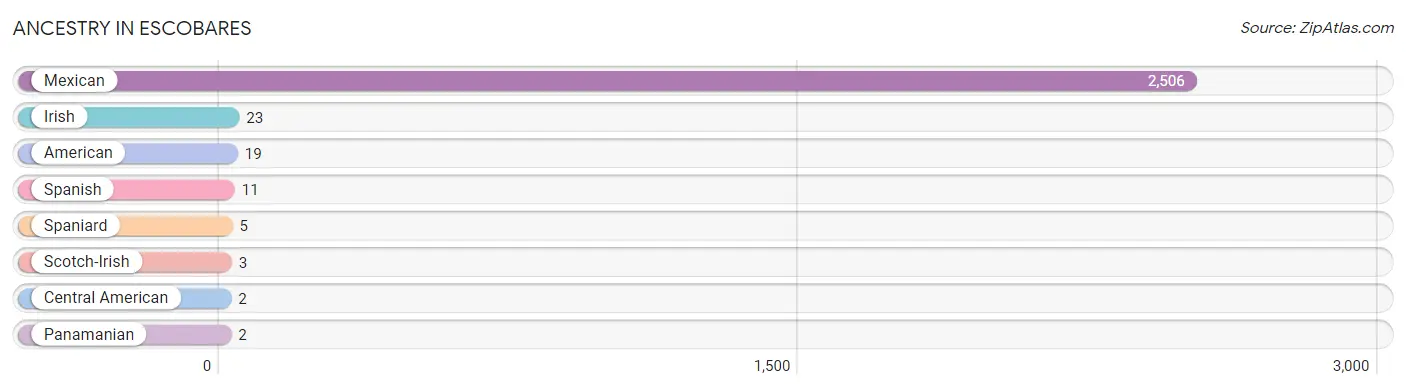
Ancestry in Escobares
The most populous ancestries reported in Escobares are Mexican (2,506 | 97.2%), Irish (23 | 0.9%), American (19 | 0.7%), Spanish (11 | 0.4%), and Spaniard (5 | 0.2%), together accounting for 99.5% of all Escobares residents.
| Ancestry | # Population | % Population |
| American | 19 | 0.7% |
| Central American | 2 | 0.1% |
| Irish | 23 | 0.9% |
| Mexican | 2,506 | 97.2% |
| Panamanian | 2 | 0.1% |
| Scotch-Irish | 3 | 0.1% |
| Spaniard | 5 | 0.2% |
| Spanish | 11 | 0.4% | View All 8 Rows |
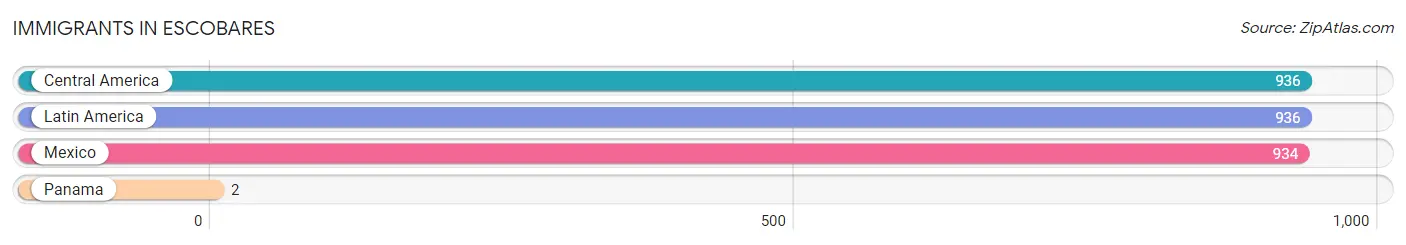
Immigrants in Escobares
The most numerous immigrant groups reported in Escobares came from Central America (936 | 36.3%), Latin America (936 | 36.3%), Mexico (934 | 36.2%), and Panama (2 | 0.1%), together accounting for 108.9% of all Escobares residents.
| Immigration Origin | # Population | % Population |
| Central America | 936 | 36.3% |
| Latin America | 936 | 36.3% |
| Mexico | 934 | 36.2% |
| Panama | 2 | 0.1% | View All 4 Rows |
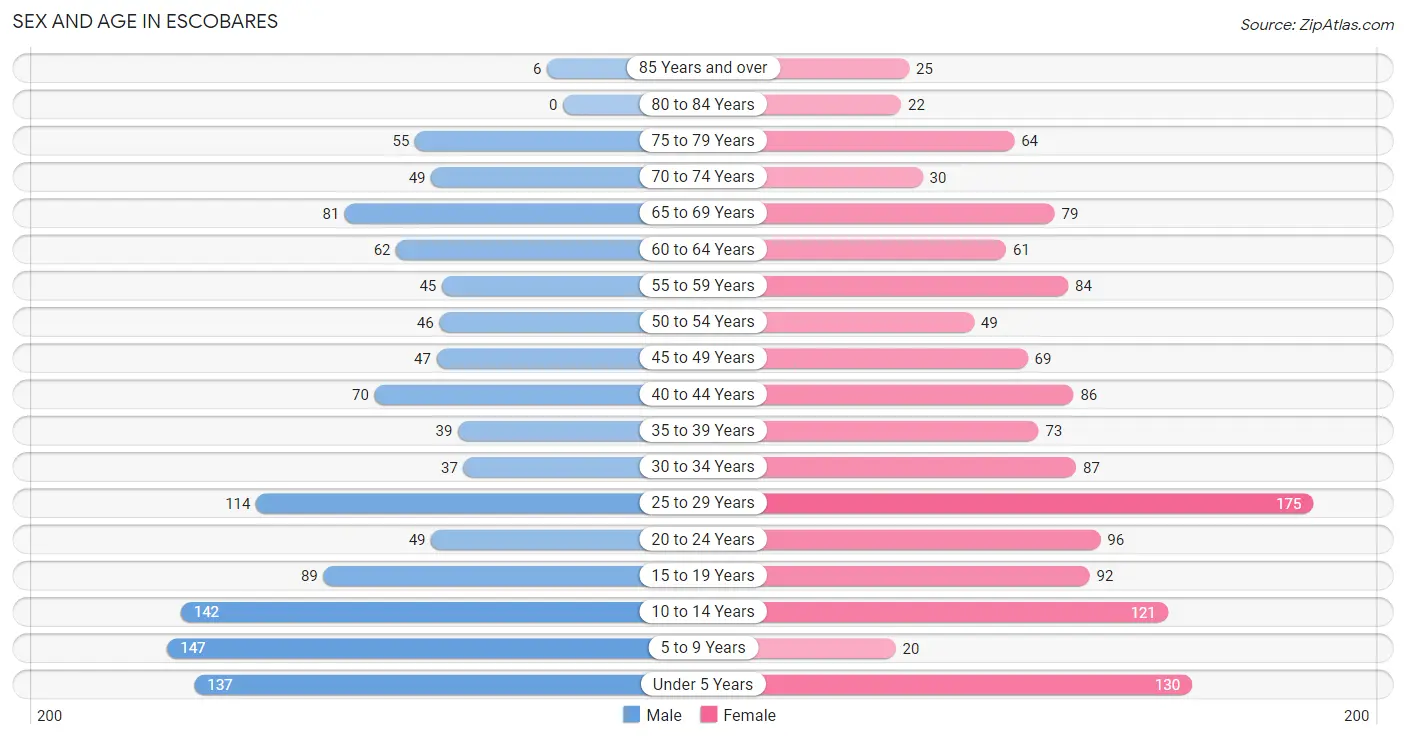
Sex and Age in Escobares
Sex and Age in Escobares
The most populous age groups in Escobares are 5 to 9 Years (147 | 12.1%) for men and 25 to 29 Years (175 | 12.8%) for women.
| Age Bracket | Male | Female |
| Under 5 Years | 137 (11.3%) | 130 (9.5%) |
| 5 to 9 Years | 147 (12.1%) | 20 (1.5%) |
| 10 to 14 Years | 142 (11.7%) | 121 (8.9%) |
| 15 to 19 Years | 89 (7.3%) | 92 (6.8%) |
| 20 to 24 Years | 49 (4.0%) | 96 (7.0%) |
| 25 to 29 Years | 114 (9.4%) | 175 (12.8%) |
| 30 to 34 Years | 37 (3.0%) | 87 (6.4%) |
| 35 to 39 Years | 39 (3.2%) | 73 (5.4%) |
| 40 to 44 Years | 70 (5.8%) | 86 (6.3%) |
| 45 to 49 Years | 47 (3.9%) | 69 (5.1%) |
| 50 to 54 Years | 46 (3.8%) | 49 (3.6%) |
| 55 to 59 Years | 45 (3.7%) | 84 (6.2%) |
| 60 to 64 Years | 62 (5.1%) | 61 (4.5%) |
| 65 to 69 Years | 81 (6.7%) | 79 (5.8%) |
| 70 to 74 Years | 49 (4.0%) | 30 (2.2%) |
| 75 to 79 Years | 55 (4.5%) | 64 (4.7%) |
| 80 to 84 Years | 0 (0.0%) | 22 (1.6%) |
| 85 Years and over | 6 (0.5%) | 25 (1.8%) |
| Total | 1,215 (100.0%) | 1,363 (100.0%) |
Families and Households in Escobares
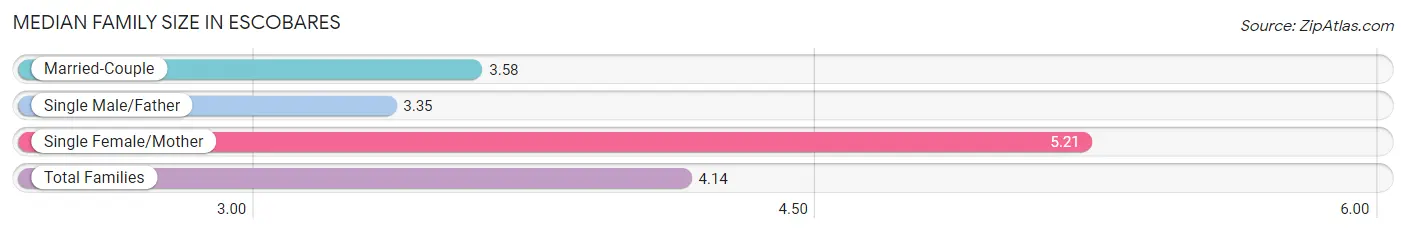
Median Family Size in Escobares
The median family size in Escobares is 4.14 persons per family, with single female/mother families (200 | 34.9%) accounting for the largest median family size of 5.21 persons per family. On the other hand, single male/father families (17 | 3.0%) represent the smallest median family size with 3.35 persons per family.
| Family Type | # Families | Family Size |
| Married-Couple | 356 (62.1%) | 3.58 |
| Single Male/Father | 17 (3.0%) | 3.35 |
| Single Female/Mother | 200 (34.9%) | 5.21 |
| Total Families | 573 (100.0%) | 4.14 |
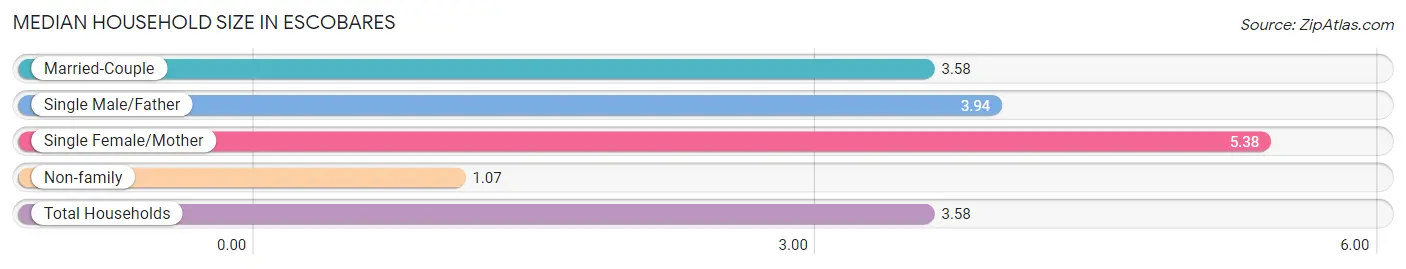
Median Household Size in Escobares
The median household size in Escobares is 3.58 persons per household, with single female/mother households (200 | 27.8%) accounting for the largest median household size of 5.38 persons per household. non-family households (147 | 20.4%) represent the smallest median household size with 1.07 persons per household.
| Household Type | # Households | Household Size |
| Married-Couple | 356 (49.4%) | 3.58 |
| Single Male/Father | 17 (2.4%) | 3.94 |
| Single Female/Mother | 200 (27.8%) | 5.38 |
| Non-family | 147 (20.4%) | 1.07 |
| Total Households | 720 (100.0%) | 3.58 |
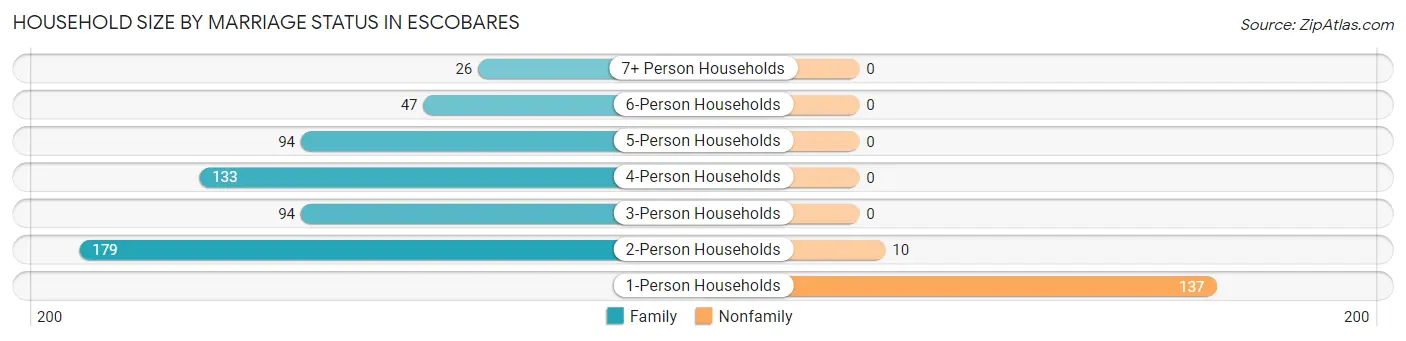
Household Size by Marriage Status in Escobares
Out of a total of 720 households in Escobares, 573 (79.6%) are family households, while 147 (20.4%) are nonfamily households. The most numerous type of family households are 2-person households, comprising 179, and the most common type of nonfamily households are 1-person households, comprising 137.
| Household Size | Family Households | Nonfamily Households |
| 1-Person Households | - | 137 (19.0%) |
| 2-Person Households | 179 (24.9%) | 10 (1.4%) |
| 3-Person Households | 94 (13.1%) | 0 (0.0%) |
| 4-Person Households | 133 (18.5%) | 0 (0.0%) |
| 5-Person Households | 94 (13.1%) | 0 (0.0%) |
| 6-Person Households | 47 (6.5%) | 0 (0.0%) |
| 7+ Person Households | 26 (3.6%) | 0 (0.0%) |
| Total | 573 (79.6%) | 147 (20.4%) |
Female Fertility in Escobares
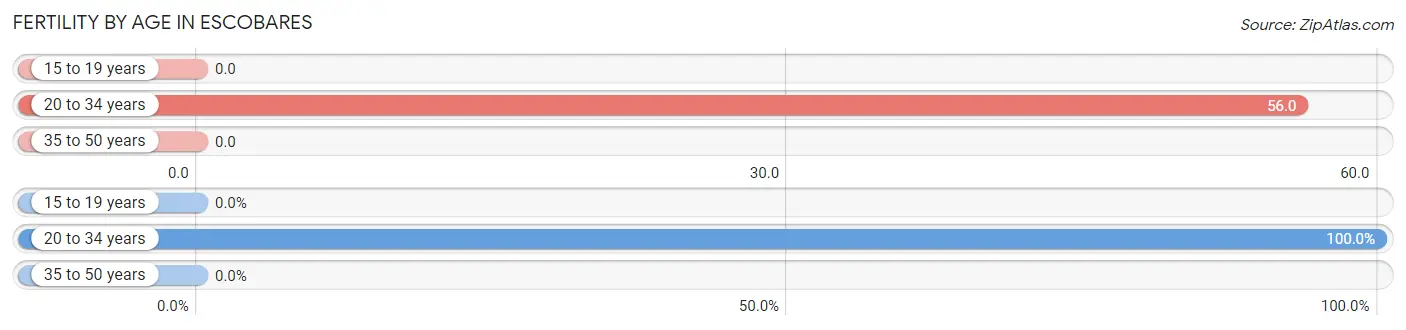
Fertility by Age in Escobares
Average fertility rate in Escobares is 29.0 births per 1,000 women. Women in the age bracket of 20 to 34 years have the highest fertility rate with 56.0 births per 1,000 women. Women in the age bracket of 20 to 34 years acount for 100.0% of all women with births.
| Age Bracket | Women with Births | Births / 1,000 Women |
| 15 to 19 years | 0 (0.0%) | 0.0 |
| 20 to 34 years | 20 (100.0%) | 56.0 |
| 35 to 50 years | 0 (0.0%) | 0.0 |
| Total | 20 (100.0%) | 29.0 |
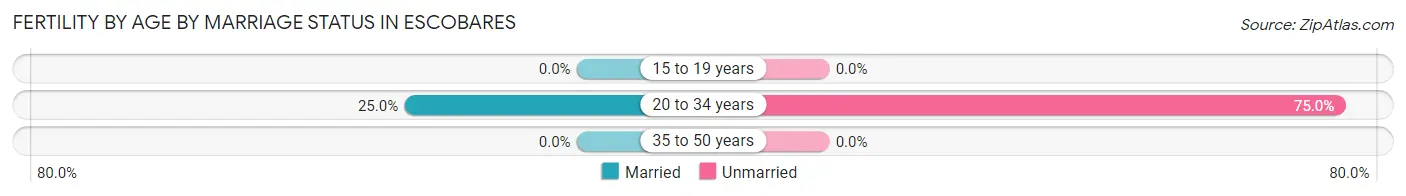
Fertility by Age by Marriage Status in Escobares
25.0% of women with births (20) in Escobares are married. The highest percentage of unmarried women with births falls into 20 to 34 years age bracket with 75.0% of them unmarried at the time of birth, while the lowest percentage of unmarried women with births belong to 20 to 34 years age bracket with 75.0% of them unmarried.
| Age Bracket | Married | Unmarried |
| 15 to 19 years | 0 (0.0%) | 0 (0.0%) |
| 20 to 34 years | 5 (25.0%) | 15 (75.0%) |
| 35 to 50 years | 0 (0.0%) | 0 (0.0%) |
| Total | 5 (25.0%) | 15 (75.0%) |
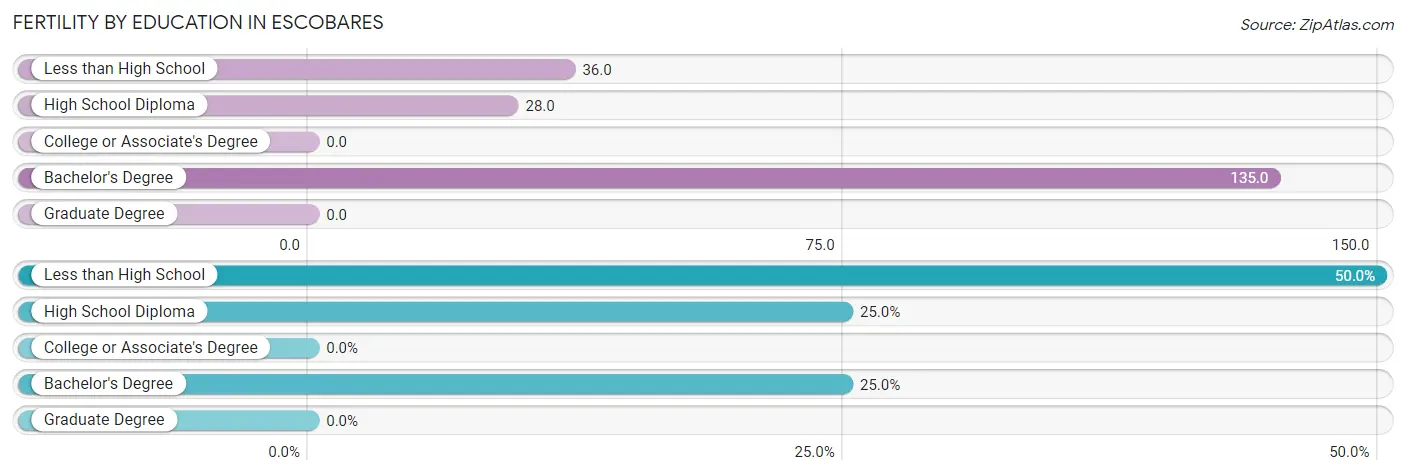
Fertility by Education in Escobares
| Educational Attainment | Women with Births | Births / 1,000 Women |
| Less than High School | 10 (50.0%) | 36.0 |
| High School Diploma | 5 (25.0%) | 28.0 |
| College or Associate's Degree | 0 (0.0%) | 0.0 |
| Bachelor's Degree | 5 (25.0%) | 135.0 |
| Graduate Degree | 0 (0.0%) | 0.0 |
| Total | 20 (100.0%) | 29.0 |
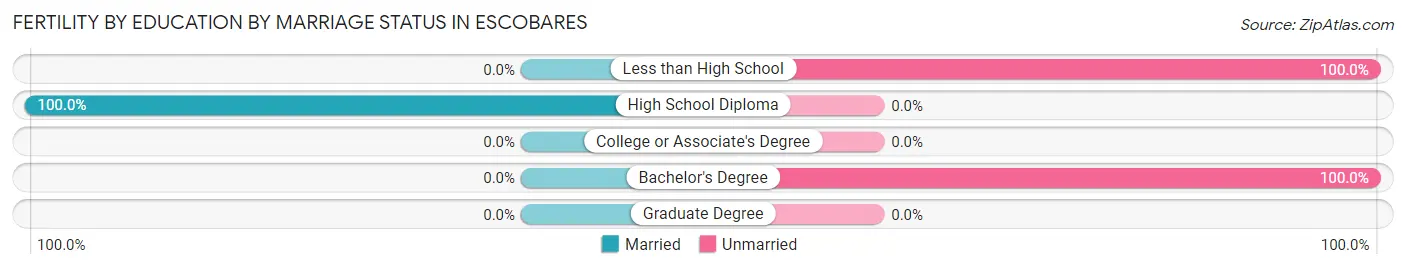
Fertility by Education by Marriage Status in Escobares
75.0% of women with births in Escobares are unmarried. Women with the educational attainment of high school diploma are most likely to be married with 100.0% of them married at childbirth, while women with the educational attainment of less than high school are least likely to be married with 100.0% of them unmarried at childbirth.
| Educational Attainment | Married | Unmarried |
| Less than High School | 0 (0.0%) | 10 (100.0%) |
| High School Diploma | 5 (100.0%) | 0 (0.0%) |
| College or Associate's Degree | 0 (0.0%) | 0 (0.0%) |
| Bachelor's Degree | 0 (0.0%) | 5 (100.0%) |
| Graduate Degree | 0 (0.0%) | 0 (0.0%) |
| Total | 5 (25.0%) | 15 (75.0%) |
Income in Escobares
Income Overview in Escobares
Per Capita Income in Escobares is $13,488, while median incomes of families and households are $30,938 and $29,141 respectively.
| Characteristic | Number | Measure |
| Per Capita Income | 2,578 | $13,488 |
| Median Family Income | 573 | $30,938 |
| Mean Family Income | 573 | $44,485 |
| Median Household Income | 720 | $29,141 |
| Mean Household Income | 720 | $43,572 |
| Income Deficit | 573 | $0 |
| Wage / Income Gap (%) | 2,578 | 3.58% |
| Wage / Income Gap ($) | 2,578 | 96.42¢ per $1 |
| Gini / Inequality Index | 2,578 | 0.48 |
Earnings by Sex in Escobares
Average Earnings in Escobares are $13,766, $13,977 for men and $13,477 for women, a difference of 3.6%.
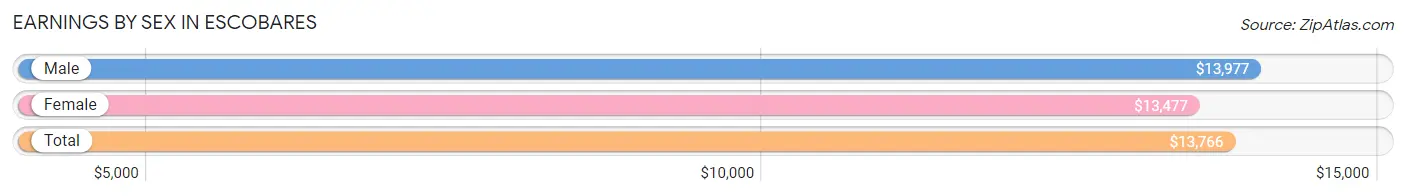
| Sex | Number | Average Earnings |
| Male | 506 (48.1%) | $13,977 |
| Female | 545 (51.9%) | $13,477 |
| Total | 1,051 (100.0%) | $13,766 |
Earnings by Sex by Income Bracket in Escobares
The most common earnings brackets in Escobares are $2,499 or less for men (60 | 11.9%) and $2,500 to $4,999 for women (103 | 18.9%).
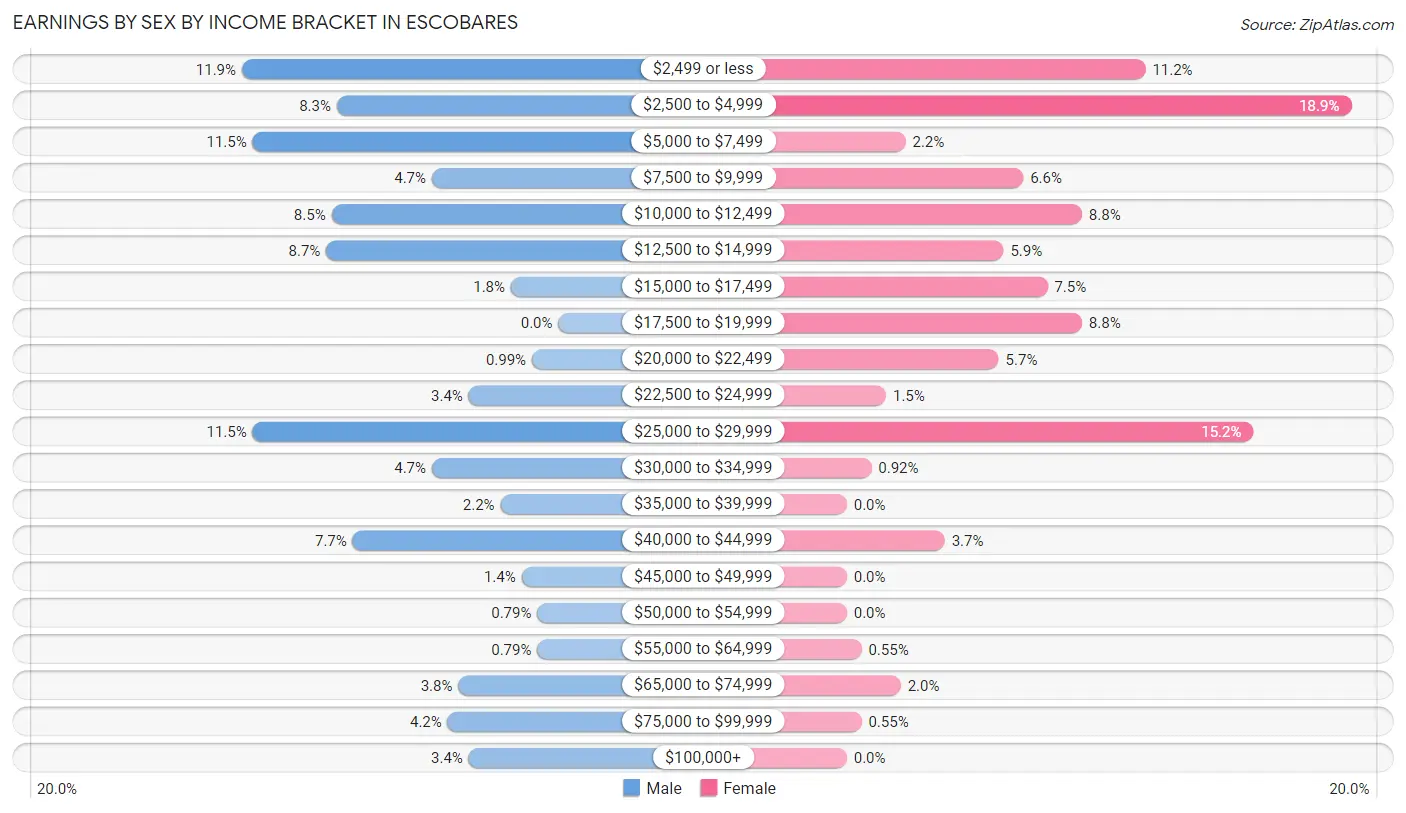
| Income | Male | Female |
| $2,499 or less | 60 (11.9%) | 61 (11.2%) |
| $2,500 to $4,999 | 42 (8.3%) | 103 (18.9%) |
| $5,000 to $7,499 | 58 (11.5%) | 12 (2.2%) |
| $7,500 to $9,999 | 24 (4.7%) | 36 (6.6%) |
| $10,000 to $12,499 | 43 (8.5%) | 48 (8.8%) |
| $12,500 to $14,999 | 44 (8.7%) | 32 (5.9%) |
| $15,000 to $17,499 | 9 (1.8%) | 41 (7.5%) |
| $17,500 to $19,999 | 0 (0.0%) | 48 (8.8%) |
| $20,000 to $22,499 | 5 (1.0%) | 31 (5.7%) |
| $22,500 to $24,999 | 17 (3.4%) | 8 (1.5%) |
| $25,000 to $29,999 | 58 (11.5%) | 83 (15.2%) |
| $30,000 to $34,999 | 24 (4.7%) | 5 (0.9%) |
| $35,000 to $39,999 | 11 (2.2%) | 0 (0.0%) |
| $40,000 to $44,999 | 39 (7.7%) | 20 (3.7%) |
| $45,000 to $49,999 | 7 (1.4%) | 0 (0.0%) |
| $50,000 to $54,999 | 4 (0.8%) | 0 (0.0%) |
| $55,000 to $64,999 | 4 (0.8%) | 3 (0.5%) |
| $65,000 to $74,999 | 19 (3.7%) | 11 (2.0%) |
| $75,000 to $99,999 | 21 (4.2%) | 3 (0.5%) |
| $100,000+ | 17 (3.4%) | 0 (0.0%) |
| Total | 506 (100.0%) | 545 (100.0%) |
Earnings by Sex by Educational Attainment in Escobares
Average earnings in Escobares are $22,868 for men and $14,023 for women, a difference of 38.7%. Men with an educational attainment of high school diploma enjoy the highest average annual earnings of $24,250, while those with less than high school education earn the least with $13,438. Women with an educational attainment of college or associate's degree earn the most with the average annual earnings of $19,042, while those with less than high school education have the smallest earnings of $12,196.
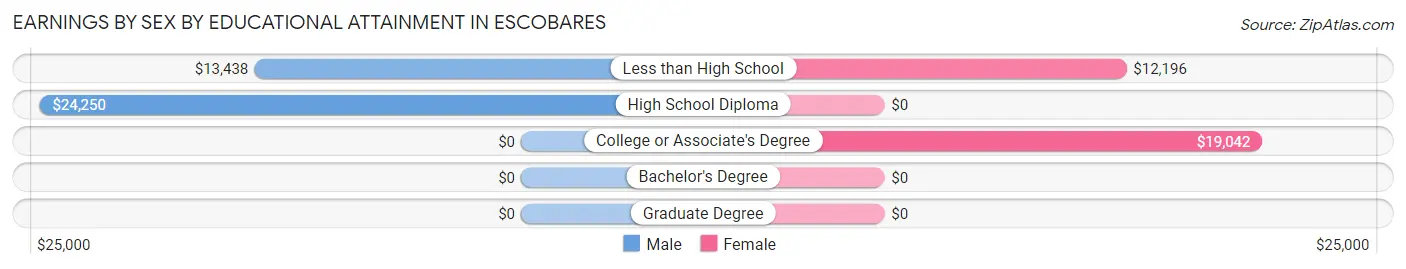
| Educational Attainment | Male Income | Female Income |
| Less than High School | $13,438 | $12,196 |
| High School Diploma | $24,250 | $0 |
| College or Associate's Degree | - | - |
| Bachelor's Degree | - | - |
| Graduate Degree | - | - |
| Total | $22,868 | $14,023 |
Family Income in Escobares
Family Income Brackets in Escobares
According to the Escobares family income data, there are 128 families falling into the $25,000 to $34,999 income range, which is the most common income bracket and makes up 22.3% of all families. Conversely, the $200,000+ income bracket is the least frequent group with only 1 families (0.2%) belonging to this category.
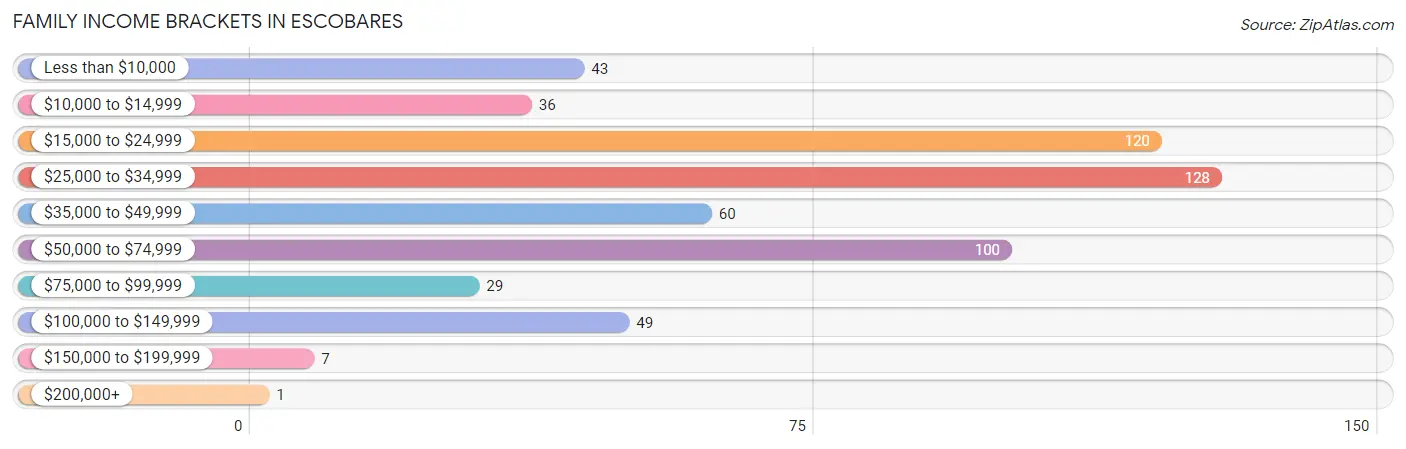
| Income Bracket | # Families | % Families |
| Less than $10,000 | 43 | 7.5% |
| $10,000 to $14,999 | 36 | 6.3% |
| $15,000 to $24,999 | 120 | 20.9% |
| $25,000 to $34,999 | 128 | 22.3% |
| $35,000 to $49,999 | 60 | 10.5% |
| $50,000 to $74,999 | 100 | 17.5% |
| $75,000 to $99,999 | 29 | 5.1% |
| $100,000 to $149,999 | 49 | 8.6% |
| $150,000 to $199,999 | 7 | 1.2% |
| $200,000+ | 1 | 0.2% |
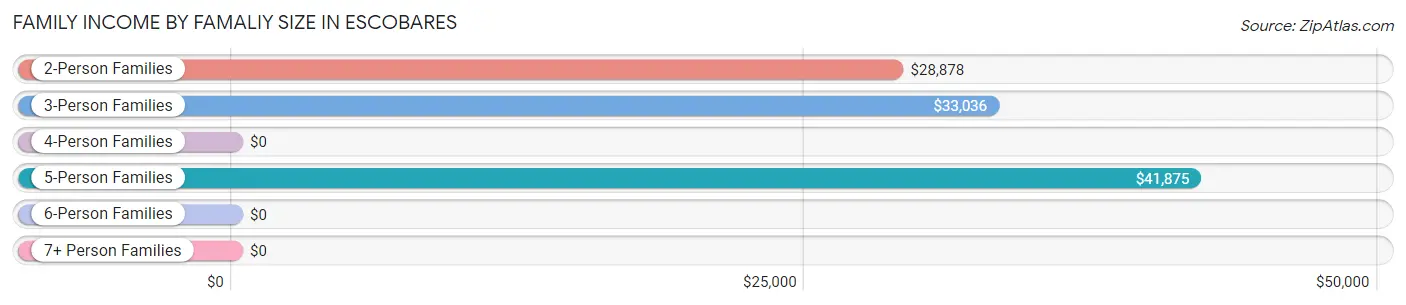
Family Income by Famaliy Size in Escobares
5-person families (81 | 14.1%) account for the highest median family income in Escobares with $41,875 per family, while 2-person families (182 | 31.8%) have the highest median income of $14,439 per family member.
| Income Bracket | # Families | Median Income |
| 2-Person Families | 182 (31.8%) | $28,878 |
| 3-Person Families | 130 (22.7%) | $33,036 |
| 4-Person Families | 107 (18.7%) | $0 |
| 5-Person Families | 81 (14.1%) | $41,875 |
| 6-Person Families | 47 (8.2%) | $0 |
| 7+ Person Families | 26 (4.5%) | $0 |
| Total | 573 (100.0%) | $30,938 |
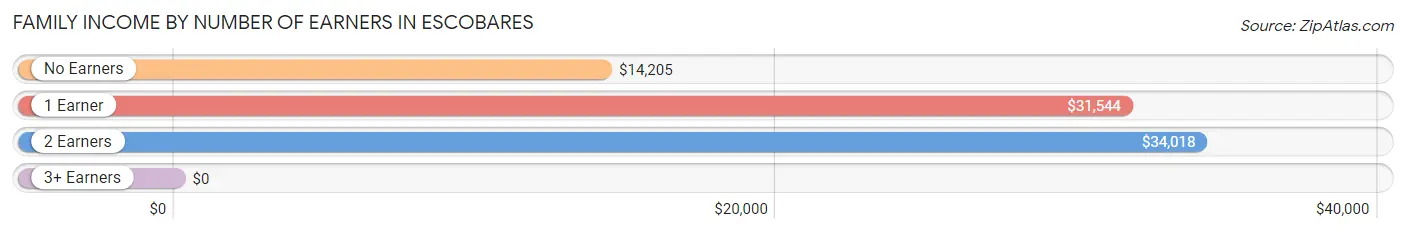
Family Income by Number of Earners in Escobares
| Number of Earners | # Families | Median Income |
| No Earners | 63 (11.0%) | $14,205 |
| 1 Earner | 236 (41.2%) | $31,544 |
| 2 Earners | 165 (28.8%) | $34,018 |
| 3+ Earners | 109 (19.0%) | $0 |
| Total | 573 (100.0%) | $30,938 |
Household Income in Escobares
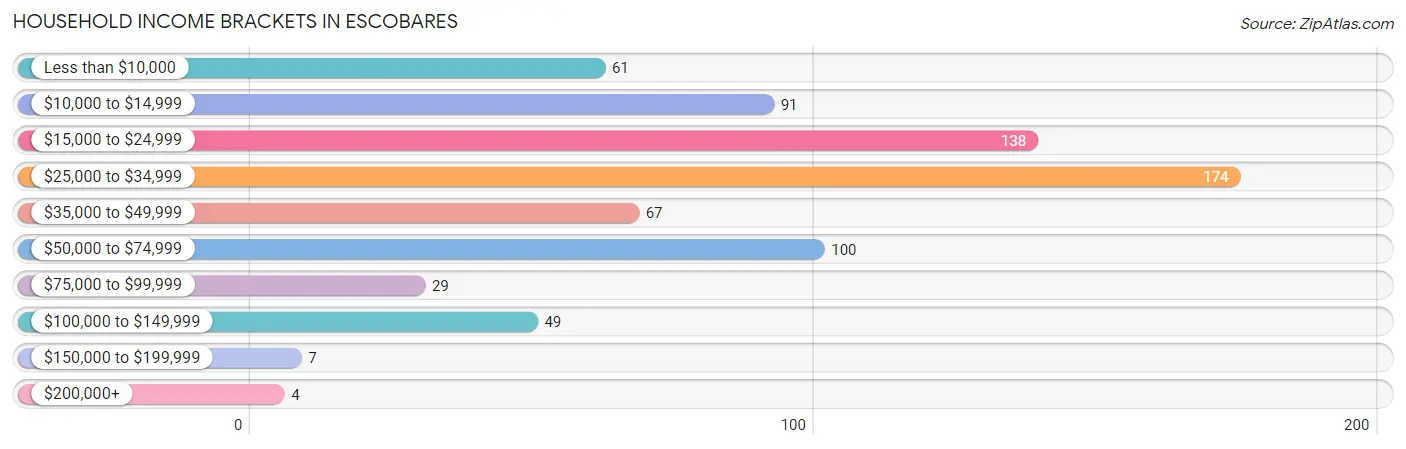
Household Income Brackets in Escobares
With 174 households falling in the category, the $25,000 to $34,999 income range is the most frequent in Escobares, accounting for 24.2% of all households. In contrast, only 4 households (0.6%) fall into the $200,000+ income bracket, making it the least populous group.
| Income Bracket | # Households | % Households |
| Less than $10,000 | 61 | 8.5% |
| $10,000 to $14,999 | 91 | 12.6% |
| $15,000 to $24,999 | 138 | 19.2% |
| $25,000 to $34,999 | 174 | 24.2% |
| $35,000 to $49,999 | 67 | 9.3% |
| $50,000 to $74,999 | 100 | 13.9% |
| $75,000 to $99,999 | 29 | 4.0% |
| $100,000 to $149,999 | 49 | 6.8% |
| $150,000 to $199,999 | 7 | 1.0% |
| $200,000+ | 4 | 0.6% |
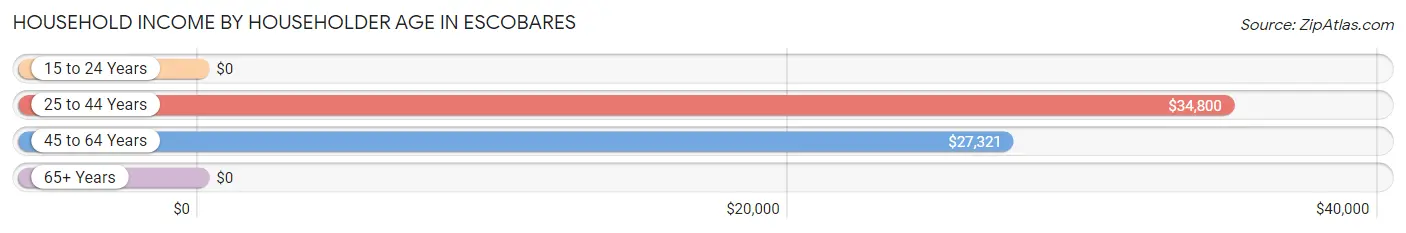
Household Income by Householder Age in Escobares
The median household income in Escobares is $29,141, with the highest median household income of $34,800 found in the 25 to 44 years age bracket for the primary householder. A total of 248 households (34.4%) fall into this category. Meanwhile, the 15 to 24 years age bracket for the primary householder has the lowest median household income of $0, with 28 households (3.9%) in this group.
| Income Bracket | # Households | Median Income |
| 15 to 24 Years | 28 (3.9%) | $0 |
| 25 to 44 Years | 248 (34.4%) | $34,800 |
| 45 to 64 Years | 255 (35.4%) | $27,321 |
| 65+ Years | 189 (26.3%) | $0 |
| Total | 720 (100.0%) | $29,141 |
Poverty in Escobares
Income Below Poverty by Sex and Age in Escobares
With 43.9% poverty level for males and 53.2% for females among the residents of Escobares, 5 year old males and 16 and 17 year old females are the most vulnerable to poverty, with 20 males (100.0%) and 14 females (100.0%) in their respective age groups living below the poverty level.
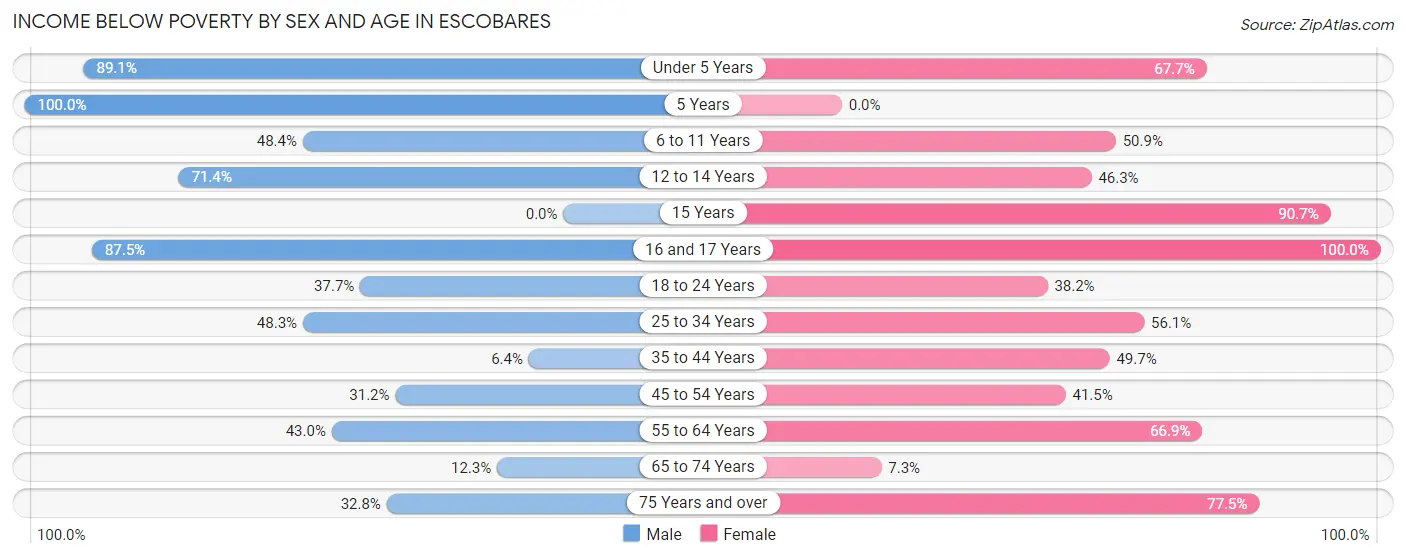
| Age Bracket | Male | Female |
| Under 5 Years | 122 (89.0%) | 88 (67.7%) |
| 5 Years | 20 (100.0%) | 0 (0.0%) |
| 6 to 11 Years | 103 (48.4%) | 30 (50.8%) |
| 12 to 14 Years | 40 (71.4%) | 38 (46.3%) |
| 15 Years | 0 (0.0%) | 39 (90.7%) |
| 16 and 17 Years | 14 (87.5%) | 14 (100.0%) |
| 18 to 24 Years | 43 (37.7%) | 50 (38.2%) |
| 25 to 34 Years | 73 (48.3%) | 147 (56.1%) |
| 35 to 44 Years | 7 (6.4%) | 79 (49.7%) |
| 45 to 54 Years | 29 (31.2%) | 49 (41.5%) |
| 55 to 64 Years | 46 (43.0%) | 97 (66.9%) |
| 65 to 74 Years | 16 (12.3%) | 8 (7.3%) |
| 75 Years and over | 20 (32.8%) | 86 (77.5%) |
| Total | 533 (43.9%) | 725 (53.2%) |
Income Above Poverty by Sex and Age in Escobares
According to the poverty statistics in Escobares, males aged 15 years and females aged 65 to 74 years are the age groups that are most secure financially, with 100.0% of males and 92.7% of females in these age groups living above the poverty line.
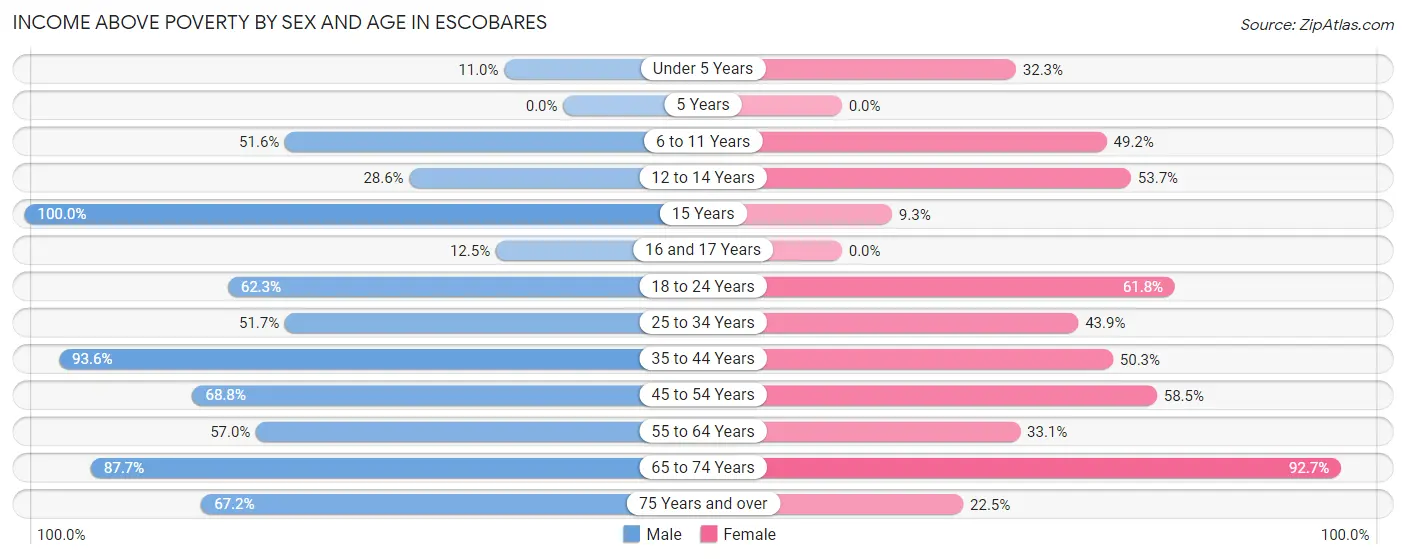
| Age Bracket | Male | Female |
| Under 5 Years | 15 (11.0%) | 42 (32.3%) |
| 5 Years | 0 (0.0%) | 0 (0.0%) |
| 6 to 11 Years | 110 (51.6%) | 29 (49.1%) |
| 12 to 14 Years | 16 (28.6%) | 44 (53.7%) |
| 15 Years | 8 (100.0%) | 4 (9.3%) |
| 16 and 17 Years | 2 (12.5%) | 0 (0.0%) |
| 18 to 24 Years | 71 (62.3%) | 81 (61.8%) |
| 25 to 34 Years | 78 (51.7%) | 115 (43.9%) |
| 35 to 44 Years | 102 (93.6%) | 80 (50.3%) |
| 45 to 54 Years | 64 (68.8%) | 69 (58.5%) |
| 55 to 64 Years | 61 (57.0%) | 48 (33.1%) |
| 65 to 74 Years | 114 (87.7%) | 101 (92.7%) |
| 75 Years and over | 41 (67.2%) | 25 (22.5%) |
| Total | 682 (56.1%) | 638 (46.8%) |
Income Below Poverty Among Married-Couple Families in Escobares
The poverty statistics for married-couple families in Escobares show that 26.4% or 94 of the total 356 families live below the poverty line. Families with 3 or 4 children have the highest poverty rate of 55.8%, comprising of 24 families. On the other hand, families with no children have the lowest poverty rate of 22.2%, which includes 51 families.
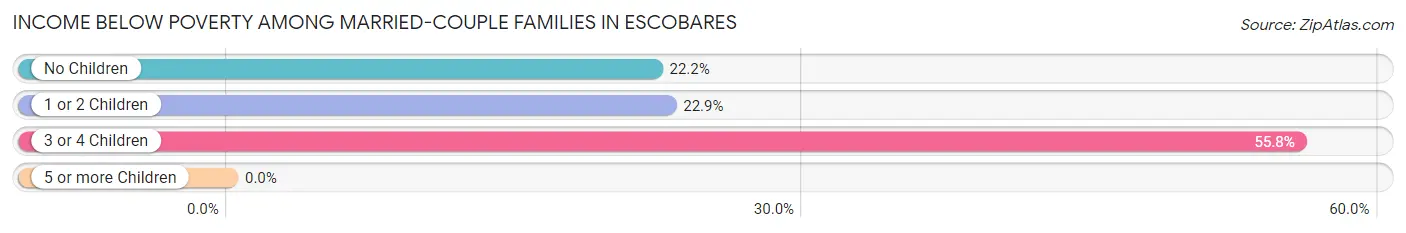
| Children | Above Poverty | Below Poverty |
| No Children | 179 (77.8%) | 51 (22.2%) |
| 1 or 2 Children | 64 (77.1%) | 19 (22.9%) |
| 3 or 4 Children | 19 (44.2%) | 24 (55.8%) |
| 5 or more Children | 0 (0.0%) | 0 (0.0%) |
| Total | 262 (73.6%) | 94 (26.4%) |
Income Below Poverty Among Single-Parent Households in Escobares
According to the poverty data in Escobares, 23.5% or 4 single-father households and 64.5% or 129 single-mother households are living below the poverty line. Among single-father households, those with no children have the highest poverty rate, with 4 households (100.0%) experiencing poverty. Likewise, among single-mother households, those with 5 or more children have the highest poverty rate, with 9 households (100.0%) falling below the poverty line.
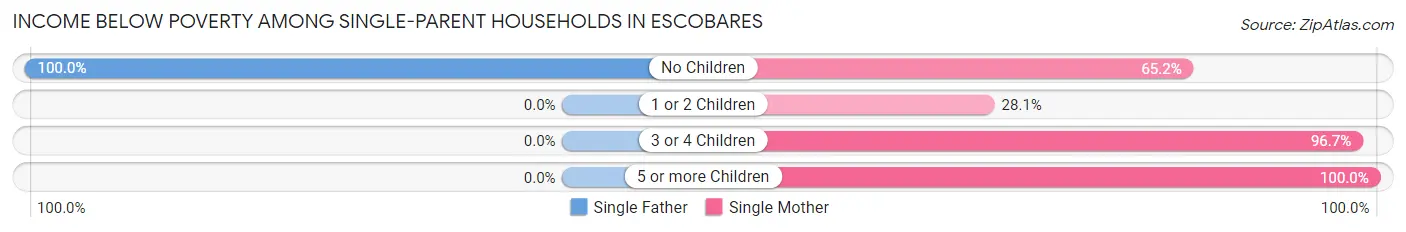
| Children | Single Father | Single Mother |
| No Children | 4 (100.0%) | 43 (65.1%) |
| 1 or 2 Children | 0 (0.0%) | 18 (28.1%) |
| 3 or 4 Children | 0 (0.0%) | 59 (96.7%) |
| 5 or more Children | 0 (0.0%) | 9 (100.0%) |
| Total | 4 (23.5%) | 129 (64.5%) |
Income Below Poverty Among Married-Couple vs Single-Parent Households in Escobares
The poverty data for Escobares shows that 94 of the married-couple family households (26.4%) and 133 of the single-parent households (61.3%) are living below the poverty level. Within the married-couple family households, those with 3 or 4 children have the highest poverty rate, with 24 households (55.8%) falling below the poverty line. Among the single-parent households, those with 5 or more children have the highest poverty rate, with 9 household (100.0%) living below poverty.
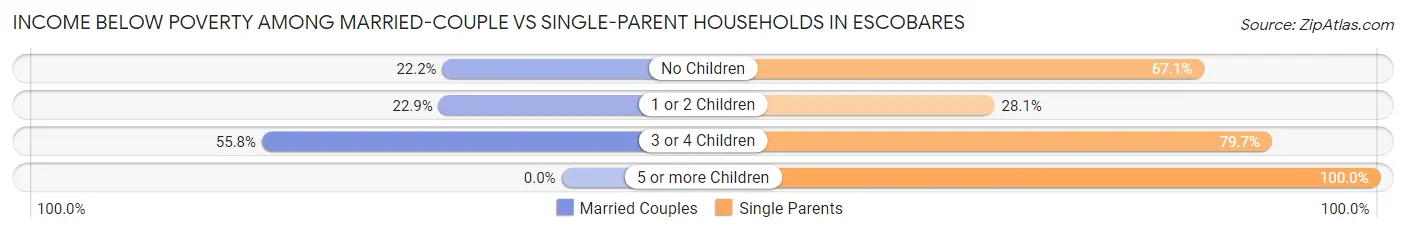
| Children | Married-Couple Families | Single-Parent Households |
| No Children | 51 (22.2%) | 47 (67.1%) |
| 1 or 2 Children | 19 (22.9%) | 18 (28.1%) |
| 3 or 4 Children | 24 (55.8%) | 59 (79.7%) |
| 5 or more Children | 0 (0.0%) | 9 (100.0%) |
| Total | 94 (26.4%) | 133 (61.3%) |
Employment Characteristics in Escobares
Employment by Class of Employer in Escobares
Among the 899 employed individuals in Escobares, private company employees (496 | 55.2%), self-employed (not incorporated) (141 | 15.7%), and local government employees (105 | 11.7%) make up the most common classes of employment.
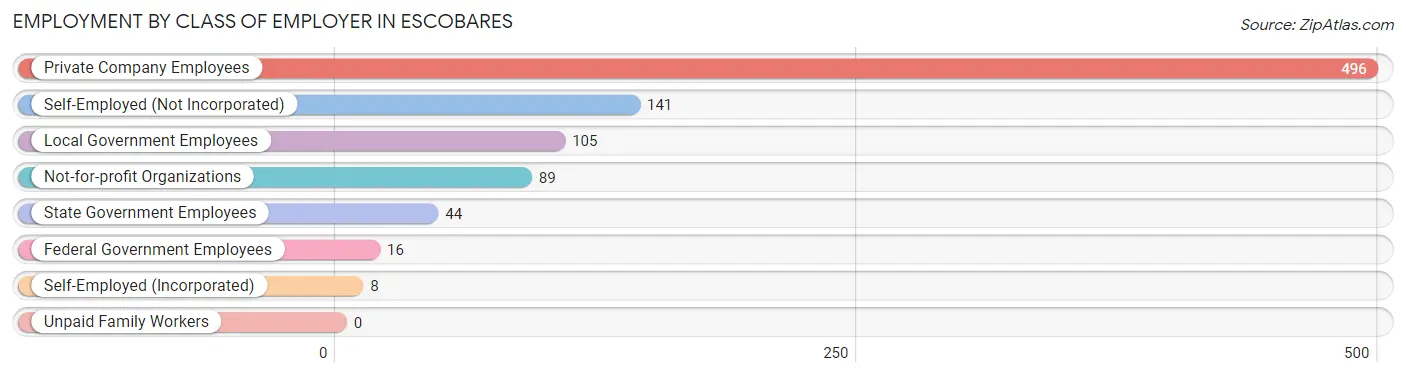
| Employer Class | # Employees | % Employees |
| Private Company Employees | 496 | 55.2% |
| Self-Employed (Incorporated) | 8 | 0.9% |
| Self-Employed (Not Incorporated) | 141 | 15.7% |
| Not-for-profit Organizations | 89 | 9.9% |
| Local Government Employees | 105 | 11.7% |
| State Government Employees | 44 | 4.9% |
| Federal Government Employees | 16 | 1.8% |
| Unpaid Family Workers | 0 | 0.0% |
| Total | 899 | 100.0% |
Employment Status by Age in Escobares
According to the labor force statistics for Escobares, out of the total population over 16 years of age (1,830), 55.6% or 1,017 individuals are in the labor force, with 9.9% or 101 of them unemployed. The age group with the highest labor force participation rate is 35 to 44 years, with 90.7% or 243 individuals in the labor force. Within the labor force, the 30 to 34 years age range has the highest percentage of unemployed individuals, with 33.7% or 33 of them being unemployed.
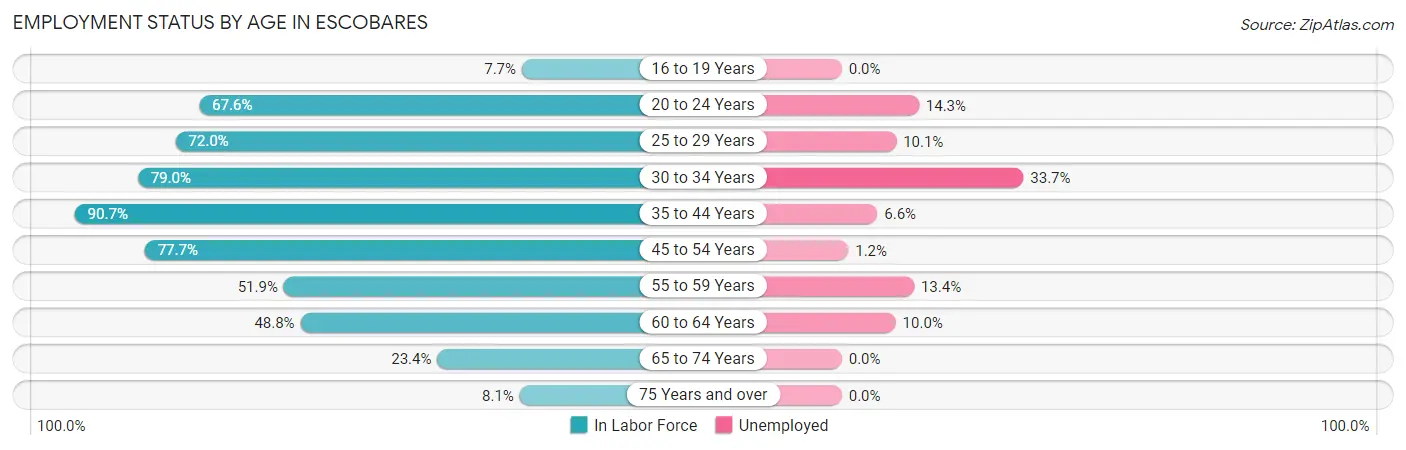
| Age Bracket | In Labor Force | Unemployed |
| 16 to 19 Years | 10 (7.7%) | 0 (0.0%) |
| 20 to 24 Years | 98 (67.6%) | 14 (14.3%) |
| 25 to 29 Years | 208 (72.0%) | 21 (10.1%) |
| 30 to 34 Years | 98 (79.0%) | 33 (33.7%) |
| 35 to 44 Years | 243 (90.7%) | 16 (6.6%) |
| 45 to 54 Years | 164 (77.7%) | 2 (1.2%) |
| 55 to 59 Years | 67 (51.9%) | 9 (13.4%) |
| 60 to 64 Years | 60 (48.8%) | 6 (10.0%) |
| 65 to 74 Years | 56 (23.4%) | 0 (0.0%) |
| 75 Years and over | 14 (8.1%) | 0 (0.0%) |
| Total | 1,017 (55.6%) | 101 (9.9%) |
Employment Status by Educational Attainment in Escobares
According to labor force statistics for Escobares, 73.4% of individuals (840) out of the total population between 25 and 64 years of age (1,144) are in the labor force, with 10.4% or 87 of them being unemployed. The group with the highest labor force participation rate are those with the educational attainment of bachelor's degree or higher, with 100.0% or 45 individuals in the labor force. Within the labor force, individuals with high school diploma education have the highest percentage of unemployment, with 13.8% or 37 of them being unemployed.
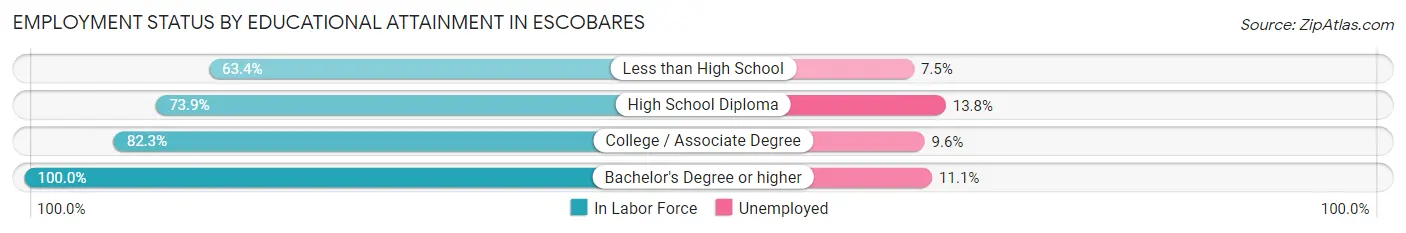
| Educational Attainment | In Labor Force | Unemployed |
| Less than High School | 265 (63.4%) | 31 (7.5%) |
| High School Diploma | 269 (73.9%) | 50 (13.8%) |
| College / Associate Degree | 261 (82.3%) | 30 (9.6%) |
| Bachelor's Degree or higher | 45 (100.0%) | 5 (11.1%) |
| Total | 840 (73.4%) | 119 (10.4%) |
Employment Occupations by Sex in Escobares
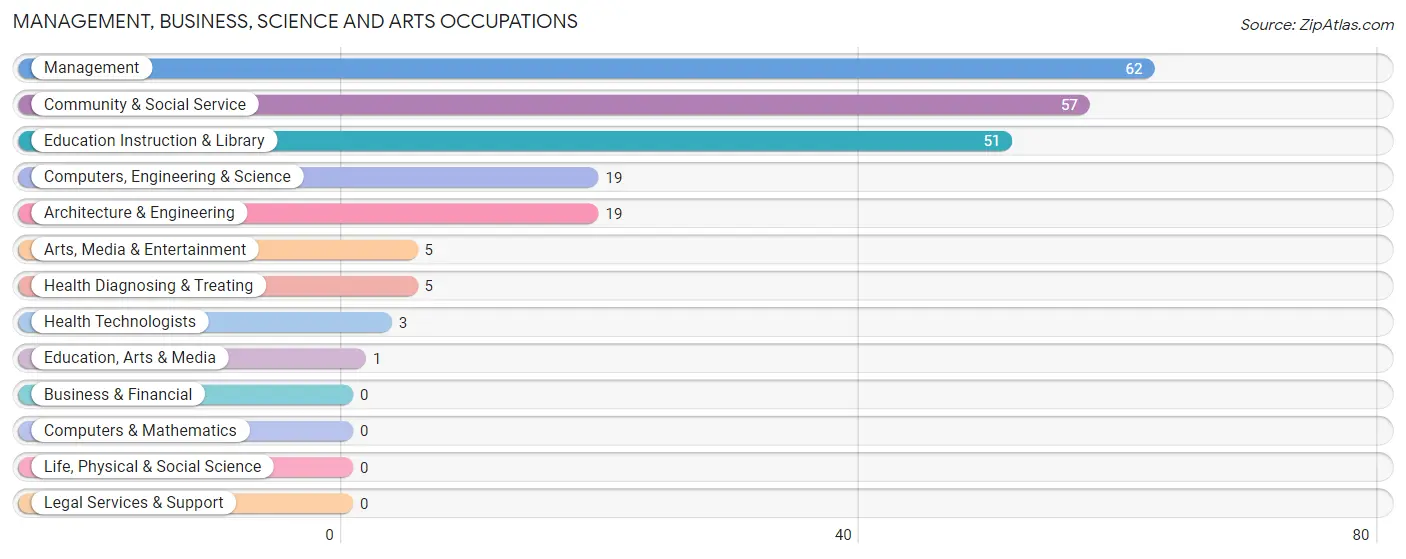
Management, Business, Science and Arts Occupations
The most common Management, Business, Science and Arts occupations in Escobares are Management (62 | 6.8%), Community & Social Service (57 | 6.2%), Education Instruction & Library (51 | 5.6%), Computers, Engineering & Science (19 | 2.1%), and Architecture & Engineering (19 | 2.1%).
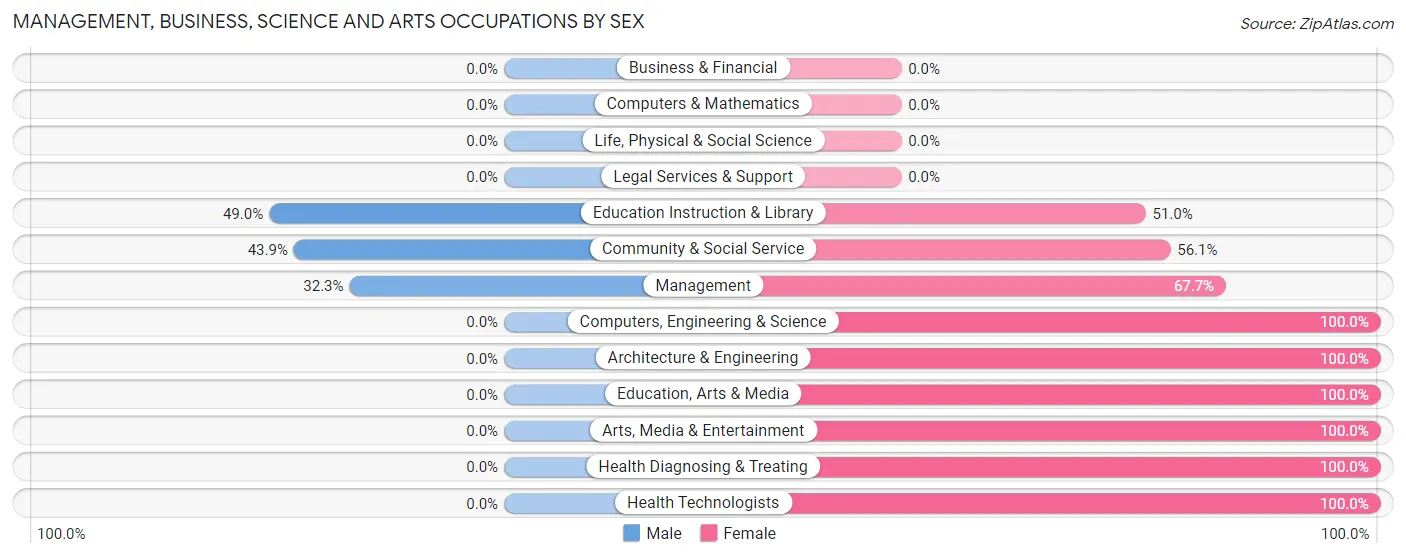
Management, Business, Science and Arts Occupations by Sex
Within the Management, Business, Science and Arts occupations in Escobares, the most male-oriented occupations are Education Instruction & Library (49.0%), Community & Social Service (43.9%), and Management (32.3%), while the most female-oriented occupations are Computers, Engineering & Science (100.0%), Architecture & Engineering (100.0%), and Education, Arts & Media (100.0%).
| Occupation | Male | Female |
| Management | 20 (32.3%) | 42 (67.7%) |
| Business & Financial | 0 (0.0%) | 0 (0.0%) |
| Computers, Engineering & Science | 0 (0.0%) | 19 (100.0%) |
| Computers & Mathematics | 0 (0.0%) | 0 (0.0%) |
| Architecture & Engineering | 0 (0.0%) | 19 (100.0%) |
| Life, Physical & Social Science | 0 (0.0%) | 0 (0.0%) |
| Community & Social Service | 25 (43.9%) | 32 (56.1%) |
| Education, Arts & Media | 0 (0.0%) | 1 (100.0%) |
| Legal Services & Support | 0 (0.0%) | 0 (0.0%) |
| Education Instruction & Library | 25 (49.0%) | 26 (51.0%) |
| Arts, Media & Entertainment | 0 (0.0%) | 5 (100.0%) |
| Health Diagnosing & Treating | 0 (0.0%) | 5 (100.0%) |
| Health Technologists | 0 (0.0%) | 3 (100.0%) |
| Total (Category) | 45 (31.5%) | 98 (68.5%) |
| Total (Overall) | 458 (49.9%) | 459 (50.0%) |
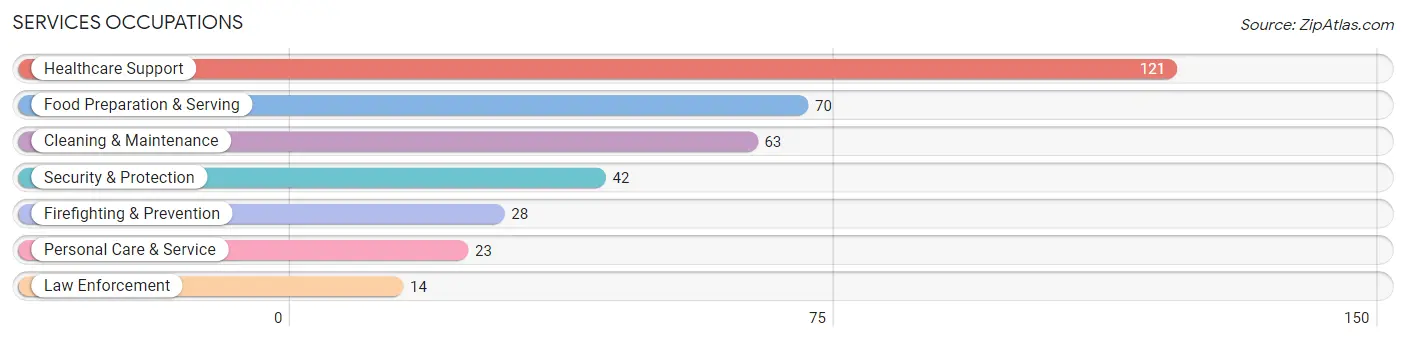
Services Occupations
The most common Services occupations in Escobares are Healthcare Support (121 | 13.2%), Food Preparation & Serving (70 | 7.6%), Cleaning & Maintenance (63 | 6.9%), Security & Protection (42 | 4.6%), and Firefighting & Prevention (28 | 3.0%).
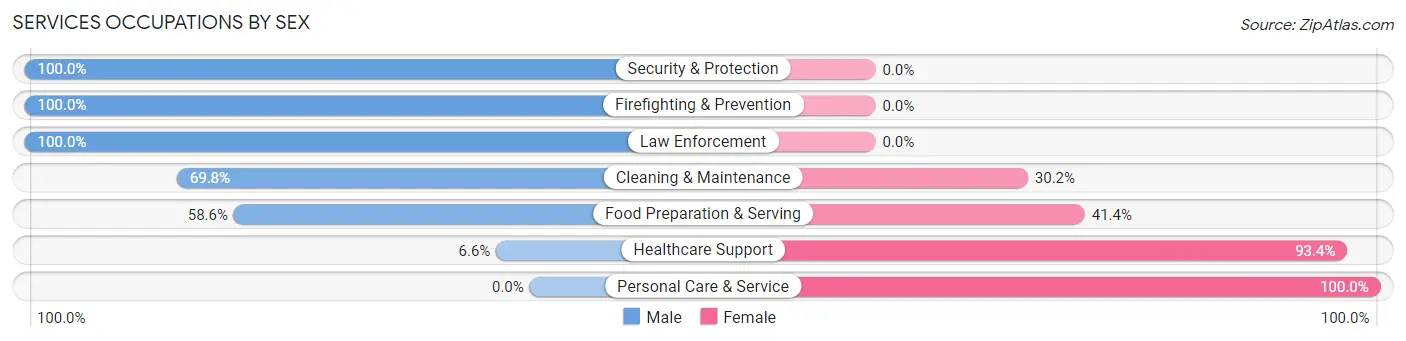
Services Occupations by Sex
Within the Services occupations in Escobares, the most male-oriented occupations are Security & Protection (100.0%), Firefighting & Prevention (100.0%), and Law Enforcement (100.0%), while the most female-oriented occupations are Personal Care & Service (100.0%), Healthcare Support (93.4%), and Food Preparation & Serving (41.4%).
| Occupation | Male | Female |
| Healthcare Support | 8 (6.6%) | 113 (93.4%) |
| Security & Protection | 42 (100.0%) | 0 (0.0%) |
| Firefighting & Prevention | 28 (100.0%) | 0 (0.0%) |
| Law Enforcement | 14 (100.0%) | 0 (0.0%) |
| Food Preparation & Serving | 41 (58.6%) | 29 (41.4%) |
| Cleaning & Maintenance | 44 (69.8%) | 19 (30.2%) |
| Personal Care & Service | 0 (0.0%) | 23 (100.0%) |
| Total (Category) | 135 (42.3%) | 184 (57.7%) |
| Total (Overall) | 458 (49.9%) | 459 (50.0%) |
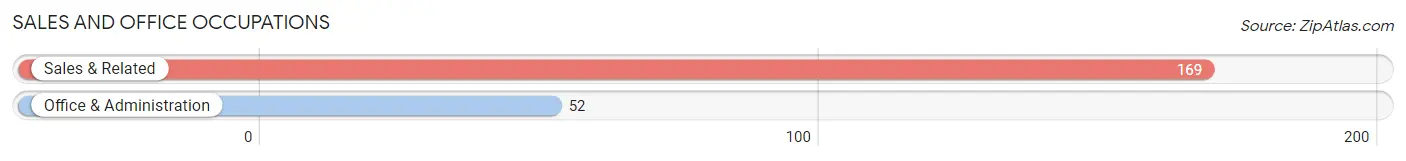
Sales and Office Occupations
The most common Sales and Office occupations in Escobares are Sales & Related (169 | 18.4%), and Office & Administration (52 | 5.7%).
Sales and Office Occupations by Sex
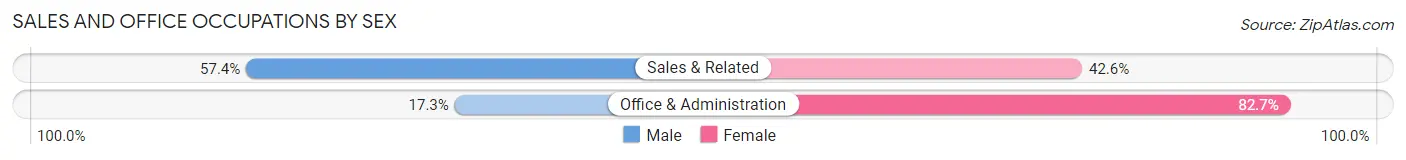
| Occupation | Male | Female |
| Sales & Related | 97 (57.4%) | 72 (42.6%) |
| Office & Administration | 9 (17.3%) | 43 (82.7%) |
| Total (Category) | 106 (48.0%) | 115 (52.0%) |
| Total (Overall) | 458 (49.9%) | 459 (50.0%) |
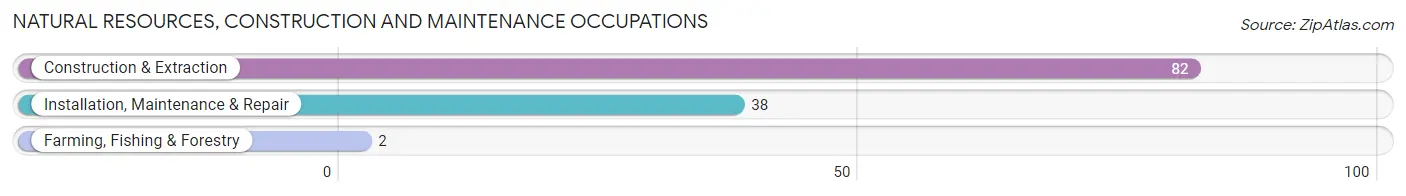
Natural Resources, Construction and Maintenance Occupations
The most common Natural Resources, Construction and Maintenance occupations in Escobares are Construction & Extraction (82 | 8.9%), Installation, Maintenance & Repair (38 | 4.1%), and Farming, Fishing & Forestry (2 | 0.2%).
Natural Resources, Construction and Maintenance Occupations by Sex
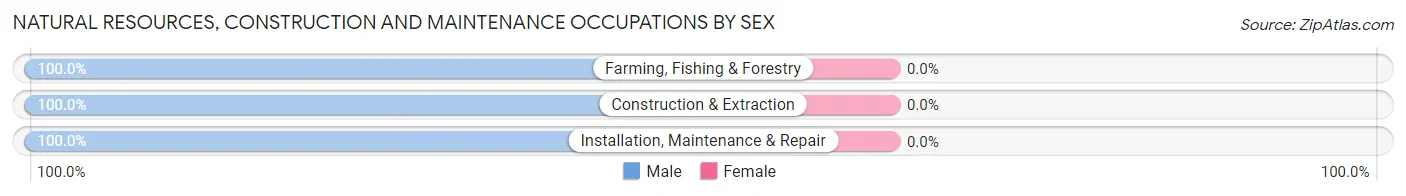
| Occupation | Male | Female |
| Farming, Fishing & Forestry | 2 (100.0%) | 0 (0.0%) |
| Construction & Extraction | 82 (100.0%) | 0 (0.0%) |
| Installation, Maintenance & Repair | 38 (100.0%) | 0 (0.0%) |
| Total (Category) | 122 (100.0%) | 0 (0.0%) |
| Total (Overall) | 458 (49.9%) | 459 (50.0%) |
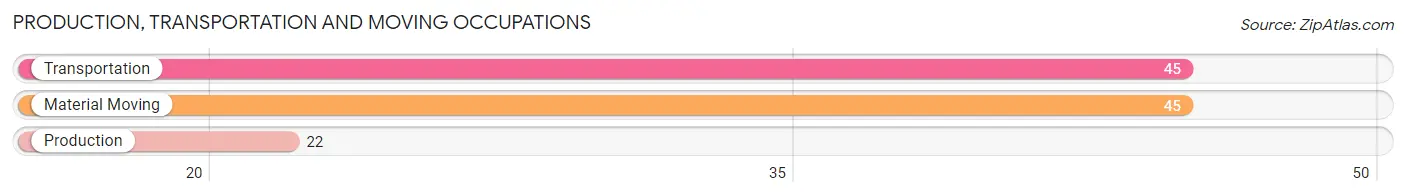
Production, Transportation and Moving Occupations
The most common Production, Transportation and Moving occupations in Escobares are Transportation (45 | 4.9%), Material Moving (45 | 4.9%), and Production (22 | 2.4%).
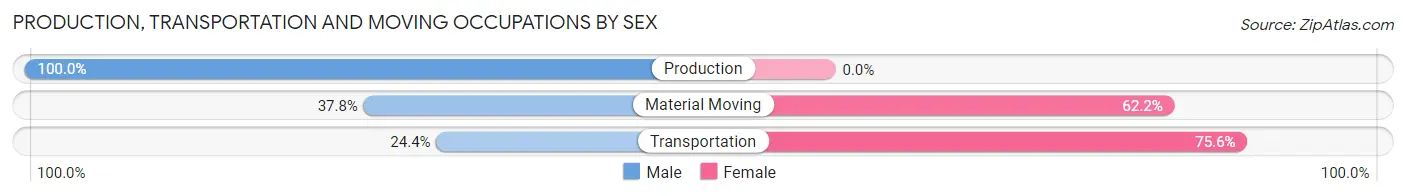
Production, Transportation and Moving Occupations by Sex
| Occupation | Male | Female |
| Production | 22 (100.0%) | 0 (0.0%) |
| Transportation | 11 (24.4%) | 34 (75.6%) |
| Material Moving | 17 (37.8%) | 28 (62.2%) |
| Total (Category) | 50 (44.6%) | 62 (55.4%) |
| Total (Overall) | 458 (49.9%) | 459 (50.0%) |
Employment Industries by Sex in Escobares
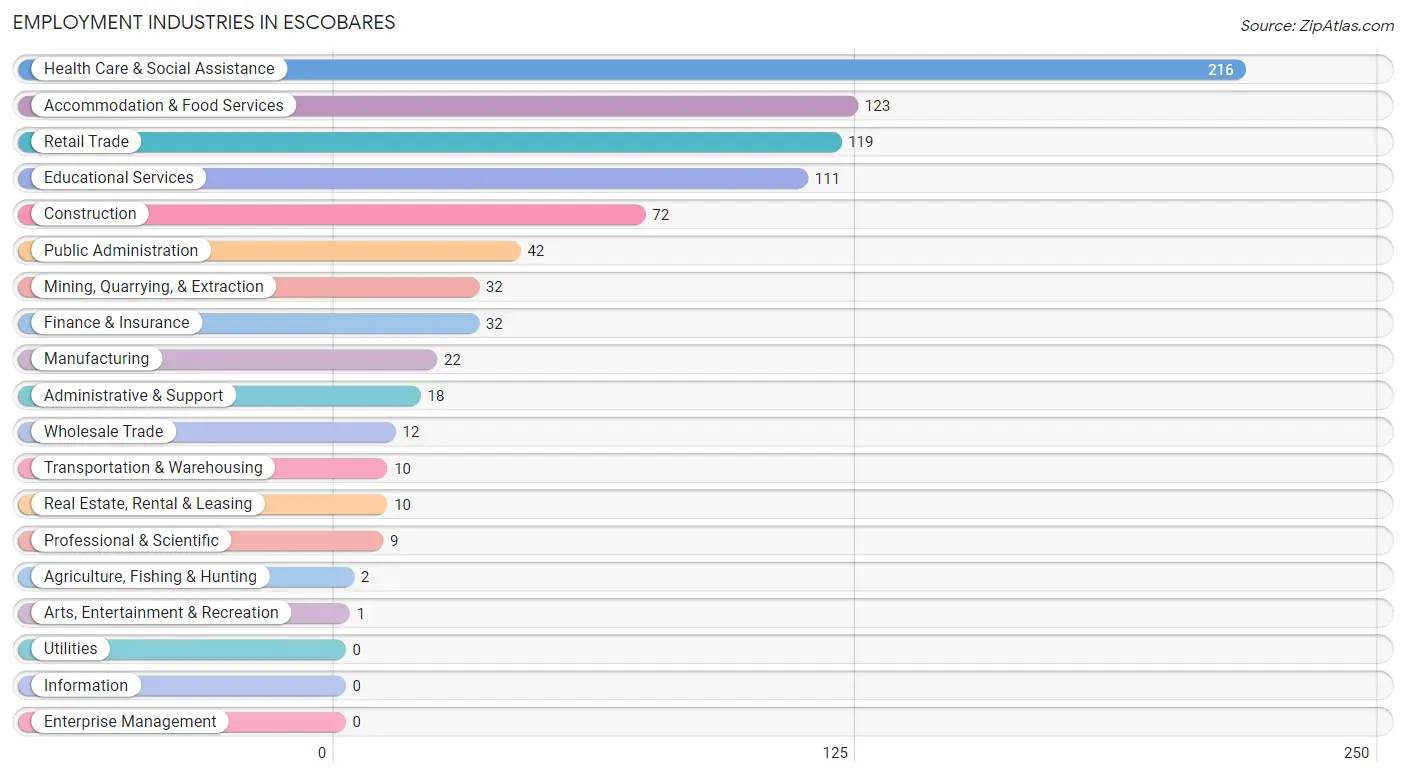
Employment Industries in Escobares
The major employment industries in Escobares include Health Care & Social Assistance (216 | 23.6%), Accommodation & Food Services (123 | 13.4%), Retail Trade (119 | 13.0%), Educational Services (111 | 12.1%), and Construction (72 | 7.9%).
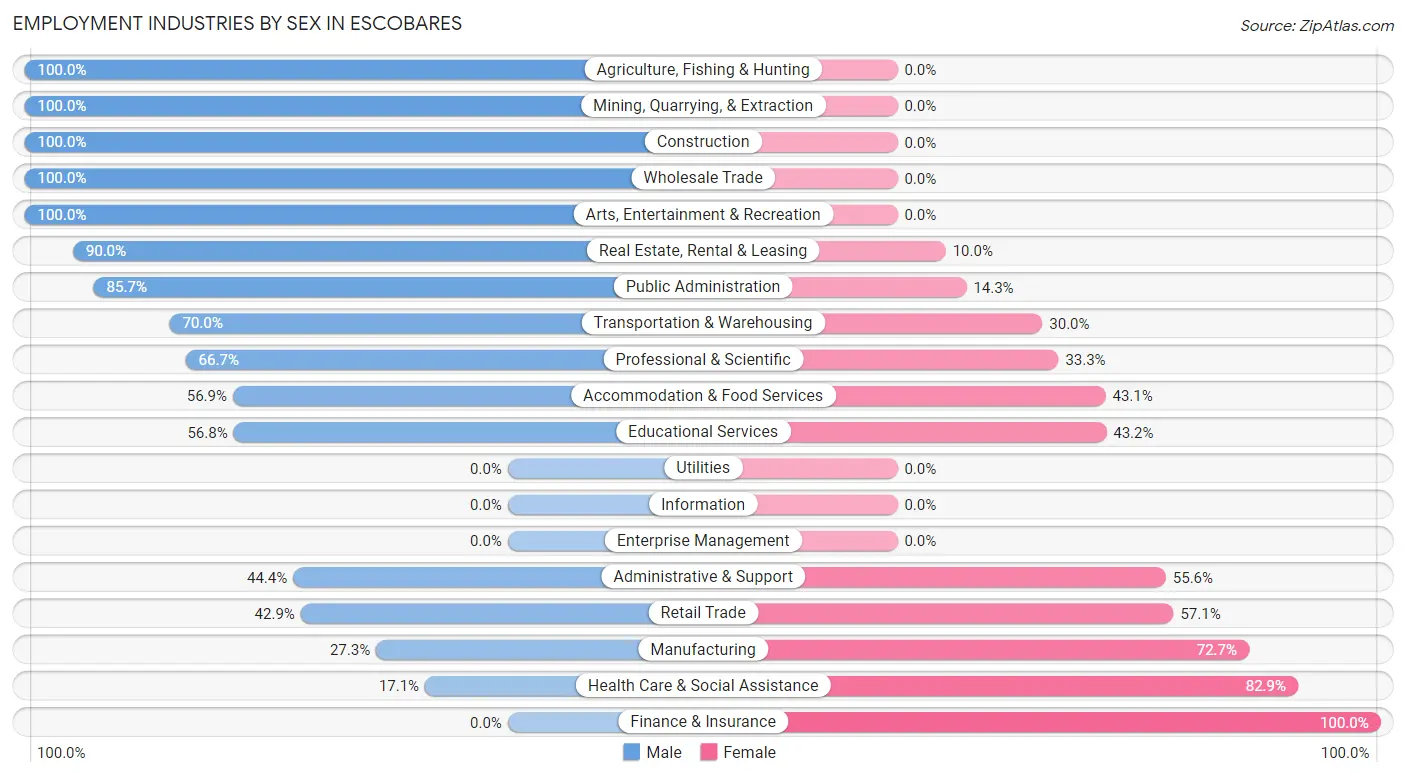
Employment Industries by Sex in Escobares
The Escobares industries that see more men than women are Agriculture, Fishing & Hunting (100.0%), Mining, Quarrying, & Extraction (100.0%), and Construction (100.0%), whereas the industries that tend to have a higher number of women are Finance & Insurance (100.0%), Health Care & Social Assistance (82.9%), and Manufacturing (72.7%).
| Industry | Male | Female |
| Agriculture, Fishing & Hunting | 2 (100.0%) | 0 (0.0%) |
| Mining, Quarrying, & Extraction | 32 (100.0%) | 0 (0.0%) |
| Construction | 72 (100.0%) | 0 (0.0%) |
| Manufacturing | 6 (27.3%) | 16 (72.7%) |
| Wholesale Trade | 12 (100.0%) | 0 (0.0%) |
| Retail Trade | 51 (42.9%) | 68 (57.1%) |
| Transportation & Warehousing | 7 (70.0%) | 3 (30.0%) |
| Utilities | 0 (0.0%) | 0 (0.0%) |
| Information | 0 (0.0%) | 0 (0.0%) |
| Finance & Insurance | 0 (0.0%) | 32 (100.0%) |
| Real Estate, Rental & Leasing | 9 (90.0%) | 1 (10.0%) |
| Professional & Scientific | 6 (66.7%) | 3 (33.3%) |
| Enterprise Management | 0 (0.0%) | 0 (0.0%) |
| Administrative & Support | 8 (44.4%) | 10 (55.6%) |
| Educational Services | 63 (56.8%) | 48 (43.2%) |
| Health Care & Social Assistance | 37 (17.1%) | 179 (82.9%) |
| Arts, Entertainment & Recreation | 1 (100.0%) | 0 (0.0%) |
| Accommodation & Food Services | 70 (56.9%) | 53 (43.1%) |
| Public Administration | 36 (85.7%) | 6 (14.3%) |
| Total | 458 (49.9%) | 459 (50.0%) |
Education in Escobares
School Enrollment in Escobares
The most common levels of schooling among the 814 students in Escobares are middle school (224 | 27.5%), high school (189 | 23.2%), and elementary school (133 | 16.3%).
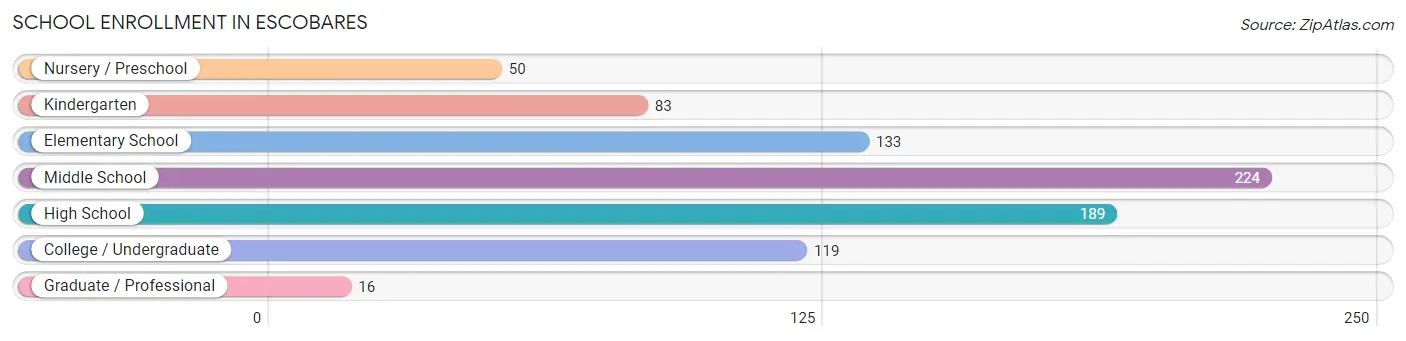
| School Level | # Students | % Students |
| Nursery / Preschool | 50 | 6.1% |
| Kindergarten | 83 | 10.2% |
| Elementary School | 133 | 16.3% |
| Middle School | 224 | 27.5% |
| High School | 189 | 23.2% |
| College / Undergraduate | 119 | 14.6% |
| Graduate / Professional | 16 | 2.0% |
| Total | 814 | 100.0% |
School Enrollment by Age by Funding Source in Escobares
Out of a total of 814 students who are enrolled in schools in Escobares, 8 (1.0%) attend a private institution, while the remaining 806 (99.0%) are enrolled in public schools. The age group of 15 to 17 year olds has the highest likelihood of being enrolled in private schools, with 8 (9.9% in the age bracket) enrolled. Conversely, the age group of 3 to 4 year olds has the lowest likelihood of being enrolled in a private school, with 66 (100.0% in the age bracket) attending a public institution.
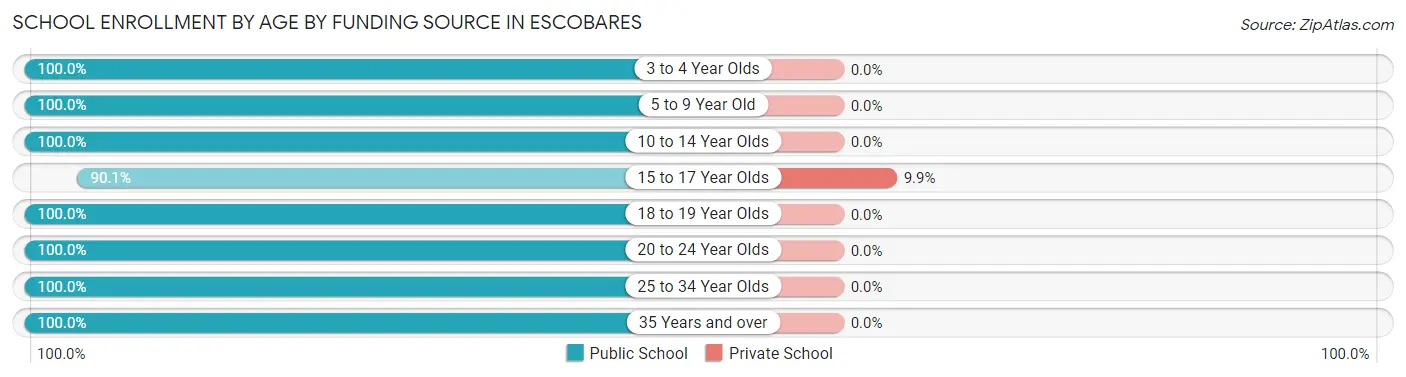
| Age Bracket | Public School | Private School |
| 3 to 4 Year Olds | 66 (100.0%) | 0 (0.0%) |
| 5 to 9 Year Old | 161 (100.0%) | 0 (0.0%) |
| 10 to 14 Year Olds | 263 (100.0%) | 0 (0.0%) |
| 15 to 17 Year Olds | 73 (90.1%) | 8 (9.9%) |
| 18 to 19 Year Olds | 100 (100.0%) | 0 (0.0%) |
| 20 to 24 Year Olds | 58 (100.0%) | 0 (0.0%) |
| 25 to 34 Year Olds | 45 (100.0%) | 0 (0.0%) |
| 35 Years and over | 40 (100.0%) | 0 (0.0%) |
| Total | 806 (99.0%) | 8 (1.0%) |
Educational Attainment by Field of Study in Escobares
Education (27 | 50.9%), literature & languages (10 | 18.9%), communications (4 | 7.5%), social sciences (3 | 5.7%), and engineering (3 | 5.7%) are the most common fields of study among 53 individuals in Escobares who have obtained a bachelor's degree or higher.
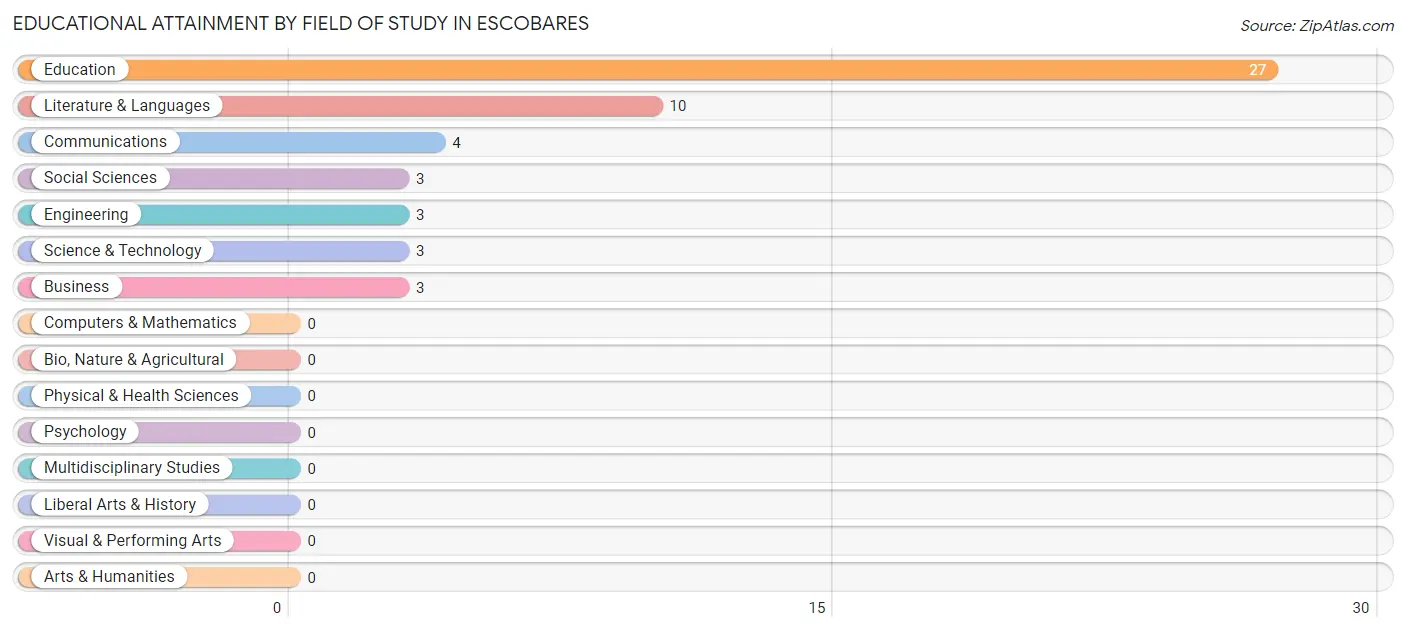
| Field of Study | # Graduates | % Graduates |
| Computers & Mathematics | 0 | 0.0% |
| Bio, Nature & Agricultural | 0 | 0.0% |
| Physical & Health Sciences | 0 | 0.0% |
| Psychology | 0 | 0.0% |
| Social Sciences | 3 | 5.7% |
| Engineering | 3 | 5.7% |
| Multidisciplinary Studies | 0 | 0.0% |
| Science & Technology | 3 | 5.7% |
| Business | 3 | 5.7% |
| Education | 27 | 50.9% |
| Literature & Languages | 10 | 18.9% |
| Liberal Arts & History | 0 | 0.0% |
| Visual & Performing Arts | 0 | 0.0% |
| Communications | 4 | 7.5% |
| Arts & Humanities | 0 | 0.0% |
| Total | 53 | 100.0% |
Transportation & Commute in Escobares
Vehicle Availability by Sex in Escobares
The most prevalent vehicle ownership categories in Escobares are males with 2 vehicles (220, accounting for 49.4%) and females with 2 vehicles (157, making up 48.8%).
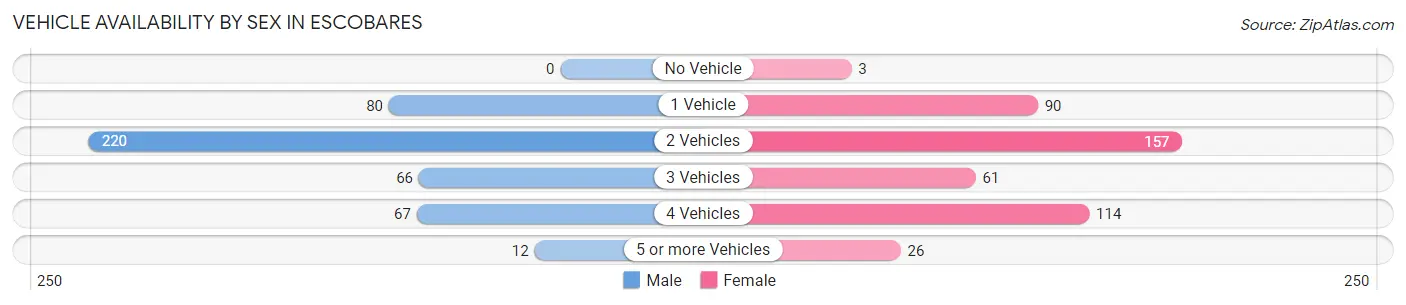
| Vehicles Available | Male | Female |
| No Vehicle | 0 (0.0%) | 3 (0.7%) |
| 1 Vehicle | 80 (18.0%) | 90 (20.0%) |
| 2 Vehicles | 220 (49.4%) | 157 (34.8%) |
| 3 Vehicles | 66 (14.8%) | 61 (13.5%) |
| 4 Vehicles | 67 (15.1%) | 114 (25.3%) |
| 5 or more Vehicles | 12 (2.7%) | 26 (5.8%) |
| Total | 445 (100.0%) | 451 (100.0%) |
Commute Time in Escobares
The most frequently occuring commute durations in Escobares are 10 to 14 minutes (188 commuters, 22.7%), 5 to 9 minutes (133 commuters, 16.1%), and less than 5 minutes (111 commuters, 13.4%).
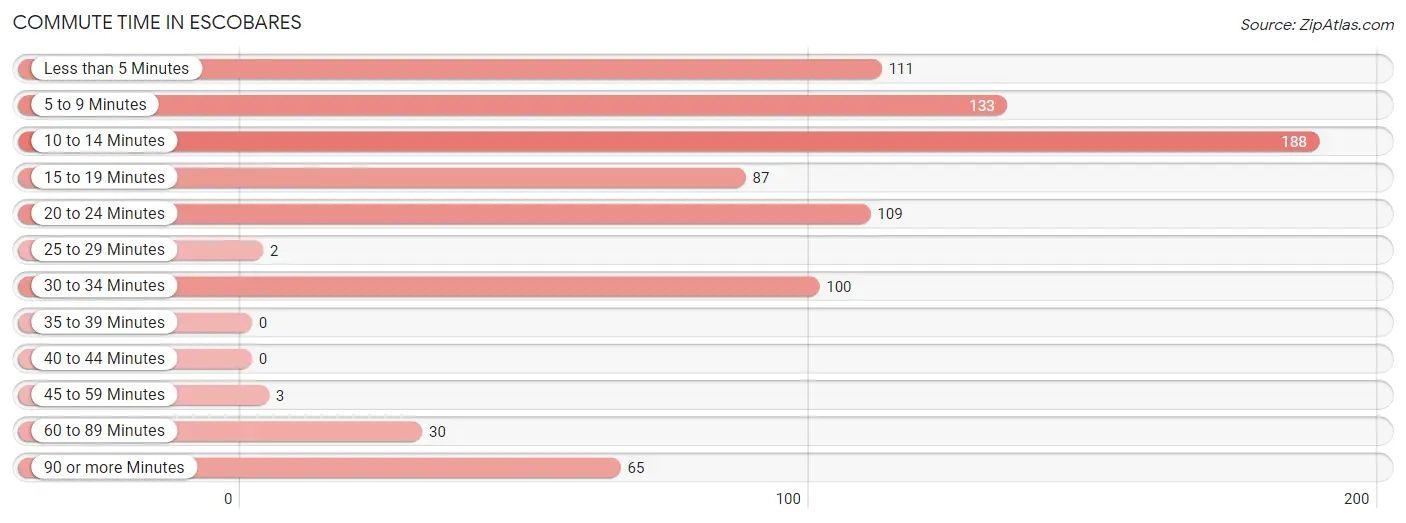
| Commute Time | # Commuters | % Commuters |
| Less than 5 Minutes | 111 | 13.4% |
| 5 to 9 Minutes | 133 | 16.1% |
| 10 to 14 Minutes | 188 | 22.7% |
| 15 to 19 Minutes | 87 | 10.5% |
| 20 to 24 Minutes | 109 | 13.2% |
| 25 to 29 Minutes | 2 | 0.2% |
| 30 to 34 Minutes | 100 | 12.1% |
| 35 to 39 Minutes | 0 | 0.0% |
| 40 to 44 Minutes | 0 | 0.0% |
| 45 to 59 Minutes | 3 | 0.4% |
| 60 to 89 Minutes | 30 | 3.6% |
| 90 or more Minutes | 65 | 7.9% |
Commute Time by Sex in Escobares
The most common commute times in Escobares are 5 to 9 minutes (89 commuters, 20.5%) for males and 10 to 14 minutes (121 commuters, 30.7%) for females.
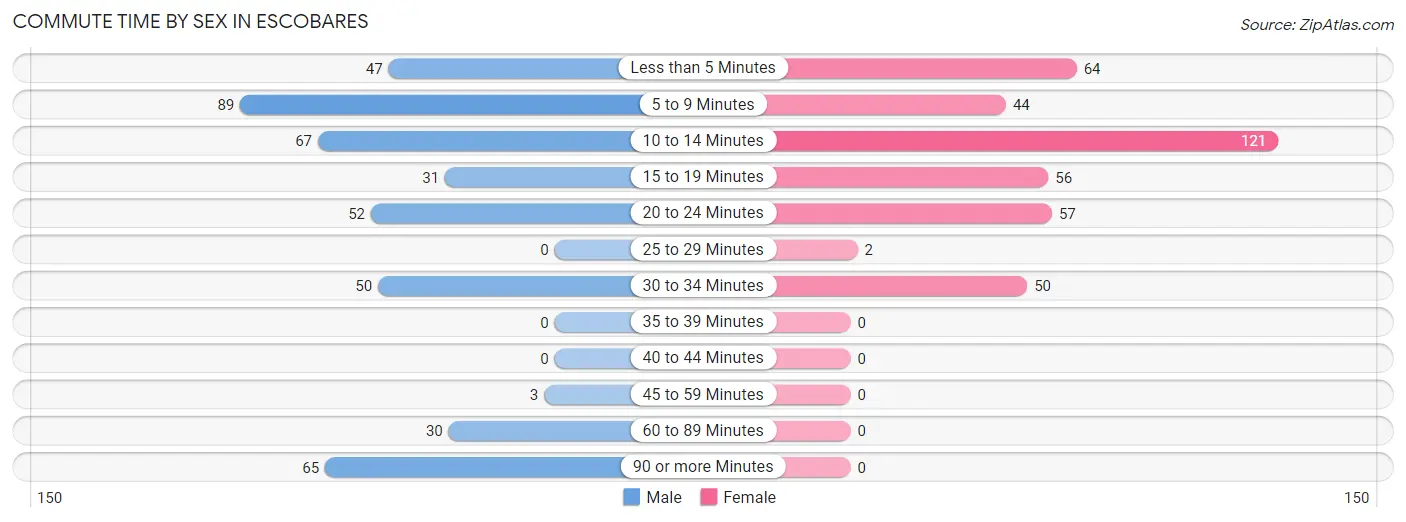
| Commute Time | Male | Female |
| Less than 5 Minutes | 47 (10.8%) | 64 (16.2%) |
| 5 to 9 Minutes | 89 (20.5%) | 44 (11.2%) |
| 10 to 14 Minutes | 67 (15.4%) | 121 (30.7%) |
| 15 to 19 Minutes | 31 (7.1%) | 56 (14.2%) |
| 20 to 24 Minutes | 52 (12.0%) | 57 (14.5%) |
| 25 to 29 Minutes | 0 (0.0%) | 2 (0.5%) |
| 30 to 34 Minutes | 50 (11.5%) | 50 (12.7%) |
| 35 to 39 Minutes | 0 (0.0%) | 0 (0.0%) |
| 40 to 44 Minutes | 0 (0.0%) | 0 (0.0%) |
| 45 to 59 Minutes | 3 (0.7%) | 0 (0.0%) |
| 60 to 89 Minutes | 30 (6.9%) | 0 (0.0%) |
| 90 or more Minutes | 65 (15.0%) | 0 (0.0%) |
Time of Departure to Work by Sex in Escobares
The most frequent times of departure to work in Escobares are 7:00 AM to 7:29 AM (92, 21.2%) for males and 7:30 AM to 7:59 AM (130, 33.0%) for females.
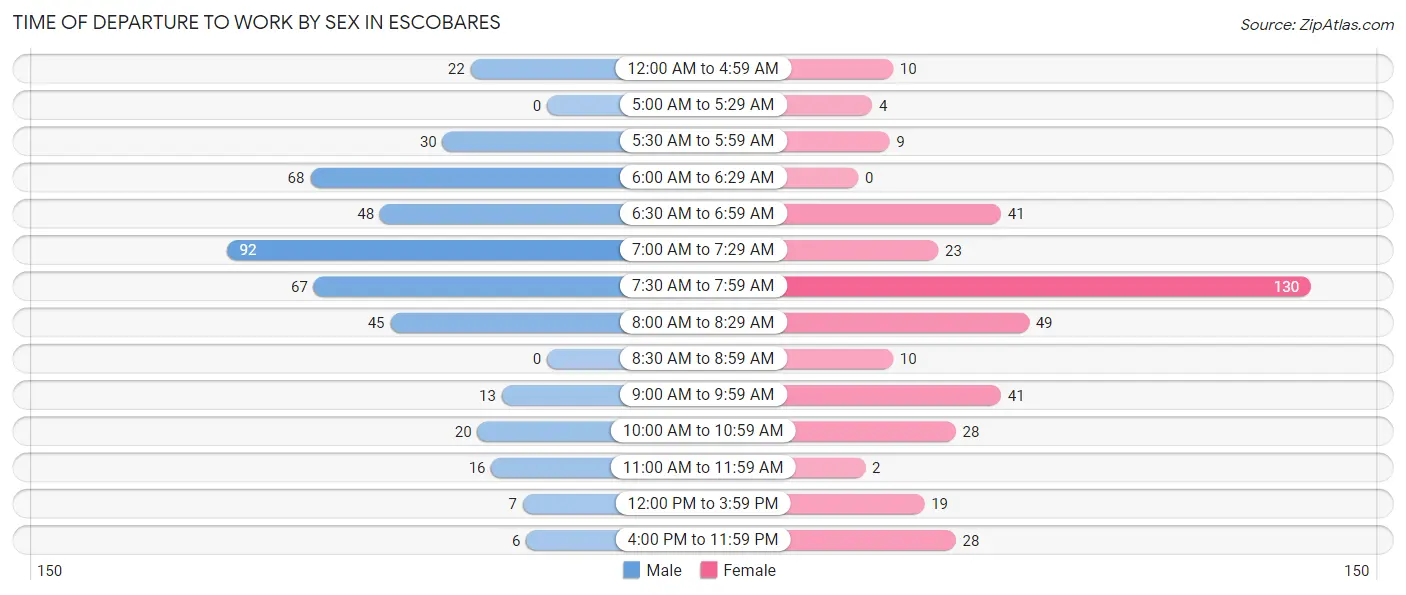
| Time of Departure | Male | Female |
| 12:00 AM to 4:59 AM | 22 (5.1%) | 10 (2.5%) |
| 5:00 AM to 5:29 AM | 0 (0.0%) | 4 (1.0%) |
| 5:30 AM to 5:59 AM | 30 (6.9%) | 9 (2.3%) |
| 6:00 AM to 6:29 AM | 68 (15.7%) | 0 (0.0%) |
| 6:30 AM to 6:59 AM | 48 (11.1%) | 41 (10.4%) |
| 7:00 AM to 7:29 AM | 92 (21.2%) | 23 (5.8%) |
| 7:30 AM to 7:59 AM | 67 (15.4%) | 130 (33.0%) |
| 8:00 AM to 8:29 AM | 45 (10.4%) | 49 (12.4%) |
| 8:30 AM to 8:59 AM | 0 (0.0%) | 10 (2.5%) |
| 9:00 AM to 9:59 AM | 13 (3.0%) | 41 (10.4%) |
| 10:00 AM to 10:59 AM | 20 (4.6%) | 28 (7.1%) |
| 11:00 AM to 11:59 AM | 16 (3.7%) | 2 (0.5%) |
| 12:00 PM to 3:59 PM | 7 (1.6%) | 19 (4.8%) |
| 4:00 PM to 11:59 PM | 6 (1.4%) | 28 (7.1%) |
| Total | 434 (100.0%) | 394 (100.0%) |
Housing Occupancy in Escobares
Occupancy by Ownership in Escobares
Of the total 720 dwellings in Escobares, owner-occupied units account for 501 (69.6%), while renter-occupied units make up 219 (30.4%).
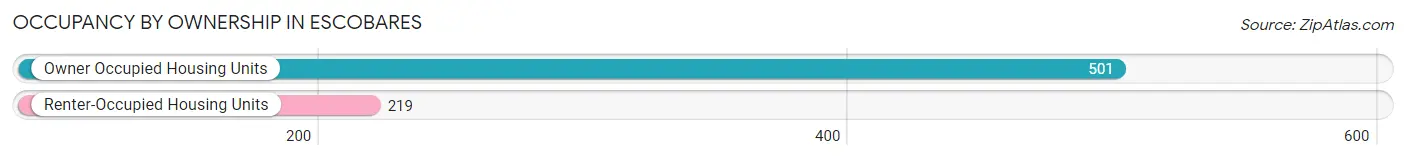
| Occupancy | # Housing Units | % Housing Units |
| Owner Occupied Housing Units | 501 | 69.6% |
| Renter-Occupied Housing Units | 219 | 30.4% |
| Total Occupied Housing Units | 720 | 100.0% |
Occupancy by Household Size in Escobares
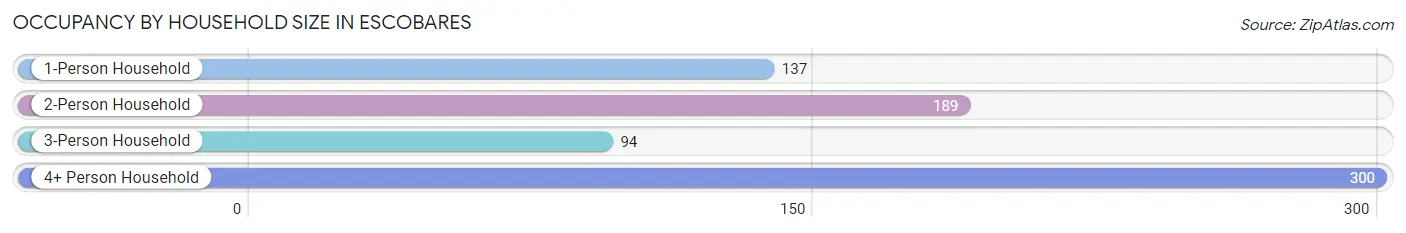
| Household Size | # Housing Units | % Housing Units |
| 1-Person Household | 137 | 19.0% |
| 2-Person Household | 189 | 26.3% |
| 3-Person Household | 94 | 13.1% |
| 4+ Person Household | 300 | 41.7% |
| Total Housing Units | 720 | 100.0% |
Occupancy by Ownership by Household Size in Escobares
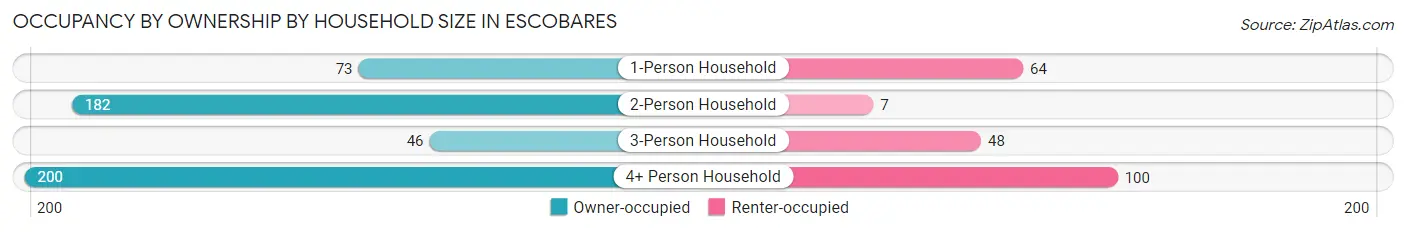
| Household Size | Owner-occupied | Renter-occupied |
| 1-Person Household | 73 (53.3%) | 64 (46.7%) |
| 2-Person Household | 182 (96.3%) | 7 (3.7%) |
| 3-Person Household | 46 (48.9%) | 48 (51.1%) |
| 4+ Person Household | 200 (66.7%) | 100 (33.3%) |
| Total Housing Units | 501 (69.6%) | 219 (30.4%) |
Occupancy by Educational Attainment in Escobares
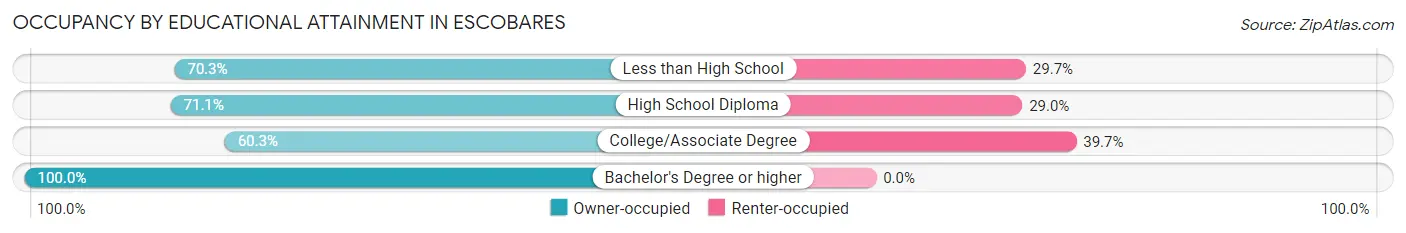
| Household Size | Owner-occupied | Renter-occupied |
| Less than High School | 270 (70.3%) | 114 (29.7%) |
| High School Diploma | 135 (71.1%) | 55 (28.9%) |
| College/Associate Degree | 76 (60.3%) | 50 (39.7%) |
| Bachelor's Degree or higher | 20 (100.0%) | 0 (0.0%) |
Occupancy by Age of Householder in Escobares
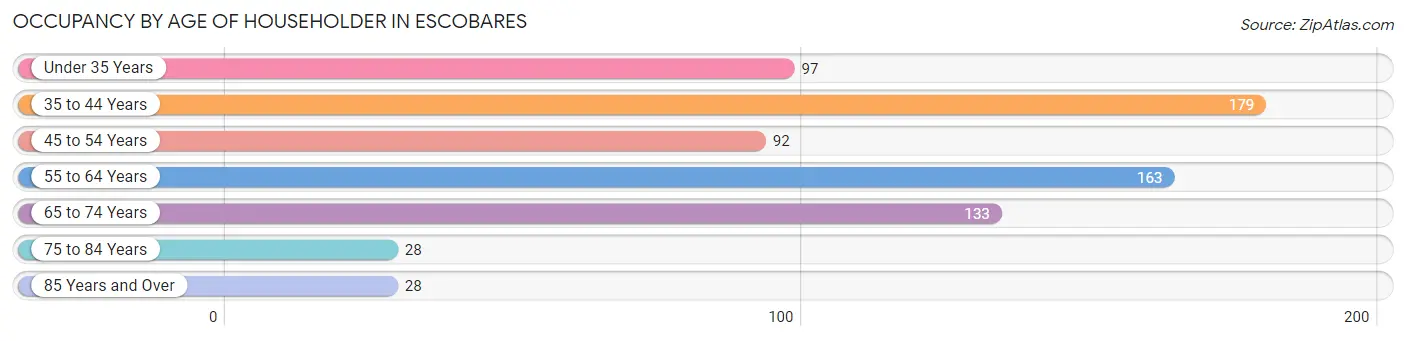
| Age Bracket | # Households | % Households |
| Under 35 Years | 97 | 13.5% |
| 35 to 44 Years | 179 | 24.9% |
| 45 to 54 Years | 92 | 12.8% |
| 55 to 64 Years | 163 | 22.6% |
| 65 to 74 Years | 133 | 18.5% |
| 75 to 84 Years | 28 | 3.9% |
| 85 Years and Over | 28 | 3.9% |
| Total | 720 | 100.0% |
Housing Finances in Escobares
Median Income by Occupancy in Escobares
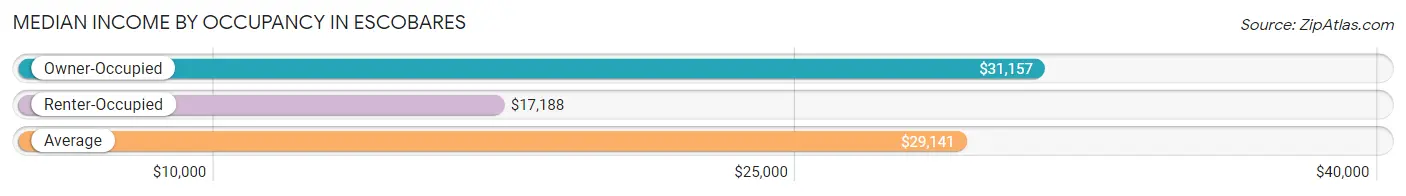
| Occupancy Type | # Households | Median Income |
| Owner-Occupied | 501 (69.6%) | $31,157 |
| Renter-Occupied | 219 (30.4%) | $17,188 |
| Average | 720 (100.0%) | $29,141 |
Occupancy by Householder Income Bracket in Escobares
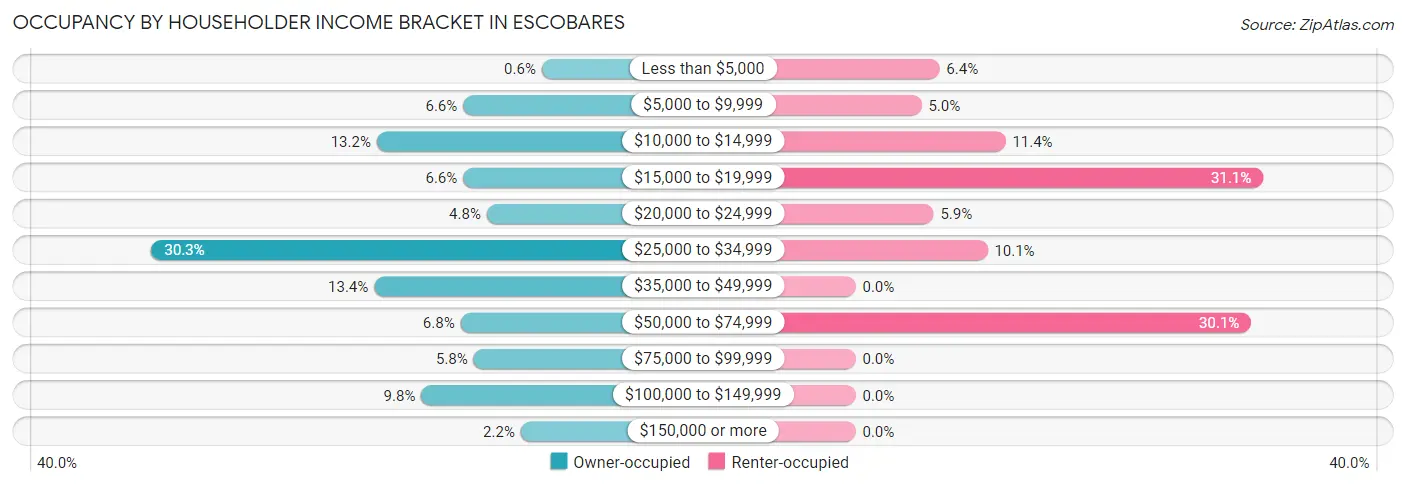
| Income Bracket | Owner-occupied | Renter-occupied |
| Less than $5,000 | 3 (0.6%) | 14 (6.4%) |
| $5,000 to $9,999 | 33 (6.6%) | 11 (5.0%) |
| $10,000 to $14,999 | 66 (13.2%) | 25 (11.4%) |
| $15,000 to $19,999 | 33 (6.6%) | 68 (31.0%) |
| $20,000 to $24,999 | 24 (4.8%) | 13 (5.9%) |
| $25,000 to $34,999 | 152 (30.3%) | 22 (10.1%) |
| $35,000 to $49,999 | 67 (13.4%) | 0 (0.0%) |
| $50,000 to $74,999 | 34 (6.8%) | 66 (30.1%) |
| $75,000 to $99,999 | 29 (5.8%) | 0 (0.0%) |
| $100,000 to $149,999 | 49 (9.8%) | 0 (0.0%) |
| $150,000 or more | 11 (2.2%) | 0 (0.0%) |
| Total | 501 (100.0%) | 219 (100.0%) |
Monthly Housing Cost Tiers in Escobares
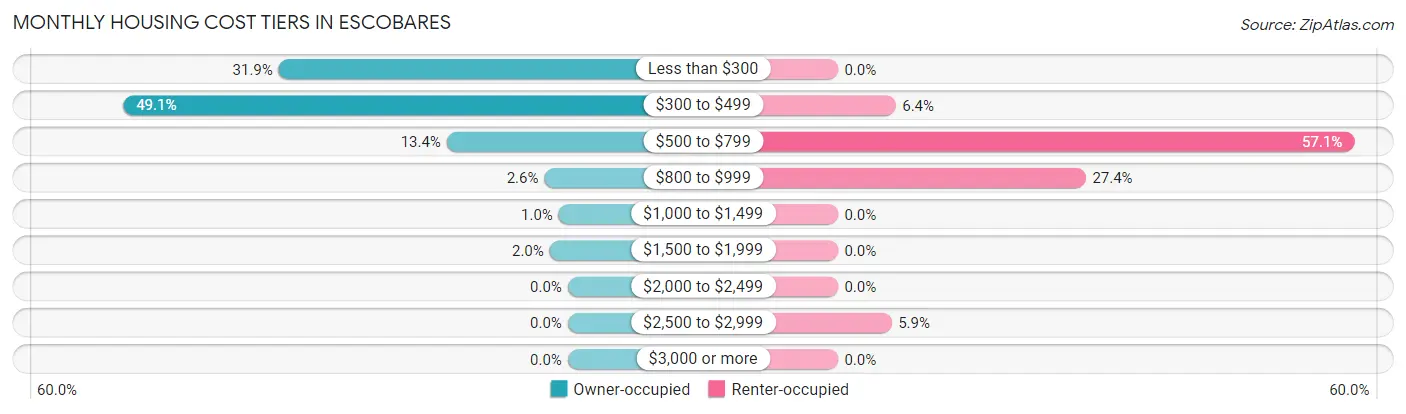
| Monthly Cost | Owner-occupied | Renter-occupied |
| Less than $300 | 160 (31.9%) | 0 (0.0%) |
| $300 to $499 | 246 (49.1%) | 14 (6.4%) |
| $500 to $799 | 67 (13.4%) | 125 (57.1%) |
| $800 to $999 | 13 (2.6%) | 60 (27.4%) |
| $1,000 to $1,499 | 5 (1.0%) | 0 (0.0%) |
| $1,500 to $1,999 | 10 (2.0%) | 0 (0.0%) |
| $2,000 to $2,499 | 0 (0.0%) | 0 (0.0%) |
| $2,500 to $2,999 | 0 (0.0%) | 13 (5.9%) |
| $3,000 or more | 0 (0.0%) | 0 (0.0%) |
| Total | 501 (100.0%) | 219 (100.0%) |
Physical Housing Characteristics in Escobares
Housing Structures in Escobares
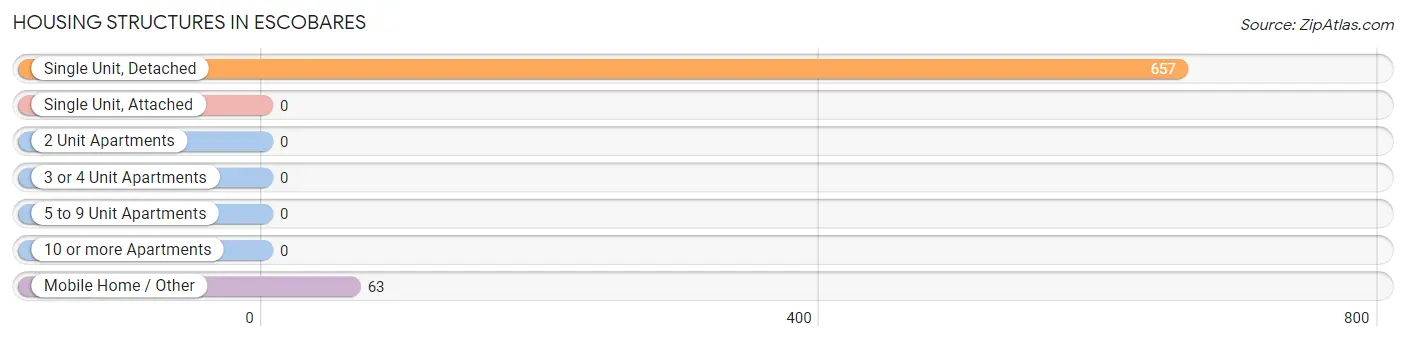
| Structure Type | # Housing Units | % Housing Units |
| Single Unit, Detached | 657 | 91.2% |
| Single Unit, Attached | 0 | 0.0% |
| 2 Unit Apartments | 0 | 0.0% |
| 3 or 4 Unit Apartments | 0 | 0.0% |
| 5 to 9 Unit Apartments | 0 | 0.0% |
| 10 or more Apartments | 0 | 0.0% |
| Mobile Home / Other | 63 | 8.7% |
| Total | 720 | 100.0% |
Housing Structures by Occupancy in Escobares
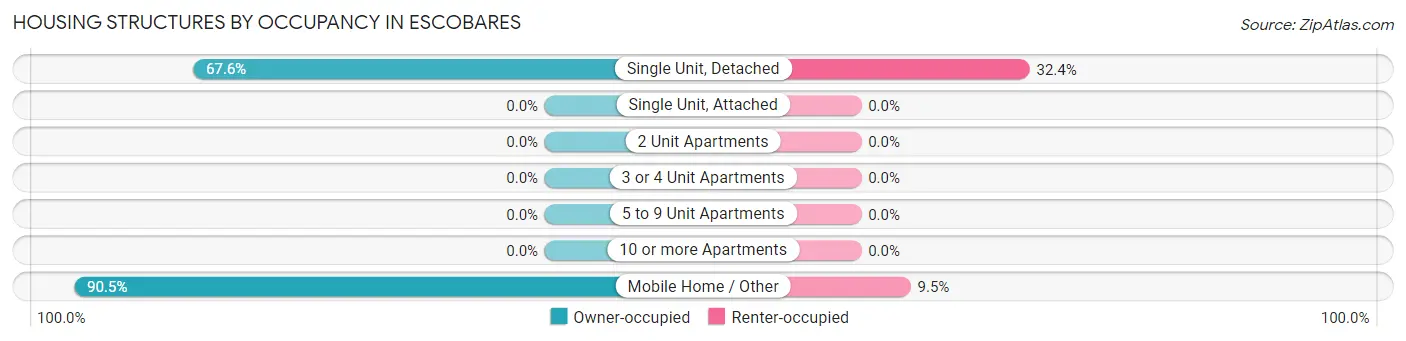
| Structure Type | Owner-occupied | Renter-occupied |
| Single Unit, Detached | 444 (67.6%) | 213 (32.4%) |
| Single Unit, Attached | 0 (0.0%) | 0 (0.0%) |
| 2 Unit Apartments | 0 (0.0%) | 0 (0.0%) |
| 3 or 4 Unit Apartments | 0 (0.0%) | 0 (0.0%) |
| 5 to 9 Unit Apartments | 0 (0.0%) | 0 (0.0%) |
| 10 or more Apartments | 0 (0.0%) | 0 (0.0%) |
| Mobile Home / Other | 57 (90.5%) | 6 (9.5%) |
| Total | 501 (69.6%) | 219 (30.4%) |
Housing Structures by Number of Rooms in Escobares
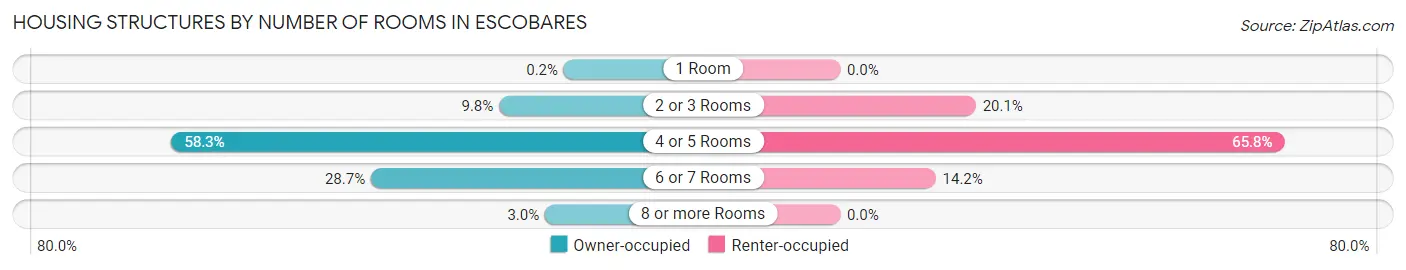
| Number of Rooms | Owner-occupied | Renter-occupied |
| 1 Room | 1 (0.2%) | 0 (0.0%) |
| 2 or 3 Rooms | 49 (9.8%) | 44 (20.1%) |
| 4 or 5 Rooms | 292 (58.3%) | 144 (65.7%) |
| 6 or 7 Rooms | 144 (28.7%) | 31 (14.2%) |
| 8 or more Rooms | 15 (3.0%) | 0 (0.0%) |
| Total | 501 (100.0%) | 219 (100.0%) |
Housing Structure by Heating Type in Escobares
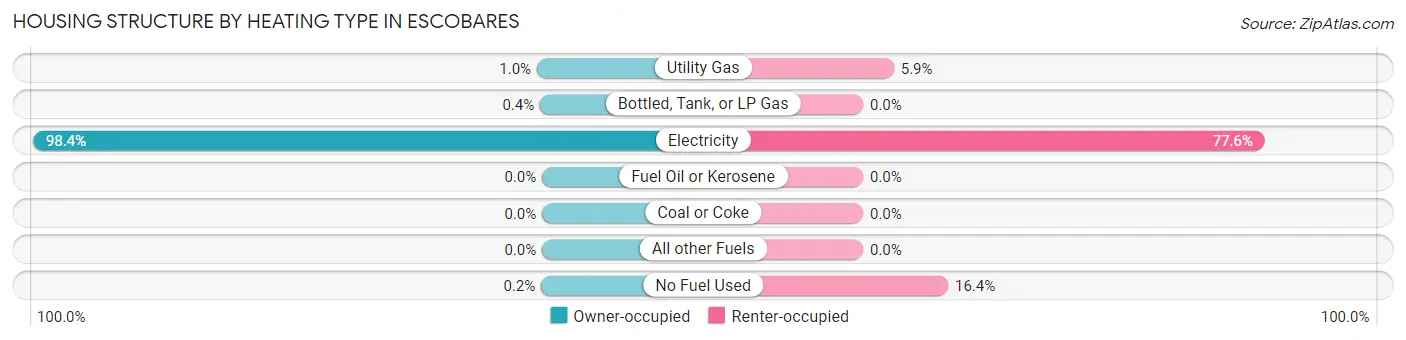
| Heating Type | Owner-occupied | Renter-occupied |
| Utility Gas | 5 (1.0%) | 13 (5.9%) |
| Bottled, Tank, or LP Gas | 2 (0.4%) | 0 (0.0%) |
| Electricity | 493 (98.4%) | 170 (77.6%) |
| Fuel Oil or Kerosene | 0 (0.0%) | 0 (0.0%) |
| Coal or Coke | 0 (0.0%) | 0 (0.0%) |
| All other Fuels | 0 (0.0%) | 0 (0.0%) |
| No Fuel Used | 1 (0.2%) | 36 (16.4%) |
| Total | 501 (100.0%) | 219 (100.0%) |
Household Vehicle Usage in Escobares
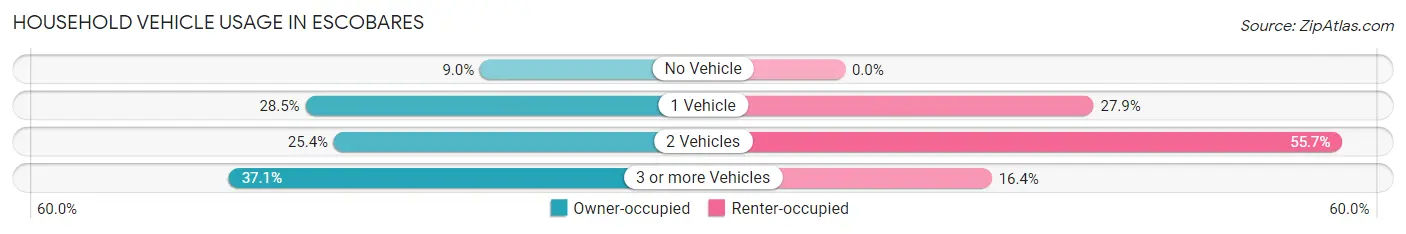
| Vehicles per Household | Owner-occupied | Renter-occupied |
| No Vehicle | 45 (9.0%) | 0 (0.0%) |
| 1 Vehicle | 143 (28.5%) | 61 (27.9%) |
| 2 Vehicles | 127 (25.4%) | 122 (55.7%) |
| 3 or more Vehicles | 186 (37.1%) | 36 (16.4%) |
| Total | 501 (100.0%) | 219 (100.0%) |
Real Estate & Mortgages in Escobares
Real Estate and Mortgage Overview in Escobares
| Characteristic | Without Mortgage | With Mortgage |
| Housing Units | 471 | 30 |
| Median Property Value | $50,900 | $93,800 |
| Median Household Income | $31,157 | $0 |
| Monthly Housing Costs | $347 | $0 |
| Real Estate Taxes | $952 | $0 |
Property Value by Mortgage Status in Escobares
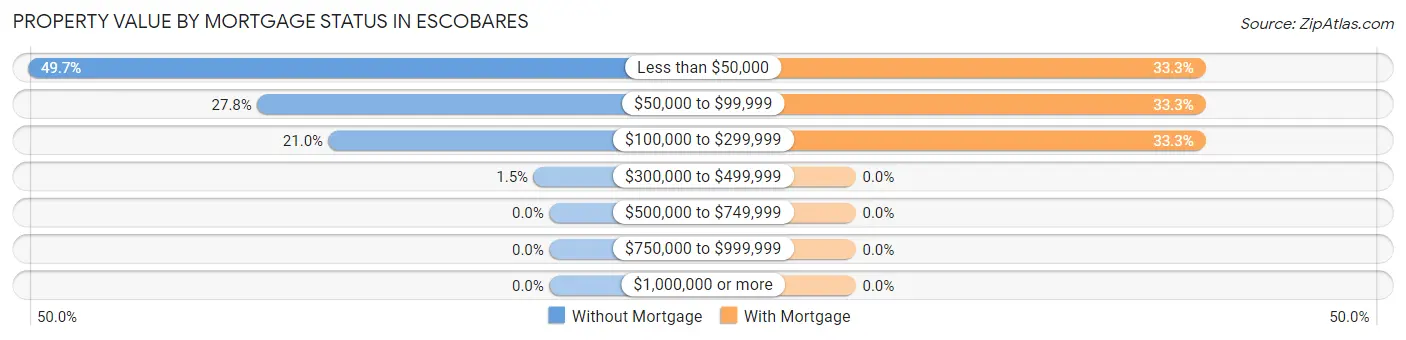
| Property Value | Without Mortgage | With Mortgage |
| Less than $50,000 | 234 (49.7%) | 10 (33.3%) |
| $50,000 to $99,999 | 131 (27.8%) | 10 (33.3%) |
| $100,000 to $299,999 | 99 (21.0%) | 10 (33.3%) |
| $300,000 to $499,999 | 7 (1.5%) | 0 (0.0%) |
| $500,000 to $749,999 | 0 (0.0%) | 0 (0.0%) |
| $750,000 to $999,999 | 0 (0.0%) | 0 (0.0%) |
| $1,000,000 or more | 0 (0.0%) | 0 (0.0%) |
| Total | 471 (100.0%) | 30 (100.0%) |
Household Income by Mortgage Status in Escobares
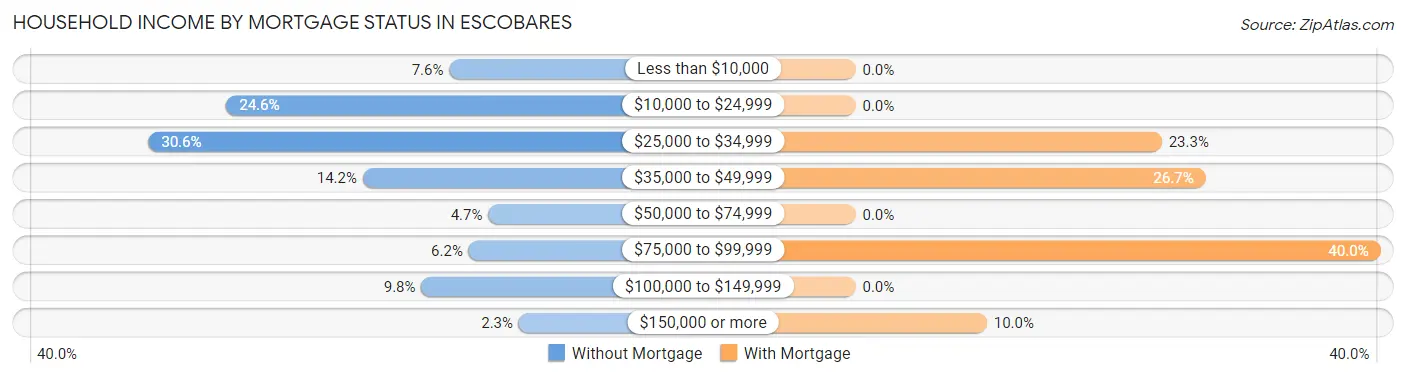
| Household Income | Without Mortgage | With Mortgage |
| Less than $10,000 | 36 (7.6%) | 0 (0.0%) |
| $10,000 to $24,999 | 116 (24.6%) | 0 (0.0%) |
| $25,000 to $34,999 | 144 (30.6%) | 7 (23.3%) |
| $35,000 to $49,999 | 67 (14.2%) | 8 (26.7%) |
| $50,000 to $74,999 | 22 (4.7%) | 0 (0.0%) |
| $75,000 to $99,999 | 29 (6.2%) | 12 (40.0%) |
| $100,000 to $149,999 | 46 (9.8%) | 0 (0.0%) |
| $150,000 or more | 11 (2.3%) | 3 (10.0%) |
| Total | 471 (100.0%) | 30 (100.0%) |
Property Value to Household Income Ratio in Escobares
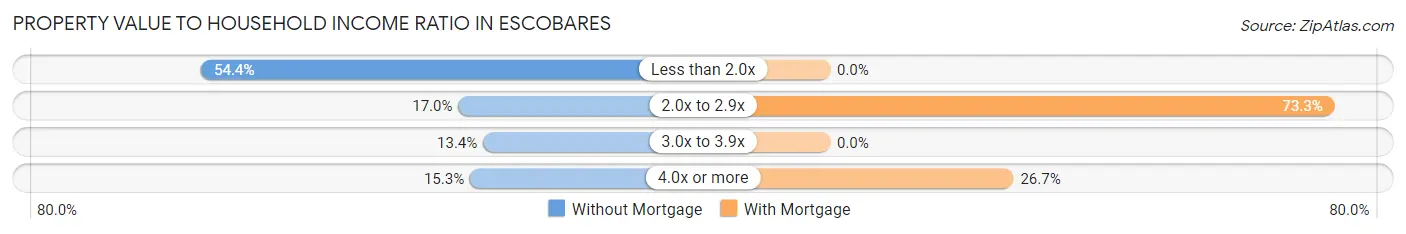
| Value-to-Income Ratio | Without Mortgage | With Mortgage |
| Less than 2.0x | 256 (54.3%) | 0 (0.0%) |
| 2.0x to 2.9x | 80 (17.0%) | 22 (73.3%) |
| 3.0x to 3.9x | 63 (13.4%) | 0 (0.0%) |
| 4.0x or more | 72 (15.3%) | 8 (26.7%) |
| Total | 471 (100.0%) | 30 (100.0%) |
Real Estate Taxes by Mortgage Status in Escobares
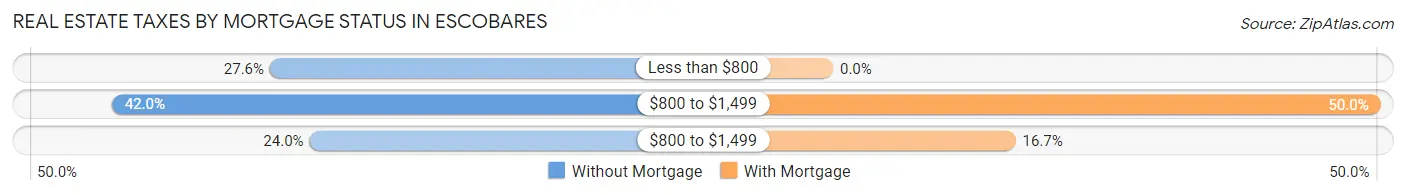
| Property Taxes | Without Mortgage | With Mortgage |
| Less than $800 | 130 (27.6%) | 0 (0.0%) |
| $800 to $1,499 | 198 (42.0%) | 15 (50.0%) |
| $800 to $1,499 | 113 (24.0%) | 5 (16.7%) |
| Total | 471 (100.0%) | 30 (100.0%) |
Health & Disability in Escobares
Health Insurance Coverage by Age in Escobares
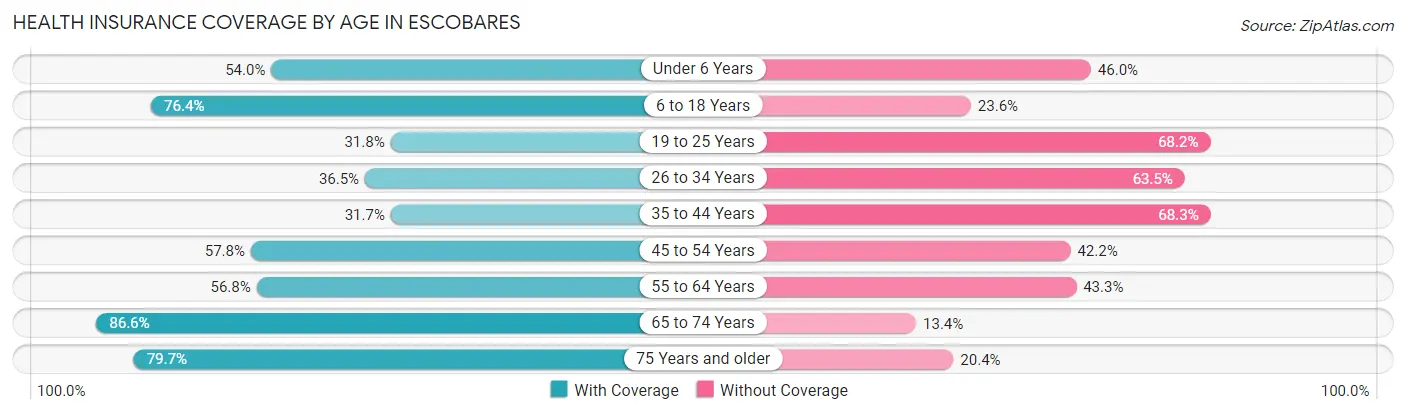
| Age Bracket | With Coverage | Without Coverage |
| Under 6 Years | 155 (54.0%) | 132 (46.0%) |
| 6 to 18 Years | 411 (76.4%) | 127 (23.6%) |
| 19 to 25 Years | 88 (31.8%) | 189 (68.2%) |
| 26 to 34 Years | 122 (36.5%) | 212 (63.5%) |
| 35 to 44 Years | 85 (31.7%) | 183 (68.3%) |
| 45 to 54 Years | 122 (57.8%) | 89 (42.2%) |
| 55 to 64 Years | 143 (56.8%) | 109 (43.2%) |
| 65 to 74 Years | 207 (86.6%) | 32 (13.4%) |
| 75 Years and older | 137 (79.6%) | 35 (20.3%) |
| Total | 1,470 (57.0%) | 1,108 (43.0%) |
Health Insurance Coverage by Citizenship Status in Escobares
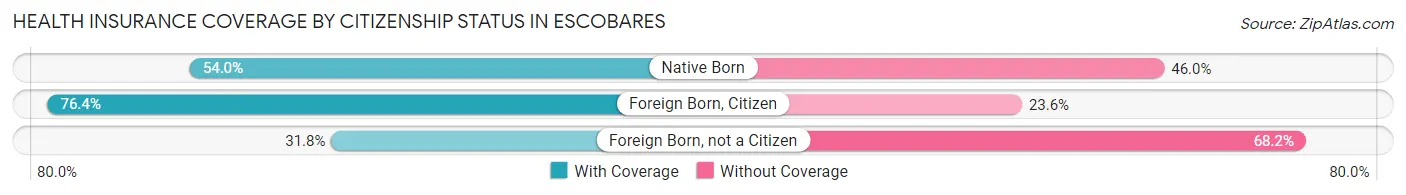
| Citizenship Status | With Coverage | Without Coverage |
| Native Born | 155 (54.0%) | 132 (46.0%) |
| Foreign Born, Citizen | 411 (76.4%) | 127 (23.6%) |
| Foreign Born, not a Citizen | 88 (31.8%) | 189 (68.2%) |
Health Insurance Coverage by Household Income in Escobares
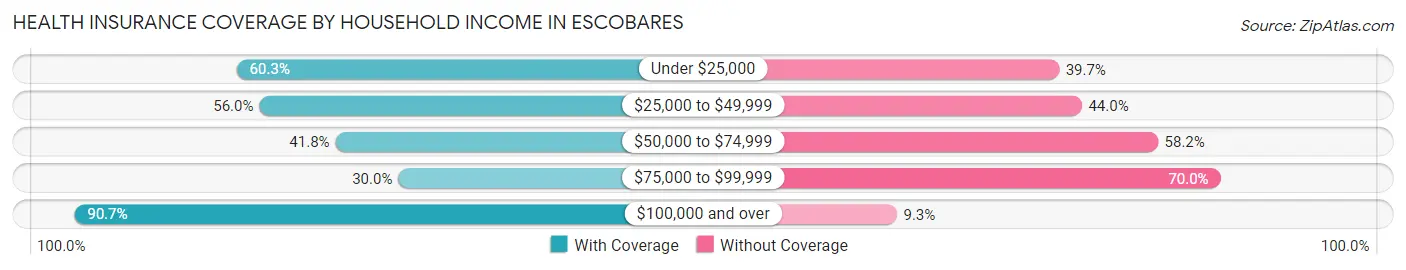
| Household Income | With Coverage | Without Coverage |
| Under $25,000 | 515 (60.3%) | 339 (39.7%) |
| $25,000 to $49,999 | 530 (56.0%) | 416 (44.0%) |
| $50,000 to $74,999 | 175 (41.8%) | 244 (58.2%) |
| $75,000 to $99,999 | 36 (30.0%) | 84 (70.0%) |
| $100,000 and over | 214 (90.7%) | 22 (9.3%) |
Public vs Private Health Insurance Coverage by Age in Escobares
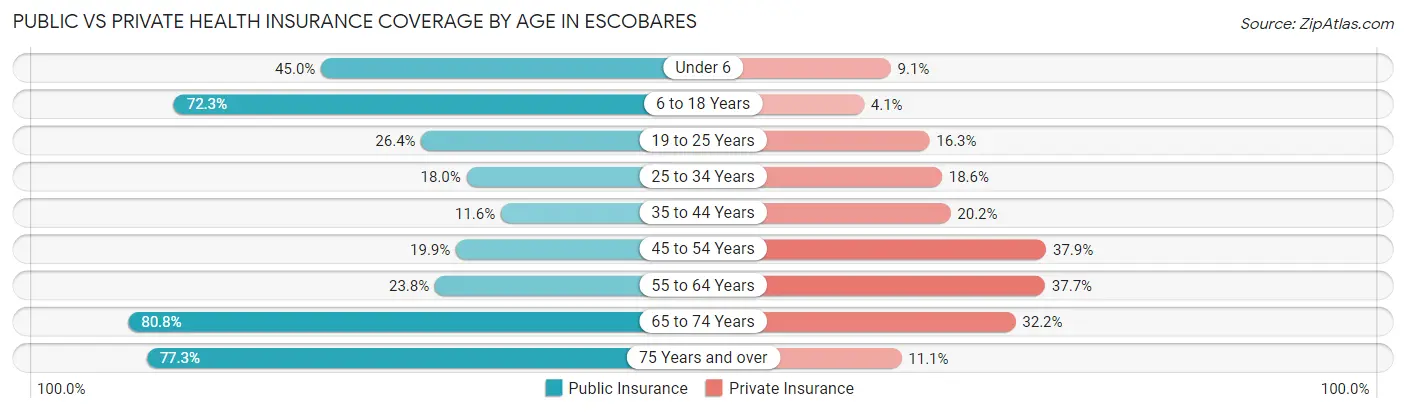
| Age Bracket | Public Insurance | Private Insurance |
| Under 6 | 129 (45.0%) | 26 (9.1%) |
| 6 to 18 Years | 389 (72.3%) | 22 (4.1%) |
| 19 to 25 Years | 73 (26.4%) | 45 (16.3%) |
| 25 to 34 Years | 60 (18.0%) | 62 (18.6%) |
| 35 to 44 Years | 31 (11.6%) | 54 (20.2%) |
| 45 to 54 Years | 42 (19.9%) | 80 (37.9%) |
| 55 to 64 Years | 60 (23.8%) | 95 (37.7%) |
| 65 to 74 Years | 193 (80.7%) | 77 (32.2%) |
| 75 Years and over | 133 (77.3%) | 19 (11.1%) |
| Total | 1,110 (43.1%) | 480 (18.6%) |
Disability Status by Sex by Age in Escobares
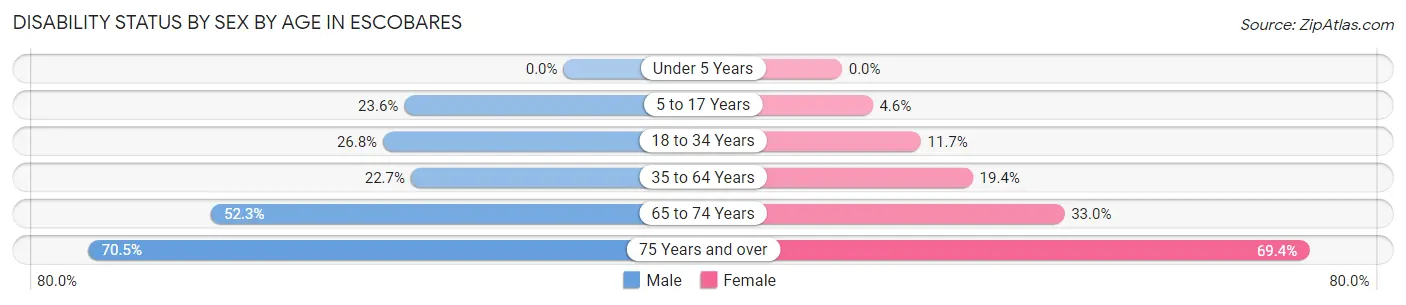
| Age Bracket | Male | Female |
| Under 5 Years | 0 (0.0%) | 0 (0.0%) |
| 5 to 17 Years | 74 (23.6%) | 9 (4.5%) |
| 18 to 34 Years | 71 (26.8%) | 46 (11.7%) |
| 35 to 64 Years | 70 (22.7%) | 82 (19.4%) |
| 65 to 74 Years | 68 (52.3%) | 36 (33.0%) |
| 75 Years and over | 43 (70.5%) | 77 (69.4%) |
Disability Class by Sex by Age in Escobares
Disability Class: Hearing Difficulty
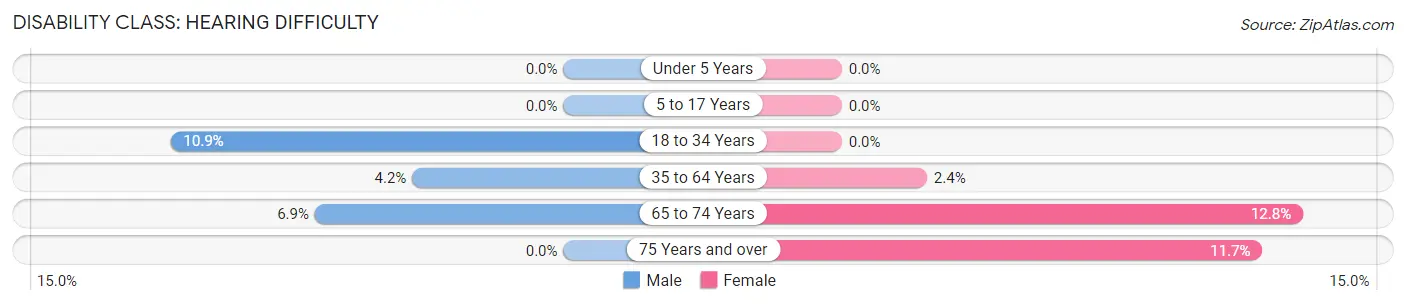
| Age Bracket | Male | Female |
| Under 5 Years | 0 (0.0%) | 0 (0.0%) |
| 5 to 17 Years | 0 (0.0%) | 0 (0.0%) |
| 18 to 34 Years | 29 (10.9%) | 0 (0.0%) |
| 35 to 64 Years | 13 (4.2%) | 10 (2.4%) |
| 65 to 74 Years | 9 (6.9%) | 14 (12.8%) |
| 75 Years and over | 0 (0.0%) | 13 (11.7%) |
Disability Class: Vision Difficulty
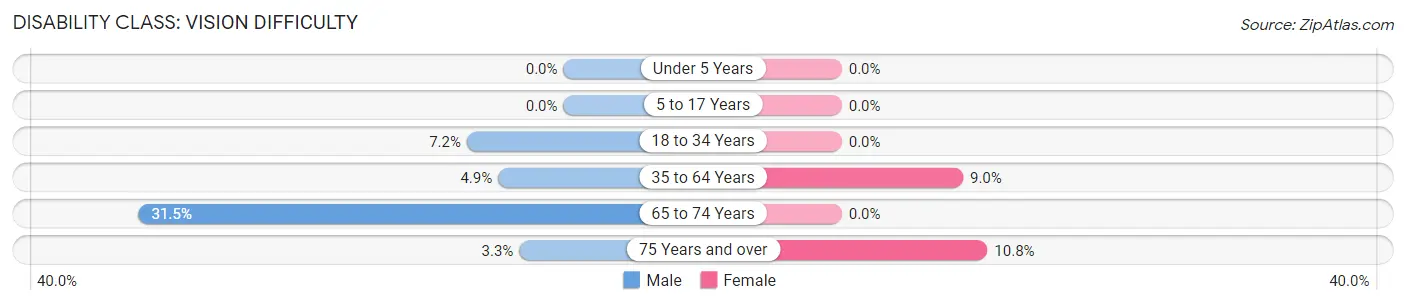
| Age Bracket | Male | Female |
| Under 5 Years | 0 (0.0%) | 0 (0.0%) |
| 5 to 17 Years | 0 (0.0%) | 0 (0.0%) |
| 18 to 34 Years | 19 (7.2%) | 0 (0.0%) |
| 35 to 64 Years | 15 (4.9%) | 38 (9.0%) |
| 65 to 74 Years | 41 (31.5%) | 0 (0.0%) |
| 75 Years and over | 2 (3.3%) | 12 (10.8%) |
Disability Class: Cognitive Difficulty
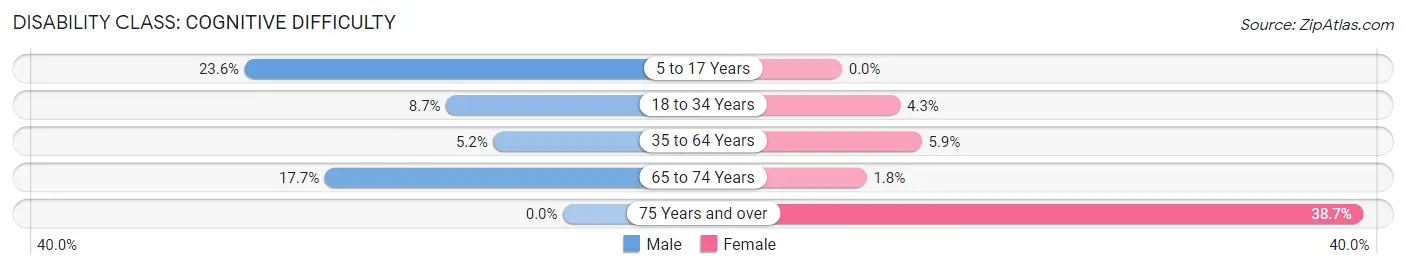
| Age Bracket | Male | Female |
| 5 to 17 Years | 74 (23.6%) | 0 (0.0%) |
| 18 to 34 Years | 23 (8.7%) | 17 (4.3%) |
| 35 to 64 Years | 16 (5.2%) | 25 (5.9%) |
| 65 to 74 Years | 23 (17.7%) | 2 (1.8%) |
| 75 Years and over | 0 (0.0%) | 43 (38.7%) |
Disability Class: Ambulatory Difficulty
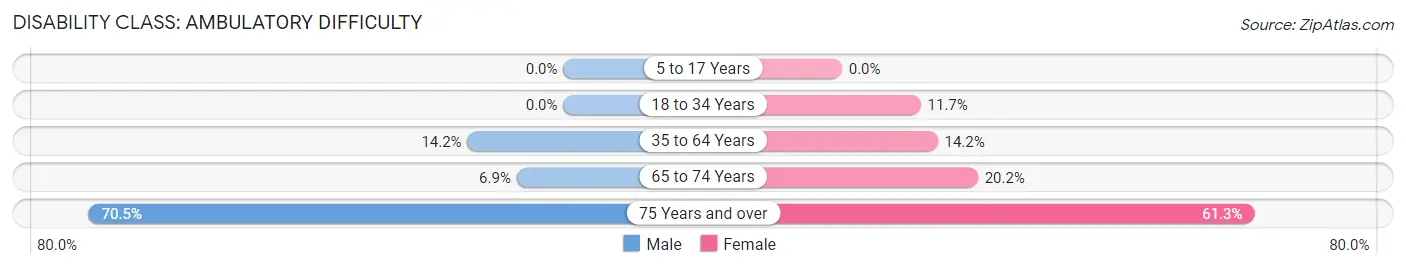
| Age Bracket | Male | Female |
| 5 to 17 Years | 0 (0.0%) | 0 (0.0%) |
| 18 to 34 Years | 0 (0.0%) | 46 (11.7%) |
| 35 to 64 Years | 44 (14.2%) | 60 (14.2%) |
| 65 to 74 Years | 9 (6.9%) | 22 (20.2%) |
| 75 Years and over | 43 (70.5%) | 68 (61.3%) |
Disability Class: Self-Care Difficulty
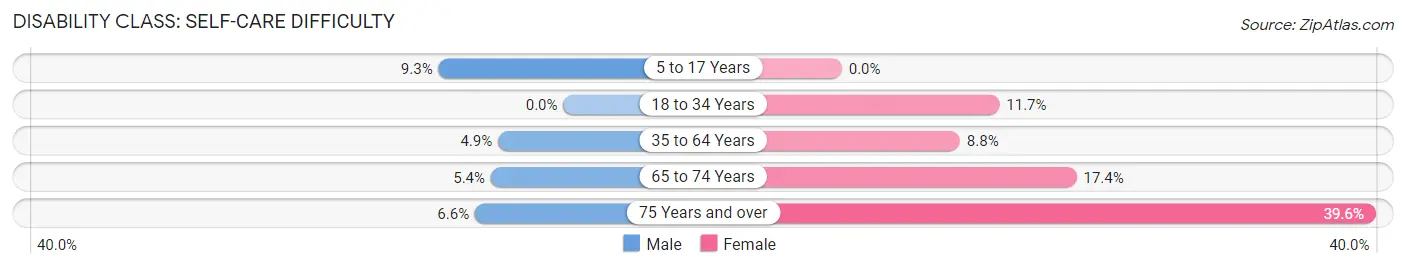
| Age Bracket | Male | Female |
| 5 to 17 Years | 29 (9.3%) | 0 (0.0%) |
| 18 to 34 Years | 0 (0.0%) | 46 (11.7%) |
| 35 to 64 Years | 15 (4.9%) | 37 (8.8%) |
| 65 to 74 Years | 7 (5.4%) | 19 (17.4%) |
| 75 Years and over | 4 (6.6%) | 44 (39.6%) |
Technology Access in Escobares
Computing Device Access in Escobares
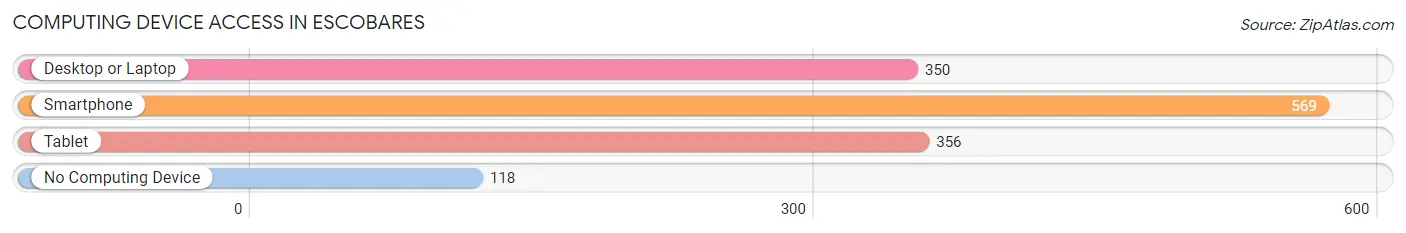
| Device Type | # Households | % Households |
| Desktop or Laptop | 350 | 48.6% |
| Smartphone | 569 | 79.0% |
| Tablet | 356 | 49.4% |
| No Computing Device | 118 | 16.4% |
| Total | 720 | 100.0% |
Internet Access in Escobares
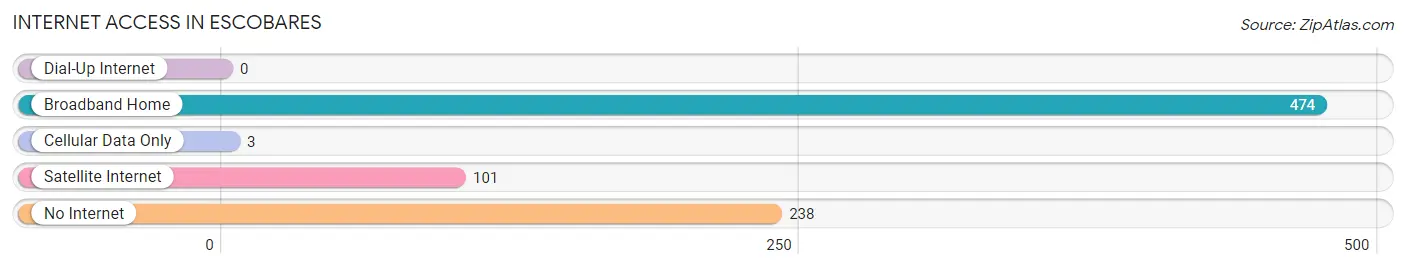
| Internet Type | # Households | % Households |
| Dial-Up Internet | 0 | 0.0% |
| Broadband Home | 474 | 65.8% |
| Cellular Data Only | 3 | 0.4% |
| Satellite Internet | 101 | 14.0% |
| No Internet | 238 | 33.1% |
| Total | 720 | 100.0% |
Escobares Summary
Escobares is a small town located in Starr County, Texas, United States. It is situated on the Rio Grande, about 20 miles (32 km) east of Rio Grande City. The population was 1,093 at the 2010 census.
History
Escobares was founded in 1848 by José María Escobar, a Mexican rancher who had been granted a land grant by the Mexican government. The town was originally called El Rancho de Escobares, but the name was later shortened to Escobares.
In the late 19th century, Escobares was a thriving agricultural community, with a population of over 1,000. The town was home to several stores, a hotel, a school, and a post office.
In the early 20th century, Escobares began to decline as the railroad bypassed the town. By the 1950s, the population had dropped to just over 500.
Geography
Escobares is located at 26°25'25" North, 98°37'45" West (26.423, -98.629). The town is situated on the Rio Grande, about 20 miles (32 km) east of Rio Grande City.
The terrain around Escobares is mostly flat, with some rolling hills. The climate is semi-arid, with hot summers and mild winters.
Economy
The economy of Escobares is largely based on agriculture. The town is home to several farms, which produce a variety of crops, including cotton, corn, sorghum, and wheat.
The town is also home to several small businesses, including a grocery store, a hardware store, and a restaurant.
Demographics
As of the 2010 census, there were 1,093 people living in Escobares. The racial makeup of the town was 94.3% Hispanic or Latino, 4.2% White, 0.2% African American, 0.2% Native American, 0.2% Asian, and 0.9% from other races.
The median household income in Escobares was $19,375, and the median family income was $21,250. The per capita income was $7,945. About 28.3% of the population was below the poverty line.
Common Questions
What is the Total Population of Escobares?
Total Population of Escobares is 2,578.
What is the Total Male Population of Escobares?
Total Male Population of Escobares is 1,215.
What is the Total Female Population of Escobares?
Total Female Population of Escobares is 1,363.
What is the Ratio of Males per 100 Females in Escobares?
There are 89.14 Males per 100 Females in Escobares.
What is the Ratio of Females per 100 Males in Escobares?
There are 112.18 Females per 100 Males in Escobares.
What is the Median Population Age in Escobares?
Median Population Age in Escobares is 28.8 Years.
What is the Average Family Size in Escobares
Average Family Size in Escobares is 4.1 People.
What is the Average Household Size in Escobares
Average Household Size in Escobares is 3.6 People.
What is Per Capita Income in Escobares?
Per Capita income in Escobares is $13,488.
What is the Median Family Income in Escobares?
Median Family Income in Escobares is $30,938.
What is the Median Household income in Escobares?
Median Household Income in Escobares is $29,141.
What is Income or Wage Gap in Escobares?
Income or Wage Gap in Escobares is 3.6%.
Women in Escobares earn 96.4 cents for every dollar earned by a man.
What is Inequality or Gini Index in Escobares?
Inequality or Gini Index in Escobares is 0.48.
How Large is the Labor Force in Escobares?
There are 1,017 People in the Labor Forcein in Escobares.
What is the Percentage of People in the Labor Force in Escobares?
55.6% of People are in the Labor Force in Escobares.
What is the Unemployment Rate in Escobares?
Unemployment Rate in Escobares is 9.9%.