Warwick, NY
Warwick Map
Warwick Overview
6,653
TOTAL POPULATION
3,064
MALE POPULATION
3,589
FEMALE POPULATION
85.37
MALES / 100 FEMALES
117.13
FEMALES / 100 MALES
51.0
MEDIAN AGE
2.9
AVG FAMILY SIZE
2.1
AVG HOUSEHOLD SIZE
$50,484
PER CAPITA INCOME
$142,121
AVG FAMILY INCOME
$85,736
AVG HOUSEHOLD INCOME
11.0%
WAGE / INCOME GAP [ % ]
89.0¢/ $1
WAGE / INCOME GAP [ $ ]
0.46
INEQUALITY / GINI INDEX
3,484
LABOR FORCE [ PEOPLE ]
62.8%
PERCENT IN LABOR FORCE
2.3%
UNEMPLOYMENT RATE
Warwick Zip Codes
Warwick Area Codes
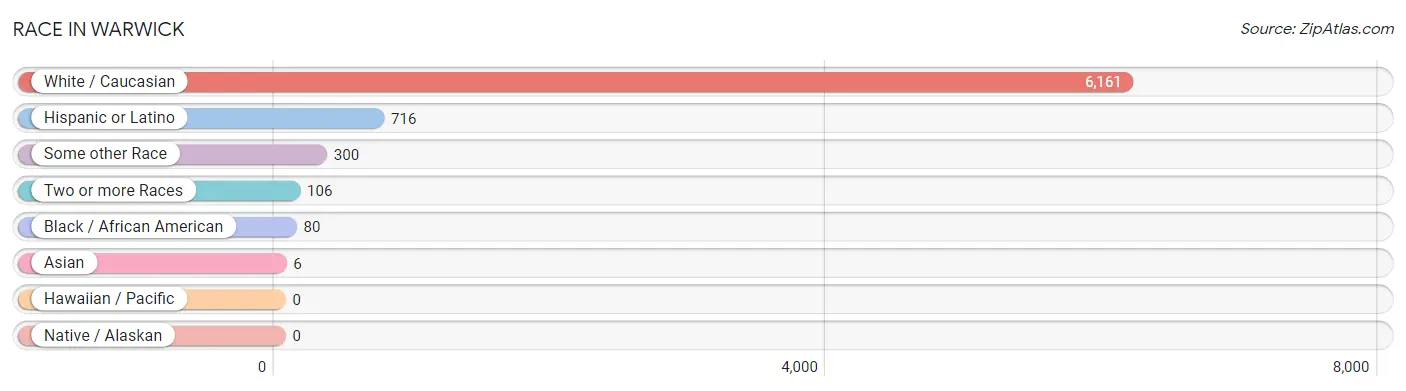
Race in Warwick
The most populous races in Warwick are White / Caucasian (6,161 | 92.6%), Hispanic or Latino (716 | 10.8%), and Some other Race (300 | 4.5%).
| Race | # Population | % Population |
| Asian | 6 | 0.1% |
| Black / African American | 80 | 1.2% |
| Hawaiian / Pacific | 0 | 0.0% |
| Hispanic or Latino | 716 | 10.8% |
| Native / Alaskan | 0 | 0.0% |
| White / Caucasian | 6,161 | 92.6% |
| Two or more Races | 106 | 1.6% |
| Some other Race | 300 | 4.5% |
| Total | 6,653 | 100.0% |
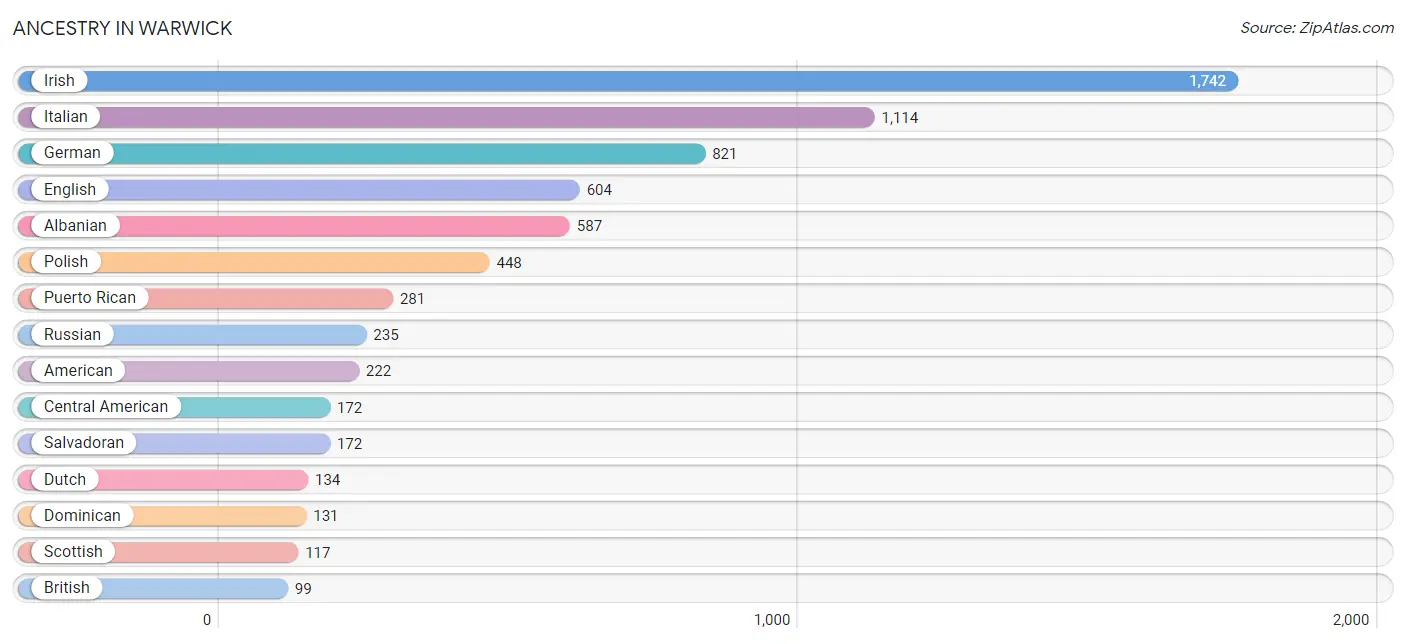
Ancestry in Warwick
The most populous ancestries reported in Warwick are Irish (1,742 | 26.2%), Italian (1,114 | 16.7%), German (821 | 12.3%), English (604 | 9.1%), and Albanian (587 | 8.8%), together accounting for 73.2% of all Warwick residents.
| Ancestry | # Population | % Population |
| African | 39 | 0.6% |
| Albanian | 587 | 8.8% |
| American | 222 | 3.3% |
| Arab | 93 | 1.4% |
| Argentinean | 17 | 0.3% |
| Austrian | 82 | 1.2% |
| British | 99 | 1.5% |
| Central American | 172 | 2.6% |
| Cherokee | 19 | 0.3% |
| Colombian | 29 | 0.4% |
| Croatian | 12 | 0.2% |
| Czech | 49 | 0.7% |
| Czechoslovakian | 11 | 0.2% |
| Dominican | 131 | 2.0% |
| Dutch | 134 | 2.0% |
| Eastern European | 80 | 1.2% |
| English | 604 | 9.1% |
| European | 11 | 0.2% |
| Finnish | 20 | 0.3% |
| French | 40 | 0.6% |
| French Canadian | 25 | 0.4% |
| German | 821 | 12.3% |
| Greek | 37 | 0.6% |
| Guyanese | 4 | 0.1% |
| Haitian | 3 | 0.1% |
| Hungarian | 65 | 1.0% |
| Irish | 1,742 | 26.2% |
| Italian | 1,114 | 16.7% |
| Korean | 6 | 0.1% |
| Lebanese | 14 | 0.2% |
| Lithuanian | 31 | 0.5% |
| Mexican | 70 | 1.1% |
| Norwegian | 22 | 0.3% |
| Polish | 448 | 6.7% |
| Portuguese | 70 | 1.1% |
| Puerto Rican | 281 | 4.2% |
| Romanian | 66 | 1.0% |
| Russian | 235 | 3.5% |
| Salvadoran | 172 | 2.6% |
| Scandinavian | 83 | 1.3% |
| Scottish | 117 | 1.8% |
| Slavic | 20 | 0.3% |
| Slovak | 24 | 0.4% |
| South American | 46 | 0.7% |
| Spanish | 16 | 0.2% |
| Subsaharan African | 39 | 0.6% |
| Swedish | 25 | 0.4% |
| Syrian | 79 | 1.2% |
| Thai | 45 | 0.7% |
| Trinidadian and Tobagonian | 4 | 0.1% |
| Turkish | 15 | 0.2% |
| Ukrainian | 14 | 0.2% |
| Welsh | 23 | 0.4% | View All 53 Rows |
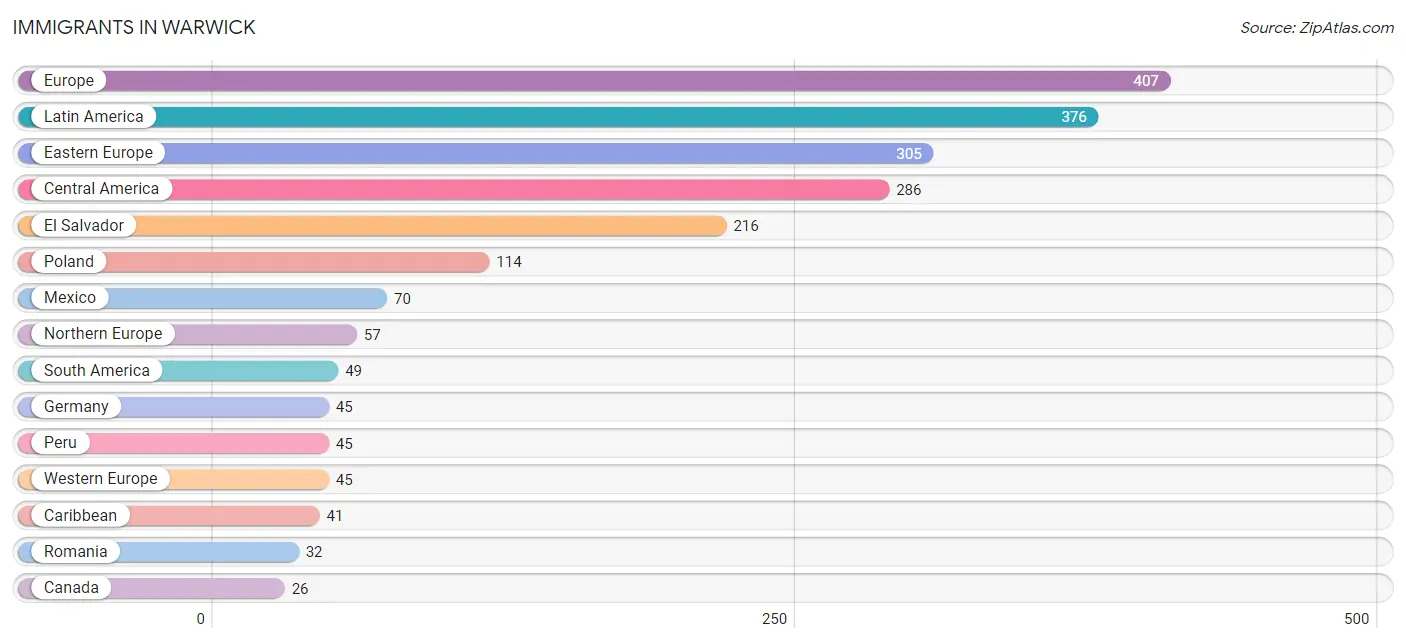
Immigrants in Warwick
The most numerous immigrant groups reported in Warwick came from Europe (407 | 6.1%), Latin America (376 | 5.7%), Eastern Europe (305 | 4.6%), Central America (286 | 4.3%), and El Salvador (216 | 3.3%), together accounting for 23.9% of all Warwick residents.
| Immigration Origin | # Population | % Population |
| Asia | 23 | 0.4% |
| Canada | 26 | 0.4% |
| Caribbean | 41 | 0.6% |
| Central America | 286 | 4.3% |
| Czechoslovakia | 14 | 0.2% |
| Dominican Republic | 13 | 0.2% |
| Eastern Europe | 305 | 4.6% |
| El Salvador | 216 | 3.3% |
| England | 12 | 0.2% |
| Europe | 407 | 6.1% |
| Germany | 45 | 0.7% |
| Guyana | 4 | 0.1% |
| Haiti | 3 | 0.1% |
| Ireland | 15 | 0.2% |
| Jamaica | 19 | 0.3% |
| Jordan | 23 | 0.4% |
| Latin America | 376 | 5.7% |
| Mexico | 70 | 1.1% |
| Northern Europe | 57 | 0.9% |
| Peru | 45 | 0.7% |
| Poland | 114 | 1.7% |
| Romania | 32 | 0.5% |
| Scotland | 22 | 0.3% |
| South America | 49 | 0.7% |
| Trinidad and Tobago | 6 | 0.1% |
| Western Asia | 23 | 0.4% |
| Western Europe | 45 | 0.7% | View All 27 Rows |
Sex and Age in Warwick
Sex and Age in Warwick
The most populous age groups in Warwick are 60 to 64 Years (320 | 10.4%) for men and 60 to 64 Years (437 | 12.2%) for women.
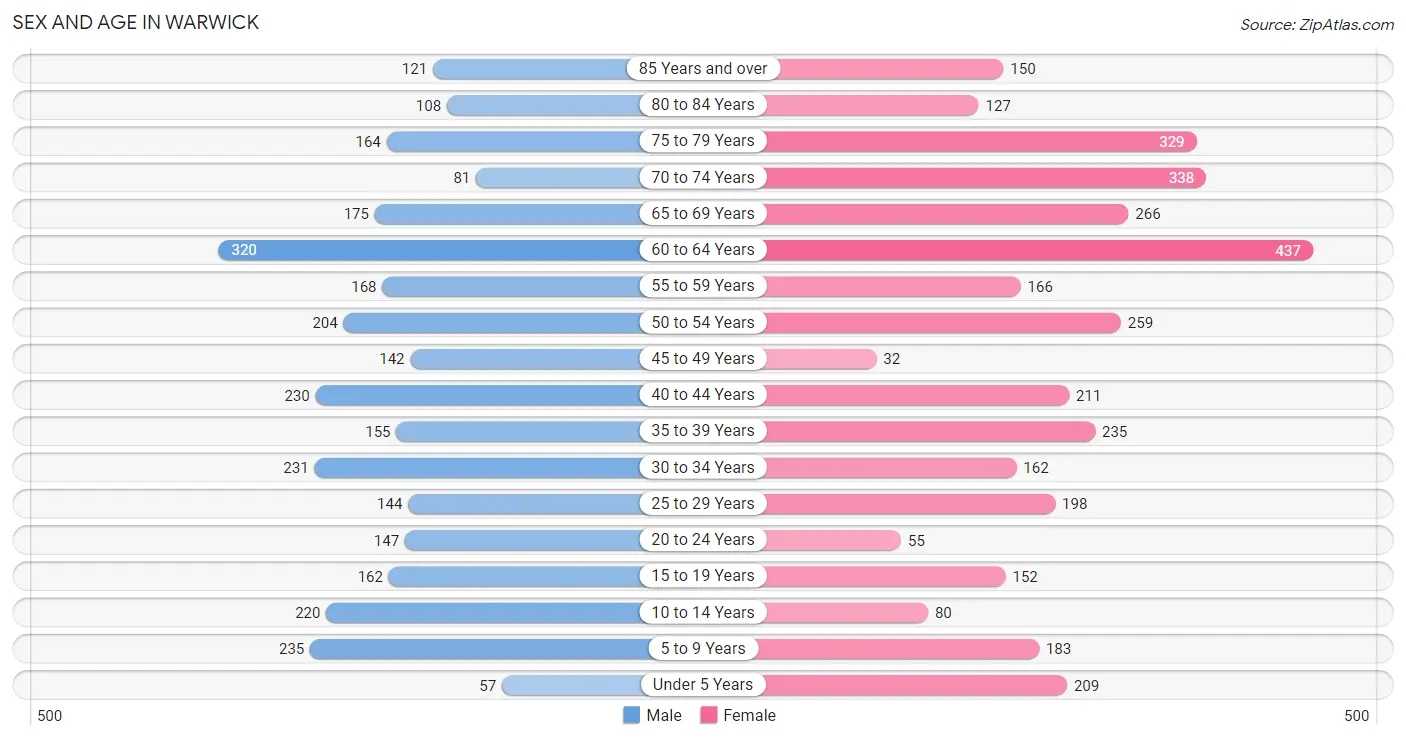
| Age Bracket | Male | Female |
| Under 5 Years | 57 (1.9%) | 209 (5.8%) |
| 5 to 9 Years | 235 (7.7%) | 183 (5.1%) |
| 10 to 14 Years | 220 (7.2%) | 80 (2.2%) |
| 15 to 19 Years | 162 (5.3%) | 152 (4.2%) |
| 20 to 24 Years | 147 (4.8%) | 55 (1.5%) |
| 25 to 29 Years | 144 (4.7%) | 198 (5.5%) |
| 30 to 34 Years | 231 (7.5%) | 162 (4.5%) |
| 35 to 39 Years | 155 (5.1%) | 235 (6.6%) |
| 40 to 44 Years | 230 (7.5%) | 211 (5.9%) |
| 45 to 49 Years | 142 (4.6%) | 32 (0.9%) |
| 50 to 54 Years | 204 (6.7%) | 259 (7.2%) |
| 55 to 59 Years | 168 (5.5%) | 166 (4.6%) |
| 60 to 64 Years | 320 (10.4%) | 437 (12.2%) |
| 65 to 69 Years | 175 (5.7%) | 266 (7.4%) |
| 70 to 74 Years | 81 (2.6%) | 338 (9.4%) |
| 75 to 79 Years | 164 (5.3%) | 329 (9.2%) |
| 80 to 84 Years | 108 (3.5%) | 127 (3.5%) |
| 85 Years and over | 121 (4.0%) | 150 (4.2%) |
| Total | 3,064 (100.0%) | 3,589 (100.0%) |
Families and Households in Warwick
Median Family Size in Warwick
The median family size in Warwick is 2.92 persons per family, with married-couple families (1,325 | 80.3%) accounting for the largest median family size of 2.98 persons per family. On the other hand, single female/mother families (244 | 14.8%) represent the smallest median family size with 2.58 persons per family.
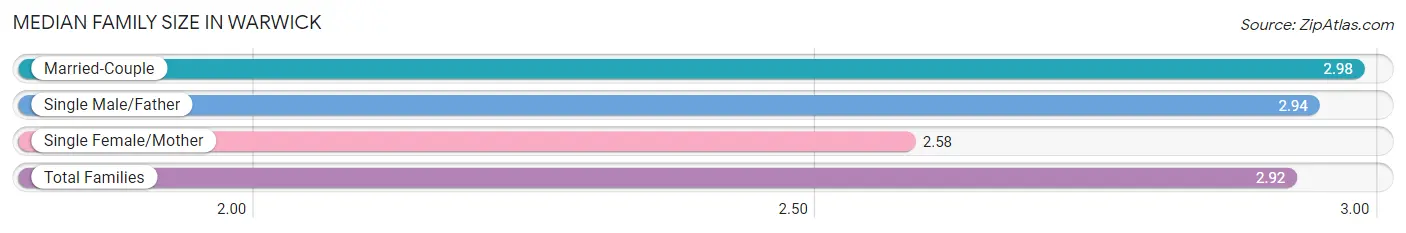
| Family Type | # Families | Family Size |
| Married-Couple | 1,325 (80.3%) | 2.98 |
| Single Male/Father | 81 (4.9%) | 2.94 |
| Single Female/Mother | 244 (14.8%) | 2.58 |
| Total Families | 1,650 (100.0%) | 2.92 |
Median Household Size in Warwick
The median household size in Warwick is 2.10 persons per household, with married-couple households (1,325 | 42.4%) accounting for the largest median household size of 3 persons per household. non-family households (1,471 | 47.1%) represent the smallest median household size with 1.15 persons per household.
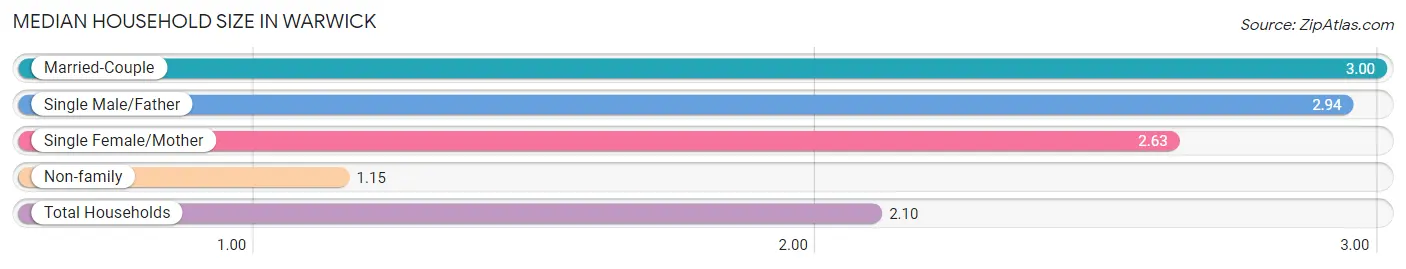
| Household Type | # Households | Household Size |
| Married-Couple | 1,325 (42.4%) | 3.00 |
| Single Male/Father | 81 (2.6%) | 2.94 |
| Single Female/Mother | 244 (7.8%) | 2.63 |
| Non-family | 1,471 (47.1%) | 1.15 |
| Total Households | 3,121 (100.0%) | 2.10 |
Household Size by Marriage Status in Warwick
Out of a total of 3,121 households in Warwick, 1,650 (52.9%) are family households, while 1,471 (47.1%) are nonfamily households. The most numerous type of family households are 2-person households, comprising 871, and the most common type of nonfamily households are 1-person households, comprising 1,296.
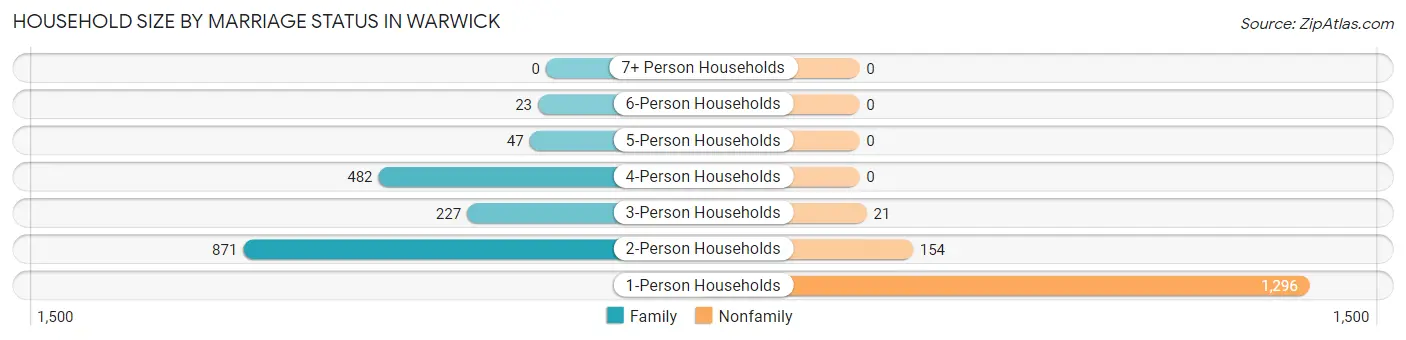
| Household Size | Family Households | Nonfamily Households |
| 1-Person Households | - | 1,296 (41.5%) |
| 2-Person Households | 871 (27.9%) | 154 (4.9%) |
| 3-Person Households | 227 (7.3%) | 21 (0.7%) |
| 4-Person Households | 482 (15.4%) | 0 (0.0%) |
| 5-Person Households | 47 (1.5%) | 0 (0.0%) |
| 6-Person Households | 23 (0.7%) | 0 (0.0%) |
| 7+ Person Households | 0 (0.0%) | 0 (0.0%) |
| Total | 1,650 (52.9%) | 1,471 (47.1%) |
Female Fertility in Warwick
Fertility by Age in Warwick
Average fertility rate in Warwick is 42.0 births per 1,000 women. Women in the age bracket of 35 to 50 years have the highest fertility rate with 71.0 births per 1,000 women. Women in the age bracket of 35 to 50 years acount for 83.0% of all women with births.
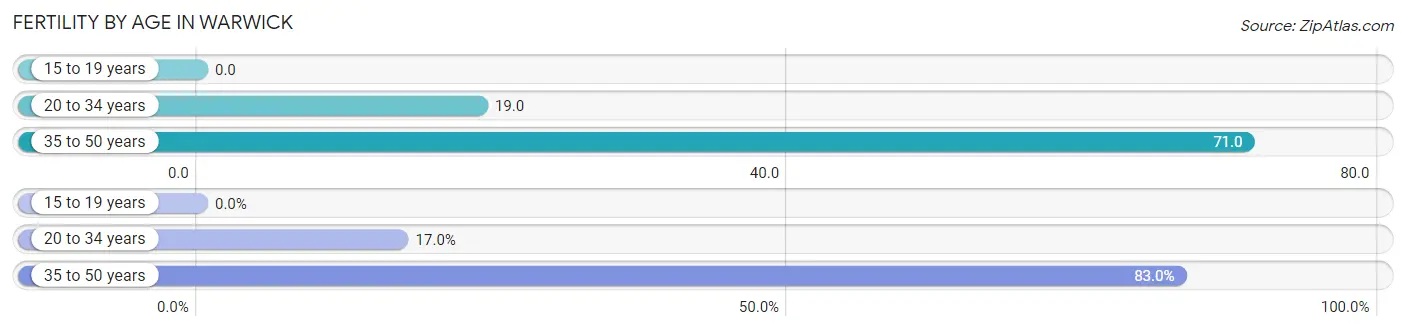
| Age Bracket | Women with Births | Births / 1,000 Women |
| 15 to 19 years | 0 (0.0%) | 0.0 |
| 20 to 34 years | 8 (17.0%) | 19.0 |
| 35 to 50 years | 39 (83.0%) | 71.0 |
| Total | 47 (100.0%) | 42.0 |
Fertility by Age by Marriage Status in Warwick
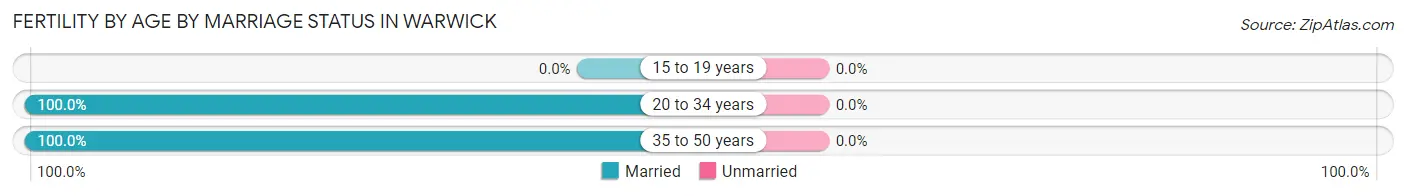
| Age Bracket | Married | Unmarried |
| 15 to 19 years | 0 (0.0%) | 0 (0.0%) |
| 20 to 34 years | 8 (100.0%) | 0 (0.0%) |
| 35 to 50 years | 39 (100.0%) | 0 (0.0%) |
| Total | 47 (100.0%) | 0 (0.0%) |
Fertility by Education in Warwick
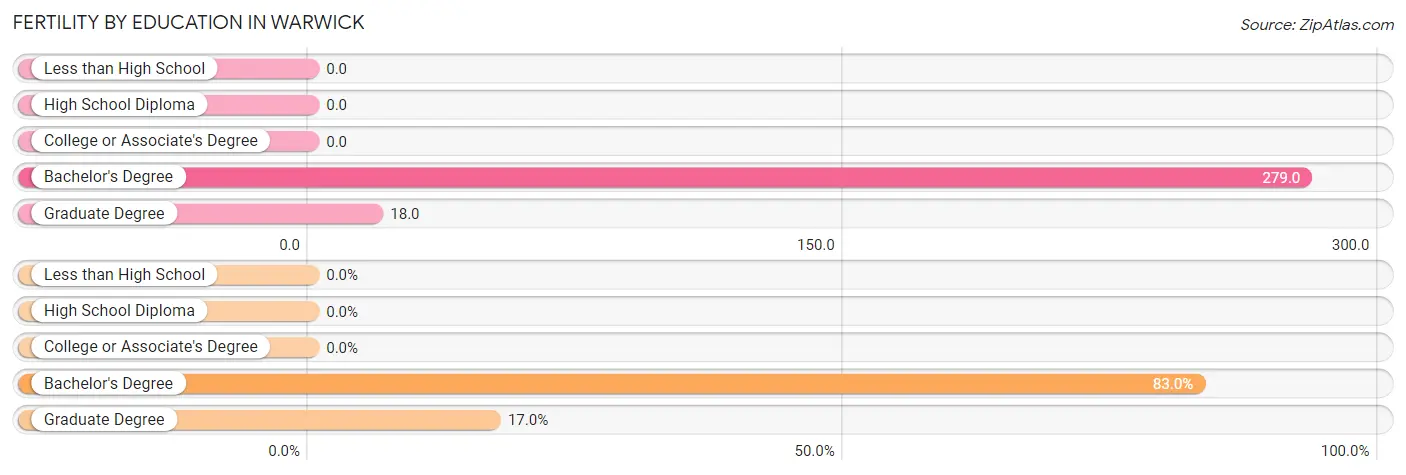
| Educational Attainment | Women with Births | Births / 1,000 Women |
| Less than High School | 0 (0.0%) | 0.0 |
| High School Diploma | 0 (0.0%) | 0.0 |
| College or Associate's Degree | 0 (0.0%) | 0.0 |
| Bachelor's Degree | 39 (83.0%) | 279.0 |
| Graduate Degree | 8 (17.0%) | 18.0 |
| Total | 47 (100.0%) | 42.0 |
Fertility by Education by Marriage Status in Warwick
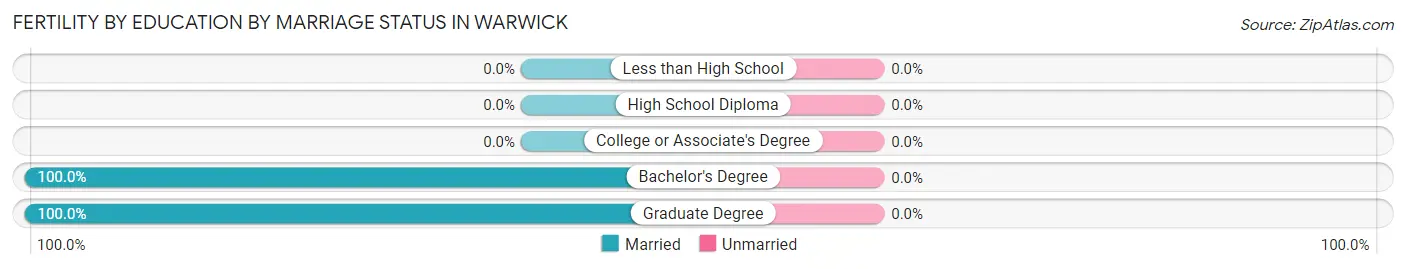
| Educational Attainment | Married | Unmarried |
| Less than High School | 0 (0.0%) | 0 (0.0%) |
| High School Diploma | 0 (0.0%) | 0 (0.0%) |
| College or Associate's Degree | 0 (0.0%) | 0 (0.0%) |
| Bachelor's Degree | 39 (100.0%) | 0 (0.0%) |
| Graduate Degree | 8 (100.0%) | 0 (0.0%) |
| Total | 47 (100.0%) | 0 (0.0%) |
Income in Warwick
Income Overview in Warwick
Per Capita Income in Warwick is $50,484, while median incomes of families and households are $142,121 and $85,736 respectively.
| Characteristic | Number | Measure |
| Per Capita Income | 6,653 | $50,484 |
| Median Family Income | 1,650 | $142,121 |
| Mean Family Income | 1,650 | $146,733 |
| Median Household Income | 3,121 | $85,736 |
| Mean Household Income | 3,121 | $104,578 |
| Income Deficit | 1,650 | $0 |
| Wage / Income Gap (%) | 6,653 | 10.99% |
| Wage / Income Gap ($) | 6,653 | 89.01¢ per $1 |
| Gini / Inequality Index | 6,653 | 0.46 |
Earnings by Sex in Warwick
Average Earnings in Warwick are $52,643, $54,693 for men and $48,684 for women, a difference of 11.0%.
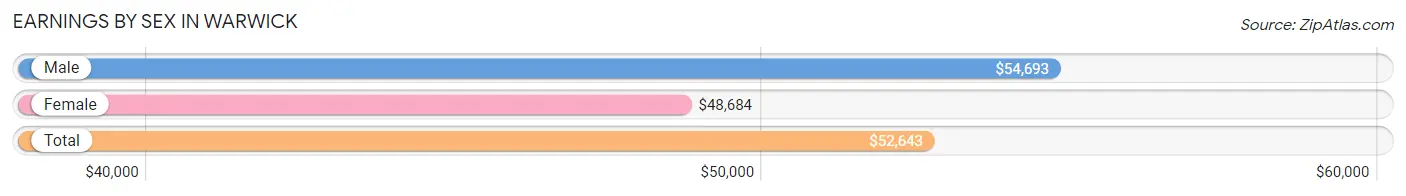
| Sex | Number | Average Earnings |
| Male | 1,833 (51.8%) | $54,693 |
| Female | 1,708 (48.2%) | $48,684 |
| Total | 3,541 (100.0%) | $52,643 |
Earnings by Sex by Income Bracket in Warwick
The most common earnings brackets in Warwick are $100,000+ for men (508 | 27.7%) and $100,000+ for women (478 | 28.0%).
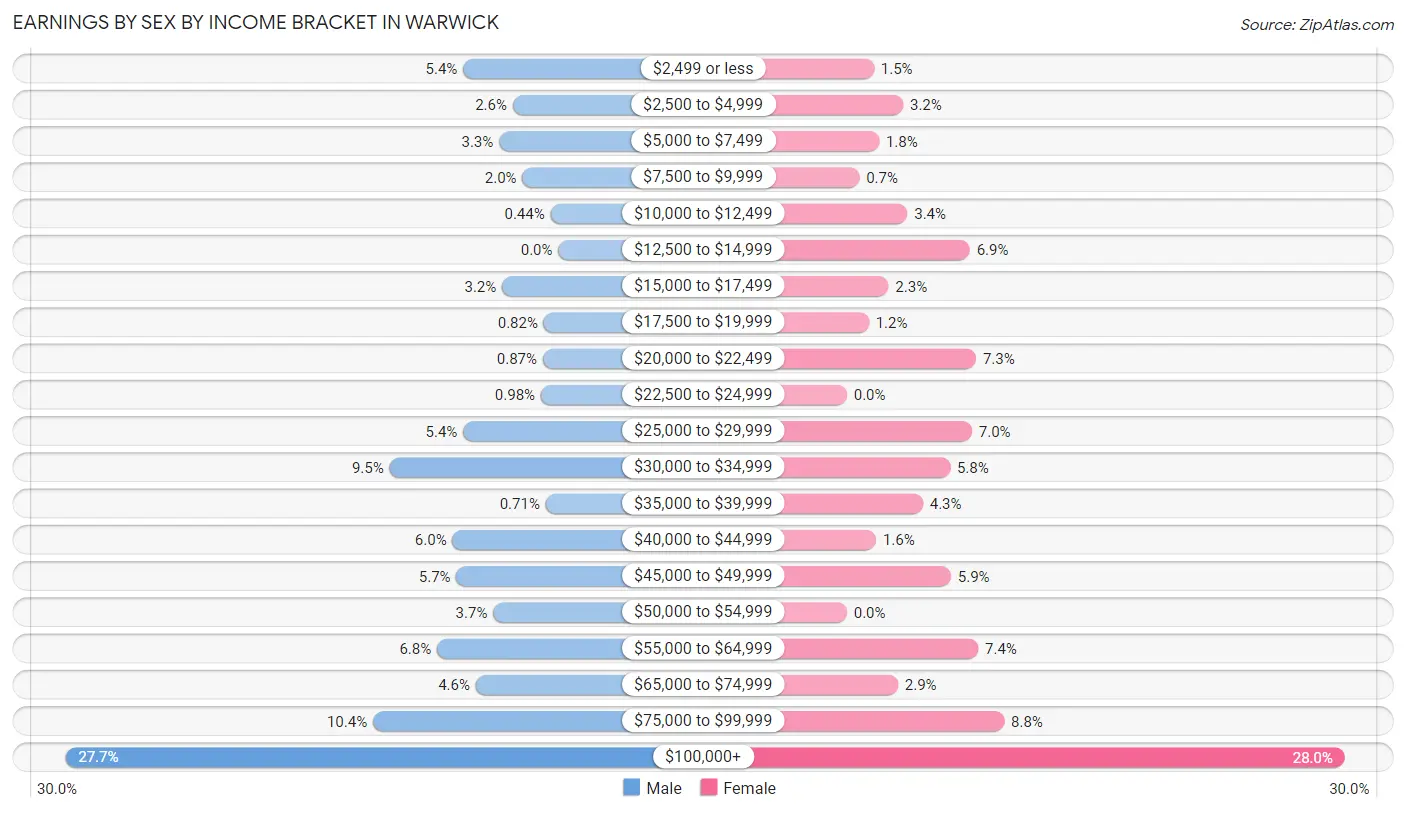
| Income | Male | Female |
| $2,499 or less | 98 (5.3%) | 26 (1.5%) |
| $2,500 to $4,999 | 47 (2.6%) | 54 (3.2%) |
| $5,000 to $7,499 | 61 (3.3%) | 31 (1.8%) |
| $7,500 to $9,999 | 37 (2.0%) | 12 (0.7%) |
| $10,000 to $12,499 | 8 (0.4%) | 58 (3.4%) |
| $12,500 to $14,999 | 0 (0.0%) | 118 (6.9%) |
| $15,000 to $17,499 | 58 (3.2%) | 40 (2.3%) |
| $17,500 to $19,999 | 15 (0.8%) | 21 (1.2%) |
| $20,000 to $22,499 | 16 (0.9%) | 124 (7.3%) |
| $22,500 to $24,999 | 18 (1.0%) | 0 (0.0%) |
| $25,000 to $29,999 | 98 (5.3%) | 120 (7.0%) |
| $30,000 to $34,999 | 174 (9.5%) | 99 (5.8%) |
| $35,000 to $39,999 | 13 (0.7%) | 73 (4.3%) |
| $40,000 to $44,999 | 109 (5.9%) | 28 (1.6%) |
| $45,000 to $49,999 | 105 (5.7%) | 100 (5.9%) |
| $50,000 to $54,999 | 67 (3.7%) | 0 (0.0%) |
| $55,000 to $64,999 | 125 (6.8%) | 126 (7.4%) |
| $65,000 to $74,999 | 85 (4.6%) | 49 (2.9%) |
| $75,000 to $99,999 | 191 (10.4%) | 151 (8.8%) |
| $100,000+ | 508 (27.7%) | 478 (28.0%) |
| Total | 1,833 (100.0%) | 1,708 (100.0%) |
Earnings by Sex by Educational Attainment in Warwick
Average earnings in Warwick are $61,467 for men and $49,605 for women, a difference of 19.3%. Men with an educational attainment of graduate degree enjoy the highest average annual earnings of $113,920, while those with high school diploma education earn the least with $41,790. Women with an educational attainment of graduate degree earn the most with the average annual earnings of $110,357, while those with college or associate's degree education have the smallest earnings of $21,139.
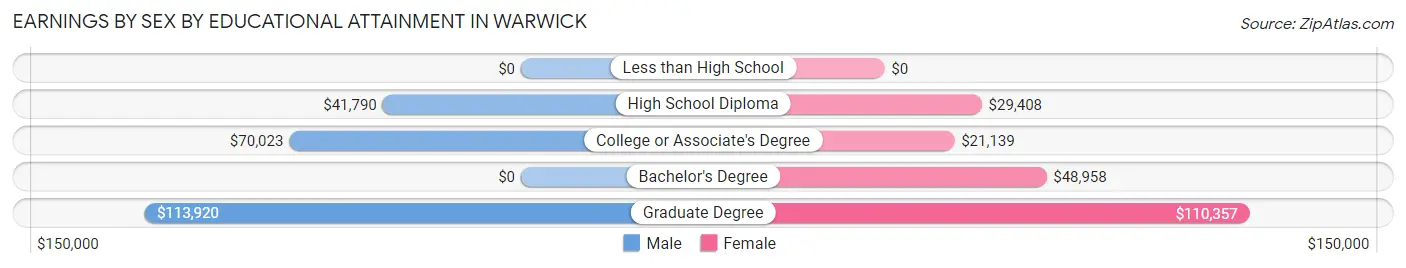
| Educational Attainment | Male Income | Female Income |
| Less than High School | - | - |
| High School Diploma | $41,790 | $29,408 |
| College or Associate's Degree | $70,023 | $21,139 |
| Bachelor's Degree | - | - |
| Graduate Degree | $113,920 | $110,357 |
| Total | $61,467 | $49,605 |
Family Income in Warwick
Family Income Brackets in Warwick
According to the Warwick family income data, there are 470 families falling into the $150,000 to $199,999 income range, which is the most common income bracket and makes up 28.5% of all families. Conversely, the less than $10,000 income bracket is the least frequent group with only 13 families (0.8%) belonging to this category.
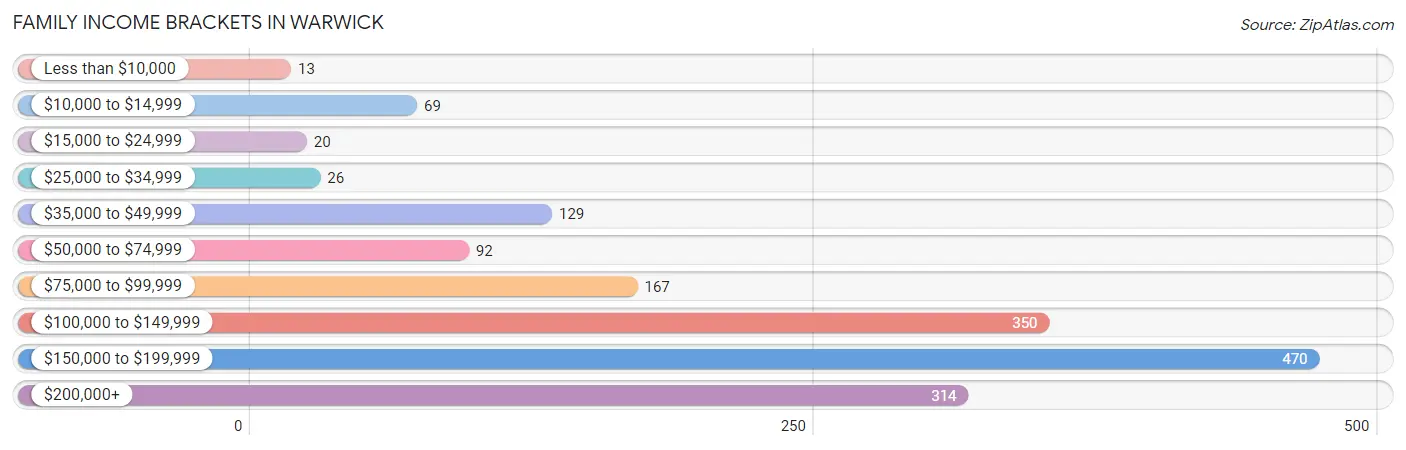
| Income Bracket | # Families | % Families |
| Less than $10,000 | 13 | 0.8% |
| $10,000 to $14,999 | 69 | 4.2% |
| $15,000 to $24,999 | 20 | 1.2% |
| $25,000 to $34,999 | 26 | 1.6% |
| $35,000 to $49,999 | 129 | 7.8% |
| $50,000 to $74,999 | 92 | 5.6% |
| $75,000 to $99,999 | 167 | 10.1% |
| $100,000 to $149,999 | 350 | 21.2% |
| $150,000 to $199,999 | 470 | 28.5% |
| $200,000+ | 314 | 19.0% |
Family Income by Famaliy Size in Warwick
3-person families (215 | 13.0%) account for the highest median family income in Warwick with $198,723 per family, while 3-person families (215 | 13.0%) have the highest median income of $66,241 per family member.
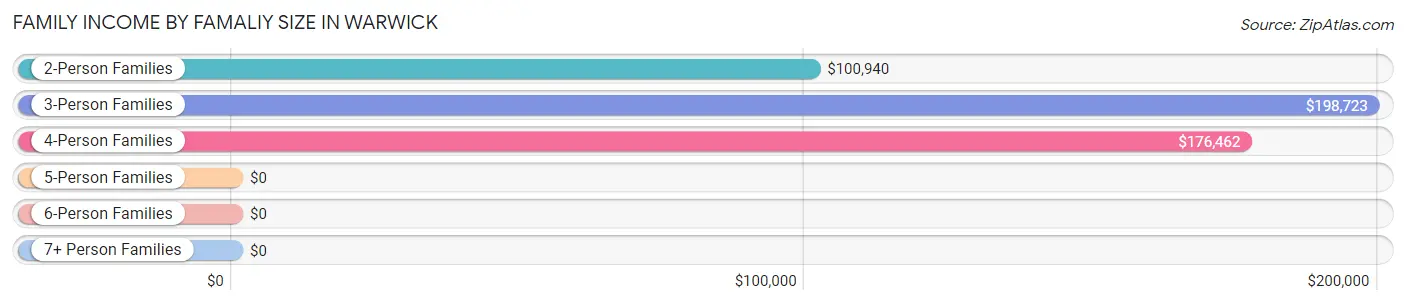
| Income Bracket | # Families | Median Income |
| 2-Person Families | 883 (53.5%) | $100,940 |
| 3-Person Families | 215 (13.0%) | $198,723 |
| 4-Person Families | 482 (29.2%) | $176,462 |
| 5-Person Families | 70 (4.2%) | $0 |
| 6-Person Families | 0 (0.0%) | $0 |
| 7+ Person Families | 0 (0.0%) | $0 |
| Total | 1,650 (100.0%) | $142,121 |
Family Income by Number of Earners in Warwick
The median family income in Warwick is $142,121, with families comprising 3+ earners (116) having the highest median family income of $183,667, while families with no earners (312) have the lowest median family income of $78,667, accounting for 7.0% and 18.9% of families, respectively.
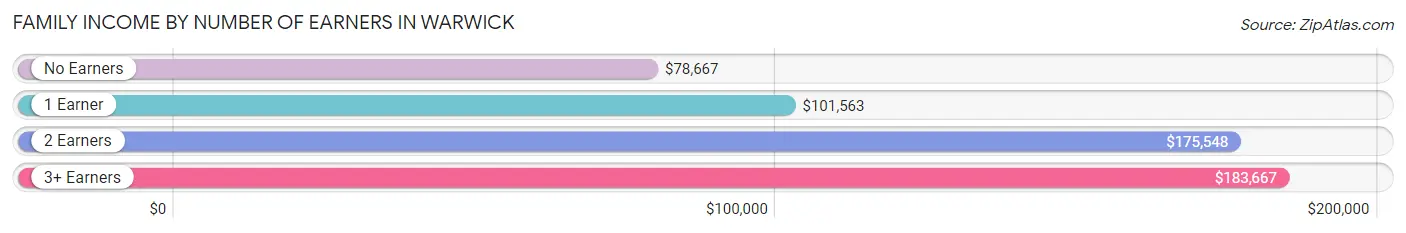
| Number of Earners | # Families | Median Income |
| No Earners | 312 (18.9%) | $78,667 |
| 1 Earner | 397 (24.1%) | $101,563 |
| 2 Earners | 825 (50.0%) | $175,548 |
| 3+ Earners | 116 (7.0%) | $183,667 |
| Total | 1,650 (100.0%) | $142,121 |
Household Income in Warwick
Household Income Brackets in Warwick
With 524 households falling in the category, the $100,000 to $149,999 income range is the most frequent in Warwick, accounting for 16.8% of all households. In contrast, only 69 households (2.2%) fall into the $10,000 to $14,999 income bracket, making it the least populous group.
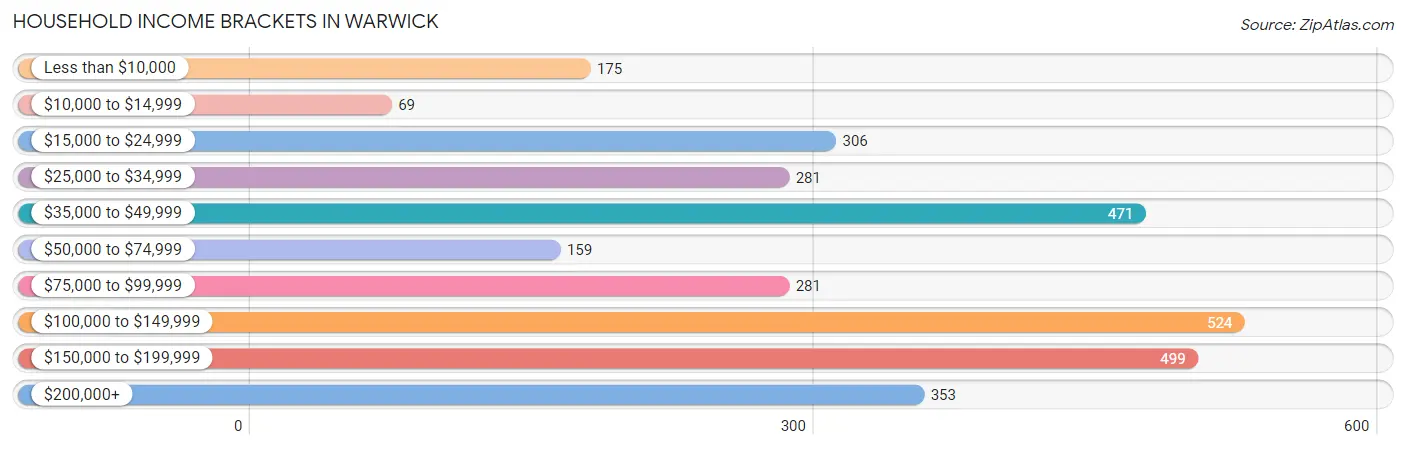
| Income Bracket | # Households | % Households |
| Less than $10,000 | 175 | 5.6% |
| $10,000 to $14,999 | 69 | 2.2% |
| $15,000 to $24,999 | 306 | 9.8% |
| $25,000 to $34,999 | 281 | 9.0% |
| $35,000 to $49,999 | 471 | 15.1% |
| $50,000 to $74,999 | 159 | 5.1% |
| $75,000 to $99,999 | 281 | 9.0% |
| $100,000 to $149,999 | 524 | 16.8% |
| $150,000 to $199,999 | 499 | 16.0% |
| $200,000+ | 353 | 11.3% |
Household Income by Householder Age in Warwick
The median household income in Warwick is $85,736, with the highest median household income of $152,353 found in the 25 to 44 years age bracket for the primary householder. A total of 702 households (22.5%) fall into this category. Meanwhile, the 15 to 24 years age bracket for the primary householder has the lowest median household income of $0, with 39 households (1.3%) in this group.
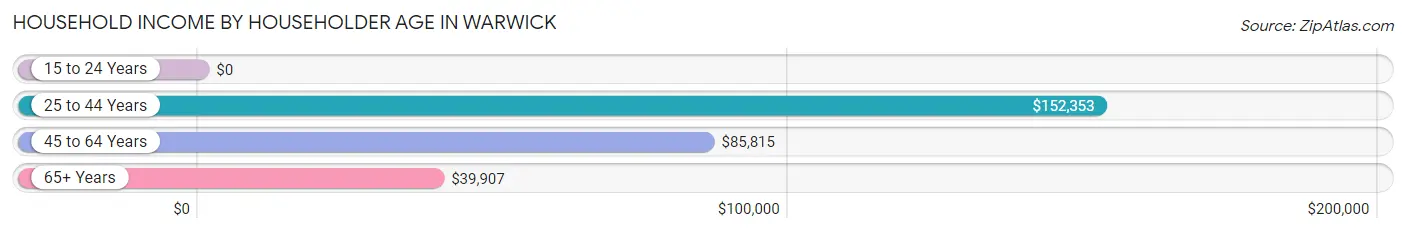
| Income Bracket | # Households | Median Income |
| 15 to 24 Years | 39 (1.3%) | $0 |
| 25 to 44 Years | 702 (22.5%) | $152,353 |
| 45 to 64 Years | 1,088 (34.9%) | $85,815 |
| 65+ Years | 1,292 (41.4%) | $39,907 |
| Total | 3,121 (100.0%) | $85,736 |
Poverty in Warwick
Income Below Poverty by Sex and Age in Warwick
With 5.4% poverty level for males and 8.5% for females among the residents of Warwick, 25 to 34 year old males and 12 to 14 year old females are the most vulnerable to poverty, with 100 males (26.7%) and 16 females (33.3%) in their respective age groups living below the poverty level.
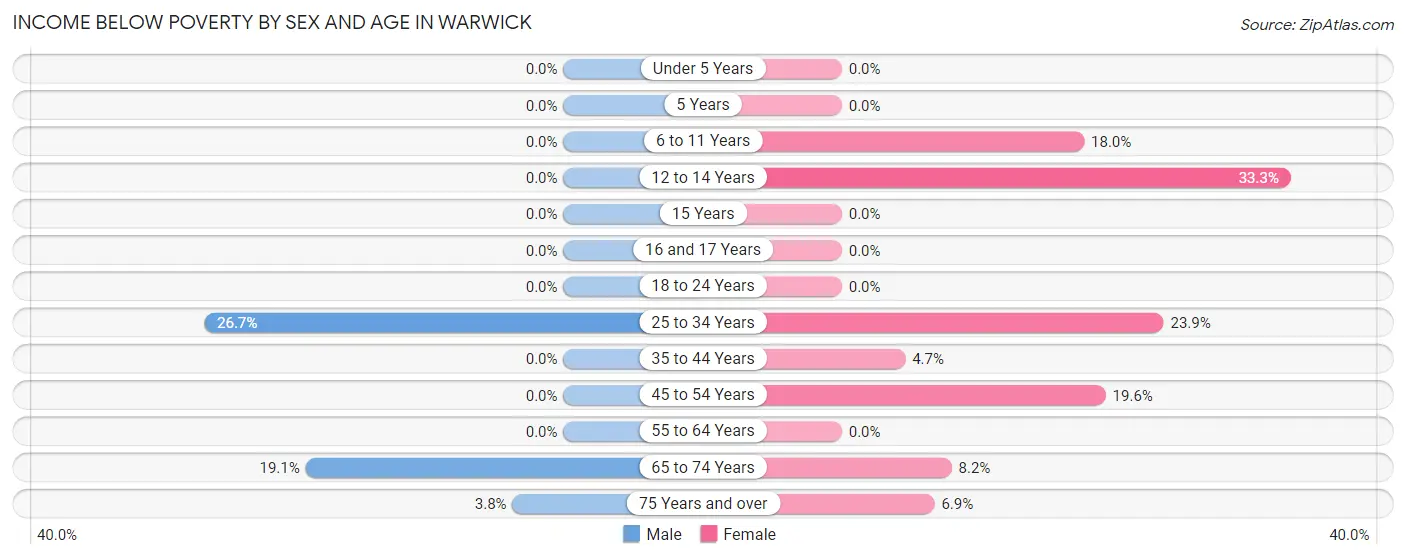
| Age Bracket | Male | Female |
| Under 5 Years | 0 (0.0%) | 0 (0.0%) |
| 5 Years | 0 (0.0%) | 0 (0.0%) |
| 6 to 11 Years | 0 (0.0%) | 34 (18.0%) |
| 12 to 14 Years | 0 (0.0%) | 16 (33.3%) |
| 15 Years | 0 (0.0%) | 0 (0.0%) |
| 16 and 17 Years | 0 (0.0%) | 0 (0.0%) |
| 18 to 24 Years | 0 (0.0%) | 0 (0.0%) |
| 25 to 34 Years | 100 (26.7%) | 86 (23.9%) |
| 35 to 44 Years | 0 (0.0%) | 21 (4.7%) |
| 45 to 54 Years | 0 (0.0%) | 57 (19.6%) |
| 55 to 64 Years | 0 (0.0%) | 0 (0.0%) |
| 65 to 74 Years | 49 (19.1%) | 49 (8.2%) |
| 75 Years and over | 14 (3.8%) | 38 (6.9%) |
| Total | 163 (5.4%) | 301 (8.5%) |
Income Above Poverty by Sex and Age in Warwick
According to the poverty statistics in Warwick, males aged under 5 years and females aged under 5 years are the age groups that are most secure financially, with 100.0% of males and 100.0% of females in these age groups living above the poverty line.
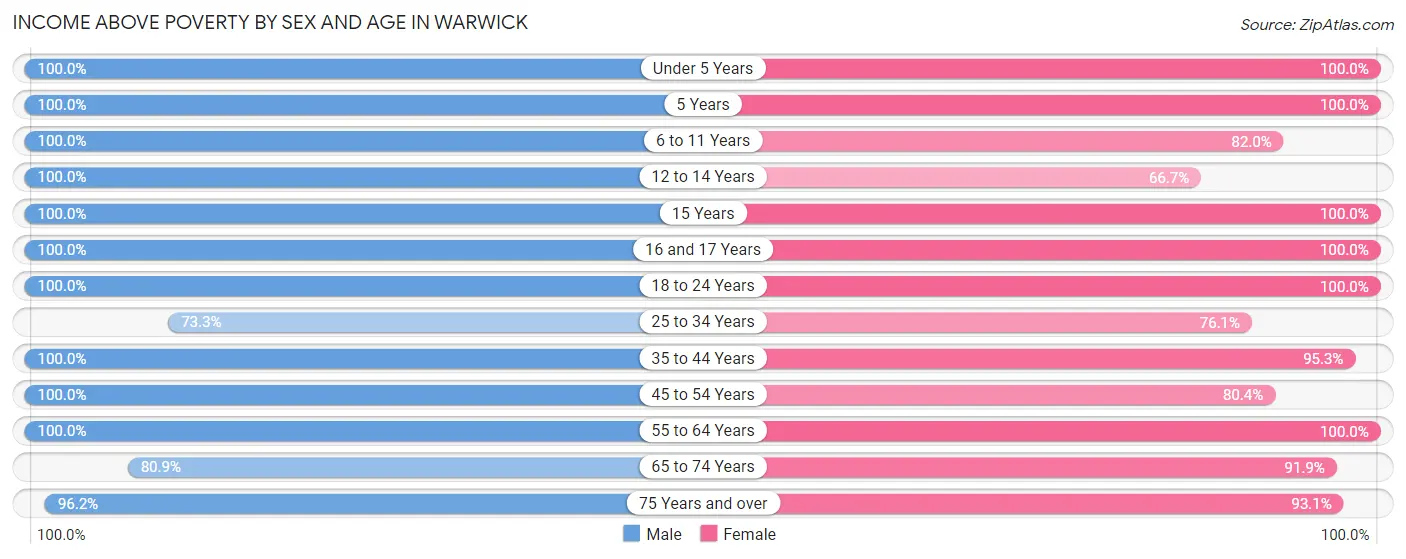
| Age Bracket | Male | Female |
| Under 5 Years | 57 (100.0%) | 209 (100.0%) |
| 5 Years | 10 (100.0%) | 26 (100.0%) |
| 6 to 11 Years | 277 (100.0%) | 155 (82.0%) |
| 12 to 14 Years | 168 (100.0%) | 32 (66.7%) |
| 15 Years | 47 (100.0%) | 74 (100.0%) |
| 16 and 17 Years | 46 (100.0%) | 52 (100.0%) |
| 18 to 24 Years | 216 (100.0%) | 81 (100.0%) |
| 25 to 34 Years | 275 (73.3%) | 274 (76.1%) |
| 35 to 44 Years | 385 (100.0%) | 425 (95.3%) |
| 45 to 54 Years | 346 (100.0%) | 234 (80.4%) |
| 55 to 64 Years | 481 (100.0%) | 600 (100.0%) |
| 65 to 74 Years | 207 (80.9%) | 552 (91.8%) |
| 75 Years and over | 356 (96.2%) | 514 (93.1%) |
| Total | 2,871 (94.6%) | 3,228 (91.5%) |
Income Below Poverty Among Married-Couple Families in Warwick
The poverty statistics for married-couple families in Warwick show that 1.1% or 14 of the total 1,325 families live below the poverty line. Families with no children have the highest poverty rate of 1.7%, comprising of 14 families. On the other hand, families with 1 or 2 children have the lowest poverty rate of 0.0%, which includes 0 families.
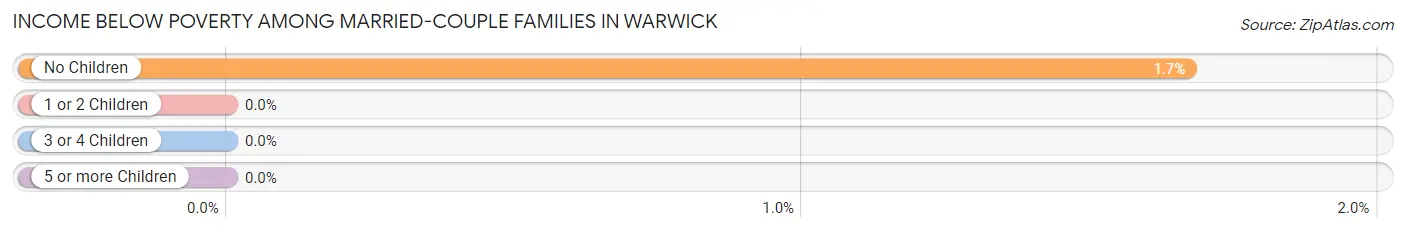
| Children | Above Poverty | Below Poverty |
| No Children | 822 (98.3%) | 14 (1.7%) |
| 1 or 2 Children | 451 (100.0%) | 0 (0.0%) |
| 3 or 4 Children | 38 (100.0%) | 0 (0.0%) |
| 5 or more Children | 0 (0.0%) | 0 (0.0%) |
| Total | 1,311 (98.9%) | 14 (1.1%) |
Income Below Poverty Among Single-Parent Households in Warwick
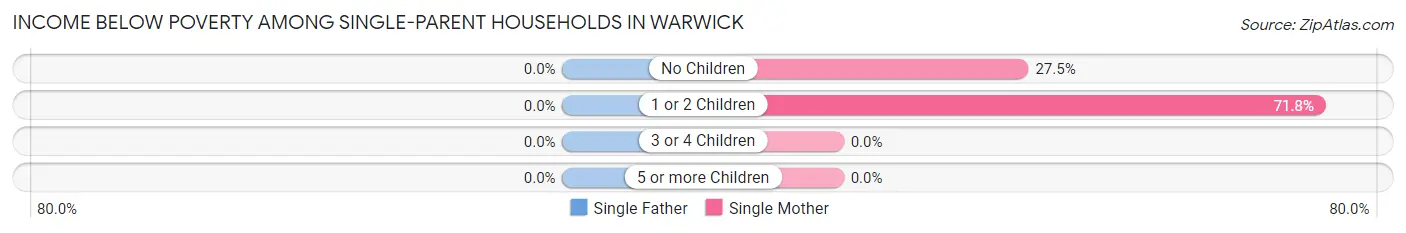
| Children | Single Father | Single Mother |
| No Children | 0 (0.0%) | 38 (27.5%) |
| 1 or 2 Children | 0 (0.0%) | 51 (71.8%) |
| 3 or 4 Children | 0 (0.0%) | 0 (0.0%) |
| 5 or more Children | 0 (0.0%) | 0 (0.0%) |
| Total | 0 (0.0%) | 89 (36.5%) |
Income Below Poverty Among Married-Couple vs Single-Parent Households in Warwick
The poverty data for Warwick shows that 14 of the married-couple family households (1.1%) and 89 of the single-parent households (27.4%) are living below the poverty level. Within the married-couple family households, those with no children have the highest poverty rate, with 14 households (1.7%) falling below the poverty line. Among the single-parent households, those with 1 or 2 children have the highest poverty rate, with 51 household (38.9%) living below poverty.
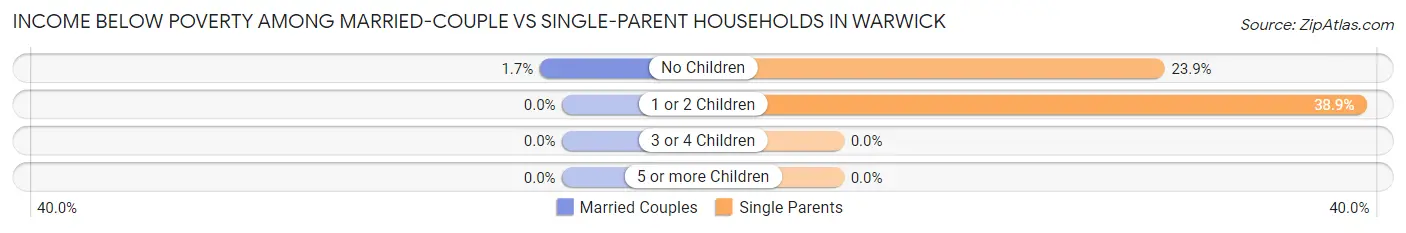
| Children | Married-Couple Families | Single-Parent Households |
| No Children | 14 (1.7%) | 38 (23.9%) |
| 1 or 2 Children | 0 (0.0%) | 51 (38.9%) |
| 3 or 4 Children | 0 (0.0%) | 0 (0.0%) |
| 5 or more Children | 0 (0.0%) | 0 (0.0%) |
| Total | 14 (1.1%) | 89 (27.4%) |
Employment Characteristics in Warwick
Employment by Class of Employer in Warwick
Among the 3,197 employed individuals in Warwick, private company employees (1,945 | 60.8%), local government employees (370 | 11.6%), and not-for-profit organizations (333 | 10.4%) make up the most common classes of employment.
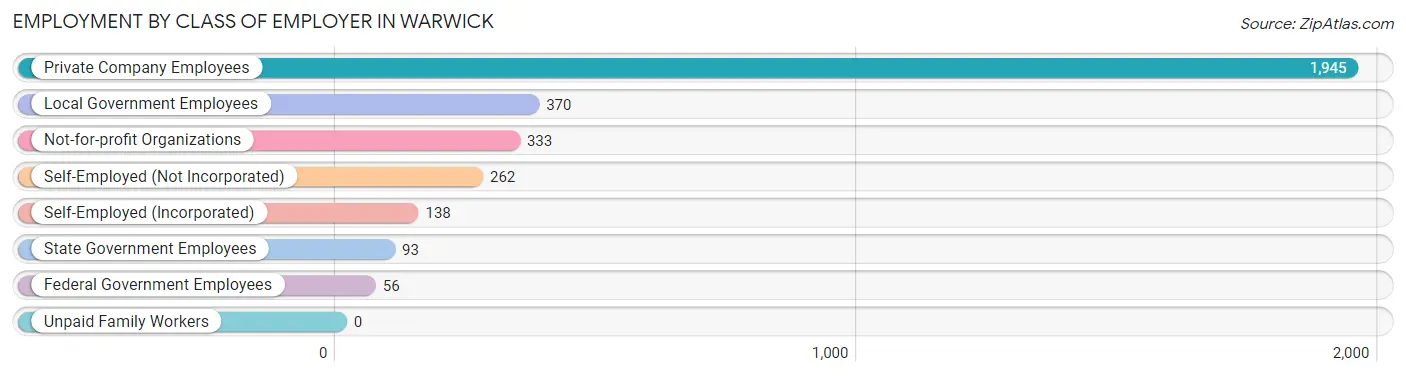
| Employer Class | # Employees | % Employees |
| Private Company Employees | 1,945 | 60.8% |
| Self-Employed (Incorporated) | 138 | 4.3% |
| Self-Employed (Not Incorporated) | 262 | 8.2% |
| Not-for-profit Organizations | 333 | 10.4% |
| Local Government Employees | 370 | 11.6% |
| State Government Employees | 93 | 2.9% |
| Federal Government Employees | 56 | 1.8% |
| Unpaid Family Workers | 0 | 0.0% |
| Total | 3,197 | 100.0% |
Employment Status by Age in Warwick
According to the labor force statistics for Warwick, out of the total population over 16 years of age (5,548), 62.8% or 3,484 individuals are in the labor force, with 2.3% or 80 of them unemployed. The age group with the highest labor force participation rate is 45 to 54 years, with 98.3% or 626 individuals in the labor force. Within the labor force, the 16 to 19 years age range has the highest percentage of unemployed individuals, with 18.3% or 11 of them being unemployed.
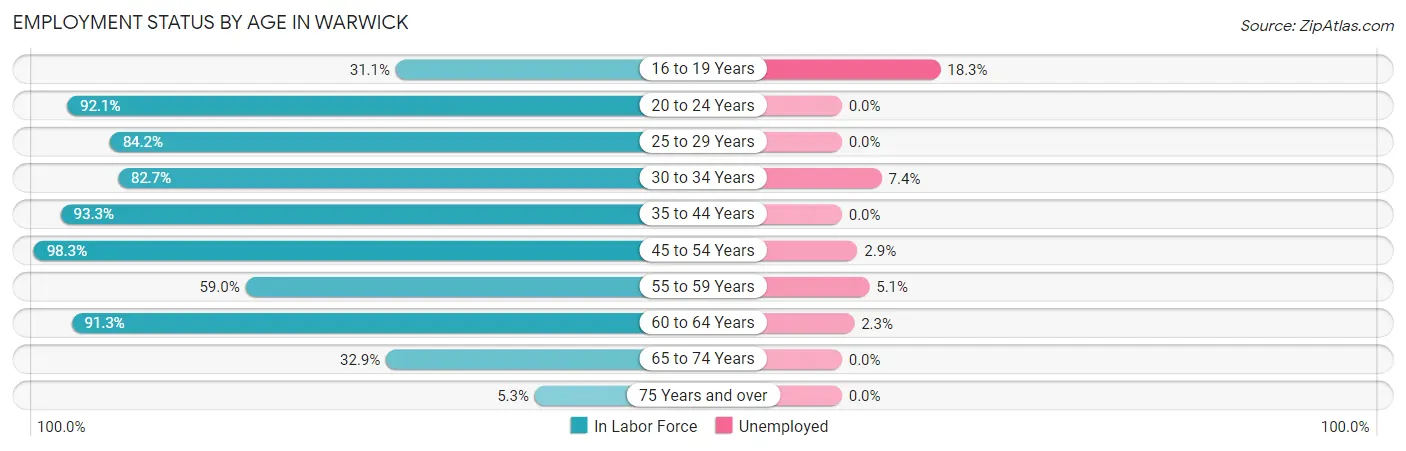
| Age Bracket | In Labor Force | Unemployed |
| 16 to 19 Years | 60 (31.1%) | 11 (18.3%) |
| 20 to 24 Years | 186 (92.1%) | 0 (0.0%) |
| 25 to 29 Years | 288 (84.2%) | 0 (0.0%) |
| 30 to 34 Years | 325 (82.7%) | 24 (7.4%) |
| 35 to 44 Years | 775 (93.3%) | 0 (0.0%) |
| 45 to 54 Years | 626 (98.3%) | 18 (2.9%) |
| 55 to 59 Years | 197 (59.0%) | 10 (5.1%) |
| 60 to 64 Years | 691 (91.3%) | 16 (2.3%) |
| 65 to 74 Years | 283 (32.9%) | 0 (0.0%) |
| 75 Years and over | 53 (5.3%) | 0 (0.0%) |
| Total | 3,484 (62.8%) | 80 (2.3%) |
Employment Status by Educational Attainment in Warwick
According to labor force statistics for Warwick, 88.1% of individuals (2,902) out of the total population between 25 and 64 years of age (3,294) are in the labor force, with 2.3% or 67 of them being unemployed. The group with the highest labor force participation rate are those with the educational attainment of bachelor's degree or higher, with 90.4% or 1,467 individuals in the labor force. Within the labor force, individuals with college / associate degree education have the highest percentage of unemployment, with 4.6% or 28 of them being unemployed.
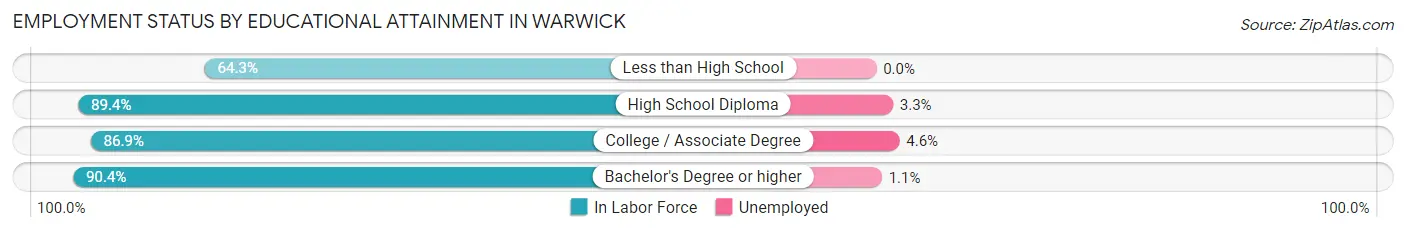
| Educational Attainment | In Labor Force | Unemployed |
| Less than High School | 110 (64.3%) | 0 (0.0%) |
| High School Diploma | 720 (89.4%) | 27 (3.3%) |
| College / Associate Degree | 604 (86.9%) | 32 (4.6%) |
| Bachelor's Degree or higher | 1,467 (90.4%) | 18 (1.1%) |
| Total | 2,902 (88.1%) | 76 (2.3%) |
Employment Occupations by Sex in Warwick
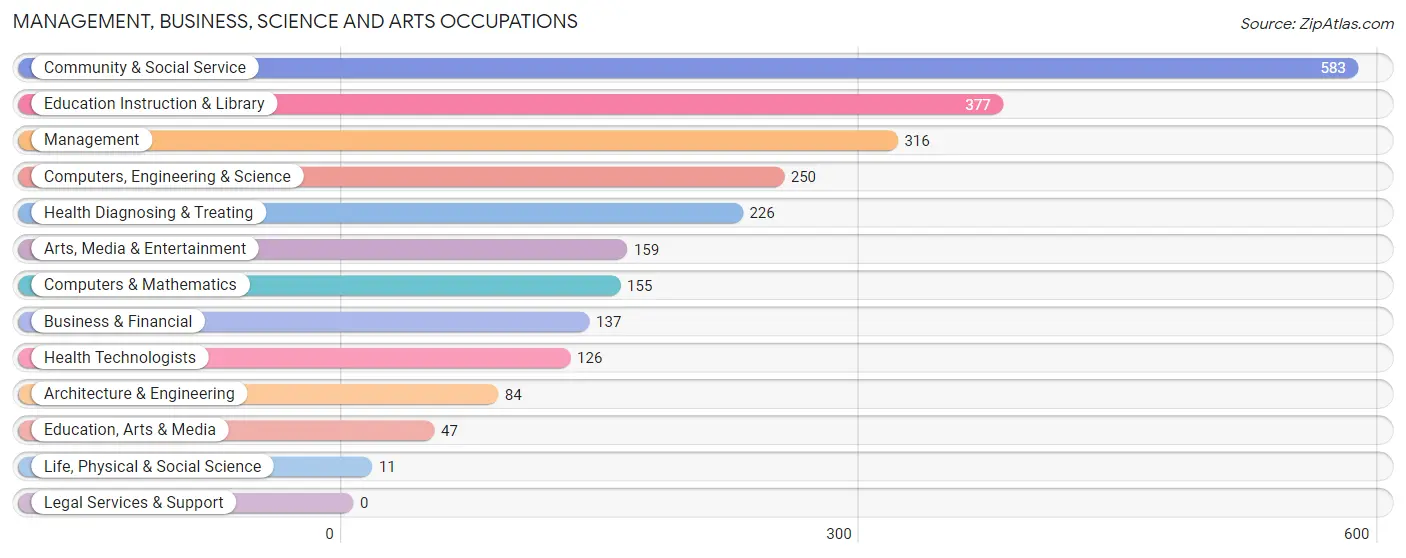
Management, Business, Science and Arts Occupations
The most common Management, Business, Science and Arts occupations in Warwick are Community & Social Service (583 | 17.1%), Education Instruction & Library (377 | 11.1%), Management (316 | 9.3%), Computers, Engineering & Science (250 | 7.3%), and Health Diagnosing & Treating (226 | 6.6%).
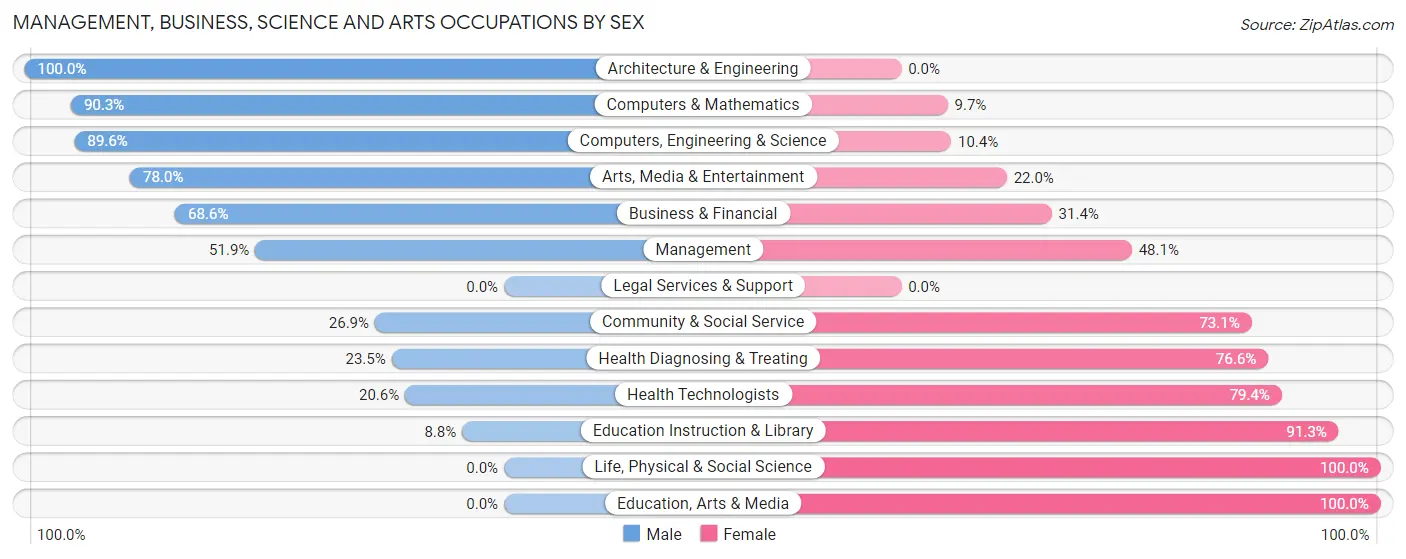
Management, Business, Science and Arts Occupations by Sex
Within the Management, Business, Science and Arts occupations in Warwick, the most male-oriented occupations are Architecture & Engineering (100.0%), Computers & Mathematics (90.3%), and Computers, Engineering & Science (89.6%), while the most female-oriented occupations are Life, Physical & Social Science (100.0%), Education, Arts & Media (100.0%), and Education Instruction & Library (91.2%).
| Occupation | Male | Female |
| Management | 164 (51.9%) | 152 (48.1%) |
| Business & Financial | 94 (68.6%) | 43 (31.4%) |
| Computers, Engineering & Science | 224 (89.6%) | 26 (10.4%) |
| Computers & Mathematics | 140 (90.3%) | 15 (9.7%) |
| Architecture & Engineering | 84 (100.0%) | 0 (0.0%) |
| Life, Physical & Social Science | 0 (0.0%) | 11 (100.0%) |
| Community & Social Service | 157 (26.9%) | 426 (73.1%) |
| Education, Arts & Media | 0 (0.0%) | 47 (100.0%) |
| Legal Services & Support | 0 (0.0%) | 0 (0.0%) |
| Education Instruction & Library | 33 (8.7%) | 344 (91.2%) |
| Arts, Media & Entertainment | 124 (78.0%) | 35 (22.0%) |
| Health Diagnosing & Treating | 53 (23.4%) | 173 (76.5%) |
| Health Technologists | 26 (20.6%) | 100 (79.4%) |
| Total (Category) | 692 (45.8%) | 820 (54.2%) |
| Total (Overall) | 1,755 (51.5%) | 1,650 (48.5%) |
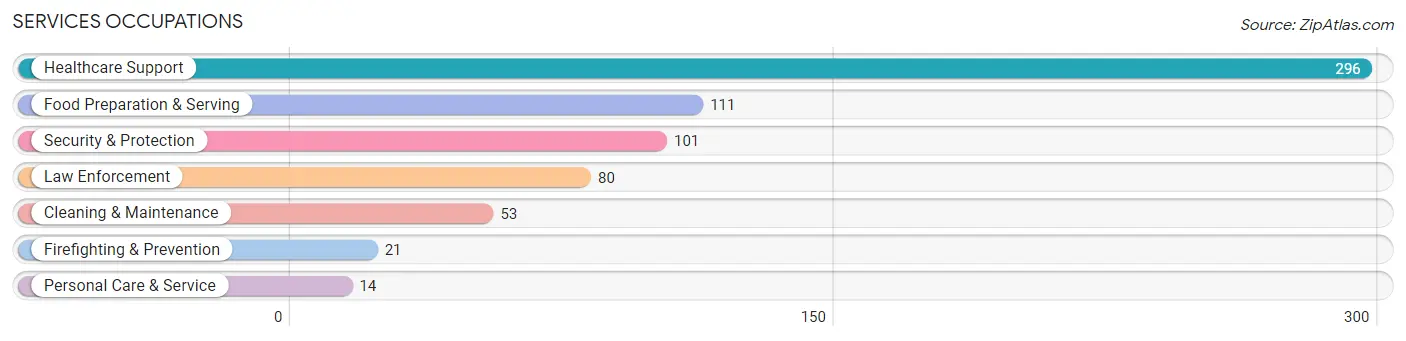
Services Occupations
The most common Services occupations in Warwick are Healthcare Support (296 | 8.7%), Food Preparation & Serving (111 | 3.3%), Security & Protection (101 | 3.0%), Law Enforcement (80 | 2.4%), and Cleaning & Maintenance (53 | 1.6%).
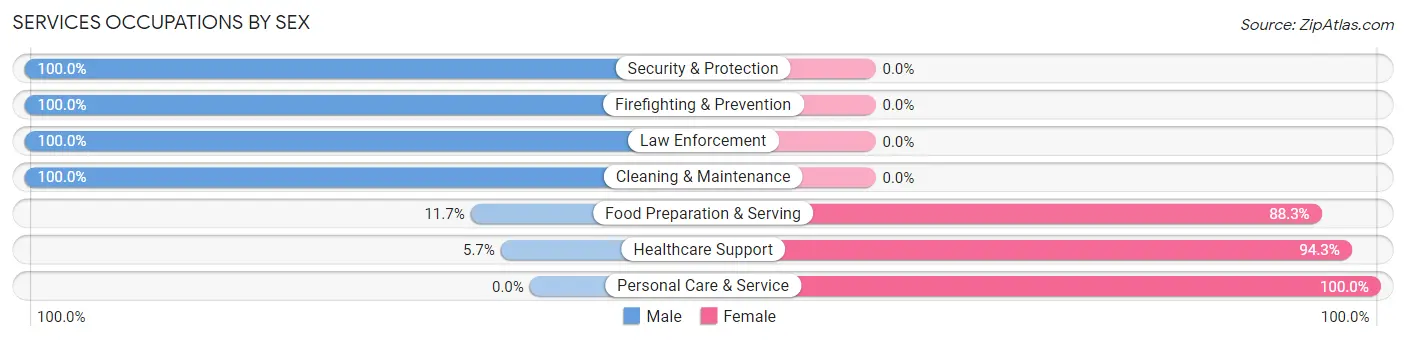
Services Occupations by Sex
Within the Services occupations in Warwick, the most male-oriented occupations are Security & Protection (100.0%), Firefighting & Prevention (100.0%), and Law Enforcement (100.0%), while the most female-oriented occupations are Personal Care & Service (100.0%), Healthcare Support (94.3%), and Food Preparation & Serving (88.3%).
| Occupation | Male | Female |
| Healthcare Support | 17 (5.7%) | 279 (94.3%) |
| Security & Protection | 101 (100.0%) | 0 (0.0%) |
| Firefighting & Prevention | 21 (100.0%) | 0 (0.0%) |
| Law Enforcement | 80 (100.0%) | 0 (0.0%) |
| Food Preparation & Serving | 13 (11.7%) | 98 (88.3%) |
| Cleaning & Maintenance | 53 (100.0%) | 0 (0.0%) |
| Personal Care & Service | 0 (0.0%) | 14 (100.0%) |
| Total (Category) | 184 (32.0%) | 391 (68.0%) |
| Total (Overall) | 1,755 (51.5%) | 1,650 (48.5%) |
Sales and Office Occupations
The most common Sales and Office occupations in Warwick are Office & Administration (367 | 10.8%), and Sales & Related (288 | 8.5%).

Sales and Office Occupations by Sex
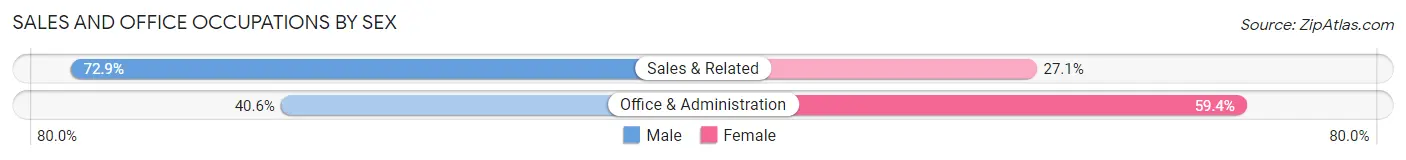
| Occupation | Male | Female |
| Sales & Related | 210 (72.9%) | 78 (27.1%) |
| Office & Administration | 149 (40.6%) | 218 (59.4%) |
| Total (Category) | 359 (54.8%) | 296 (45.2%) |
| Total (Overall) | 1,755 (51.5%) | 1,650 (48.5%) |
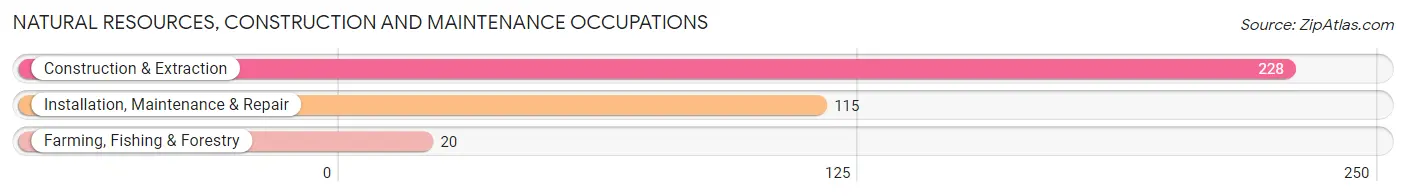
Natural Resources, Construction and Maintenance Occupations
The most common Natural Resources, Construction and Maintenance occupations in Warwick are Construction & Extraction (228 | 6.7%), Installation, Maintenance & Repair (115 | 3.4%), and Farming, Fishing & Forestry (20 | 0.6%).
Natural Resources, Construction and Maintenance Occupations by Sex
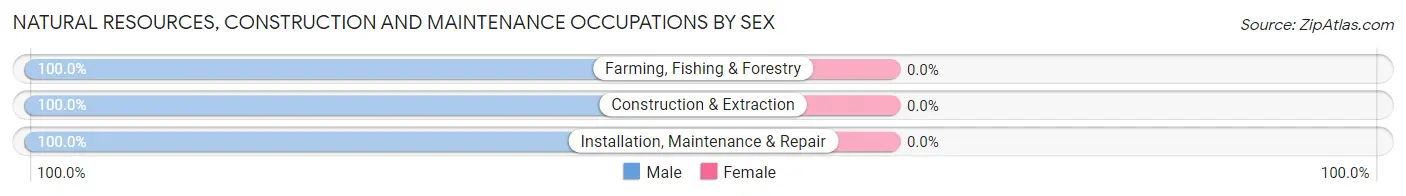
| Occupation | Male | Female |
| Farming, Fishing & Forestry | 20 (100.0%) | 0 (0.0%) |
| Construction & Extraction | 228 (100.0%) | 0 (0.0%) |
| Installation, Maintenance & Repair | 115 (100.0%) | 0 (0.0%) |
| Total (Category) | 363 (100.0%) | 0 (0.0%) |
| Total (Overall) | 1,755 (51.5%) | 1,650 (48.5%) |
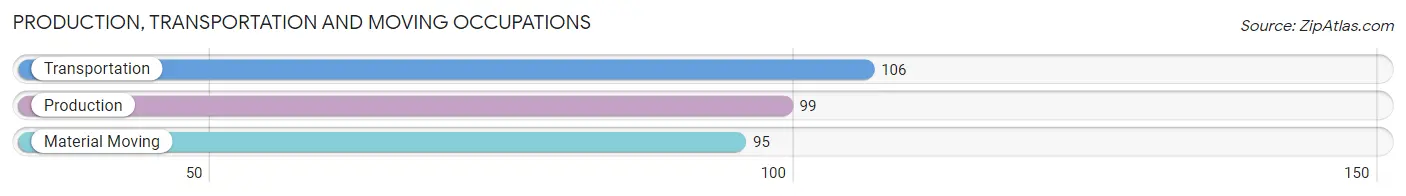
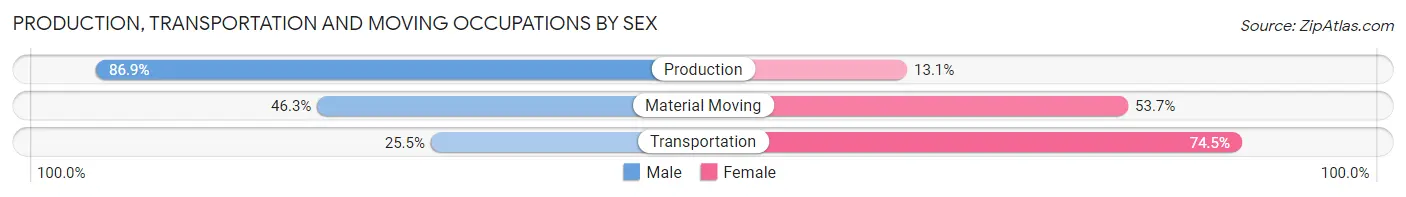
Production, Transportation and Moving Occupations
The most common Production, Transportation and Moving occupations in Warwick are Transportation (106 | 3.1%), Production (99 | 2.9%), and Material Moving (95 | 2.8%).
Production, Transportation and Moving Occupations by Sex
| Occupation | Male | Female |
| Production | 86 (86.9%) | 13 (13.1%) |
| Transportation | 27 (25.5%) | 79 (74.5%) |
| Material Moving | 44 (46.3%) | 51 (53.7%) |
| Total (Category) | 157 (52.3%) | 143 (47.7%) |
| Total (Overall) | 1,755 (51.5%) | 1,650 (48.5%) |
Employment Industries by Sex in Warwick
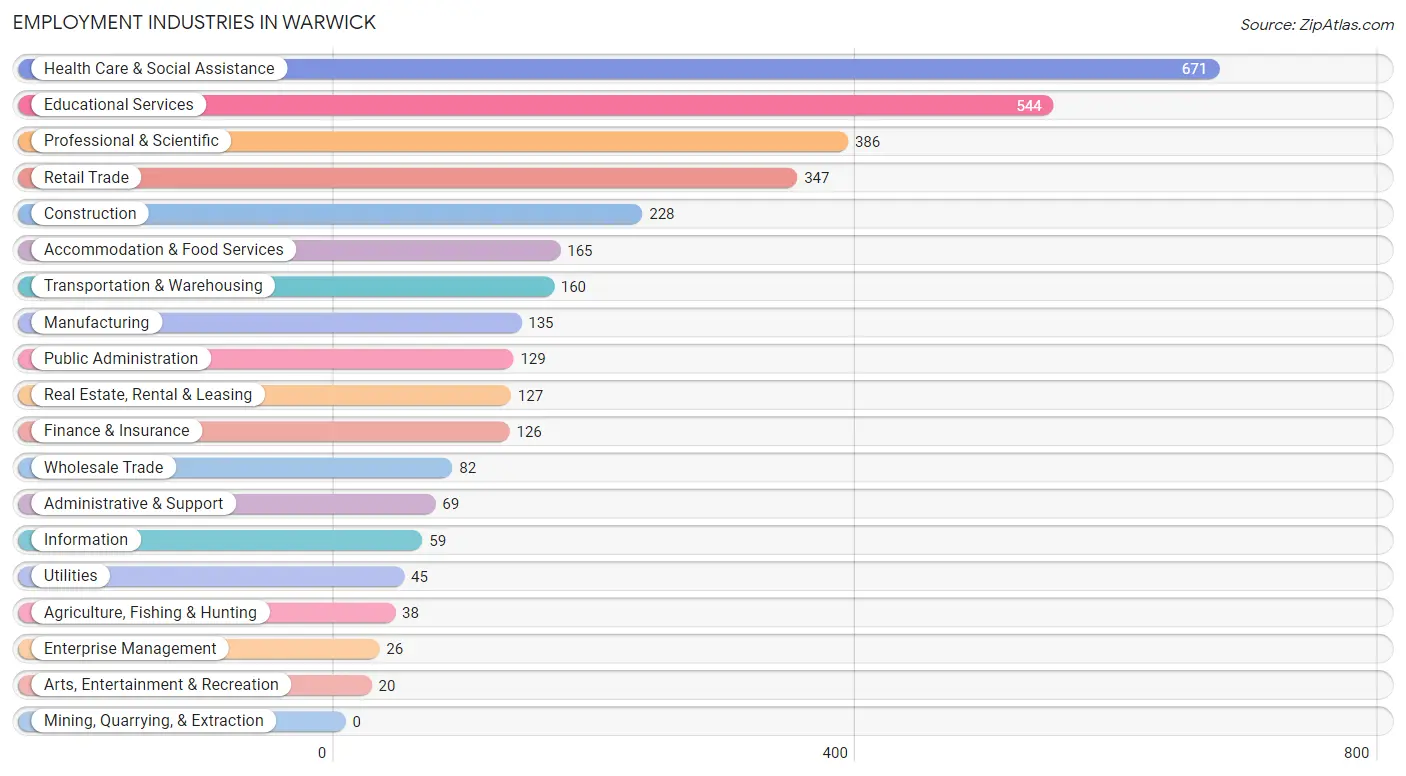
Employment Industries in Warwick
The major employment industries in Warwick include Health Care & Social Assistance (671 | 19.7%), Educational Services (544 | 16.0%), Professional & Scientific (386 | 11.3%), Retail Trade (347 | 10.2%), and Construction (228 | 6.7%).
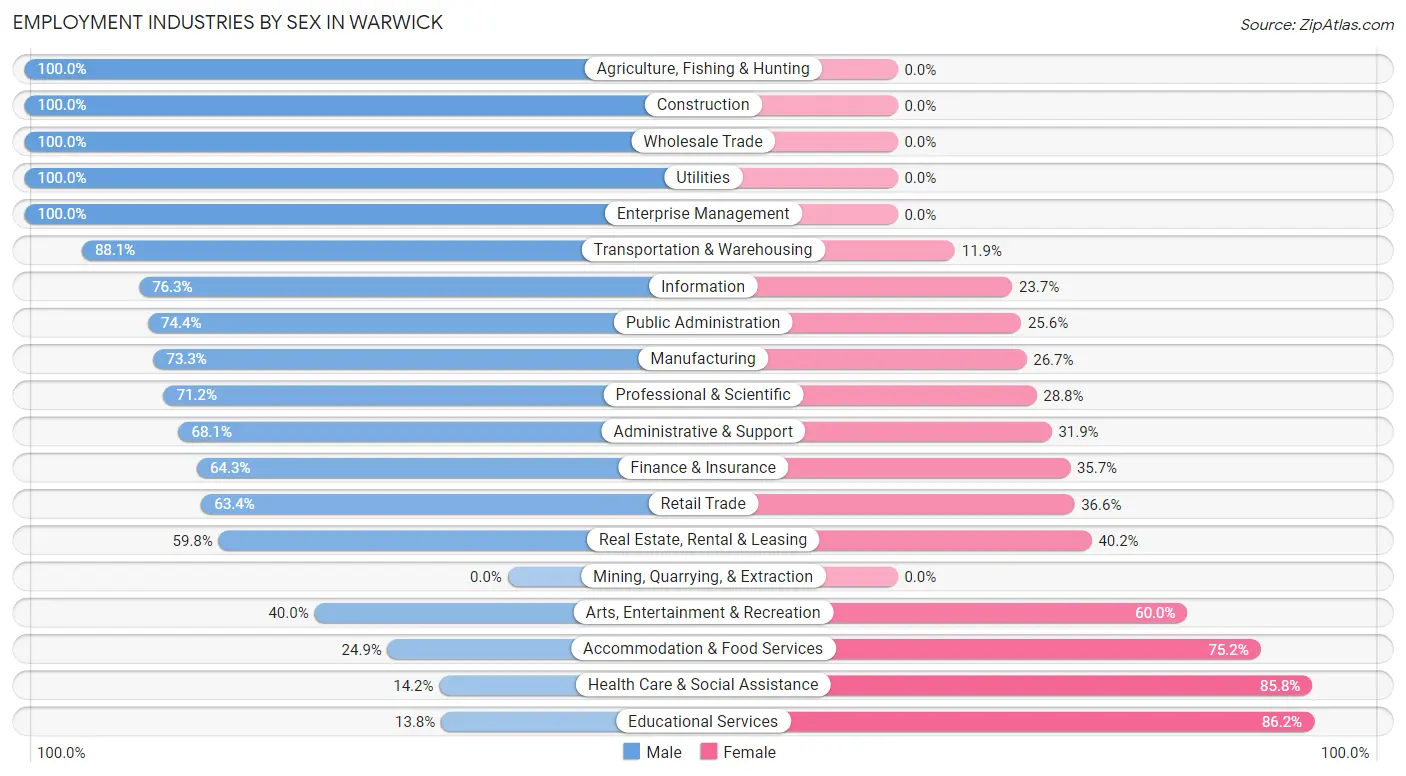
Employment Industries by Sex in Warwick
The Warwick industries that see more men than women are Agriculture, Fishing & Hunting (100.0%), Construction (100.0%), and Wholesale Trade (100.0%), whereas the industries that tend to have a higher number of women are Educational Services (86.2%), Health Care & Social Assistance (85.8%), and Accommodation & Food Services (75.1%).
| Industry | Male | Female |
| Agriculture, Fishing & Hunting | 38 (100.0%) | 0 (0.0%) |
| Mining, Quarrying, & Extraction | 0 (0.0%) | 0 (0.0%) |
| Construction | 228 (100.0%) | 0 (0.0%) |
| Manufacturing | 99 (73.3%) | 36 (26.7%) |
| Wholesale Trade | 82 (100.0%) | 0 (0.0%) |
| Retail Trade | 220 (63.4%) | 127 (36.6%) |
| Transportation & Warehousing | 141 (88.1%) | 19 (11.9%) |
| Utilities | 45 (100.0%) | 0 (0.0%) |
| Information | 45 (76.3%) | 14 (23.7%) |
| Finance & Insurance | 81 (64.3%) | 45 (35.7%) |
| Real Estate, Rental & Leasing | 76 (59.8%) | 51 (40.2%) |
| Professional & Scientific | 275 (71.2%) | 111 (28.8%) |
| Enterprise Management | 26 (100.0%) | 0 (0.0%) |
| Administrative & Support | 47 (68.1%) | 22 (31.9%) |
| Educational Services | 75 (13.8%) | 469 (86.2%) |
| Health Care & Social Assistance | 95 (14.2%) | 576 (85.8%) |
| Arts, Entertainment & Recreation | 8 (40.0%) | 12 (60.0%) |
| Accommodation & Food Services | 41 (24.8%) | 124 (75.1%) |
| Public Administration | 96 (74.4%) | 33 (25.6%) |
| Total | 1,755 (51.5%) | 1,650 (48.5%) |
Education in Warwick
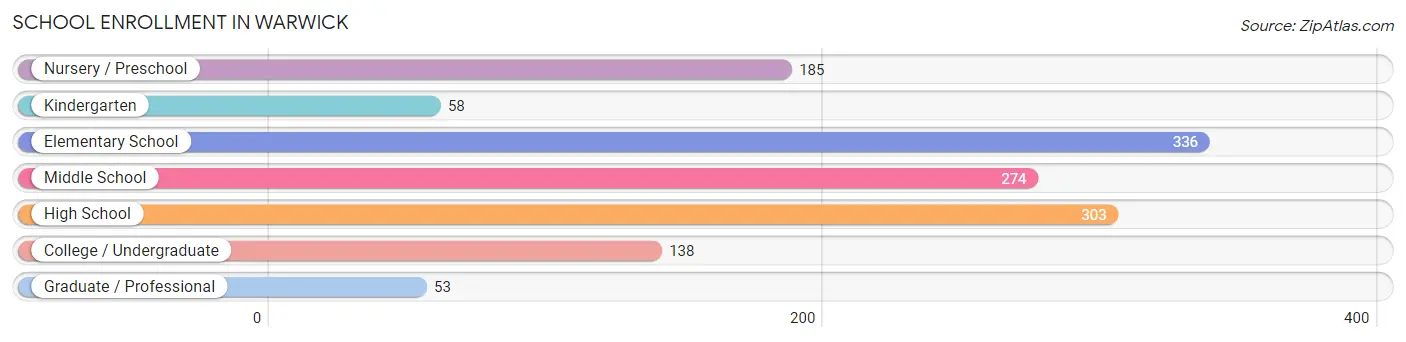
School Enrollment in Warwick
The most common levels of schooling among the 1,347 students in Warwick are elementary school (336 | 24.9%), high school (303 | 22.5%), and middle school (274 | 20.3%).
| School Level | # Students | % Students |
| Nursery / Preschool | 185 | 13.7% |
| Kindergarten | 58 | 4.3% |
| Elementary School | 336 | 24.9% |
| Middle School | 274 | 20.3% |
| High School | 303 | 22.5% |
| College / Undergraduate | 138 | 10.2% |
| Graduate / Professional | 53 | 3.9% |
| Total | 1,347 | 100.0% |
School Enrollment by Age by Funding Source in Warwick
Out of a total of 1,347 students who are enrolled in schools in Warwick, 51 (3.8%) attend a private institution, while the remaining 1,296 (96.2%) are enrolled in public schools. The age group of 35 years and over has the highest likelihood of being enrolled in private schools, with 11 (25.0% in the age bracket) enrolled. Conversely, the age group of 5 to 9 year old has the lowest likelihood of being enrolled in a private school, with 394 (100.0% in the age bracket) attending a public institution.
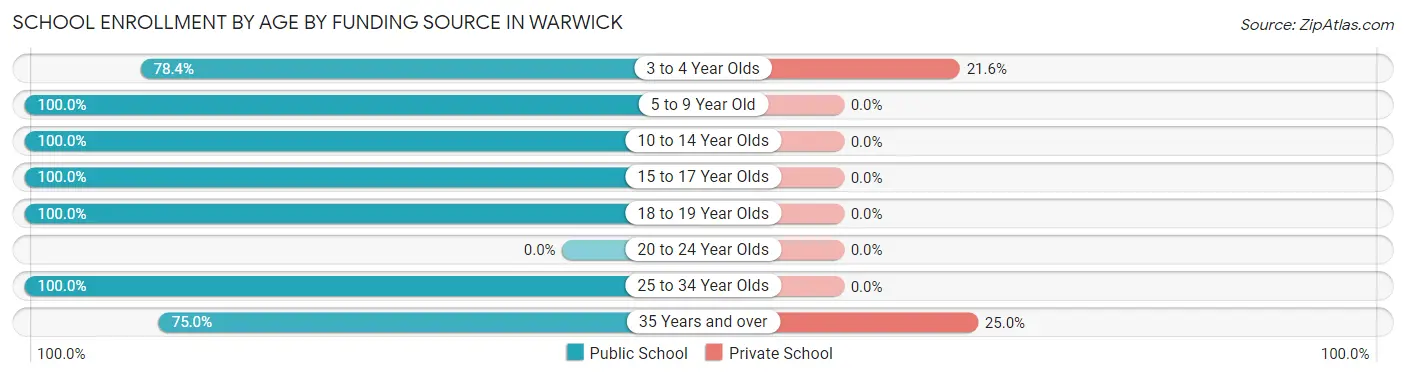
| Age Bracket | Public School | Private School |
| 3 to 4 Year Olds | 145 (78.4%) | 40 (21.6%) |
| 5 to 9 Year Old | 394 (100.0%) | 0 (0.0%) |
| 10 to 14 Year Olds | 300 (100.0%) | 0 (0.0%) |
| 15 to 17 Year Olds | 219 (100.0%) | 0 (0.0%) |
| 18 to 19 Year Olds | 95 (100.0%) | 0 (0.0%) |
| 20 to 24 Year Olds | 0 (0.0%) | 0 (0.0%) |
| 25 to 34 Year Olds | 110 (100.0%) | 0 (0.0%) |
| 35 Years and over | 33 (75.0%) | 11 (25.0%) |
| Total | 1,296 (96.2%) | 51 (3.8%) |
Educational Attainment by Field of Study in Warwick
Science & technology (403 | 16.6%), business (363 | 14.9%), education (322 | 13.2%), arts & humanities (230 | 9.5%), and physical & health sciences (183 | 7.5%) are the most common fields of study among 2,432 individuals in Warwick who have obtained a bachelor's degree or higher.
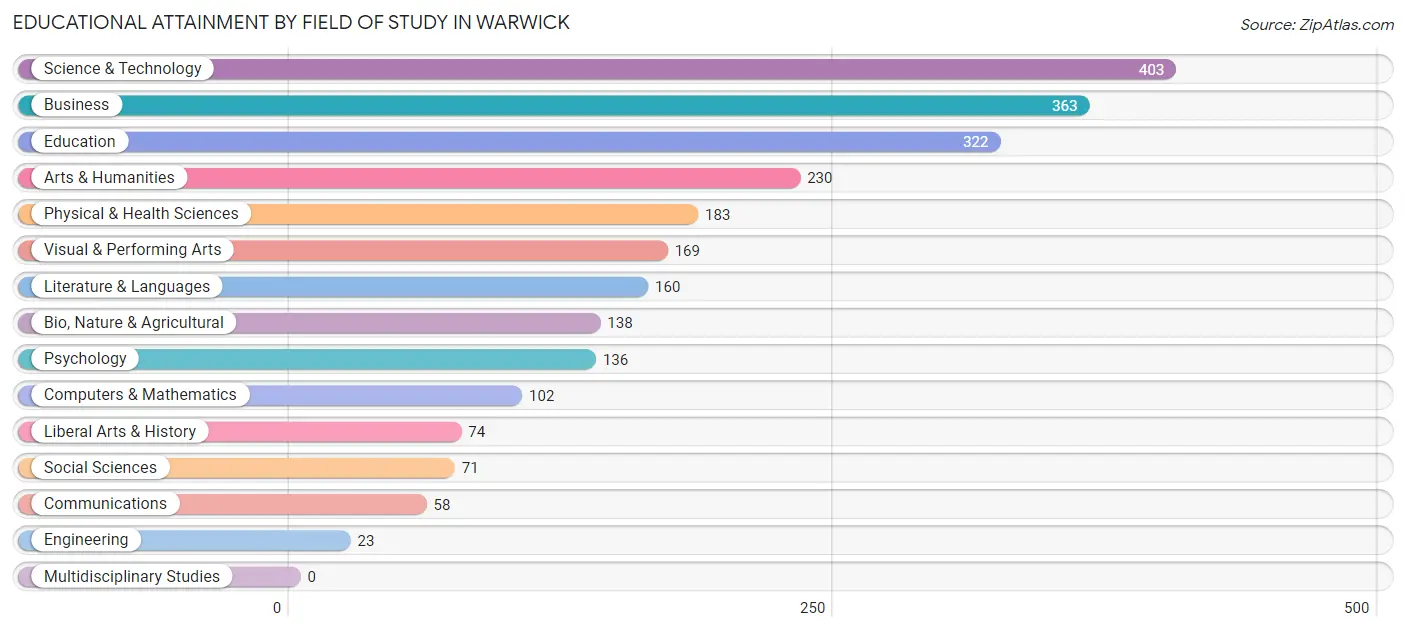
| Field of Study | # Graduates | % Graduates |
| Computers & Mathematics | 102 | 4.2% |
| Bio, Nature & Agricultural | 138 | 5.7% |
| Physical & Health Sciences | 183 | 7.5% |
| Psychology | 136 | 5.6% |
| Social Sciences | 71 | 2.9% |
| Engineering | 23 | 0.9% |
| Multidisciplinary Studies | 0 | 0.0% |
| Science & Technology | 403 | 16.6% |
| Business | 363 | 14.9% |
| Education | 322 | 13.2% |
| Literature & Languages | 160 | 6.6% |
| Liberal Arts & History | 74 | 3.0% |
| Visual & Performing Arts | 169 | 7.0% |
| Communications | 58 | 2.4% |
| Arts & Humanities | 230 | 9.5% |
| Total | 2,432 | 100.0% |
Transportation & Commute in Warwick
Vehicle Availability by Sex in Warwick
The most prevalent vehicle ownership categories in Warwick are males with 2 vehicles (873, accounting for 50.1%) and females with 2 vehicles (534, making up 60.1%).
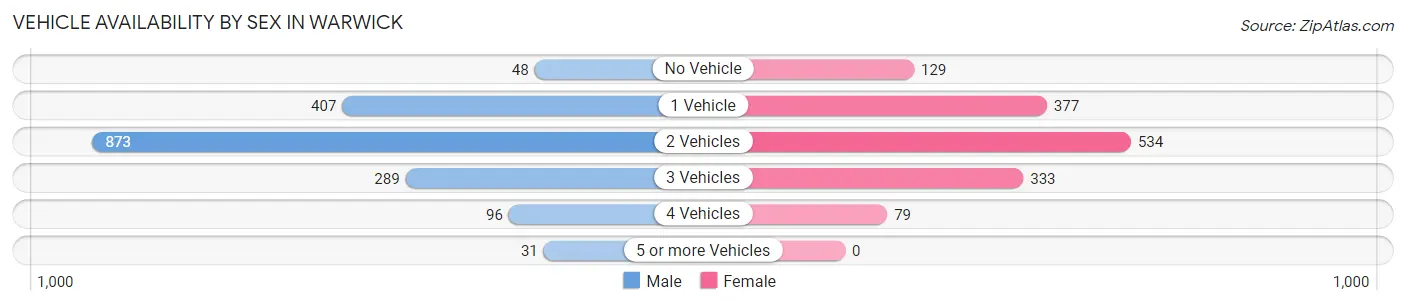
| Vehicles Available | Male | Female |
| No Vehicle | 48 (2.8%) | 129 (8.9%) |
| 1 Vehicle | 407 (23.3%) | 377 (26.0%) |
| 2 Vehicles | 873 (50.1%) | 534 (36.8%) |
| 3 Vehicles | 289 (16.6%) | 333 (22.9%) |
| 4 Vehicles | 96 (5.5%) | 79 (5.4%) |
| 5 or more Vehicles | 31 (1.8%) | 0 (0.0%) |
| Total | 1,744 (100.0%) | 1,452 (100.0%) |
Commute Time in Warwick
The most frequently occuring commute durations in Warwick are 60 to 89 minutes (454 commuters, 16.2%), 30 to 34 minutes (360 commuters, 12.8%), and 45 to 59 minutes (316 commuters, 11.3%).
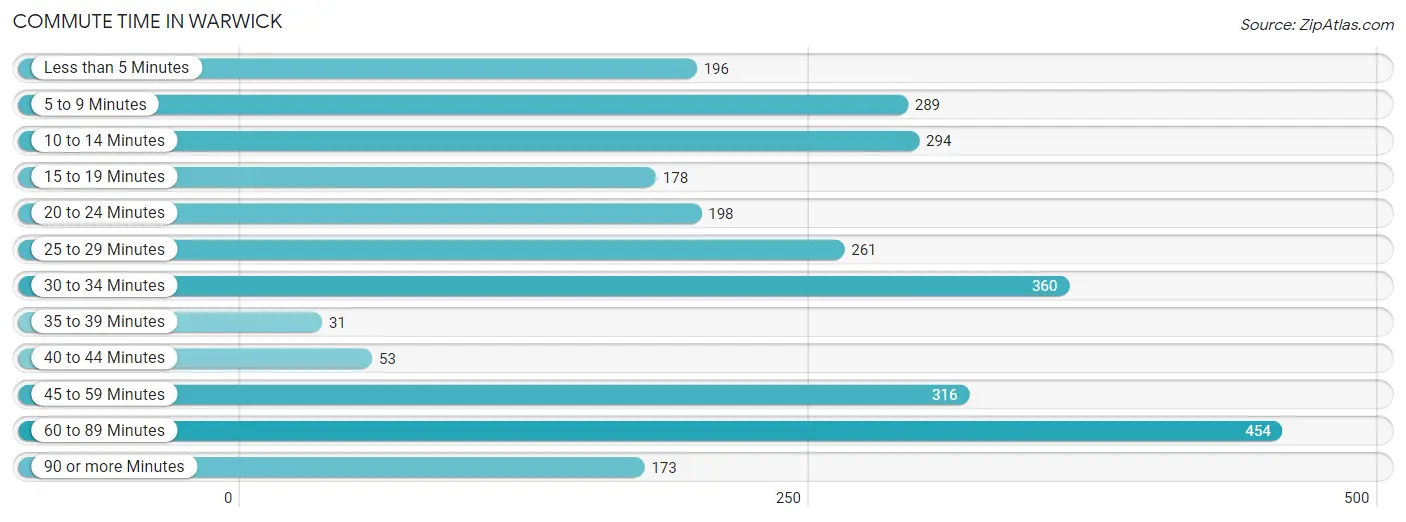
| Commute Time | # Commuters | % Commuters |
| Less than 5 Minutes | 196 | 7.0% |
| 5 to 9 Minutes | 289 | 10.3% |
| 10 to 14 Minutes | 294 | 10.5% |
| 15 to 19 Minutes | 178 | 6.4% |
| 20 to 24 Minutes | 198 | 7.1% |
| 25 to 29 Minutes | 261 | 9.3% |
| 30 to 34 Minutes | 360 | 12.8% |
| 35 to 39 Minutes | 31 | 1.1% |
| 40 to 44 Minutes | 53 | 1.9% |
| 45 to 59 Minutes | 316 | 11.3% |
| 60 to 89 Minutes | 454 | 16.2% |
| 90 or more Minutes | 173 | 6.2% |
Commute Time by Sex in Warwick
The most common commute times in Warwick are 60 to 89 minutes (358 commuters, 23.4%) for males and 30 to 34 minutes (306 commuters, 24.1%) for females.
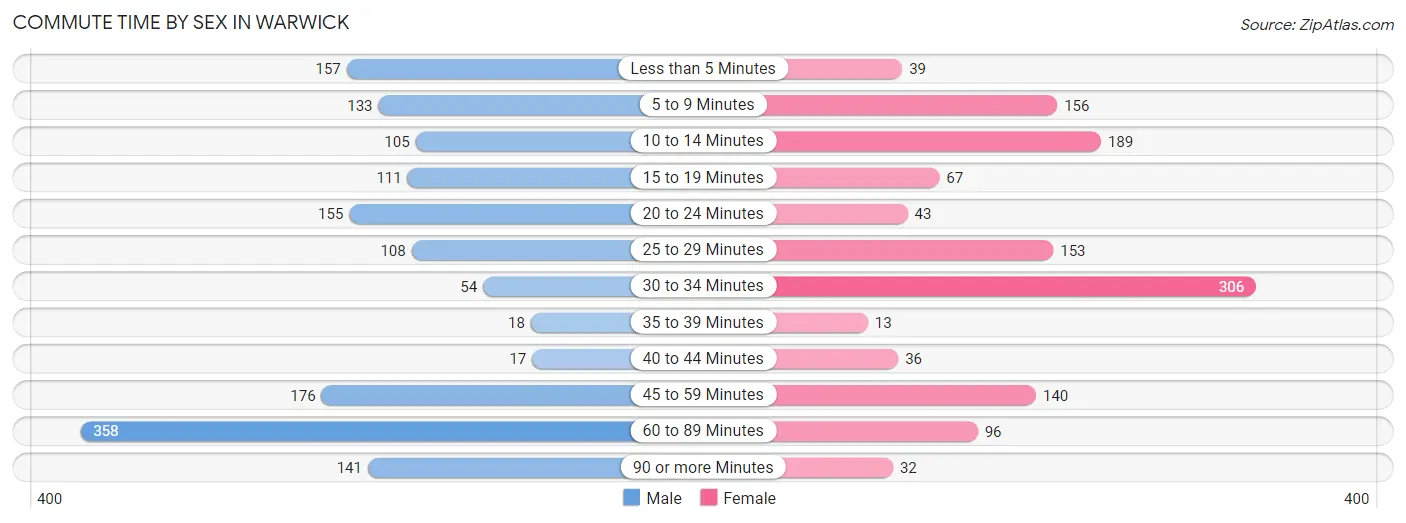
| Commute Time | Male | Female |
| Less than 5 Minutes | 157 (10.2%) | 39 (3.1%) |
| 5 to 9 Minutes | 133 (8.7%) | 156 (12.3%) |
| 10 to 14 Minutes | 105 (6.9%) | 189 (14.9%) |
| 15 to 19 Minutes | 111 (7.2%) | 67 (5.3%) |
| 20 to 24 Minutes | 155 (10.1%) | 43 (3.4%) |
| 25 to 29 Minutes | 108 (7.0%) | 153 (12.0%) |
| 30 to 34 Minutes | 54 (3.5%) | 306 (24.1%) |
| 35 to 39 Minutes | 18 (1.2%) | 13 (1.0%) |
| 40 to 44 Minutes | 17 (1.1%) | 36 (2.8%) |
| 45 to 59 Minutes | 176 (11.5%) | 140 (11.0%) |
| 60 to 89 Minutes | 358 (23.4%) | 96 (7.6%) |
| 90 or more Minutes | 141 (9.2%) | 32 (2.5%) |
Time of Departure to Work by Sex in Warwick
The most frequent times of departure to work in Warwick are 9:00 AM to 9:59 AM (186, 12.1%) for males and 7:00 AM to 7:29 AM (328, 25.8%) for females.
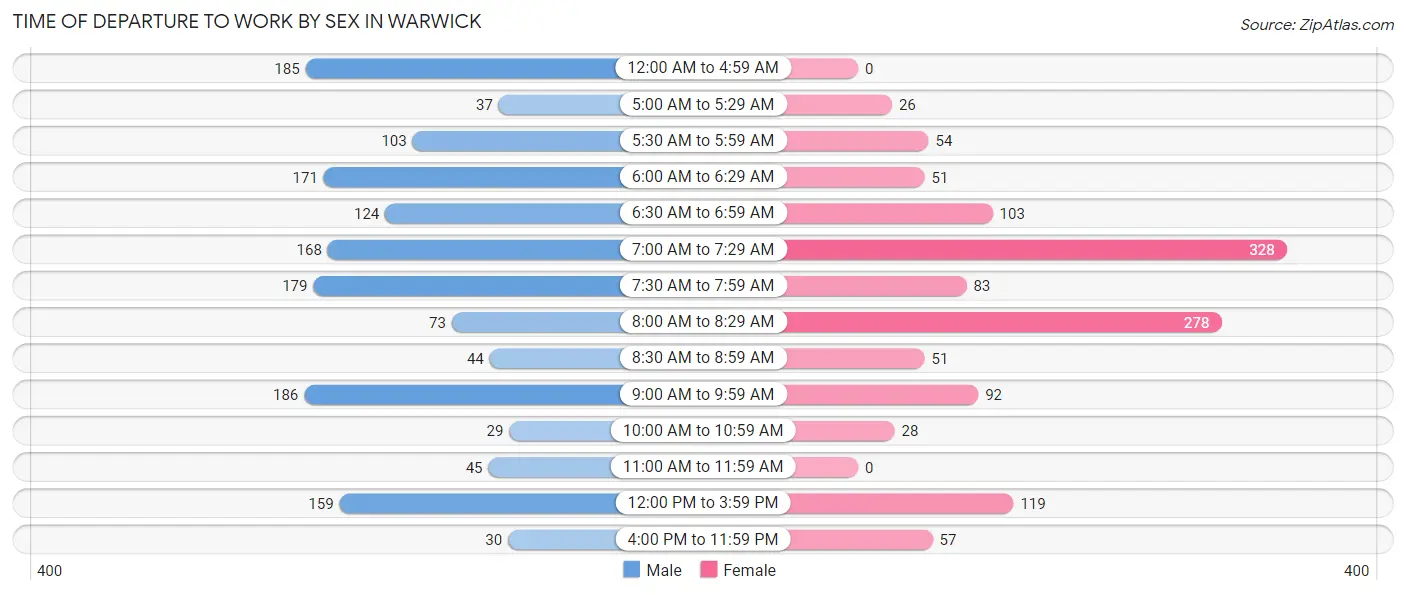
| Time of Departure | Male | Female |
| 12:00 AM to 4:59 AM | 185 (12.1%) | 0 (0.0%) |
| 5:00 AM to 5:29 AM | 37 (2.4%) | 26 (2.1%) |
| 5:30 AM to 5:59 AM | 103 (6.7%) | 54 (4.3%) |
| 6:00 AM to 6:29 AM | 171 (11.2%) | 51 (4.0%) |
| 6:30 AM to 6:59 AM | 124 (8.1%) | 103 (8.1%) |
| 7:00 AM to 7:29 AM | 168 (11.0%) | 328 (25.8%) |
| 7:30 AM to 7:59 AM | 179 (11.7%) | 83 (6.5%) |
| 8:00 AM to 8:29 AM | 73 (4.8%) | 278 (21.9%) |
| 8:30 AM to 8:59 AM | 44 (2.9%) | 51 (4.0%) |
| 9:00 AM to 9:59 AM | 186 (12.1%) | 92 (7.2%) |
| 10:00 AM to 10:59 AM | 29 (1.9%) | 28 (2.2%) |
| 11:00 AM to 11:59 AM | 45 (2.9%) | 0 (0.0%) |
| 12:00 PM to 3:59 PM | 159 (10.4%) | 119 (9.4%) |
| 4:00 PM to 11:59 PM | 30 (2.0%) | 57 (4.5%) |
| Total | 1,533 (100.0%) | 1,270 (100.0%) |
Housing Occupancy in Warwick
Occupancy by Ownership in Warwick
Of the total 3,121 dwellings in Warwick, owner-occupied units account for 1,848 (59.2%), while renter-occupied units make up 1,273 (40.8%).
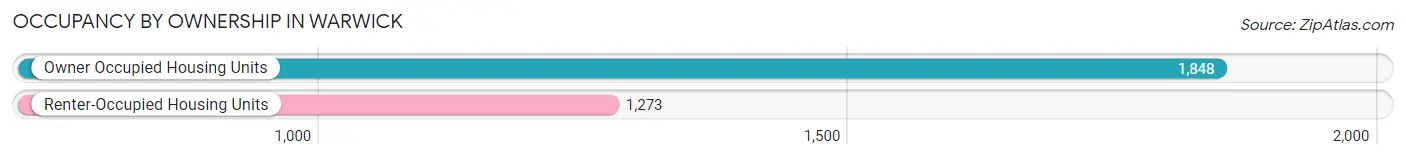
| Occupancy | # Housing Units | % Housing Units |
| Owner Occupied Housing Units | 1,848 | 59.2% |
| Renter-Occupied Housing Units | 1,273 | 40.8% |
| Total Occupied Housing Units | 3,121 | 100.0% |
Occupancy by Household Size in Warwick
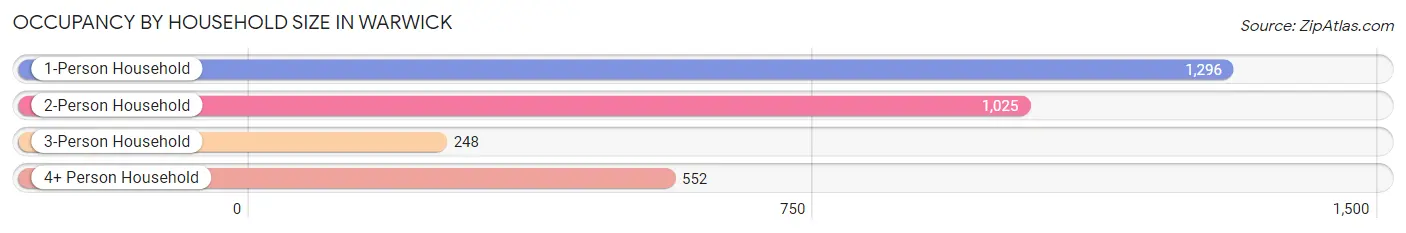
| Household Size | # Housing Units | % Housing Units |
| 1-Person Household | 1,296 | 41.5% |
| 2-Person Household | 1,025 | 32.8% |
| 3-Person Household | 248 | 8.0% |
| 4+ Person Household | 552 | 17.7% |
| Total Housing Units | 3,121 | 100.0% |
Occupancy by Ownership by Household Size in Warwick
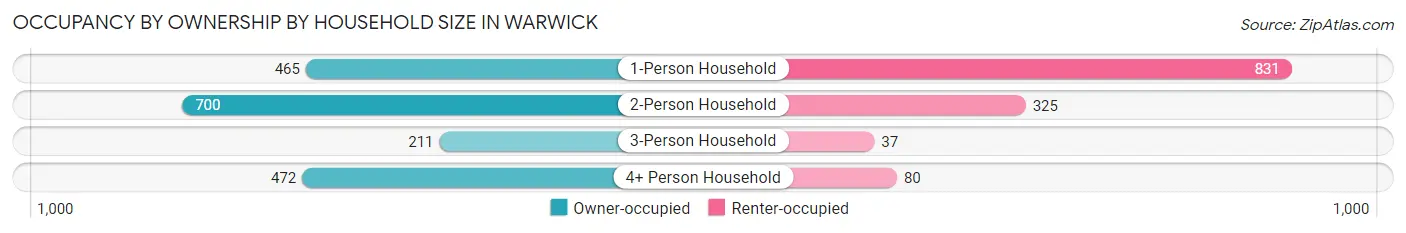
| Household Size | Owner-occupied | Renter-occupied |
| 1-Person Household | 465 (35.9%) | 831 (64.1%) |
| 2-Person Household | 700 (68.3%) | 325 (31.7%) |
| 3-Person Household | 211 (85.1%) | 37 (14.9%) |
| 4+ Person Household | 472 (85.5%) | 80 (14.5%) |
| Total Housing Units | 1,848 (59.2%) | 1,273 (40.8%) |
Occupancy by Educational Attainment in Warwick
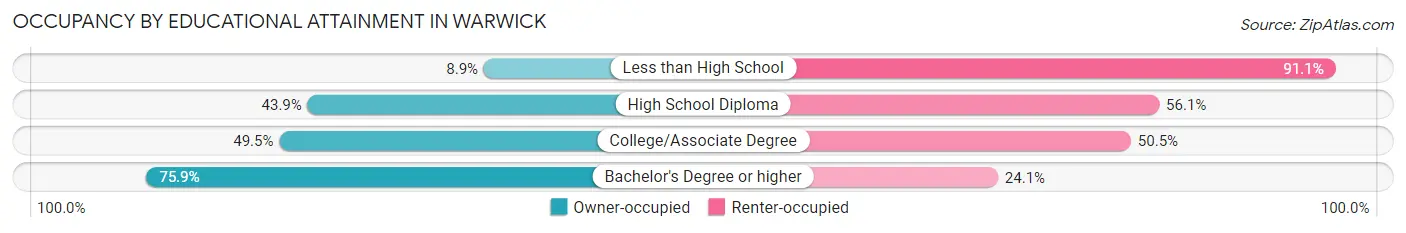
| Household Size | Owner-occupied | Renter-occupied |
| Less than High School | 10 (8.9%) | 102 (91.1%) |
| High School Diploma | 323 (43.9%) | 413 (56.1%) |
| College/Associate Degree | 393 (49.5%) | 401 (50.5%) |
| Bachelor's Degree or higher | 1,122 (75.9%) | 357 (24.1%) |
Occupancy by Age of Householder in Warwick
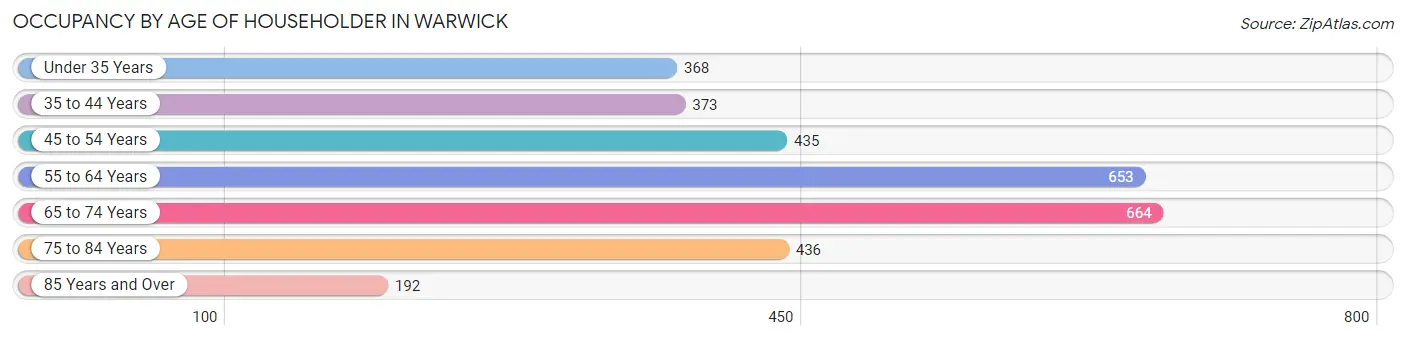
| Age Bracket | # Households | % Households |
| Under 35 Years | 368 | 11.8% |
| 35 to 44 Years | 373 | 11.9% |
| 45 to 54 Years | 435 | 13.9% |
| 55 to 64 Years | 653 | 20.9% |
| 65 to 74 Years | 664 | 21.3% |
| 75 to 84 Years | 436 | 14.0% |
| 85 Years and Over | 192 | 6.1% |
| Total | 3,121 | 100.0% |
Housing Finances in Warwick
Median Income by Occupancy in Warwick
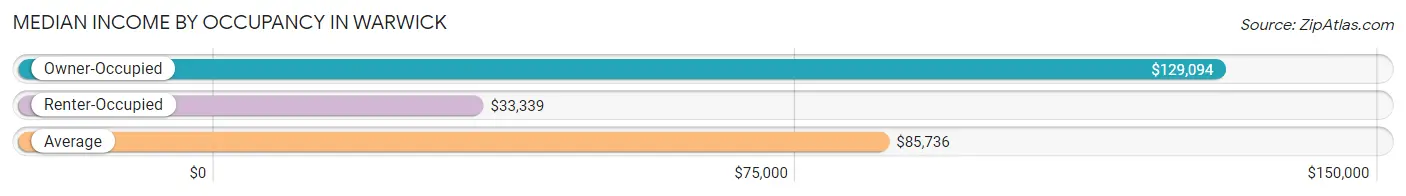
| Occupancy Type | # Households | Median Income |
| Owner-Occupied | 1,848 (59.2%) | $129,094 |
| Renter-Occupied | 1,273 (40.8%) | $33,339 |
| Average | 3,121 (100.0%) | $85,736 |
Occupancy by Householder Income Bracket in Warwick
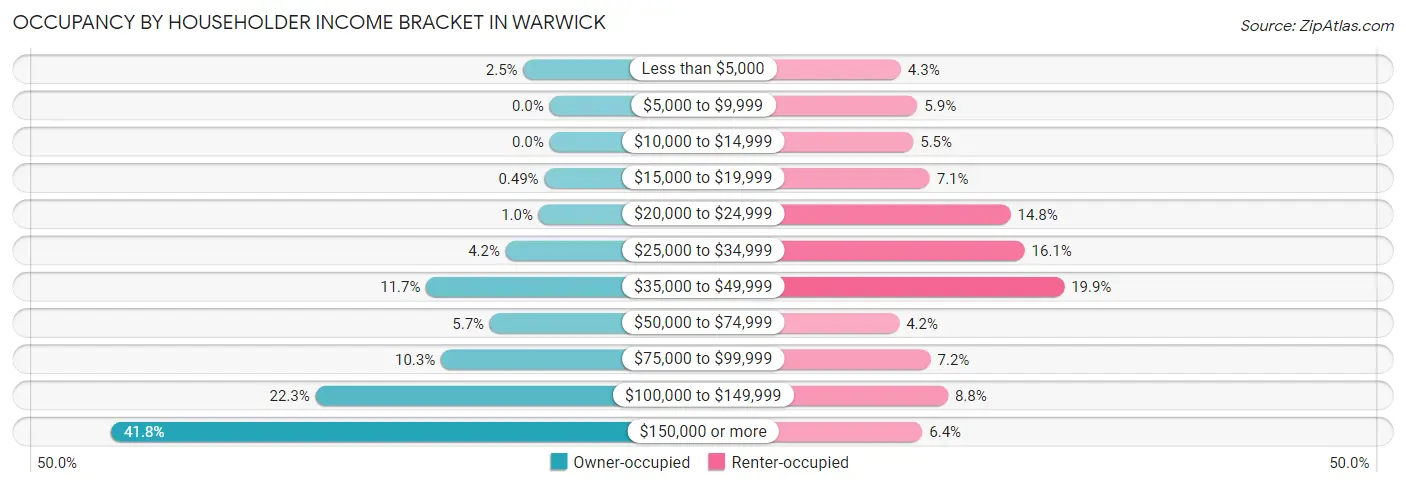
| Income Bracket | Owner-occupied | Renter-occupied |
| Less than $5,000 | 46 (2.5%) | 55 (4.3%) |
| $5,000 to $9,999 | 0 (0.0%) | 75 (5.9%) |
| $10,000 to $14,999 | 0 (0.0%) | 70 (5.5%) |
| $15,000 to $19,999 | 9 (0.5%) | 90 (7.1%) |
| $20,000 to $24,999 | 19 (1.0%) | 188 (14.8%) |
| $25,000 to $34,999 | 77 (4.2%) | 205 (16.1%) |
| $35,000 to $49,999 | 217 (11.7%) | 253 (19.9%) |
| $50,000 to $74,999 | 105 (5.7%) | 53 (4.2%) |
| $75,000 to $99,999 | 191 (10.3%) | 91 (7.1%) |
| $100,000 to $149,999 | 412 (22.3%) | 112 (8.8%) |
| $150,000 or more | 772 (41.8%) | 81 (6.4%) |
| Total | 1,848 (100.0%) | 1,273 (100.0%) |
Monthly Housing Cost Tiers in Warwick
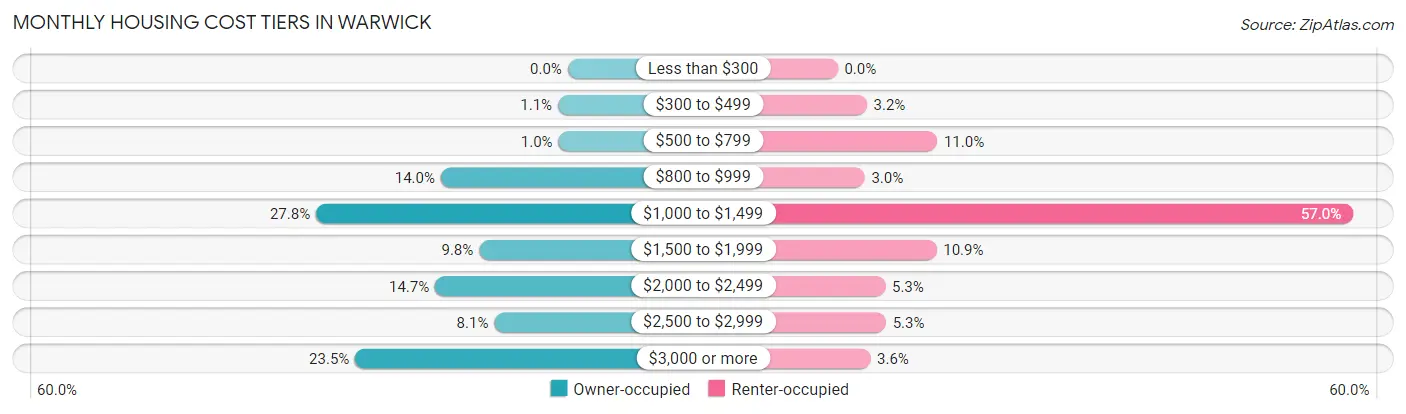
| Monthly Cost | Owner-occupied | Renter-occupied |
| Less than $300 | 0 (0.0%) | 0 (0.0%) |
| $300 to $499 | 20 (1.1%) | 41 (3.2%) |
| $500 to $799 | 19 (1.0%) | 140 (11.0%) |
| $800 to $999 | 259 (14.0%) | 38 (3.0%) |
| $1,000 to $1,499 | 514 (27.8%) | 725 (57.0%) |
| $1,500 to $1,999 | 181 (9.8%) | 139 (10.9%) |
| $2,000 to $2,499 | 271 (14.7%) | 67 (5.3%) |
| $2,500 to $2,999 | 150 (8.1%) | 68 (5.3%) |
| $3,000 or more | 434 (23.5%) | 46 (3.6%) |
| Total | 1,848 (100.0%) | 1,273 (100.0%) |
Physical Housing Characteristics in Warwick
Housing Structures in Warwick
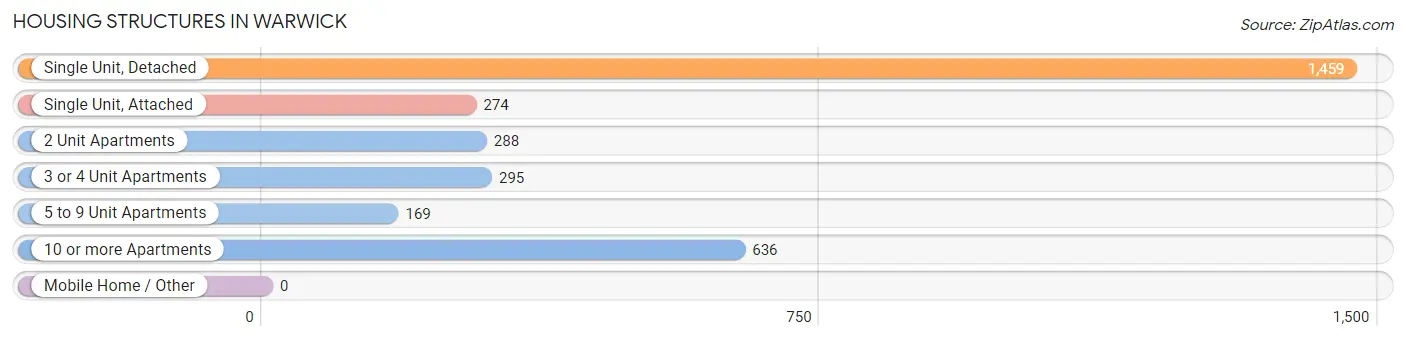
| Structure Type | # Housing Units | % Housing Units |
| Single Unit, Detached | 1,459 | 46.8% |
| Single Unit, Attached | 274 | 8.8% |
| 2 Unit Apartments | 288 | 9.2% |
| 3 or 4 Unit Apartments | 295 | 9.5% |
| 5 to 9 Unit Apartments | 169 | 5.4% |
| 10 or more Apartments | 636 | 20.4% |
| Mobile Home / Other | 0 | 0.0% |
| Total | 3,121 | 100.0% |
Housing Structures by Occupancy in Warwick
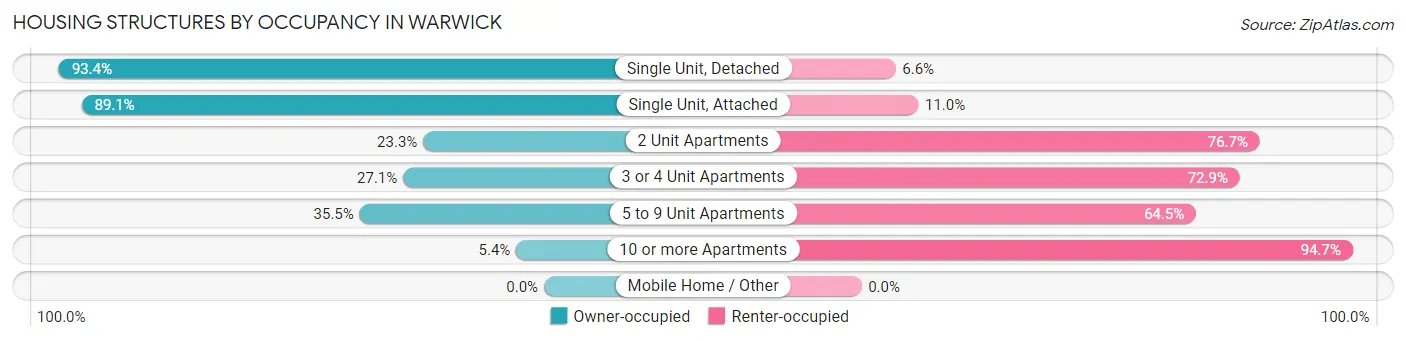
| Structure Type | Owner-occupied | Renter-occupied |
| Single Unit, Detached | 1,363 (93.4%) | 96 (6.6%) |
| Single Unit, Attached | 244 (89.0%) | 30 (11.0%) |
| 2 Unit Apartments | 67 (23.3%) | 221 (76.7%) |
| 3 or 4 Unit Apartments | 80 (27.1%) | 215 (72.9%) |
| 5 to 9 Unit Apartments | 60 (35.5%) | 109 (64.5%) |
| 10 or more Apartments | 34 (5.3%) | 602 (94.7%) |
| Mobile Home / Other | 0 (0.0%) | 0 (0.0%) |
| Total | 1,848 (59.2%) | 1,273 (40.8%) |
Housing Structures by Number of Rooms in Warwick
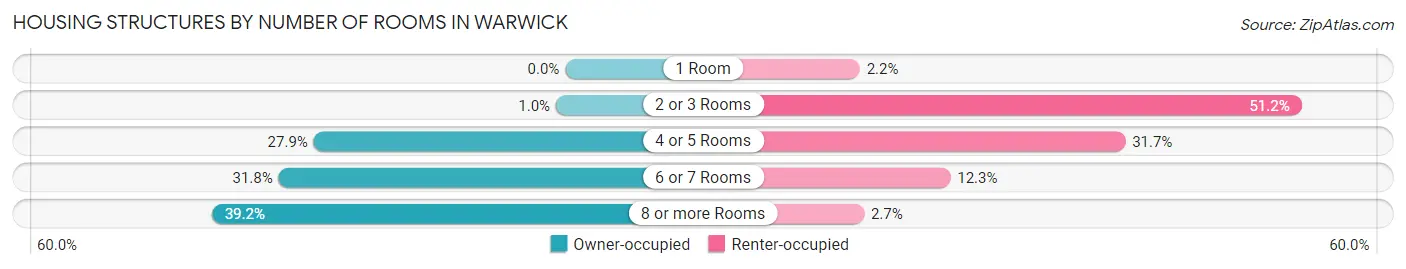
| Number of Rooms | Owner-occupied | Renter-occupied |
| 1 Room | 0 (0.0%) | 28 (2.2%) |
| 2 or 3 Rooms | 19 (1.0%) | 652 (51.2%) |
| 4 or 5 Rooms | 516 (27.9%) | 403 (31.7%) |
| 6 or 7 Rooms | 588 (31.8%) | 156 (12.2%) |
| 8 or more Rooms | 725 (39.2%) | 34 (2.7%) |
| Total | 1,848 (100.0%) | 1,273 (100.0%) |
Housing Structure by Heating Type in Warwick
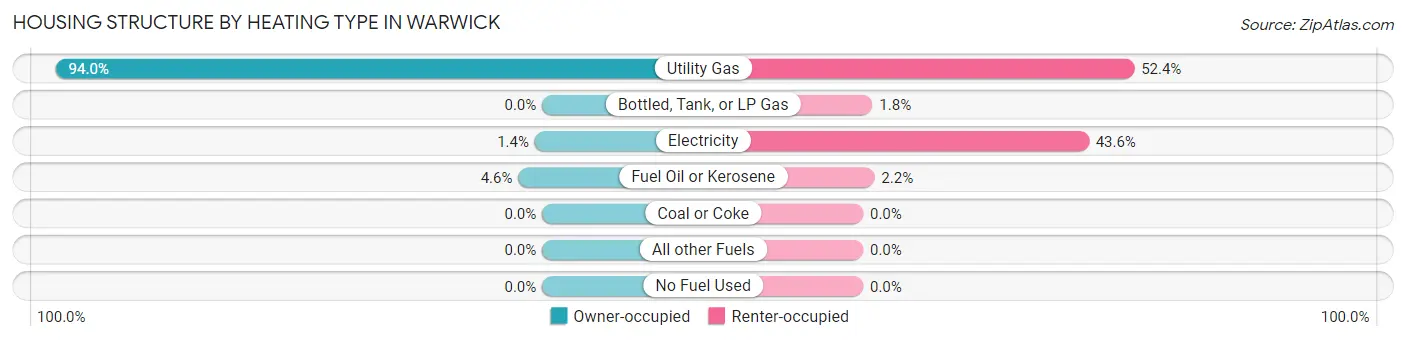
| Heating Type | Owner-occupied | Renter-occupied |
| Utility Gas | 1,737 (94.0%) | 667 (52.4%) |
| Bottled, Tank, or LP Gas | 0 (0.0%) | 23 (1.8%) |
| Electricity | 26 (1.4%) | 555 (43.6%) |
| Fuel Oil or Kerosene | 85 (4.6%) | 28 (2.2%) |
| Coal or Coke | 0 (0.0%) | 0 (0.0%) |
| All other Fuels | 0 (0.0%) | 0 (0.0%) |
| No Fuel Used | 0 (0.0%) | 0 (0.0%) |
| Total | 1,848 (100.0%) | 1,273 (100.0%) |
Household Vehicle Usage in Warwick
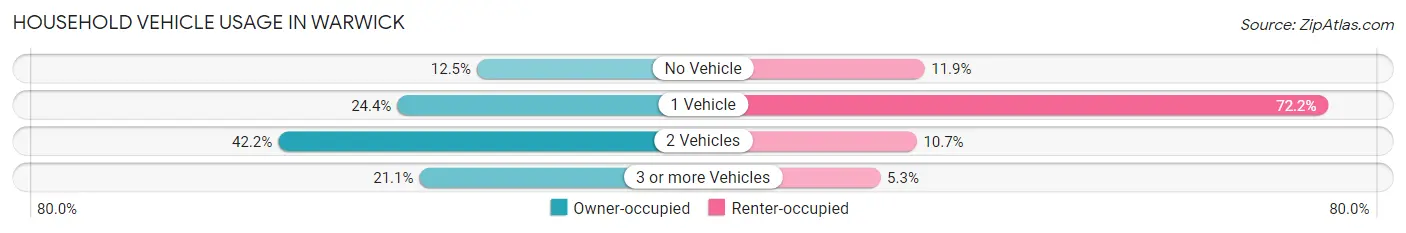
| Vehicles per Household | Owner-occupied | Renter-occupied |
| No Vehicle | 230 (12.4%) | 151 (11.9%) |
| 1 Vehicle | 450 (24.3%) | 919 (72.2%) |
| 2 Vehicles | 779 (42.1%) | 136 (10.7%) |
| 3 or more Vehicles | 389 (21.0%) | 67 (5.3%) |
| Total | 1,848 (100.0%) | 1,273 (100.0%) |
Real Estate & Mortgages in Warwick
Real Estate and Mortgage Overview in Warwick
| Characteristic | Without Mortgage | With Mortgage |
| Housing Units | 885 | 963 |
| Median Property Value | $391,400 | $370,000 |
| Median Household Income | $100,336 | $535 |
| Monthly Housing Costs | $1,174 | $434 |
| Real Estate Taxes | $8,551 | $8 |
Property Value by Mortgage Status in Warwick
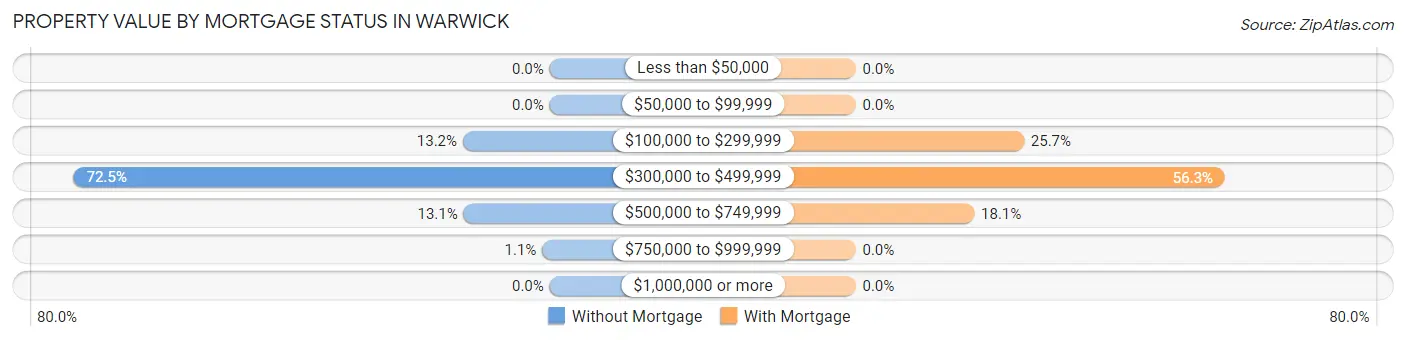
| Property Value | Without Mortgage | With Mortgage |
| Less than $50,000 | 0 (0.0%) | 0 (0.0%) |
| $50,000 to $99,999 | 0 (0.0%) | 0 (0.0%) |
| $100,000 to $299,999 | 117 (13.2%) | 247 (25.7%) |
| $300,000 to $499,999 | 642 (72.5%) | 542 (56.3%) |
| $500,000 to $749,999 | 116 (13.1%) | 174 (18.1%) |
| $750,000 to $999,999 | 10 (1.1%) | 0 (0.0%) |
| $1,000,000 or more | 0 (0.0%) | 0 (0.0%) |
| Total | 885 (100.0%) | 963 (100.0%) |
Household Income by Mortgage Status in Warwick
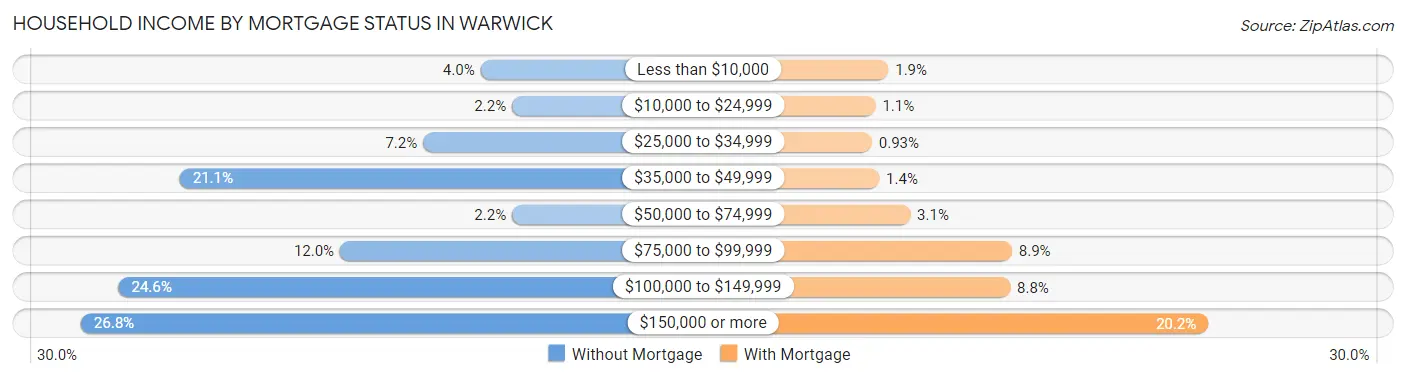
| Household Income | Without Mortgage | With Mortgage |
| Less than $10,000 | 35 (4.0%) | 18 (1.9%) |
| $10,000 to $24,999 | 19 (2.1%) | 11 (1.1%) |
| $25,000 to $34,999 | 64 (7.2%) | 9 (0.9%) |
| $35,000 to $49,999 | 187 (21.1%) | 13 (1.3%) |
| $50,000 to $74,999 | 19 (2.1%) | 30 (3.1%) |
| $75,000 to $99,999 | 106 (12.0%) | 86 (8.9%) |
| $100,000 to $149,999 | 218 (24.6%) | 85 (8.8%) |
| $150,000 or more | 237 (26.8%) | 194 (20.2%) |
| Total | 885 (100.0%) | 963 (100.0%) |
Property Value to Household Income Ratio in Warwick
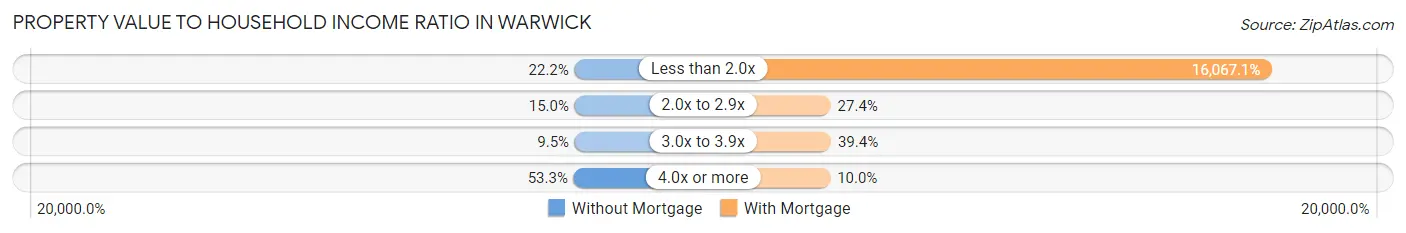
| Value-to-Income Ratio | Without Mortgage | With Mortgage |
| Less than 2.0x | 196 (22.2%) | 154,726 (16,067.1%) |
| 2.0x to 2.9x | 133 (15.0%) | 264 (27.4%) |
| 3.0x to 3.9x | 84 (9.5%) | 379 (39.4%) |
| 4.0x or more | 472 (53.3%) | 96 (10.0%) |
| Total | 885 (100.0%) | 963 (100.0%) |
Real Estate Taxes by Mortgage Status in Warwick
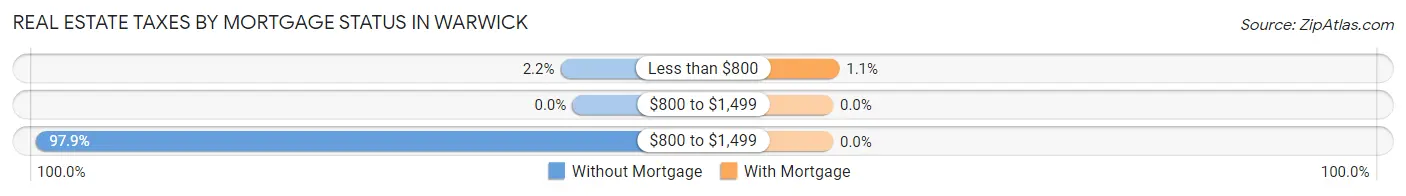
| Property Taxes | Without Mortgage | With Mortgage |
| Less than $800 | 19 (2.1%) | 11 (1.1%) |
| $800 to $1,499 | 0 (0.0%) | 0 (0.0%) |
| $800 to $1,499 | 866 (97.9%) | 0 (0.0%) |
| Total | 885 (100.0%) | 963 (100.0%) |
Health & Disability in Warwick
Health Insurance Coverage by Age in Warwick
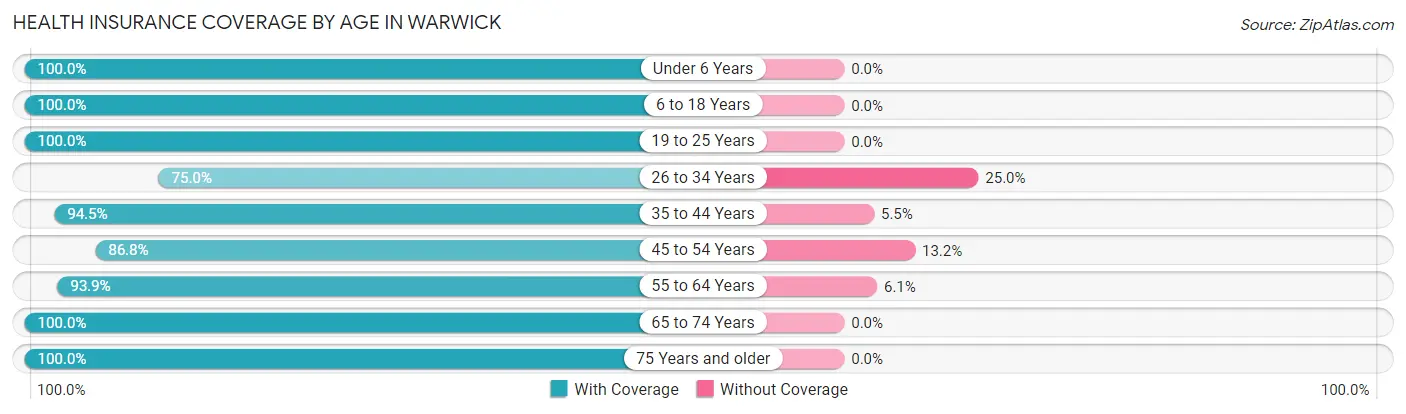
| Age Bracket | With Coverage | Without Coverage |
| Under 6 Years | 302 (100.0%) | 0 (0.0%) |
| 6 to 18 Years | 950 (100.0%) | 0 (0.0%) |
| 19 to 25 Years | 323 (100.0%) | 0 (0.0%) |
| 26 to 34 Years | 495 (75.0%) | 165 (25.0%) |
| 35 to 44 Years | 785 (94.5%) | 46 (5.5%) |
| 45 to 54 Years | 553 (86.8%) | 84 (13.2%) |
| 55 to 64 Years | 1,015 (93.9%) | 66 (6.1%) |
| 65 to 74 Years | 857 (100.0%) | 0 (0.0%) |
| 75 Years and older | 922 (100.0%) | 0 (0.0%) |
| Total | 6,202 (94.5%) | 361 (5.5%) |
Health Insurance Coverage by Citizenship Status in Warwick
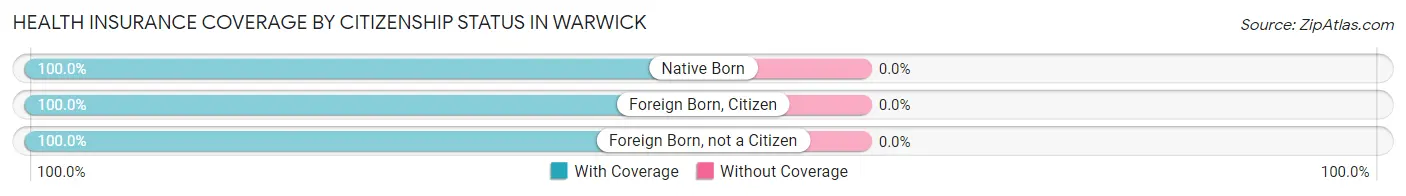
| Citizenship Status | With Coverage | Without Coverage |
| Native Born | 302 (100.0%) | 0 (0.0%) |
| Foreign Born, Citizen | 950 (100.0%) | 0 (0.0%) |
| Foreign Born, not a Citizen | 323 (100.0%) | 0 (0.0%) |
Health Insurance Coverage by Household Income in Warwick
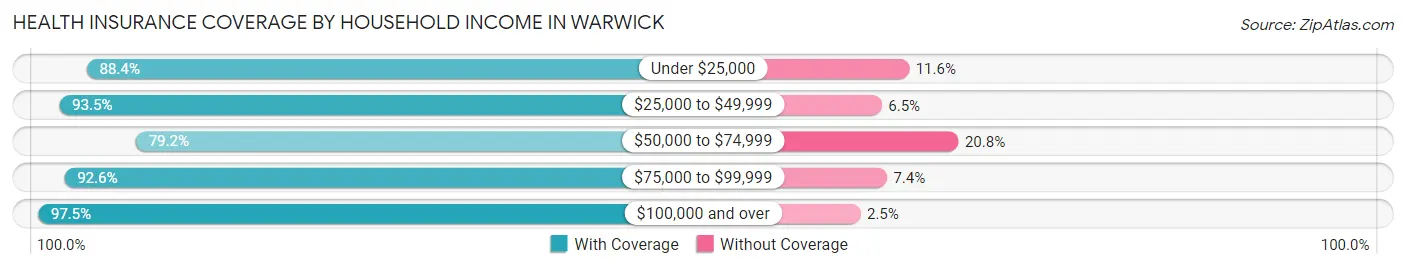
| Household Income | With Coverage | Without Coverage |
| Under $25,000 | 579 (88.4%) | 76 (11.6%) |
| $25,000 to $49,999 | 881 (93.5%) | 61 (6.5%) |
| $50,000 to $74,999 | 304 (79.2%) | 80 (20.8%) |
| $75,000 to $99,999 | 573 (92.6%) | 46 (7.4%) |
| $100,000 and over | 3,856 (97.5%) | 98 (2.5%) |
Public vs Private Health Insurance Coverage by Age in Warwick
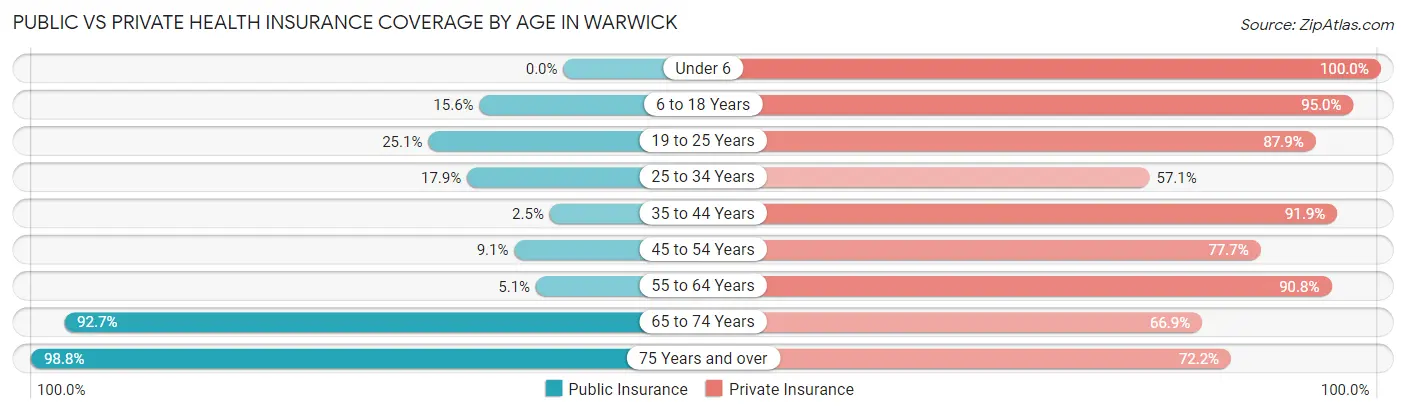
| Age Bracket | Public Insurance | Private Insurance |
| Under 6 | 0 (0.0%) | 302 (100.0%) |
| 6 to 18 Years | 148 (15.6%) | 902 (95.0%) |
| 19 to 25 Years | 81 (25.1%) | 284 (87.9%) |
| 25 to 34 Years | 118 (17.9%) | 377 (57.1%) |
| 35 to 44 Years | 21 (2.5%) | 764 (91.9%) |
| 45 to 54 Years | 58 (9.1%) | 495 (77.7%) |
| 55 to 64 Years | 55 (5.1%) | 982 (90.8%) |
| 65 to 74 Years | 794 (92.6%) | 573 (66.9%) |
| 75 Years and over | 911 (98.8%) | 666 (72.2%) |
| Total | 2,186 (33.3%) | 5,345 (81.4%) |
Disability Status by Sex by Age in Warwick
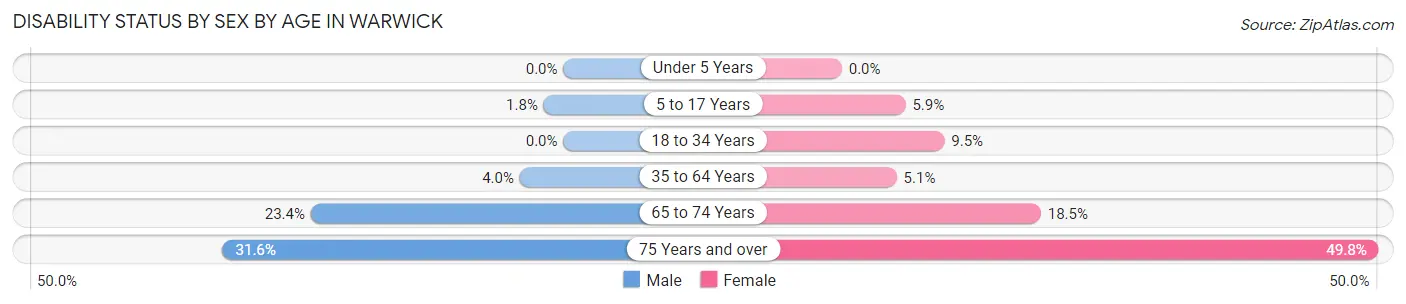
| Age Bracket | Male | Female |
| Under 5 Years | 0 (0.0%) | 0 (0.0%) |
| 5 to 17 Years | 10 (1.8%) | 23 (5.9%) |
| 18 to 34 Years | 0 (0.0%) | 42 (9.5%) |
| 35 to 64 Years | 49 (4.0%) | 68 (5.1%) |
| 65 to 74 Years | 60 (23.4%) | 111 (18.5%) |
| 75 Years and over | 117 (31.6%) | 275 (49.8%) |
Disability Class by Sex by Age in Warwick
Disability Class: Hearing Difficulty
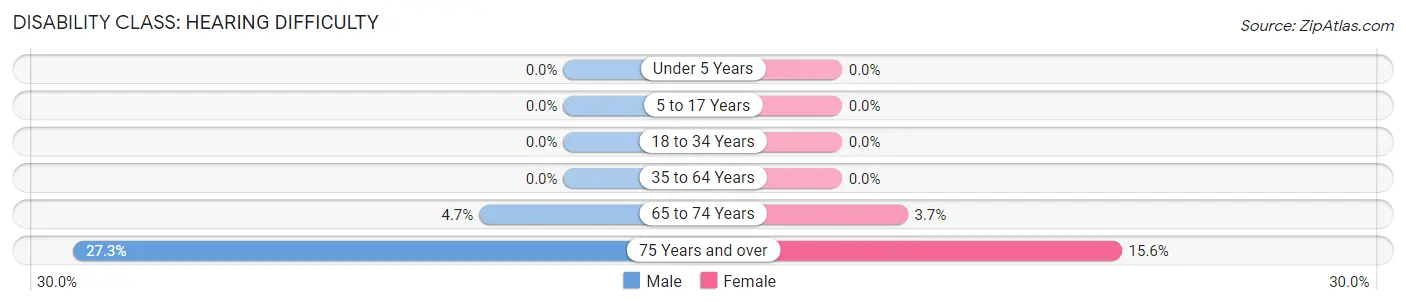
| Age Bracket | Male | Female |
| Under 5 Years | 0 (0.0%) | 0 (0.0%) |
| 5 to 17 Years | 0 (0.0%) | 0 (0.0%) |
| 18 to 34 Years | 0 (0.0%) | 0 (0.0%) |
| 35 to 64 Years | 0 (0.0%) | 0 (0.0%) |
| 65 to 74 Years | 12 (4.7%) | 22 (3.7%) |
| 75 Years and over | 101 (27.3%) | 86 (15.6%) |
Disability Class: Vision Difficulty
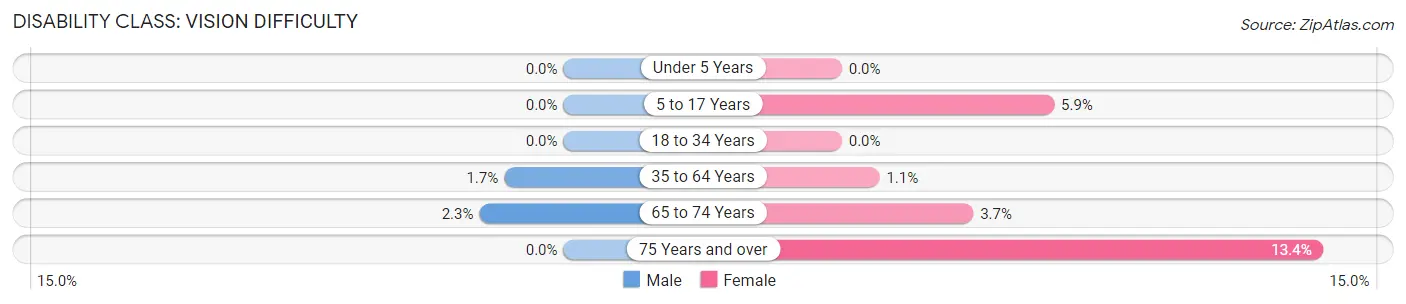
| Age Bracket | Male | Female |
| Under 5 Years | 0 (0.0%) | 0 (0.0%) |
| 5 to 17 Years | 0 (0.0%) | 23 (5.9%) |
| 18 to 34 Years | 0 (0.0%) | 0 (0.0%) |
| 35 to 64 Years | 20 (1.7%) | 14 (1.1%) |
| 65 to 74 Years | 6 (2.3%) | 22 (3.7%) |
| 75 Years and over | 0 (0.0%) | 74 (13.4%) |
Disability Class: Cognitive Difficulty
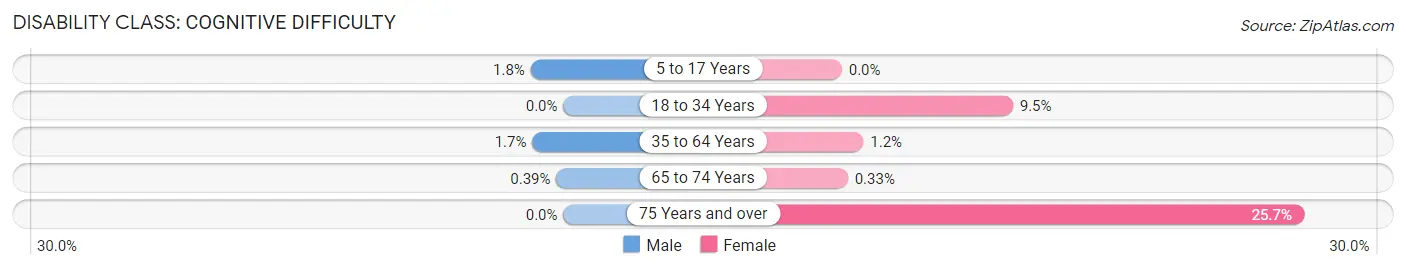
| Age Bracket | Male | Female |
| 5 to 17 Years | 10 (1.8%) | 0 (0.0%) |
| 18 to 34 Years | 0 (0.0%) | 42 (9.5%) |
| 35 to 64 Years | 21 (1.7%) | 16 (1.2%) |
| 65 to 74 Years | 1 (0.4%) | 2 (0.3%) |
| 75 Years and over | 0 (0.0%) | 142 (25.7%) |
Disability Class: Ambulatory Difficulty
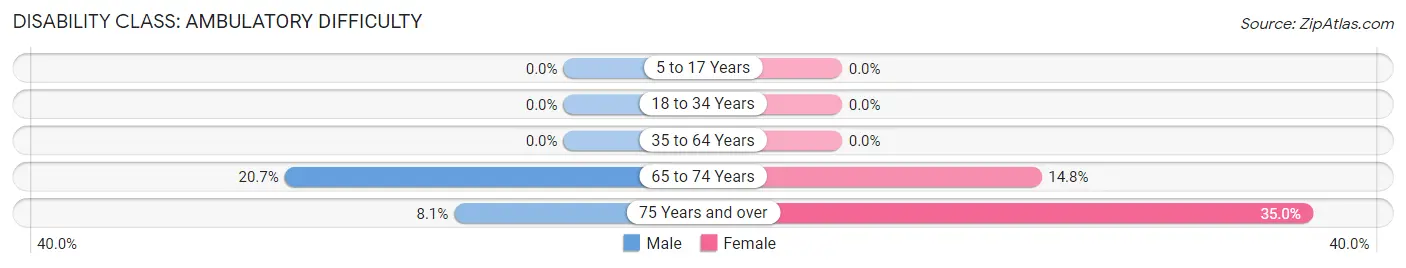
| Age Bracket | Male | Female |
| 5 to 17 Years | 0 (0.0%) | 0 (0.0%) |
| 18 to 34 Years | 0 (0.0%) | 0 (0.0%) |
| 35 to 64 Years | 0 (0.0%) | 0 (0.0%) |
| 65 to 74 Years | 53 (20.7%) | 89 (14.8%) |
| 75 Years and over | 30 (8.1%) | 193 (35.0%) |
Disability Class: Self-Care Difficulty
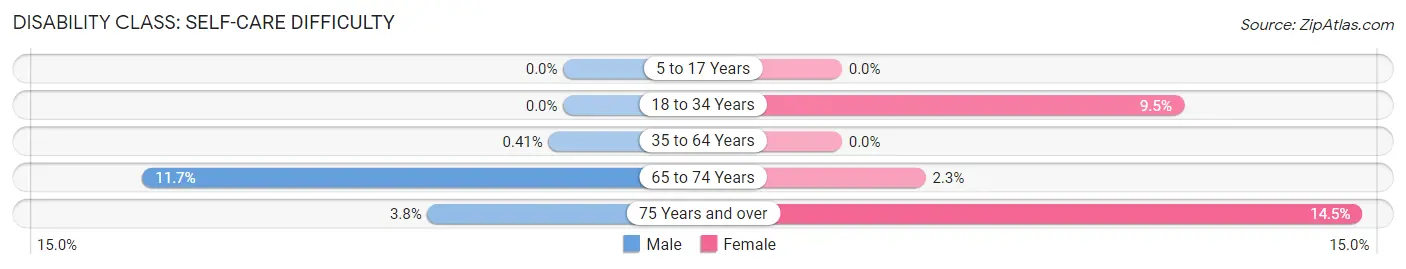
| Age Bracket | Male | Female |
| 5 to 17 Years | 0 (0.0%) | 0 (0.0%) |
| 18 to 34 Years | 0 (0.0%) | 42 (9.5%) |
| 35 to 64 Years | 5 (0.4%) | 0 (0.0%) |
| 65 to 74 Years | 30 (11.7%) | 14 (2.3%) |
| 75 Years and over | 14 (3.8%) | 80 (14.5%) |
Technology Access in Warwick
Computing Device Access in Warwick
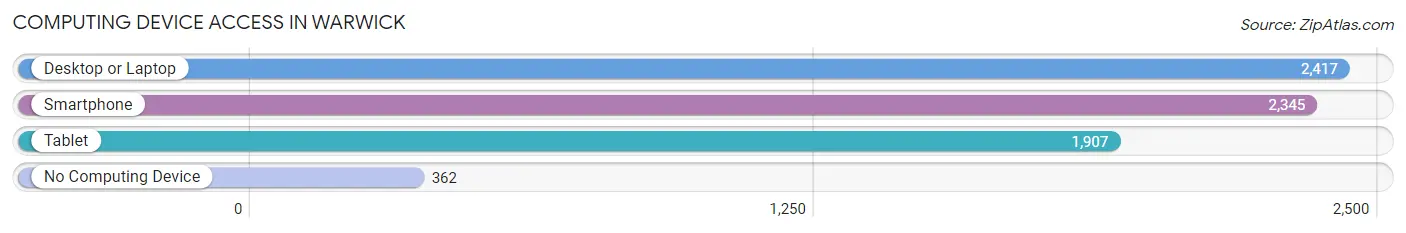
| Device Type | # Households | % Households |
| Desktop or Laptop | 2,417 | 77.4% |
| Smartphone | 2,345 | 75.1% |
| Tablet | 1,907 | 61.1% |
| No Computing Device | 362 | 11.6% |
| Total | 3,121 | 100.0% |
Internet Access in Warwick
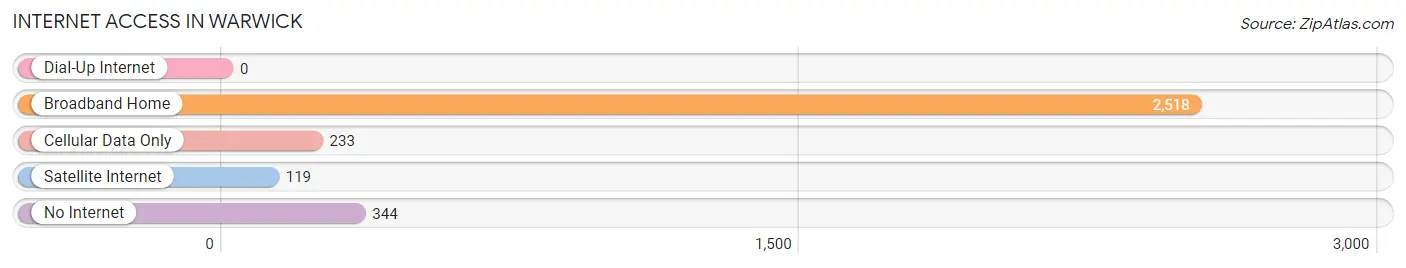
| Internet Type | # Households | % Households |
| Dial-Up Internet | 0 | 0.0% |
| Broadband Home | 2,518 | 80.7% |
| Cellular Data Only | 233 | 7.5% |
| Satellite Internet | 119 | 3.8% |
| No Internet | 344 | 11.0% |
| Total | 3,121 | 100.0% |
Warwick Summary
Warwick, NY is a town located in Orange County, New York, United States. The town is situated in the southeastern part of the county, approximately 50 miles northwest of New York City. As of the 2010 census, the town had a population of 32,065.
History
The area that is now Warwick was originally inhabited by the Munsee Indians, a branch of the Lenape. The first European settlers arrived in the area in the late 17th century, and the town was officially established in 1788. The town was named after Robert Rich, the 2nd Earl of Warwick.
In the 19th century, Warwick became a popular summer resort destination for wealthy New Yorkers. The town was home to several grand hotels, including the Warwick House, which was built in 1845. The town also became a popular destination for artists, writers, and musicians.
Geography
Warwick is located in southeastern Orange County, approximately 50 miles northwest of New York City. The town is bordered by the towns of Chester to the north, Tuxedo to the east, Monroe to the south, and Goshen to the west.
The town is located in the Hudson Valley region of New York, and is situated in the foothills of the Shawangunk Mountains. The town is home to several lakes, including Greenwood Lake, which is the largest lake in Orange County.
Economy
The economy of Warwick is largely based on tourism and agriculture. The town is home to several wineries, including Warwick Valley Winery and Distillery, which produces award-winning wines and spirits. The town is also home to several farms, including the Warwick Valley Farm and Orchard, which produces a variety of fruits and vegetables.
The town is also home to several manufacturing companies, including the Warwick Valley Manufacturing Company, which produces a variety of products, including furniture, clothing, and toys.
Demographics
As of the 2010 census, there were 32,065 people, 11,845 households, and 8,541 families residing in the town. The population density was 545.3 people per square mile. The racial makeup of the town was 94.2% White, 2.3% African American, 0.3% Native American, 1.2% Asian, 0.1% Pacific Islander, 0.9% from other races, and 1.1% from two or more races. Hispanic or Latino of any race were 4.2% of the population.
The median income for a household in the town was $63,945, and the median income for a family was $76,945. The per capita income for the town was $30,945. About 4.2% of families and 6.2% of the population were below the poverty line, including 8.2% of those under age 18 and 4.2% of those age 65 or over.
Common Questions
What is the Total Population of Warwick?
Total Population of Warwick is 6,653.
What is the Total Male Population of Warwick?
Total Male Population of Warwick is 3,064.
What is the Total Female Population of Warwick?
Total Female Population of Warwick is 3,589.
What is the Ratio of Males per 100 Females in Warwick?
There are 85.37 Males per 100 Females in Warwick.
What is the Ratio of Females per 100 Males in Warwick?
There are 117.13 Females per 100 Males in Warwick.
What is the Median Population Age in Warwick?
Median Population Age in Warwick is 51.0 Years.
What is the Average Family Size in Warwick
Average Family Size in Warwick is 2.9 People.
What is the Average Household Size in Warwick
Average Household Size in Warwick is 2.1 People.
What is Per Capita Income in Warwick?
Per Capita income in Warwick is $50,484.
What is the Median Family Income in Warwick?
Median Family Income in Warwick is $142,121.
What is the Median Household income in Warwick?
Median Household Income in Warwick is $85,736.
What is Income or Wage Gap in Warwick?
Income or Wage Gap in Warwick is 11.0%.
Women in Warwick earn 89.0 cents for every dollar earned by a man.
What is Inequality or Gini Index in Warwick?
Inequality or Gini Index in Warwick is 0.46.
How Large is the Labor Force in Warwick?
There are 3,484 People in the Labor Forcein in Warwick.
What is the Percentage of People in the Labor Force in Warwick?
62.8% of People are in the Labor Force in Warwick.
What is the Unemployment Rate in Warwick?
Unemployment Rate in Warwick is 2.3%.