Port Jefferson, NY
Port Jefferson Map
Port Jefferson Overview
7,990
TOTAL POPULATION
4,013
MALE POPULATION
3,977
FEMALE POPULATION
100.91
MALES / 100 FEMALES
99.10
FEMALES / 100 MALES
45.1
MEDIAN AGE
3.2
AVG FAMILY SIZE
2.5
AVG HOUSEHOLD SIZE
$68,127
PER CAPITA INCOME
$181,715
AVG FAMILY INCOME
$134,230
AVG HOUSEHOLD INCOME
30.8%
WAGE / INCOME GAP [ % ]
69.2¢/ $1
WAGE / INCOME GAP [ $ ]
0.41
INEQUALITY / GINI INDEX
4,280
LABOR FORCE [ PEOPLE ]
64.6%
PERCENT IN LABOR FORCE
2.9%
UNEMPLOYMENT RATE
Port Jefferson Zip Codes
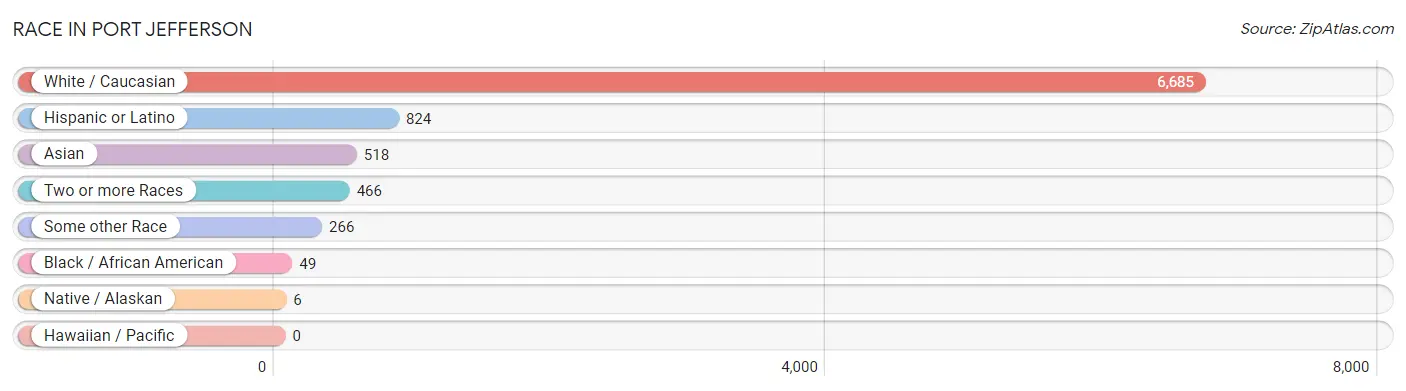
Race in Port Jefferson
The most populous races in Port Jefferson are White / Caucasian (6,685 | 83.7%), Hispanic or Latino (824 | 10.3%), and Asian (518 | 6.5%).
| Race | # Population | % Population |
| Asian | 518 | 6.5% |
| Black / African American | 49 | 0.6% |
| Hawaiian / Pacific | 0 | 0.0% |
| Hispanic or Latino | 824 | 10.3% |
| Native / Alaskan | 6 | 0.1% |
| White / Caucasian | 6,685 | 83.7% |
| Two or more Races | 466 | 5.8% |
| Some other Race | 266 | 3.3% |
| Total | 7,990 | 100.0% |
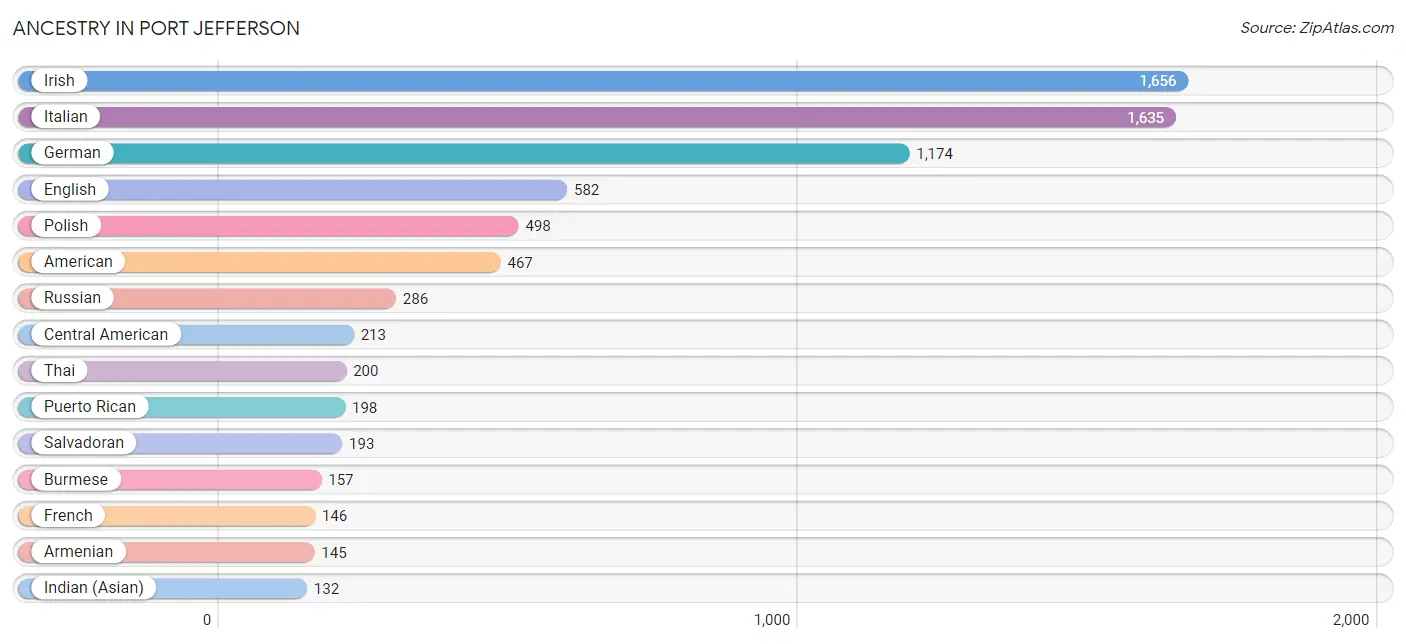
Ancestry in Port Jefferson
The most populous ancestries reported in Port Jefferson are Irish (1,656 | 20.7%), Italian (1,635 | 20.5%), German (1,174 | 14.7%), English (582 | 7.3%), and Polish (498 | 6.2%), together accounting for 69.4% of all Port Jefferson residents.
| Ancestry | # Population | % Population |
| Albanian | 33 | 0.4% |
| American | 467 | 5.8% |
| Arab | 52 | 0.6% |
| Argentinean | 35 | 0.4% |
| Armenian | 145 | 1.8% |
| Australian | 9 | 0.1% |
| Austrian | 44 | 0.5% |
| Belgian | 9 | 0.1% |
| Brazilian | 18 | 0.2% |
| British | 65 | 0.8% |
| Bulgarian | 30 | 0.4% |
| Burmese | 157 | 2.0% |
| Canadian | 25 | 0.3% |
| Celtic | 17 | 0.2% |
| Central American | 213 | 2.7% |
| Cherokee | 6 | 0.1% |
| Colombian | 70 | 0.9% |
| Croatian | 72 | 0.9% |
| Czechoslovakian | 22 | 0.3% |
| Danish | 15 | 0.2% |
| Dominican | 60 | 0.7% |
| Dutch | 105 | 1.3% |
| Eastern European | 80 | 1.0% |
| Ecuadorian | 12 | 0.2% |
| Egyptian | 7 | 0.1% |
| English | 582 | 7.3% |
| European | 62 | 0.8% |
| Filipino | 19 | 0.2% |
| Finnish | 35 | 0.4% |
| French | 146 | 1.8% |
| French Canadian | 8 | 0.1% |
| German | 1,174 | 14.7% |
| Greek | 129 | 1.6% |
| Haitian | 4 | 0.1% |
| Honduran | 7 | 0.1% |
| Hungarian | 58 | 0.7% |
| Indian (Asian) | 132 | 1.7% |
| Iranian | 24 | 0.3% |
| Irish | 1,656 | 20.7% |
| Italian | 1,635 | 20.5% |
| Korean | 7 | 0.1% |
| Laotian | 15 | 0.2% |
| Latvian | 27 | 0.3% |
| Lebanese | 27 | 0.3% |
| Lithuanian | 15 | 0.2% |
| Mexican | 120 | 1.5% |
| Mongolian | 23 | 0.3% |
| Nicaraguan | 13 | 0.2% |
| Northern European | 9 | 0.1% |
| Norwegian | 82 | 1.0% |
| Pakistani | 7 | 0.1% |
| Palestinian | 9 | 0.1% |
| Polish | 498 | 6.2% |
| Portuguese | 2 | 0.0% |
| Puerto Rican | 198 | 2.5% |
| Romanian | 33 | 0.4% |
| Russian | 286 | 3.6% |
| Salvadoran | 193 | 2.4% |
| Scandinavian | 15 | 0.2% |
| Scotch-Irish | 17 | 0.2% |
| Scottish | 46 | 0.6% |
| Serbian | 18 | 0.2% |
| Slovak | 16 | 0.2% |
| South American | 117 | 1.5% |
| Spaniard | 48 | 0.6% |
| Spanish American | 30 | 0.4% |
| Swedish | 62 | 0.8% |
| Swiss | 10 | 0.1% |
| Thai | 200 | 2.5% |
| Turkish | 15 | 0.2% |
| Ukrainian | 45 | 0.6% |
| Welsh | 40 | 0.5% | View All 72 Rows |
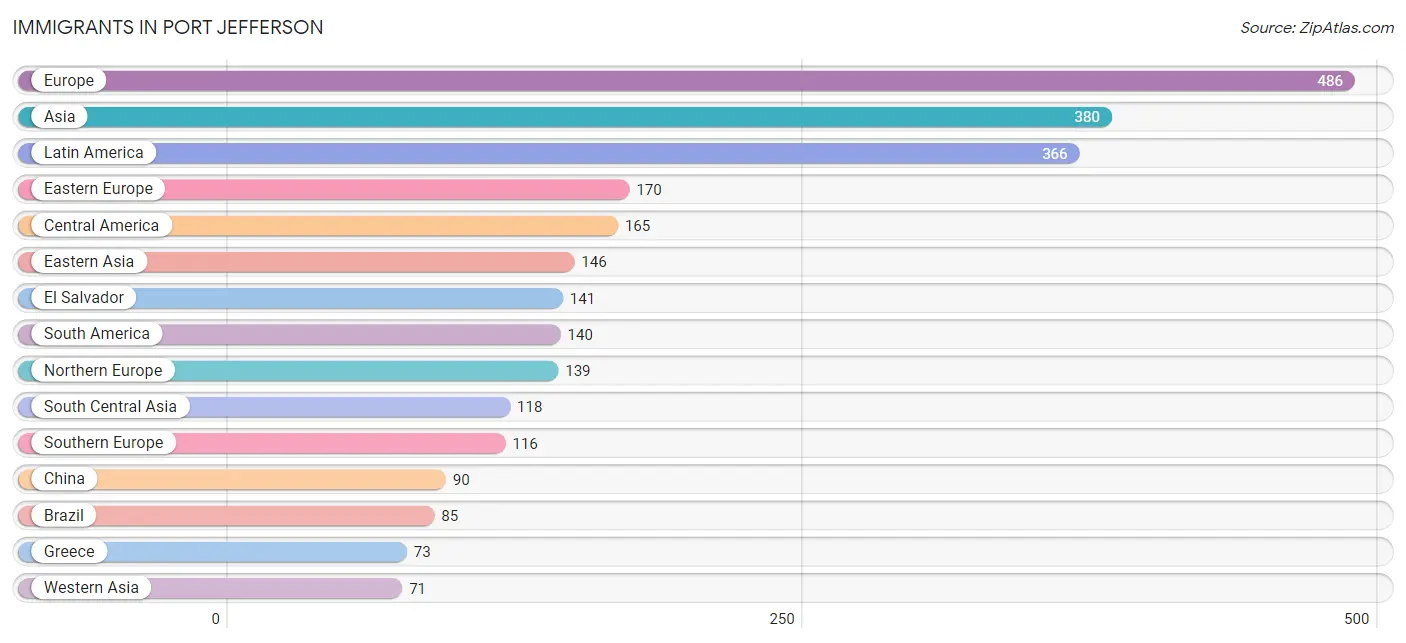
Immigrants in Port Jefferson
The most numerous immigrant groups reported in Port Jefferson came from Europe (486 | 6.1%), Asia (380 | 4.8%), Latin America (366 | 4.6%), Eastern Europe (170 | 2.1%), and Central America (165 | 2.1%), together accounting for 19.6% of all Port Jefferson residents.
| Immigration Origin | # Population | % Population |
| Argentina | 35 | 0.4% |
| Asia | 380 | 4.8% |
| Bangladesh | 11 | 0.1% |
| Brazil | 85 | 1.1% |
| Bulgaria | 16 | 0.2% |
| Canada | 15 | 0.2% |
| Caribbean | 61 | 0.8% |
| Central America | 165 | 2.1% |
| China | 90 | 1.1% |
| Colombia | 20 | 0.3% |
| Costa Rica | 15 | 0.2% |
| Dominican Republic | 57 | 0.7% |
| Eastern Asia | 146 | 1.8% |
| Eastern Europe | 170 | 2.1% |
| El Salvador | 141 | 1.8% |
| England | 37 | 0.5% |
| Europe | 486 | 6.1% |
| France | 12 | 0.2% |
| Germany | 26 | 0.3% |
| Greece | 73 | 0.9% |
| Guatemala | 9 | 0.1% |
| Haiti | 4 | 0.1% |
| India | 30 | 0.4% |
| Indonesia | 15 | 0.2% |
| Iran | 8 | 0.1% |
| Ireland | 23 | 0.3% |
| Israel | 9 | 0.1% |
| Italy | 15 | 0.2% |
| Korea | 56 | 0.7% |
| Latin America | 366 | 4.6% |
| Latvia | 9 | 0.1% |
| Lebanon | 27 | 0.3% |
| Malaysia | 23 | 0.3% |
| Northern Europe | 139 | 1.7% |
| Pakistan | 65 | 0.8% |
| Poland | 65 | 0.8% |
| Portugal | 2 | 0.0% |
| Russia | 38 | 0.5% |
| Serbia | 42 | 0.5% |
| South America | 140 | 1.8% |
| South Central Asia | 118 | 1.5% |
| South Eastern Asia | 45 | 0.6% |
| Southern Europe | 116 | 1.5% |
| Spain | 26 | 0.3% |
| Sweden | 20 | 0.3% |
| Taiwan | 19 | 0.2% |
| Thailand | 7 | 0.1% |
| Turkey | 35 | 0.4% |
| Western Asia | 71 | 0.9% |
| Western Europe | 38 | 0.5% | View All 50 Rows |
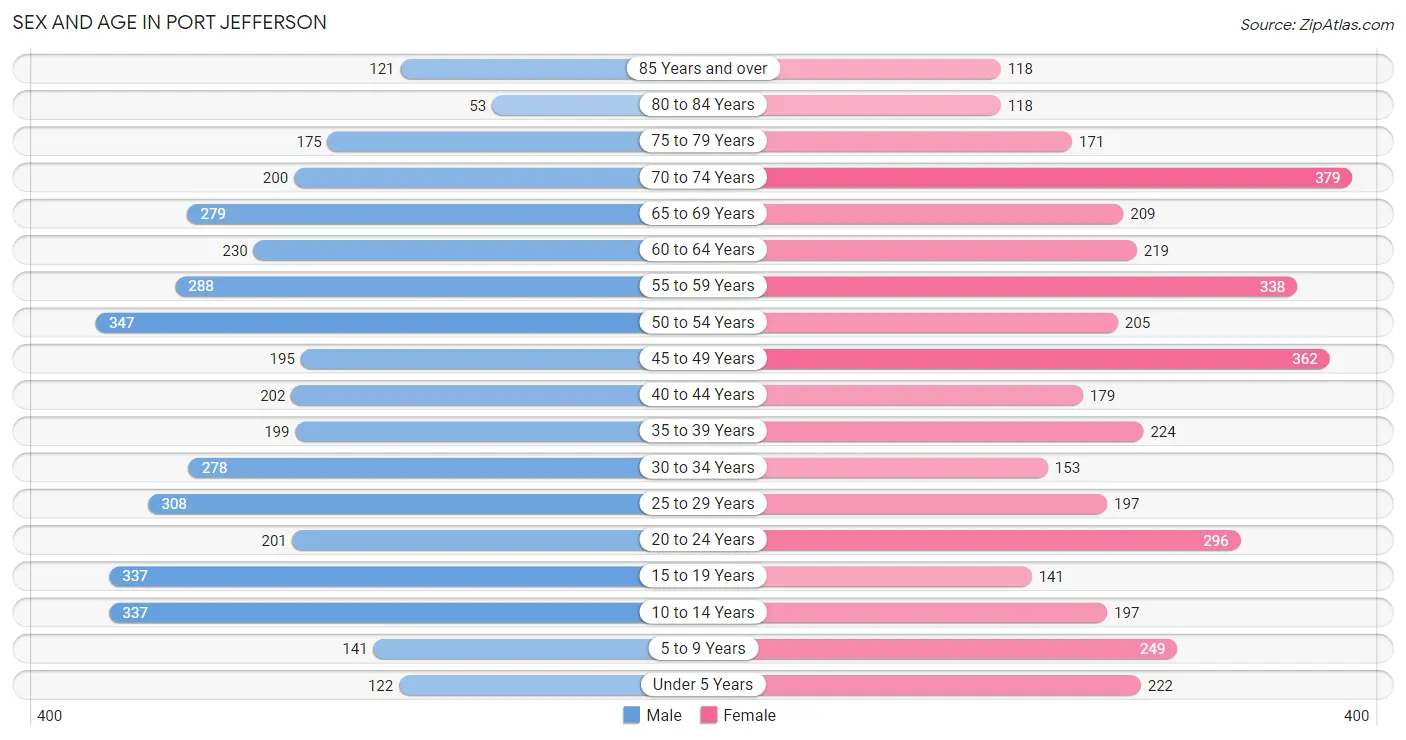
Sex and Age in Port Jefferson
Sex and Age in Port Jefferson
The most populous age groups in Port Jefferson are 50 to 54 Years (347 | 8.6%) for men and 70 to 74 Years (379 | 9.5%) for women.
| Age Bracket | Male | Female |
| Under 5 Years | 122 (3.0%) | 222 (5.6%) |
| 5 to 9 Years | 141 (3.5%) | 249 (6.3%) |
| 10 to 14 Years | 337 (8.4%) | 197 (5.0%) |
| 15 to 19 Years | 337 (8.4%) | 141 (3.5%) |
| 20 to 24 Years | 201 (5.0%) | 296 (7.4%) |
| 25 to 29 Years | 308 (7.7%) | 197 (5.0%) |
| 30 to 34 Years | 278 (6.9%) | 153 (3.8%) |
| 35 to 39 Years | 199 (5.0%) | 224 (5.6%) |
| 40 to 44 Years | 202 (5.0%) | 179 (4.5%) |
| 45 to 49 Years | 195 (4.9%) | 362 (9.1%) |
| 50 to 54 Years | 347 (8.6%) | 205 (5.1%) |
| 55 to 59 Years | 288 (7.2%) | 338 (8.5%) |
| 60 to 64 Years | 230 (5.7%) | 219 (5.5%) |
| 65 to 69 Years | 279 (7.0%) | 209 (5.3%) |
| 70 to 74 Years | 200 (5.0%) | 379 (9.5%) |
| 75 to 79 Years | 175 (4.4%) | 171 (4.3%) |
| 80 to 84 Years | 53 (1.3%) | 118 (3.0%) |
| 85 Years and over | 121 (3.0%) | 118 (3.0%) |
| Total | 4,013 (100.0%) | 3,977 (100.0%) |
Families and Households in Port Jefferson
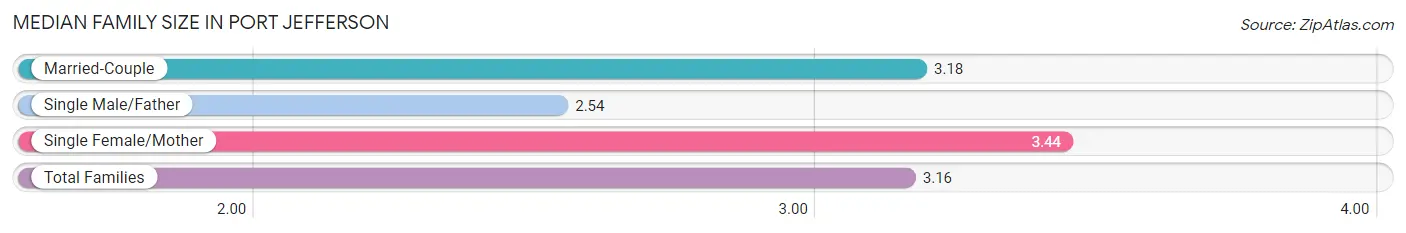
Median Family Size in Port Jefferson
The median family size in Port Jefferson is 3.16 persons per family, with single female/mother families (193 | 10.5%) accounting for the largest median family size of 3.44 persons per family. On the other hand, single male/father families (119 | 6.5%) represent the smallest median family size with 2.54 persons per family.
| Family Type | # Families | Family Size |
| Married-Couple | 1,521 (83.0%) | 3.18 |
| Single Male/Father | 119 (6.5%) | 2.54 |
| Single Female/Mother | 193 (10.5%) | 3.44 |
| Total Families | 1,833 (100.0%) | 3.16 |
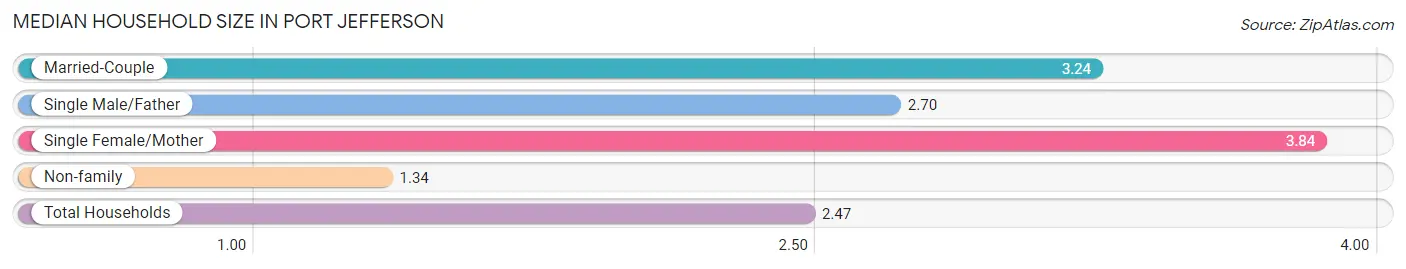
Median Household Size in Port Jefferson
The median household size in Port Jefferson is 2.47 persons per household, with single female/mother households (193 | 6.2%) accounting for the largest median household size of 3.84 persons per household. non-family households (1,286 | 41.2%) represent the smallest median household size with 1.34 persons per household.
| Household Type | # Households | Household Size |
| Married-Couple | 1,521 (48.8%) | 3.24 |
| Single Male/Father | 119 (3.8%) | 2.70 |
| Single Female/Mother | 193 (6.2%) | 3.84 |
| Non-family | 1,286 (41.2%) | 1.34 |
| Total Households | 3,119 (100.0%) | 2.47 |
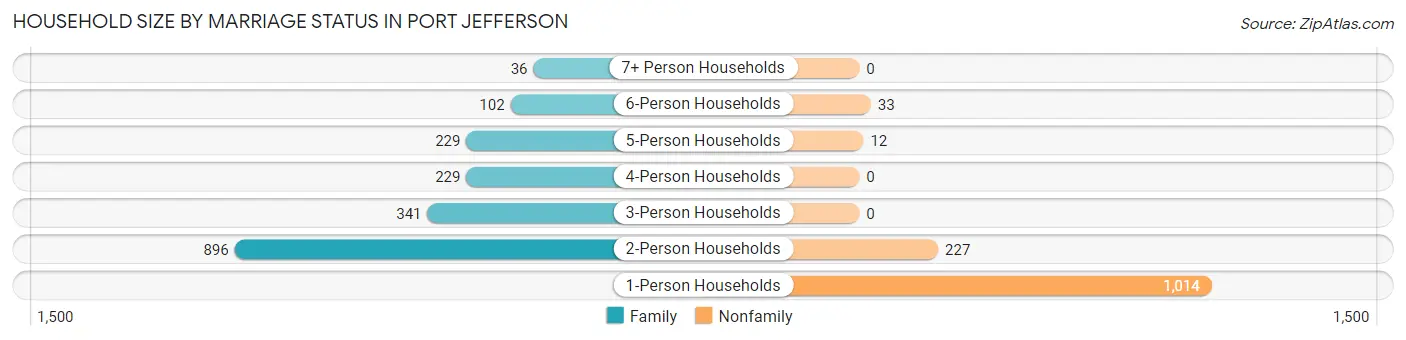
Household Size by Marriage Status in Port Jefferson
Out of a total of 3,119 households in Port Jefferson, 1,833 (58.8%) are family households, while 1,286 (41.2%) are nonfamily households. The most numerous type of family households are 2-person households, comprising 896, and the most common type of nonfamily households are 1-person households, comprising 1,014.
| Household Size | Family Households | Nonfamily Households |
| 1-Person Households | - | 1,014 (32.5%) |
| 2-Person Households | 896 (28.7%) | 227 (7.3%) |
| 3-Person Households | 341 (10.9%) | 0 (0.0%) |
| 4-Person Households | 229 (7.3%) | 0 (0.0%) |
| 5-Person Households | 229 (7.3%) | 12 (0.4%) |
| 6-Person Households | 102 (3.3%) | 33 (1.1%) |
| 7+ Person Households | 36 (1.1%) | 0 (0.0%) |
| Total | 1,833 (58.8%) | 1,286 (41.2%) |
Female Fertility in Port Jefferson
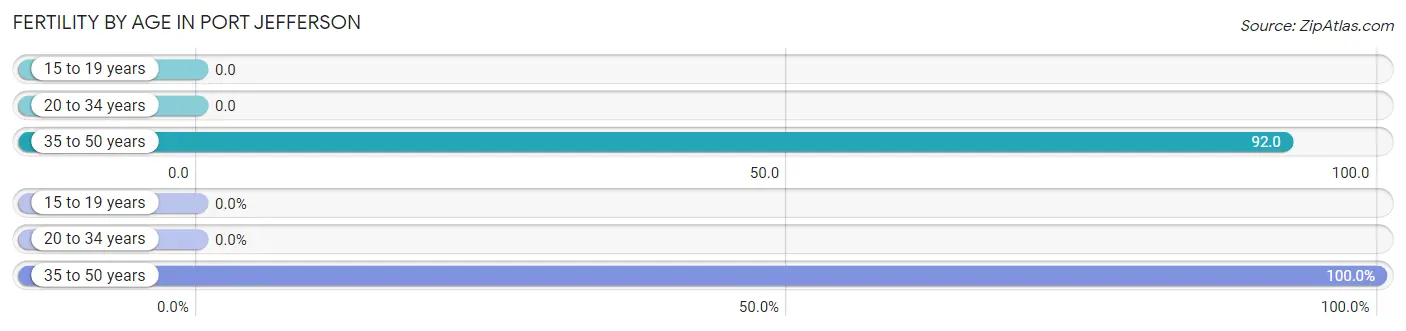
Fertility by Age in Port Jefferson
Average fertility rate in Port Jefferson is 47.0 births per 1,000 women. Women in the age bracket of 35 to 50 years have the highest fertility rate with 92.0 births per 1,000 women. Women in the age bracket of 35 to 50 years acount for 100.0% of all women with births.
| Age Bracket | Women with Births | Births / 1,000 Women |
| 15 to 19 years | 0 (0.0%) | 0.0 |
| 20 to 34 years | 0 (0.0%) | 0.0 |
| 35 to 50 years | 75 (100.0%) | 92.0 |
| Total | 75 (100.0%) | 47.0 |
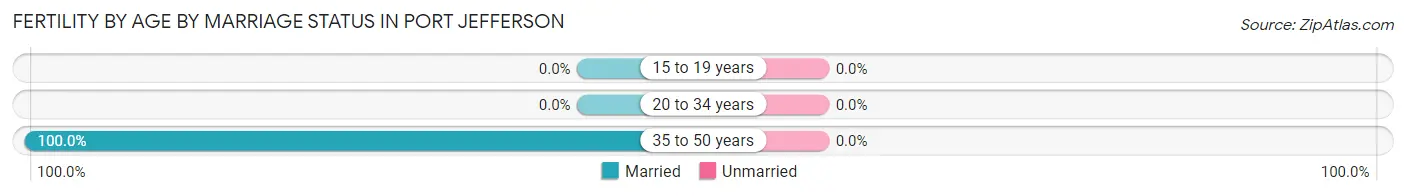
Fertility by Age by Marriage Status in Port Jefferson
| Age Bracket | Married | Unmarried |
| 15 to 19 years | 0 (0.0%) | 0 (0.0%) |
| 20 to 34 years | 0 (0.0%) | 0 (0.0%) |
| 35 to 50 years | 75 (100.0%) | 0 (0.0%) |
| Total | 75 (100.0%) | 0 (0.0%) |
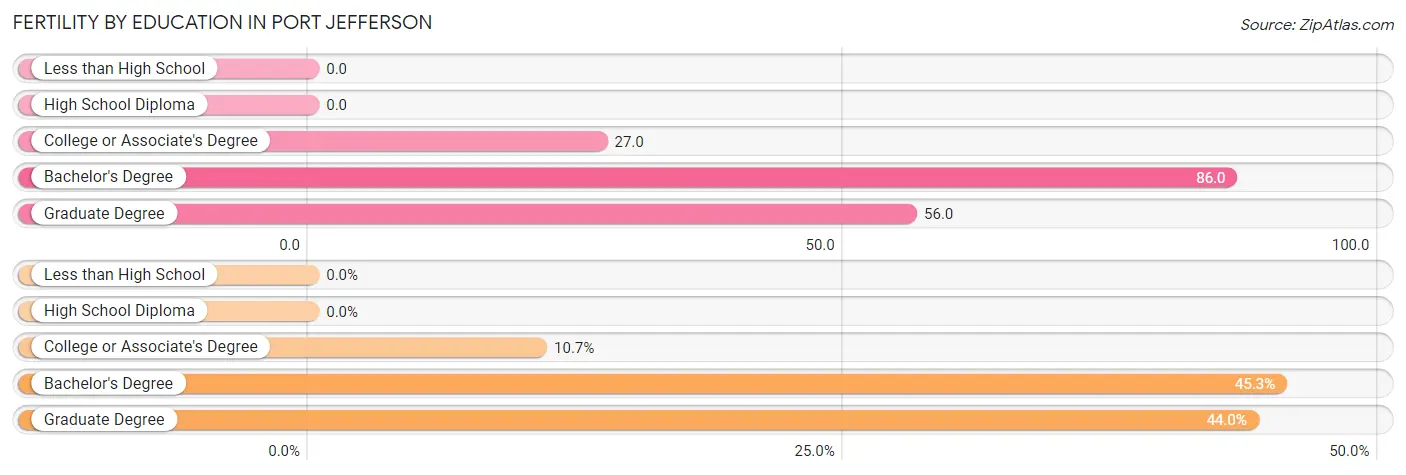
Fertility by Education in Port Jefferson
| Educational Attainment | Women with Births | Births / 1,000 Women |
| Less than High School | 0 (0.0%) | 0.0 |
| High School Diploma | 0 (0.0%) | 0.0 |
| College or Associate's Degree | 8 (10.7%) | 27.0 |
| Bachelor's Degree | 34 (45.3%) | 86.0 |
| Graduate Degree | 33 (44.0%) | 56.0 |
| Total | 75 (100.0%) | 47.0 |
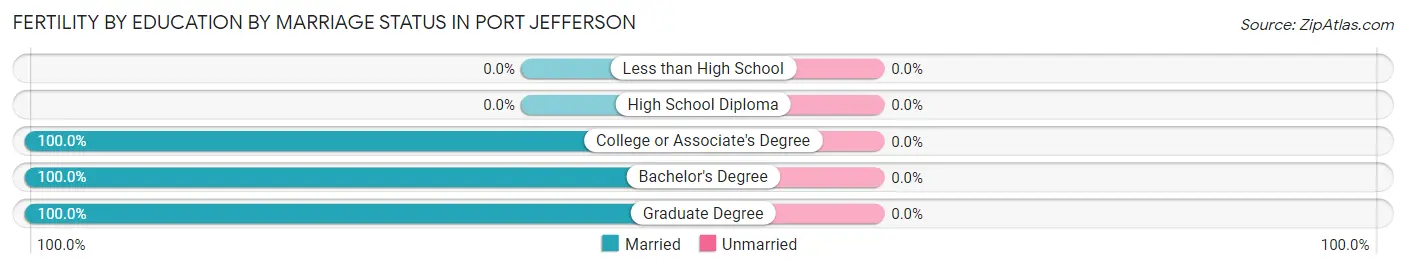
Fertility by Education by Marriage Status in Port Jefferson
| Educational Attainment | Married | Unmarried |
| Less than High School | 0 (0.0%) | 0 (0.0%) |
| High School Diploma | 0 (0.0%) | 0 (0.0%) |
| College or Associate's Degree | 8 (100.0%) | 0 (0.0%) |
| Bachelor's Degree | 34 (100.0%) | 0 (0.0%) |
| Graduate Degree | 33 (100.0%) | 0 (0.0%) |
| Total | 75 (100.0%) | 0 (0.0%) |
Income in Port Jefferson
Income Overview in Port Jefferson
Per Capita Income in Port Jefferson is $68,127, while median incomes of families and households are $181,715 and $134,230 respectively.
| Characteristic | Number | Measure |
| Per Capita Income | 7,990 | $68,127 |
| Median Family Income | 1,833 | $181,715 |
| Mean Family Income | 1,833 | $207,243 |
| Median Household Income | 3,119 | $134,230 |
| Mean Household Income | 3,119 | $173,066 |
| Income Deficit | 1,833 | $0 |
| Wage / Income Gap (%) | 7,990 | 30.76% |
| Wage / Income Gap ($) | 7,990 | 69.24¢ per $1 |
| Gini / Inequality Index | 7,990 | 0.41 |
Earnings by Sex in Port Jefferson
Average Earnings in Port Jefferson are $64,591, $73,301 for men and $50,750 for women, a difference of 30.8%.
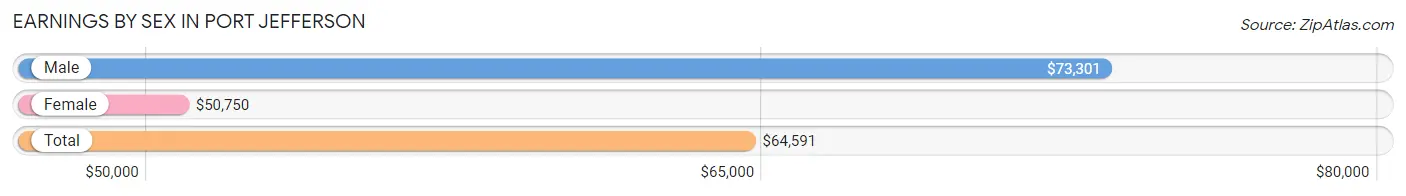
| Sex | Number | Average Earnings |
| Male | 2,605 (57.6%) | $73,301 |
| Female | 1,921 (42.4%) | $50,750 |
| Total | 4,526 (100.0%) | $64,591 |
Earnings by Sex by Income Bracket in Port Jefferson
The most common earnings brackets in Port Jefferson are $100,000+ for men (991 | 38.0%) and $100,000+ for women (457 | 23.8%).
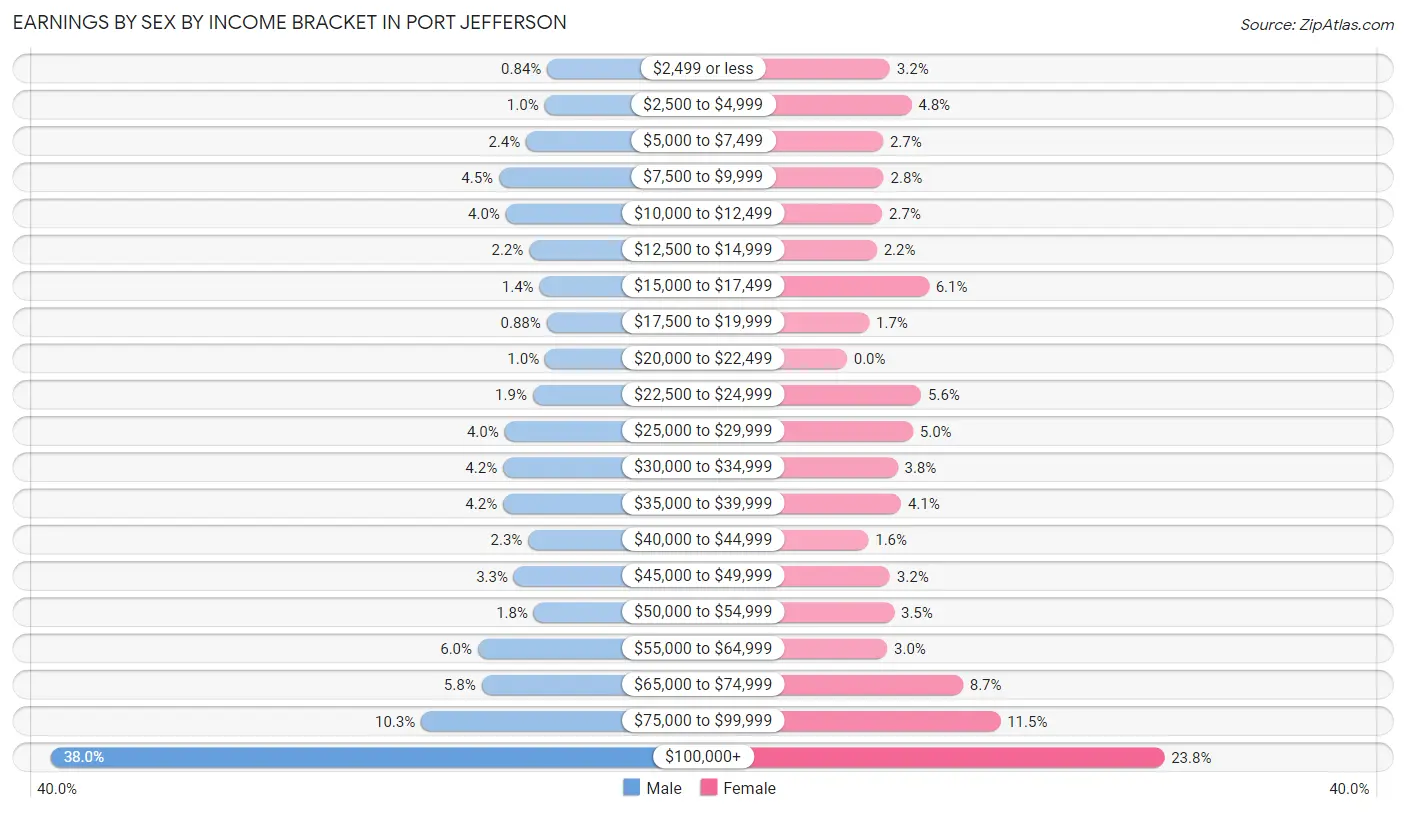
| Income | Male | Female |
| $2,499 or less | 22 (0.8%) | 62 (3.2%) |
| $2,500 to $4,999 | 27 (1.0%) | 93 (4.8%) |
| $5,000 to $7,499 | 63 (2.4%) | 52 (2.7%) |
| $7,500 to $9,999 | 116 (4.4%) | 53 (2.8%) |
| $10,000 to $12,499 | 103 (4.0%) | 51 (2.6%) |
| $12,500 to $14,999 | 57 (2.2%) | 43 (2.2%) |
| $15,000 to $17,499 | 37 (1.4%) | 118 (6.1%) |
| $17,500 to $19,999 | 23 (0.9%) | 32 (1.7%) |
| $20,000 to $22,499 | 26 (1.0%) | 0 (0.0%) |
| $22,500 to $24,999 | 50 (1.9%) | 107 (5.6%) |
| $25,000 to $29,999 | 105 (4.0%) | 95 (5.0%) |
| $30,000 to $34,999 | 108 (4.2%) | 73 (3.8%) |
| $35,000 to $39,999 | 108 (4.2%) | 78 (4.1%) |
| $40,000 to $44,999 | 59 (2.3%) | 31 (1.6%) |
| $45,000 to $49,999 | 87 (3.3%) | 62 (3.2%) |
| $50,000 to $54,999 | 48 (1.8%) | 68 (3.5%) |
| $55,000 to $64,999 | 157 (6.0%) | 58 (3.0%) |
| $65,000 to $74,999 | 150 (5.8%) | 167 (8.7%) |
| $75,000 to $99,999 | 268 (10.3%) | 221 (11.5%) |
| $100,000+ | 991 (38.0%) | 457 (23.8%) |
| Total | 2,605 (100.0%) | 1,921 (100.0%) |
Earnings by Sex by Educational Attainment in Port Jefferson
Average earnings in Port Jefferson are $86,846 for men and $68,481 for women, a difference of 21.1%. Men with an educational attainment of graduate degree enjoy the highest average annual earnings of $108,750, while those with less than high school education earn the least with $22,917. Women with an educational attainment of graduate degree earn the most with the average annual earnings of $87,647, while those with high school diploma education have the smallest earnings of $27,000.
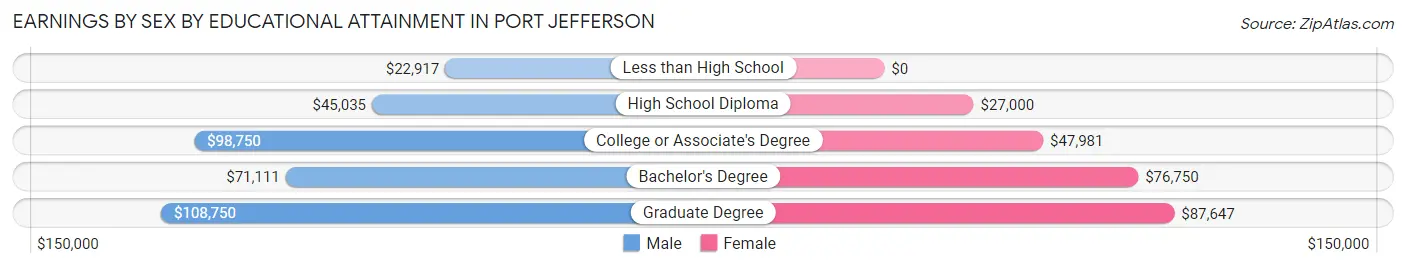
| Educational Attainment | Male Income | Female Income |
| Less than High School | $22,917 | $0 |
| High School Diploma | $45,035 | $27,000 |
| College or Associate's Degree | $98,750 | $47,981 |
| Bachelor's Degree | $71,111 | $76,750 |
| Graduate Degree | $108,750 | $87,647 |
| Total | $86,846 | $68,481 |
Family Income in Port Jefferson
Family Income Brackets in Port Jefferson
According to the Port Jefferson family income data, there are 827 families falling into the $200,000+ income range, which is the most common income bracket and makes up 45.1% of all families.
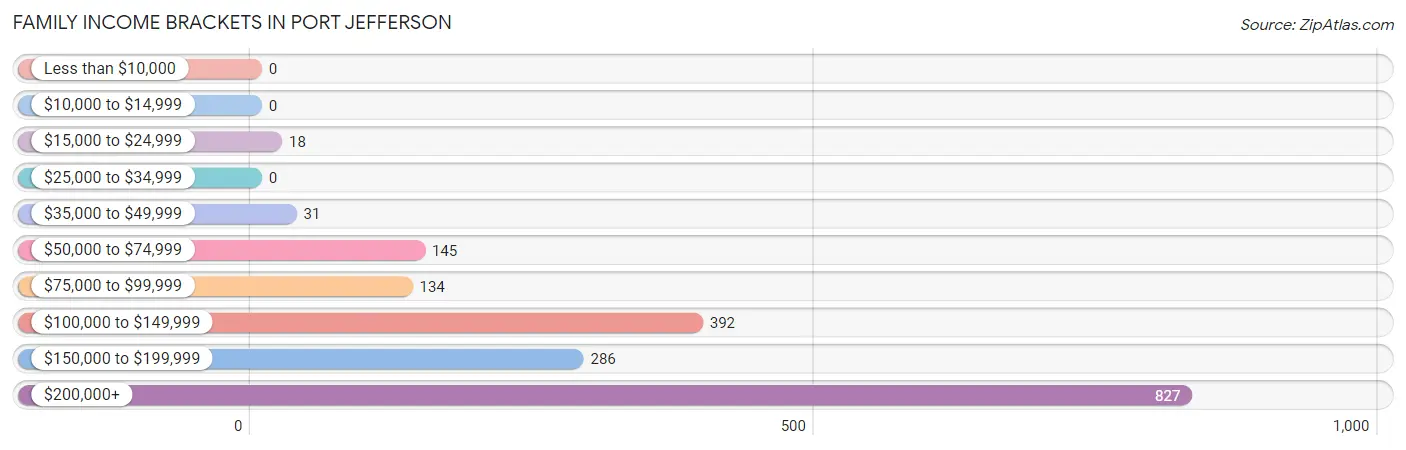
| Income Bracket | # Families | % Families |
| Less than $10,000 | 0 | 0.0% |
| $10,000 to $14,999 | 0 | 0.0% |
| $15,000 to $24,999 | 18 | 1.0% |
| $25,000 to $34,999 | 0 | 0.0% |
| $35,000 to $49,999 | 31 | 1.7% |
| $50,000 to $74,999 | 145 | 7.9% |
| $75,000 to $99,999 | 134 | 7.3% |
| $100,000 to $149,999 | 392 | 21.4% |
| $150,000 to $199,999 | 286 | 15.6% |
| $200,000+ | 827 | 45.1% |
Family Income by Famaliy Size in Port Jefferson
3-person families (345 | 18.8%) account for the highest median family income in Port Jefferson with $248,875 per family, while 2-person families (923 | 50.3%) have the highest median income of $83,576 per family member.
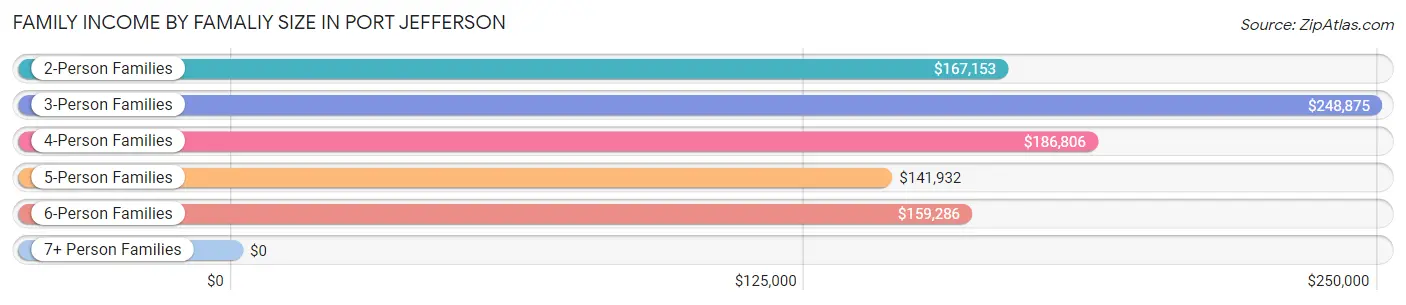
| Income Bracket | # Families | Median Income |
| 2-Person Families | 923 (50.3%) | $167,153 |
| 3-Person Families | 345 (18.8%) | $248,875 |
| 4-Person Families | 267 (14.6%) | $186,806 |
| 5-Person Families | 191 (10.4%) | $141,932 |
| 6-Person Families | 80 (4.4%) | $159,286 |
| 7+ Person Families | 27 (1.5%) | $0 |
| Total | 1,833 (100.0%) | $181,715 |
Family Income by Number of Earners in Port Jefferson
The median family income in Port Jefferson is $181,715, with families comprising 3+ earners (234) having the highest median family income of $236,389, while families with 1 earner (474) have the lowest median family income of $145,882, accounting for 12.8% and 25.9% of families, respectively.
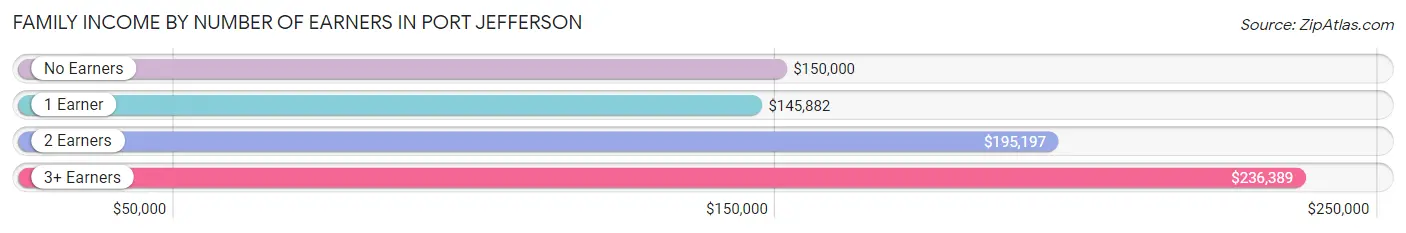
| Number of Earners | # Families | Median Income |
| No Earners | 274 (14.9%) | $150,000 |
| 1 Earner | 474 (25.9%) | $145,882 |
| 2 Earners | 851 (46.4%) | $195,197 |
| 3+ Earners | 234 (12.8%) | $236,389 |
| Total | 1,833 (100.0%) | $181,715 |
Household Income in Port Jefferson
Household Income Brackets in Port Jefferson
With 992 households falling in the category, the $200,000+ income range is the most frequent in Port Jefferson, accounting for 31.8% of all households. In contrast, only 16 households (0.5%) fall into the less than $10,000 income bracket, making it the least populous group.
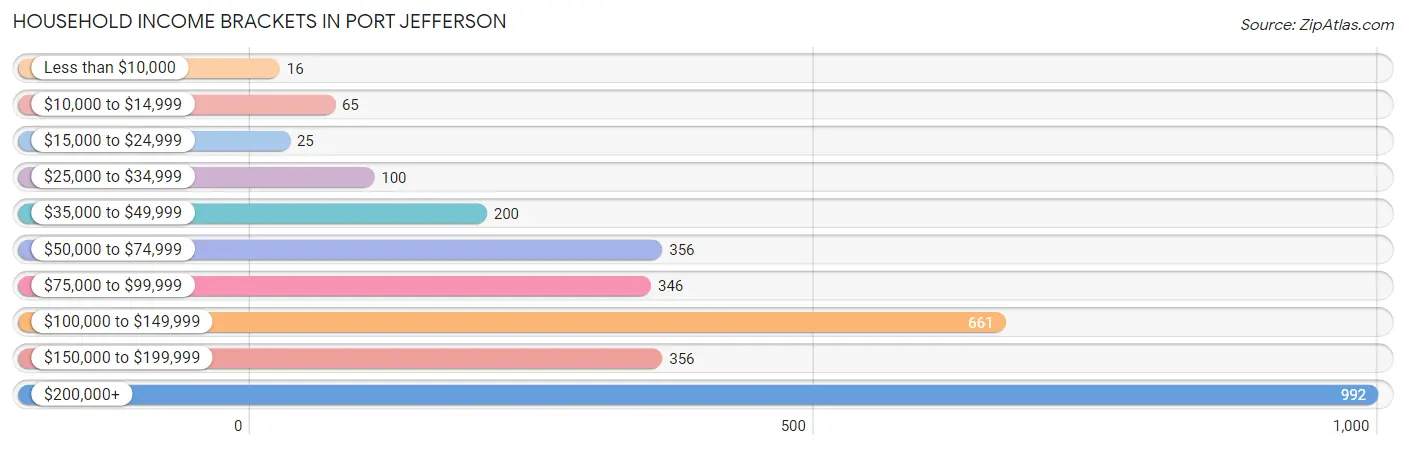
| Income Bracket | # Households | % Households |
| Less than $10,000 | 16 | 0.5% |
| $10,000 to $14,999 | 65 | 2.1% |
| $15,000 to $24,999 | 25 | 0.8% |
| $25,000 to $34,999 | 100 | 3.2% |
| $35,000 to $49,999 | 200 | 6.4% |
| $50,000 to $74,999 | 356 | 11.4% |
| $75,000 to $99,999 | 346 | 11.1% |
| $100,000 to $149,999 | 661 | 21.2% |
| $150,000 to $199,999 | 356 | 11.4% |
| $200,000+ | 992 | 31.8% |
Household Income by Householder Age in Port Jefferson
The median household income in Port Jefferson is $134,230, with the highest median household income of $168,125 found in the 45 to 64 years age bracket for the primary householder. A total of 1,229 households (39.4%) fall into this category. Meanwhile, the 15 to 24 years age bracket for the primary householder has the lowest median household income of $0, with 58 households (1.9%) in this group.
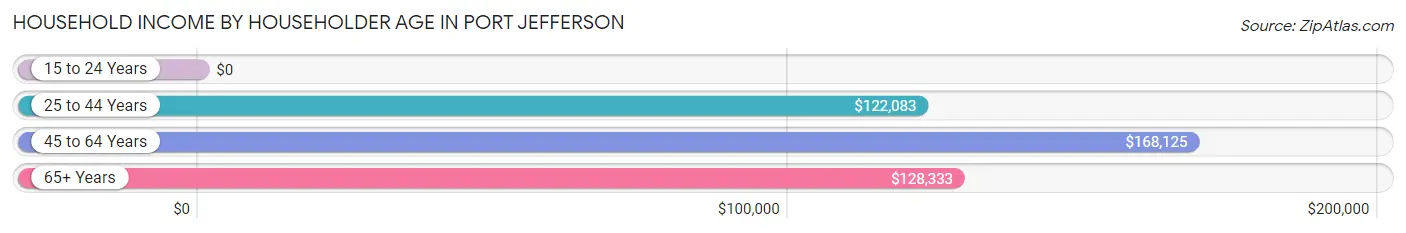
| Income Bracket | # Households | Median Income |
| 15 to 24 Years | 58 (1.9%) | $0 |
| 25 to 44 Years | 770 (24.7%) | $122,083 |
| 45 to 64 Years | 1,229 (39.4%) | $168,125 |
| 65+ Years | 1,062 (34.1%) | $128,333 |
| Total | 3,119 (100.0%) | $134,230 |
Poverty in Port Jefferson
Income Below Poverty by Sex and Age in Port Jefferson
With 5.6% poverty level for males and 5.3% for females among the residents of Port Jefferson, 55 to 64 year old males and 18 to 24 year old females are the most vulnerable to poverty, with 74 males (14.3%) and 84 females (26.1%) in their respective age groups living below the poverty level.
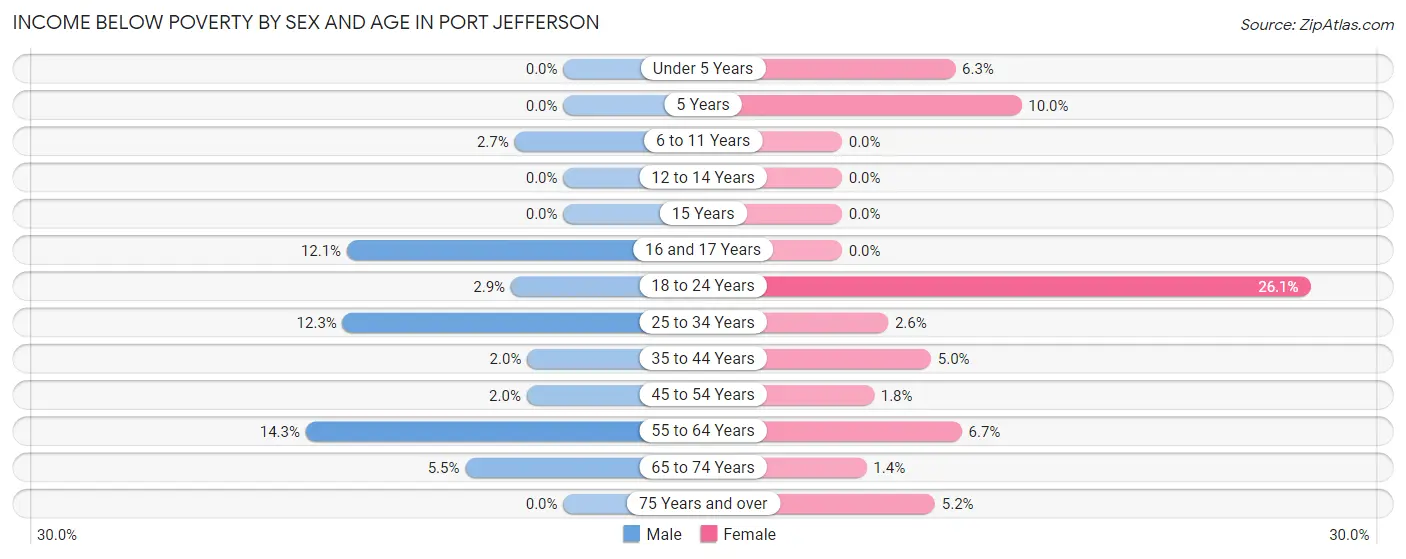
| Age Bracket | Male | Female |
| Under 5 Years | 0 (0.0%) | 14 (6.3%) |
| 5 Years | 0 (0.0%) | 7 (10.0%) |
| 6 to 11 Years | 8 (2.7%) | 0 (0.0%) |
| 12 to 14 Years | 0 (0.0%) | 0 (0.0%) |
| 15 Years | 0 (0.0%) | 0 (0.0%) |
| 16 and 17 Years | 10 (12.0%) | 0 (0.0%) |
| 18 to 24 Years | 10 (2.9%) | 84 (26.1%) |
| 25 to 34 Years | 72 (12.3%) | 9 (2.6%) |
| 35 to 44 Years | 8 (2.0%) | 20 (5.0%) |
| 45 to 54 Years | 11 (2.0%) | 10 (1.8%) |
| 55 to 64 Years | 74 (14.3%) | 37 (6.7%) |
| 65 to 74 Years | 26 (5.5%) | 8 (1.4%) |
| 75 Years and over | 0 (0.0%) | 19 (5.2%) |
| Total | 219 (5.6%) | 208 (5.3%) |
Income Above Poverty by Sex and Age in Port Jefferson
According to the poverty statistics in Port Jefferson, males aged under 5 years and females aged 6 to 11 years are the age groups that are most secure financially, with 100.0% of males and 100.0% of females in these age groups living above the poverty line.
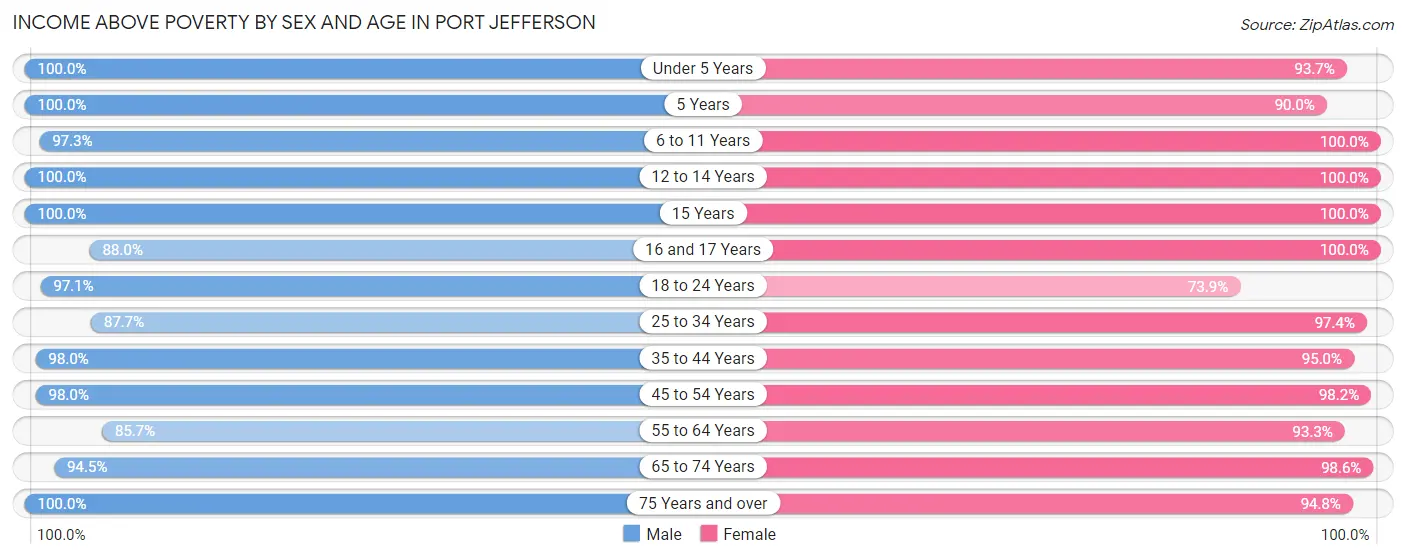
| Age Bracket | Male | Female |
| Under 5 Years | 122 (100.0%) | 208 (93.7%) |
| 5 Years | 7 (100.0%) | 63 (90.0%) |
| 6 to 11 Years | 286 (97.3%) | 263 (100.0%) |
| 12 to 14 Years | 177 (100.0%) | 113 (100.0%) |
| 15 Years | 39 (100.0%) | 58 (100.0%) |
| 16 and 17 Years | 73 (87.9%) | 45 (100.0%) |
| 18 to 24 Years | 332 (97.1%) | 238 (73.9%) |
| 25 to 34 Years | 514 (87.7%) | 341 (97.4%) |
| 35 to 44 Years | 391 (98.0%) | 383 (95.0%) |
| 45 to 54 Years | 529 (98.0%) | 552 (98.2%) |
| 55 to 64 Years | 442 (85.7%) | 518 (93.3%) |
| 65 to 74 Years | 450 (94.5%) | 576 (98.6%) |
| 75 Years and over | 341 (100.0%) | 348 (94.8%) |
| Total | 3,703 (94.4%) | 3,706 (94.7%) |
Income Below Poverty Among Married-Couple Families in Port Jefferson
The poverty statistics for married-couple families in Port Jefferson show that 0.5% or 8 of the total 1,521 families live below the poverty line. Families with 1 or 2 children have the highest poverty rate of 2.1%, comprising of 8 families. On the other hand, families with no children have the lowest poverty rate of 0.0%, which includes 0 families.
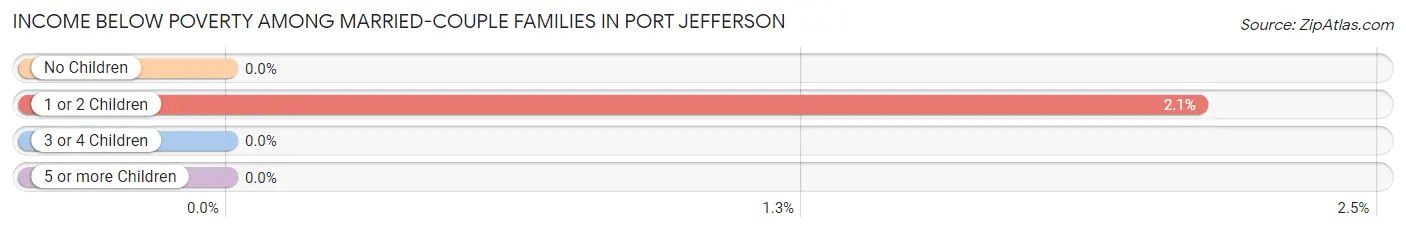
| Children | Above Poverty | Below Poverty |
| No Children | 988 (100.0%) | 0 (0.0%) |
| 1 or 2 Children | 372 (97.9%) | 8 (2.1%) |
| 3 or 4 Children | 135 (100.0%) | 0 (0.0%) |
| 5 or more Children | 18 (100.0%) | 0 (0.0%) |
| Total | 1,513 (99.5%) | 8 (0.5%) |
Income Below Poverty Among Single-Parent Households in Port Jefferson
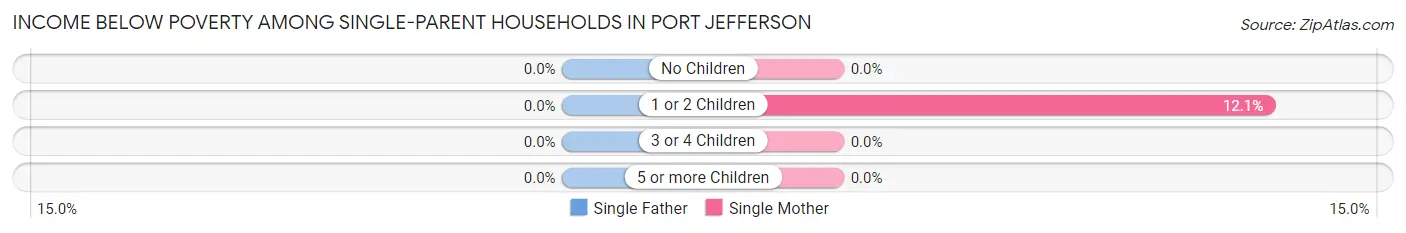
| Children | Single Father | Single Mother |
| No Children | 0 (0.0%) | 0 (0.0%) |
| 1 or 2 Children | 0 (0.0%) | 10 (12.0%) |
| 3 or 4 Children | 0 (0.0%) | 0 (0.0%) |
| 5 or more Children | 0 (0.0%) | 0 (0.0%) |
| Total | 0 (0.0%) | 10 (5.2%) |
Income Below Poverty Among Married-Couple vs Single-Parent Households in Port Jefferson
The poverty data for Port Jefferson shows that 8 of the married-couple family households (0.5%) and 10 of the single-parent households (3.2%) are living below the poverty level. Within the married-couple family households, those with 1 or 2 children have the highest poverty rate, with 8 households (2.1%) falling below the poverty line. Among the single-parent households, those with 1 or 2 children have the highest poverty rate, with 10 household (9.1%) living below poverty.
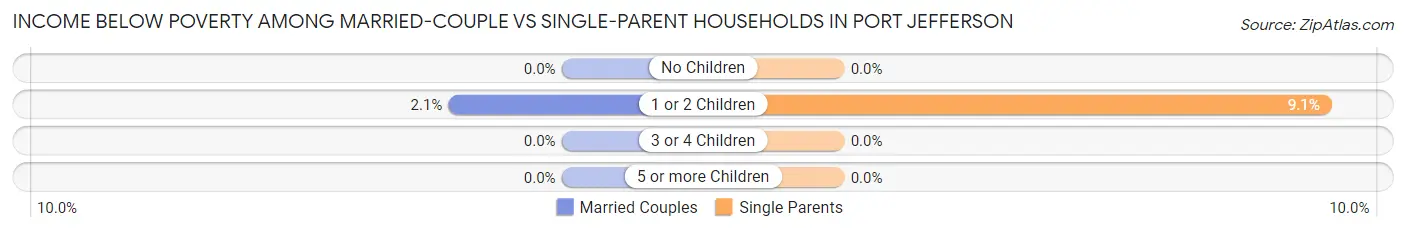
| Children | Married-Couple Families | Single-Parent Households |
| No Children | 0 (0.0%) | 0 (0.0%) |
| 1 or 2 Children | 8 (2.1%) | 10 (9.1%) |
| 3 or 4 Children | 0 (0.0%) | 0 (0.0%) |
| 5 or more Children | 0 (0.0%) | 0 (0.0%) |
| Total | 8 (0.5%) | 10 (3.2%) |
Employment Characteristics in Port Jefferson
Employment by Class of Employer in Port Jefferson
Among the 4,096 employed individuals in Port Jefferson, private company employees (2,265 | 55.3%), state government employees (493 | 12.0%), and not-for-profit organizations (389 | 9.5%) make up the most common classes of employment.
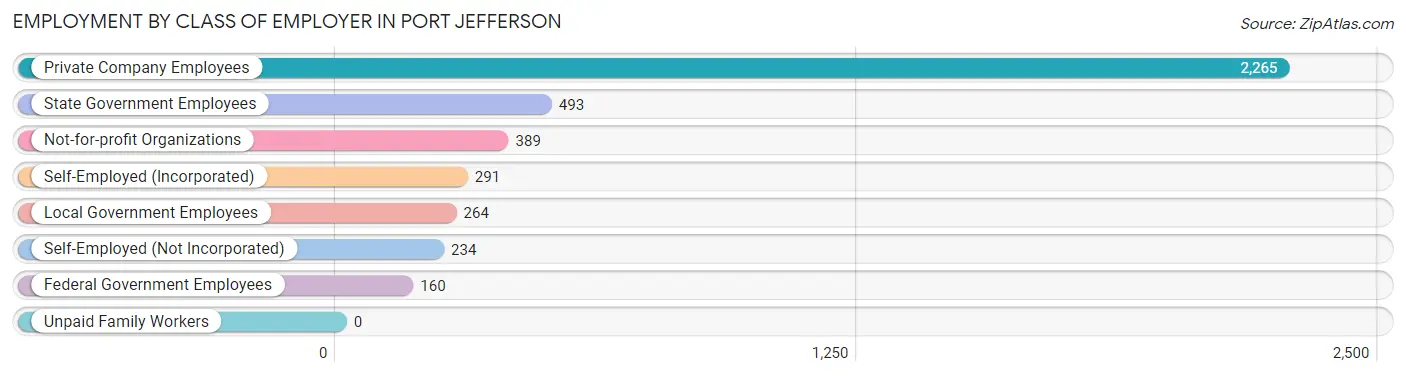
| Employer Class | # Employees | % Employees |
| Private Company Employees | 2,265 | 55.3% |
| Self-Employed (Incorporated) | 291 | 7.1% |
| Self-Employed (Not Incorporated) | 234 | 5.7% |
| Not-for-profit Organizations | 389 | 9.5% |
| Local Government Employees | 264 | 6.5% |
| State Government Employees | 493 | 12.0% |
| Federal Government Employees | 160 | 3.9% |
| Unpaid Family Workers | 0 | 0.0% |
| Total | 4,096 | 100.0% |
Employment Status by Age in Port Jefferson
According to the labor force statistics for Port Jefferson, out of the total population over 16 years of age (6,625), 64.6% or 4,280 individuals are in the labor force, with 2.9% or 124 of them unemployed. The age group with the highest labor force participation rate is 30 to 34 years, with 97.2% or 419 individuals in the labor force. Within the labor force, the 16 to 19 years age range has the highest percentage of unemployed individuals, with 9.0% or 10 of them being unemployed.
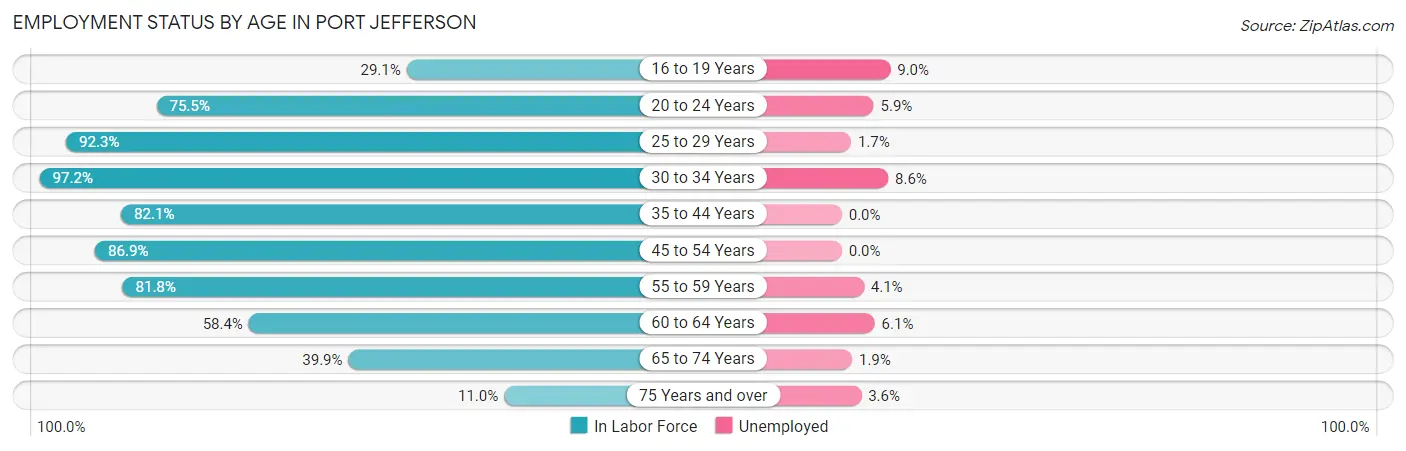
| Age Bracket | In Labor Force | Unemployed |
| 16 to 19 Years | 111 (29.1%) | 10 (9.0%) |
| 20 to 24 Years | 375 (75.5%) | 22 (5.9%) |
| 25 to 29 Years | 466 (92.3%) | 8 (1.7%) |
| 30 to 34 Years | 419 (97.2%) | 36 (8.6%) |
| 35 to 44 Years | 660 (82.1%) | 0 (0.0%) |
| 45 to 54 Years | 964 (86.9%) | 0 (0.0%) |
| 55 to 59 Years | 512 (81.8%) | 21 (4.1%) |
| 60 to 64 Years | 262 (58.4%) | 16 (6.1%) |
| 65 to 74 Years | 426 (39.9%) | 8 (1.9%) |
| 75 Years and over | 83 (11.0%) | 3 (3.6%) |
| Total | 4,280 (64.6%) | 124 (2.9%) |
Employment Status by Educational Attainment in Port Jefferson
According to labor force statistics for Port Jefferson, 83.7% of individuals (3,284) out of the total population between 25 and 64 years of age (3,924) are in the labor force, with 2.5% or 82 of them being unemployed. The group with the highest labor force participation rate are those with the educational attainment of bachelor's degree or higher, with 85.5% or 2,225 individuals in the labor force. Within the labor force, individuals with less than high school education have the highest percentage of unemployment, with 20.4% or 11 of them being unemployed.
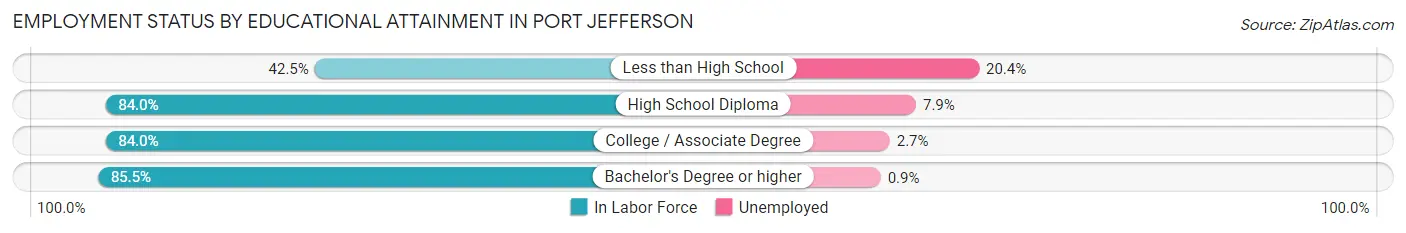
| Educational Attainment | In Labor Force | Unemployed |
| Less than High School | 54 (42.5%) | 26 (20.4%) |
| High School Diploma | 458 (84.0%) | 43 (7.9%) |
| College / Associate Degree | 546 (84.0%) | 18 (2.7%) |
| Bachelor's Degree or higher | 2,225 (85.5%) | 23 (0.9%) |
| Total | 3,284 (83.7%) | 98 (2.5%) |
Employment Occupations by Sex in Port Jefferson
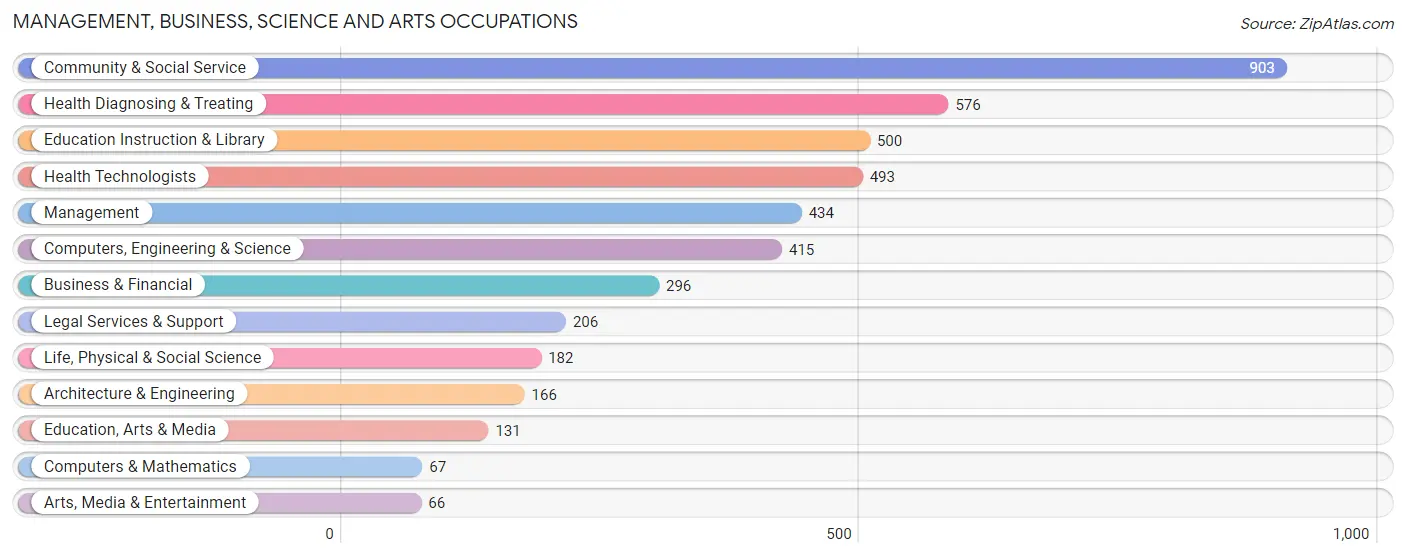
Management, Business, Science and Arts Occupations
The most common Management, Business, Science and Arts occupations in Port Jefferson are Community & Social Service (903 | 21.9%), Health Diagnosing & Treating (576 | 13.9%), Education Instruction & Library (500 | 12.1%), Health Technologists (493 | 11.9%), and Management (434 | 10.5%).
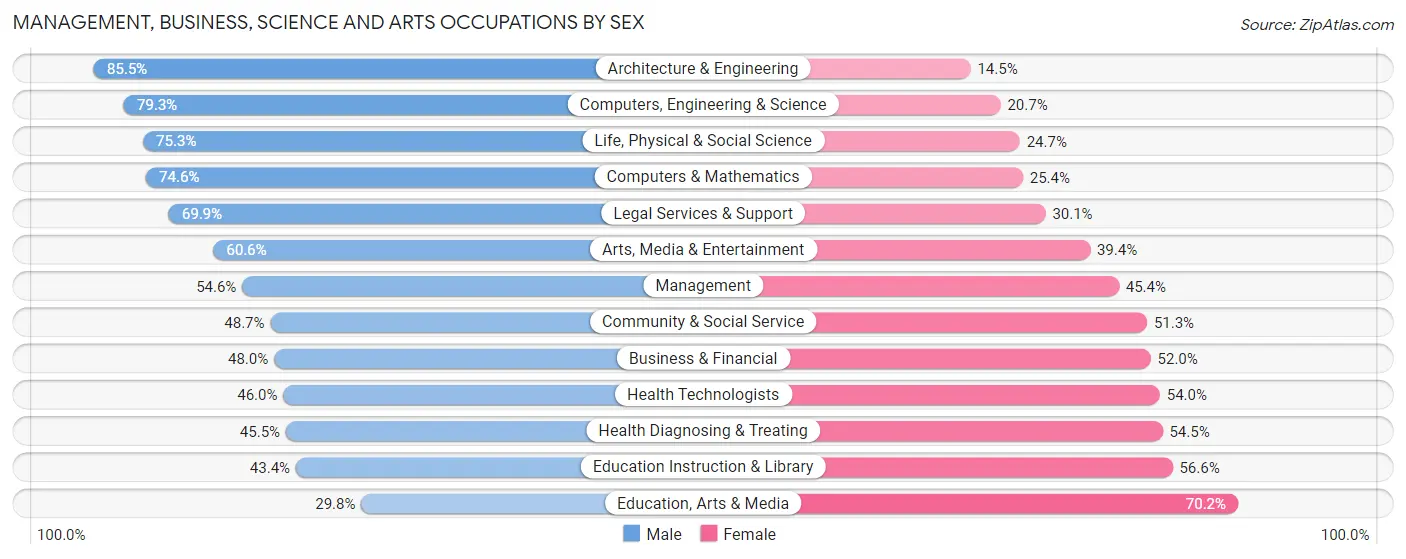
Management, Business, Science and Arts Occupations by Sex
Within the Management, Business, Science and Arts occupations in Port Jefferson, the most male-oriented occupations are Architecture & Engineering (85.5%), Computers, Engineering & Science (79.3%), and Life, Physical & Social Science (75.3%), while the most female-oriented occupations are Education, Arts & Media (70.2%), Education Instruction & Library (56.6%), and Health Diagnosing & Treating (54.5%).
| Occupation | Male | Female |
| Management | 237 (54.6%) | 197 (45.4%) |
| Business & Financial | 142 (48.0%) | 154 (52.0%) |
| Computers, Engineering & Science | 329 (79.3%) | 86 (20.7%) |
| Computers & Mathematics | 50 (74.6%) | 17 (25.4%) |
| Architecture & Engineering | 142 (85.5%) | 24 (14.5%) |
| Life, Physical & Social Science | 137 (75.3%) | 45 (24.7%) |
| Community & Social Service | 440 (48.7%) | 463 (51.3%) |
| Education, Arts & Media | 39 (29.8%) | 92 (70.2%) |
| Legal Services & Support | 144 (69.9%) | 62 (30.1%) |
| Education Instruction & Library | 217 (43.4%) | 283 (56.6%) |
| Arts, Media & Entertainment | 40 (60.6%) | 26 (39.4%) |
| Health Diagnosing & Treating | 262 (45.5%) | 314 (54.5%) |
| Health Technologists | 227 (46.0%) | 266 (54.0%) |
| Total (Category) | 1,410 (53.7%) | 1,214 (46.3%) |
| Total (Overall) | 2,400 (58.1%) | 1,731 (41.9%) |
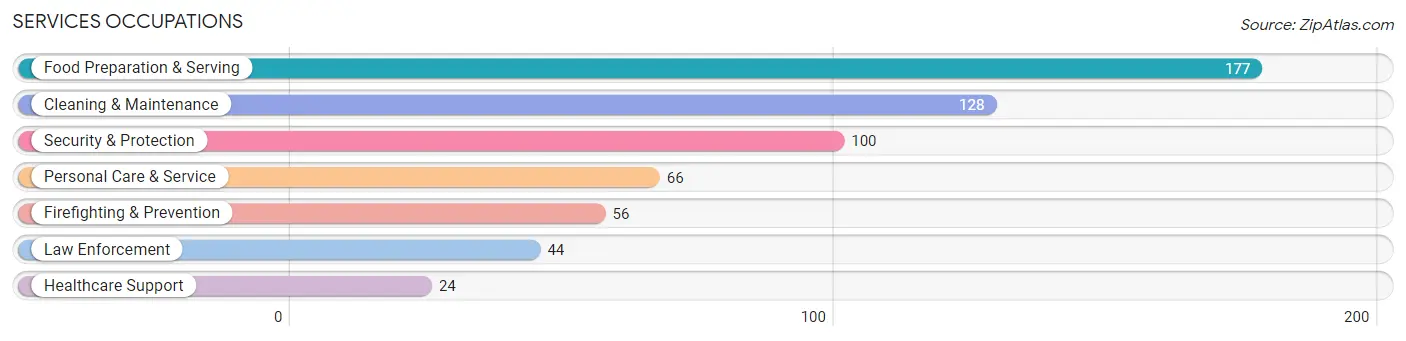
Services Occupations
The most common Services occupations in Port Jefferson are Food Preparation & Serving (177 | 4.3%), Cleaning & Maintenance (128 | 3.1%), Security & Protection (100 | 2.4%), Personal Care & Service (66 | 1.6%), and Firefighting & Prevention (56 | 1.4%).
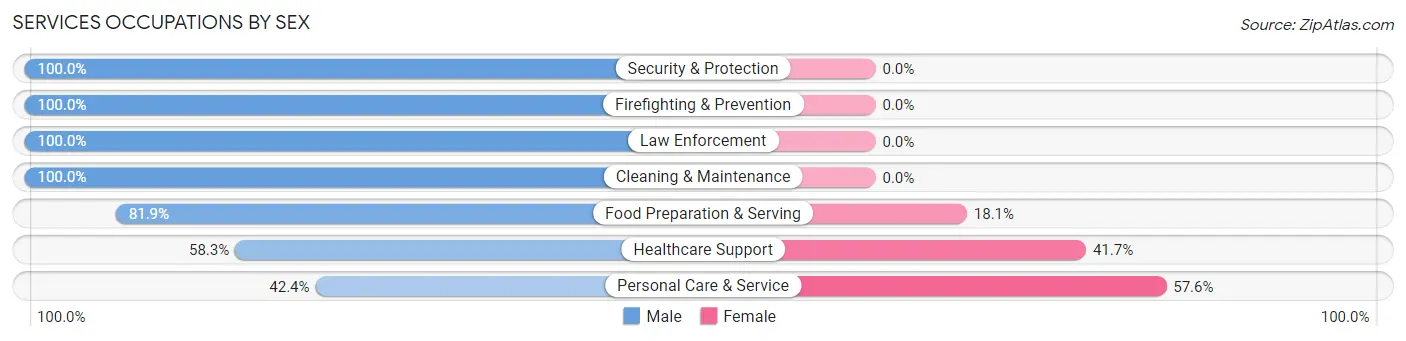
Services Occupations by Sex
Within the Services occupations in Port Jefferson, the most male-oriented occupations are Security & Protection (100.0%), Firefighting & Prevention (100.0%), and Law Enforcement (100.0%), while the most female-oriented occupations are Personal Care & Service (57.6%), Healthcare Support (41.7%), and Food Preparation & Serving (18.1%).
| Occupation | Male | Female |
| Healthcare Support | 14 (58.3%) | 10 (41.7%) |
| Security & Protection | 100 (100.0%) | 0 (0.0%) |
| Firefighting & Prevention | 56 (100.0%) | 0 (0.0%) |
| Law Enforcement | 44 (100.0%) | 0 (0.0%) |
| Food Preparation & Serving | 145 (81.9%) | 32 (18.1%) |
| Cleaning & Maintenance | 128 (100.0%) | 0 (0.0%) |
| Personal Care & Service | 28 (42.4%) | 38 (57.6%) |
| Total (Category) | 415 (83.8%) | 80 (16.2%) |
| Total (Overall) | 2,400 (58.1%) | 1,731 (41.9%) |
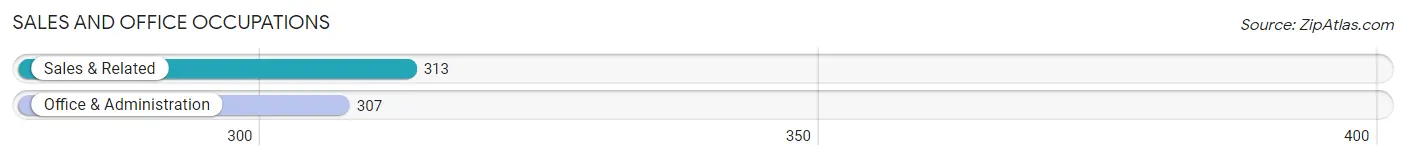
Sales and Office Occupations
The most common Sales and Office occupations in Port Jefferson are Sales & Related (313 | 7.6%), and Office & Administration (307 | 7.4%).
Sales and Office Occupations by Sex
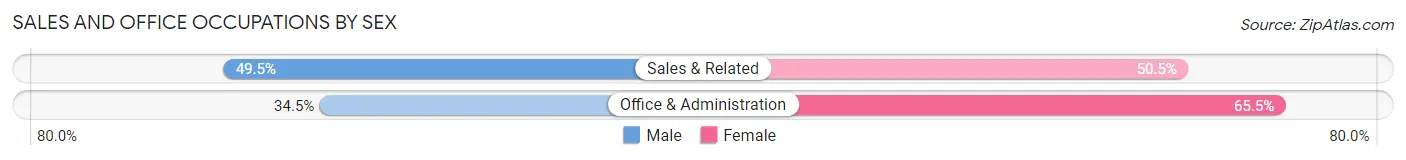
| Occupation | Male | Female |
| Sales & Related | 155 (49.5%) | 158 (50.5%) |
| Office & Administration | 106 (34.5%) | 201 (65.5%) |
| Total (Category) | 261 (42.1%) | 359 (57.9%) |
| Total (Overall) | 2,400 (58.1%) | 1,731 (41.9%) |
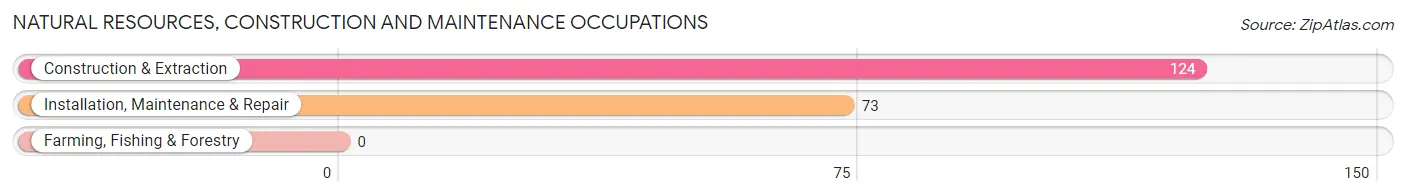
Natural Resources, Construction and Maintenance Occupations
The most common Natural Resources, Construction and Maintenance occupations in Port Jefferson are Construction & Extraction (124 | 3.0%), and Installation, Maintenance & Repair (73 | 1.8%).
Natural Resources, Construction and Maintenance Occupations by Sex
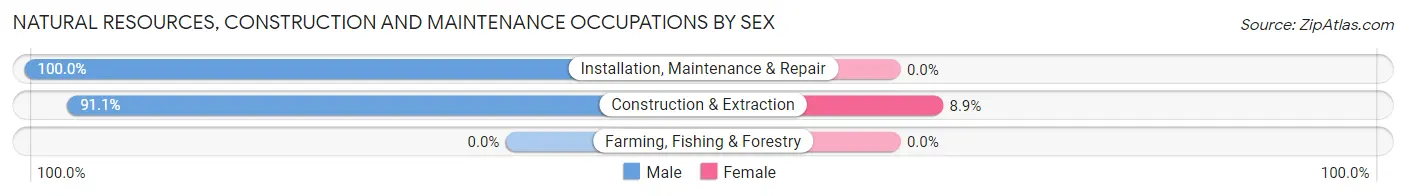
| Occupation | Male | Female |
| Farming, Fishing & Forestry | 0 (0.0%) | 0 (0.0%) |
| Construction & Extraction | 113 (91.1%) | 11 (8.9%) |
| Installation, Maintenance & Repair | 73 (100.0%) | 0 (0.0%) |
| Total (Category) | 186 (94.4%) | 11 (5.6%) |
| Total (Overall) | 2,400 (58.1%) | 1,731 (41.9%) |
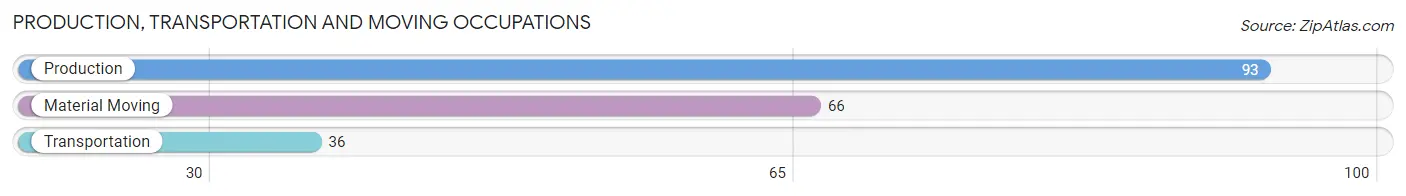
Production, Transportation and Moving Occupations
The most common Production, Transportation and Moving occupations in Port Jefferson are Production (93 | 2.2%), Material Moving (66 | 1.6%), and Transportation (36 | 0.9%).
Production, Transportation and Moving Occupations by Sex
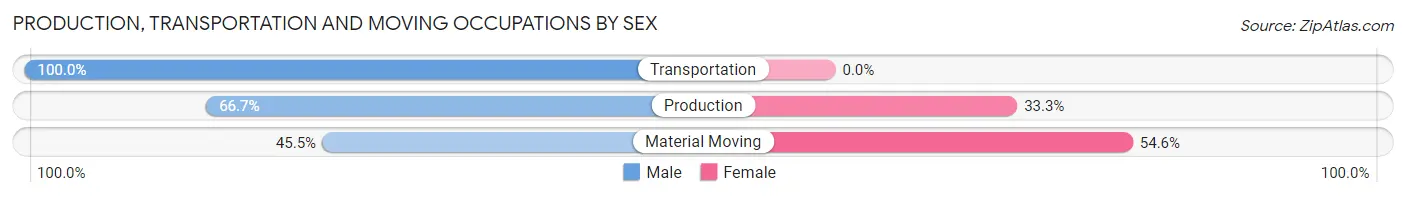
| Occupation | Male | Female |
| Production | 62 (66.7%) | 31 (33.3%) |
| Transportation | 36 (100.0%) | 0 (0.0%) |
| Material Moving | 30 (45.5%) | 36 (54.5%) |
| Total (Category) | 128 (65.6%) | 67 (34.4%) |
| Total (Overall) | 2,400 (58.1%) | 1,731 (41.9%) |
Employment Industries by Sex in Port Jefferson
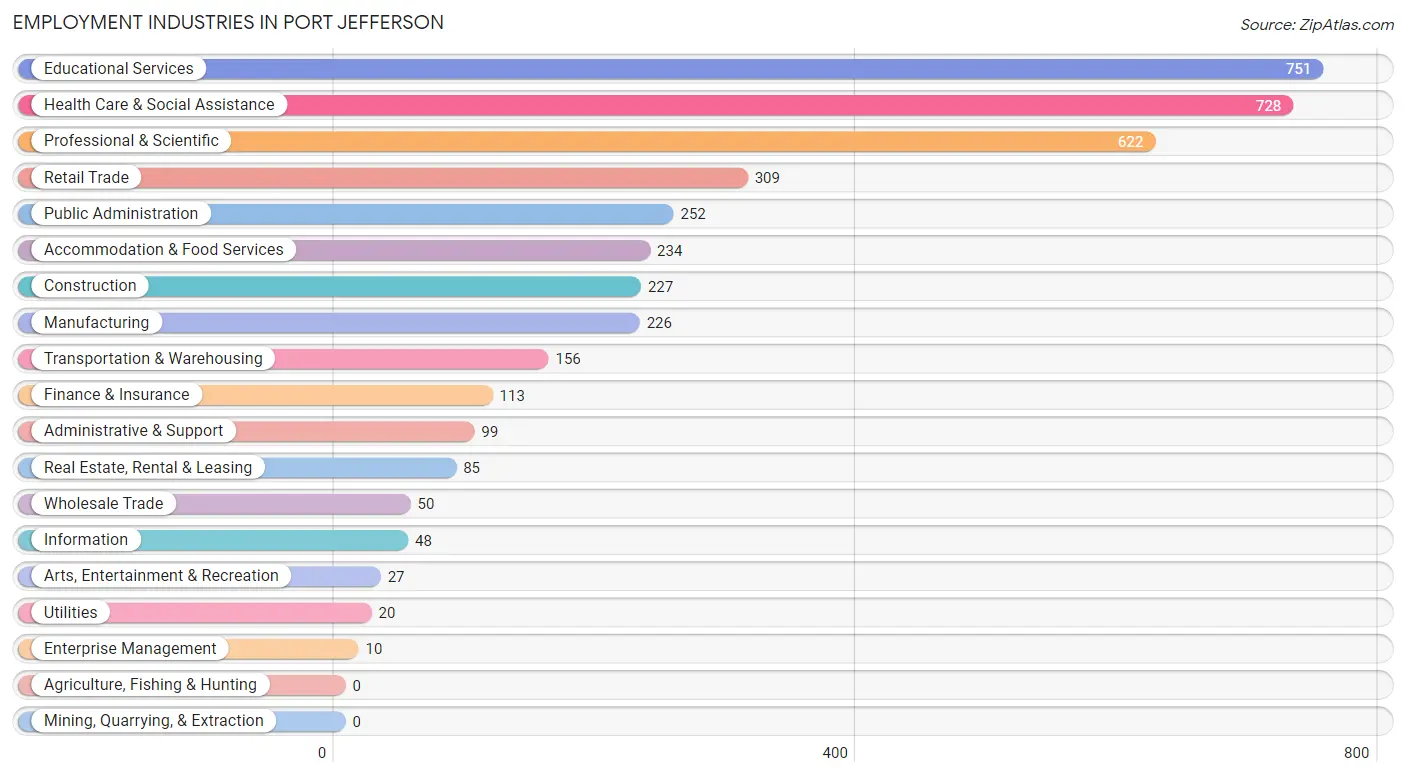
Employment Industries in Port Jefferson
The major employment industries in Port Jefferson include Educational Services (751 | 18.2%), Health Care & Social Assistance (728 | 17.6%), Professional & Scientific (622 | 15.1%), Retail Trade (309 | 7.5%), and Public Administration (252 | 6.1%).
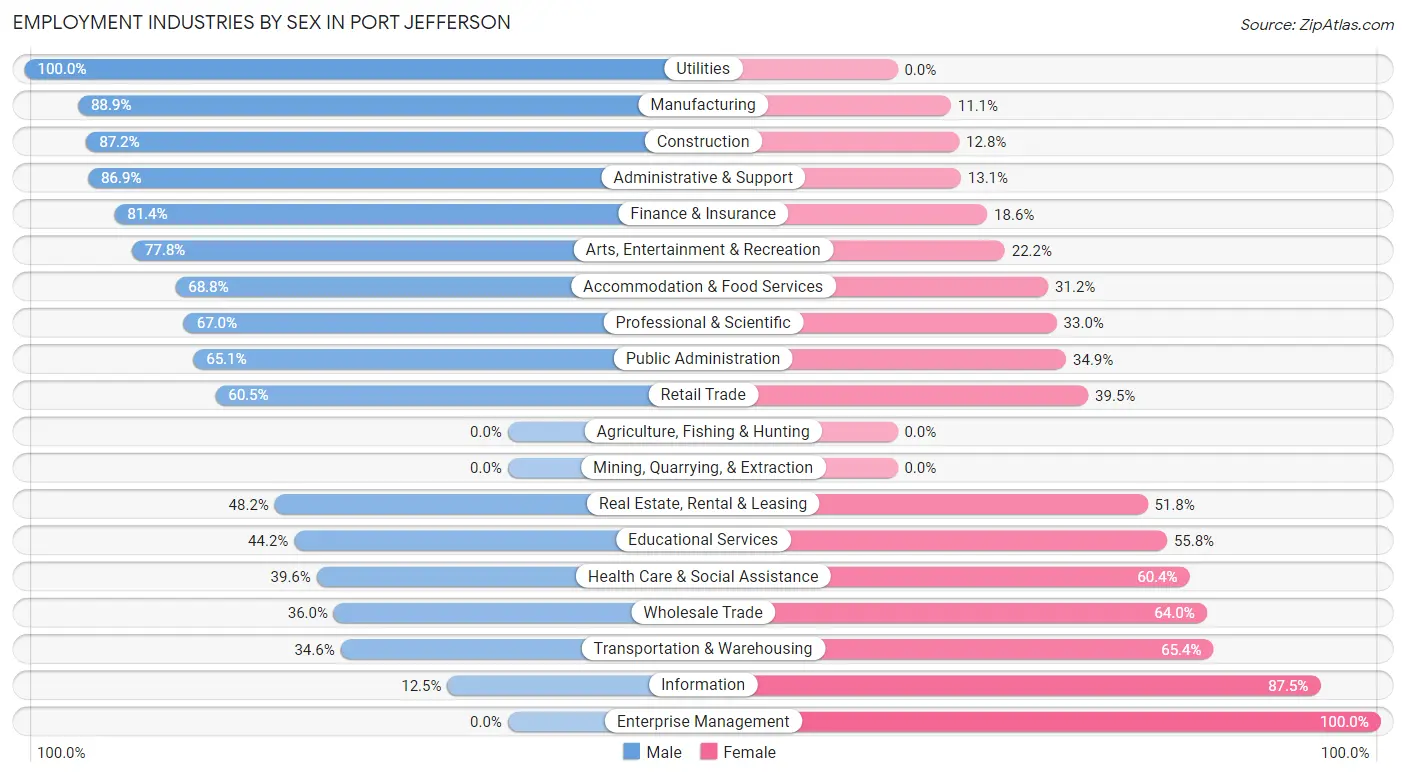
Employment Industries by Sex in Port Jefferson
The Port Jefferson industries that see more men than women are Utilities (100.0%), Manufacturing (88.9%), and Construction (87.2%), whereas the industries that tend to have a higher number of women are Enterprise Management (100.0%), Information (87.5%), and Transportation & Warehousing (65.4%).
| Industry | Male | Female |
| Agriculture, Fishing & Hunting | 0 (0.0%) | 0 (0.0%) |
| Mining, Quarrying, & Extraction | 0 (0.0%) | 0 (0.0%) |
| Construction | 198 (87.2%) | 29 (12.8%) |
| Manufacturing | 201 (88.9%) | 25 (11.1%) |
| Wholesale Trade | 18 (36.0%) | 32 (64.0%) |
| Retail Trade | 187 (60.5%) | 122 (39.5%) |
| Transportation & Warehousing | 54 (34.6%) | 102 (65.4%) |
| Utilities | 20 (100.0%) | 0 (0.0%) |
| Information | 6 (12.5%) | 42 (87.5%) |
| Finance & Insurance | 92 (81.4%) | 21 (18.6%) |
| Real Estate, Rental & Leasing | 41 (48.2%) | 44 (51.8%) |
| Professional & Scientific | 417 (67.0%) | 205 (33.0%) |
| Enterprise Management | 0 (0.0%) | 10 (100.0%) |
| Administrative & Support | 86 (86.9%) | 13 (13.1%) |
| Educational Services | 332 (44.2%) | 419 (55.8%) |
| Health Care & Social Assistance | 288 (39.6%) | 440 (60.4%) |
| Arts, Entertainment & Recreation | 21 (77.8%) | 6 (22.2%) |
| Accommodation & Food Services | 161 (68.8%) | 73 (31.2%) |
| Public Administration | 164 (65.1%) | 88 (34.9%) |
| Total | 2,400 (58.1%) | 1,731 (41.9%) |
Education in Port Jefferson
School Enrollment in Port Jefferson
The most common levels of schooling among the 1,861 students in Port Jefferson are middle school (423 | 22.7%), college / undergraduate (413 | 22.2%), and high school (365 | 19.6%).
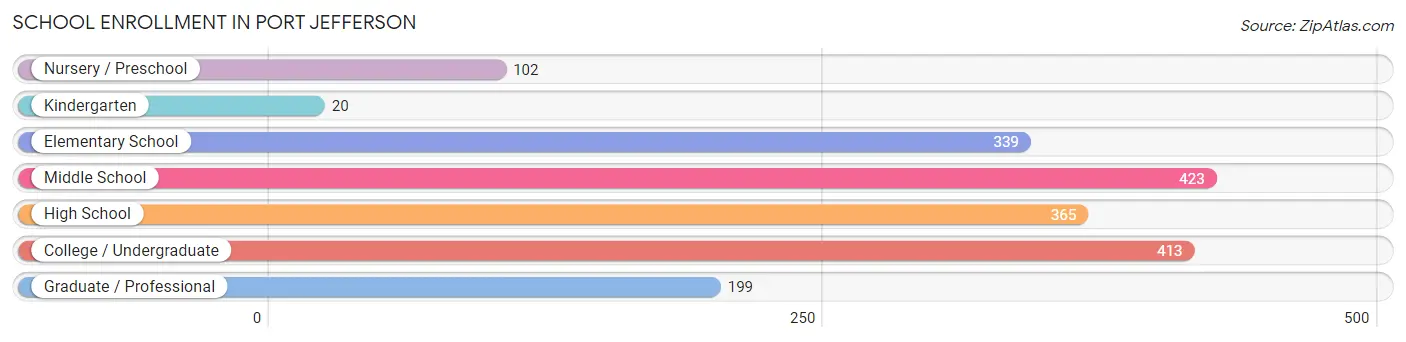
| School Level | # Students | % Students |
| Nursery / Preschool | 102 | 5.5% |
| Kindergarten | 20 | 1.1% |
| Elementary School | 339 | 18.2% |
| Middle School | 423 | 22.7% |
| High School | 365 | 19.6% |
| College / Undergraduate | 413 | 22.2% |
| Graduate / Professional | 199 | 10.7% |
| Total | 1,861 | 100.0% |
School Enrollment by Age by Funding Source in Port Jefferson
Out of a total of 1,861 students who are enrolled in schools in Port Jefferson, 274 (14.7%) attend a private institution, while the remaining 1,587 (85.3%) are enrolled in public schools. The age group of 3 to 4 year olds has the highest likelihood of being enrolled in private schools, with 31 (40.3% in the age bracket) enrolled. Conversely, the age group of 15 to 17 year olds has the lowest likelihood of being enrolled in a private school, with 225 (95.7% in the age bracket) attending a public institution.
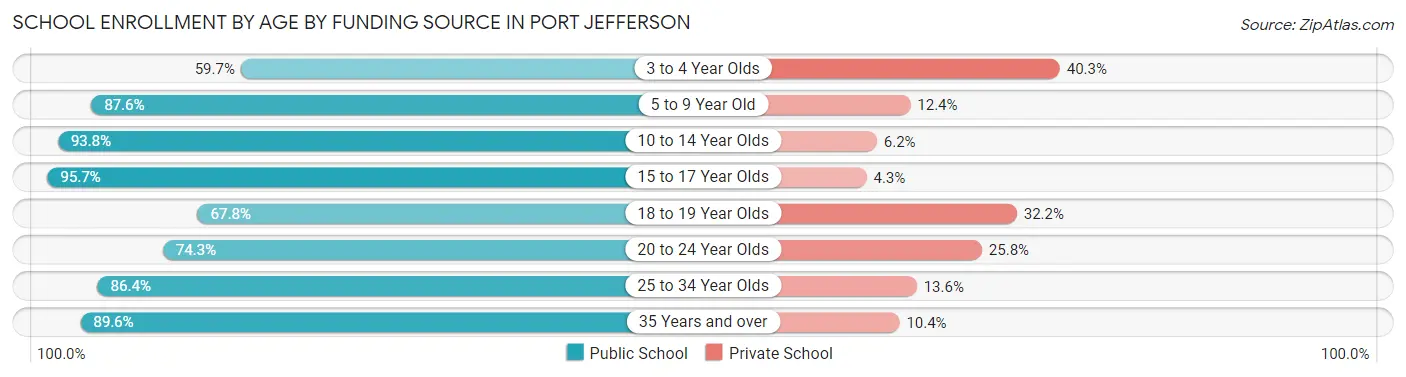
| Age Bracket | Public School | Private School |
| 3 to 4 Year Olds | 46 (59.7%) | 31 (40.3%) |
| 5 to 9 Year Old | 282 (87.6%) | 40 (12.4%) |
| 10 to 14 Year Olds | 501 (93.8%) | 33 (6.2%) |
| 15 to 17 Year Olds | 225 (95.7%) | 10 (4.3%) |
| 18 to 19 Year Olds | 145 (67.8%) | 69 (32.2%) |
| 20 to 24 Year Olds | 173 (74.3%) | 60 (25.8%) |
| 25 to 34 Year Olds | 146 (86.4%) | 23 (13.6%) |
| 35 Years and over | 69 (89.6%) | 8 (10.4%) |
| Total | 1,587 (85.3%) | 274 (14.7%) |
Educational Attainment by Field of Study in Port Jefferson
Education (607 | 15.4%), science & technology (514 | 13.0%), business (392 | 9.9%), engineering (312 | 7.9%), and computers & mathematics (302 | 7.6%) are the most common fields of study among 3,948 individuals in Port Jefferson who have obtained a bachelor's degree or higher.
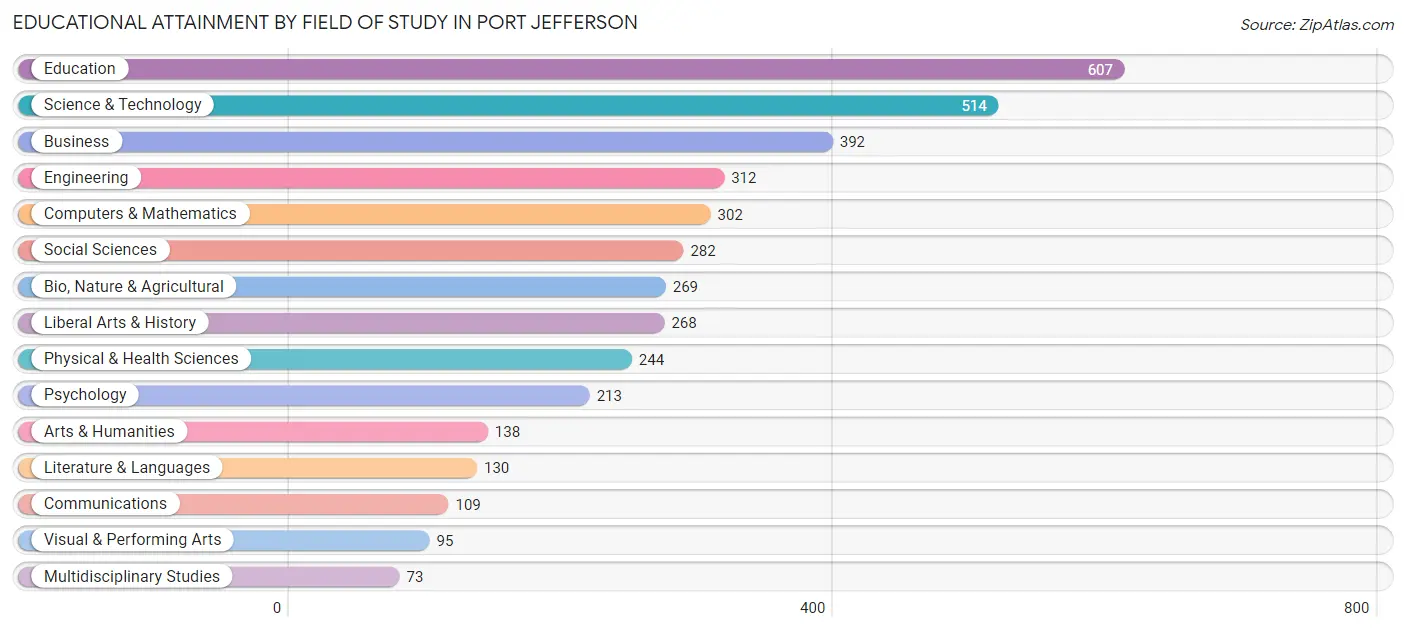
| Field of Study | # Graduates | % Graduates |
| Computers & Mathematics | 302 | 7.6% |
| Bio, Nature & Agricultural | 269 | 6.8% |
| Physical & Health Sciences | 244 | 6.2% |
| Psychology | 213 | 5.4% |
| Social Sciences | 282 | 7.1% |
| Engineering | 312 | 7.9% |
| Multidisciplinary Studies | 73 | 1.8% |
| Science & Technology | 514 | 13.0% |
| Business | 392 | 9.9% |
| Education | 607 | 15.4% |
| Literature & Languages | 130 | 3.3% |
| Liberal Arts & History | 268 | 6.8% |
| Visual & Performing Arts | 95 | 2.4% |
| Communications | 109 | 2.8% |
| Arts & Humanities | 138 | 3.5% |
| Total | 3,948 | 100.0% |
Transportation & Commute in Port Jefferson
Vehicle Availability by Sex in Port Jefferson
The most prevalent vehicle ownership categories in Port Jefferson are males with 2 vehicles (935, accounting for 39.0%) and females with 2 vehicles (674, making up 55.3%).
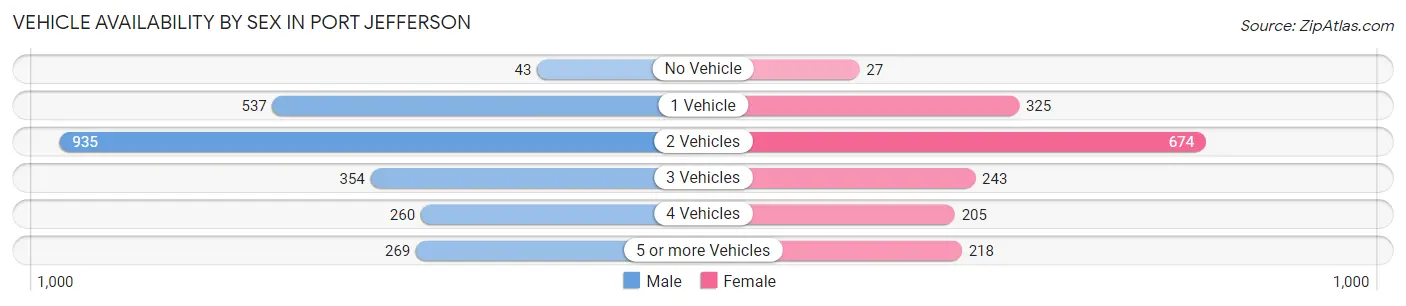
| Vehicles Available | Male | Female |
| No Vehicle | 43 (1.8%) | 27 (1.6%) |
| 1 Vehicle | 537 (22.4%) | 325 (19.2%) |
| 2 Vehicles | 935 (39.0%) | 674 (39.8%) |
| 3 Vehicles | 354 (14.8%) | 243 (14.4%) |
| 4 Vehicles | 260 (10.8%) | 205 (12.1%) |
| 5 or more Vehicles | 269 (11.2%) | 218 (12.9%) |
| Total | 2,398 (100.0%) | 1,692 (100.0%) |
Commute Time in Port Jefferson
The most frequently occuring commute durations in Port Jefferson are 30 to 34 minutes (655 commuters, 17.8%), 5 to 9 minutes (607 commuters, 16.5%), and 20 to 24 minutes (529 commuters, 14.3%).
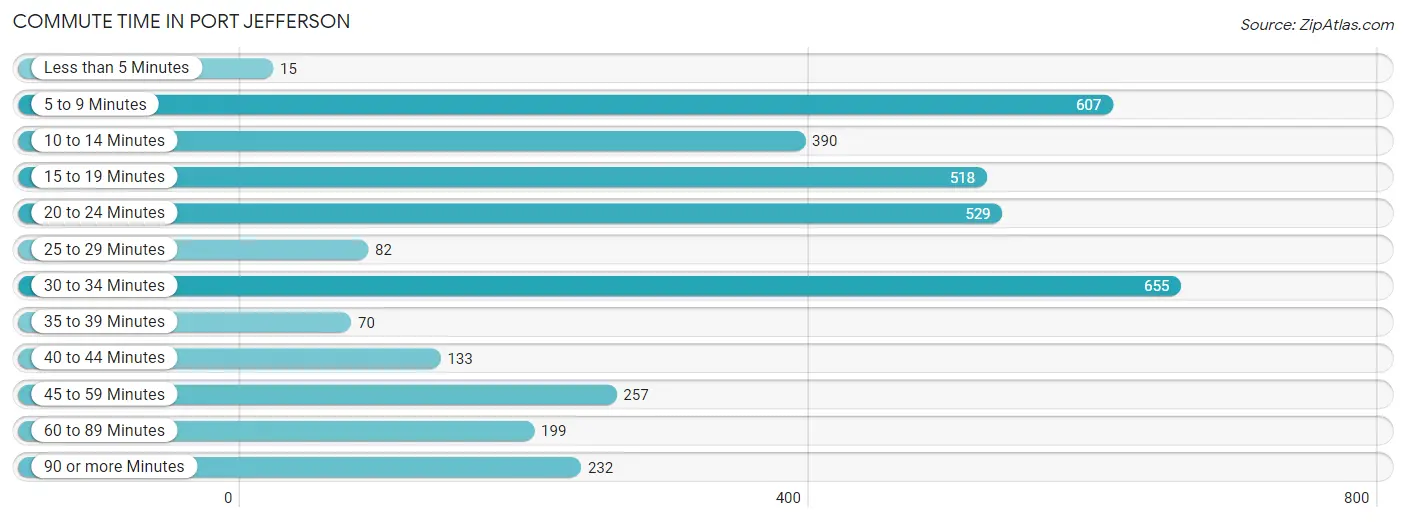
| Commute Time | # Commuters | % Commuters |
| Less than 5 Minutes | 15 | 0.4% |
| 5 to 9 Minutes | 607 | 16.5% |
| 10 to 14 Minutes | 390 | 10.6% |
| 15 to 19 Minutes | 518 | 14.1% |
| 20 to 24 Minutes | 529 | 14.3% |
| 25 to 29 Minutes | 82 | 2.2% |
| 30 to 34 Minutes | 655 | 17.8% |
| 35 to 39 Minutes | 70 | 1.9% |
| 40 to 44 Minutes | 133 | 3.6% |
| 45 to 59 Minutes | 257 | 7.0% |
| 60 to 89 Minutes | 199 | 5.4% |
| 90 or more Minutes | 232 | 6.3% |
Commute Time by Sex in Port Jefferson
The most common commute times in Port Jefferson are 30 to 34 minutes (467 commuters, 20.9%) for males and 20 to 24 minutes (250 commuters, 17.2%) for females.
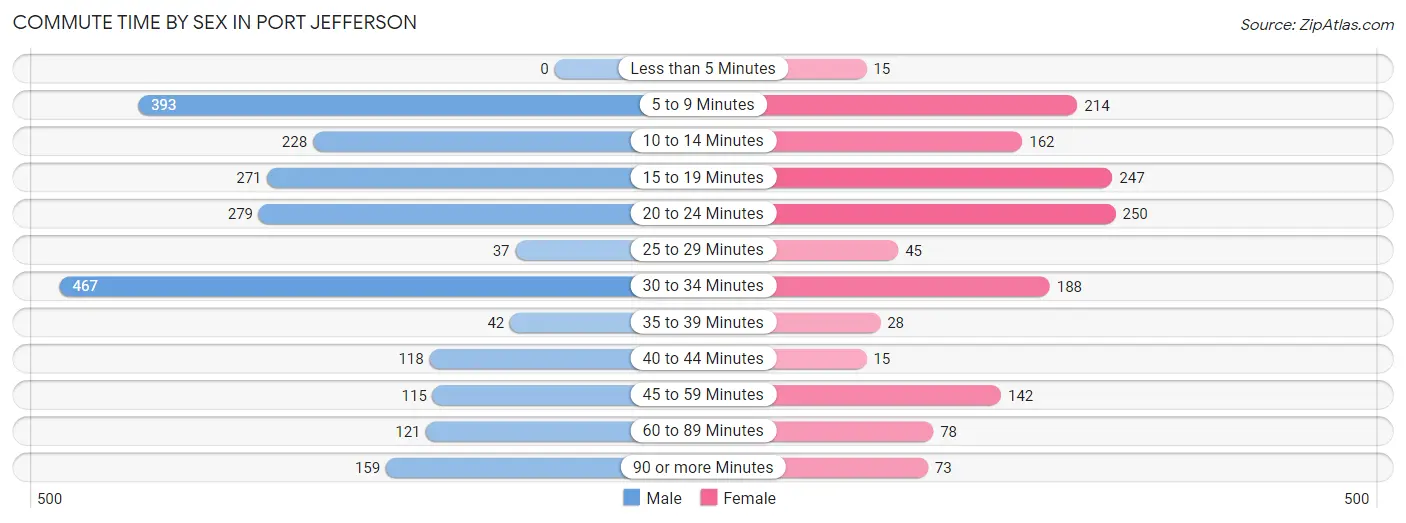
| Commute Time | Male | Female |
| Less than 5 Minutes | 0 (0.0%) | 15 (1.0%) |
| 5 to 9 Minutes | 393 (17.6%) | 214 (14.7%) |
| 10 to 14 Minutes | 228 (10.2%) | 162 (11.1%) |
| 15 to 19 Minutes | 271 (12.1%) | 247 (17.0%) |
| 20 to 24 Minutes | 279 (12.5%) | 250 (17.2%) |
| 25 to 29 Minutes | 37 (1.7%) | 45 (3.1%) |
| 30 to 34 Minutes | 467 (20.9%) | 188 (12.9%) |
| 35 to 39 Minutes | 42 (1.9%) | 28 (1.9%) |
| 40 to 44 Minutes | 118 (5.3%) | 15 (1.0%) |
| 45 to 59 Minutes | 115 (5.2%) | 142 (9.8%) |
| 60 to 89 Minutes | 121 (5.4%) | 78 (5.3%) |
| 90 or more Minutes | 159 (7.1%) | 73 (5.0%) |
Time of Departure to Work by Sex in Port Jefferson
The most frequent times of departure to work in Port Jefferson are 8:00 AM to 8:29 AM (344, 15.4%) for males and 8:30 AM to 8:59 AM (249, 17.1%) for females.
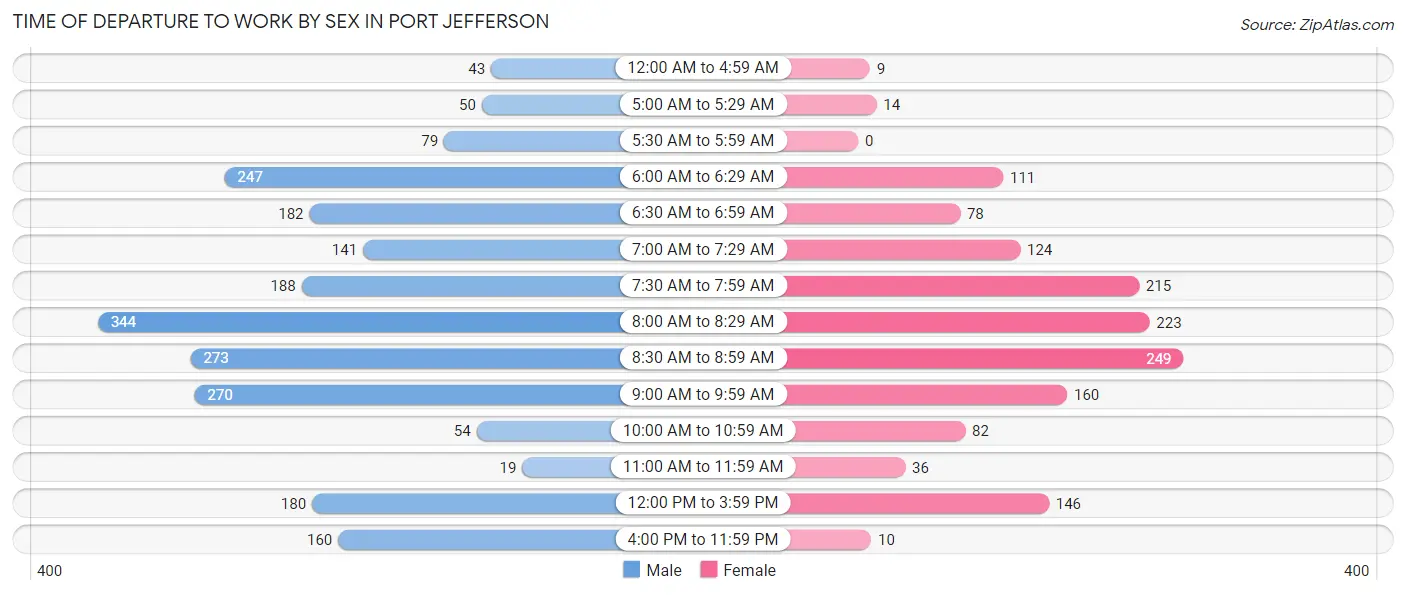
| Time of Departure | Male | Female |
| 12:00 AM to 4:59 AM | 43 (1.9%) | 9 (0.6%) |
| 5:00 AM to 5:29 AM | 50 (2.2%) | 14 (1.0%) |
| 5:30 AM to 5:59 AM | 79 (3.5%) | 0 (0.0%) |
| 6:00 AM to 6:29 AM | 247 (11.1%) | 111 (7.6%) |
| 6:30 AM to 6:59 AM | 182 (8.2%) | 78 (5.3%) |
| 7:00 AM to 7:29 AM | 141 (6.3%) | 124 (8.5%) |
| 7:30 AM to 7:59 AM | 188 (8.4%) | 215 (14.8%) |
| 8:00 AM to 8:29 AM | 344 (15.4%) | 223 (15.3%) |
| 8:30 AM to 8:59 AM | 273 (12.2%) | 249 (17.1%) |
| 9:00 AM to 9:59 AM | 270 (12.1%) | 160 (11.0%) |
| 10:00 AM to 10:59 AM | 54 (2.4%) | 82 (5.6%) |
| 11:00 AM to 11:59 AM | 19 (0.9%) | 36 (2.5%) |
| 12:00 PM to 3:59 PM | 180 (8.1%) | 146 (10.0%) |
| 4:00 PM to 11:59 PM | 160 (7.2%) | 10 (0.7%) |
| Total | 2,230 (100.0%) | 1,457 (100.0%) |
Housing Occupancy in Port Jefferson
Occupancy by Ownership in Port Jefferson
Of the total 3,119 dwellings in Port Jefferson, owner-occupied units account for 2,194 (70.3%), while renter-occupied units make up 925 (29.7%).
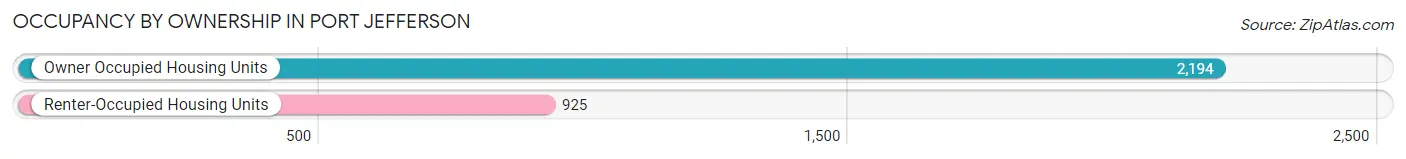
| Occupancy | # Housing Units | % Housing Units |
| Owner Occupied Housing Units | 2,194 | 70.3% |
| Renter-Occupied Housing Units | 925 | 29.7% |
| Total Occupied Housing Units | 3,119 | 100.0% |
Occupancy by Household Size in Port Jefferson
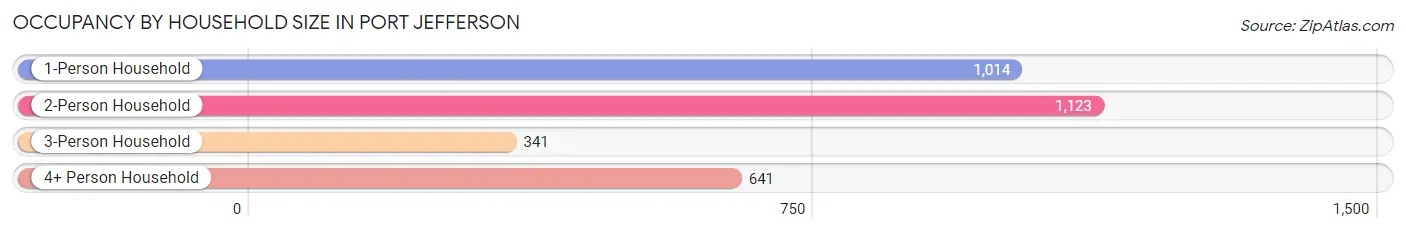
| Household Size | # Housing Units | % Housing Units |
| 1-Person Household | 1,014 | 32.5% |
| 2-Person Household | 1,123 | 36.0% |
| 3-Person Household | 341 | 10.9% |
| 4+ Person Household | 641 | 20.5% |
| Total Housing Units | 3,119 | 100.0% |
Occupancy by Ownership by Household Size in Port Jefferson
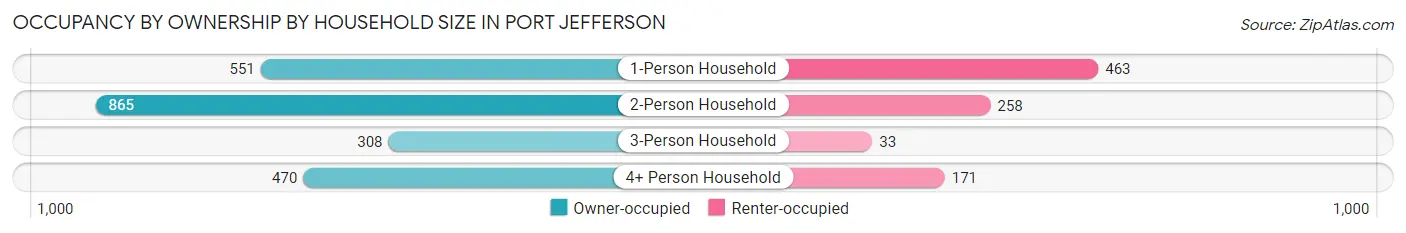
| Household Size | Owner-occupied | Renter-occupied |
| 1-Person Household | 551 (54.3%) | 463 (45.7%) |
| 2-Person Household | 865 (77.0%) | 258 (23.0%) |
| 3-Person Household | 308 (90.3%) | 33 (9.7%) |
| 4+ Person Household | 470 (73.3%) | 171 (26.7%) |
| Total Housing Units | 2,194 (70.3%) | 925 (29.7%) |
Occupancy by Educational Attainment in Port Jefferson
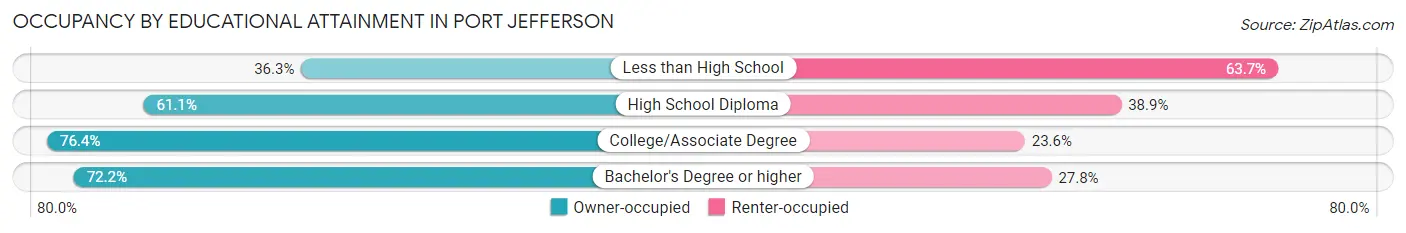
| Household Size | Owner-occupied | Renter-occupied |
| Less than High School | 41 (36.3%) | 72 (63.7%) |
| High School Diploma | 206 (61.1%) | 131 (38.9%) |
| College/Associate Degree | 360 (76.4%) | 111 (23.6%) |
| Bachelor's Degree or higher | 1,587 (72.2%) | 611 (27.8%) |
Occupancy by Age of Householder in Port Jefferson
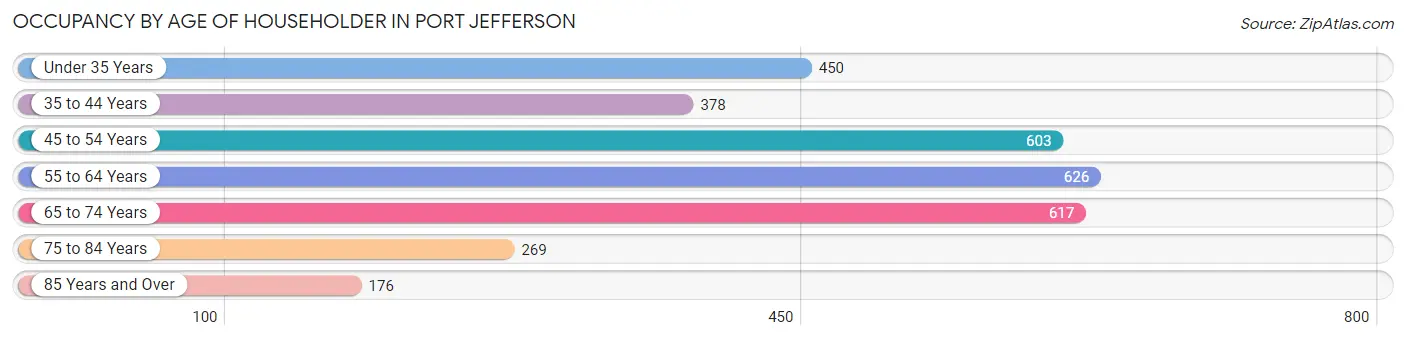
| Age Bracket | # Households | % Households |
| Under 35 Years | 450 | 14.4% |
| 35 to 44 Years | 378 | 12.1% |
| 45 to 54 Years | 603 | 19.3% |
| 55 to 64 Years | 626 | 20.1% |
| 65 to 74 Years | 617 | 19.8% |
| 75 to 84 Years | 269 | 8.6% |
| 85 Years and Over | 176 | 5.6% |
| Total | 3,119 | 100.0% |
Housing Finances in Port Jefferson
Median Income by Occupancy in Port Jefferson
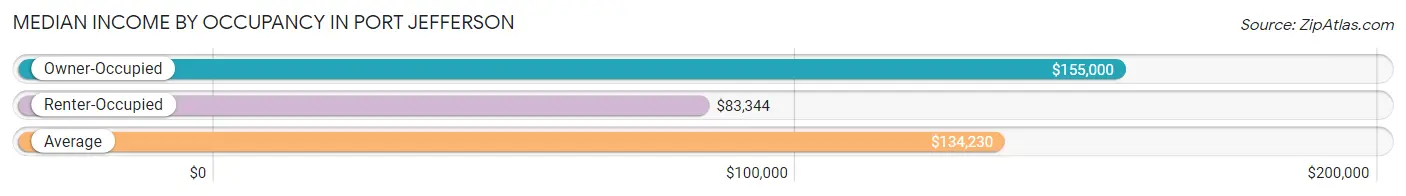
| Occupancy Type | # Households | Median Income |
| Owner-Occupied | 2,194 (70.3%) | $155,000 |
| Renter-Occupied | 925 (29.7%) | $83,344 |
| Average | 3,119 (100.0%) | $134,230 |
Occupancy by Householder Income Bracket in Port Jefferson
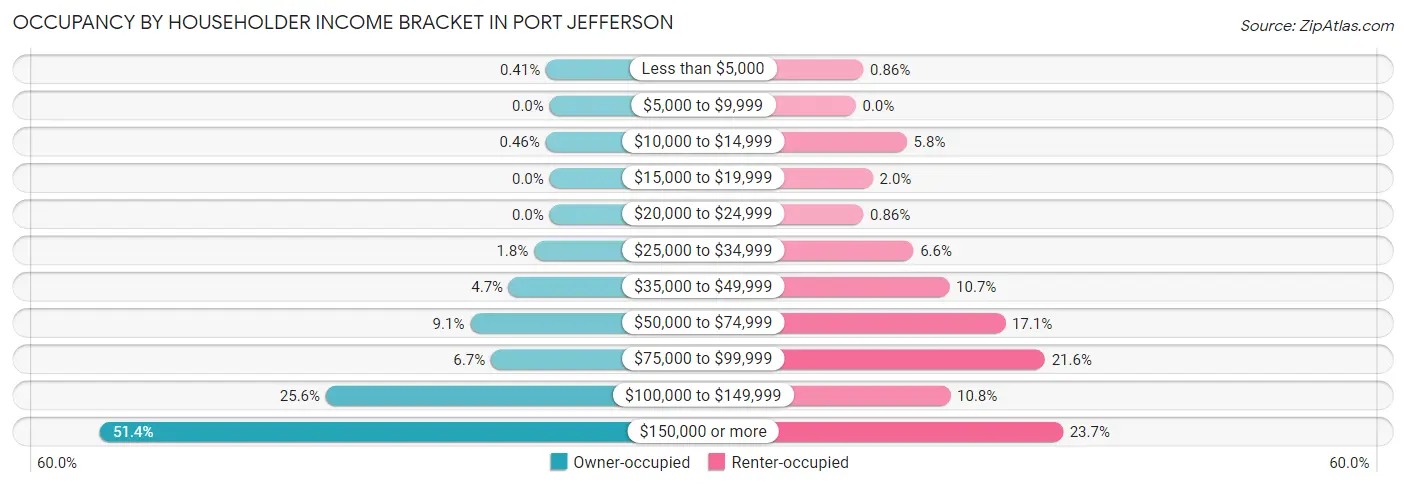
| Income Bracket | Owner-occupied | Renter-occupied |
| Less than $5,000 | 9 (0.4%) | 8 (0.9%) |
| $5,000 to $9,999 | 0 (0.0%) | 0 (0.0%) |
| $10,000 to $14,999 | 10 (0.5%) | 54 (5.8%) |
| $15,000 to $19,999 | 0 (0.0%) | 18 (1.9%) |
| $20,000 to $24,999 | 0 (0.0%) | 8 (0.9%) |
| $25,000 to $34,999 | 39 (1.8%) | 61 (6.6%) |
| $35,000 to $49,999 | 102 (4.6%) | 99 (10.7%) |
| $50,000 to $74,999 | 199 (9.1%) | 158 (17.1%) |
| $75,000 to $99,999 | 147 (6.7%) | 200 (21.6%) |
| $100,000 to $149,999 | 561 (25.6%) | 100 (10.8%) |
| $150,000 or more | 1,127 (51.4%) | 219 (23.7%) |
| Total | 2,194 (100.0%) | 925 (100.0%) |
Monthly Housing Cost Tiers in Port Jefferson
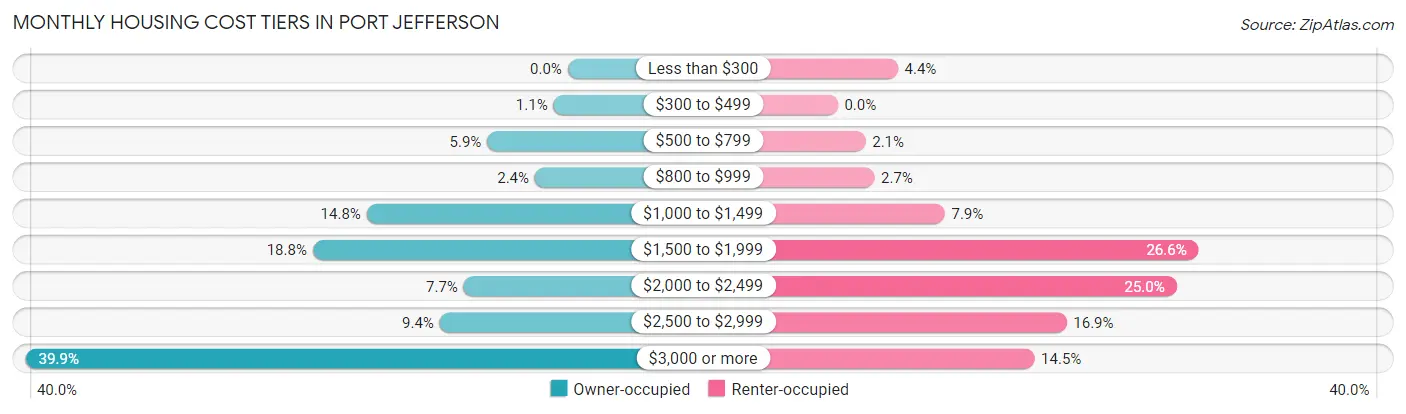
| Monthly Cost | Owner-occupied | Renter-occupied |
| Less than $300 | 0 (0.0%) | 41 (4.4%) |
| $300 to $499 | 23 (1.1%) | 0 (0.0%) |
| $500 to $799 | 130 (5.9%) | 19 (2.1%) |
| $800 to $999 | 53 (2.4%) | 25 (2.7%) |
| $1,000 to $1,499 | 325 (14.8%) | 73 (7.9%) |
| $1,500 to $1,999 | 412 (18.8%) | 246 (26.6%) |
| $2,000 to $2,499 | 168 (7.7%) | 231 (25.0%) |
| $2,500 to $2,999 | 207 (9.4%) | 156 (16.9%) |
| $3,000 or more | 876 (39.9%) | 134 (14.5%) |
| Total | 2,194 (100.0%) | 925 (100.0%) |
Physical Housing Characteristics in Port Jefferson
Housing Structures in Port Jefferson
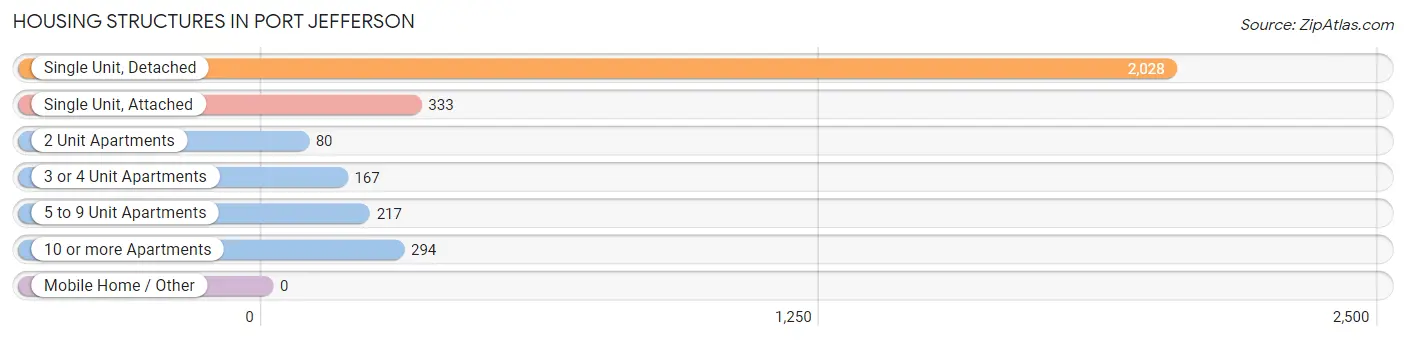
| Structure Type | # Housing Units | % Housing Units |
| Single Unit, Detached | 2,028 | 65.0% |
| Single Unit, Attached | 333 | 10.7% |
| 2 Unit Apartments | 80 | 2.6% |
| 3 or 4 Unit Apartments | 167 | 5.3% |
| 5 to 9 Unit Apartments | 217 | 7.0% |
| 10 or more Apartments | 294 | 9.4% |
| Mobile Home / Other | 0 | 0.0% |
| Total | 3,119 | 100.0% |
Housing Structures by Occupancy in Port Jefferson
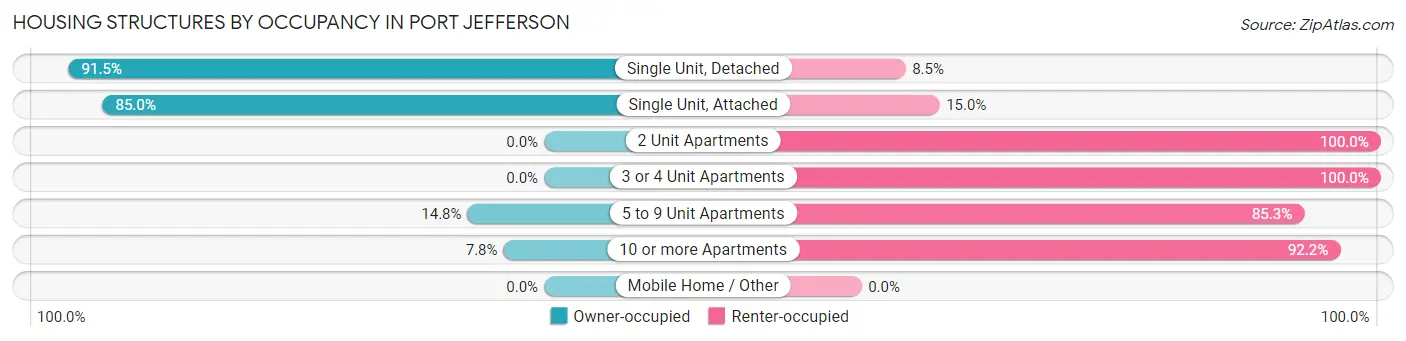
| Structure Type | Owner-occupied | Renter-occupied |
| Single Unit, Detached | 1,856 (91.5%) | 172 (8.5%) |
| Single Unit, Attached | 283 (85.0%) | 50 (15.0%) |
| 2 Unit Apartments | 0 (0.0%) | 80 (100.0%) |
| 3 or 4 Unit Apartments | 0 (0.0%) | 167 (100.0%) |
| 5 to 9 Unit Apartments | 32 (14.7%) | 185 (85.3%) |
| 10 or more Apartments | 23 (7.8%) | 271 (92.2%) |
| Mobile Home / Other | 0 (0.0%) | 0 (0.0%) |
| Total | 2,194 (70.3%) | 925 (29.7%) |
Housing Structures by Number of Rooms in Port Jefferson
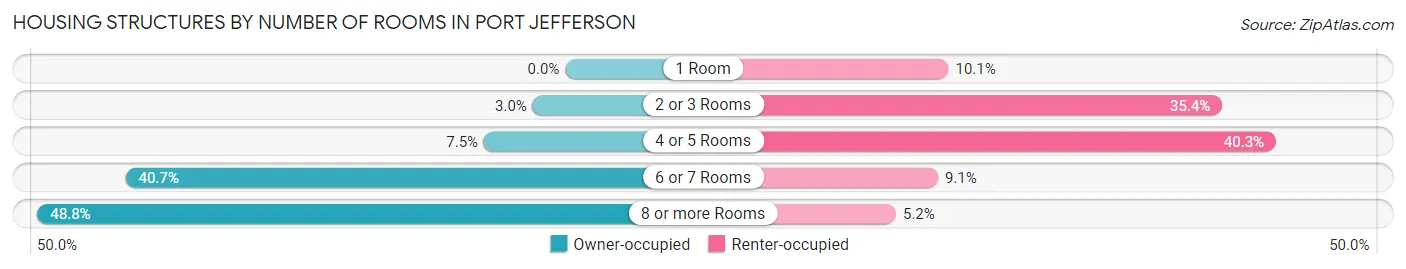
| Number of Rooms | Owner-occupied | Renter-occupied |
| 1 Room | 0 (0.0%) | 93 (10.1%) |
| 2 or 3 Rooms | 66 (3.0%) | 327 (35.3%) |
| 4 or 5 Rooms | 165 (7.5%) | 373 (40.3%) |
| 6 or 7 Rooms | 892 (40.7%) | 84 (9.1%) |
| 8 or more Rooms | 1,071 (48.8%) | 48 (5.2%) |
| Total | 2,194 (100.0%) | 925 (100.0%) |
Housing Structure by Heating Type in Port Jefferson
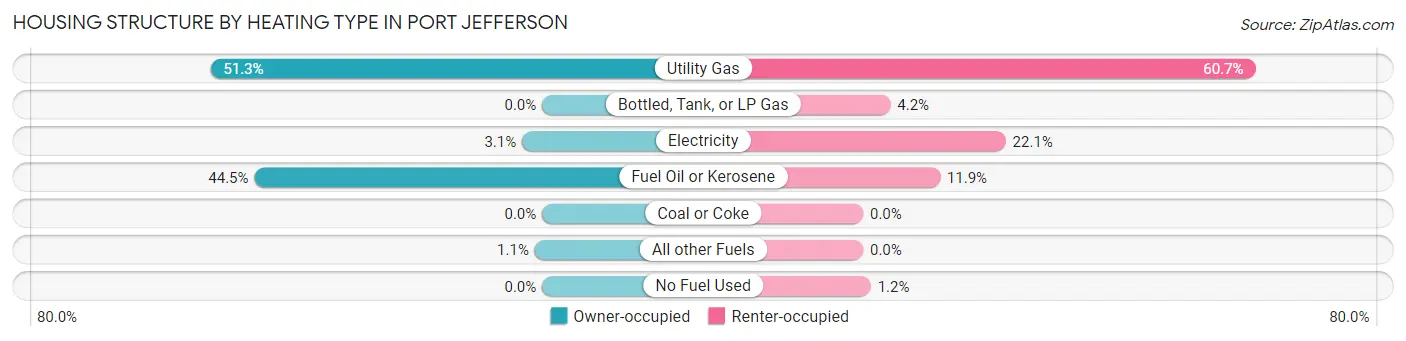
| Heating Type | Owner-occupied | Renter-occupied |
| Utility Gas | 1,125 (51.3%) | 561 (60.7%) |
| Bottled, Tank, or LP Gas | 0 (0.0%) | 39 (4.2%) |
| Electricity | 68 (3.1%) | 204 (22.1%) |
| Fuel Oil or Kerosene | 976 (44.5%) | 110 (11.9%) |
| Coal or Coke | 0 (0.0%) | 0 (0.0%) |
| All other Fuels | 25 (1.1%) | 0 (0.0%) |
| No Fuel Used | 0 (0.0%) | 11 (1.2%) |
| Total | 2,194 (100.0%) | 925 (100.0%) |
Household Vehicle Usage in Port Jefferson
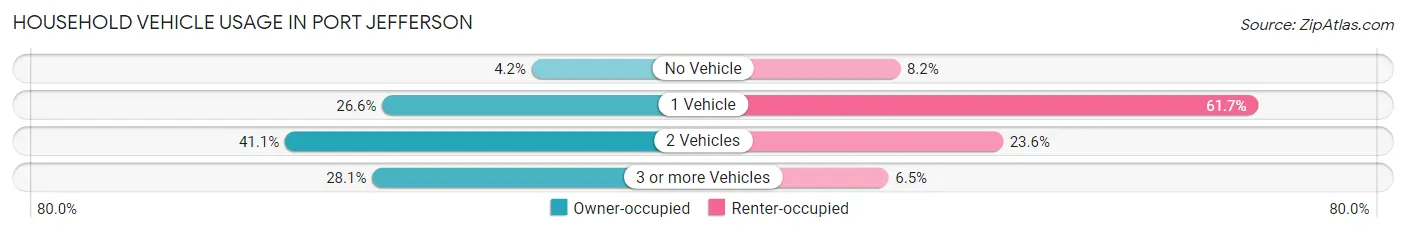
| Vehicles per Household | Owner-occupied | Renter-occupied |
| No Vehicle | 93 (4.2%) | 76 (8.2%) |
| 1 Vehicle | 583 (26.6%) | 571 (61.7%) |
| 2 Vehicles | 902 (41.1%) | 218 (23.6%) |
| 3 or more Vehicles | 616 (28.1%) | 60 (6.5%) |
| Total | 2,194 (100.0%) | 925 (100.0%) |
Real Estate & Mortgages in Port Jefferson
Real Estate and Mortgage Overview in Port Jefferson
| Characteristic | Without Mortgage | With Mortgage |
| Housing Units | 975 | 1,219 |
| Median Property Value | $539,600 | $665,500 |
| Median Household Income | $132,696 | $767 |
| Monthly Housing Costs | $1,401 | $876 |
| Real Estate Taxes | $10,001 | $0 |
Property Value by Mortgage Status in Port Jefferson
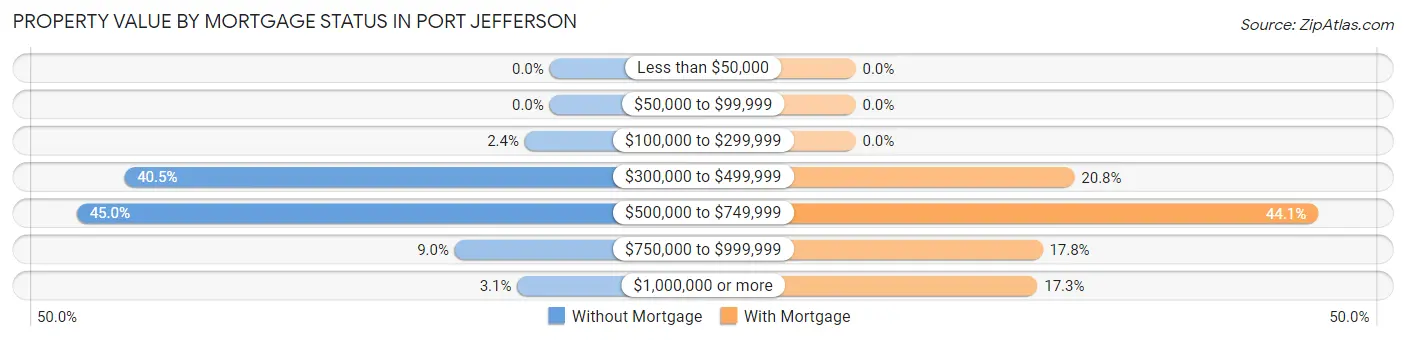
| Property Value | Without Mortgage | With Mortgage |
| Less than $50,000 | 0 (0.0%) | 0 (0.0%) |
| $50,000 to $99,999 | 0 (0.0%) | 0 (0.0%) |
| $100,000 to $299,999 | 23 (2.4%) | 0 (0.0%) |
| $300,000 to $499,999 | 395 (40.5%) | 254 (20.8%) |
| $500,000 to $749,999 | 439 (45.0%) | 537 (44.1%) |
| $750,000 to $999,999 | 88 (9.0%) | 217 (17.8%) |
| $1,000,000 or more | 30 (3.1%) | 211 (17.3%) |
| Total | 975 (100.0%) | 1,219 (100.0%) |
Household Income by Mortgage Status in Port Jefferson
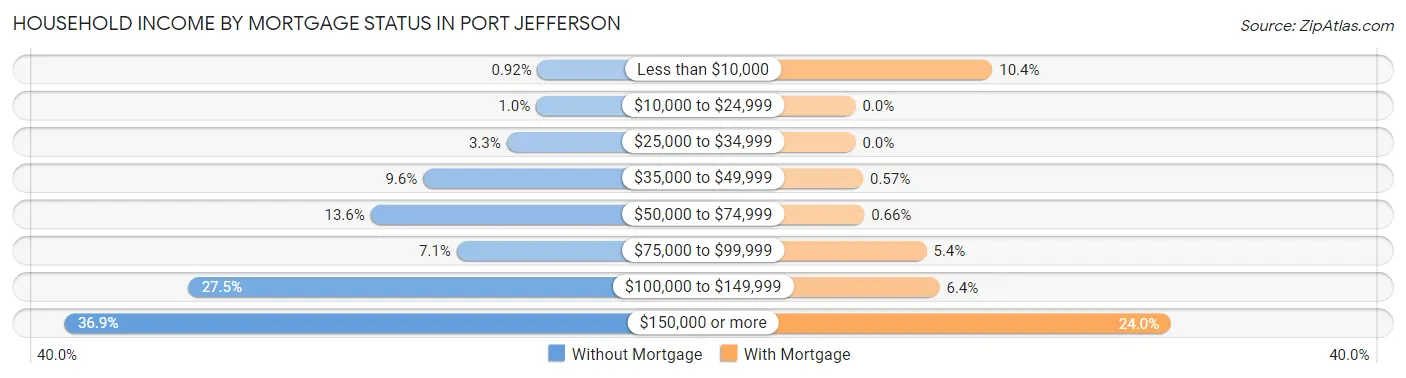
| Household Income | Without Mortgage | With Mortgage |
| Less than $10,000 | 9 (0.9%) | 127 (10.4%) |
| $10,000 to $24,999 | 10 (1.0%) | 0 (0.0%) |
| $25,000 to $34,999 | 32 (3.3%) | 0 (0.0%) |
| $35,000 to $49,999 | 94 (9.6%) | 7 (0.6%) |
| $50,000 to $74,999 | 133 (13.6%) | 8 (0.7%) |
| $75,000 to $99,999 | 69 (7.1%) | 66 (5.4%) |
| $100,000 to $149,999 | 268 (27.5%) | 78 (6.4%) |
| $150,000 or more | 360 (36.9%) | 293 (24.0%) |
| Total | 975 (100.0%) | 1,219 (100.0%) |
Property Value to Household Income Ratio in Port Jefferson
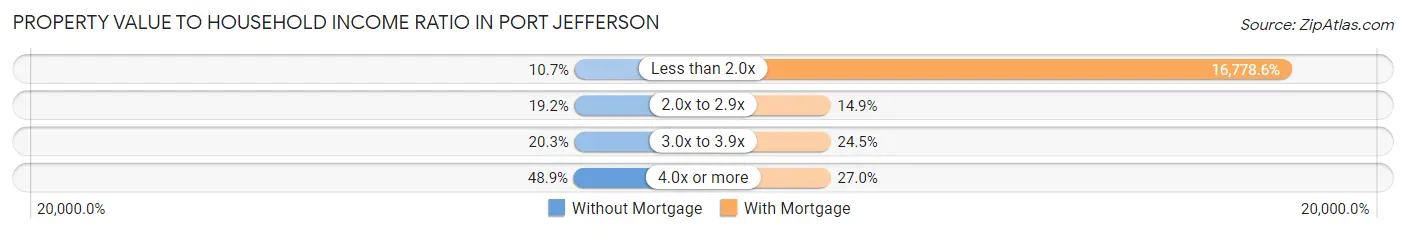
| Value-to-Income Ratio | Without Mortgage | With Mortgage |
| Less than 2.0x | 104 (10.7%) | 204,531 (16,778.6%) |
| 2.0x to 2.9x | 187 (19.2%) | 182 (14.9%) |
| 3.0x to 3.9x | 198 (20.3%) | 299 (24.5%) |
| 4.0x or more | 477 (48.9%) | 329 (27.0%) |
| Total | 975 (100.0%) | 1,219 (100.0%) |
Real Estate Taxes by Mortgage Status in Port Jefferson
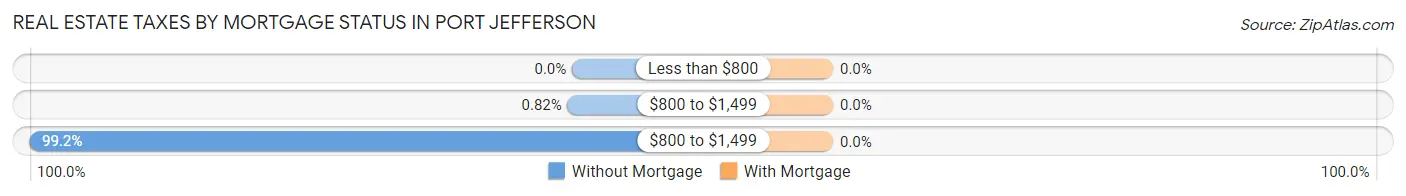
| Property Taxes | Without Mortgage | With Mortgage |
| Less than $800 | 0 (0.0%) | 0 (0.0%) |
| $800 to $1,499 | 8 (0.8%) | 0 (0.0%) |
| $800 to $1,499 | 967 (99.2%) | 0 (0.0%) |
| Total | 975 (100.0%) | 1,219 (100.0%) |
Health & Disability in Port Jefferson
Health Insurance Coverage by Age in Port Jefferson
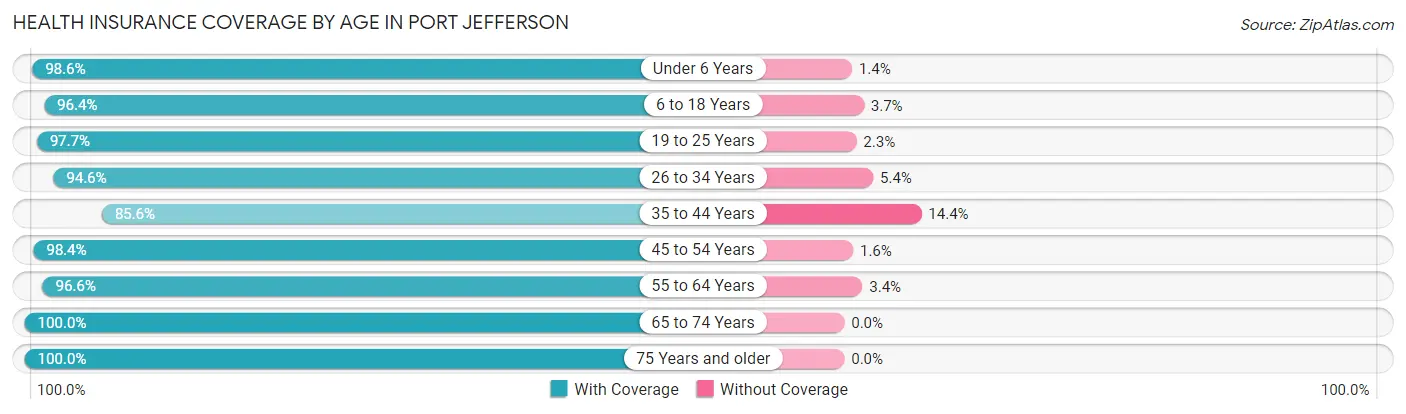
| Age Bracket | With Coverage | Without Coverage |
| Under 6 Years | 415 (98.6%) | 6 (1.4%) |
| 6 to 18 Years | 1,135 (96.4%) | 43 (3.6%) |
| 19 to 25 Years | 605 (97.7%) | 14 (2.3%) |
| 26 to 34 Years | 828 (94.6%) | 47 (5.4%) |
| 35 to 44 Years | 667 (85.6%) | 112 (14.4%) |
| 45 to 54 Years | 1,084 (98.4%) | 18 (1.6%) |
| 55 to 64 Years | 1,035 (96.6%) | 36 (3.4%) |
| 65 to 74 Years | 1,060 (100.0%) | 0 (0.0%) |
| 75 Years and older | 708 (100.0%) | 0 (0.0%) |
| Total | 7,537 (96.5%) | 276 (3.5%) |
Health Insurance Coverage by Citizenship Status in Port Jefferson
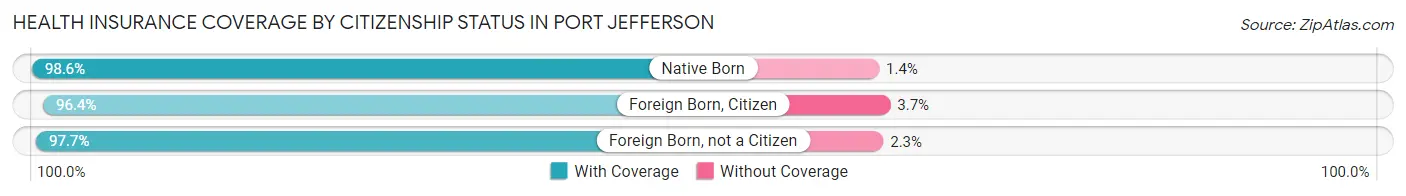
| Citizenship Status | With Coverage | Without Coverage |
| Native Born | 415 (98.6%) | 6 (1.4%) |
| Foreign Born, Citizen | 1,135 (96.4%) | 43 (3.6%) |
| Foreign Born, not a Citizen | 605 (97.7%) | 14 (2.3%) |
Health Insurance Coverage by Household Income in Port Jefferson
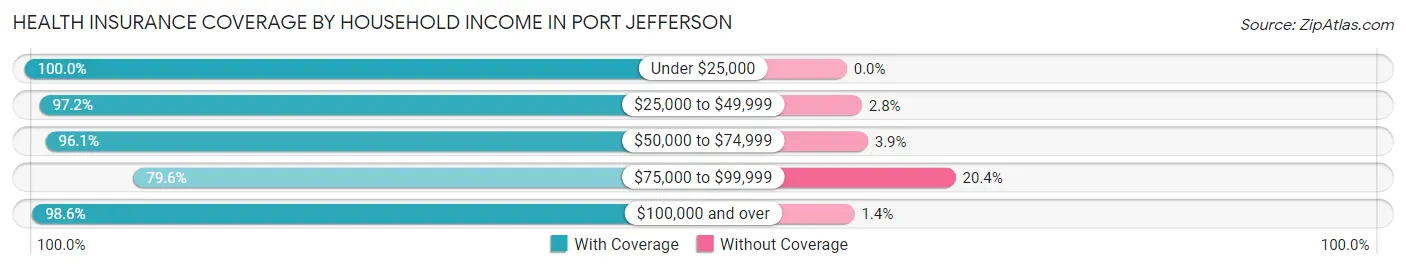
| Household Income | With Coverage | Without Coverage |
| Under $25,000 | 179 (100.0%) | 0 (0.0%) |
| $25,000 to $49,999 | 379 (97.2%) | 11 (2.8%) |
| $50,000 to $74,999 | 465 (96.1%) | 19 (3.9%) |
| $75,000 to $99,999 | 633 (79.6%) | 162 (20.4%) |
| $100,000 and over | 5,760 (98.6%) | 84 (1.4%) |
Public vs Private Health Insurance Coverage by Age in Port Jefferson
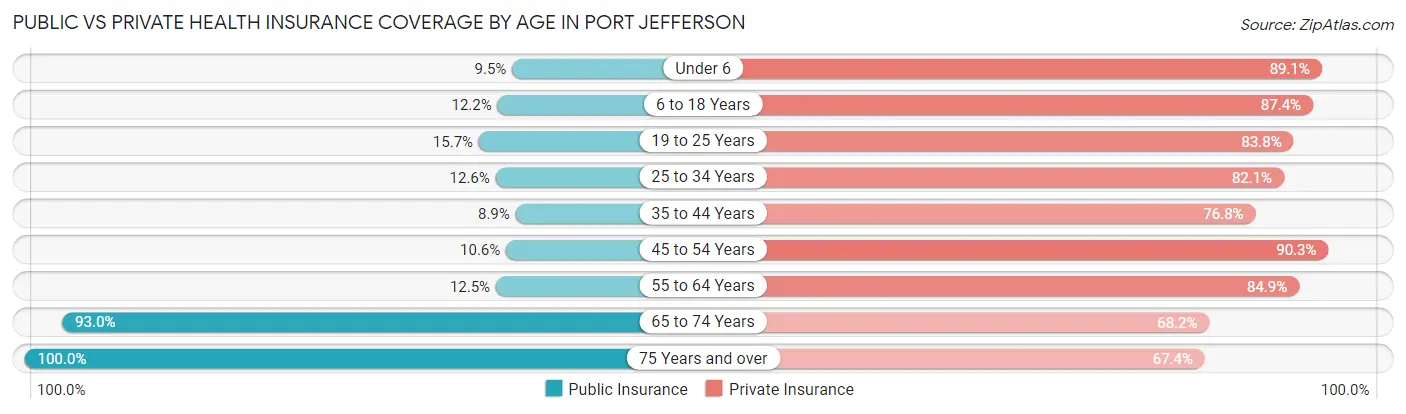
| Age Bracket | Public Insurance | Private Insurance |
| Under 6 | 40 (9.5%) | 375 (89.1%) |
| 6 to 18 Years | 144 (12.2%) | 1,030 (87.4%) |
| 19 to 25 Years | 97 (15.7%) | 519 (83.8%) |
| 25 to 34 Years | 110 (12.6%) | 718 (82.1%) |
| 35 to 44 Years | 69 (8.9%) | 598 (76.8%) |
| 45 to 54 Years | 117 (10.6%) | 995 (90.3%) |
| 55 to 64 Years | 134 (12.5%) | 909 (84.9%) |
| 65 to 74 Years | 986 (93.0%) | 723 (68.2%) |
| 75 Years and over | 708 (100.0%) | 477 (67.4%) |
| Total | 2,405 (30.8%) | 6,344 (81.2%) |
Disability Status by Sex by Age in Port Jefferson
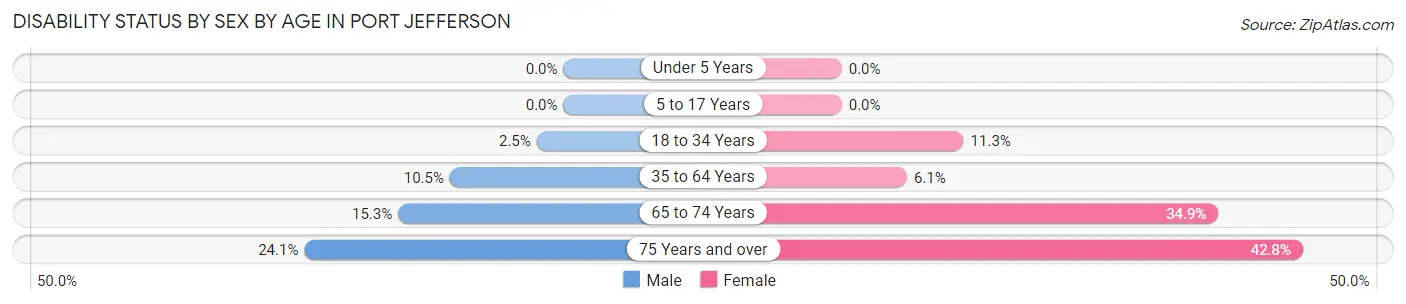
| Age Bracket | Male | Female |
| Under 5 Years | 0 (0.0%) | 0 (0.0%) |
| 5 to 17 Years | 0 (0.0%) | 0 (0.0%) |
| 18 to 34 Years | 23 (2.5%) | 76 (11.3%) |
| 35 to 64 Years | 151 (10.5%) | 92 (6.0%) |
| 65 to 74 Years | 73 (15.3%) | 204 (34.9%) |
| 75 Years and over | 82 (24.0%) | 157 (42.8%) |
Disability Class by Sex by Age in Port Jefferson
Disability Class: Hearing Difficulty
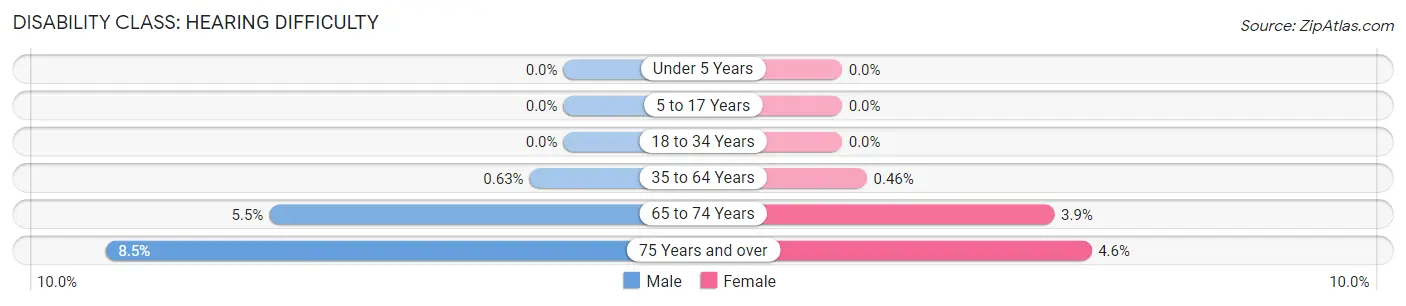
| Age Bracket | Male | Female |
| Under 5 Years | 0 (0.0%) | 0 (0.0%) |
| 5 to 17 Years | 0 (0.0%) | 0 (0.0%) |
| 18 to 34 Years | 0 (0.0%) | 0 (0.0%) |
| 35 to 64 Years | 9 (0.6%) | 7 (0.5%) |
| 65 to 74 Years | 26 (5.5%) | 23 (3.9%) |
| 75 Years and over | 29 (8.5%) | 17 (4.6%) |
Disability Class: Vision Difficulty
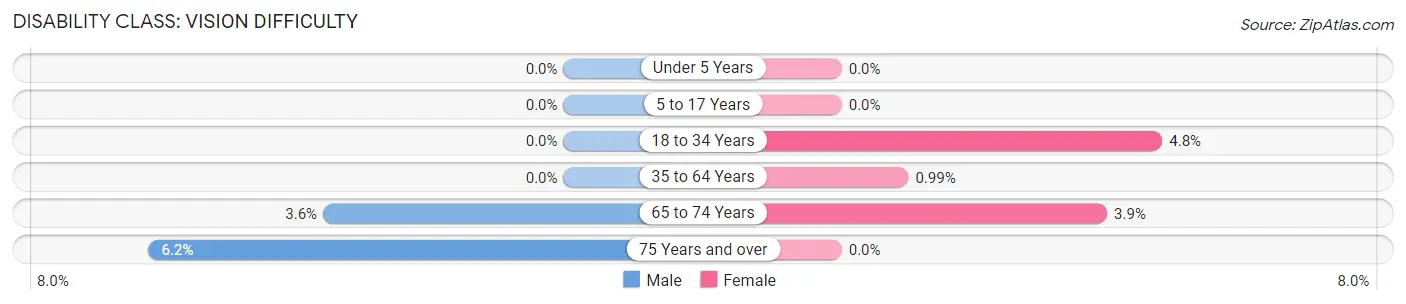
| Age Bracket | Male | Female |
| Under 5 Years | 0 (0.0%) | 0 (0.0%) |
| 5 to 17 Years | 0 (0.0%) | 0 (0.0%) |
| 18 to 34 Years | 0 (0.0%) | 32 (4.8%) |
| 35 to 64 Years | 0 (0.0%) | 15 (1.0%) |
| 65 to 74 Years | 17 (3.6%) | 23 (3.9%) |
| 75 Years and over | 21 (6.2%) | 0 (0.0%) |
Disability Class: Cognitive Difficulty
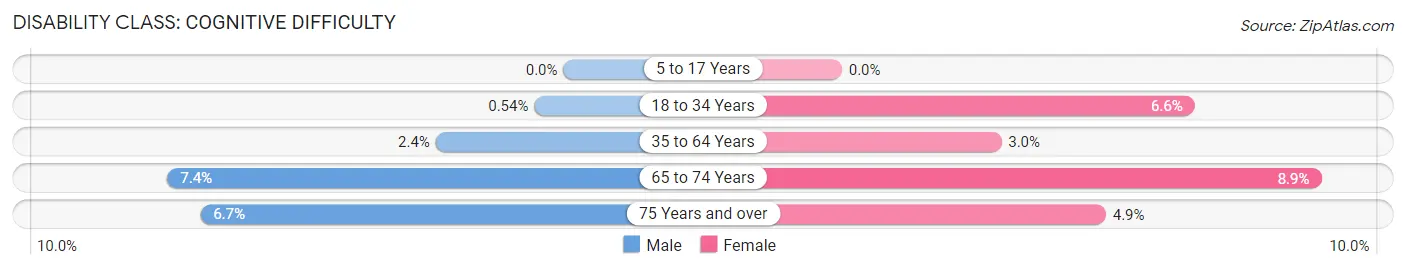
| Age Bracket | Male | Female |
| 5 to 17 Years | 0 (0.0%) | 0 (0.0%) |
| 18 to 34 Years | 5 (0.5%) | 44 (6.6%) |
| 35 to 64 Years | 34 (2.4%) | 45 (3.0%) |
| 65 to 74 Years | 35 (7.3%) | 52 (8.9%) |
| 75 Years and over | 23 (6.7%) | 18 (4.9%) |
Disability Class: Ambulatory Difficulty
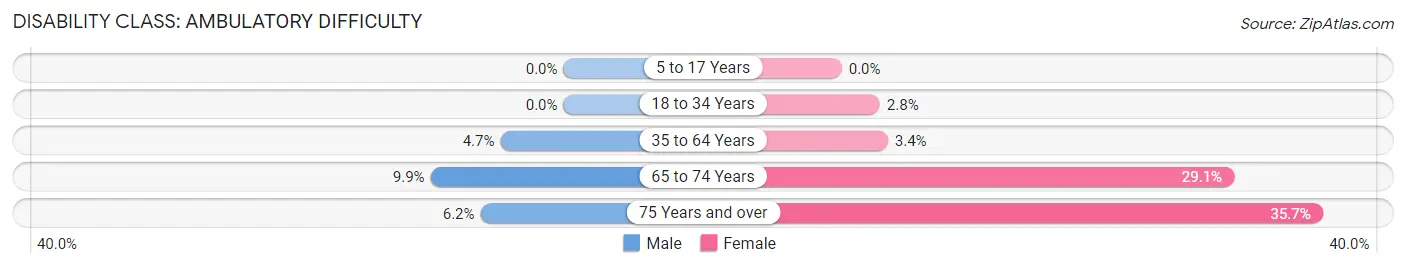
| Age Bracket | Male | Female |
| 5 to 17 Years | 0 (0.0%) | 0 (0.0%) |
| 18 to 34 Years | 0 (0.0%) | 19 (2.8%) |
| 35 to 64 Years | 67 (4.7%) | 52 (3.4%) |
| 65 to 74 Years | 47 (9.9%) | 170 (29.1%) |
| 75 Years and over | 21 (6.2%) | 131 (35.7%) |
Disability Class: Self-Care Difficulty
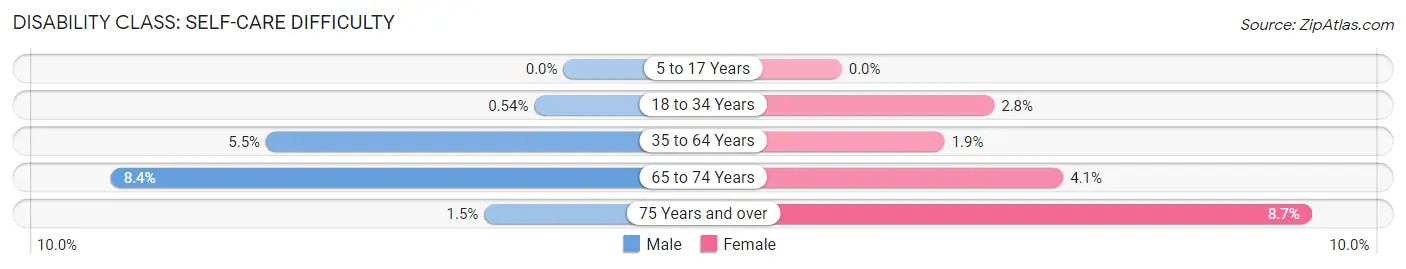
| Age Bracket | Male | Female |
| 5 to 17 Years | 0 (0.0%) | 0 (0.0%) |
| 18 to 34 Years | 5 (0.5%) | 19 (2.8%) |
| 35 to 64 Years | 79 (5.5%) | 29 (1.9%) |
| 65 to 74 Years | 40 (8.4%) | 24 (4.1%) |
| 75 Years and over | 5 (1.5%) | 32 (8.7%) |
Technology Access in Port Jefferson
Computing Device Access in Port Jefferson
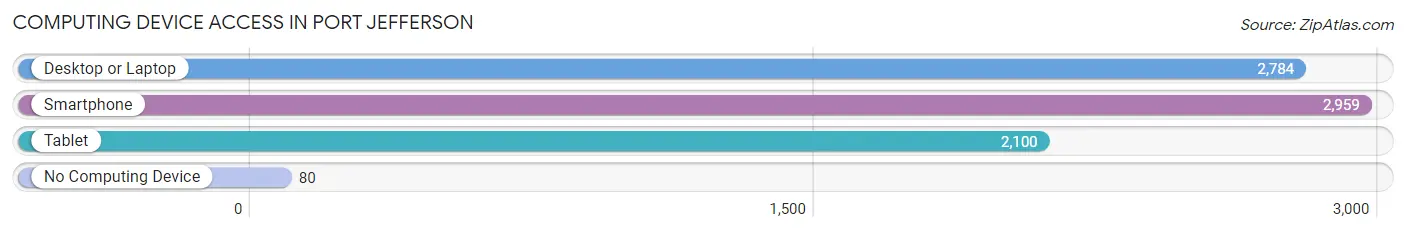
| Device Type | # Households | % Households |
| Desktop or Laptop | 2,784 | 89.3% |
| Smartphone | 2,959 | 94.9% |
| Tablet | 2,100 | 67.3% |
| No Computing Device | 80 | 2.6% |
| Total | 3,119 | 100.0% |
Internet Access in Port Jefferson
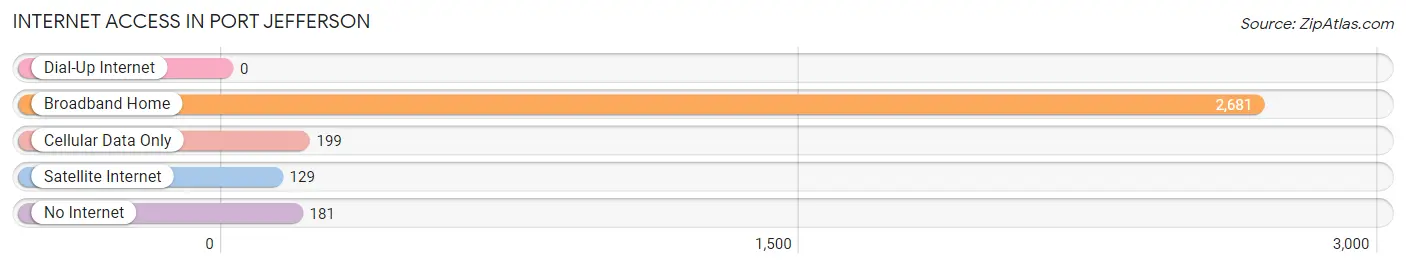
| Internet Type | # Households | % Households |
| Dial-Up Internet | 0 | 0.0% |
| Broadband Home | 2,681 | 86.0% |
| Cellular Data Only | 199 | 6.4% |
| Satellite Internet | 129 | 4.1% |
| No Internet | 181 | 5.8% |
| Total | 3,119 | 100.0% |
Port Jefferson Summary
Introduction
Port Jefferson is a village located in Suffolk County, New York, United States. It is situated on the North Shore of Long Island, approximately 60 miles east of Manhattan. The village is part of the Town of Brookhaven and is located on the Long Island Sound. The population of Port Jefferson was 7,750 as of the 2010 census.
History
The area that is now Port Jefferson was originally inhabited by the Setauket tribe of Native Americans. The first European settlers arrived in the area in the late 1600s. The village was originally known as “Drowned Meadow” due to the marshy land that surrounded it. In 1797, the village was renamed “Port Jefferson” after Thomas Jefferson, the third President of the United States.
In the early 1800s, the village became a popular port for ships carrying goods from New York City to the rest of Long Island. The village was also a popular destination for wealthy New Yorkers who wanted to escape the hustle and bustle of the city. In 1836, the village was incorporated as a village.
In the late 1800s, the village experienced a period of growth and prosperity. The village was home to several factories, including a paper mill, a brickyard, and a shipbuilding yard. The village also had a thriving fishing industry.
In the early 1900s, the village experienced a period of decline. The factories closed and the fishing industry declined. The village was also hit hard by the Great Depression.
In the late 1900s, the village experienced a period of revitalization. The village was home to several new businesses, including restaurants, shops, and art galleries. The village also became a popular tourist destination.
Geography
Port Jefferson is located on the North Shore of Long Island, approximately 60 miles east of Manhattan. The village is part of the Town of Brookhaven and is located on the Long Island Sound. The village is bordered by the villages of Belle Terre to the east, Mount Sinai to the west, and Setauket to the south.
The village has a total area of 2.2 square miles, all of which is land. The village is located on a peninsula, with the Long Island Sound to the north and the Port Jefferson Harbor to the south. The village is home to several parks, including Harborfront Park, which offers views of the harbor and the Long Island Sound.
Economy
Port Jefferson’s economy is largely based on tourism and retail. The village is home to several restaurants, shops, and art galleries. The village is also home to several marinas, which offer boat rentals and fishing charters.
The village is also home to several manufacturing companies, including a paper mill, a brickyard, and a shipbuilding yard. The village is also home to several medical facilities, including St. Charles Hospital and Mather Hospital.
Demographics
As of the 2010 census, the population of Port Jefferson was 7,750. The population is largely white (90.2%), with small percentages of African Americans (3.2%), Asians (2.7%), and Hispanics (2.2%). The median household income is $77,813, and the median home value is $521,400.
Conclusion
Port Jefferson is a village located in Suffolk County, New York, United States. It is situated on the North Shore of Long Island, approximately 60 miles east of Manhattan. The village is part of the Town of Brookhaven and is located on the Long Island Sound. The population of Port Jefferson was 7,750 as of the 2010 census. The village has a long history, and its economy is largely based on tourism and retail. The population is largely white, with small percentages of African Americans, Asians, and Hispanics. The median household income is $77,813, and the median home value is $521,400.
Common Questions
What is the Total Population of Port Jefferson?
Total Population of Port Jefferson is 7,990.
What is the Total Male Population of Port Jefferson?
Total Male Population of Port Jefferson is 4,013.
What is the Total Female Population of Port Jefferson?
Total Female Population of Port Jefferson is 3,977.
What is the Ratio of Males per 100 Females in Port Jefferson?
There are 100.91 Males per 100 Females in Port Jefferson.
What is the Ratio of Females per 100 Males in Port Jefferson?
There are 99.10 Females per 100 Males in Port Jefferson.
What is the Median Population Age in Port Jefferson?
Median Population Age in Port Jefferson is 45.1 Years.
What is the Average Family Size in Port Jefferson
Average Family Size in Port Jefferson is 3.2 People.
What is the Average Household Size in Port Jefferson
Average Household Size in Port Jefferson is 2.5 People.
What is Per Capita Income in Port Jefferson?
Per Capita income in Port Jefferson is $68,127.
What is the Median Family Income in Port Jefferson?
Median Family Income in Port Jefferson is $181,715.
What is the Median Household income in Port Jefferson?
Median Household Income in Port Jefferson is $134,230.
What is Income or Wage Gap in Port Jefferson?
Income or Wage Gap in Port Jefferson is 30.8%.
Women in Port Jefferson earn 69.2 cents for every dollar earned by a man.
What is Inequality or Gini Index in Port Jefferson?
Inequality or Gini Index in Port Jefferson is 0.41.
How Large is the Labor Force in Port Jefferson?
There are 4,280 People in the Labor Forcein in Port Jefferson.
What is the Percentage of People in the Labor Force in Port Jefferson?
64.6% of People are in the Labor Force in Port Jefferson.
What is the Unemployment Rate in Port Jefferson?
Unemployment Rate in Port Jefferson is 2.9%.