Otisville, NY
Otisville Map
Otisville Overview
1,431
TOTAL POPULATION
701
MALE POPULATION
730
FEMALE POPULATION
96.03
MALES / 100 FEMALES
104.14
FEMALES / 100 MALES
35.5
MEDIAN AGE
3.4
AVG FAMILY SIZE
2.9
AVG HOUSEHOLD SIZE
$36,006
PER CAPITA INCOME
$93,750
AVG FAMILY INCOME
$79,615
AVG HOUSEHOLD INCOME
23.9%
WAGE / INCOME GAP [ % ]
76.1¢/ $1
WAGE / INCOME GAP [ $ ]
0.40
INEQUALITY / GINI INDEX
572
LABOR FORCE [ PEOPLE ]
53.7%
PERCENT IN LABOR FORCE
2.4%
UNEMPLOYMENT RATE
Otisville Zip Codes
Otisville Area Codes
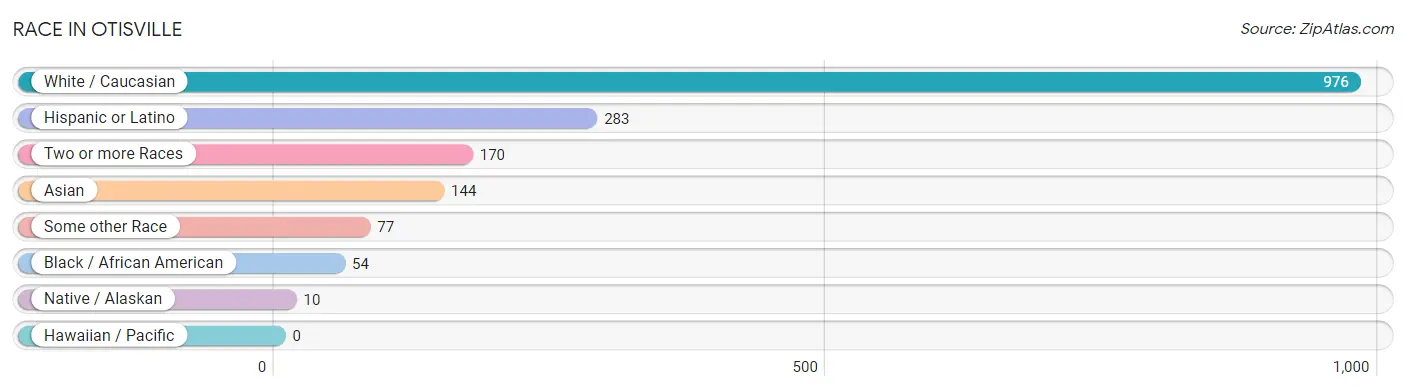
Race in Otisville
The most populous races in Otisville are White / Caucasian (976 | 68.2%), Hispanic or Latino (283 | 19.8%), and Two or more Races (170 | 11.9%).
| Race | # Population | % Population |
| Asian | 144 | 10.1% |
| Black / African American | 54 | 3.8% |
| Hawaiian / Pacific | 0 | 0.0% |
| Hispanic or Latino | 283 | 19.8% |
| Native / Alaskan | 10 | 0.7% |
| White / Caucasian | 976 | 68.2% |
| Two or more Races | 170 | 11.9% |
| Some other Race | 77 | 5.4% |
| Total | 1,431 | 100.0% |
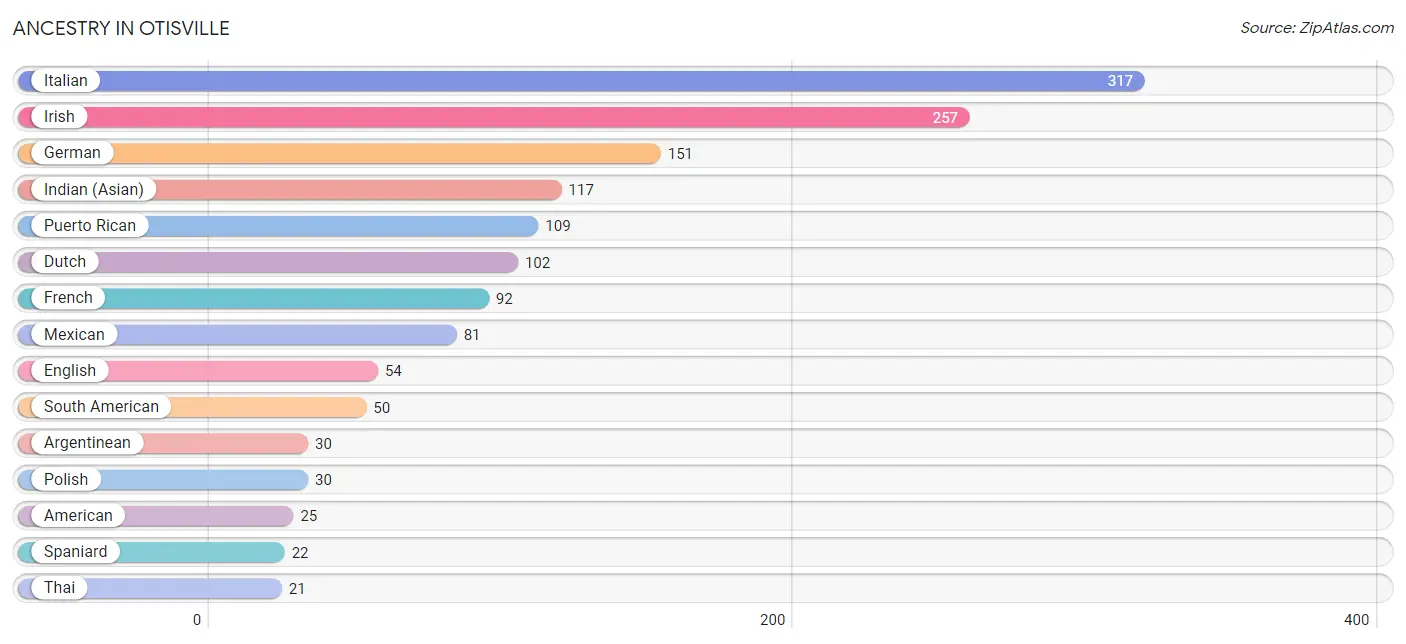
Ancestry in Otisville
The most populous ancestries reported in Otisville are Italian (317 | 22.2%), Irish (257 | 18.0%), German (151 | 10.5%), Indian (Asian) (117 | 8.2%), and Puerto Rican (109 | 7.6%), together accounting for 66.5% of all Otisville residents.
| Ancestry | # Population | % Population |
| American | 25 | 1.8% |
| Argentinean | 30 | 2.1% |
| Austrian | 3 | 0.2% |
| Canadian | 3 | 0.2% |
| Central American | 3 | 0.2% |
| Central American Indian | 17 | 1.2% |
| Colombian | 11 | 0.8% |
| Cuban | 4 | 0.3% |
| Czech | 3 | 0.2% |
| Czechoslovakian | 5 | 0.4% |
| Delaware | 12 | 0.8% |
| Dominican | 14 | 1.0% |
| Dutch | 102 | 7.1% |
| Eastern European | 7 | 0.5% |
| English | 54 | 3.8% |
| European | 5 | 0.4% |
| Finnish | 3 | 0.2% |
| French | 92 | 6.4% |
| French Canadian | 3 | 0.2% |
| German | 151 | 10.5% |
| Greek | 4 | 0.3% |
| Hungarian | 3 | 0.2% |
| Indian (Asian) | 117 | 8.2% |
| Irish | 257 | 18.0% |
| Italian | 317 | 22.2% |
| Jamaican | 5 | 0.4% |
| Korean | 3 | 0.2% |
| Mexican | 81 | 5.7% |
| Panamanian | 3 | 0.2% |
| Peruvian | 9 | 0.6% |
| Polish | 30 | 2.1% |
| Puerto Rican | 109 | 7.6% |
| Russian | 8 | 0.6% |
| Scotch-Irish | 6 | 0.4% |
| Scottish | 8 | 0.6% |
| South American | 50 | 3.5% |
| South American Indian | 4 | 0.3% |
| Spaniard | 22 | 1.5% |
| Sri Lankan | 3 | 0.2% |
| Swedish | 3 | 0.2% |
| Thai | 21 | 1.5% |
| Ukrainian | 10 | 0.7% | View All 42 Rows |
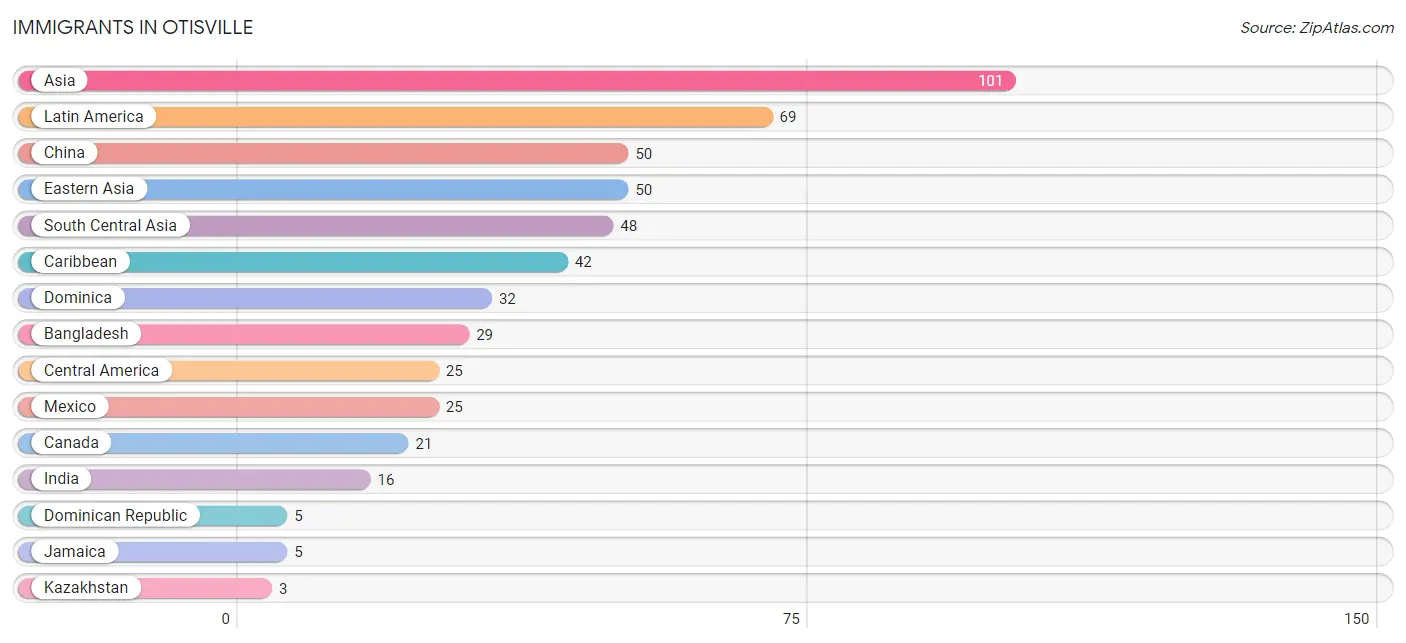
Immigrants in Otisville
The most numerous immigrant groups reported in Otisville came from Asia (101 | 7.1%), Latin America (69 | 4.8%), China (50 | 3.5%), Eastern Asia (50 | 3.5%), and South Central Asia (48 | 3.4%), together accounting for 22.2% of all Otisville residents.
| Immigration Origin | # Population | % Population |
| Asia | 101 | 7.1% |
| Bangladesh | 29 | 2.0% |
| Canada | 21 | 1.5% |
| Caribbean | 42 | 2.9% |
| Central America | 25 | 1.8% |
| China | 50 | 3.5% |
| Dominica | 32 | 2.2% |
| Dominican Republic | 5 | 0.4% |
| Eastern Asia | 50 | 3.5% |
| Eastern Europe | 2 | 0.1% |
| Europe | 2 | 0.1% |
| India | 16 | 1.1% |
| Jamaica | 5 | 0.4% |
| Kazakhstan | 3 | 0.2% |
| Latin America | 69 | 4.8% |
| Mexico | 25 | 1.8% |
| Peru | 2 | 0.1% |
| South America | 2 | 0.1% |
| South Central Asia | 48 | 3.4% |
| South Eastern Asia | 3 | 0.2% |
| Ukraine | 2 | 0.1% |
| Vietnam | 3 | 0.2% | View All 22 Rows |
Sex and Age in Otisville
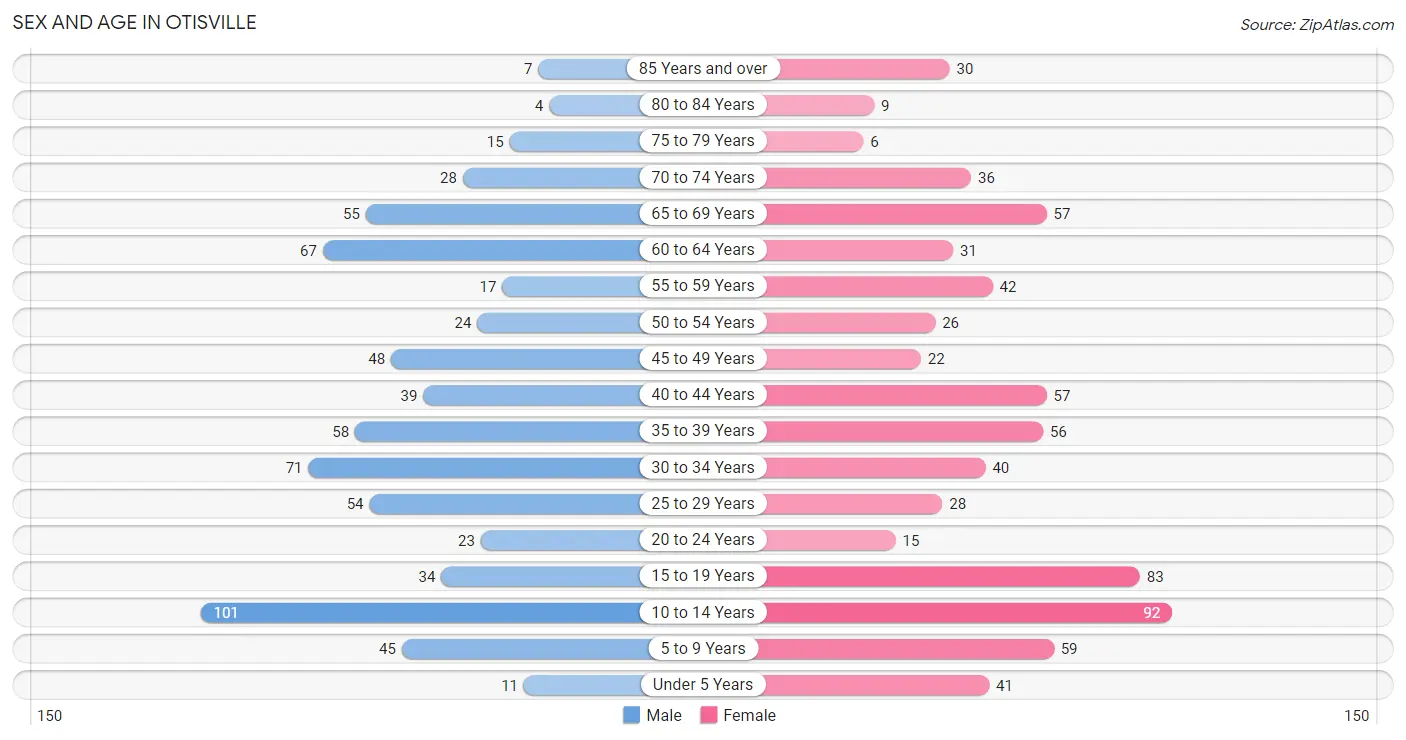
Sex and Age in Otisville
The most populous age groups in Otisville are 10 to 14 Years (101 | 14.4%) for men and 10 to 14 Years (92 | 12.6%) for women.
| Age Bracket | Male | Female |
| Under 5 Years | 11 (1.6%) | 41 (5.6%) |
| 5 to 9 Years | 45 (6.4%) | 59 (8.1%) |
| 10 to 14 Years | 101 (14.4%) | 92 (12.6%) |
| 15 to 19 Years | 34 (4.9%) | 83 (11.4%) |
| 20 to 24 Years | 23 (3.3%) | 15 (2.1%) |
| 25 to 29 Years | 54 (7.7%) | 28 (3.8%) |
| 30 to 34 Years | 71 (10.1%) | 40 (5.5%) |
| 35 to 39 Years | 58 (8.3%) | 56 (7.7%) |
| 40 to 44 Years | 39 (5.6%) | 57 (7.8%) |
| 45 to 49 Years | 48 (6.9%) | 22 (3.0%) |
| 50 to 54 Years | 24 (3.4%) | 26 (3.6%) |
| 55 to 59 Years | 17 (2.4%) | 42 (5.8%) |
| 60 to 64 Years | 67 (9.6%) | 31 (4.3%) |
| 65 to 69 Years | 55 (7.9%) | 57 (7.8%) |
| 70 to 74 Years | 28 (4.0%) | 36 (4.9%) |
| 75 to 79 Years | 15 (2.1%) | 6 (0.8%) |
| 80 to 84 Years | 4 (0.6%) | 9 (1.2%) |
| 85 Years and over | 7 (1.0%) | 30 (4.1%) |
| Total | 701 (100.0%) | 730 (100.0%) |
Families and Households in Otisville
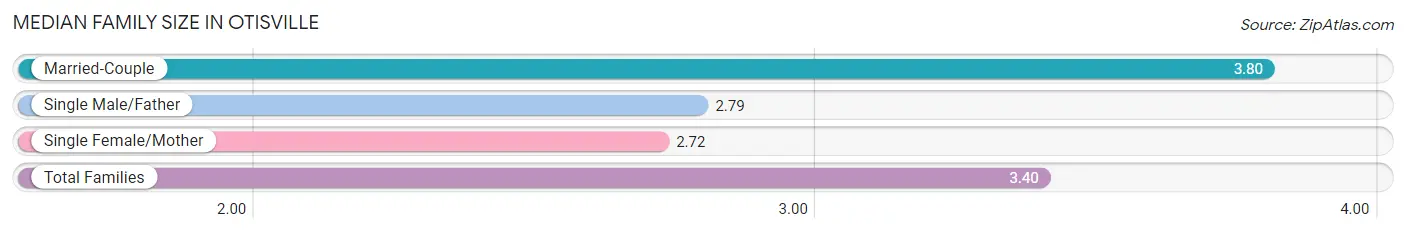
Median Family Size in Otisville
The median family size in Otisville is 3.40 persons per family, with married-couple families (242 | 62.2%) accounting for the largest median family size of 3.8 persons per family. On the other hand, single female/mother families (99 | 25.5%) represent the smallest median family size with 2.72 persons per family.
| Family Type | # Families | Family Size |
| Married-Couple | 242 (62.2%) | 3.80 |
| Single Male/Father | 48 (12.3%) | 2.79 |
| Single Female/Mother | 99 (25.5%) | 2.72 |
| Total Families | 389 (100.0%) | 3.40 |
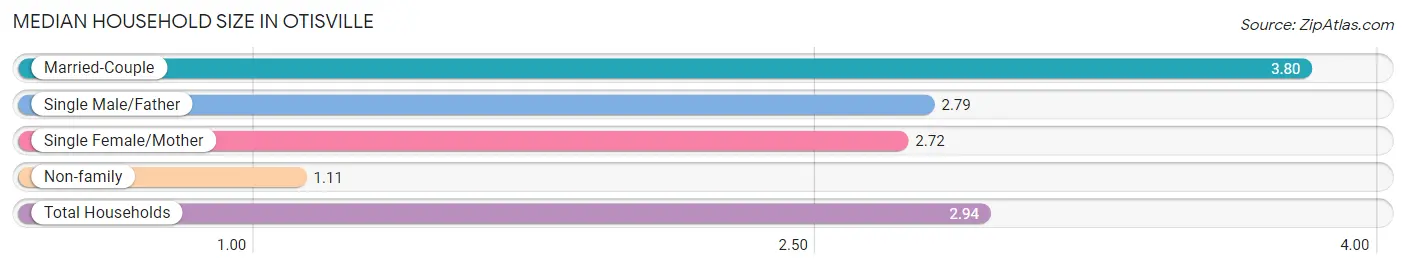
Median Household Size in Otisville
The median household size in Otisville is 2.94 persons per household, with married-couple households (242 | 49.8%) accounting for the largest median household size of 3.8 persons per household. non-family households (97 | 20.0%) represent the smallest median household size with 1.11 persons per household.
| Household Type | # Households | Household Size |
| Married-Couple | 242 (49.8%) | 3.80 |
| Single Male/Father | 48 (9.9%) | 2.79 |
| Single Female/Mother | 99 (20.4%) | 2.72 |
| Non-family | 97 (20.0%) | 1.11 |
| Total Households | 486 (100.0%) | 2.94 |
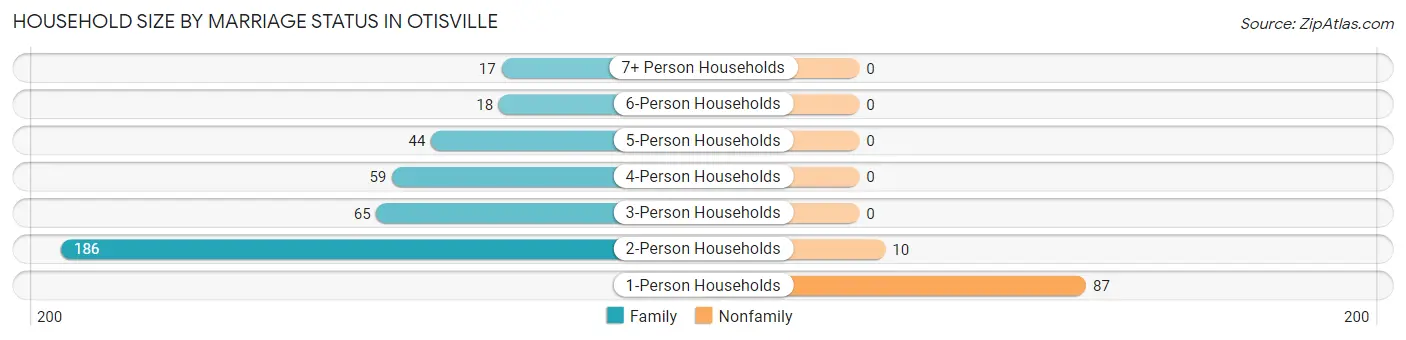
Household Size by Marriage Status in Otisville
Out of a total of 486 households in Otisville, 389 (80.0%) are family households, while 97 (20.0%) are nonfamily households. The most numerous type of family households are 2-person households, comprising 186, and the most common type of nonfamily households are 1-person households, comprising 87.
| Household Size | Family Households | Nonfamily Households |
| 1-Person Households | - | 87 (17.9%) |
| 2-Person Households | 186 (38.3%) | 10 (2.1%) |
| 3-Person Households | 65 (13.4%) | 0 (0.0%) |
| 4-Person Households | 59 (12.1%) | 0 (0.0%) |
| 5-Person Households | 44 (9.0%) | 0 (0.0%) |
| 6-Person Households | 18 (3.7%) | 0 (0.0%) |
| 7+ Person Households | 17 (3.5%) | 0 (0.0%) |
| Total | 389 (80.0%) | 97 (20.0%) |
Female Fertility in Otisville
Fertility by Age in Otisville
Average fertility rate in Otisville is 10.0 births per 1,000 women. Women in the age bracket of 20 to 34 years have the highest fertility rate with 36.0 births per 1,000 women. Women in the age bracket of 20 to 34 years acount for 100.0% of all women with births.
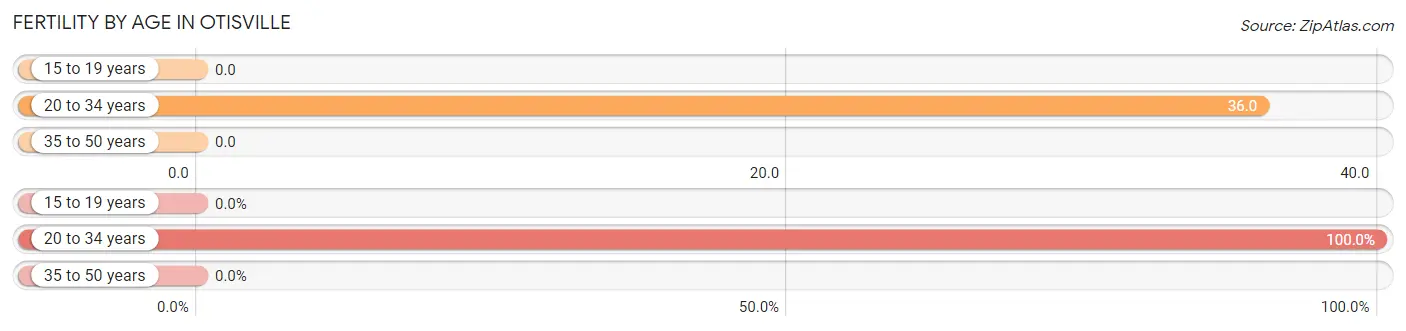
| Age Bracket | Women with Births | Births / 1,000 Women |
| 15 to 19 years | 0 (0.0%) | 0.0 |
| 20 to 34 years | 3 (100.0%) | 36.0 |
| 35 to 50 years | 0 (0.0%) | 0.0 |
| Total | 3 (100.0%) | 10.0 |
Fertility by Age by Marriage Status in Otisville
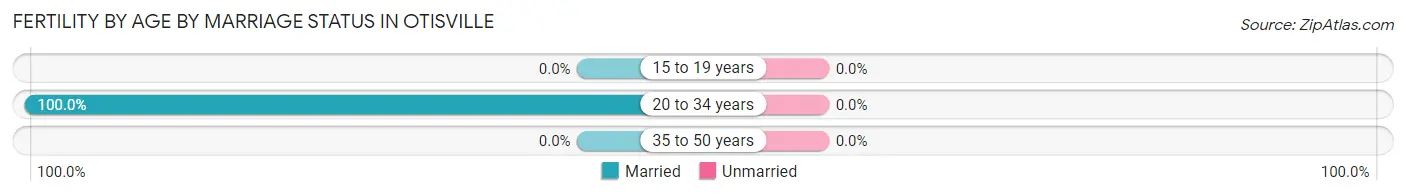
| Age Bracket | Married | Unmarried |
| 15 to 19 years | 0 (0.0%) | 0 (0.0%) |
| 20 to 34 years | 3 (100.0%) | 0 (0.0%) |
| 35 to 50 years | 0 (0.0%) | 0 (0.0%) |
| Total | 3 (100.0%) | 0 (0.0%) |
Fertility by Education in Otisville
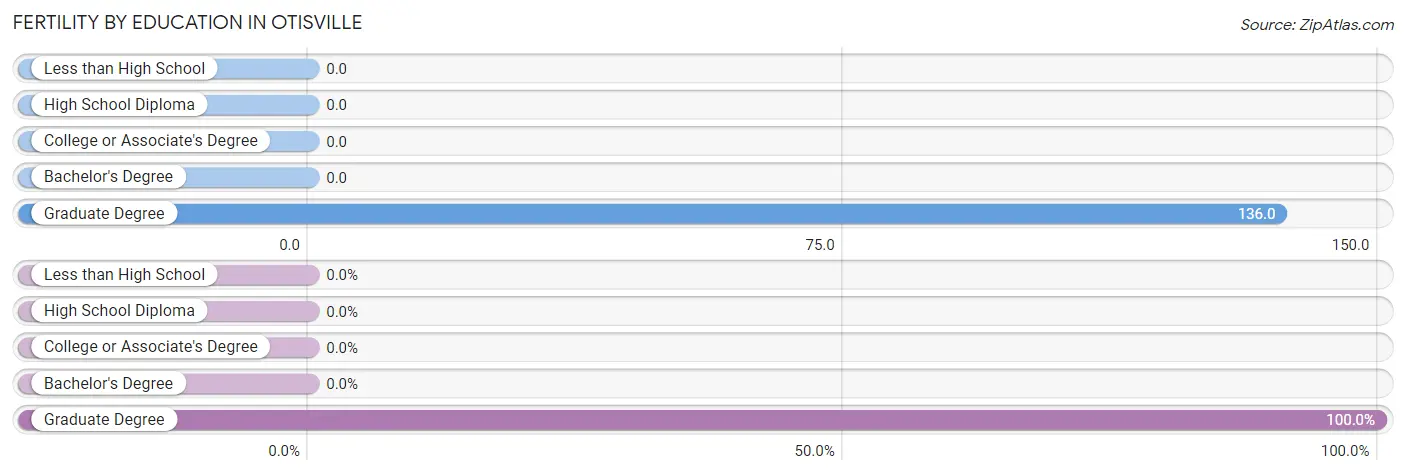
| Educational Attainment | Women with Births | Births / 1,000 Women |
| Less than High School | 0 (0.0%) | 0.0 |
| High School Diploma | 0 (0.0%) | 0.0 |
| College or Associate's Degree | 0 (0.0%) | 0.0 |
| Bachelor's Degree | 0 (0.0%) | 0.0 |
| Graduate Degree | 3 (100.0%) | 136.0 |
| Total | 3 (100.0%) | 10.0 |
Fertility by Education by Marriage Status in Otisville
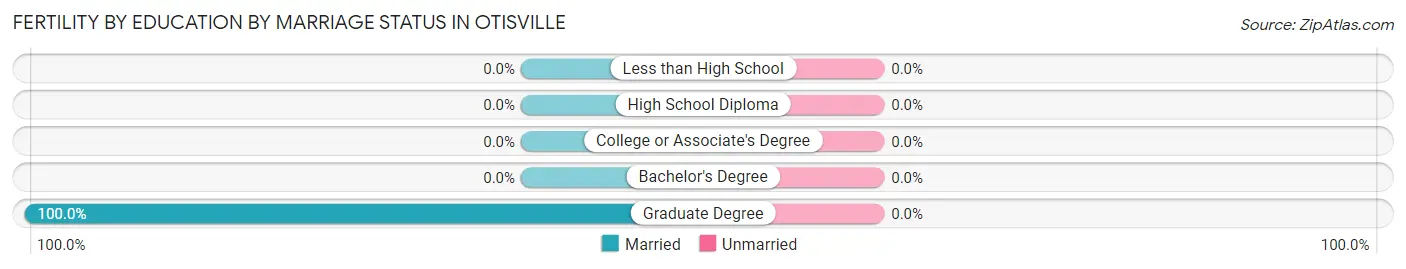
| Educational Attainment | Married | Unmarried |
| Less than High School | 0 (0.0%) | 0 (0.0%) |
| High School Diploma | 0 (0.0%) | 0 (0.0%) |
| College or Associate's Degree | 0 (0.0%) | 0 (0.0%) |
| Bachelor's Degree | 0 (0.0%) | 0 (0.0%) |
| Graduate Degree | 3 (100.0%) | 0 (0.0%) |
| Total | 3 (100.0%) | 0 (0.0%) |
Income in Otisville
Income Overview in Otisville
Per Capita Income in Otisville is $36,006, while median incomes of families and households are $93,750 and $79,615 respectively.
| Characteristic | Number | Measure |
| Per Capita Income | 1,431 | $36,006 |
| Median Family Income | 389 | $93,750 |
| Mean Family Income | 389 | $105,623 |
| Median Household Income | 486 | $79,615 |
| Mean Household Income | 486 | $102,576 |
| Income Deficit | 389 | $0 |
| Wage / Income Gap (%) | 1,431 | 23.92% |
| Wage / Income Gap ($) | 1,431 | 76.08¢ per $1 |
| Gini / Inequality Index | 1,431 | 0.40 |
Earnings by Sex in Otisville
Average Earnings in Otisville are $45,372, $46,824 for men and $35,625 for women, a difference of 23.9%.
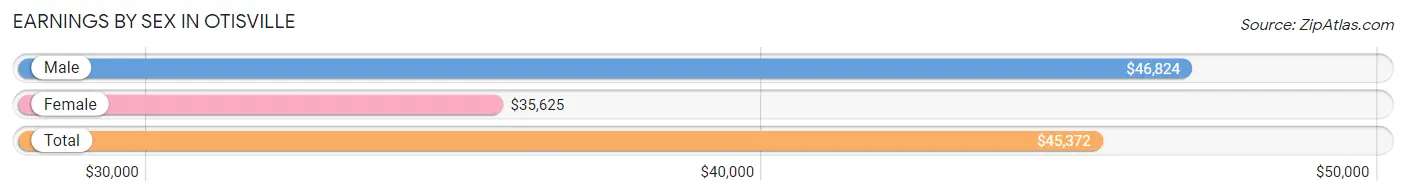
| Sex | Number | Average Earnings |
| Male | 354 (54.6%) | $46,824 |
| Female | 294 (45.4%) | $35,625 |
| Total | 648 (100.0%) | $45,372 |
Earnings by Sex by Income Bracket in Otisville
The most common earnings brackets in Otisville are $35,000 to $39,999 for men (64 | 18.1%) and $2,499 or less for women (48 | 16.3%).
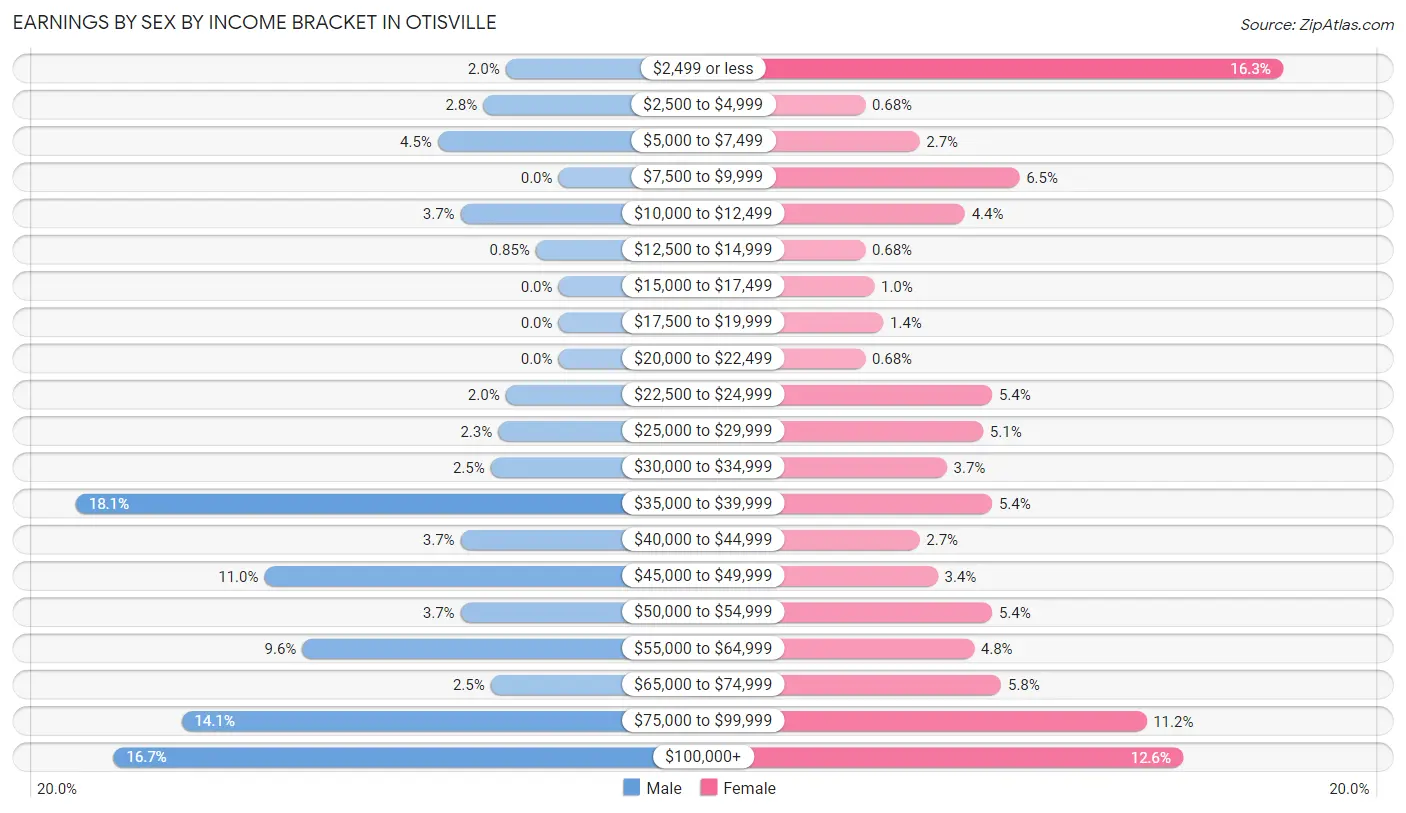
| Income | Male | Female |
| $2,499 or less | 7 (2.0%) | 48 (16.3%) |
| $2,500 to $4,999 | 10 (2.8%) | 2 (0.7%) |
| $5,000 to $7,499 | 16 (4.5%) | 8 (2.7%) |
| $7,500 to $9,999 | 0 (0.0%) | 19 (6.5%) |
| $10,000 to $12,499 | 13 (3.7%) | 13 (4.4%) |
| $12,500 to $14,999 | 3 (0.9%) | 2 (0.7%) |
| $15,000 to $17,499 | 0 (0.0%) | 3 (1.0%) |
| $17,500 to $19,999 | 0 (0.0%) | 4 (1.4%) |
| $20,000 to $22,499 | 0 (0.0%) | 2 (0.7%) |
| $22,500 to $24,999 | 7 (2.0%) | 16 (5.4%) |
| $25,000 to $29,999 | 8 (2.3%) | 15 (5.1%) |
| $30,000 to $34,999 | 9 (2.5%) | 11 (3.7%) |
| $35,000 to $39,999 | 64 (18.1%) | 16 (5.4%) |
| $40,000 to $44,999 | 13 (3.7%) | 8 (2.7%) |
| $45,000 to $49,999 | 39 (11.0%) | 10 (3.4%) |
| $50,000 to $54,999 | 13 (3.7%) | 16 (5.4%) |
| $55,000 to $64,999 | 34 (9.6%) | 14 (4.8%) |
| $65,000 to $74,999 | 9 (2.5%) | 17 (5.8%) |
| $75,000 to $99,999 | 50 (14.1%) | 33 (11.2%) |
| $100,000+ | 59 (16.7%) | 37 (12.6%) |
| Total | 354 (100.0%) | 294 (100.0%) |
Earnings by Sex by Educational Attainment in Otisville
Average earnings in Otisville are $47,466 for men and $46,625 for women, a difference of 1.8%. Men with an educational attainment of graduate degree enjoy the highest average annual earnings of $125,357, while those with high school diploma education earn the least with $43,942. Women with an educational attainment of graduate degree earn the most with the average annual earnings of $76,250, while those with less than high school education have the smallest earnings of $10,417.
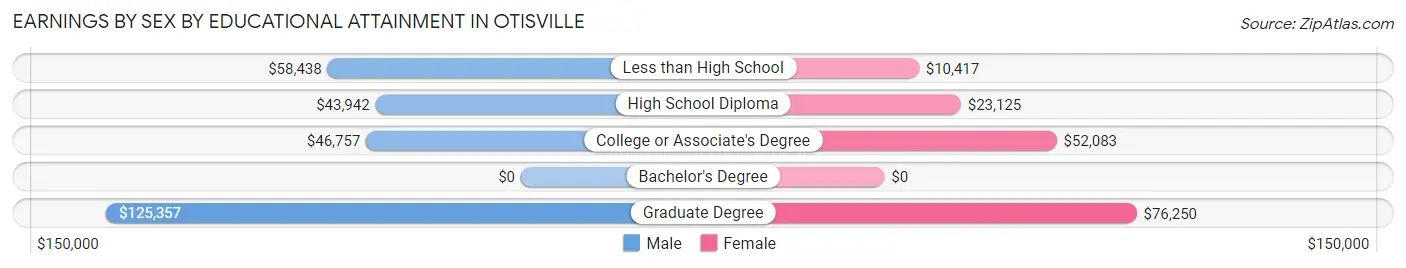
| Educational Attainment | Male Income | Female Income |
| Less than High School | $58,438 | $10,417 |
| High School Diploma | $43,942 | $23,125 |
| College or Associate's Degree | $46,757 | $52,083 |
| Bachelor's Degree | - | - |
| Graduate Degree | $125,357 | $76,250 |
| Total | $47,466 | $46,625 |
Family Income in Otisville
Family Income Brackets in Otisville
According to the Otisville family income data, there are 116 families falling into the $100,000 to $149,999 income range, which is the most common income bracket and makes up 29.8% of all families. Conversely, the less than $10,000 income bracket is the least frequent group with only 2 families (0.5%) belonging to this category.
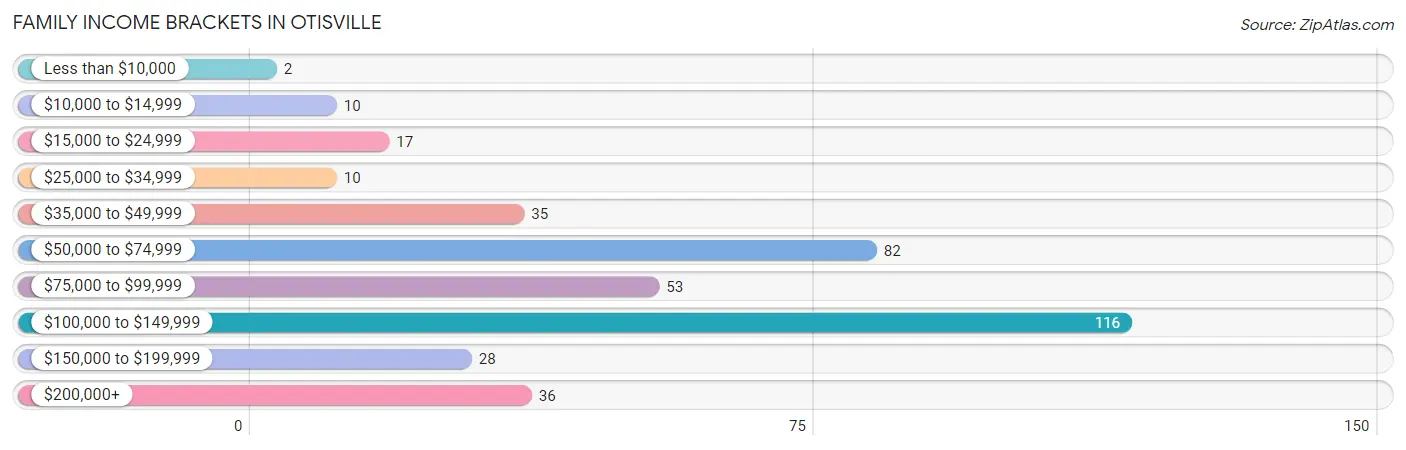
| Income Bracket | # Families | % Families |
| Less than $10,000 | 2 | 0.5% |
| $10,000 to $14,999 | 10 | 2.6% |
| $15,000 to $24,999 | 17 | 4.4% |
| $25,000 to $34,999 | 10 | 2.6% |
| $35,000 to $49,999 | 35 | 9.0% |
| $50,000 to $74,999 | 82 | 21.1% |
| $75,000 to $99,999 | 53 | 13.6% |
| $100,000 to $149,999 | 116 | 29.8% |
| $150,000 to $199,999 | 28 | 7.2% |
| $200,000+ | 36 | 9.3% |
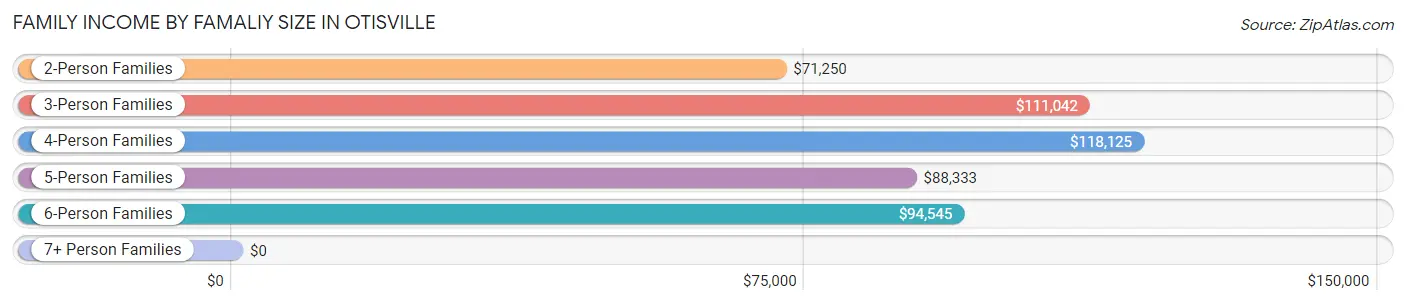
Family Income by Famaliy Size in Otisville
4-person families (59 | 15.2%) account for the highest median family income in Otisville with $118,125 per family, while 3-person families (65 | 16.7%) have the highest median income of $37,014 per family member.
| Income Bracket | # Families | Median Income |
| 2-Person Families | 186 (47.8%) | $71,250 |
| 3-Person Families | 65 (16.7%) | $111,042 |
| 4-Person Families | 59 (15.2%) | $118,125 |
| 5-Person Families | 44 (11.3%) | $88,333 |
| 6-Person Families | 18 (4.6%) | $94,545 |
| 7+ Person Families | 17 (4.4%) | $0 |
| Total | 389 (100.0%) | $93,750 |
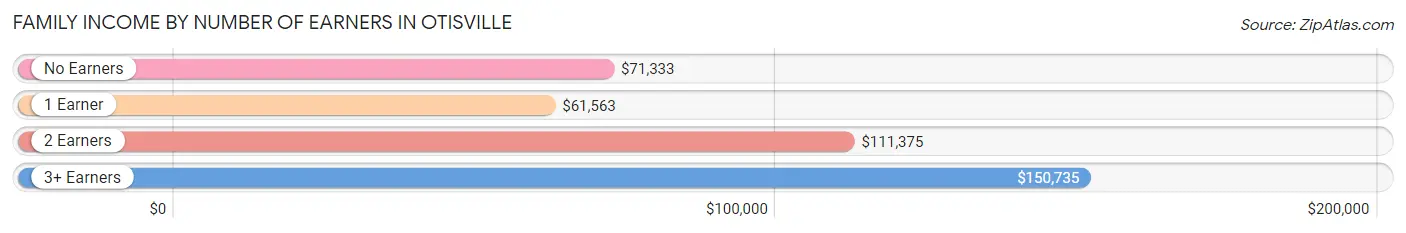
Family Income by Number of Earners in Otisville
The median family income in Otisville is $93,750, with families comprising 3+ earners (40) having the highest median family income of $150,735, while families with 1 earner (132) have the lowest median family income of $61,563, accounting for 10.3% and 33.9% of families, respectively.
| Number of Earners | # Families | Median Income |
| No Earners | 104 (26.7%) | $71,333 |
| 1 Earner | 132 (33.9%) | $61,563 |
| 2 Earners | 113 (29.0%) | $111,375 |
| 3+ Earners | 40 (10.3%) | $150,735 |
| Total | 389 (100.0%) | $93,750 |
Household Income in Otisville
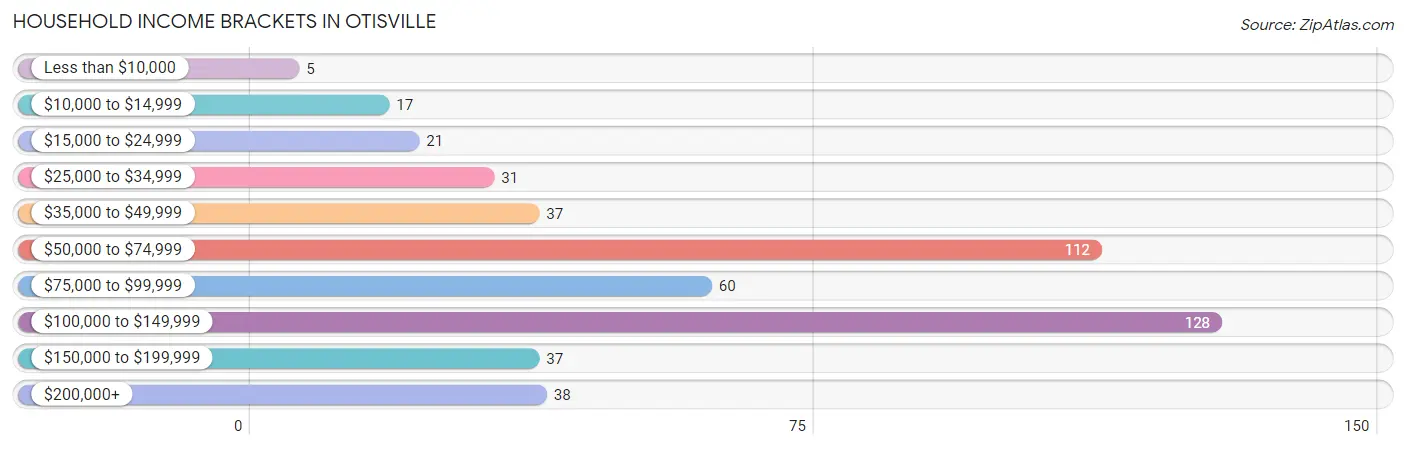
Household Income Brackets in Otisville
With 128 households falling in the category, the $100,000 to $149,999 income range is the most frequent in Otisville, accounting for 26.3% of all households. In contrast, only 5 households (1.0%) fall into the less than $10,000 income bracket, making it the least populous group.
| Income Bracket | # Households | % Households |
| Less than $10,000 | 5 | 1.0% |
| $10,000 to $14,999 | 17 | 3.5% |
| $15,000 to $24,999 | 21 | 4.3% |
| $25,000 to $34,999 | 31 | 6.4% |
| $35,000 to $49,999 | 37 | 7.6% |
| $50,000 to $74,999 | 112 | 23.0% |
| $75,000 to $99,999 | 60 | 12.3% |
| $100,000 to $149,999 | 128 | 26.3% |
| $150,000 to $199,999 | 37 | 7.6% |
| $200,000+ | 38 | 7.8% |
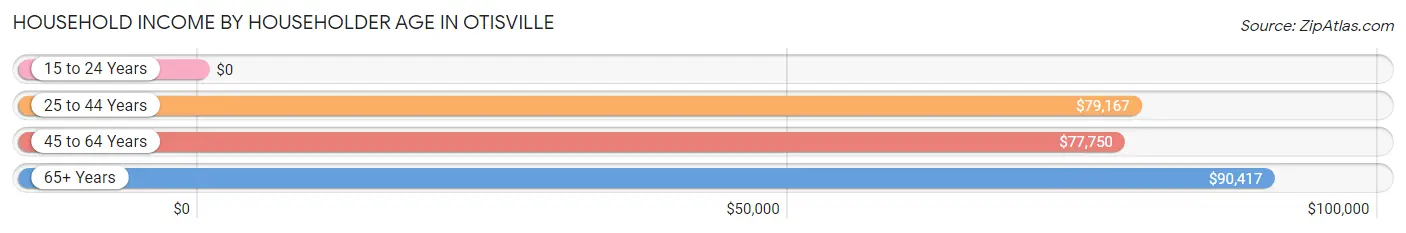
Household Income by Householder Age in Otisville
The median household income in Otisville is $79,615, with the highest median household income of $90,417 found in the 65+ years age bracket for the primary householder. A total of 155 households (31.9%) fall into this category.
| Income Bracket | # Households | Median Income |
| 15 to 24 Years | 0 (0.0%) | $0 |
| 25 to 44 Years | 152 (31.3%) | $79,167 |
| 45 to 64 Years | 179 (36.8%) | $77,750 |
| 65+ Years | 155 (31.9%) | $90,417 |
| Total | 486 (100.0%) | $79,615 |
Poverty in Otisville
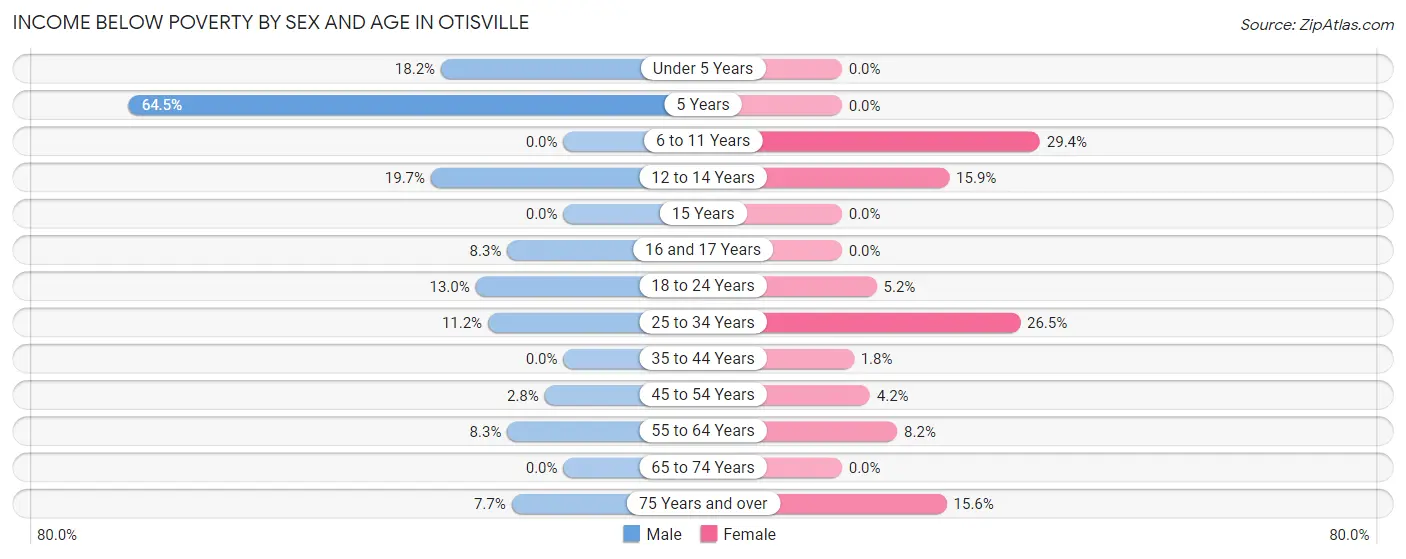
Income Below Poverty by Sex and Age in Otisville
With 9.1% poverty level for males and 9.5% for females among the residents of Otisville, 5 year old males and 6 to 11 year old females are the most vulnerable to poverty, with 20 males (64.5%) and 20 females (29.4%) in their respective age groups living below the poverty level.
| Age Bracket | Male | Female |
| Under 5 Years | 2 (18.2%) | 0 (0.0%) |
| 5 Years | 20 (64.5%) | 0 (0.0%) |
| 6 to 11 Years | 0 (0.0%) | 20 (29.4%) |
| 12 to 14 Years | 12 (19.7%) | 11 (15.9%) |
| 15 Years | 0 (0.0%) | 0 (0.0%) |
| 16 and 17 Years | 2 (8.3%) | 0 (0.0%) |
| 18 to 24 Years | 3 (13.0%) | 3 (5.2%) |
| 25 to 34 Years | 14 (11.2%) | 18 (26.5%) |
| 35 to 44 Years | 0 (0.0%) | 2 (1.8%) |
| 45 to 54 Years | 2 (2.8%) | 2 (4.2%) |
| 55 to 64 Years | 7 (8.3%) | 6 (8.2%) |
| 65 to 74 Years | 0 (0.0%) | 0 (0.0%) |
| 75 Years and over | 2 (7.7%) | 7 (15.6%) |
| Total | 64 (9.1%) | 69 (9.5%) |
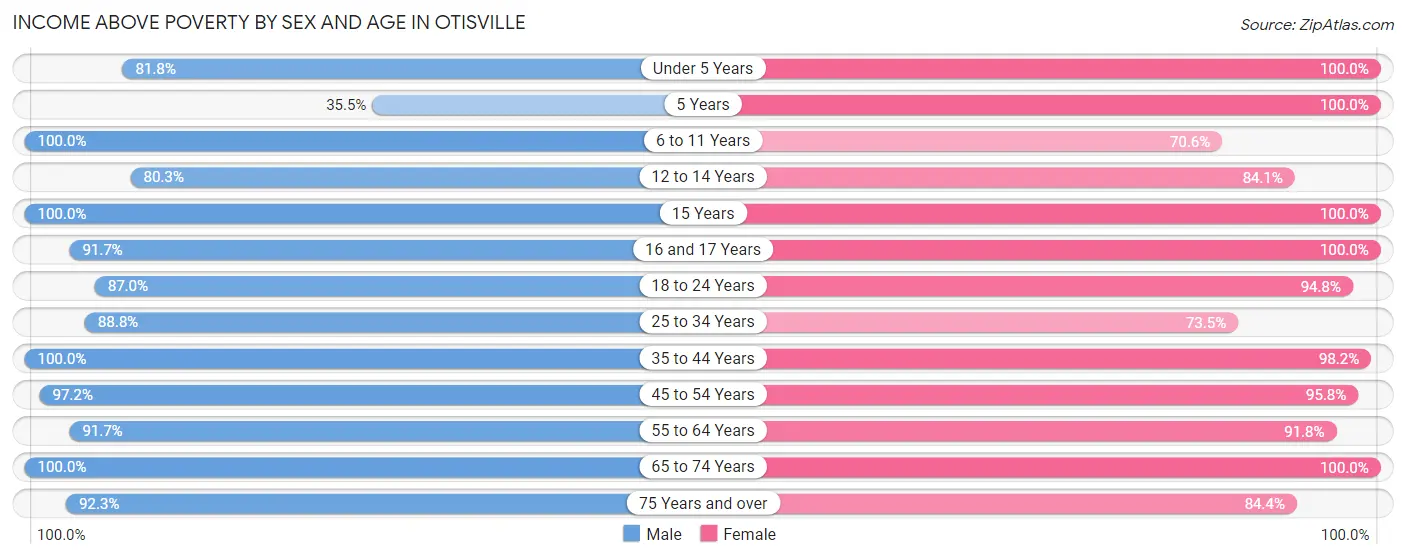
Income Above Poverty by Sex and Age in Otisville
According to the poverty statistics in Otisville, males aged 6 to 11 years and females aged under 5 years are the age groups that are most secure financially, with 100.0% of males and 100.0% of females in these age groups living above the poverty line.
| Age Bracket | Male | Female |
| Under 5 Years | 9 (81.8%) | 41 (100.0%) |
| 5 Years | 11 (35.5%) | 14 (100.0%) |
| 6 to 11 Years | 54 (100.0%) | 48 (70.6%) |
| 12 to 14 Years | 49 (80.3%) | 58 (84.1%) |
| 15 Years | 10 (100.0%) | 7 (100.0%) |
| 16 and 17 Years | 22 (91.7%) | 33 (100.0%) |
| 18 to 24 Years | 20 (87.0%) | 55 (94.8%) |
| 25 to 34 Years | 111 (88.8%) | 50 (73.5%) |
| 35 to 44 Years | 97 (100.0%) | 111 (98.2%) |
| 45 to 54 Years | 70 (97.2%) | 46 (95.8%) |
| 55 to 64 Years | 77 (91.7%) | 67 (91.8%) |
| 65 to 74 Years | 83 (100.0%) | 93 (100.0%) |
| 75 Years and over | 24 (92.3%) | 38 (84.4%) |
| Total | 637 (90.9%) | 661 (90.5%) |
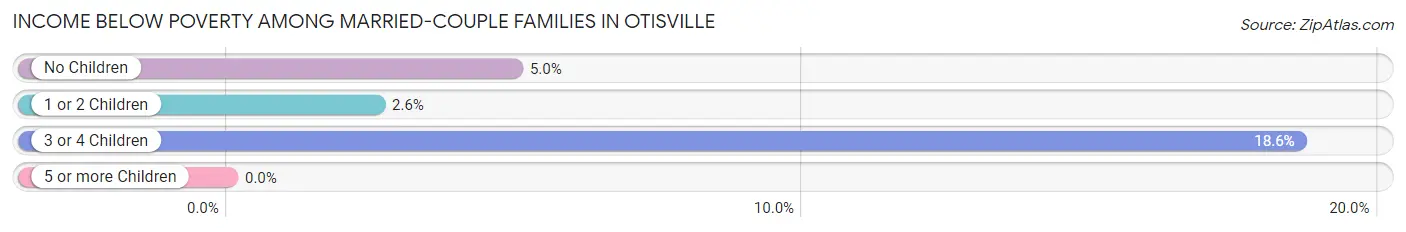
Income Below Poverty Among Married-Couple Families in Otisville
The poverty statistics for married-couple families in Otisville show that 6.6% or 16 of the total 242 families live below the poverty line. Families with 3 or 4 children have the highest poverty rate of 18.6%, comprising of 8 families. On the other hand, families with 1 or 2 children have the lowest poverty rate of 2.6%, which includes 2 families.
| Children | Above Poverty | Below Poverty |
| No Children | 115 (95.0%) | 6 (5.0%) |
| 1 or 2 Children | 76 (97.4%) | 2 (2.6%) |
| 3 or 4 Children | 35 (81.4%) | 8 (18.6%) |
| 5 or more Children | 0 (0.0%) | 0 (0.0%) |
| Total | 226 (93.4%) | 16 (6.6%) |
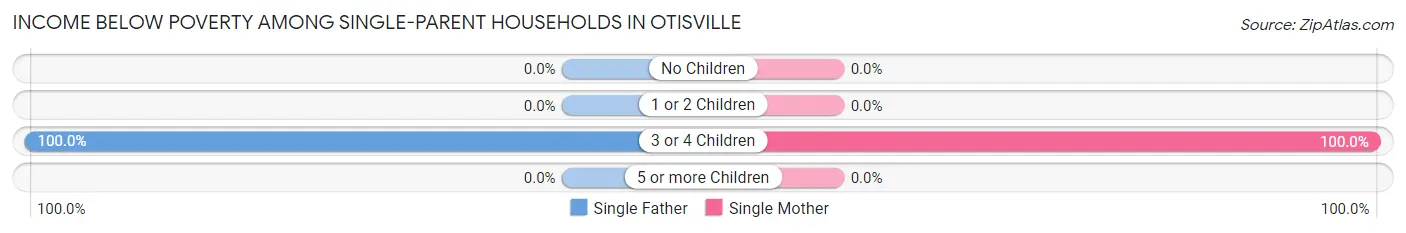
Income Below Poverty Among Single-Parent Households in Otisville
According to the poverty data in Otisville, 20.8% or 10 single-father households and 2.0% or 2 single-mother households are living below the poverty line. Among single-father households, those with 3 or 4 children have the highest poverty rate, with 10 households (100.0%) experiencing poverty. Likewise, among single-mother households, those with 3 or 4 children have the highest poverty rate, with 2 households (100.0%) falling below the poverty line.
| Children | Single Father | Single Mother |
| No Children | 0 (0.0%) | 0 (0.0%) |
| 1 or 2 Children | 0 (0.0%) | 0 (0.0%) |
| 3 or 4 Children | 10 (100.0%) | 2 (100.0%) |
| 5 or more Children | 0 (0.0%) | 0 (0.0%) |
| Total | 10 (20.8%) | 2 (2.0%) |
Income Below Poverty Among Married-Couple vs Single-Parent Households in Otisville
The poverty data for Otisville shows that 16 of the married-couple family households (6.6%) and 12 of the single-parent households (8.2%) are living below the poverty level. Within the married-couple family households, those with 3 or 4 children have the highest poverty rate, with 8 households (18.6%) falling below the poverty line. Among the single-parent households, those with 3 or 4 children have the highest poverty rate, with 12 household (100.0%) living below poverty.
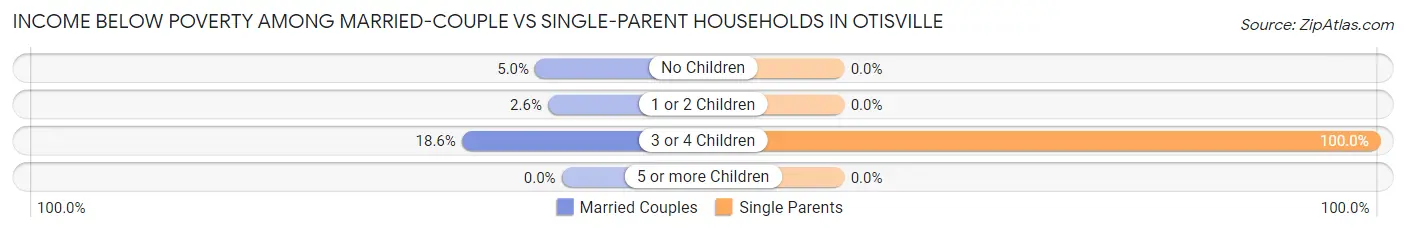
| Children | Married-Couple Families | Single-Parent Households |
| No Children | 6 (5.0%) | 0 (0.0%) |
| 1 or 2 Children | 2 (2.6%) | 0 (0.0%) |
| 3 or 4 Children | 8 (18.6%) | 12 (100.0%) |
| 5 or more Children | 0 (0.0%) | 0 (0.0%) |
| Total | 16 (6.6%) | 12 (8.2%) |
Employment Characteristics in Otisville
Employment by Class of Employer in Otisville
Among the 548 employed individuals in Otisville, private company employees (396 | 72.3%), local government employees (64 | 11.7%), and not-for-profit organizations (42 | 7.7%) make up the most common classes of employment.
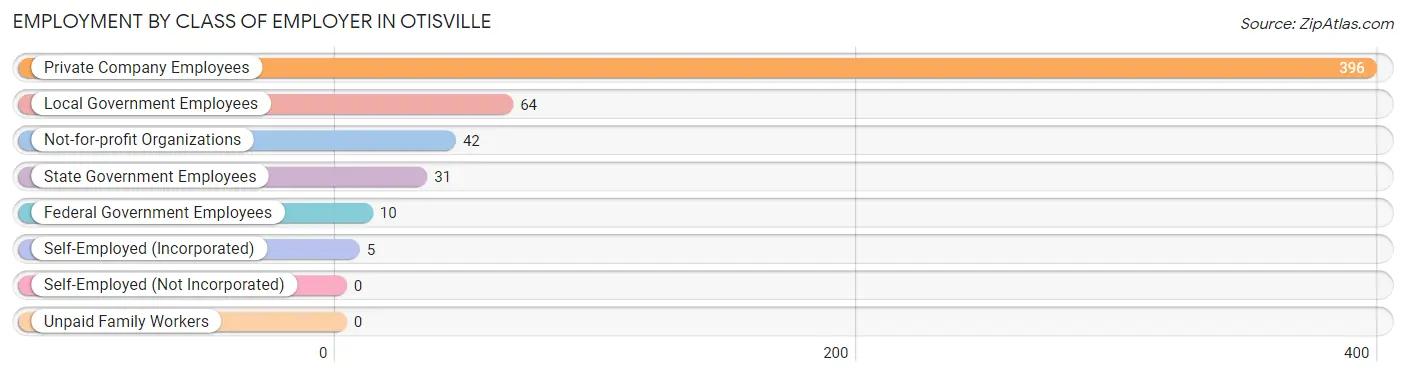
| Employer Class | # Employees | % Employees |
| Private Company Employees | 396 | 72.3% |
| Self-Employed (Incorporated) | 5 | 0.9% |
| Self-Employed (Not Incorporated) | 0 | 0.0% |
| Not-for-profit Organizations | 42 | 7.7% |
| Local Government Employees | 64 | 11.7% |
| State Government Employees | 31 | 5.7% |
| Federal Government Employees | 10 | 1.8% |
| Unpaid Family Workers | 0 | 0.0% |
| Total | 548 | 100.0% |
Employment Status by Age in Otisville
According to the labor force statistics for Otisville, out of the total population over 16 years of age (1,065), 53.7% or 572 individuals are in the labor force, with 2.4% or 14 of them unemployed. The age group with the highest labor force participation rate is 45 to 54 years, with 90.8% or 109 individuals in the labor force. Within the labor force, the 65 to 74 years age range has the highest percentage of unemployed individuals, with 15.4% or 2 of them being unemployed.
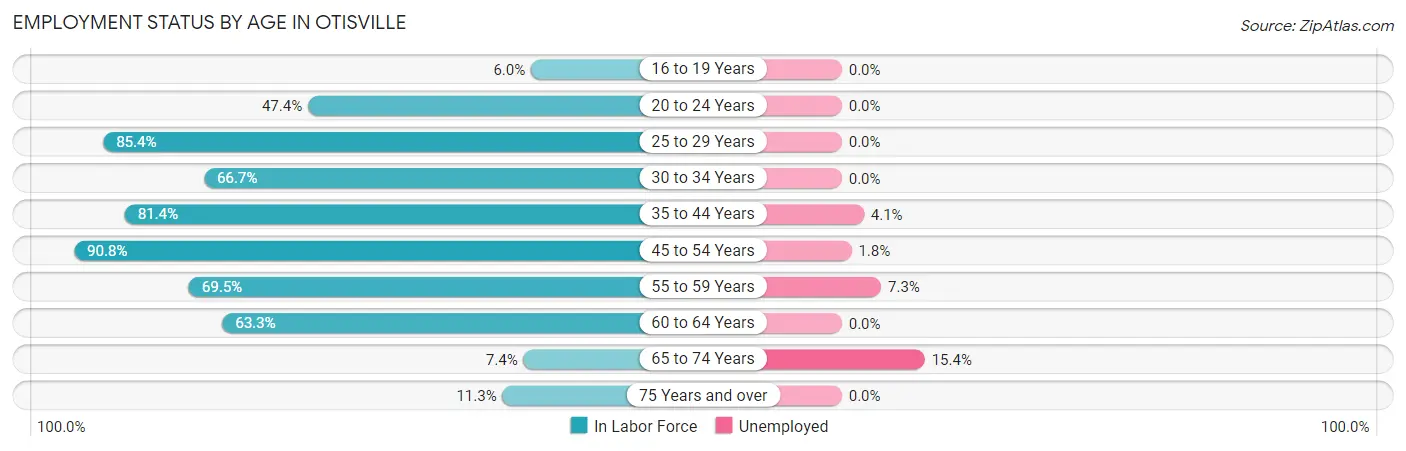
| Age Bracket | In Labor Force | Unemployed |
| 16 to 19 Years | 6 (6.0%) | 0 (0.0%) |
| 20 to 24 Years | 18 (47.4%) | 0 (0.0%) |
| 25 to 29 Years | 70 (85.4%) | 0 (0.0%) |
| 30 to 34 Years | 74 (66.7%) | 0 (0.0%) |
| 35 to 44 Years | 171 (81.4%) | 7 (4.1%) |
| 45 to 54 Years | 109 (90.8%) | 2 (1.8%) |
| 55 to 59 Years | 41 (69.5%) | 3 (7.3%) |
| 60 to 64 Years | 62 (63.3%) | 0 (0.0%) |
| 65 to 74 Years | 13 (7.4%) | 2 (15.4%) |
| 75 Years and over | 8 (11.3%) | 0 (0.0%) |
| Total | 572 (53.7%) | 14 (2.4%) |
Employment Status by Educational Attainment in Otisville
According to labor force statistics for Otisville, 77.5% of individuals (527) out of the total population between 25 and 64 years of age (680) are in the labor force, with 2.3% or 12 of them being unemployed. The group with the highest labor force participation rate are those with the educational attainment of bachelor's degree or higher, with 90.4% or 142 individuals in the labor force. Within the labor force, individuals with less than high school education have the highest percentage of unemployment, with 17.9% or 5 of them being unemployed.
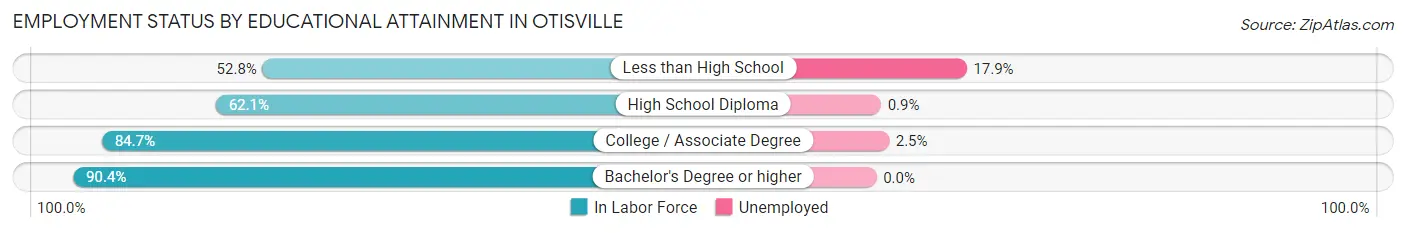
| Educational Attainment | In Labor Force | Unemployed |
| Less than High School | 28 (52.8%) | 9 (17.9%) |
| High School Diploma | 113 (62.1%) | 2 (0.9%) |
| College / Associate Degree | 244 (84.7%) | 7 (2.5%) |
| Bachelor's Degree or higher | 142 (90.4%) | 0 (0.0%) |
| Total | 527 (77.5%) | 16 (2.3%) |
Employment Occupations by Sex in Otisville
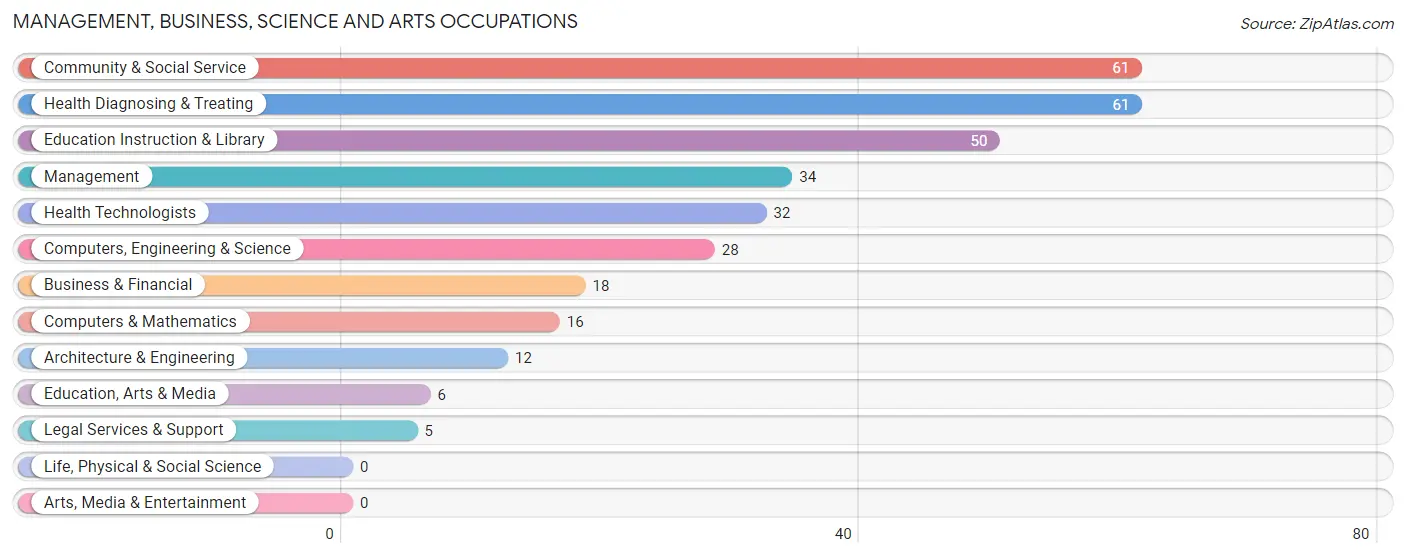
Management, Business, Science and Arts Occupations
The most common Management, Business, Science and Arts occupations in Otisville are Community & Social Service (61 | 10.9%), Health Diagnosing & Treating (61 | 10.9%), Education Instruction & Library (50 | 9.0%), Management (34 | 6.1%), and Health Technologists (32 | 5.7%).
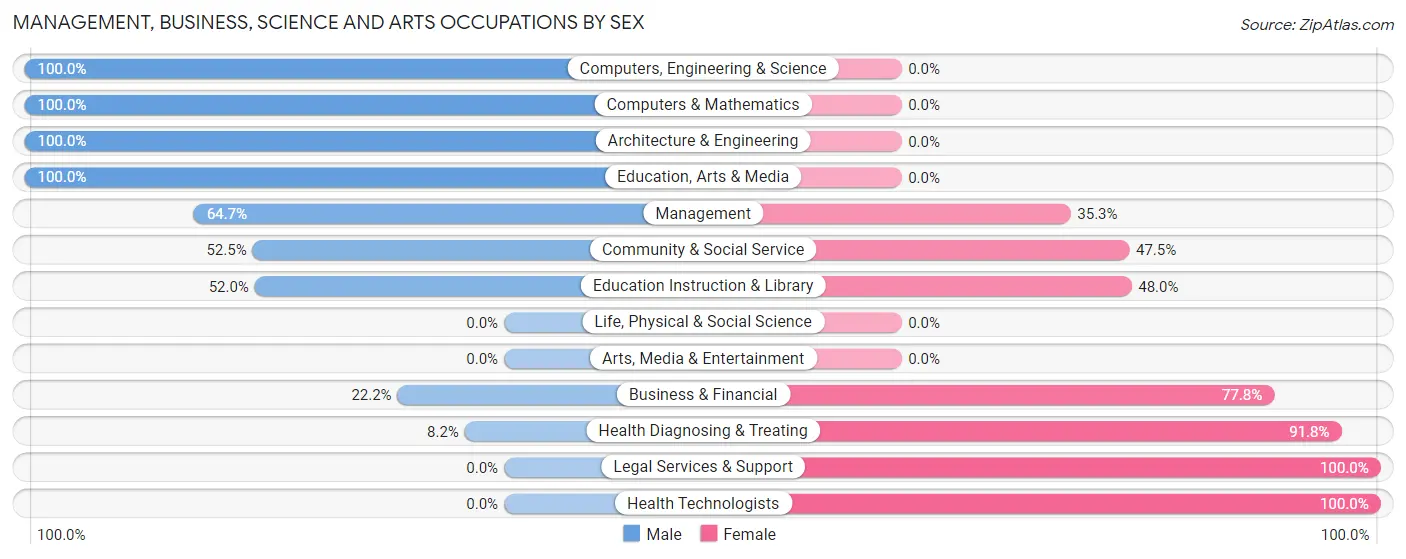
Management, Business, Science and Arts Occupations by Sex
Within the Management, Business, Science and Arts occupations in Otisville, the most male-oriented occupations are Computers, Engineering & Science (100.0%), Computers & Mathematics (100.0%), and Architecture & Engineering (100.0%), while the most female-oriented occupations are Legal Services & Support (100.0%), Health Technologists (100.0%), and Health Diagnosing & Treating (91.8%).
| Occupation | Male | Female |
| Management | 22 (64.7%) | 12 (35.3%) |
| Business & Financial | 4 (22.2%) | 14 (77.8%) |
| Computers, Engineering & Science | 28 (100.0%) | 0 (0.0%) |
| Computers & Mathematics | 16 (100.0%) | 0 (0.0%) |
| Architecture & Engineering | 12 (100.0%) | 0 (0.0%) |
| Life, Physical & Social Science | 0 (0.0%) | 0 (0.0%) |
| Community & Social Service | 32 (52.5%) | 29 (47.5%) |
| Education, Arts & Media | 6 (100.0%) | 0 (0.0%) |
| Legal Services & Support | 0 (0.0%) | 5 (100.0%) |
| Education Instruction & Library | 26 (52.0%) | 24 (48.0%) |
| Arts, Media & Entertainment | 0 (0.0%) | 0 (0.0%) |
| Health Diagnosing & Treating | 5 (8.2%) | 56 (91.8%) |
| Health Technologists | 0 (0.0%) | 32 (100.0%) |
| Total (Category) | 91 (45.1%) | 111 (54.9%) |
| Total (Overall) | 334 (59.9%) | 224 (40.1%) |
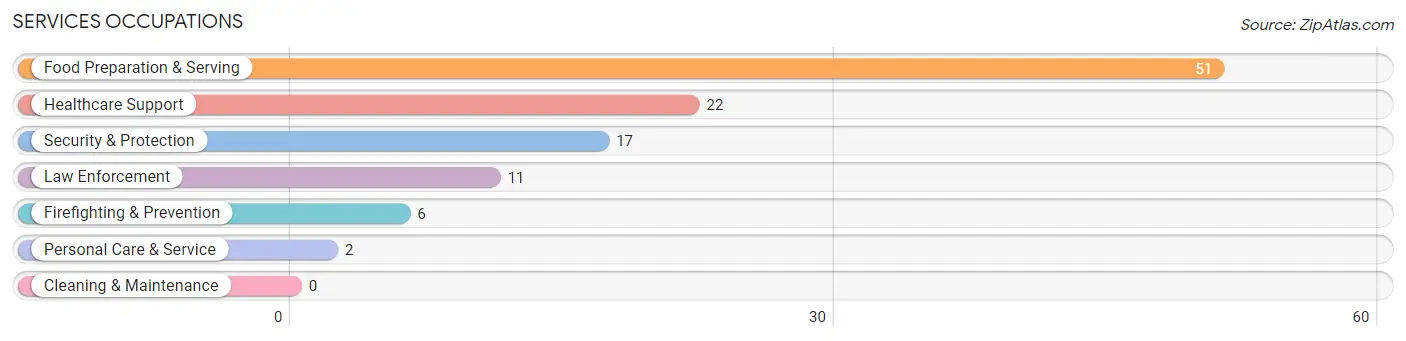
Services Occupations
The most common Services occupations in Otisville are Food Preparation & Serving (51 | 9.1%), Healthcare Support (22 | 3.9%), Security & Protection (17 | 3.0%), Law Enforcement (11 | 2.0%), and Firefighting & Prevention (6 | 1.1%).
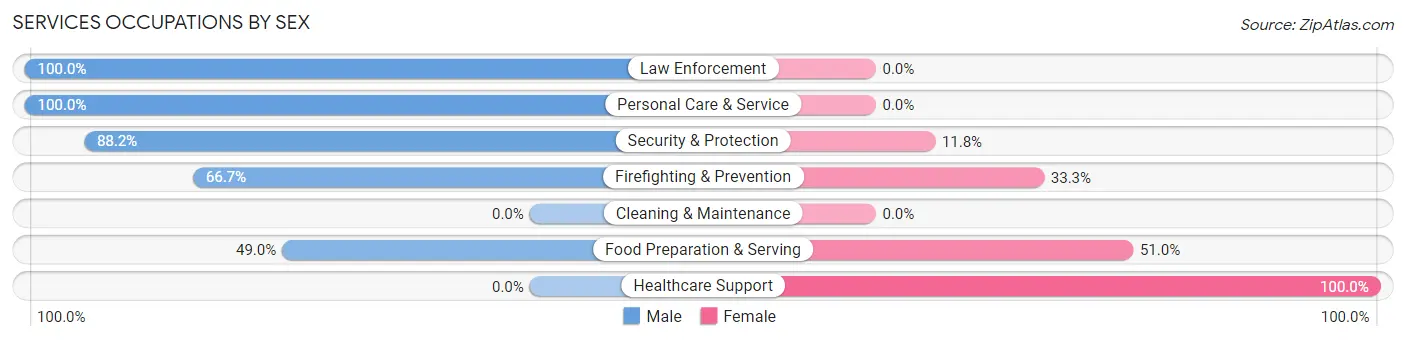
Services Occupations by Sex
Within the Services occupations in Otisville, the most male-oriented occupations are Law Enforcement (100.0%), Personal Care & Service (100.0%), and Security & Protection (88.2%), while the most female-oriented occupations are Healthcare Support (100.0%), Food Preparation & Serving (51.0%), and Firefighting & Prevention (33.3%).
| Occupation | Male | Female |
| Healthcare Support | 0 (0.0%) | 22 (100.0%) |
| Security & Protection | 15 (88.2%) | 2 (11.8%) |
| Firefighting & Prevention | 4 (66.7%) | 2 (33.3%) |
| Law Enforcement | 11 (100.0%) | 0 (0.0%) |
| Food Preparation & Serving | 25 (49.0%) | 26 (51.0%) |
| Cleaning & Maintenance | 0 (0.0%) | 0 (0.0%) |
| Personal Care & Service | 2 (100.0%) | 0 (0.0%) |
| Total (Category) | 42 (45.7%) | 50 (54.3%) |
| Total (Overall) | 334 (59.9%) | 224 (40.1%) |
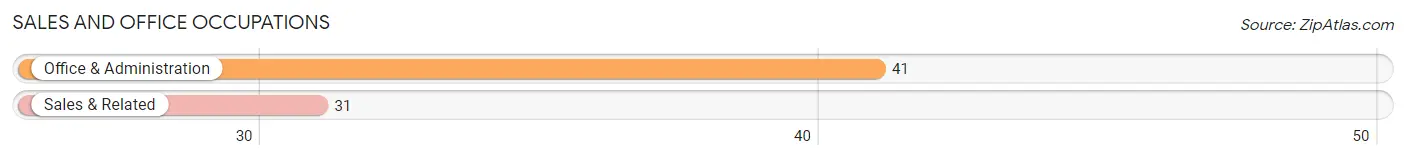
Sales and Office Occupations
The most common Sales and Office occupations in Otisville are Office & Administration (41 | 7.3%), and Sales & Related (31 | 5.6%).
Sales and Office Occupations by Sex
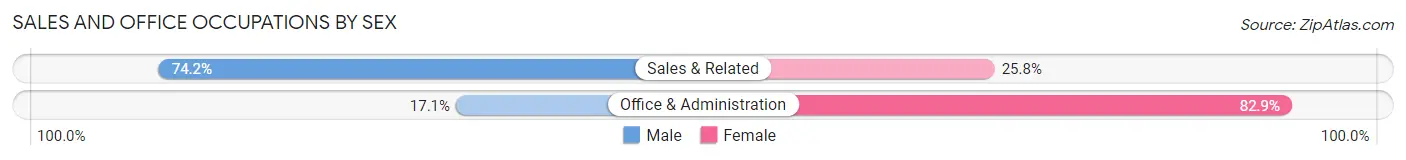
| Occupation | Male | Female |
| Sales & Related | 23 (74.2%) | 8 (25.8%) |
| Office & Administration | 7 (17.1%) | 34 (82.9%) |
| Total (Category) | 30 (41.7%) | 42 (58.3%) |
| Total (Overall) | 334 (59.9%) | 224 (40.1%) |
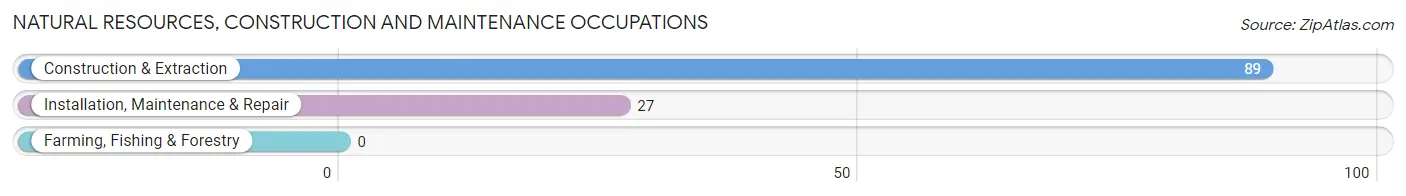
Natural Resources, Construction and Maintenance Occupations
The most common Natural Resources, Construction and Maintenance occupations in Otisville are Construction & Extraction (89 | 16.0%), and Installation, Maintenance & Repair (27 | 4.8%).
Natural Resources, Construction and Maintenance Occupations by Sex
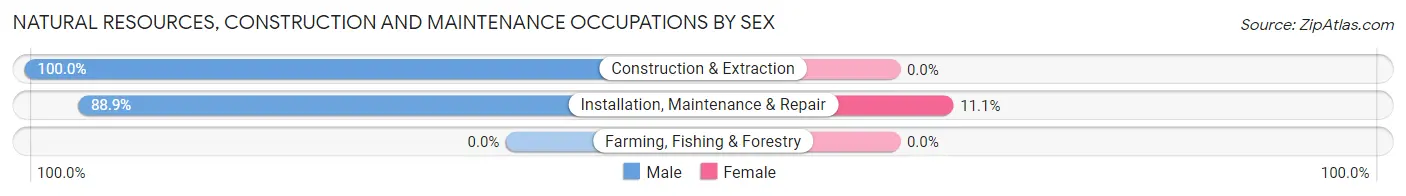
| Occupation | Male | Female |
| Farming, Fishing & Forestry | 0 (0.0%) | 0 (0.0%) |
| Construction & Extraction | 89 (100.0%) | 0 (0.0%) |
| Installation, Maintenance & Repair | 24 (88.9%) | 3 (11.1%) |
| Total (Category) | 113 (97.4%) | 3 (2.6%) |
| Total (Overall) | 334 (59.9%) | 224 (40.1%) |
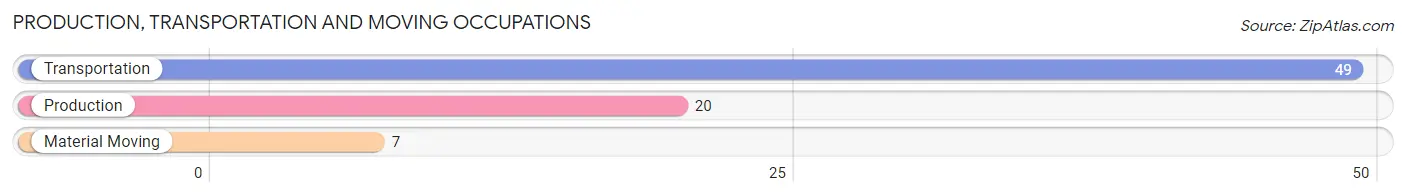
Production, Transportation and Moving Occupations
The most common Production, Transportation and Moving occupations in Otisville are Transportation (49 | 8.8%), Production (20 | 3.6%), and Material Moving (7 | 1.3%).
Production, Transportation and Moving Occupations by Sex
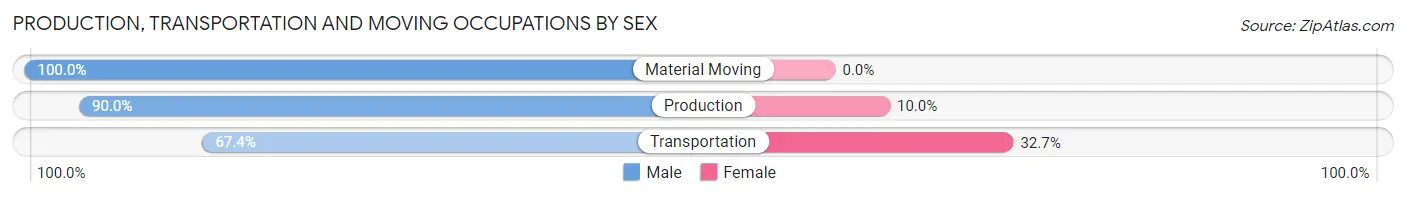
| Occupation | Male | Female |
| Production | 18 (90.0%) | 2 (10.0%) |
| Transportation | 33 (67.3%) | 16 (32.7%) |
| Material Moving | 7 (100.0%) | 0 (0.0%) |
| Total (Category) | 58 (76.3%) | 18 (23.7%) |
| Total (Overall) | 334 (59.9%) | 224 (40.1%) |
Employment Industries by Sex in Otisville
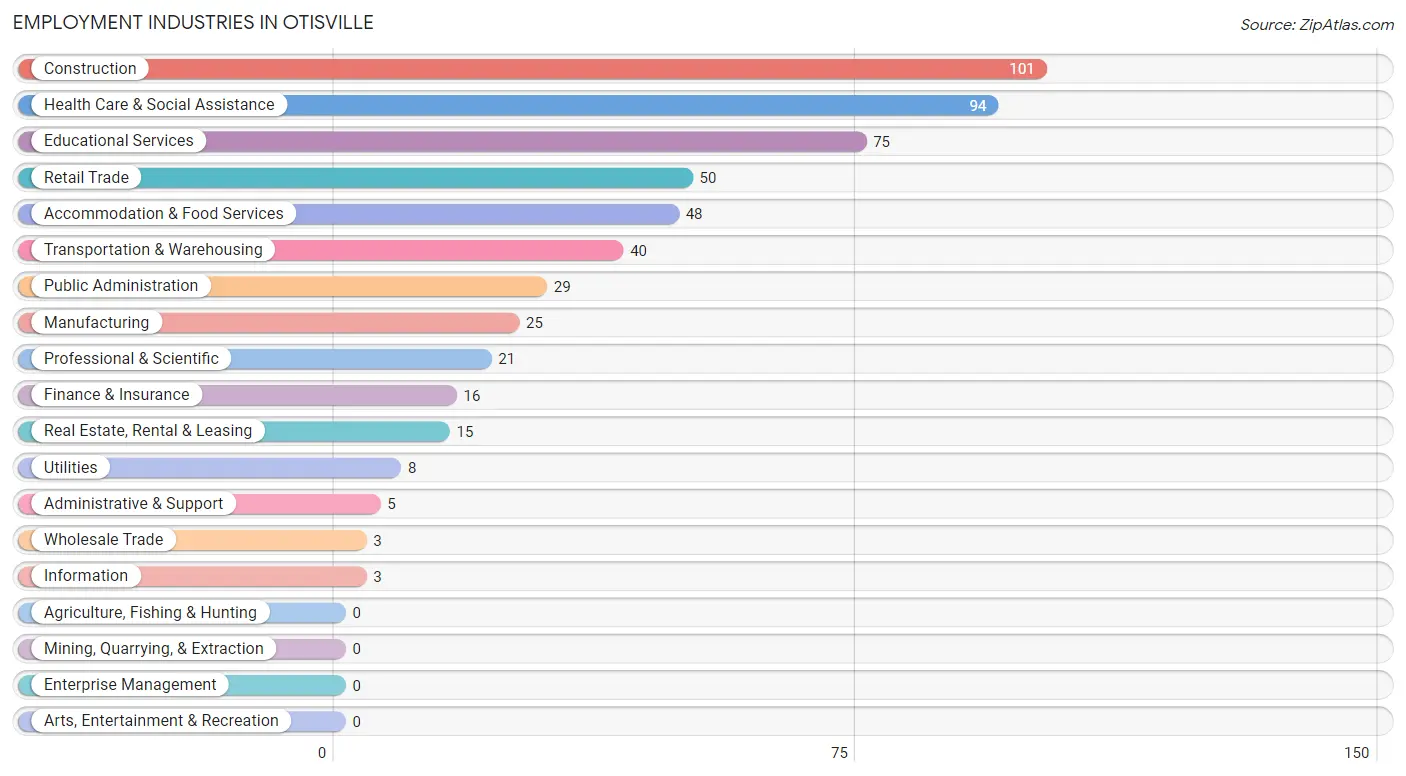
Employment Industries in Otisville
The major employment industries in Otisville include Construction (101 | 18.1%), Health Care & Social Assistance (94 | 16.9%), Educational Services (75 | 13.4%), Retail Trade (50 | 9.0%), and Accommodation & Food Services (48 | 8.6%).
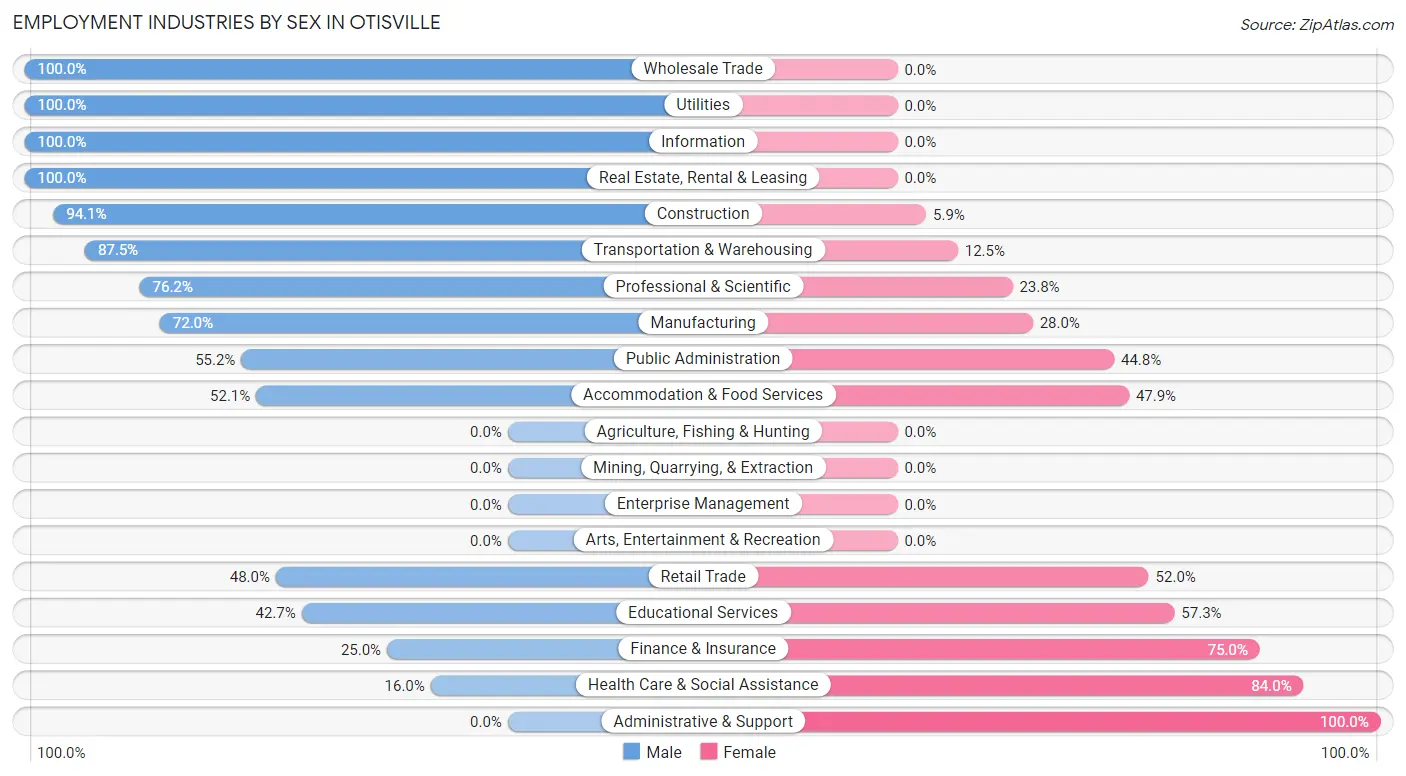
Employment Industries by Sex in Otisville
The Otisville industries that see more men than women are Wholesale Trade (100.0%), Utilities (100.0%), and Information (100.0%), whereas the industries that tend to have a higher number of women are Administrative & Support (100.0%), Health Care & Social Assistance (84.0%), and Finance & Insurance (75.0%).
| Industry | Male | Female |
| Agriculture, Fishing & Hunting | 0 (0.0%) | 0 (0.0%) |
| Mining, Quarrying, & Extraction | 0 (0.0%) | 0 (0.0%) |
| Construction | 95 (94.1%) | 6 (5.9%) |
| Manufacturing | 18 (72.0%) | 7 (28.0%) |
| Wholesale Trade | 3 (100.0%) | 0 (0.0%) |
| Retail Trade | 24 (48.0%) | 26 (52.0%) |
| Transportation & Warehousing | 35 (87.5%) | 5 (12.5%) |
| Utilities | 8 (100.0%) | 0 (0.0%) |
| Information | 3 (100.0%) | 0 (0.0%) |
| Finance & Insurance | 4 (25.0%) | 12 (75.0%) |
| Real Estate, Rental & Leasing | 15 (100.0%) | 0 (0.0%) |
| Professional & Scientific | 16 (76.2%) | 5 (23.8%) |
| Enterprise Management | 0 (0.0%) | 0 (0.0%) |
| Administrative & Support | 0 (0.0%) | 5 (100.0%) |
| Educational Services | 32 (42.7%) | 43 (57.3%) |
| Health Care & Social Assistance | 15 (16.0%) | 79 (84.0%) |
| Arts, Entertainment & Recreation | 0 (0.0%) | 0 (0.0%) |
| Accommodation & Food Services | 25 (52.1%) | 23 (47.9%) |
| Public Administration | 16 (55.2%) | 13 (44.8%) |
| Total | 334 (59.9%) | 224 (40.1%) |
Education in Otisville
School Enrollment in Otisville
The most common levels of schooling among the 439 students in Otisville are middle school (122 | 27.8%), high school (115 | 26.2%), and college / undergraduate (71 | 16.2%).
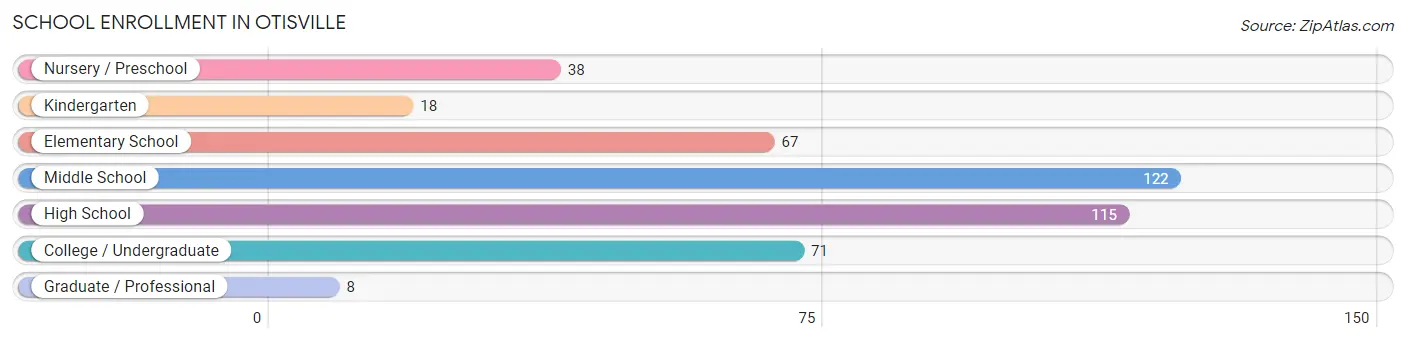
| School Level | # Students | % Students |
| Nursery / Preschool | 38 | 8.7% |
| Kindergarten | 18 | 4.1% |
| Elementary School | 67 | 15.3% |
| Middle School | 122 | 27.8% |
| High School | 115 | 26.2% |
| College / Undergraduate | 71 | 16.2% |
| Graduate / Professional | 8 | 1.8% |
| Total | 439 | 100.0% |
School Enrollment by Age by Funding Source in Otisville
Out of a total of 439 students who are enrolled in schools in Otisville, 36 (8.2%) attend a private institution, while the remaining 403 (91.8%) are enrolled in public schools. The age group of 25 to 34 year olds has the highest likelihood of being enrolled in private schools, with 8 (72.7% in the age bracket) enrolled. Conversely, the age group of 15 to 17 year olds has the lowest likelihood of being enrolled in a private school, with 69 (100.0% in the age bracket) attending a public institution.
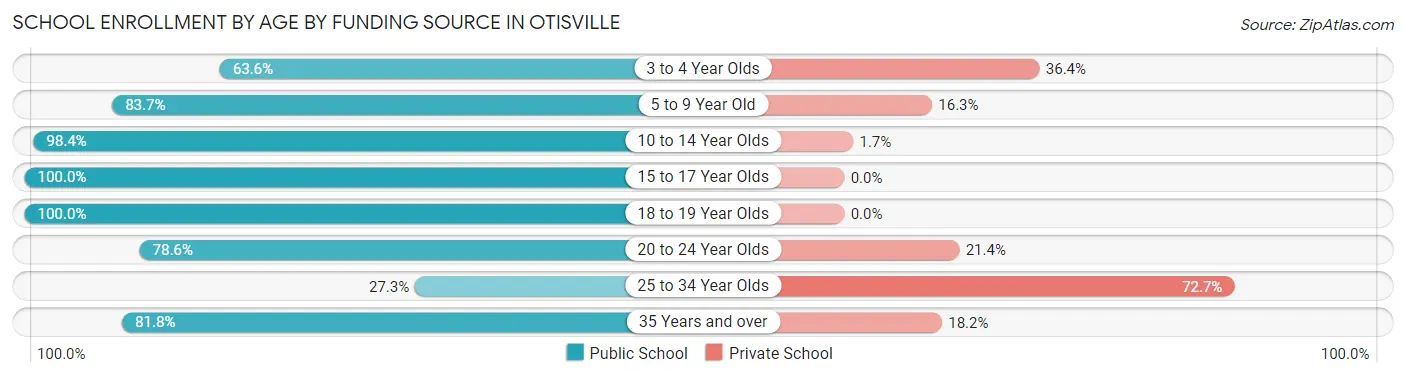
| Age Bracket | Public School | Private School |
| 3 to 4 Year Olds | 7 (63.6%) | 4 (36.4%) |
| 5 to 9 Year Old | 82 (83.7%) | 16 (16.3%) |
| 10 to 14 Year Olds | 179 (98.4%) | 3 (1.7%) |
| 15 to 17 Year Olds | 69 (100.0%) | 0 (0.0%) |
| 18 to 19 Year Olds | 43 (100.0%) | 0 (0.0%) |
| 20 to 24 Year Olds | 11 (78.6%) | 3 (21.4%) |
| 25 to 34 Year Olds | 3 (27.3%) | 8 (72.7%) |
| 35 Years and over | 9 (81.8%) | 2 (18.2%) |
| Total | 403 (91.8%) | 36 (8.2%) |
Educational Attainment by Field of Study in Otisville
Education (58 | 21.7%), arts & humanities (47 | 17.6%), science & technology (34 | 12.7%), business (24 | 9.0%), and social sciences (22 | 8.2%) are the most common fields of study among 267 individuals in Otisville who have obtained a bachelor's degree or higher.
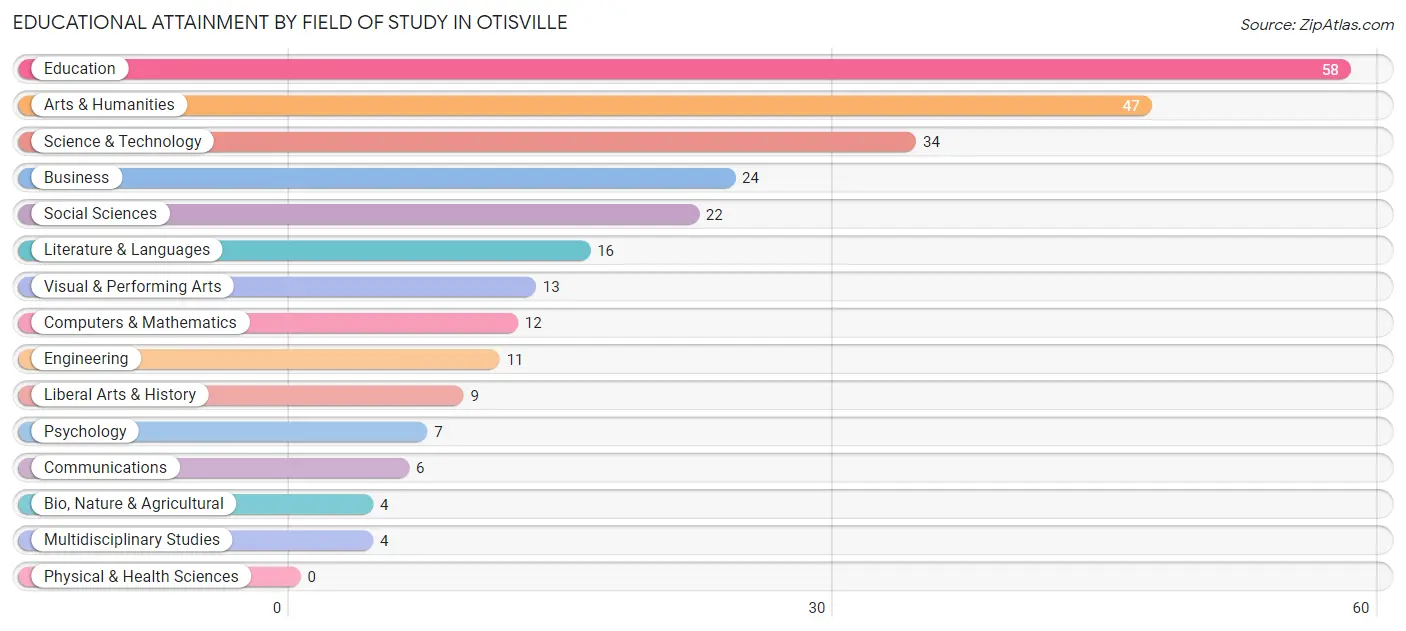
| Field of Study | # Graduates | % Graduates |
| Computers & Mathematics | 12 | 4.5% |
| Bio, Nature & Agricultural | 4 | 1.5% |
| Physical & Health Sciences | 0 | 0.0% |
| Psychology | 7 | 2.6% |
| Social Sciences | 22 | 8.2% |
| Engineering | 11 | 4.1% |
| Multidisciplinary Studies | 4 | 1.5% |
| Science & Technology | 34 | 12.7% |
| Business | 24 | 9.0% |
| Education | 58 | 21.7% |
| Literature & Languages | 16 | 6.0% |
| Liberal Arts & History | 9 | 3.4% |
| Visual & Performing Arts | 13 | 4.9% |
| Communications | 6 | 2.2% |
| Arts & Humanities | 47 | 17.6% |
| Total | 267 | 100.0% |
Transportation & Commute in Otisville
Vehicle Availability by Sex in Otisville
The most prevalent vehicle ownership categories in Otisville are males with 2 vehicles (182, accounting for 55.7%) and females with 2 vehicles (84, making up 82.4%).
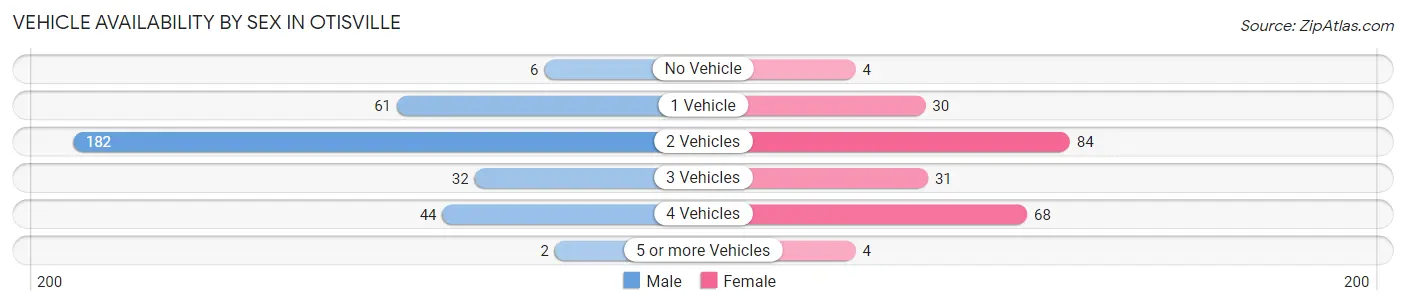
| Vehicles Available | Male | Female |
| No Vehicle | 6 (1.8%) | 4 (1.8%) |
| 1 Vehicle | 61 (18.6%) | 30 (13.6%) |
| 2 Vehicles | 182 (55.7%) | 84 (38.0%) |
| 3 Vehicles | 32 (9.8%) | 31 (14.0%) |
| 4 Vehicles | 44 (13.5%) | 68 (30.8%) |
| 5 or more Vehicles | 2 (0.6%) | 4 (1.8%) |
| Total | 327 (100.0%) | 221 (100.0%) |
Commute Time in Otisville
The most frequently occuring commute durations in Otisville are 45 to 59 minutes (82 commuters, 16.1%), 90 or more minutes (64 commuters, 12.6%), and 15 to 19 minutes (61 commuters, 12.0%).
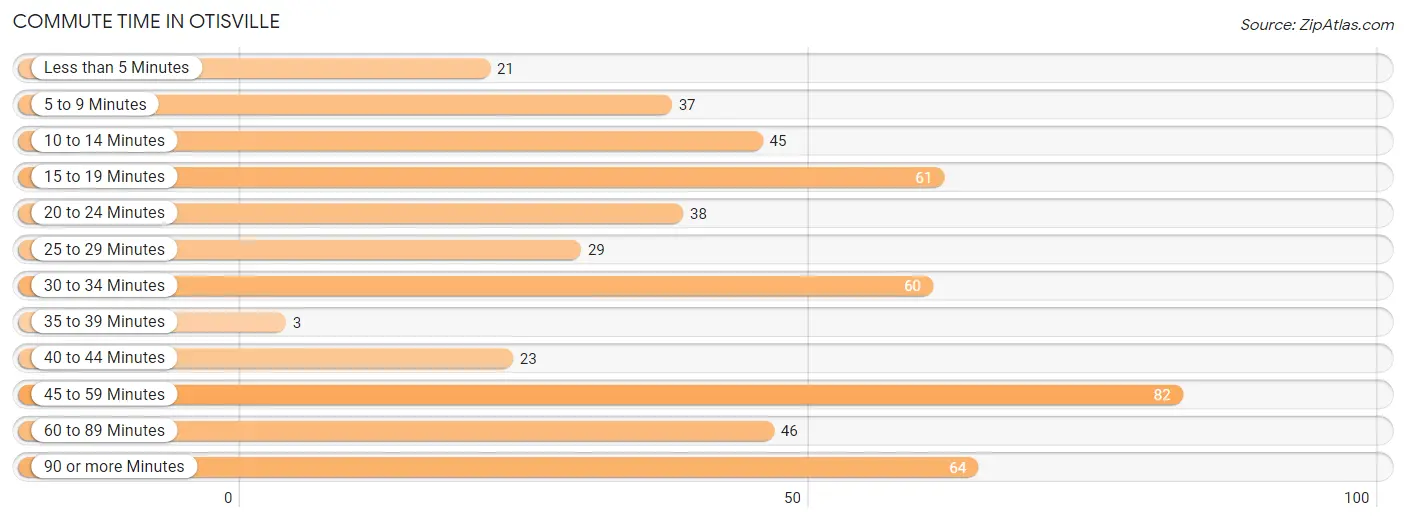
| Commute Time | # Commuters | % Commuters |
| Less than 5 Minutes | 21 | 4.1% |
| 5 to 9 Minutes | 37 | 7.3% |
| 10 to 14 Minutes | 45 | 8.8% |
| 15 to 19 Minutes | 61 | 12.0% |
| 20 to 24 Minutes | 38 | 7.5% |
| 25 to 29 Minutes | 29 | 5.7% |
| 30 to 34 Minutes | 60 | 11.8% |
| 35 to 39 Minutes | 3 | 0.6% |
| 40 to 44 Minutes | 23 | 4.5% |
| 45 to 59 Minutes | 82 | 16.1% |
| 60 to 89 Minutes | 46 | 9.0% |
| 90 or more Minutes | 64 | 12.6% |
Commute Time by Sex in Otisville
The most common commute times in Otisville are 45 to 59 minutes (76 commuters, 24.5%) for males and 30 to 34 minutes (50 commuters, 25.1%) for females.
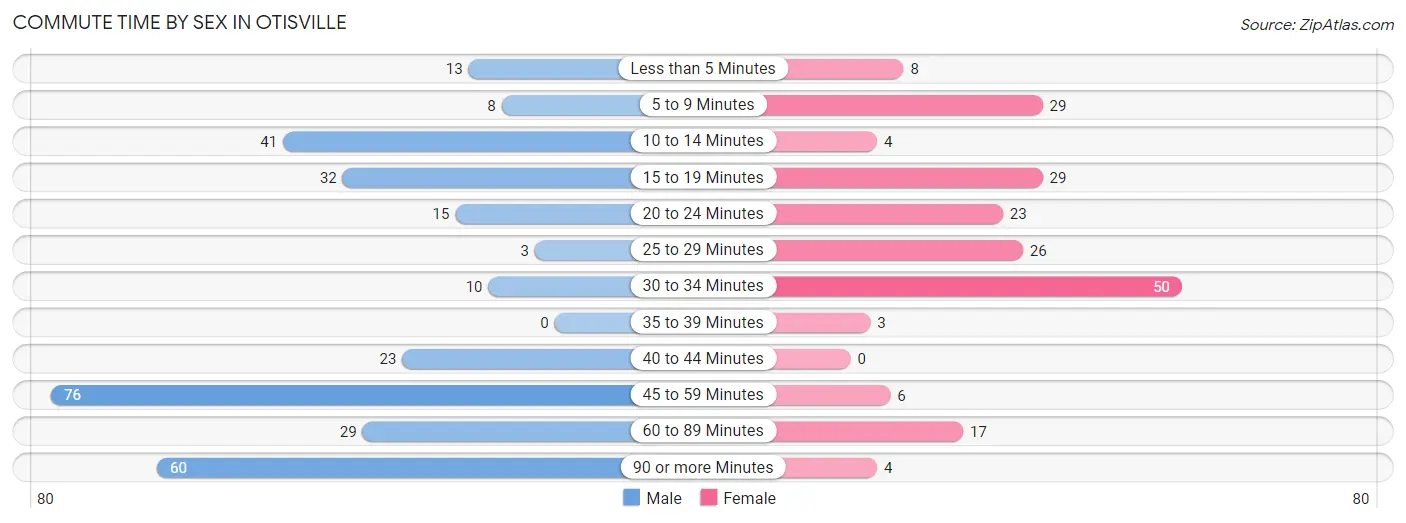
| Commute Time | Male | Female |
| Less than 5 Minutes | 13 (4.2%) | 8 (4.0%) |
| 5 to 9 Minutes | 8 (2.6%) | 29 (14.6%) |
| 10 to 14 Minutes | 41 (13.2%) | 4 (2.0%) |
| 15 to 19 Minutes | 32 (10.3%) | 29 (14.6%) |
| 20 to 24 Minutes | 15 (4.8%) | 23 (11.6%) |
| 25 to 29 Minutes | 3 (1.0%) | 26 (13.1%) |
| 30 to 34 Minutes | 10 (3.2%) | 50 (25.1%) |
| 35 to 39 Minutes | 0 (0.0%) | 3 (1.5%) |
| 40 to 44 Minutes | 23 (7.4%) | 0 (0.0%) |
| 45 to 59 Minutes | 76 (24.5%) | 6 (3.0%) |
| 60 to 89 Minutes | 29 (9.3%) | 17 (8.5%) |
| 90 or more Minutes | 60 (19.4%) | 4 (2.0%) |
Time of Departure to Work by Sex in Otisville
The most frequent times of departure to work in Otisville are 12:00 AM to 4:59 AM (59, 19.0%) for males and 8:00 AM to 8:29 AM (48, 24.1%) for females.
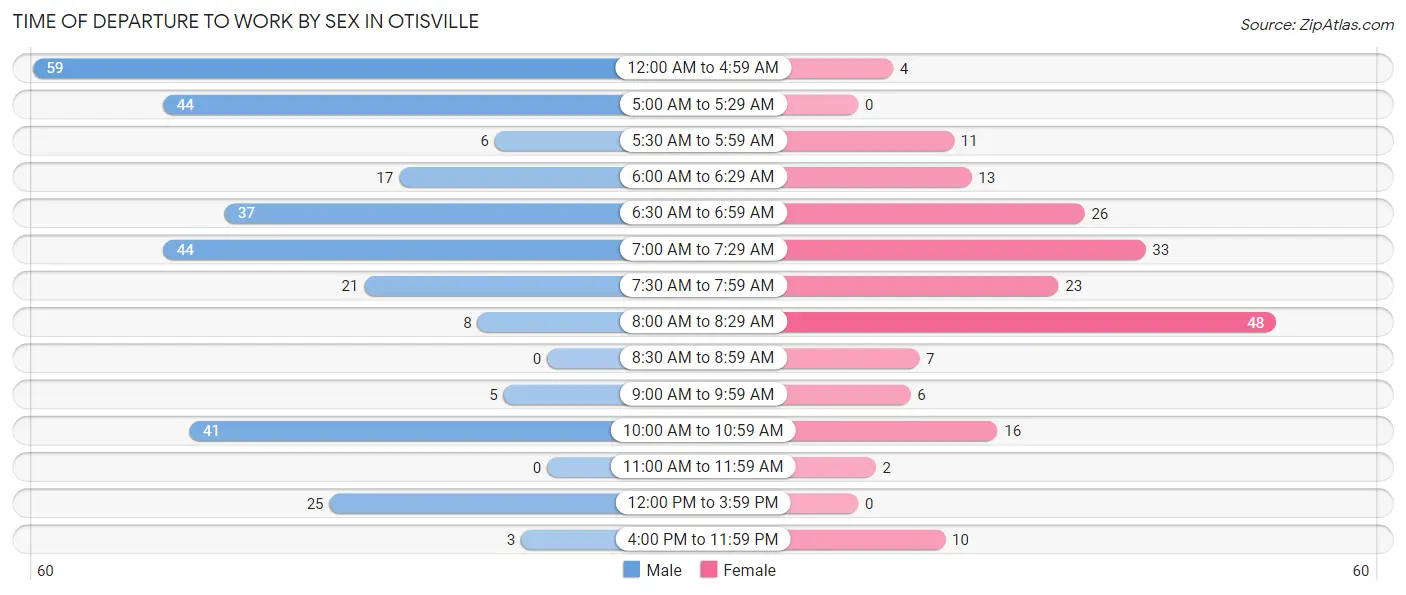
| Time of Departure | Male | Female |
| 12:00 AM to 4:59 AM | 59 (19.0%) | 4 (2.0%) |
| 5:00 AM to 5:29 AM | 44 (14.2%) | 0 (0.0%) |
| 5:30 AM to 5:59 AM | 6 (1.9%) | 11 (5.5%) |
| 6:00 AM to 6:29 AM | 17 (5.5%) | 13 (6.5%) |
| 6:30 AM to 6:59 AM | 37 (11.9%) | 26 (13.1%) |
| 7:00 AM to 7:29 AM | 44 (14.2%) | 33 (16.6%) |
| 7:30 AM to 7:59 AM | 21 (6.8%) | 23 (11.6%) |
| 8:00 AM to 8:29 AM | 8 (2.6%) | 48 (24.1%) |
| 8:30 AM to 8:59 AM | 0 (0.0%) | 7 (3.5%) |
| 9:00 AM to 9:59 AM | 5 (1.6%) | 6 (3.0%) |
| 10:00 AM to 10:59 AM | 41 (13.2%) | 16 (8.0%) |
| 11:00 AM to 11:59 AM | 0 (0.0%) | 2 (1.0%) |
| 12:00 PM to 3:59 PM | 25 (8.1%) | 0 (0.0%) |
| 4:00 PM to 11:59 PM | 3 (1.0%) | 10 (5.0%) |
| Total | 310 (100.0%) | 199 (100.0%) |
Housing Occupancy in Otisville
Occupancy by Ownership in Otisville
Of the total 486 dwellings in Otisville, owner-occupied units account for 282 (58.0%), while renter-occupied units make up 204 (42.0%).
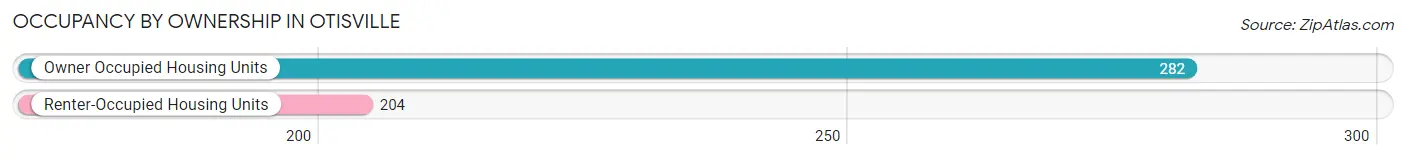
| Occupancy | # Housing Units | % Housing Units |
| Owner Occupied Housing Units | 282 | 58.0% |
| Renter-Occupied Housing Units | 204 | 42.0% |
| Total Occupied Housing Units | 486 | 100.0% |
Occupancy by Household Size in Otisville
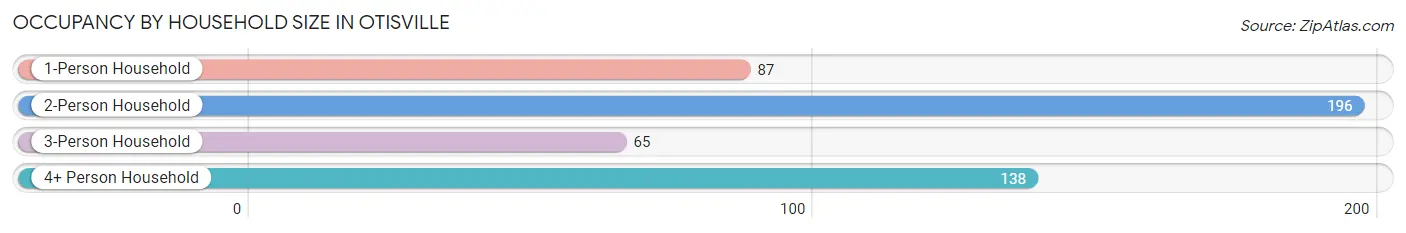
| Household Size | # Housing Units | % Housing Units |
| 1-Person Household | 87 | 17.9% |
| 2-Person Household | 196 | 40.3% |
| 3-Person Household | 65 | 13.4% |
| 4+ Person Household | 138 | 28.4% |
| Total Housing Units | 486 | 100.0% |
Occupancy by Ownership by Household Size in Otisville
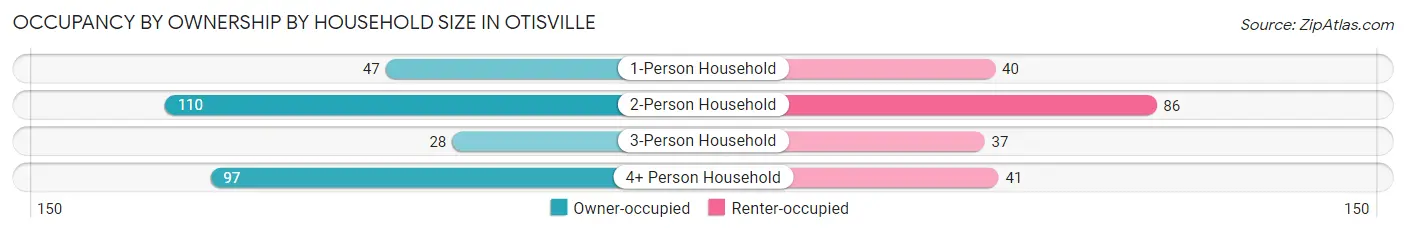
| Household Size | Owner-occupied | Renter-occupied |
| 1-Person Household | 47 (54.0%) | 40 (46.0%) |
| 2-Person Household | 110 (56.1%) | 86 (43.9%) |
| 3-Person Household | 28 (43.1%) | 37 (56.9%) |
| 4+ Person Household | 97 (70.3%) | 41 (29.7%) |
| Total Housing Units | 282 (58.0%) | 204 (42.0%) |
Occupancy by Educational Attainment in Otisville
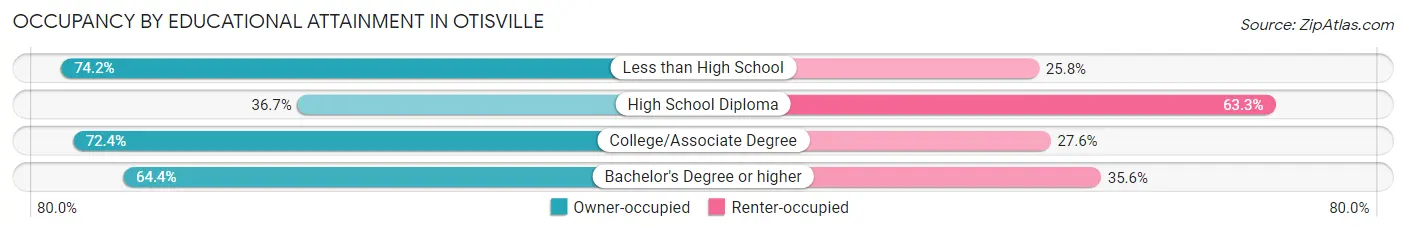
| Household Size | Owner-occupied | Renter-occupied |
| Less than High School | 23 (74.2%) | 8 (25.8%) |
| High School Diploma | 58 (36.7%) | 100 (63.3%) |
| College/Associate Degree | 89 (72.4%) | 34 (27.6%) |
| Bachelor's Degree or higher | 112 (64.4%) | 62 (35.6%) |
Occupancy by Age of Householder in Otisville
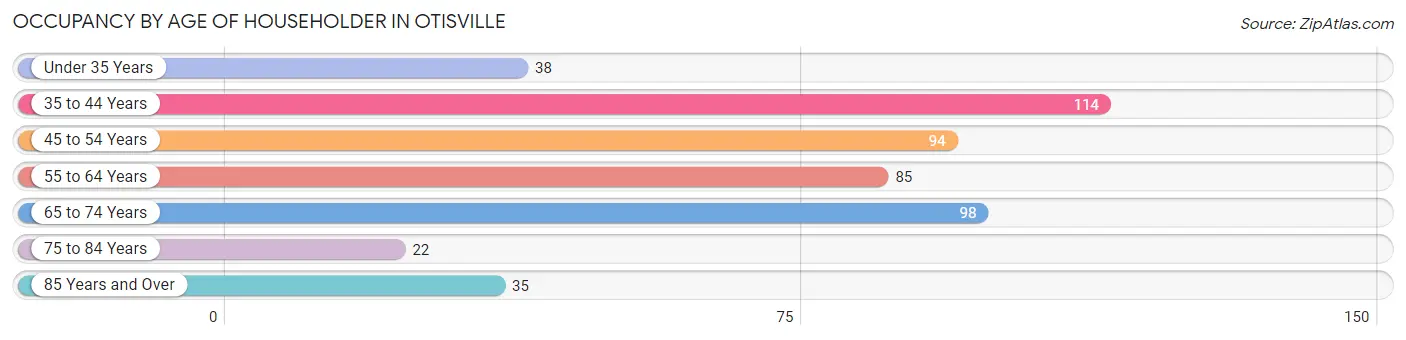
| Age Bracket | # Households | % Households |
| Under 35 Years | 38 | 7.8% |
| 35 to 44 Years | 114 | 23.5% |
| 45 to 54 Years | 94 | 19.3% |
| 55 to 64 Years | 85 | 17.5% |
| 65 to 74 Years | 98 | 20.2% |
| 75 to 84 Years | 22 | 4.5% |
| 85 Years and Over | 35 | 7.2% |
| Total | 486 | 100.0% |
Housing Finances in Otisville
Median Income by Occupancy in Otisville
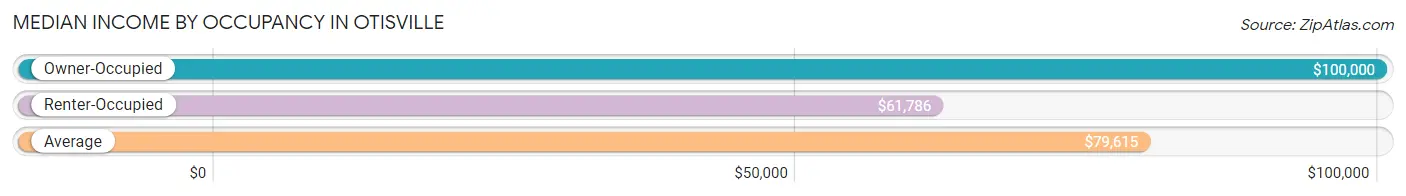
| Occupancy Type | # Households | Median Income |
| Owner-Occupied | 282 (58.0%) | $100,000 |
| Renter-Occupied | 204 (42.0%) | $61,786 |
| Average | 486 (100.0%) | $79,615 |
Occupancy by Householder Income Bracket in Otisville
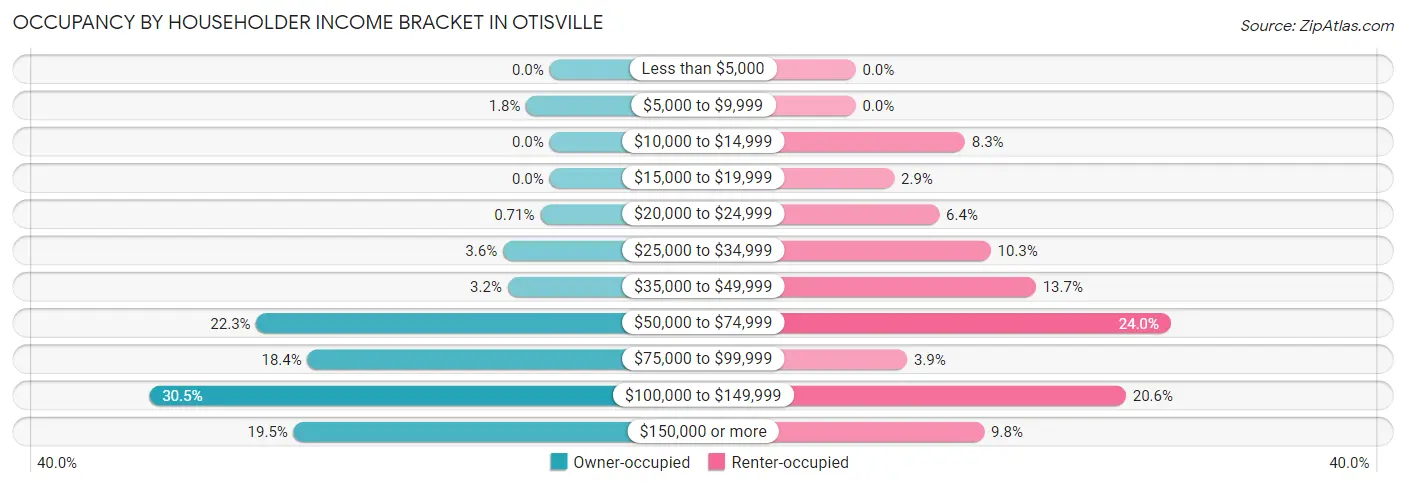
| Income Bracket | Owner-occupied | Renter-occupied |
| Less than $5,000 | 0 (0.0%) | 0 (0.0%) |
| $5,000 to $9,999 | 5 (1.8%) | 0 (0.0%) |
| $10,000 to $14,999 | 0 (0.0%) | 17 (8.3%) |
| $15,000 to $19,999 | 0 (0.0%) | 6 (2.9%) |
| $20,000 to $24,999 | 2 (0.7%) | 13 (6.4%) |
| $25,000 to $34,999 | 10 (3.5%) | 21 (10.3%) |
| $35,000 to $49,999 | 9 (3.2%) | 28 (13.7%) |
| $50,000 to $74,999 | 63 (22.3%) | 49 (24.0%) |
| $75,000 to $99,999 | 52 (18.4%) | 8 (3.9%) |
| $100,000 to $149,999 | 86 (30.5%) | 42 (20.6%) |
| $150,000 or more | 55 (19.5%) | 20 (9.8%) |
| Total | 282 (100.0%) | 204 (100.0%) |
Monthly Housing Cost Tiers in Otisville
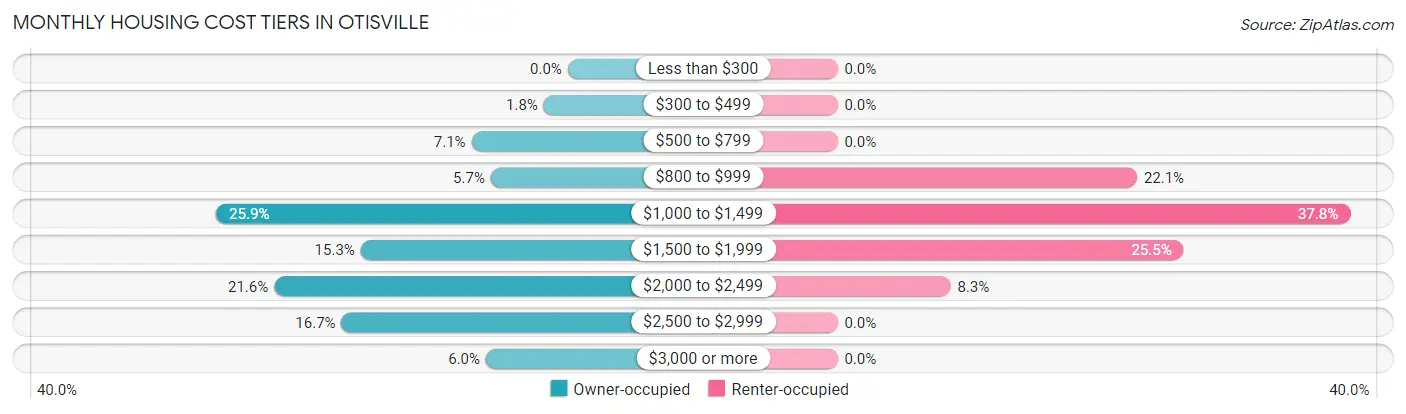
| Monthly Cost | Owner-occupied | Renter-occupied |
| Less than $300 | 0 (0.0%) | 0 (0.0%) |
| $300 to $499 | 5 (1.8%) | 0 (0.0%) |
| $500 to $799 | 20 (7.1%) | 0 (0.0%) |
| $800 to $999 | 16 (5.7%) | 45 (22.1%) |
| $1,000 to $1,499 | 73 (25.9%) | 77 (37.8%) |
| $1,500 to $1,999 | 43 (15.2%) | 52 (25.5%) |
| $2,000 to $2,499 | 61 (21.6%) | 17 (8.3%) |
| $2,500 to $2,999 | 47 (16.7%) | 0 (0.0%) |
| $3,000 or more | 17 (6.0%) | 0 (0.0%) |
| Total | 282 (100.0%) | 204 (100.0%) |
Physical Housing Characteristics in Otisville
Housing Structures in Otisville
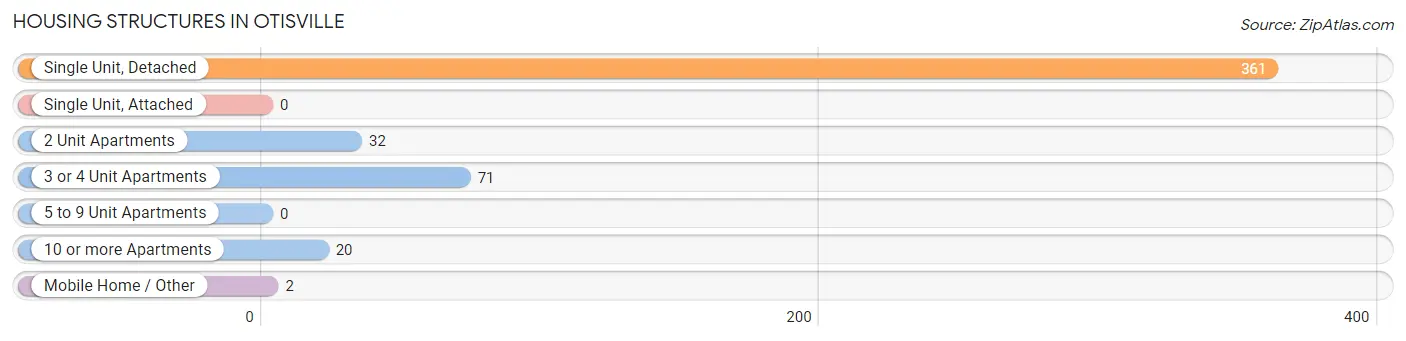
| Structure Type | # Housing Units | % Housing Units |
| Single Unit, Detached | 361 | 74.3% |
| Single Unit, Attached | 0 | 0.0% |
| 2 Unit Apartments | 32 | 6.6% |
| 3 or 4 Unit Apartments | 71 | 14.6% |
| 5 to 9 Unit Apartments | 0 | 0.0% |
| 10 or more Apartments | 20 | 4.1% |
| Mobile Home / Other | 2 | 0.4% |
| Total | 486 | 100.0% |
Housing Structures by Occupancy in Otisville
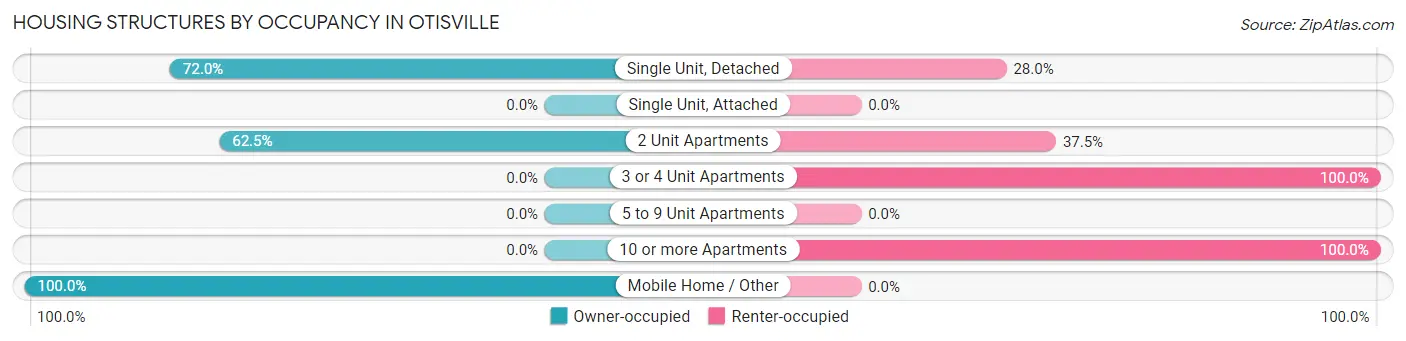
| Structure Type | Owner-occupied | Renter-occupied |
| Single Unit, Detached | 260 (72.0%) | 101 (28.0%) |
| Single Unit, Attached | 0 (0.0%) | 0 (0.0%) |
| 2 Unit Apartments | 20 (62.5%) | 12 (37.5%) |
| 3 or 4 Unit Apartments | 0 (0.0%) | 71 (100.0%) |
| 5 to 9 Unit Apartments | 0 (0.0%) | 0 (0.0%) |
| 10 or more Apartments | 0 (0.0%) | 20 (100.0%) |
| Mobile Home / Other | 2 (100.0%) | 0 (0.0%) |
| Total | 282 (58.0%) | 204 (42.0%) |
Housing Structures by Number of Rooms in Otisville
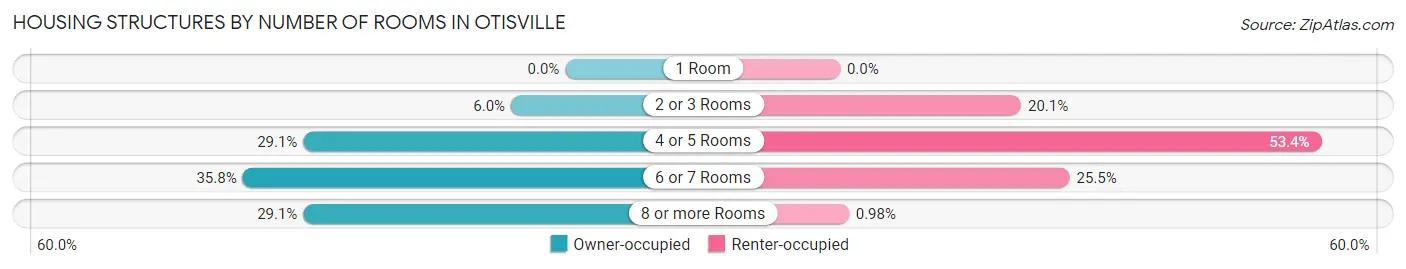
| Number of Rooms | Owner-occupied | Renter-occupied |
| 1 Room | 0 (0.0%) | 0 (0.0%) |
| 2 or 3 Rooms | 17 (6.0%) | 41 (20.1%) |
| 4 or 5 Rooms | 82 (29.1%) | 109 (53.4%) |
| 6 or 7 Rooms | 101 (35.8%) | 52 (25.5%) |
| 8 or more Rooms | 82 (29.1%) | 2 (1.0%) |
| Total | 282 (100.0%) | 204 (100.0%) |
Housing Structure by Heating Type in Otisville
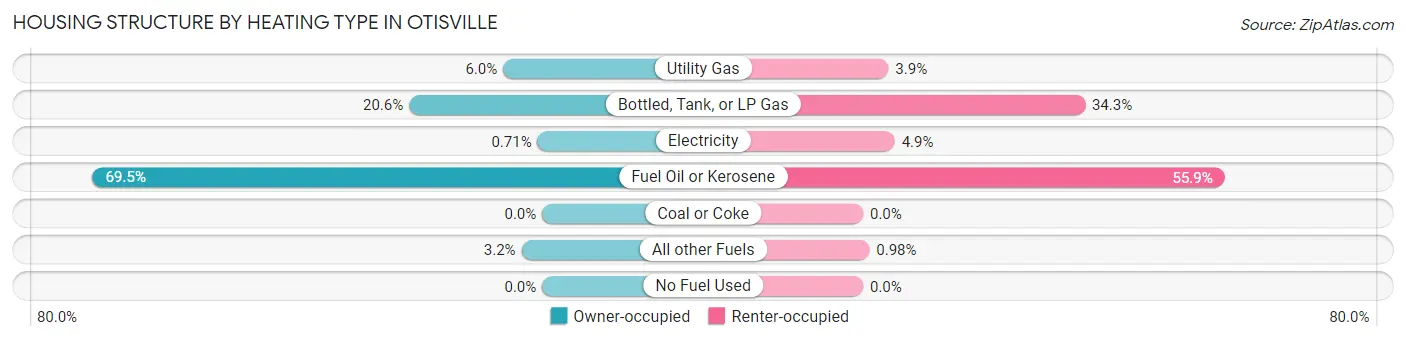
| Heating Type | Owner-occupied | Renter-occupied |
| Utility Gas | 17 (6.0%) | 8 (3.9%) |
| Bottled, Tank, or LP Gas | 58 (20.6%) | 70 (34.3%) |
| Electricity | 2 (0.7%) | 10 (4.9%) |
| Fuel Oil or Kerosene | 196 (69.5%) | 114 (55.9%) |
| Coal or Coke | 0 (0.0%) | 0 (0.0%) |
| All other Fuels | 9 (3.2%) | 2 (1.0%) |
| No Fuel Used | 0 (0.0%) | 0 (0.0%) |
| Total | 282 (100.0%) | 204 (100.0%) |
Household Vehicle Usage in Otisville
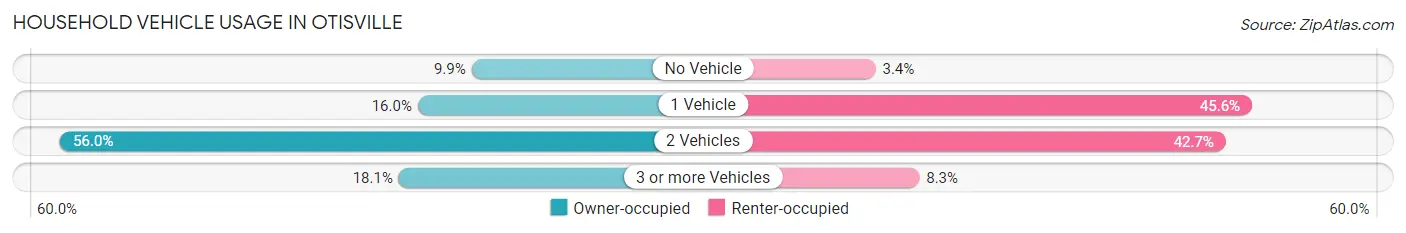
| Vehicles per Household | Owner-occupied | Renter-occupied |
| No Vehicle | 28 (9.9%) | 7 (3.4%) |
| 1 Vehicle | 45 (16.0%) | 93 (45.6%) |
| 2 Vehicles | 158 (56.0%) | 87 (42.6%) |
| 3 or more Vehicles | 51 (18.1%) | 17 (8.3%) |
| Total | 282 (100.0%) | 204 (100.0%) |
Real Estate & Mortgages in Otisville
Real Estate and Mortgage Overview in Otisville
| Characteristic | Without Mortgage | With Mortgage |
| Housing Units | 79 | 203 |
| Median Property Value | $218,500 | $277,600 |
| Median Household Income | $77,708 | $46 |
| Monthly Housing Costs | $981 | $17 |
| Real Estate Taxes | $6,250 | $27 |
Property Value by Mortgage Status in Otisville
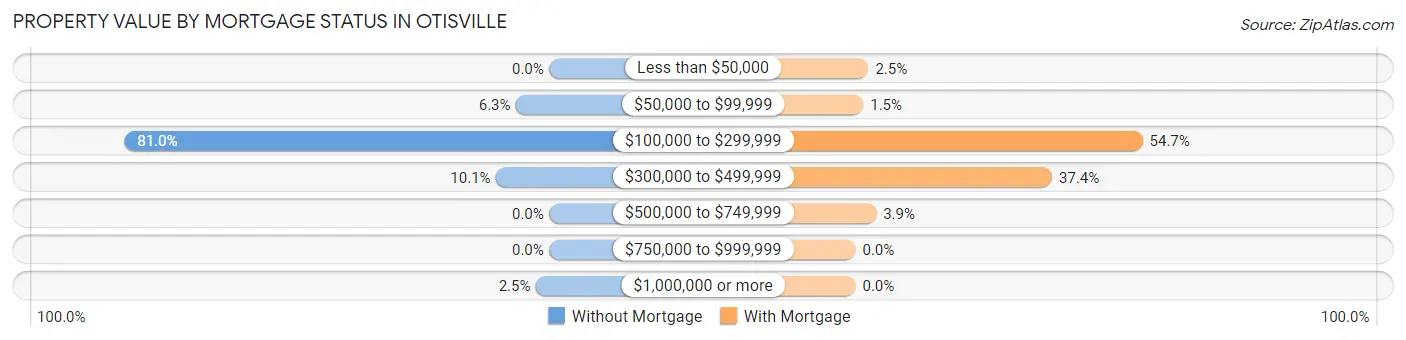
| Property Value | Without Mortgage | With Mortgage |
| Less than $50,000 | 0 (0.0%) | 5 (2.5%) |
| $50,000 to $99,999 | 5 (6.3%) | 3 (1.5%) |
| $100,000 to $299,999 | 64 (81.0%) | 111 (54.7%) |
| $300,000 to $499,999 | 8 (10.1%) | 76 (37.4%) |
| $500,000 to $749,999 | 0 (0.0%) | 8 (3.9%) |
| $750,000 to $999,999 | 0 (0.0%) | 0 (0.0%) |
| $1,000,000 or more | 2 (2.5%) | 0 (0.0%) |
| Total | 79 (100.0%) | 203 (100.0%) |
Household Income by Mortgage Status in Otisville
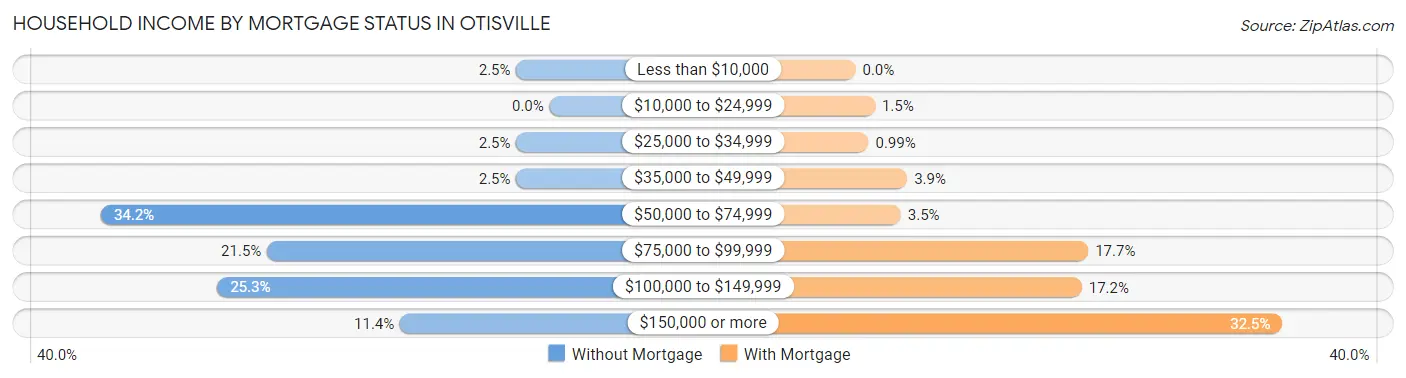
| Household Income | Without Mortgage | With Mortgage |
| Less than $10,000 | 2 (2.5%) | 0 (0.0%) |
| $10,000 to $24,999 | 0 (0.0%) | 3 (1.5%) |
| $25,000 to $34,999 | 2 (2.5%) | 2 (1.0%) |
| $35,000 to $49,999 | 2 (2.5%) | 8 (3.9%) |
| $50,000 to $74,999 | 27 (34.2%) | 7 (3.5%) |
| $75,000 to $99,999 | 17 (21.5%) | 36 (17.7%) |
| $100,000 to $149,999 | 20 (25.3%) | 35 (17.2%) |
| $150,000 or more | 9 (11.4%) | 66 (32.5%) |
| Total | 79 (100.0%) | 203 (100.0%) |
Property Value to Household Income Ratio in Otisville
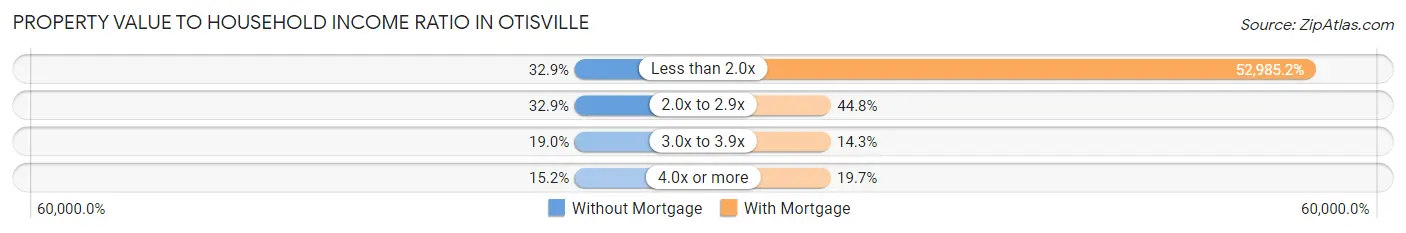
| Value-to-Income Ratio | Without Mortgage | With Mortgage |
| Less than 2.0x | 26 (32.9%) | 107,560 (52,985.2%) |
| 2.0x to 2.9x | 26 (32.9%) | 91 (44.8%) |
| 3.0x to 3.9x | 15 (19.0%) | 29 (14.3%) |
| 4.0x or more | 12 (15.2%) | 40 (19.7%) |
| Total | 79 (100.0%) | 203 (100.0%) |
Real Estate Taxes by Mortgage Status in Otisville
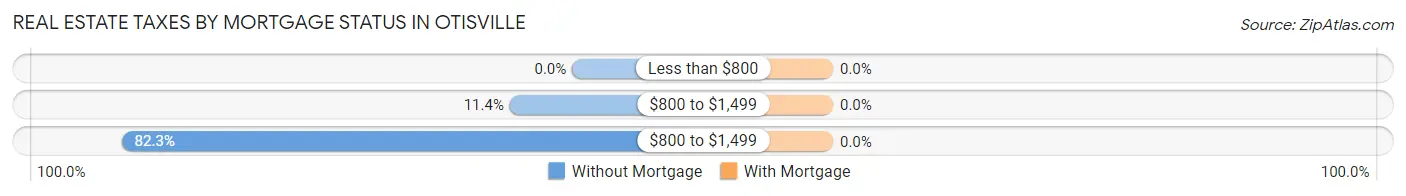
| Property Taxes | Without Mortgage | With Mortgage |
| Less than $800 | 0 (0.0%) | 0 (0.0%) |
| $800 to $1,499 | 9 (11.4%) | 0 (0.0%) |
| $800 to $1,499 | 65 (82.3%) | 0 (0.0%) |
| Total | 79 (100.0%) | 203 (100.0%) |
Health & Disability in Otisville
Health Insurance Coverage by Age in Otisville
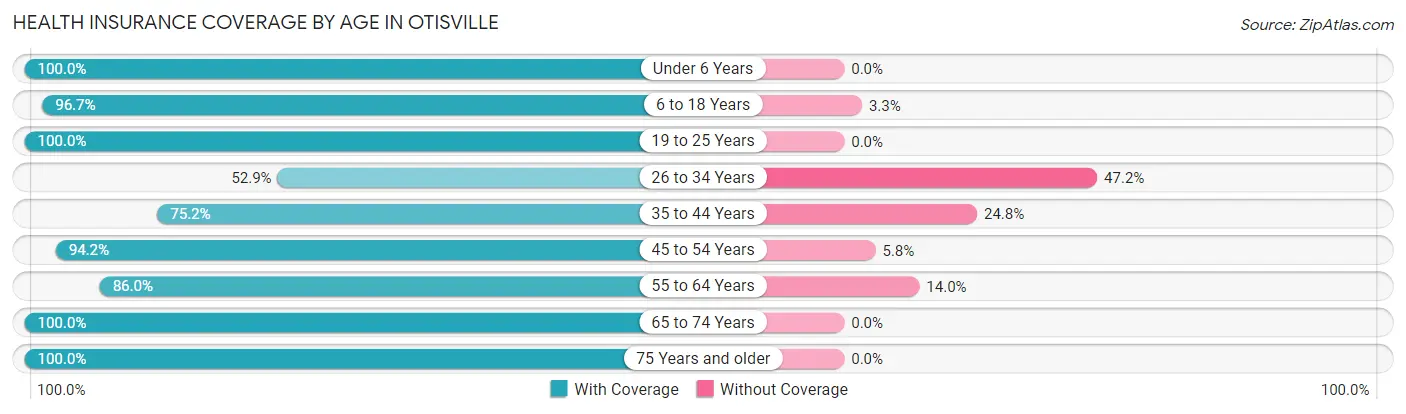
| Age Bracket | With Coverage | Without Coverage |
| Under 6 Years | 97 (100.0%) | 0 (0.0%) |
| 6 to 18 Years | 352 (96.7%) | 12 (3.3%) |
| 19 to 25 Years | 43 (100.0%) | 0 (0.0%) |
| 26 to 34 Years | 102 (52.8%) | 91 (47.1%) |
| 35 to 44 Years | 158 (75.2%) | 52 (24.8%) |
| 45 to 54 Years | 113 (94.2%) | 7 (5.8%) |
| 55 to 64 Years | 135 (86.0%) | 22 (14.0%) |
| 65 to 74 Years | 176 (100.0%) | 0 (0.0%) |
| 75 Years and older | 71 (100.0%) | 0 (0.0%) |
| Total | 1,247 (87.1%) | 184 (12.9%) |
Health Insurance Coverage by Citizenship Status in Otisville
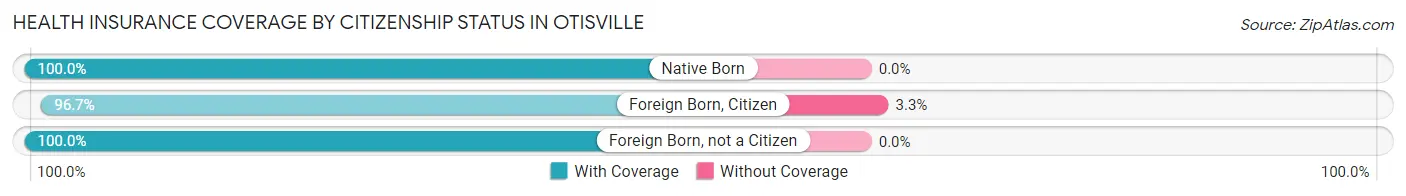
| Citizenship Status | With Coverage | Without Coverage |
| Native Born | 97 (100.0%) | 0 (0.0%) |
| Foreign Born, Citizen | 352 (96.7%) | 12 (3.3%) |
| Foreign Born, not a Citizen | 43 (100.0%) | 0 (0.0%) |
Health Insurance Coverage by Household Income in Otisville
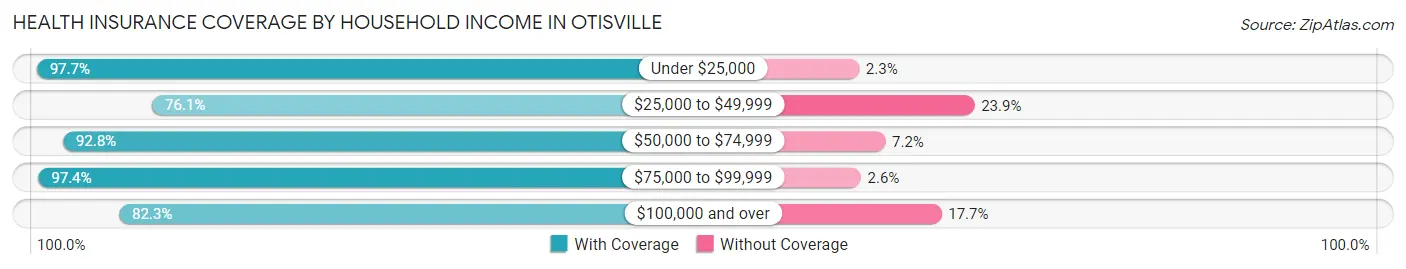
| Household Income | With Coverage | Without Coverage |
| Under $25,000 | 129 (97.7%) | 3 (2.3%) |
| $25,000 to $49,999 | 102 (76.1%) | 32 (23.9%) |
| $50,000 to $74,999 | 194 (92.8%) | 15 (7.2%) |
| $75,000 to $99,999 | 227 (97.4%) | 6 (2.6%) |
| $100,000 and over | 595 (82.3%) | 128 (17.7%) |
Public vs Private Health Insurance Coverage by Age in Otisville
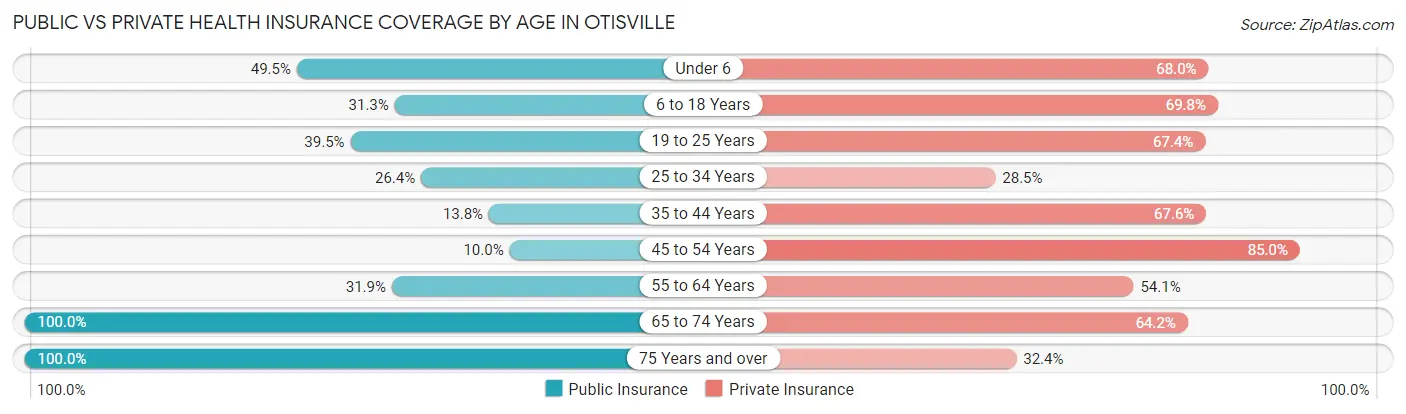
| Age Bracket | Public Insurance | Private Insurance |
| Under 6 | 48 (49.5%) | 66 (68.0%) |
| 6 to 18 Years | 114 (31.3%) | 254 (69.8%) |
| 19 to 25 Years | 17 (39.5%) | 29 (67.4%) |
| 25 to 34 Years | 51 (26.4%) | 55 (28.5%) |
| 35 to 44 Years | 29 (13.8%) | 142 (67.6%) |
| 45 to 54 Years | 12 (10.0%) | 102 (85.0%) |
| 55 to 64 Years | 50 (31.9%) | 85 (54.1%) |
| 65 to 74 Years | 176 (100.0%) | 113 (64.2%) |
| 75 Years and over | 71 (100.0%) | 23 (32.4%) |
| Total | 568 (39.7%) | 869 (60.7%) |
Disability Status by Sex by Age in Otisville
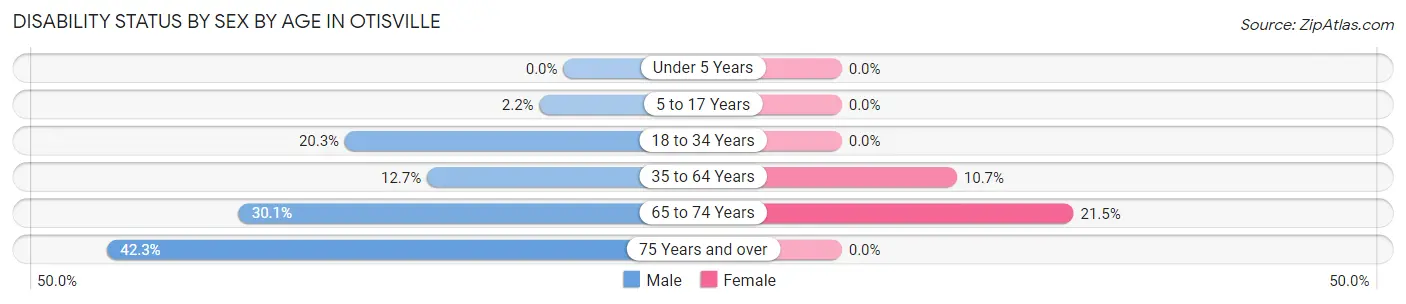
| Age Bracket | Male | Female |
| Under 5 Years | 0 (0.0%) | 0 (0.0%) |
| 5 to 17 Years | 4 (2.2%) | 0 (0.0%) |
| 18 to 34 Years | 30 (20.3%) | 0 (0.0%) |
| 35 to 64 Years | 32 (12.7%) | 25 (10.7%) |
| 65 to 74 Years | 25 (30.1%) | 20 (21.5%) |
| 75 Years and over | 11 (42.3%) | 0 (0.0%) |
Disability Class by Sex by Age in Otisville
Disability Class: Hearing Difficulty
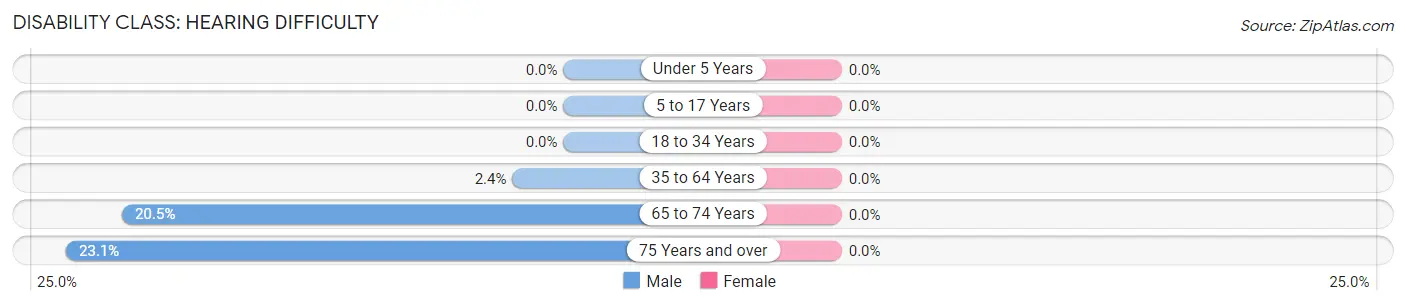
| Age Bracket | Male | Female |
| Under 5 Years | 0 (0.0%) | 0 (0.0%) |
| 5 to 17 Years | 0 (0.0%) | 0 (0.0%) |
| 18 to 34 Years | 0 (0.0%) | 0 (0.0%) |
| 35 to 64 Years | 6 (2.4%) | 0 (0.0%) |
| 65 to 74 Years | 17 (20.5%) | 0 (0.0%) |
| 75 Years and over | 6 (23.1%) | 0 (0.0%) |
Disability Class: Vision Difficulty
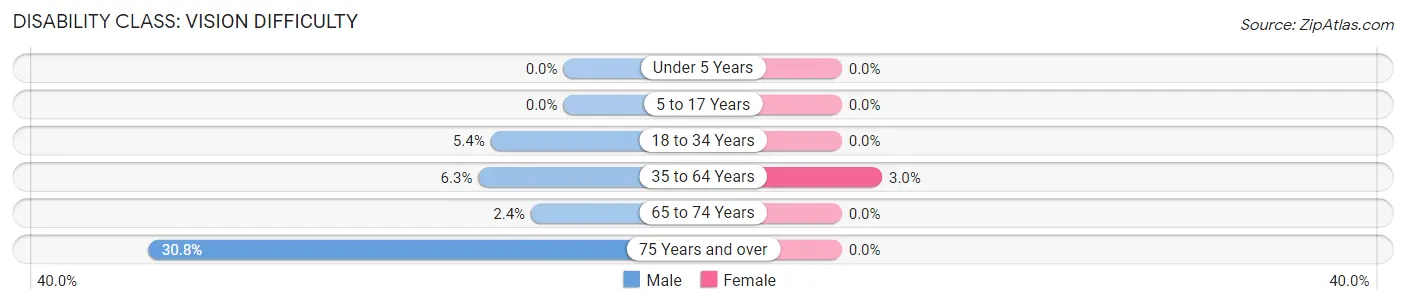
| Age Bracket | Male | Female |
| Under 5 Years | 0 (0.0%) | 0 (0.0%) |
| 5 to 17 Years | 0 (0.0%) | 0 (0.0%) |
| 18 to 34 Years | 8 (5.4%) | 0 (0.0%) |
| 35 to 64 Years | 16 (6.3%) | 7 (3.0%) |
| 65 to 74 Years | 2 (2.4%) | 0 (0.0%) |
| 75 Years and over | 8 (30.8%) | 0 (0.0%) |
Disability Class: Cognitive Difficulty
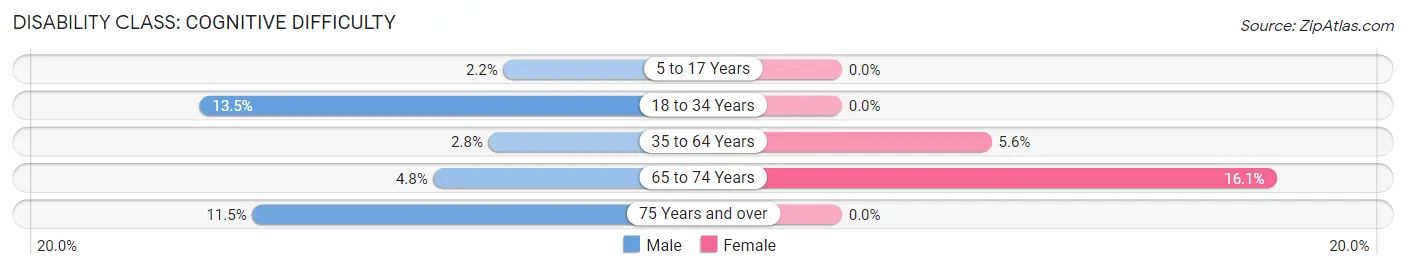
| Age Bracket | Male | Female |
| 5 to 17 Years | 4 (2.2%) | 0 (0.0%) |
| 18 to 34 Years | 20 (13.5%) | 0 (0.0%) |
| 35 to 64 Years | 7 (2.8%) | 13 (5.6%) |
| 65 to 74 Years | 4 (4.8%) | 15 (16.1%) |
| 75 Years and over | 3 (11.5%) | 0 (0.0%) |
Disability Class: Ambulatory Difficulty
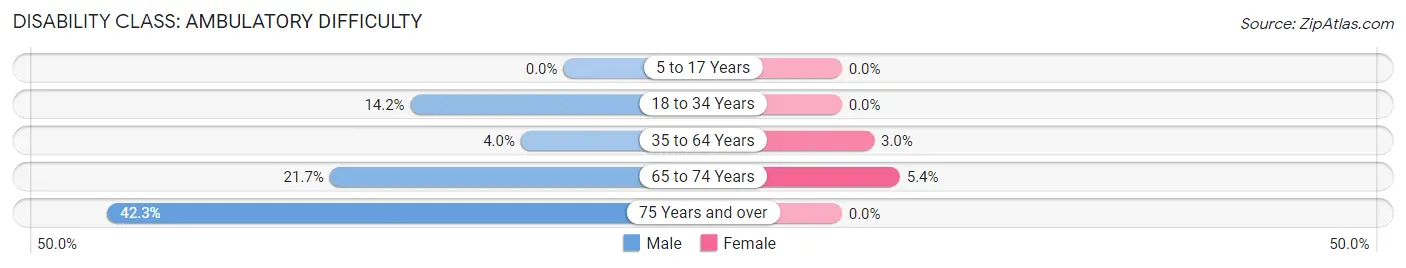
| Age Bracket | Male | Female |
| 5 to 17 Years | 0 (0.0%) | 0 (0.0%) |
| 18 to 34 Years | 21 (14.2%) | 0 (0.0%) |
| 35 to 64 Years | 10 (4.0%) | 7 (3.0%) |
| 65 to 74 Years | 18 (21.7%) | 5 (5.4%) |
| 75 Years and over | 11 (42.3%) | 0 (0.0%) |
Disability Class: Self-Care Difficulty
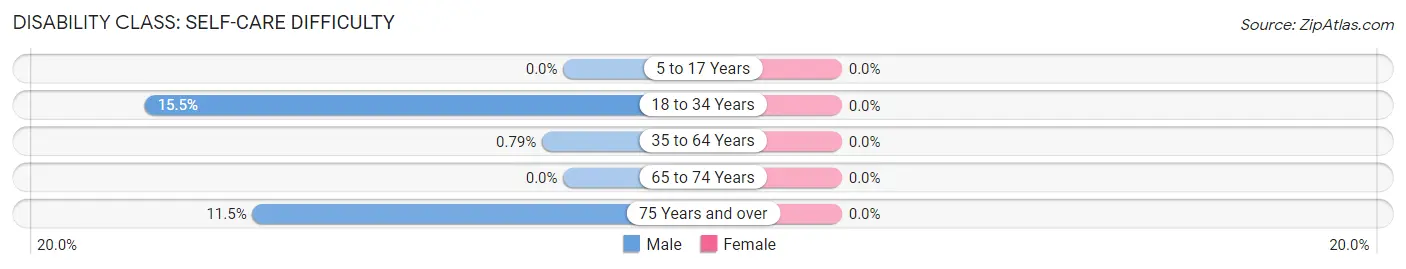
| Age Bracket | Male | Female |
| 5 to 17 Years | 0 (0.0%) | 0 (0.0%) |
| 18 to 34 Years | 23 (15.5%) | 0 (0.0%) |
| 35 to 64 Years | 2 (0.8%) | 0 (0.0%) |
| 65 to 74 Years | 0 (0.0%) | 0 (0.0%) |
| 75 Years and over | 3 (11.5%) | 0 (0.0%) |
Technology Access in Otisville
Computing Device Access in Otisville
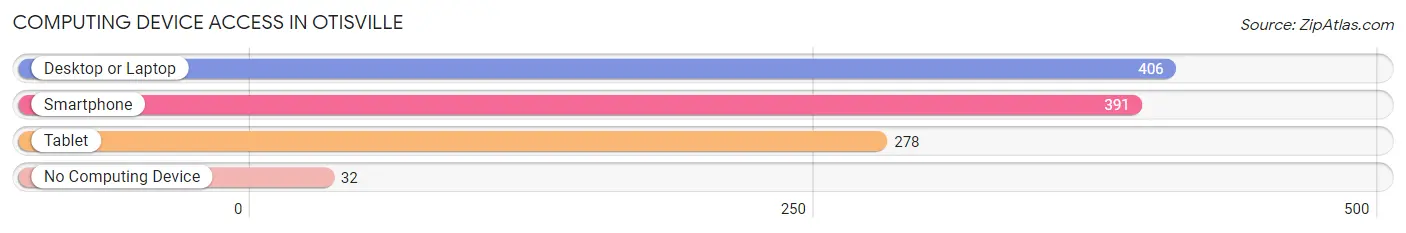
| Device Type | # Households | % Households |
| Desktop or Laptop | 406 | 83.5% |
| Smartphone | 391 | 80.4% |
| Tablet | 278 | 57.2% |
| No Computing Device | 32 | 6.6% |
| Total | 486 | 100.0% |
Internet Access in Otisville
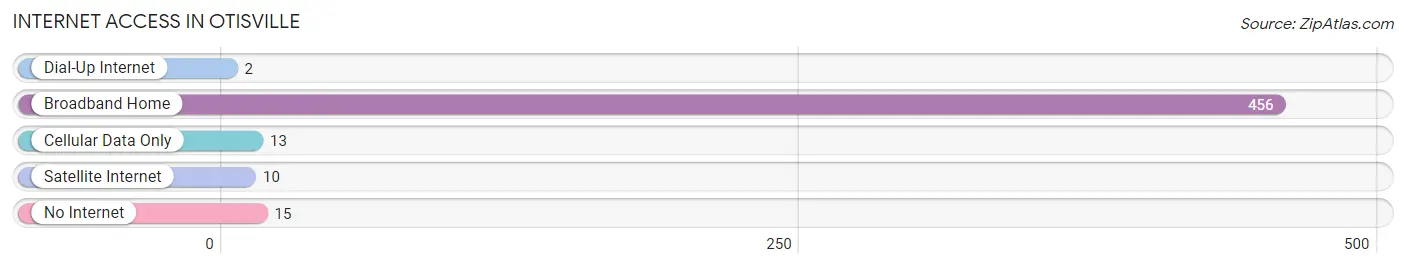
| Internet Type | # Households | % Households |
| Dial-Up Internet | 2 | 0.4% |
| Broadband Home | 456 | 93.8% |
| Cellular Data Only | 13 | 2.7% |
| Satellite Internet | 10 | 2.1% |
| No Internet | 15 | 3.1% |
| Total | 486 | 100.0% |
Otisville Summary
Otisville is a hamlet located in the Town of Mount Hope in Orange County, New York. It is situated in the foothills of the Shawangunk Mountains, approximately 50 miles northwest of New York City. The hamlet is home to a population of approximately 1,500 people and is known for its rural charm and small-town atmosphere.
History
Otisville was first settled in the late 1700s by the Otis family, who were among the first settlers in the area. The hamlet was originally known as “Otisville Corners” and was later renamed “Otisville” in 1845. The hamlet was officially incorporated in 1848.
In the late 1800s, Otisville was a thriving agricultural community, with many farms and orchards in the area. The hamlet was also home to several small businesses, including a blacksmith shop, a general store, and a grist mill.
In the early 1900s, Otisville began to experience a period of growth and development. The hamlet was home to several factories, including a brickyard, a tannery, and a furniture factory. The hamlet also had a post office, a bank, and a railroad station.
Geography
Otisville is located in the foothills of the Shawangunk Mountains in Orange County, New York. The hamlet is situated at an elevation of approximately 1,000 feet above sea level. The hamlet is bordered by the Town of Wallkill to the north, the Town of Wawayanda to the east, the Town of Mount Hope to the south, and the Town of Deerpark to the west.
The hamlet is located approximately 50 miles northwest of New York City and is accessible via Interstate 84 and U.S. Route 6. The hamlet is also served by the Otisville Station of the Metro-North Railroad.
Economy
Otisville’s economy is largely based on agriculture and tourism. The hamlet is home to several farms and orchards, as well as several wineries and breweries. The hamlet is also home to several small businesses, including restaurants, shops, and galleries.
The hamlet is also home to several manufacturing companies, including a furniture factory, a printing company, and a plastics factory. The hamlet is also home to several government offices, including a post office, a library, and a fire station.
Demographics
As of the 2010 census, Otisville had a population of 1,500 people. The median age of the population was 43.7 years, and the median household income was $50,000. The racial makeup of the hamlet was 94.7% White, 1.3% African American, 0.7% Asian, 0.3% Native American, and 2.7% from other races.
Conclusion
Otisville is a small hamlet located in the foothills of the Shawangunk Mountains in Orange County, New York. The hamlet is home to a population of approximately 1,500 people and is known for its rural charm and small-town atmosphere. The hamlet’s economy is largely based on agriculture and tourism, and it is home to several small businesses, manufacturing companies, and government offices. As of the 2010 census, the hamlet had a population of 1,500 people, with a median age of 43.7 years and a median household income of $50,000.
Common Questions
What is the Total Population of Otisville?
Total Population of Otisville is 1,431.
What is the Total Male Population of Otisville?
Total Male Population of Otisville is 701.
What is the Total Female Population of Otisville?
Total Female Population of Otisville is 730.
What is the Ratio of Males per 100 Females in Otisville?
There are 96.03 Males per 100 Females in Otisville.
What is the Ratio of Females per 100 Males in Otisville?
There are 104.14 Females per 100 Males in Otisville.
What is the Median Population Age in Otisville?
Median Population Age in Otisville is 35.5 Years.
What is the Average Family Size in Otisville
Average Family Size in Otisville is 3.4 People.
What is the Average Household Size in Otisville
Average Household Size in Otisville is 2.9 People.
What is Per Capita Income in Otisville?
Per Capita income in Otisville is $36,006.
What is the Median Family Income in Otisville?
Median Family Income in Otisville is $93,750.
What is the Median Household income in Otisville?
Median Household Income in Otisville is $79,615.
What is Income or Wage Gap in Otisville?
Income or Wage Gap in Otisville is 23.9%.
Women in Otisville earn 76.1 cents for every dollar earned by a man.
What is Inequality or Gini Index in Otisville?
Inequality or Gini Index in Otisville is 0.40.
How Large is the Labor Force in Otisville?
There are 572 People in the Labor Forcein in Otisville.
What is the Percentage of People in the Labor Force in Otisville?
53.7% of People are in the Labor Force in Otisville.
What is the Unemployment Rate in Otisville?
Unemployment Rate in Otisville is 2.4%.