Greenvale, NY
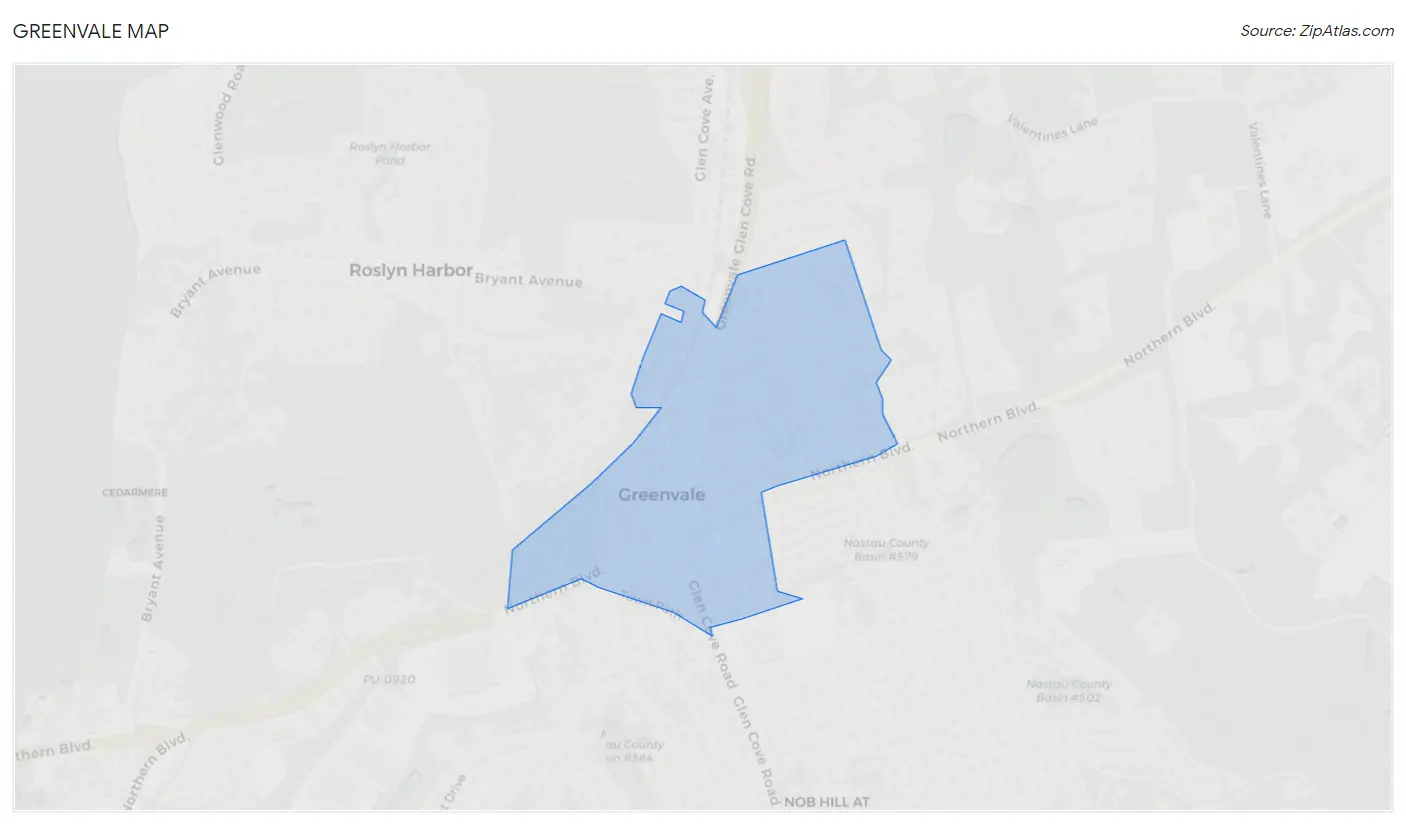
Greenvale Map
Greenvale Overview
1,164
TOTAL POPULATION
680
MALE POPULATION
484
FEMALE POPULATION
140.50
MALES / 100 FEMALES
71.18
FEMALES / 100 MALES
47.6
MEDIAN AGE
3.2
AVG FAMILY SIZE
3.0
AVG HOUSEHOLD SIZE
$49,620
PER CAPITA INCOME
$151,250
AVG FAMILY INCOME
47.8%
WAGE / INCOME GAP [ % ]
52.2¢/ $1
WAGE / INCOME GAP [ $ ]
0.57
INEQUALITY / GINI INDEX
506
LABOR FORCE [ PEOPLE ]
48.1%
PERCENT IN LABOR FORCE
11.1%
UNEMPLOYMENT RATE
Greenvale Zip Codes
Greenvale Area Codes
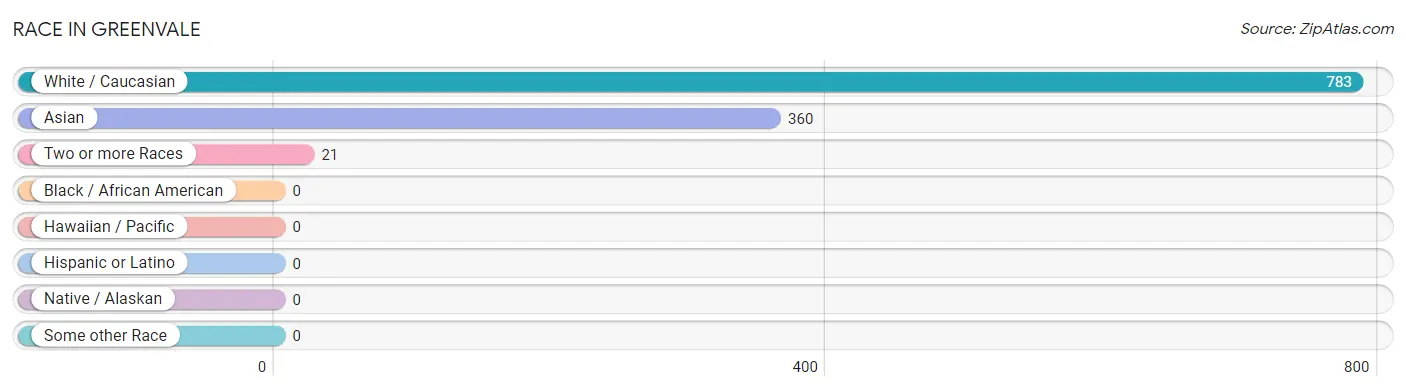
Race in Greenvale
The most populous races in Greenvale are White / Caucasian (783 | 67.3%), Asian (360 | 30.9%), and Two or more Races (21 | 1.8%).
| Race | # Population | % Population |
| Asian | 360 | 30.9% |
| Black / African American | 0 | 0.0% |
| Hawaiian / Pacific | 0 | 0.0% |
| Hispanic or Latino | 0 | 0.0% |
| Native / Alaskan | 0 | 0.0% |
| White / Caucasian | 783 | 67.3% |
| Two or more Races | 21 | 1.8% |
| Some other Race | 0 | 0.0% |
| Total | 1,164 | 100.0% |
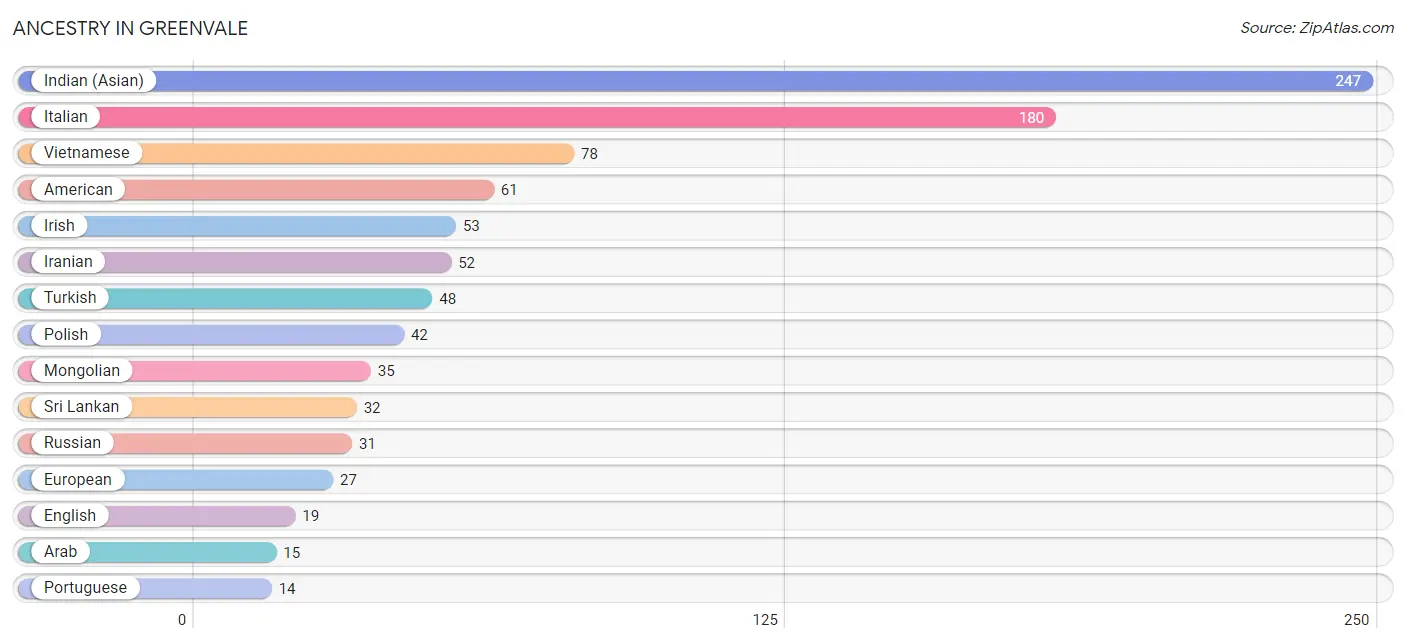
Ancestry in Greenvale
The most populous ancestries reported in Greenvale are Indian (Asian) (247 | 21.2%), Italian (180 | 15.5%), Vietnamese (78 | 6.7%), American (61 | 5.2%), and Irish (53 | 4.5%), together accounting for 53.2% of all Greenvale residents.
| Ancestry | # Population | % Population |
| American | 61 | 5.2% |
| Arab | 15 | 1.3% |
| Austrian | 13 | 1.1% |
| English | 19 | 1.6% |
| European | 27 | 2.3% |
| Indian (Asian) | 247 | 21.2% |
| Iranian | 52 | 4.5% |
| Irish | 53 | 4.5% |
| Italian | 180 | 15.5% |
| Mongolian | 35 | 3.0% |
| Polish | 42 | 3.6% |
| Portuguese | 14 | 1.2% |
| Russian | 31 | 2.7% |
| Scottish | 13 | 1.1% |
| Sri Lankan | 32 | 2.8% |
| Turkish | 48 | 4.1% |
| Vietnamese | 78 | 6.7% | View All 17 Rows |
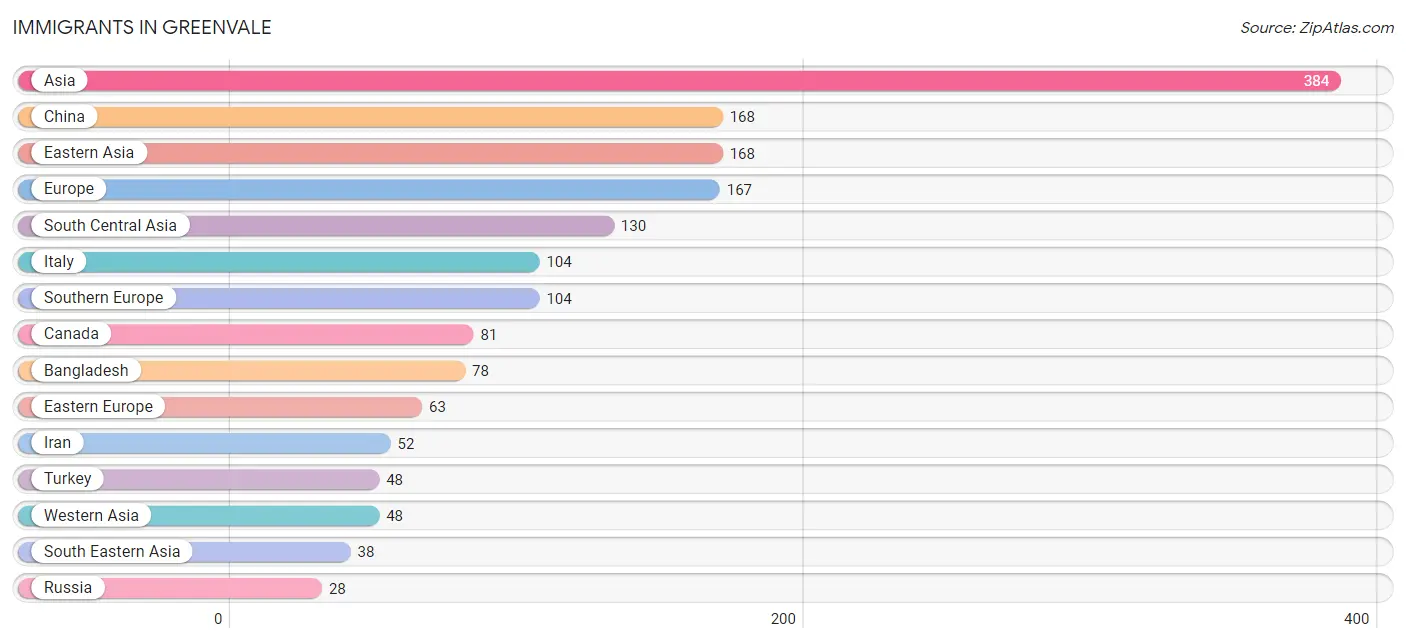
Immigrants in Greenvale
The most numerous immigrant groups reported in Greenvale came from Asia (384 | 33.0%), China (168 | 14.4%), Eastern Asia (168 | 14.4%), Europe (167 | 14.3%), and South Central Asia (130 | 11.2%), together accounting for 87.4% of all Greenvale residents.
| Immigration Origin | # Population | % Population |
| Asia | 384 | 33.0% |
| Bangladesh | 78 | 6.7% |
| Canada | 81 | 7.0% |
| China | 168 | 14.4% |
| Eastern Asia | 168 | 14.4% |
| Eastern Europe | 63 | 5.4% |
| Europe | 167 | 14.3% |
| Hong Kong | 20 | 1.7% |
| Iran | 52 | 4.5% |
| Italy | 104 | 8.9% |
| Malaysia | 17 | 1.5% |
| Poland | 17 | 1.5% |
| Russia | 28 | 2.4% |
| South Central Asia | 130 | 11.2% |
| South Eastern Asia | 38 | 3.3% |
| Southern Europe | 104 | 8.9% |
| Turkey | 48 | 4.1% |
| Ukraine | 18 | 1.5% |
| Vietnam | 21 | 1.8% |
| Western Asia | 48 | 4.1% | View All 20 Rows |
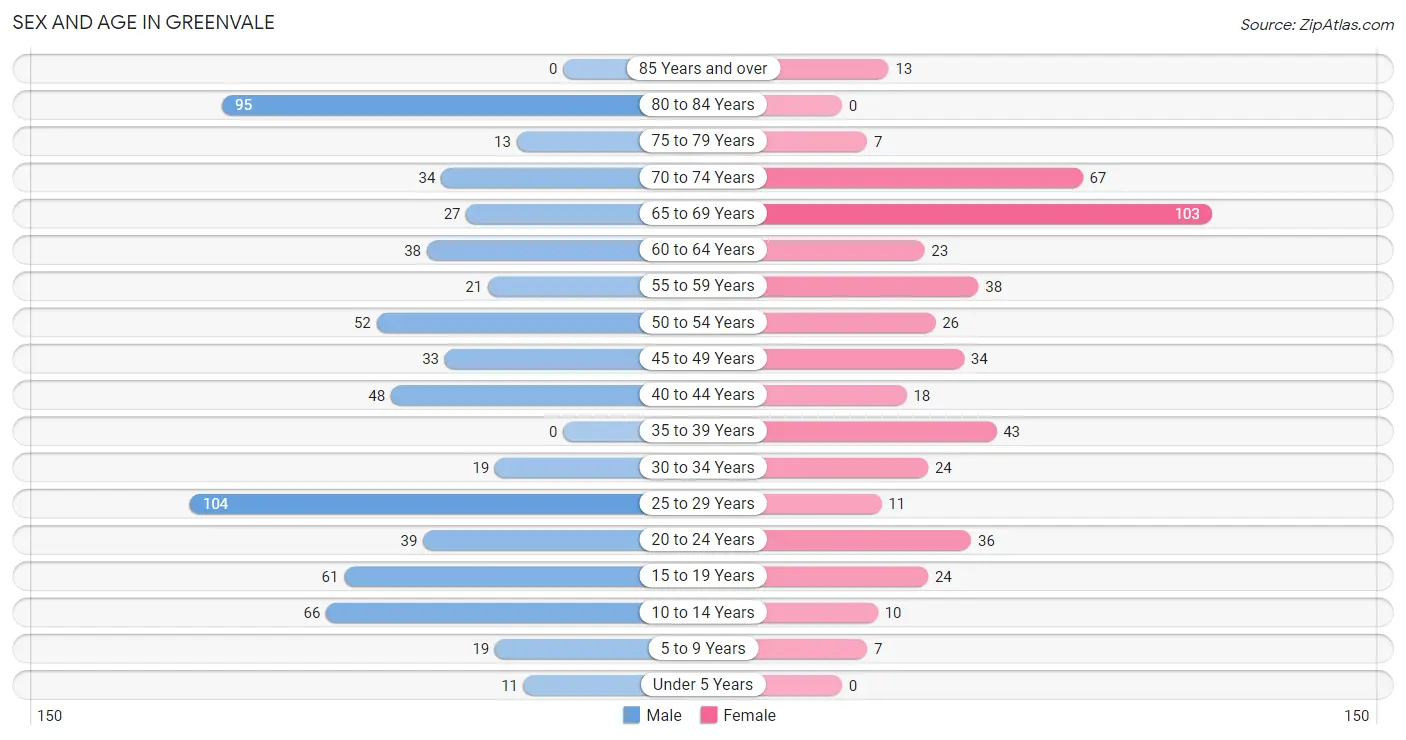
Sex and Age in Greenvale
Sex and Age in Greenvale
The most populous age groups in Greenvale are 25 to 29 Years (104 | 15.3%) for men and 65 to 69 Years (103 | 21.3%) for women.
| Age Bracket | Male | Female |
| Under 5 Years | 11 (1.6%) | 0 (0.0%) |
| 5 to 9 Years | 19 (2.8%) | 7 (1.5%) |
| 10 to 14 Years | 66 (9.7%) | 10 (2.1%) |
| 15 to 19 Years | 61 (9.0%) | 24 (5.0%) |
| 20 to 24 Years | 39 (5.7%) | 36 (7.4%) |
| 25 to 29 Years | 104 (15.3%) | 11 (2.3%) |
| 30 to 34 Years | 19 (2.8%) | 24 (5.0%) |
| 35 to 39 Years | 0 (0.0%) | 43 (8.9%) |
| 40 to 44 Years | 48 (7.1%) | 18 (3.7%) |
| 45 to 49 Years | 33 (4.9%) | 34 (7.0%) |
| 50 to 54 Years | 52 (7.6%) | 26 (5.4%) |
| 55 to 59 Years | 21 (3.1%) | 38 (7.9%) |
| 60 to 64 Years | 38 (5.6%) | 23 (4.8%) |
| 65 to 69 Years | 27 (4.0%) | 103 (21.3%) |
| 70 to 74 Years | 34 (5.0%) | 67 (13.8%) |
| 75 to 79 Years | 13 (1.9%) | 7 (1.5%) |
| 80 to 84 Years | 95 (14.0%) | 0 (0.0%) |
| 85 Years and over | 0 (0.0%) | 13 (2.7%) |
| Total | 680 (100.0%) | 484 (100.0%) |
Families and Households in Greenvale
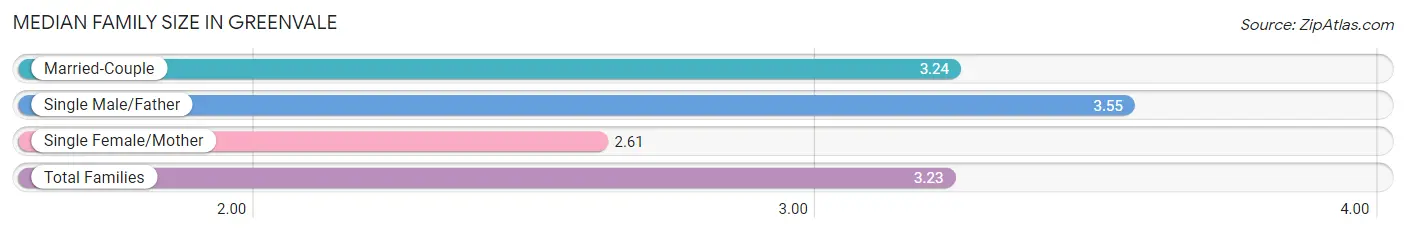
Median Family Size in Greenvale
The median family size in Greenvale is 3.23 persons per family, with single male/father families (31 | 10.4%) accounting for the largest median family size of 3.55 persons per family. On the other hand, single female/mother families (23 | 7.7%) represent the smallest median family size with 2.61 persons per family.
| Family Type | # Families | Family Size |
| Married-Couple | 245 (81.9%) | 3.24 |
| Single Male/Father | 31 (10.4%) | 3.55 |
| Single Female/Mother | 23 (7.7%) | 2.61 |
| Total Families | 299 (100.0%) | 3.23 |
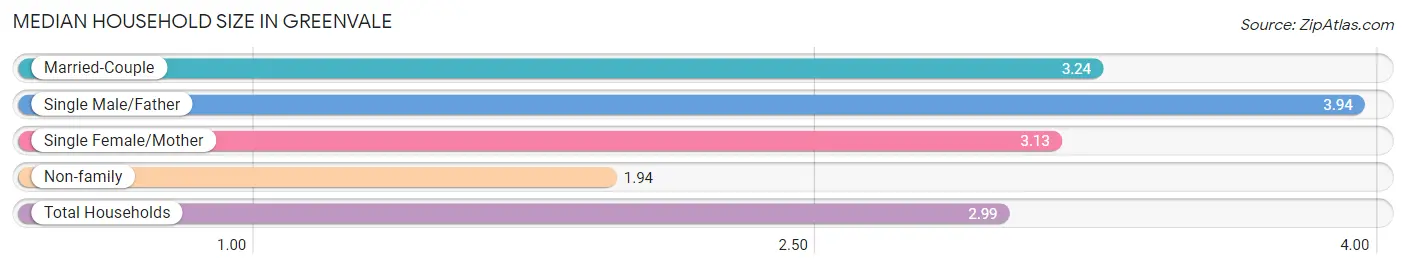
Median Household Size in Greenvale
The median household size in Greenvale is 2.99 persons per household, with single male/father households (31 | 8.0%) accounting for the largest median household size of 3.94 persons per household. non-family households (90 | 23.1%) represent the smallest median household size with 1.94 persons per household.
| Household Type | # Households | Household Size |
| Married-Couple | 245 (63.0%) | 3.24 |
| Single Male/Father | 31 (8.0%) | 3.94 |
| Single Female/Mother | 23 (5.9%) | 3.13 |
| Non-family | 90 (23.1%) | 1.94 |
| Total Households | 389 (100.0%) | 2.99 |
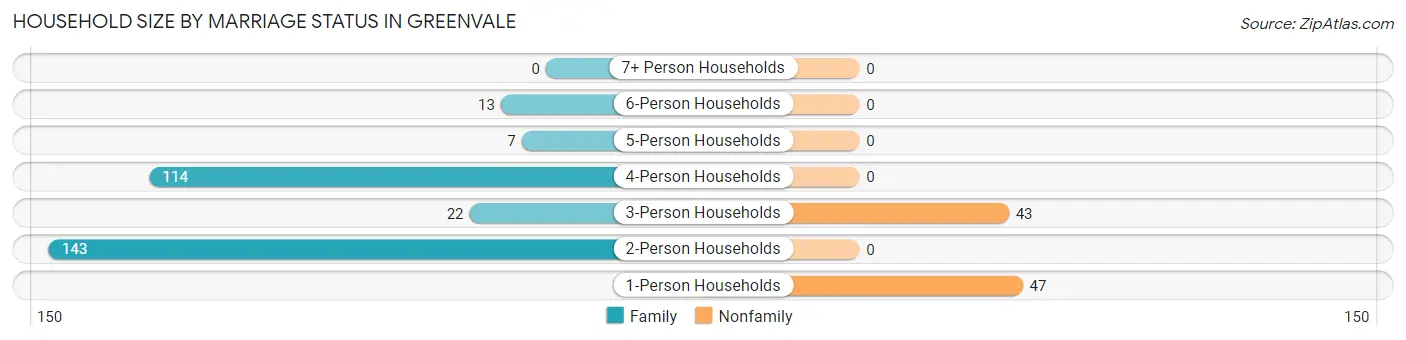
Household Size by Marriage Status in Greenvale
Out of a total of 389 households in Greenvale, 299 (76.9%) are family households, while 90 (23.1%) are nonfamily households. The most numerous type of family households are 2-person households, comprising 143, and the most common type of nonfamily households are 1-person households, comprising 47.
| Household Size | Family Households | Nonfamily Households |
| 1-Person Households | - | 47 (12.1%) |
| 2-Person Households | 143 (36.8%) | 0 (0.0%) |
| 3-Person Households | 22 (5.7%) | 43 (11.1%) |
| 4-Person Households | 114 (29.3%) | 0 (0.0%) |
| 5-Person Households | 7 (1.8%) | 0 (0.0%) |
| 6-Person Households | 13 (3.3%) | 0 (0.0%) |
| 7+ Person Households | 0 (0.0%) | 0 (0.0%) |
| Total | 299 (76.9%) | 90 (23.1%) |
Female Fertility in Greenvale
Fertility by Age in Greenvale
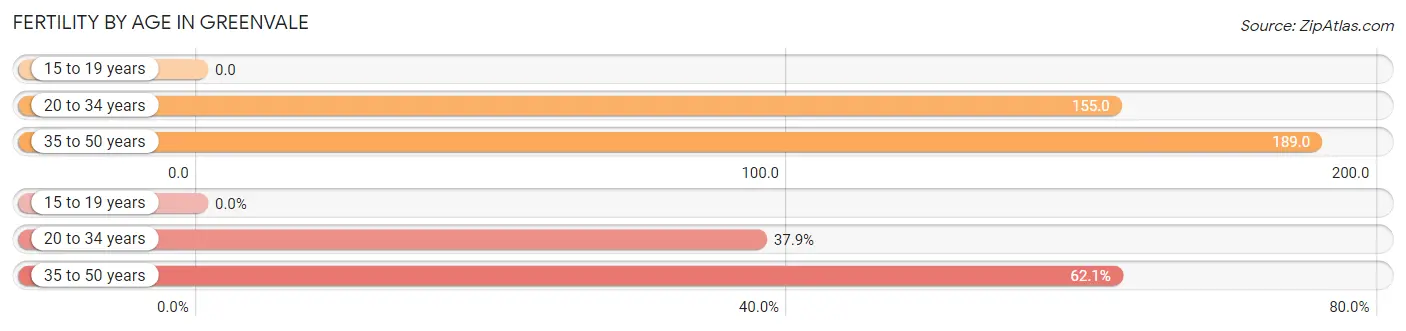
Average fertility rate in Greenvale is 153.0 births per 1,000 women. Women in the age bracket of 35 to 50 years have the highest fertility rate with 189.0 births per 1,000 women. Women in the age bracket of 35 to 50 years acount for 62.1% of all women with births.
| Age Bracket | Women with Births | Births / 1,000 Women |
| 15 to 19 years | 0 (0.0%) | 0.0 |
| 20 to 34 years | 11 (37.9%) | 155.0 |
| 35 to 50 years | 18 (62.1%) | 189.0 |
| Total | 29 (100.0%) | 153.0 |
Fertility by Age by Marriage Status in Greenvale
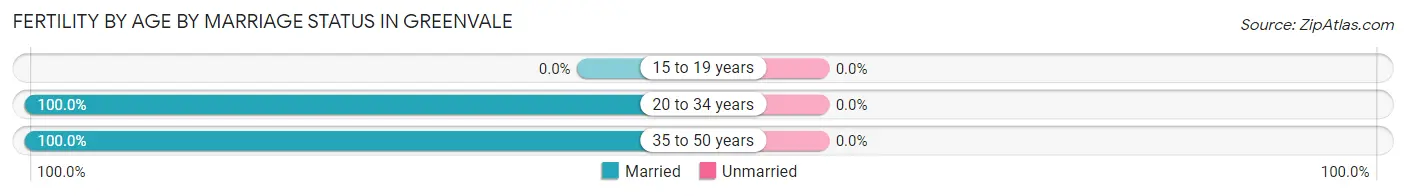
| Age Bracket | Married | Unmarried |
| 15 to 19 years | 0 (0.0%) | 0 (0.0%) |
| 20 to 34 years | 11 (100.0%) | 0 (0.0%) |
| 35 to 50 years | 18 (100.0%) | 0 (0.0%) |
| Total | 29 (100.0%) | 0 (0.0%) |
Fertility by Education in Greenvale
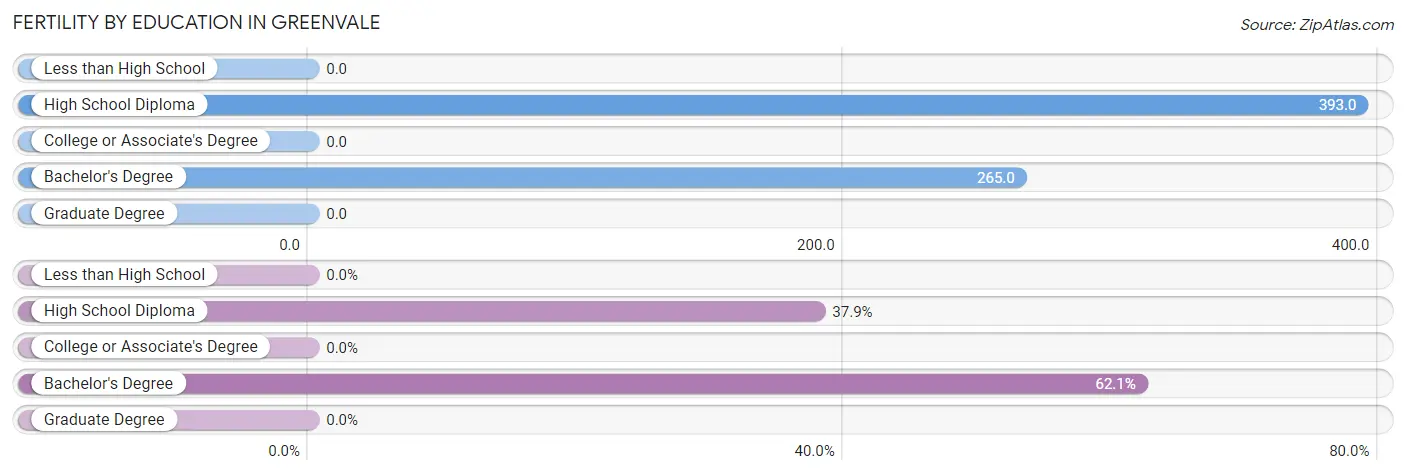
| Educational Attainment | Women with Births | Births / 1,000 Women |
| Less than High School | 0 (0.0%) | 0.0 |
| High School Diploma | 11 (37.9%) | 393.0 |
| College or Associate's Degree | 0 (0.0%) | 0.0 |
| Bachelor's Degree | 18 (62.1%) | 265.0 |
| Graduate Degree | 0 (0.0%) | 0.0 |
| Total | 29 (100.0%) | 153.0 |
Fertility by Education by Marriage Status in Greenvale
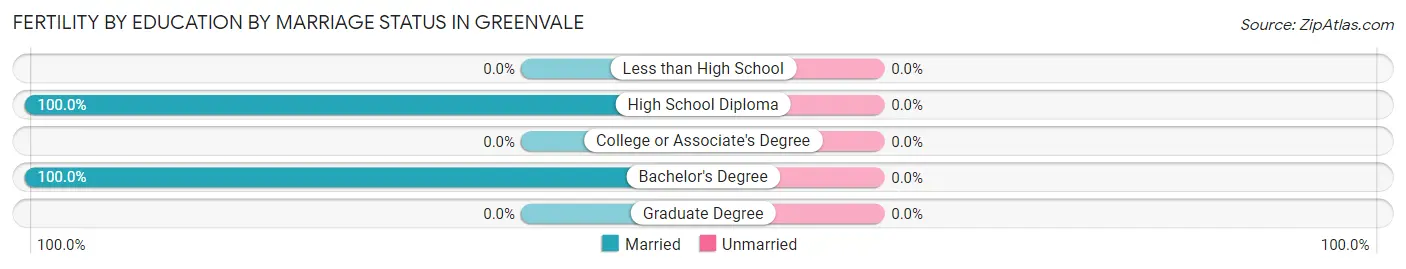
| Educational Attainment | Married | Unmarried |
| Less than High School | 0 (0.0%) | 0 (0.0%) |
| High School Diploma | 11 (100.0%) | 0 (0.0%) |
| College or Associate's Degree | 0 (0.0%) | 0 (0.0%) |
| Bachelor's Degree | 18 (100.0%) | 0 (0.0%) |
| Graduate Degree | 0 (0.0%) | 0 (0.0%) |
| Total | 29 (100.0%) | 0 (0.0%) |
Income in Greenvale
Income Overview in Greenvale
| Characteristic | Number | Measure |
| Per Capita Income | 1,164 | $49,620 |
| Median Family Income | 299 | $151,250 |
| Mean Family Income | 299 | $172,759 |
| Median Household Income | 389 | $0 |
| Mean Household Income | 389 | $146,019 |
| Income Deficit | 299 | $0 |
| Wage / Income Gap (%) | 1,164 | 47.81% |
| Wage / Income Gap ($) | 1,164 | 52.19¢ per $1 |
| Gini / Inequality Index | 1,164 | 0.57 |
Earnings by Sex in Greenvale
Average Earnings in Greenvale are $43,750, $56,635 for men and $29,557 for women, a difference of 47.8%.
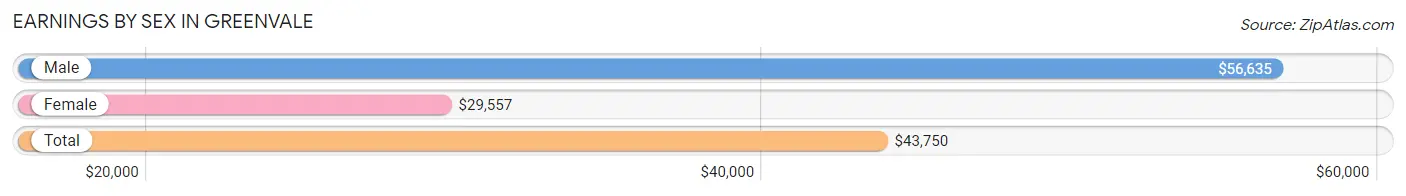
| Sex | Number | Average Earnings |
| Male | 321 (60.6%) | $56,635 |
| Female | 209 (39.4%) | $29,557 |
| Total | 530 (100.0%) | $43,750 |
Earnings by Sex by Income Bracket in Greenvale
The most common earnings brackets in Greenvale are $100,000+ for men (118 | 36.8%) and $25,000 to $29,999 for women (67 | 32.1%).
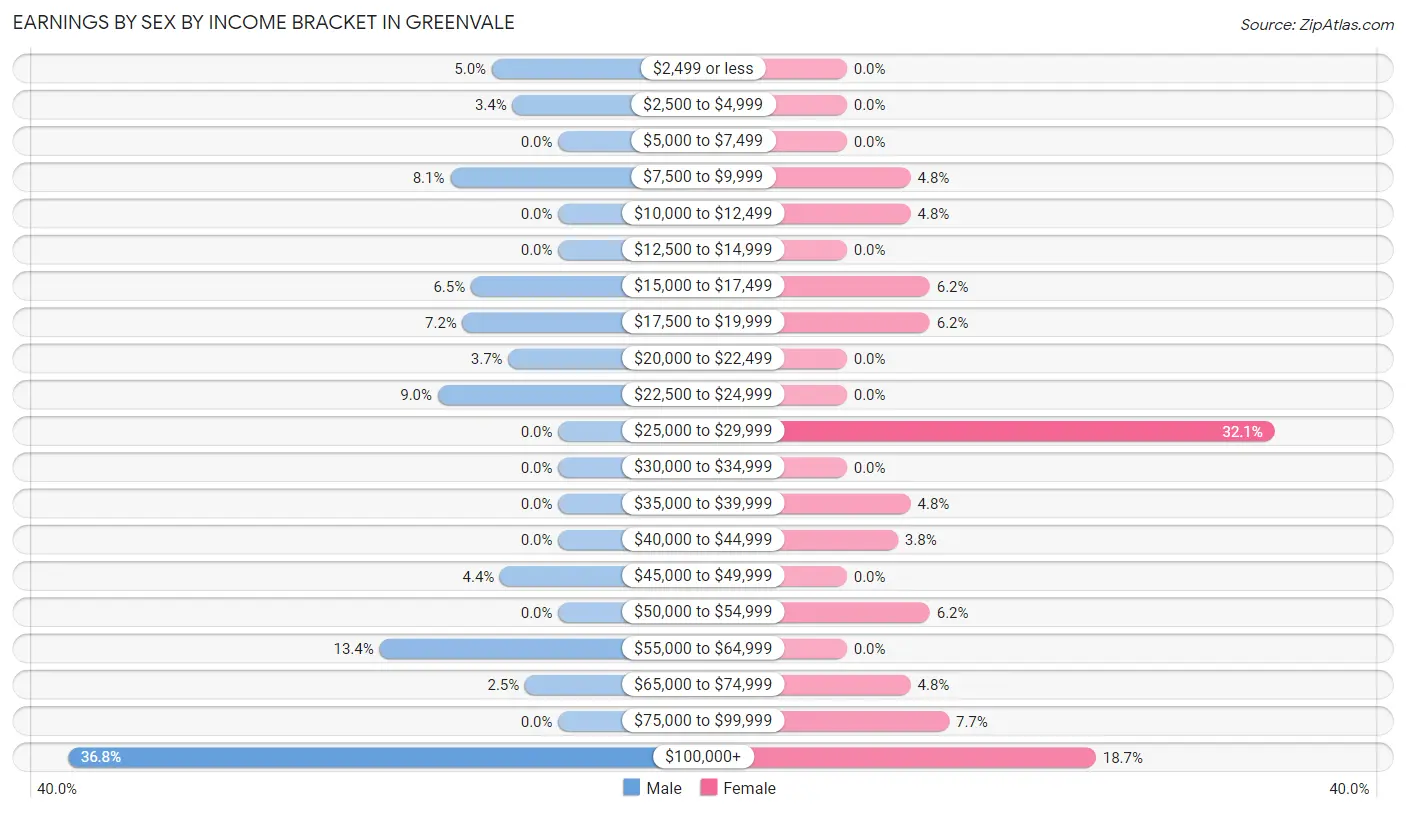
| Income | Male | Female |
| $2,499 or less | 16 (5.0%) | 0 (0.0%) |
| $2,500 to $4,999 | 11 (3.4%) | 0 (0.0%) |
| $5,000 to $7,499 | 0 (0.0%) | 0 (0.0%) |
| $7,500 to $9,999 | 26 (8.1%) | 10 (4.8%) |
| $10,000 to $12,499 | 0 (0.0%) | 10 (4.8%) |
| $12,500 to $14,999 | 0 (0.0%) | 0 (0.0%) |
| $15,000 to $17,499 | 21 (6.5%) | 13 (6.2%) |
| $17,500 to $19,999 | 23 (7.2%) | 13 (6.2%) |
| $20,000 to $22,499 | 12 (3.7%) | 0 (0.0%) |
| $22,500 to $24,999 | 29 (9.0%) | 0 (0.0%) |
| $25,000 to $29,999 | 0 (0.0%) | 67 (32.1%) |
| $30,000 to $34,999 | 0 (0.0%) | 0 (0.0%) |
| $35,000 to $39,999 | 0 (0.0%) | 10 (4.8%) |
| $40,000 to $44,999 | 0 (0.0%) | 8 (3.8%) |
| $45,000 to $49,999 | 14 (4.4%) | 0 (0.0%) |
| $50,000 to $54,999 | 0 (0.0%) | 13 (6.2%) |
| $55,000 to $64,999 | 43 (13.4%) | 0 (0.0%) |
| $65,000 to $74,999 | 8 (2.5%) | 10 (4.8%) |
| $75,000 to $99,999 | 0 (0.0%) | 16 (7.7%) |
| $100,000+ | 118 (36.8%) | 39 (18.7%) |
| Total | 321 (100.0%) | 209 (100.0%) |
Earnings by Sex by Educational Attainment in Greenvale
Average earnings in Greenvale are $110,313 for men and $43,750 for women, a difference of 60.3%. Men with an educational attainment of college or associate's degree enjoy the highest average annual earnings of $70,938, while those with college or associate's degree education earn the least with $70,938. Women with an educational attainment of graduate degree earn the most with the average annual earnings of $195,313, while those with college or associate's degree education have the smallest earnings of $28,068.
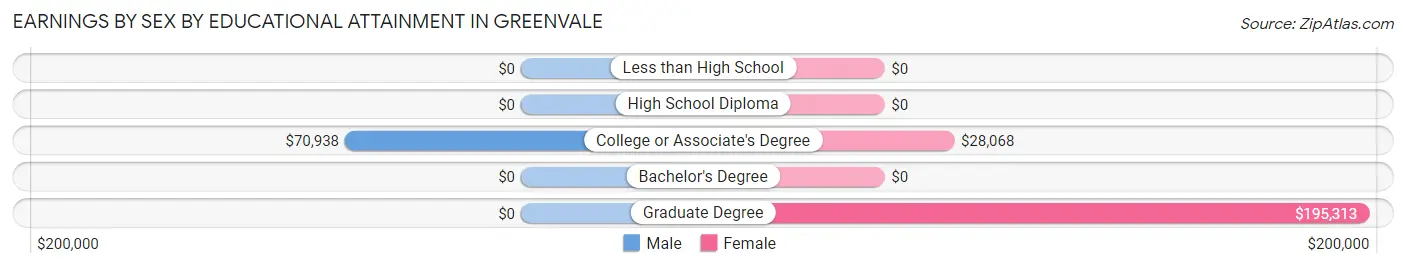
| Educational Attainment | Male Income | Female Income |
| Less than High School | - | - |
| High School Diploma | - | - |
| College or Associate's Degree | $70,938 | $28,068 |
| Bachelor's Degree | - | - |
| Graduate Degree | - | - |
| Total | $110,313 | $43,750 |
Family Income in Greenvale
Family Income Brackets in Greenvale
According to the Greenvale family income data, there are 82 families falling into the $200,000+ income range, which is the most common income bracket and makes up 27.4% of all families.
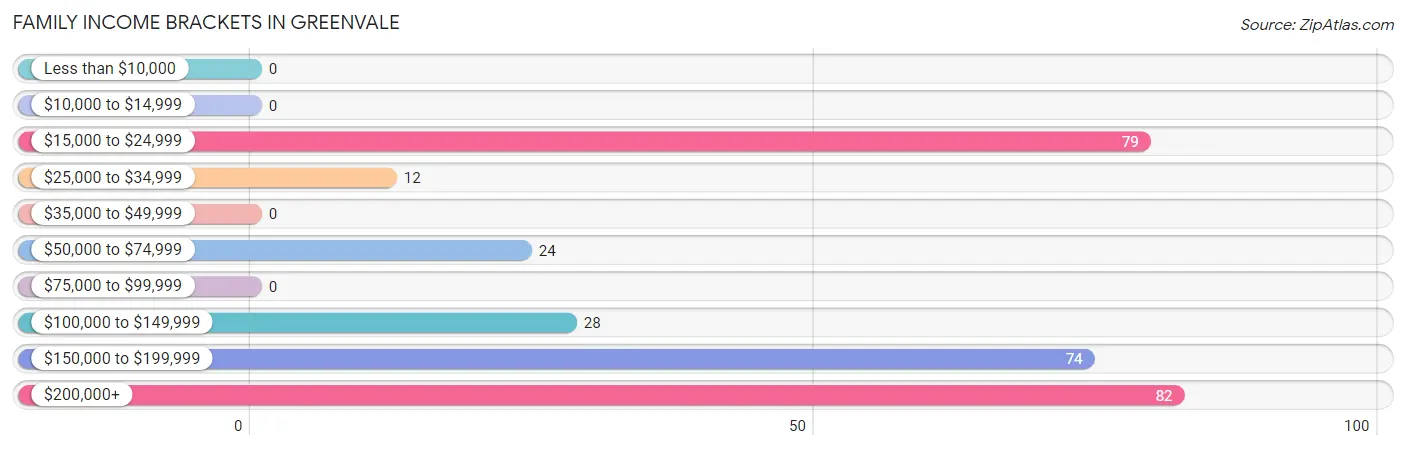
| Income Bracket | # Families | % Families |
| Less than $10,000 | 0 | 0.0% |
| $10,000 to $14,999 | 0 | 0.0% |
| $15,000 to $24,999 | 79 | 26.4% |
| $25,000 to $34,999 | 12 | 4.0% |
| $35,000 to $49,999 | 0 | 0.0% |
| $50,000 to $74,999 | 24 | 8.0% |
| $75,000 to $99,999 | 0 | 0.0% |
| $100,000 to $149,999 | 28 | 9.4% |
| $150,000 to $199,999 | 74 | 24.7% |
| $200,000+ | 82 | 27.4% |
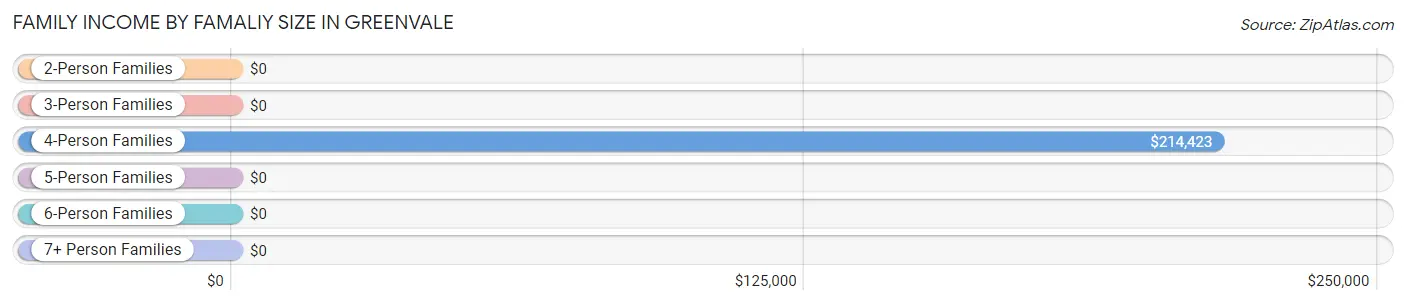
Family Income by Famaliy Size in Greenvale
4-person families (90 | 30.1%) account for the highest median family income in Greenvale with $214,423 per family, while 4-person families (90 | 30.1%) have the highest median income of $53,606 per family member.
| Income Bracket | # Families | Median Income |
| 2-Person Families | 143 (47.8%) | $0 |
| 3-Person Families | 46 (15.4%) | $0 |
| 4-Person Families | 90 (30.1%) | $214,423 |
| 5-Person Families | 7 (2.3%) | $0 |
| 6-Person Families | 13 (4.3%) | $0 |
| 7+ Person Families | 0 (0.0%) | $0 |
| Total | 299 (100.0%) | $151,250 |
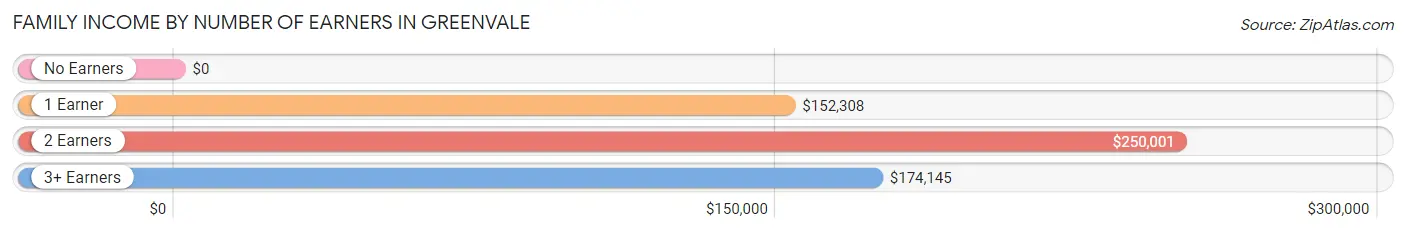
Family Income by Number of Earners in Greenvale
| Number of Earners | # Families | Median Income |
| No Earners | 87 (29.1%) | $0 |
| 1 Earner | 82 (27.4%) | $152,308 |
| 2 Earners | 91 (30.4%) | $250,001 |
| 3+ Earners | 39 (13.0%) | $174,145 |
| Total | 299 (100.0%) | $151,250 |
Household Income in Greenvale
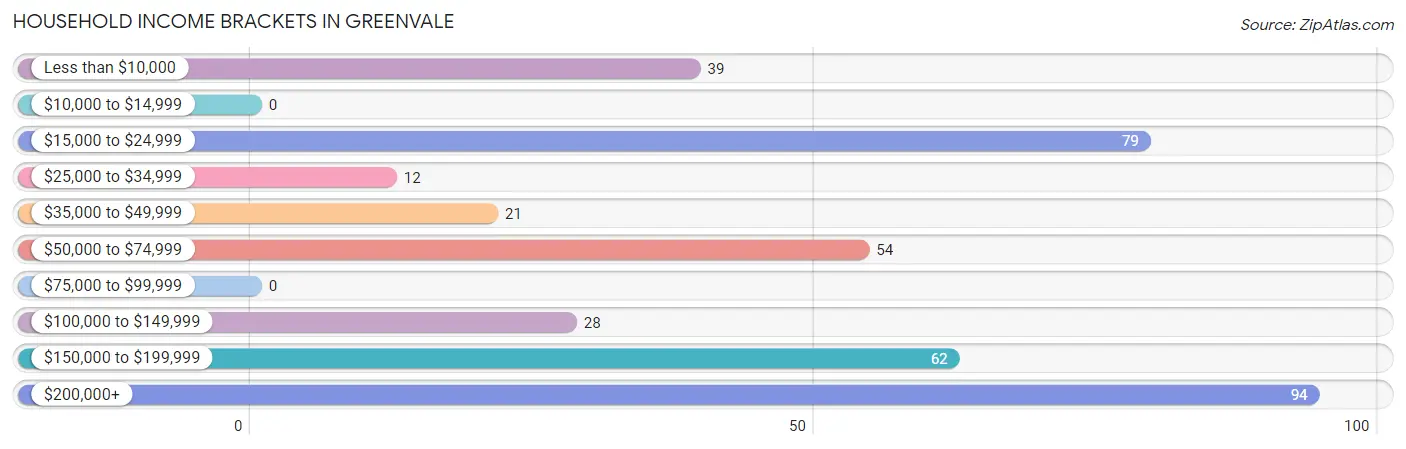
Household Income Brackets in Greenvale
With 94 households falling in the category, the $200,000+ income range is the most frequent in Greenvale, accounting for 24.2% of all households.
| Income Bracket | # Households | % Households |
| Less than $10,000 | 39 | 10.0% |
| $10,000 to $14,999 | 0 | 0.0% |
| $15,000 to $24,999 | 79 | 20.3% |
| $25,000 to $34,999 | 12 | 3.1% |
| $35,000 to $49,999 | 21 | 5.4% |
| $50,000 to $74,999 | 54 | 13.9% |
| $75,000 to $99,999 | 0 | 0.0% |
| $100,000 to $149,999 | 28 | 7.2% |
| $150,000 to $199,999 | 62 | 15.9% |
| $200,000+ | 94 | 24.2% |
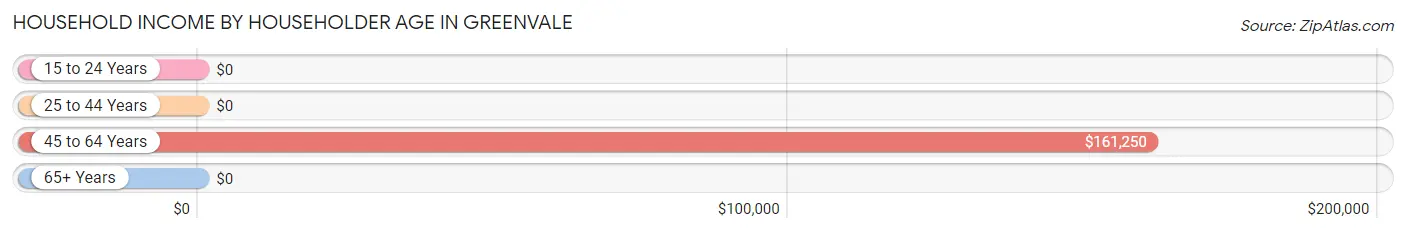
Household Income by Householder Age in Greenvale
The median household income in Greenvale is $0, with the highest median household income of $161,250 found in the 45 to 64 years age bracket for the primary householder. A total of 93 households (23.9%) fall into this category. Meanwhile, the 15 to 24 years age bracket for the primary householder has the lowest median household income of $0, with 14 households (3.6%) in this group.
| Income Bracket | # Households | Median Income |
| 15 to 24 Years | 14 (3.6%) | $0 |
| 25 to 44 Years | 87 (22.4%) | $0 |
| 45 to 64 Years | 93 (23.9%) | $161,250 |
| 65+ Years | 195 (50.1%) | $0 |
| Total | 389 (100.0%) | $0 |
Poverty in Greenvale
Income Below Poverty by Sex and Age in Greenvale
With 14.7% poverty level for males and 4.5% for females among the residents of Greenvale, 25 to 34 year old males and 55 to 64 year old females are the most vulnerable to poverty, with 89 males (72.4%) and 12 females (19.7%) in their respective age groups living below the poverty level.
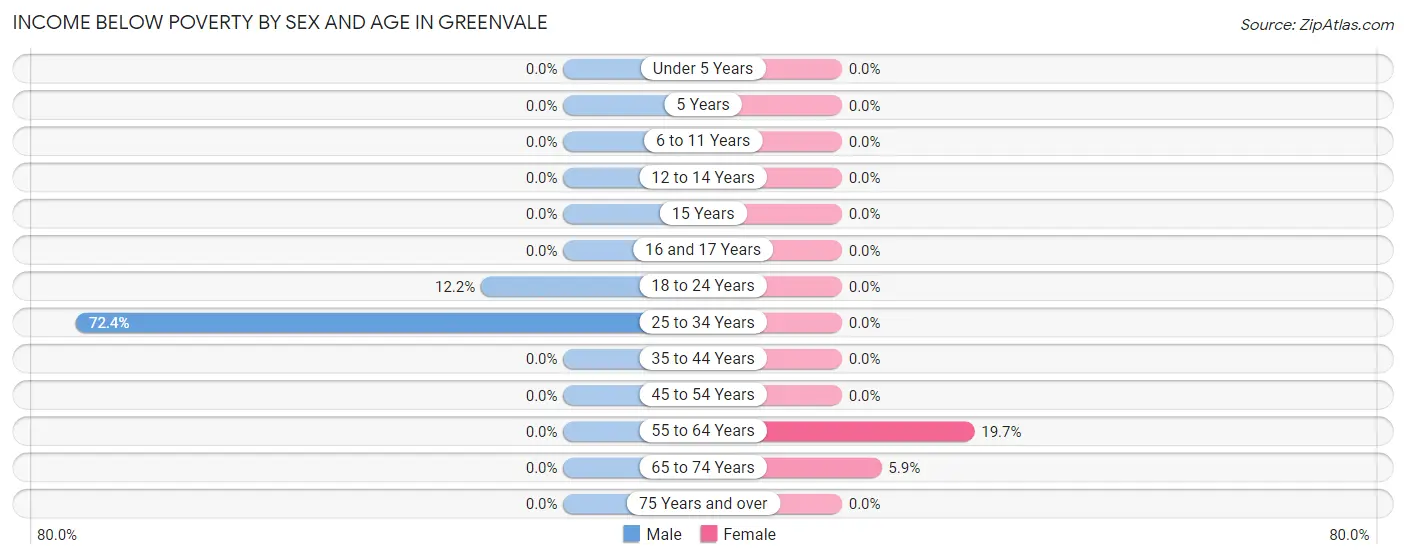
| Age Bracket | Male | Female |
| Under 5 Years | 0 (0.0%) | 0 (0.0%) |
| 5 Years | 0 (0.0%) | 0 (0.0%) |
| 6 to 11 Years | 0 (0.0%) | 0 (0.0%) |
| 12 to 14 Years | 0 (0.0%) | 0 (0.0%) |
| 15 Years | 0 (0.0%) | 0 (0.0%) |
| 16 and 17 Years | 0 (0.0%) | 0 (0.0%) |
| 18 to 24 Years | 11 (12.2%) | 0 (0.0%) |
| 25 to 34 Years | 89 (72.4%) | 0 (0.0%) |
| 35 to 44 Years | 0 (0.0%) | 0 (0.0%) |
| 45 to 54 Years | 0 (0.0%) | 0 (0.0%) |
| 55 to 64 Years | 0 (0.0%) | 12 (19.7%) |
| 65 to 74 Years | 0 (0.0%) | 10 (5.9%) |
| 75 Years and over | 0 (0.0%) | 0 (0.0%) |
| Total | 100 (14.7%) | 22 (4.5%) |
Income Above Poverty by Sex and Age in Greenvale
According to the poverty statistics in Greenvale, males aged under 5 years and females aged 6 to 11 years are the age groups that are most secure financially, with 100.0% of males and 100.0% of females in these age groups living above the poverty line.
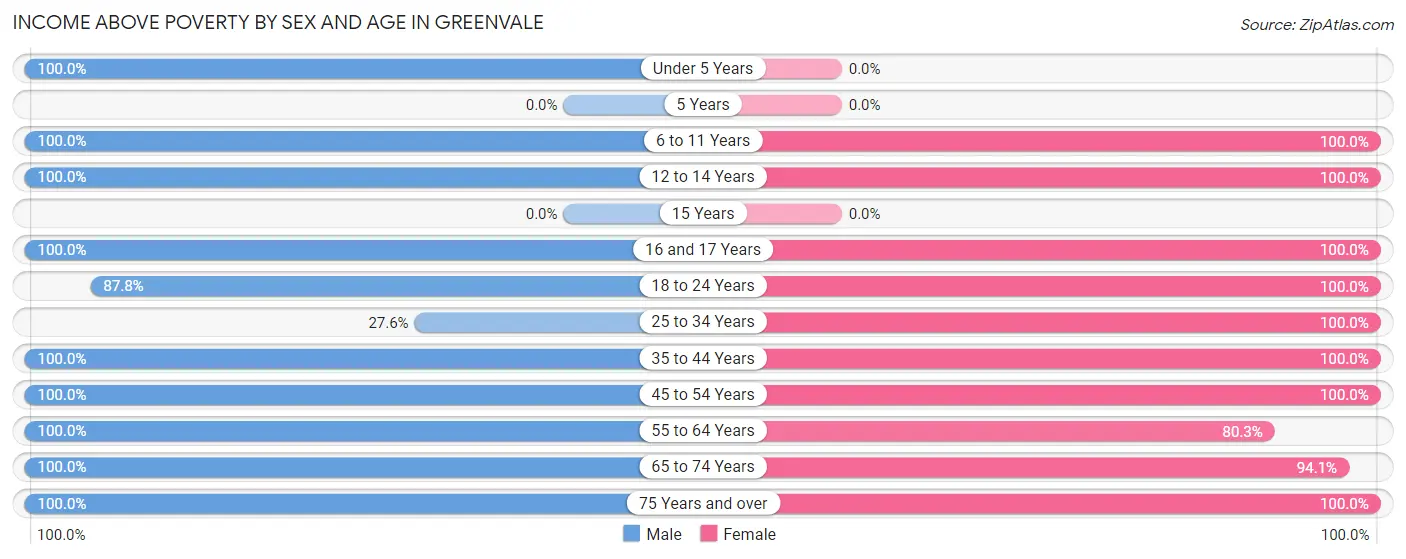
| Age Bracket | Male | Female |
| Under 5 Years | 11 (100.0%) | 0 (0.0%) |
| 5 Years | 0 (0.0%) | 0 (0.0%) |
| 6 to 11 Years | 48 (100.0%) | 7 (100.0%) |
| 12 to 14 Years | 37 (100.0%) | 10 (100.0%) |
| 15 Years | 0 (0.0%) | 0 (0.0%) |
| 16 and 17 Years | 10 (100.0%) | 15 (100.0%) |
| 18 to 24 Years | 79 (87.8%) | 45 (100.0%) |
| 25 to 34 Years | 34 (27.6%) | 35 (100.0%) |
| 35 to 44 Years | 48 (100.0%) | 61 (100.0%) |
| 45 to 54 Years | 85 (100.0%) | 60 (100.0%) |
| 55 to 64 Years | 59 (100.0%) | 49 (80.3%) |
| 65 to 74 Years | 61 (100.0%) | 160 (94.1%) |
| 75 Years and over | 108 (100.0%) | 20 (100.0%) |
| Total | 580 (85.3%) | 462 (95.5%) |
Income Below Poverty Among Married-Couple Families in Greenvale
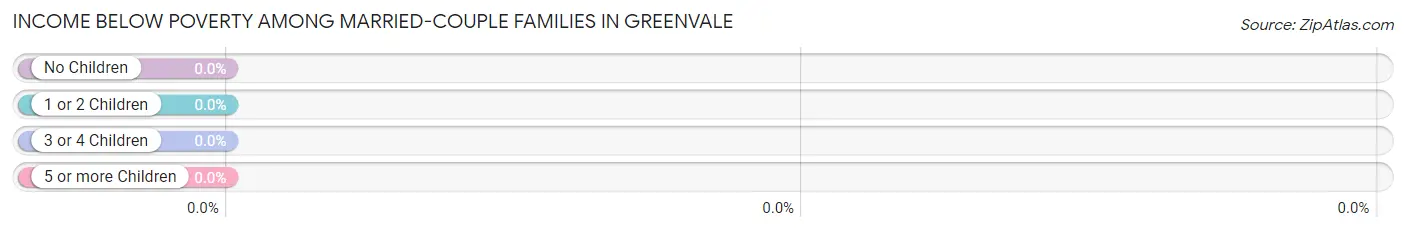
| Children | Above Poverty | Below Poverty |
| No Children | 191 (100.0%) | 0 (0.0%) |
| 1 or 2 Children | 54 (100.0%) | 0 (0.0%) |
| 3 or 4 Children | 0 (0.0%) | 0 (0.0%) |
| 5 or more Children | 0 (0.0%) | 0 (0.0%) |
| Total | 245 (100.0%) | 0 (0.0%) |
Income Below Poverty Among Single-Parent Households in Greenvale
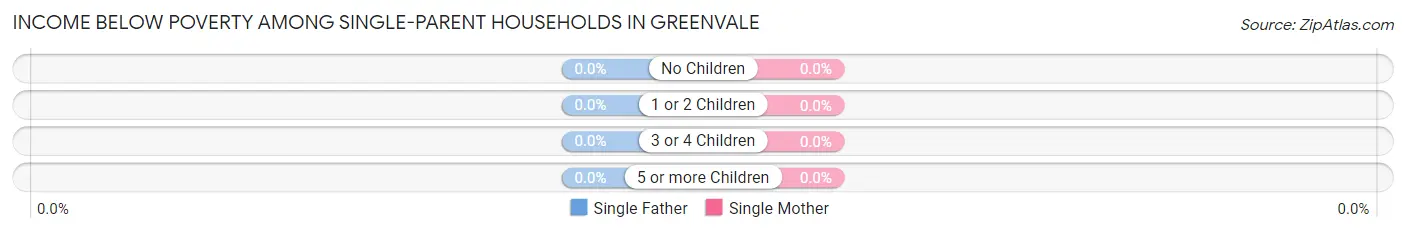
| Children | Single Father | Single Mother |
| No Children | 0 (0.0%) | 0 (0.0%) |
| 1 or 2 Children | 0 (0.0%) | 0 (0.0%) |
| 3 or 4 Children | 0 (0.0%) | 0 (0.0%) |
| 5 or more Children | 0 (0.0%) | 0 (0.0%) |
| Total | 0 (0.0%) | 0 (0.0%) |
Income Below Poverty Among Married-Couple vs Single-Parent Households in Greenvale
| Children | Married-Couple Families | Single-Parent Households |
| No Children | 0 (0.0%) | 0 (0.0%) |
| 1 or 2 Children | 0 (0.0%) | 0 (0.0%) |
| 3 or 4 Children | 0 (0.0%) | 0 (0.0%) |
| 5 or more Children | 0 (0.0%) | 0 (0.0%) |
| Total | 0 (0.0%) | 0 (0.0%) |
Employment Characteristics in Greenvale
Employment by Class of Employer in Greenvale
Among the 423 employed individuals in Greenvale, private company employees (213 | 50.3%), self-employed (incorporated) (74 | 17.5%), and self-employed (not incorporated) (52 | 12.3%) make up the most common classes of employment.
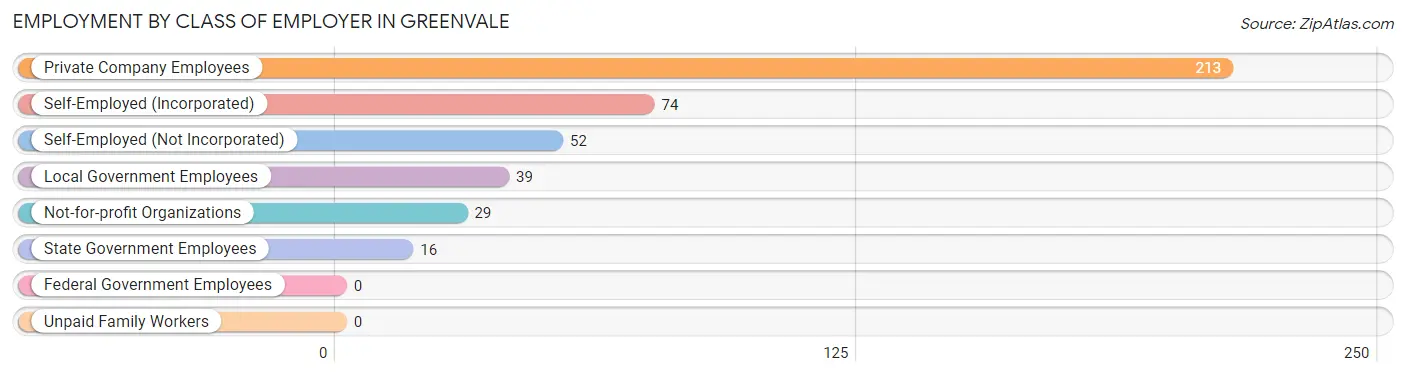
| Employer Class | # Employees | % Employees |
| Private Company Employees | 213 | 50.3% |
| Self-Employed (Incorporated) | 74 | 17.5% |
| Self-Employed (Not Incorporated) | 52 | 12.3% |
| Not-for-profit Organizations | 29 | 6.9% |
| Local Government Employees | 39 | 9.2% |
| State Government Employees | 16 | 3.8% |
| Federal Government Employees | 0 | 0.0% |
| Unpaid Family Workers | 0 | 0.0% |
| Total | 423 | 100.0% |
Employment Status by Age in Greenvale
According to the labor force statistics for Greenvale, out of the total population over 16 years of age (1,051), 48.1% or 506 individuals are in the labor force, with 11.1% or 56 of them unemployed. The age group with the highest labor force participation rate is 30 to 34 years, with 100.0% or 43 individuals in the labor force. Within the labor force, the 25 to 29 years age range has the highest percentage of unemployed individuals, with 100.0% or 15 of them being unemployed.
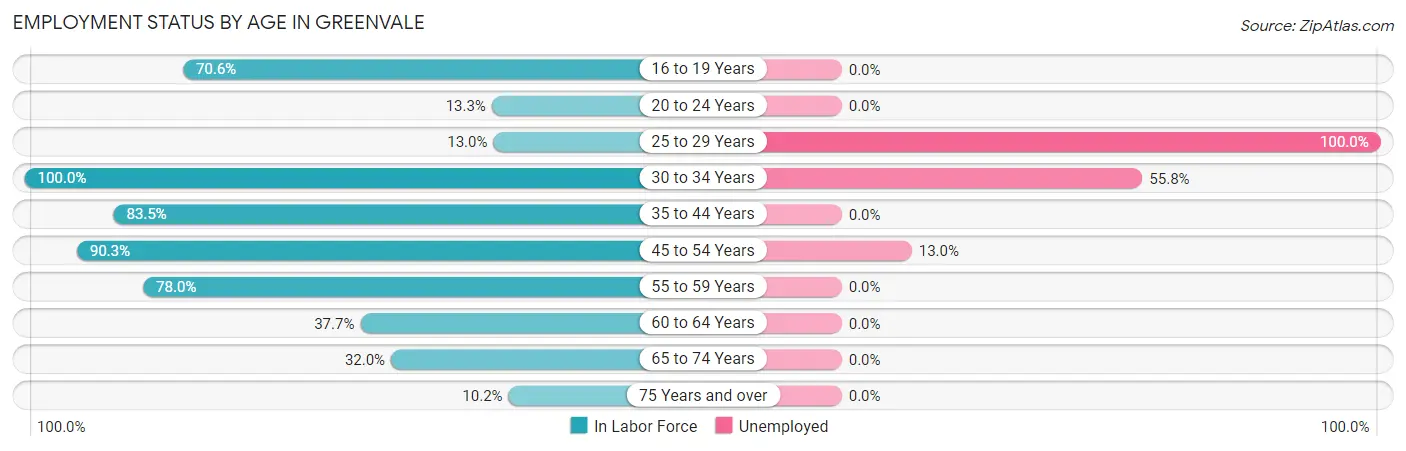
| Age Bracket | In Labor Force | Unemployed |
| 16 to 19 Years | 60 (70.6%) | 0 (0.0%) |
| 20 to 24 Years | 10 (13.3%) | 0 (0.0%) |
| 25 to 29 Years | 15 (13.0%) | 15 (100.0%) |
| 30 to 34 Years | 43 (100.0%) | 24 (55.8%) |
| 35 to 44 Years | 91 (83.5%) | 0 (0.0%) |
| 45 to 54 Years | 131 (90.3%) | 17 (13.0%) |
| 55 to 59 Years | 46 (78.0%) | 0 (0.0%) |
| 60 to 64 Years | 23 (37.7%) | 0 (0.0%) |
| 65 to 74 Years | 74 (32.0%) | 0 (0.0%) |
| 75 Years and over | 13 (10.2%) | 0 (0.0%) |
| Total | 506 (48.1%) | 56 (11.1%) |
Employment Status by Educational Attainment in Greenvale
According to labor force statistics for Greenvale, 65.6% of individuals (349) out of the total population between 25 and 64 years of age (532) are in the labor force, with 16.0% or 56 of them being unemployed. The group with the highest labor force participation rate are those with the educational attainment of less than high school, with 100.0% or 20 individuals in the labor force. Within the labor force, individuals with college / associate degree education have the highest percentage of unemployment, with 40.6% or 28 of them being unemployed.
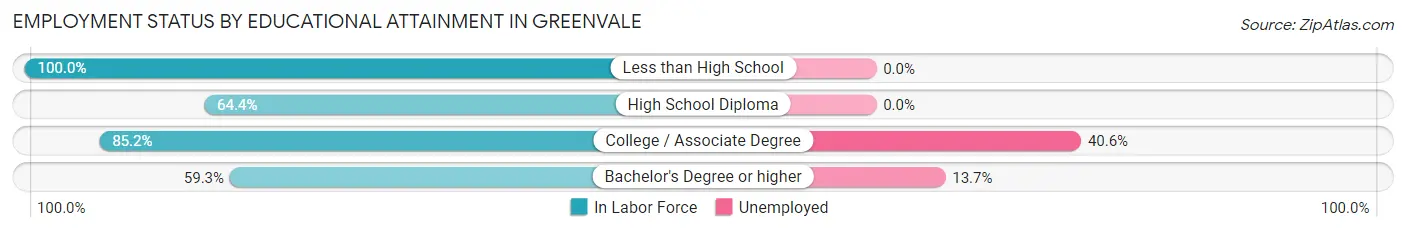
| Educational Attainment | In Labor Force | Unemployed |
| Less than High School | 20 (100.0%) | 0 (0.0%) |
| High School Diploma | 56 (64.4%) | 0 (0.0%) |
| College / Associate Degree | 69 (85.2%) | 33 (40.6%) |
| Bachelor's Degree or higher | 204 (59.3%) | 47 (13.7%) |
| Total | 349 (65.6%) | 85 (16.0%) |
Employment Occupations by Sex in Greenvale
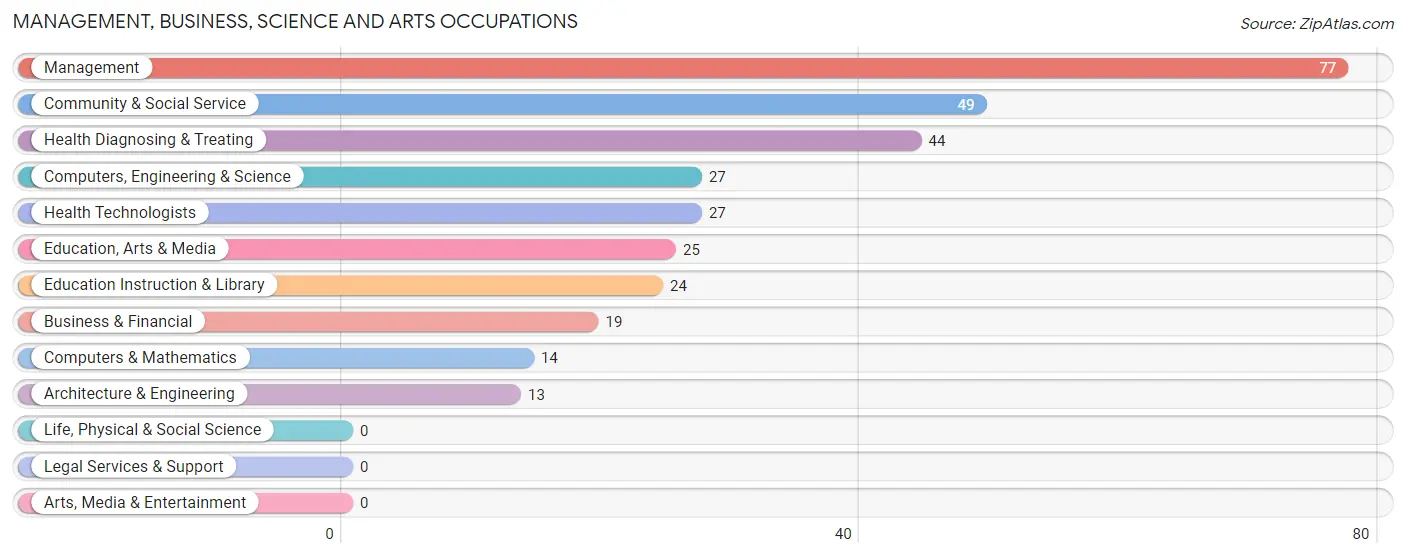
Management, Business, Science and Arts Occupations
The most common Management, Business, Science and Arts occupations in Greenvale are Management (77 | 17.1%), Community & Social Service (49 | 10.9%), Health Diagnosing & Treating (44 | 9.8%), Computers, Engineering & Science (27 | 6.0%), and Health Technologists (27 | 6.0%).
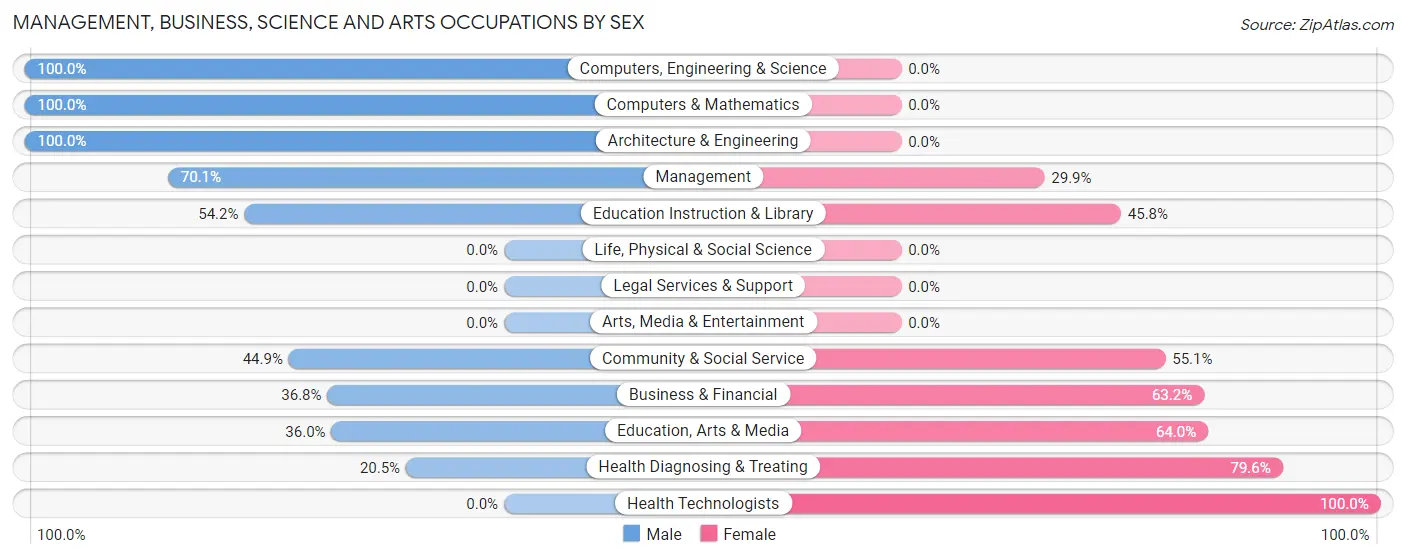
Management, Business, Science and Arts Occupations by Sex
Within the Management, Business, Science and Arts occupations in Greenvale, the most male-oriented occupations are Computers, Engineering & Science (100.0%), Computers & Mathematics (100.0%), and Architecture & Engineering (100.0%), while the most female-oriented occupations are Health Technologists (100.0%), Health Diagnosing & Treating (79.5%), and Education, Arts & Media (64.0%).
| Occupation | Male | Female |
| Management | 54 (70.1%) | 23 (29.9%) |
| Business & Financial | 7 (36.8%) | 12 (63.2%) |
| Computers, Engineering & Science | 27 (100.0%) | 0 (0.0%) |
| Computers & Mathematics | 14 (100.0%) | 0 (0.0%) |
| Architecture & Engineering | 13 (100.0%) | 0 (0.0%) |
| Life, Physical & Social Science | 0 (0.0%) | 0 (0.0%) |
| Community & Social Service | 22 (44.9%) | 27 (55.1%) |
| Education, Arts & Media | 9 (36.0%) | 16 (64.0%) |
| Legal Services & Support | 0 (0.0%) | 0 (0.0%) |
| Education Instruction & Library | 13 (54.2%) | 11 (45.8%) |
| Arts, Media & Entertainment | 0 (0.0%) | 0 (0.0%) |
| Health Diagnosing & Treating | 9 (20.4%) | 35 (79.5%) |
| Health Technologists | 0 (0.0%) | 27 (100.0%) |
| Total (Category) | 119 (55.1%) | 97 (44.9%) |
| Total (Overall) | 267 (59.3%) | 183 (40.7%) |
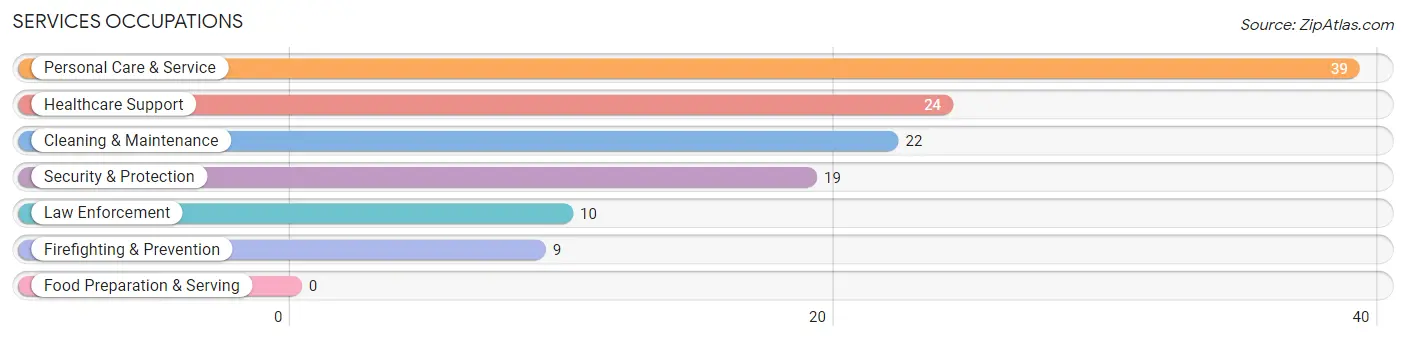
Services Occupations
The most common Services occupations in Greenvale are Personal Care & Service (39 | 8.7%), Healthcare Support (24 | 5.3%), Cleaning & Maintenance (22 | 4.9%), Security & Protection (19 | 4.2%), and Law Enforcement (10 | 2.2%).
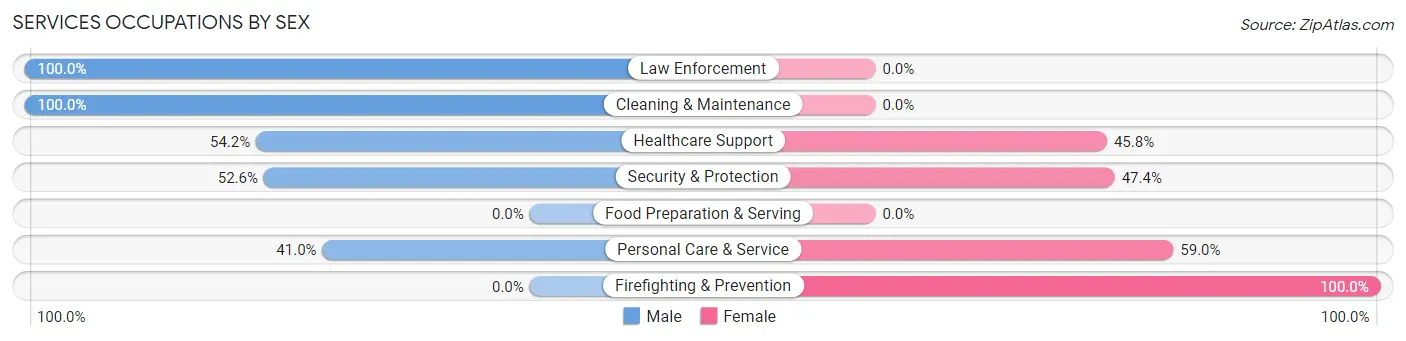
Services Occupations by Sex
Within the Services occupations in Greenvale, the most male-oriented occupations are Law Enforcement (100.0%), Cleaning & Maintenance (100.0%), and Healthcare Support (54.2%), while the most female-oriented occupations are Firefighting & Prevention (100.0%), Personal Care & Service (59.0%), and Security & Protection (47.4%).
| Occupation | Male | Female |
| Healthcare Support | 13 (54.2%) | 11 (45.8%) |
| Security & Protection | 10 (52.6%) | 9 (47.4%) |
| Firefighting & Prevention | 0 (0.0%) | 9 (100.0%) |
| Law Enforcement | 10 (100.0%) | 0 (0.0%) |
| Food Preparation & Serving | 0 (0.0%) | 0 (0.0%) |
| Cleaning & Maintenance | 22 (100.0%) | 0 (0.0%) |
| Personal Care & Service | 16 (41.0%) | 23 (59.0%) |
| Total (Category) | 61 (58.7%) | 43 (41.3%) |
| Total (Overall) | 267 (59.3%) | 183 (40.7%) |
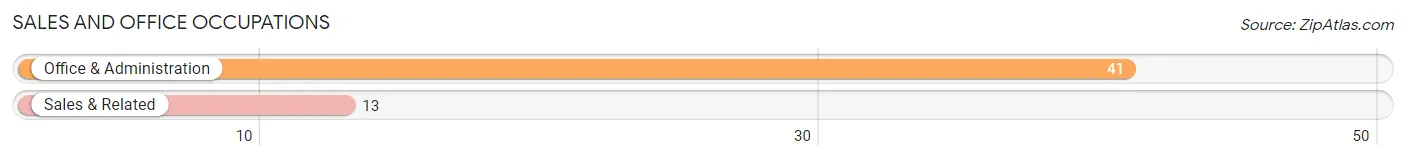
Sales and Office Occupations
The most common Sales and Office occupations in Greenvale are Office & Administration (41 | 9.1%), and Sales & Related (13 | 2.9%).
Sales and Office Occupations by Sex
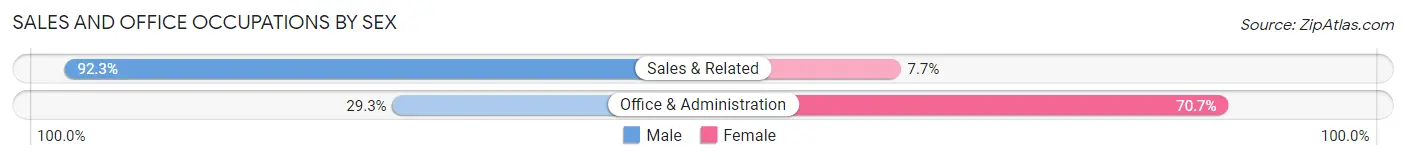
| Occupation | Male | Female |
| Sales & Related | 12 (92.3%) | 1 (7.7%) |
| Office & Administration | 12 (29.3%) | 29 (70.7%) |
| Total (Category) | 24 (44.4%) | 30 (55.6%) |
| Total (Overall) | 267 (59.3%) | 183 (40.7%) |
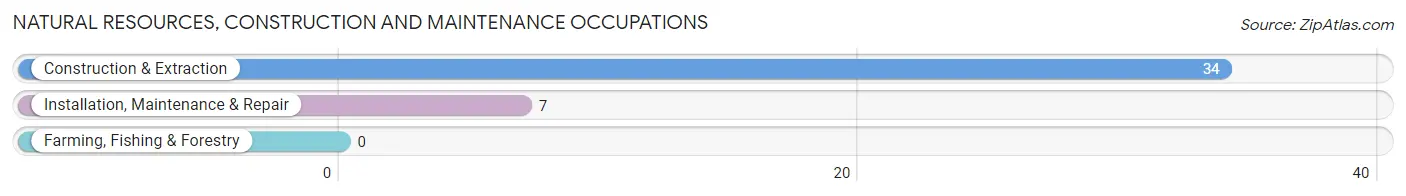
Natural Resources, Construction and Maintenance Occupations
The most common Natural Resources, Construction and Maintenance occupations in Greenvale are Construction & Extraction (34 | 7.6%), and Installation, Maintenance & Repair (7 | 1.6%).
Natural Resources, Construction and Maintenance Occupations by Sex
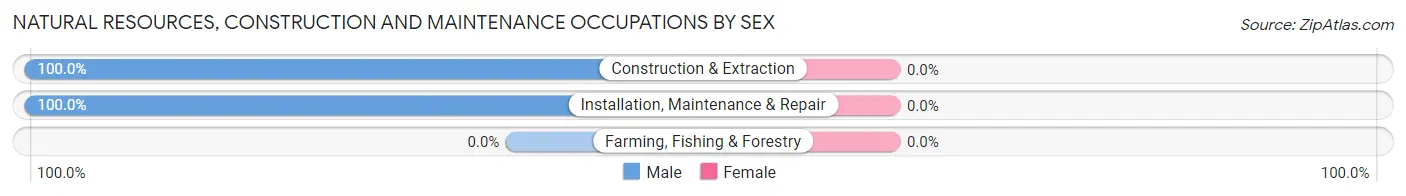
| Occupation | Male | Female |
| Farming, Fishing & Forestry | 0 (0.0%) | 0 (0.0%) |
| Construction & Extraction | 34 (100.0%) | 0 (0.0%) |
| Installation, Maintenance & Repair | 7 (100.0%) | 0 (0.0%) |
| Total (Category) | 41 (100.0%) | 0 (0.0%) |
| Total (Overall) | 267 (59.3%) | 183 (40.7%) |
Production, Transportation and Moving Occupations
The most common Production, Transportation and Moving occupations in Greenvale are Transportation (26 | 5.8%), and Material Moving (9 | 2.0%).
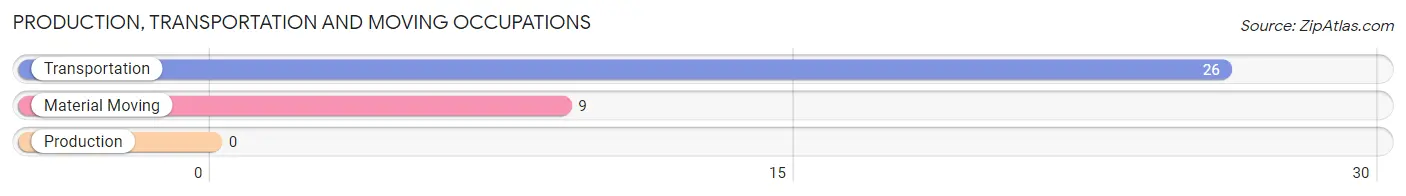
Production, Transportation and Moving Occupations by Sex
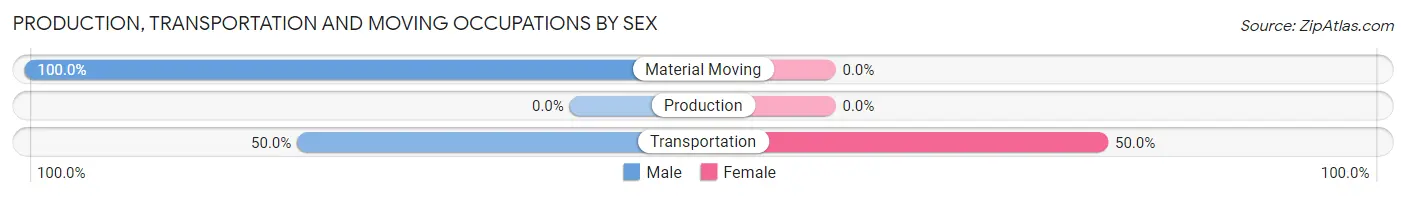
| Occupation | Male | Female |
| Production | 0 (0.0%) | 0 (0.0%) |
| Transportation | 13 (50.0%) | 13 (50.0%) |
| Material Moving | 9 (100.0%) | 0 (0.0%) |
| Total (Category) | 22 (62.9%) | 13 (37.1%) |
| Total (Overall) | 267 (59.3%) | 183 (40.7%) |
Employment Industries by Sex in Greenvale
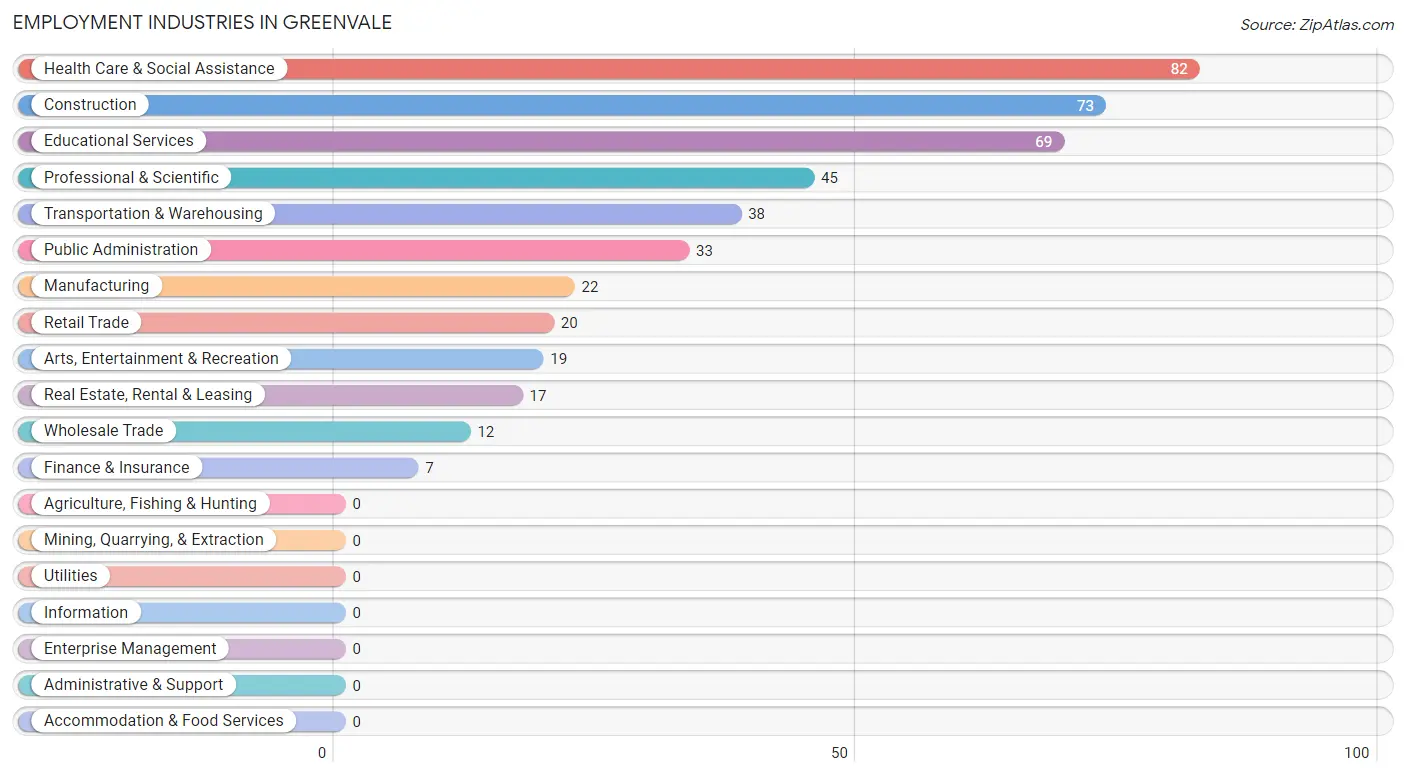
Employment Industries in Greenvale
The major employment industries in Greenvale include Health Care & Social Assistance (82 | 18.2%), Construction (73 | 16.2%), Educational Services (69 | 15.3%), Professional & Scientific (45 | 10.0%), and Transportation & Warehousing (38 | 8.4%).
Employment Industries by Sex in Greenvale
The Greenvale industries that see more men than women are Manufacturing (100.0%), Wholesale Trade (100.0%), and Finance & Insurance (100.0%), whereas the industries that tend to have a higher number of women are Retail Trade (100.0%), Arts, Entertainment & Recreation (100.0%), and Health Care & Social Assistance (58.5%).
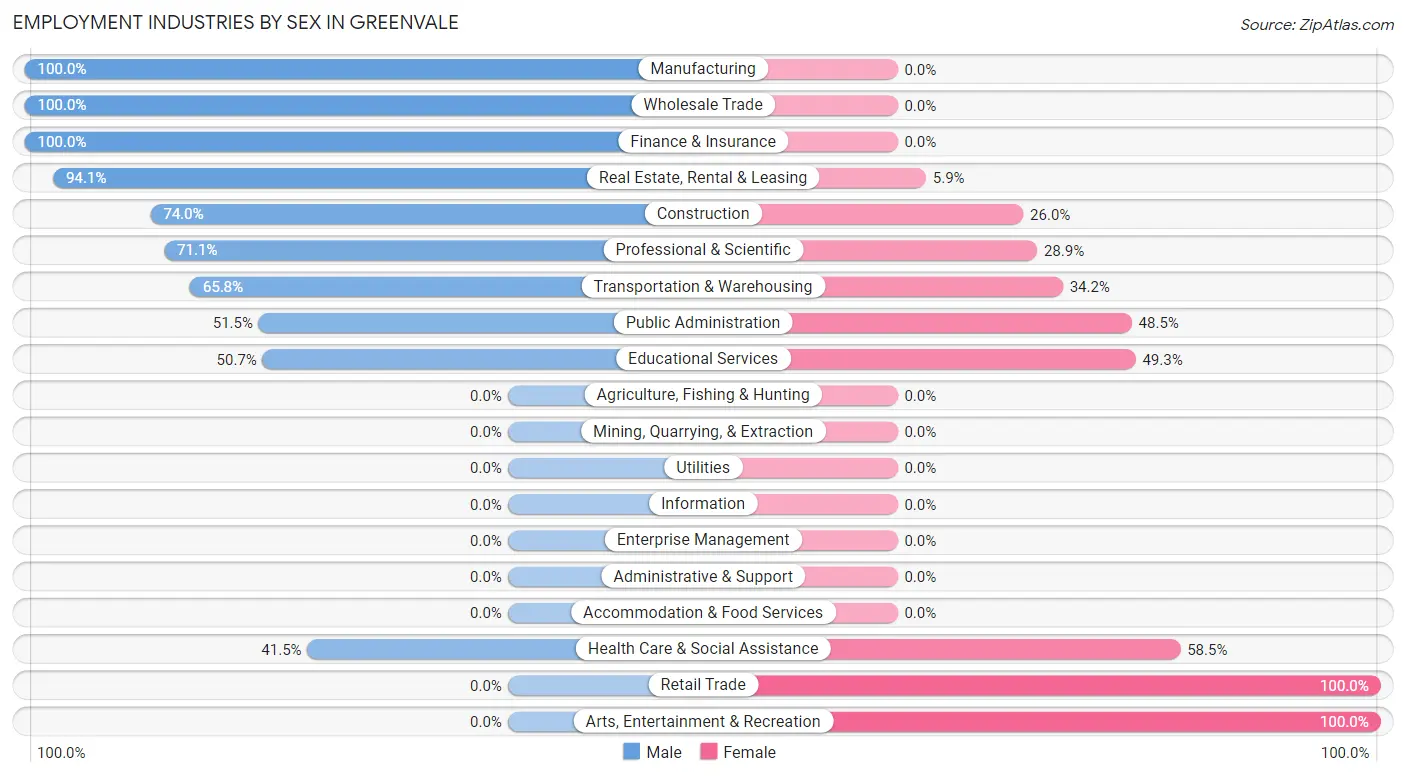
| Industry | Male | Female |
| Agriculture, Fishing & Hunting | 0 (0.0%) | 0 (0.0%) |
| Mining, Quarrying, & Extraction | 0 (0.0%) | 0 (0.0%) |
| Construction | 54 (74.0%) | 19 (26.0%) |
| Manufacturing | 22 (100.0%) | 0 (0.0%) |
| Wholesale Trade | 12 (100.0%) | 0 (0.0%) |
| Retail Trade | 0 (0.0%) | 20 (100.0%) |
| Transportation & Warehousing | 25 (65.8%) | 13 (34.2%) |
| Utilities | 0 (0.0%) | 0 (0.0%) |
| Information | 0 (0.0%) | 0 (0.0%) |
| Finance & Insurance | 7 (100.0%) | 0 (0.0%) |
| Real Estate, Rental & Leasing | 16 (94.1%) | 1 (5.9%) |
| Professional & Scientific | 32 (71.1%) | 13 (28.9%) |
| Enterprise Management | 0 (0.0%) | 0 (0.0%) |
| Administrative & Support | 0 (0.0%) | 0 (0.0%) |
| Educational Services | 35 (50.7%) | 34 (49.3%) |
| Health Care & Social Assistance | 34 (41.5%) | 48 (58.5%) |
| Arts, Entertainment & Recreation | 0 (0.0%) | 19 (100.0%) |
| Accommodation & Food Services | 0 (0.0%) | 0 (0.0%) |
| Public Administration | 17 (51.5%) | 16 (48.5%) |
| Total | 267 (59.3%) | 183 (40.7%) |
Education in Greenvale
School Enrollment in Greenvale
The most common levels of schooling among the 359 students in Greenvale are graduate / professional (151 | 42.1%), college / undergraduate (99 | 27.6%), and high school (43 | 12.0%).
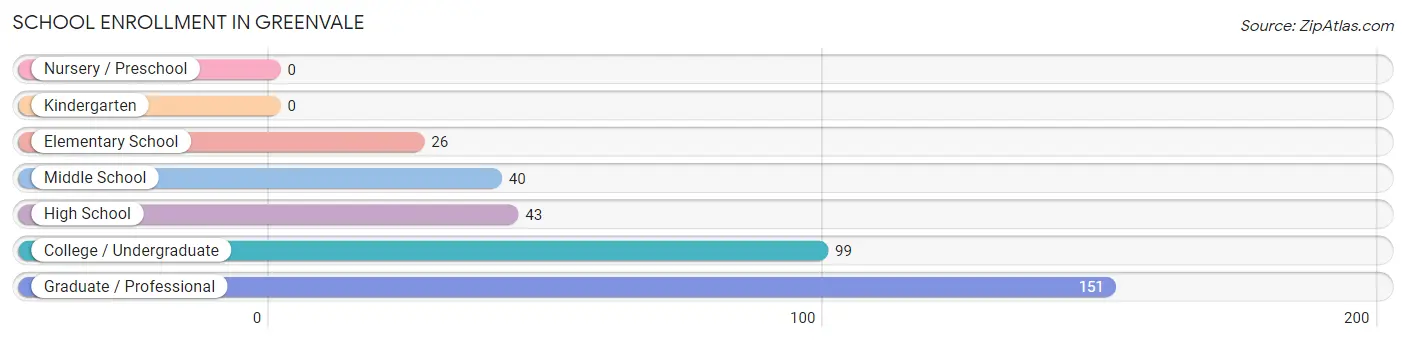
| School Level | # Students | % Students |
| Nursery / Preschool | 0 | 0.0% |
| Kindergarten | 0 | 0.0% |
| Elementary School | 26 | 7.2% |
| Middle School | 40 | 11.1% |
| High School | 43 | 12.0% |
| College / Undergraduate | 99 | 27.6% |
| Graduate / Professional | 151 | 42.1% |
| Total | 359 | 100.0% |
School Enrollment by Age by Funding Source in Greenvale
Out of a total of 359 students who are enrolled in schools in Greenvale, 180 (50.1%) attend a private institution, while the remaining 179 (49.9%) are enrolled in public schools. The age group of 25 to 34 year olds has the highest likelihood of being enrolled in private schools, with 89 (100.0% in the age bracket) enrolled. Conversely, the age group of 5 to 9 year old has the lowest likelihood of being enrolled in a private school, with 26 (100.0% in the age bracket) attending a public institution.
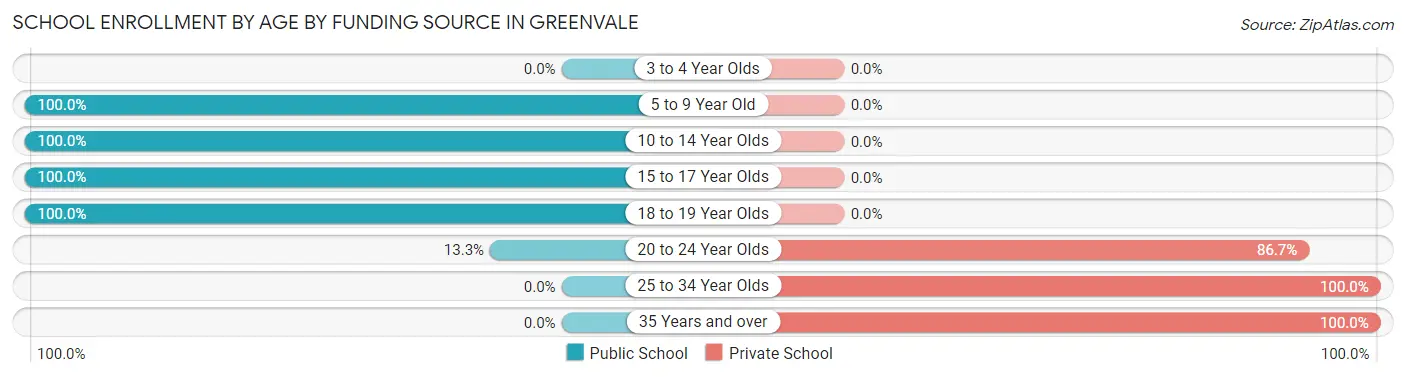
| Age Bracket | Public School | Private School |
| 3 to 4 Year Olds | 0 (0.0%) | 0 (0.0%) |
| 5 to 9 Year Old | 26 (100.0%) | 0 (0.0%) |
| 10 to 14 Year Olds | 66 (100.0%) | 0 (0.0%) |
| 15 to 17 Year Olds | 17 (100.0%) | 0 (0.0%) |
| 18 to 19 Year Olds | 60 (100.0%) | 0 (0.0%) |
| 20 to 24 Year Olds | 10 (13.3%) | 65 (86.7%) |
| 25 to 34 Year Olds | 0 (0.0%) | 89 (100.0%) |
| 35 Years and over | 0 (0.0%) | 26 (100.0%) |
| Total | 179 (49.9%) | 180 (50.1%) |
Educational Attainment by Field of Study in Greenvale
Liberal arts & history (105 | 16.5%), business (97 | 15.3%), literature & languages (94 | 14.8%), education (89 | 14.0%), and computers & mathematics (72 | 11.3%) are the most common fields of study among 635 individuals in Greenvale who have obtained a bachelor's degree or higher.
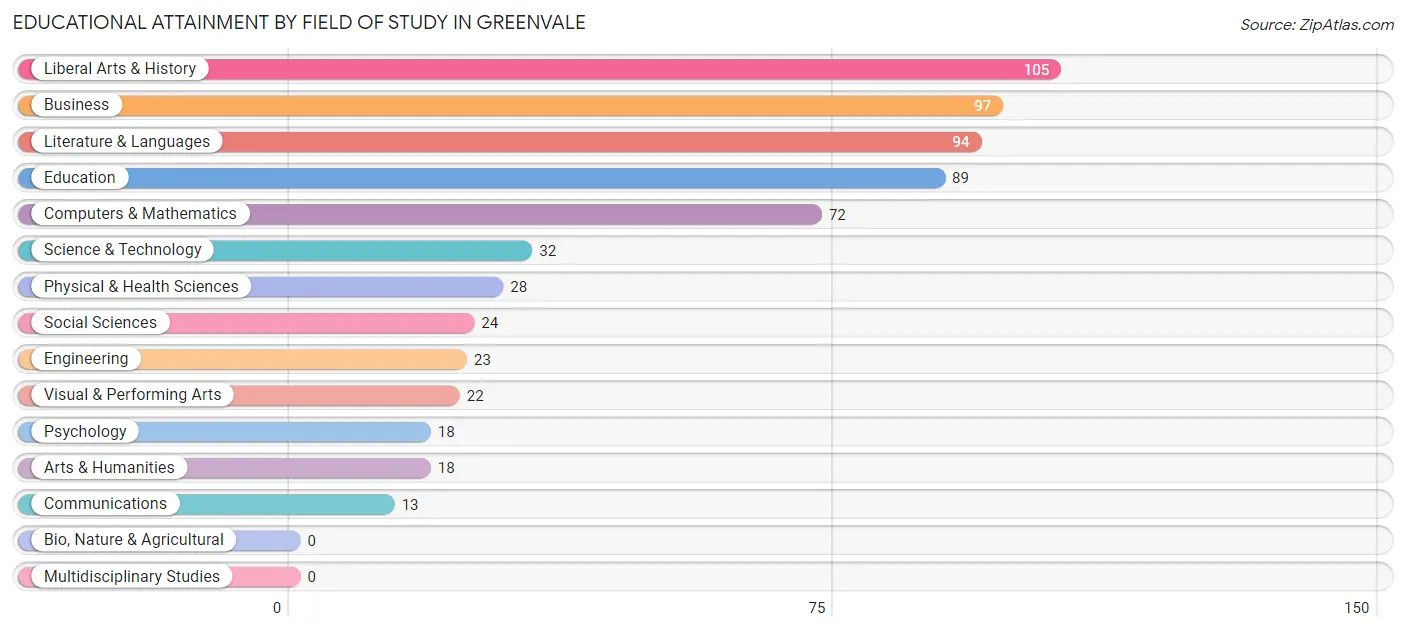
| Field of Study | # Graduates | % Graduates |
| Computers & Mathematics | 72 | 11.3% |
| Bio, Nature & Agricultural | 0 | 0.0% |
| Physical & Health Sciences | 28 | 4.4% |
| Psychology | 18 | 2.8% |
| Social Sciences | 24 | 3.8% |
| Engineering | 23 | 3.6% |
| Multidisciplinary Studies | 0 | 0.0% |
| Science & Technology | 32 | 5.0% |
| Business | 97 | 15.3% |
| Education | 89 | 14.0% |
| Literature & Languages | 94 | 14.8% |
| Liberal Arts & History | 105 | 16.5% |
| Visual & Performing Arts | 22 | 3.5% |
| Communications | 13 | 2.1% |
| Arts & Humanities | 18 | 2.8% |
| Total | 635 | 100.0% |
Transportation & Commute in Greenvale
Vehicle Availability by Sex in Greenvale
The most prevalent vehicle ownership categories in Greenvale are males with 2 vehicles (114, accounting for 45.1%) and females with 2 vehicles (71, making up 67.1%).
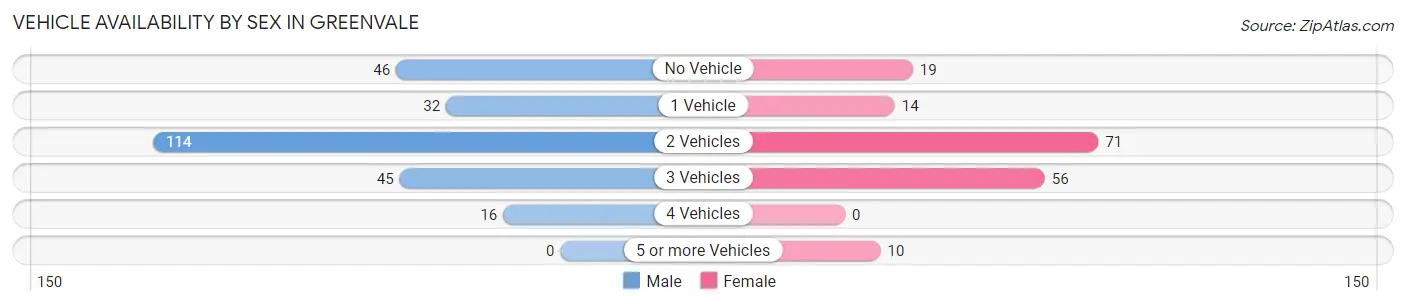
| Vehicles Available | Male | Female |
| No Vehicle | 46 (18.2%) | 19 (11.2%) |
| 1 Vehicle | 32 (12.7%) | 14 (8.2%) |
| 2 Vehicles | 114 (45.1%) | 71 (41.8%) |
| 3 Vehicles | 45 (17.8%) | 56 (32.9%) |
| 4 Vehicles | 16 (6.3%) | 0 (0.0%) |
| 5 or more Vehicles | 0 (0.0%) | 10 (5.9%) |
| Total | 253 (100.0%) | 170 (100.0%) |
Commute Time in Greenvale
The most frequently occuring commute durations in Greenvale are 45 to 59 minutes (81 commuters, 19.6%), 30 to 34 minutes (75 commuters, 18.1%), and 15 to 19 minutes (74 commuters, 17.9%).
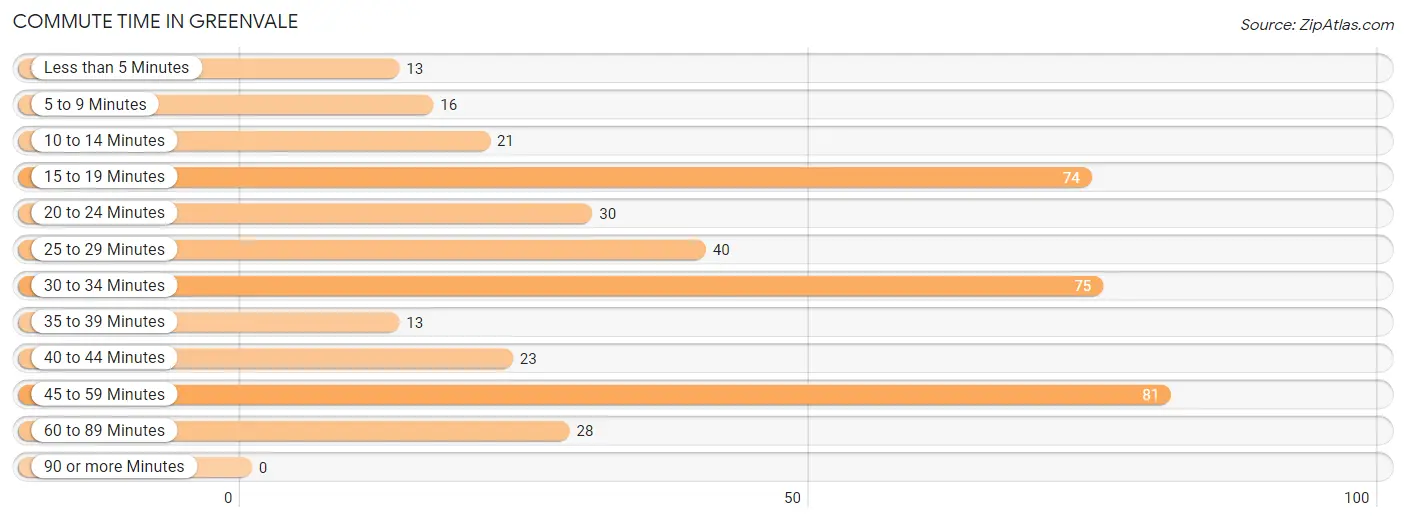
| Commute Time | # Commuters | % Commuters |
| Less than 5 Minutes | 13 | 3.1% |
| 5 to 9 Minutes | 16 | 3.9% |
| 10 to 14 Minutes | 21 | 5.1% |
| 15 to 19 Minutes | 74 | 17.9% |
| 20 to 24 Minutes | 30 | 7.2% |
| 25 to 29 Minutes | 40 | 9.7% |
| 30 to 34 Minutes | 75 | 18.1% |
| 35 to 39 Minutes | 13 | 3.1% |
| 40 to 44 Minutes | 23 | 5.6% |
| 45 to 59 Minutes | 81 | 19.6% |
| 60 to 89 Minutes | 28 | 6.8% |
| 90 or more Minutes | 0 | 0.0% |
Commute Time by Sex in Greenvale
The most common commute times in Greenvale are 45 to 59 minutes (56 commuters, 22.1%) for males and 30 to 34 minutes (29 commuters, 18.0%) for females.
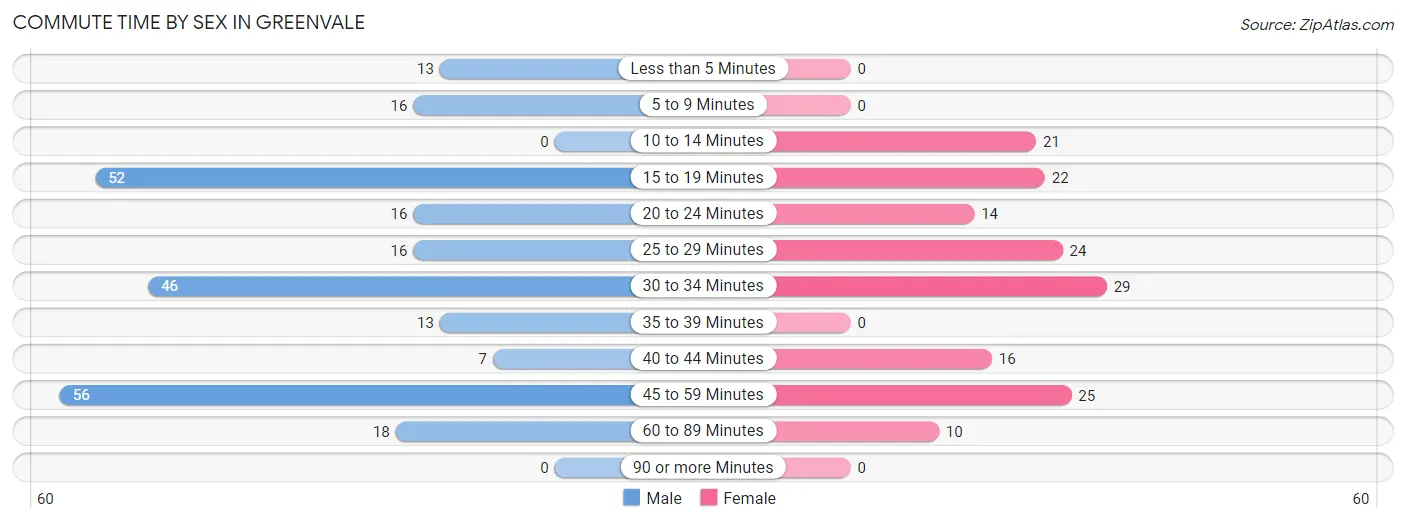
| Commute Time | Male | Female |
| Less than 5 Minutes | 13 (5.1%) | 0 (0.0%) |
| 5 to 9 Minutes | 16 (6.3%) | 0 (0.0%) |
| 10 to 14 Minutes | 0 (0.0%) | 21 (13.0%) |
| 15 to 19 Minutes | 52 (20.5%) | 22 (13.7%) |
| 20 to 24 Minutes | 16 (6.3%) | 14 (8.7%) |
| 25 to 29 Minutes | 16 (6.3%) | 24 (14.9%) |
| 30 to 34 Minutes | 46 (18.2%) | 29 (18.0%) |
| 35 to 39 Minutes | 13 (5.1%) | 0 (0.0%) |
| 40 to 44 Minutes | 7 (2.8%) | 16 (9.9%) |
| 45 to 59 Minutes | 56 (22.1%) | 25 (15.5%) |
| 60 to 89 Minutes | 18 (7.1%) | 10 (6.2%) |
| 90 or more Minutes | 0 (0.0%) | 0 (0.0%) |
Time of Departure to Work by Sex in Greenvale
The most frequent times of departure to work in Greenvale are 7:30 AM to 7:59 AM (77, 30.4%) for males and 10:00 AM to 10:59 AM (29, 18.0%) for females.
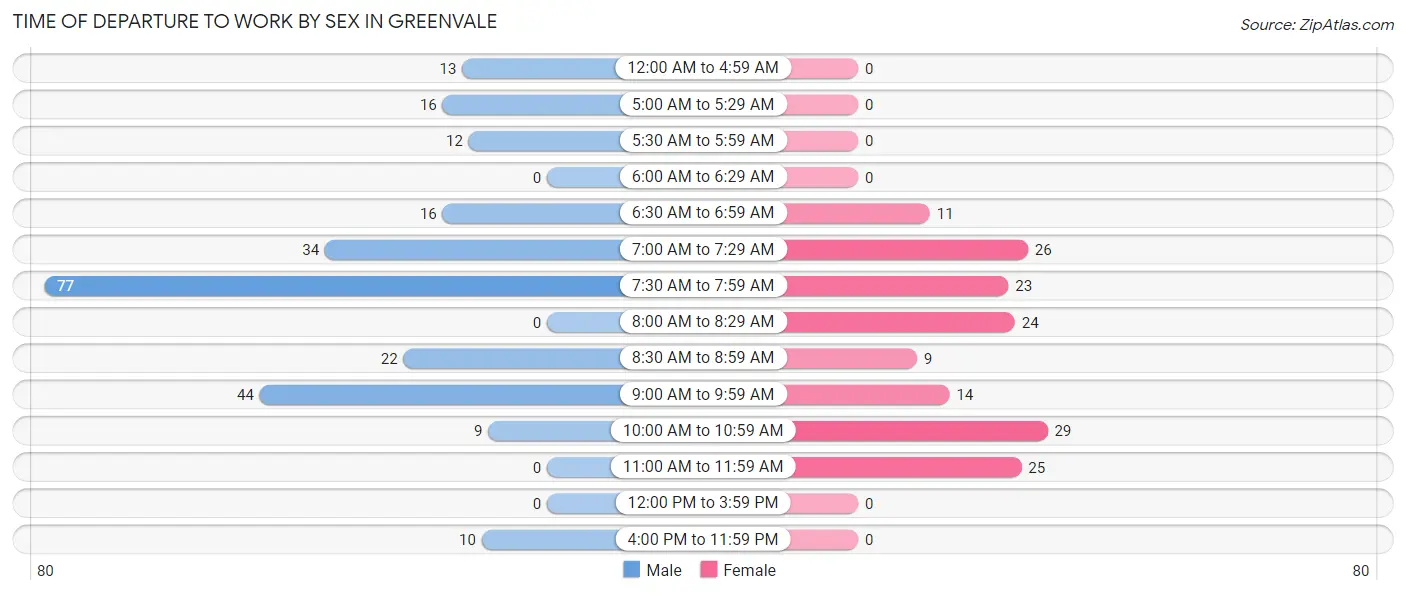
| Time of Departure | Male | Female |
| 12:00 AM to 4:59 AM | 13 (5.1%) | 0 (0.0%) |
| 5:00 AM to 5:29 AM | 16 (6.3%) | 0 (0.0%) |
| 5:30 AM to 5:59 AM | 12 (4.7%) | 0 (0.0%) |
| 6:00 AM to 6:29 AM | 0 (0.0%) | 0 (0.0%) |
| 6:30 AM to 6:59 AM | 16 (6.3%) | 11 (6.8%) |
| 7:00 AM to 7:29 AM | 34 (13.4%) | 26 (16.2%) |
| 7:30 AM to 7:59 AM | 77 (30.4%) | 23 (14.3%) |
| 8:00 AM to 8:29 AM | 0 (0.0%) | 24 (14.9%) |
| 8:30 AM to 8:59 AM | 22 (8.7%) | 9 (5.6%) |
| 9:00 AM to 9:59 AM | 44 (17.4%) | 14 (8.7%) |
| 10:00 AM to 10:59 AM | 9 (3.6%) | 29 (18.0%) |
| 11:00 AM to 11:59 AM | 0 (0.0%) | 25 (15.5%) |
| 12:00 PM to 3:59 PM | 0 (0.0%) | 0 (0.0%) |
| 4:00 PM to 11:59 PM | 10 (4.0%) | 0 (0.0%) |
| Total | 253 (100.0%) | 161 (100.0%) |
Housing Occupancy in Greenvale
Occupancy by Ownership in Greenvale
Of the total 389 dwellings in Greenvale, owner-occupied units account for 316 (81.2%), while renter-occupied units make up 73 (18.8%).
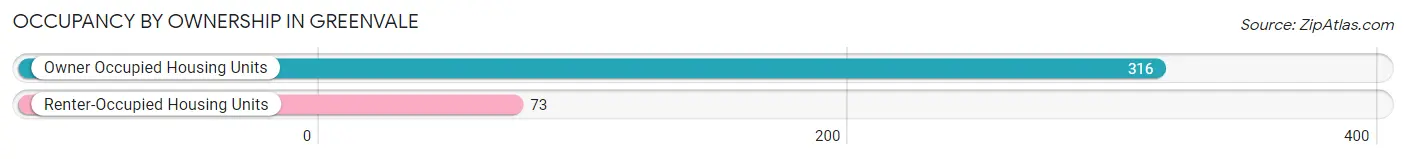
| Occupancy | # Housing Units | % Housing Units |
| Owner Occupied Housing Units | 316 | 81.2% |
| Renter-Occupied Housing Units | 73 | 18.8% |
| Total Occupied Housing Units | 389 | 100.0% |
Occupancy by Household Size in Greenvale
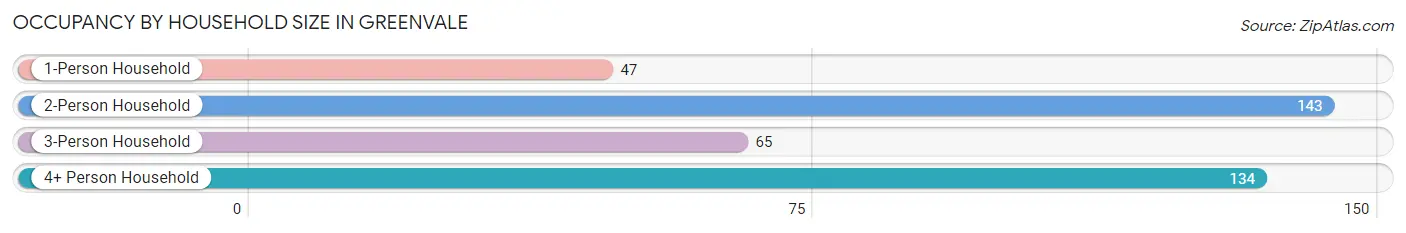
| Household Size | # Housing Units | % Housing Units |
| 1-Person Household | 47 | 12.1% |
| 2-Person Household | 143 | 36.8% |
| 3-Person Household | 65 | 16.7% |
| 4+ Person Household | 134 | 34.4% |
| Total Housing Units | 389 | 100.0% |
Occupancy by Ownership by Household Size in Greenvale
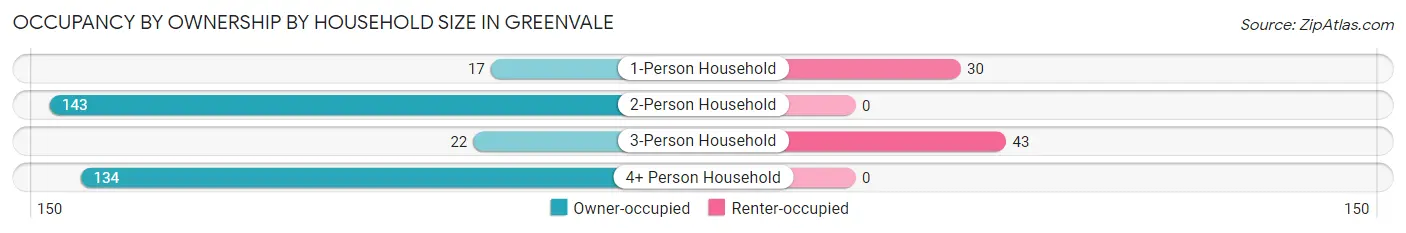
| Household Size | Owner-occupied | Renter-occupied |
| 1-Person Household | 17 (36.2%) | 30 (63.8%) |
| 2-Person Household | 143 (100.0%) | 0 (0.0%) |
| 3-Person Household | 22 (33.9%) | 43 (66.1%) |
| 4+ Person Household | 134 (100.0%) | 0 (0.0%) |
| Total Housing Units | 316 (81.2%) | 73 (18.8%) |
Occupancy by Educational Attainment in Greenvale
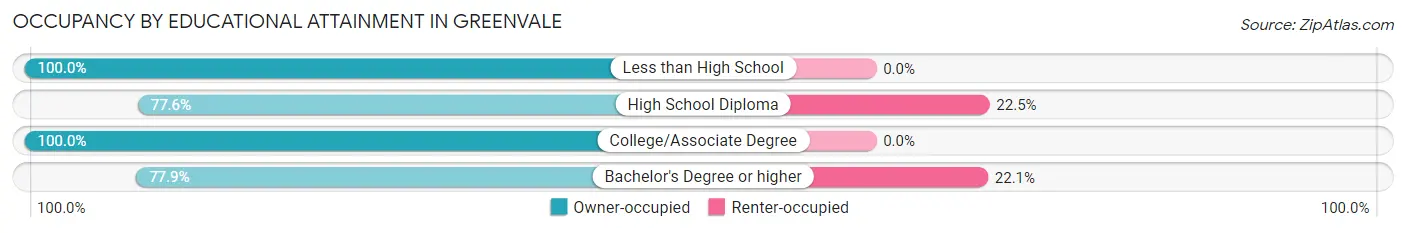
| Household Size | Owner-occupied | Renter-occupied |
| Less than High School | 15 (100.0%) | 0 (0.0%) |
| High School Diploma | 38 (77.5%) | 11 (22.5%) |
| College/Associate Degree | 45 (100.0%) | 0 (0.0%) |
| Bachelor's Degree or higher | 218 (77.9%) | 62 (22.1%) |
Occupancy by Age of Householder in Greenvale
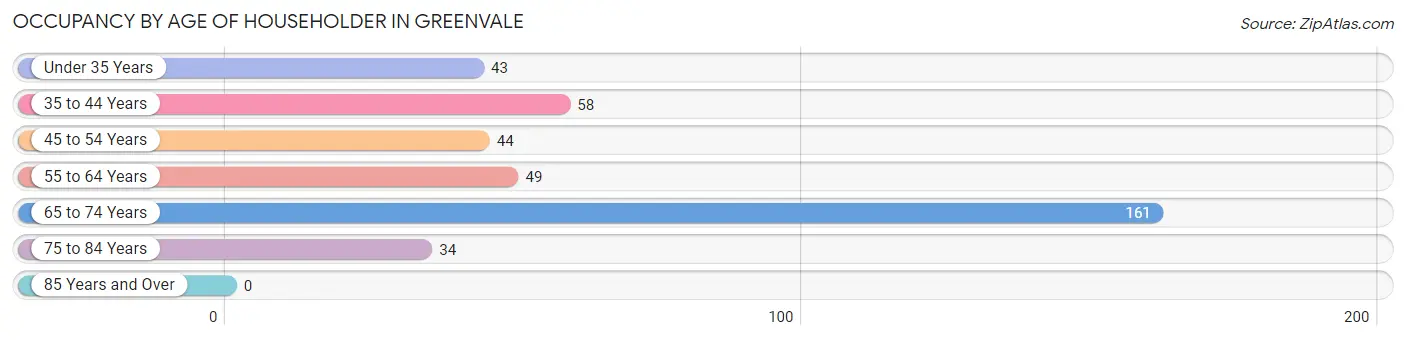
| Age Bracket | # Households | % Households |
| Under 35 Years | 43 | 11.1% |
| 35 to 44 Years | 58 | 14.9% |
| 45 to 54 Years | 44 | 11.3% |
| 55 to 64 Years | 49 | 12.6% |
| 65 to 74 Years | 161 | 41.4% |
| 75 to 84 Years | 34 | 8.7% |
| 85 Years and Over | 0 | 0.0% |
| Total | 389 | 100.0% |
Housing Finances in Greenvale
Median Income by Occupancy in Greenvale
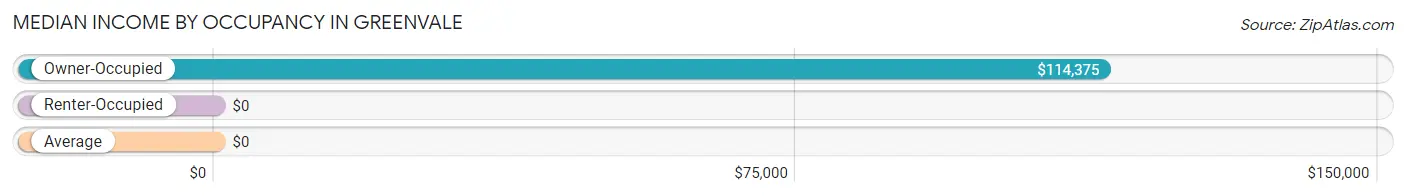
| Occupancy Type | # Households | Median Income |
| Owner-Occupied | 316 (81.2%) | $114,375 |
| Renter-Occupied | 73 (18.8%) | $0 |
| Average | 389 (100.0%) | $0 |
Occupancy by Householder Income Bracket in Greenvale
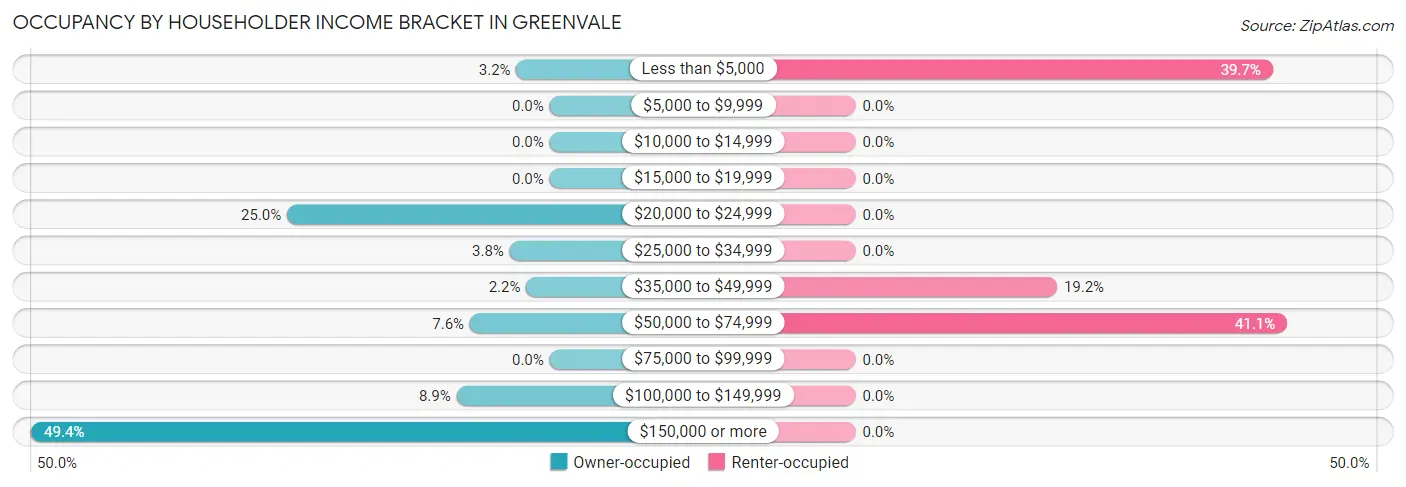
| Income Bracket | Owner-occupied | Renter-occupied |
| Less than $5,000 | 10 (3.2%) | 29 (39.7%) |
| $5,000 to $9,999 | 0 (0.0%) | 0 (0.0%) |
| $10,000 to $14,999 | 0 (0.0%) | 0 (0.0%) |
| $15,000 to $19,999 | 0 (0.0%) | 0 (0.0%) |
| $20,000 to $24,999 | 79 (25.0%) | 0 (0.0%) |
| $25,000 to $34,999 | 12 (3.8%) | 0 (0.0%) |
| $35,000 to $49,999 | 7 (2.2%) | 14 (19.2%) |
| $50,000 to $74,999 | 24 (7.6%) | 30 (41.1%) |
| $75,000 to $99,999 | 0 (0.0%) | 0 (0.0%) |
| $100,000 to $149,999 | 28 (8.9%) | 0 (0.0%) |
| $150,000 or more | 156 (49.4%) | 0 (0.0%) |
| Total | 316 (100.0%) | 73 (100.0%) |
Monthly Housing Cost Tiers in Greenvale
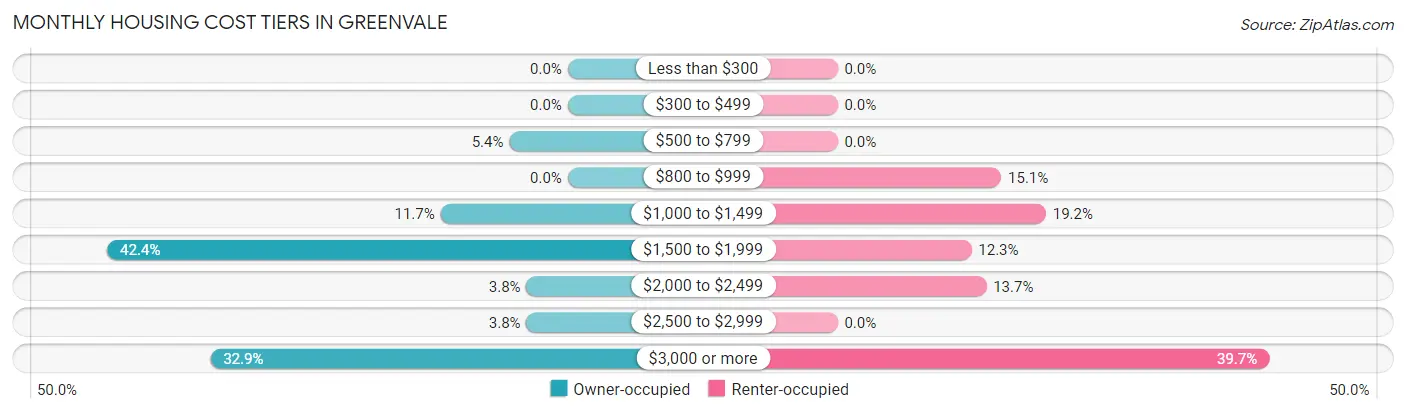
| Monthly Cost | Owner-occupied | Renter-occupied |
| Less than $300 | 0 (0.0%) | 0 (0.0%) |
| $300 to $499 | 0 (0.0%) | 0 (0.0%) |
| $500 to $799 | 17 (5.4%) | 0 (0.0%) |
| $800 to $999 | 0 (0.0%) | 11 (15.1%) |
| $1,000 to $1,499 | 37 (11.7%) | 14 (19.2%) |
| $1,500 to $1,999 | 134 (42.4%) | 9 (12.3%) |
| $2,000 to $2,499 | 12 (3.8%) | 10 (13.7%) |
| $2,500 to $2,999 | 12 (3.8%) | 0 (0.0%) |
| $3,000 or more | 104 (32.9%) | 29 (39.7%) |
| Total | 316 (100.0%) | 73 (100.0%) |
Physical Housing Characteristics in Greenvale
Housing Structures in Greenvale
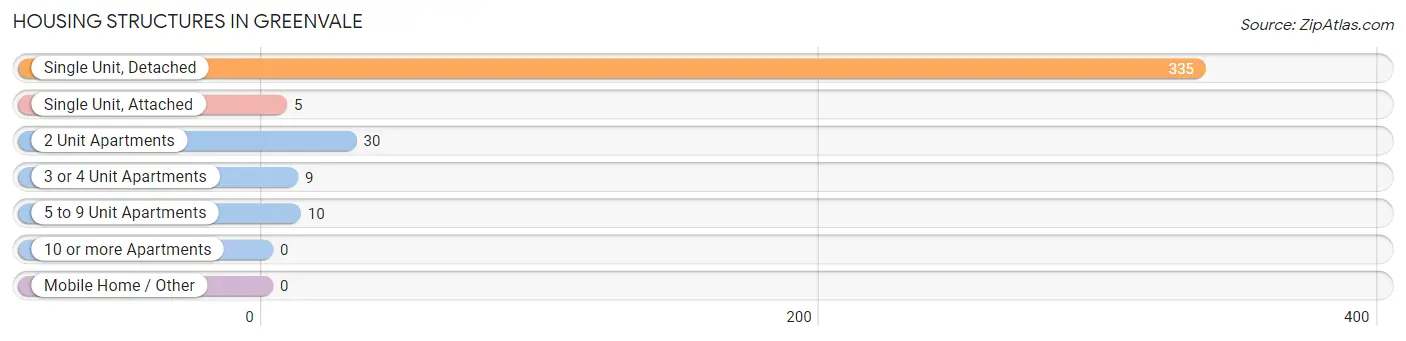
| Structure Type | # Housing Units | % Housing Units |
| Single Unit, Detached | 335 | 86.1% |
| Single Unit, Attached | 5 | 1.3% |
| 2 Unit Apartments | 30 | 7.7% |
| 3 or 4 Unit Apartments | 9 | 2.3% |
| 5 to 9 Unit Apartments | 10 | 2.6% |
| 10 or more Apartments | 0 | 0.0% |
| Mobile Home / Other | 0 | 0.0% |
| Total | 389 | 100.0% |
Housing Structures by Occupancy in Greenvale
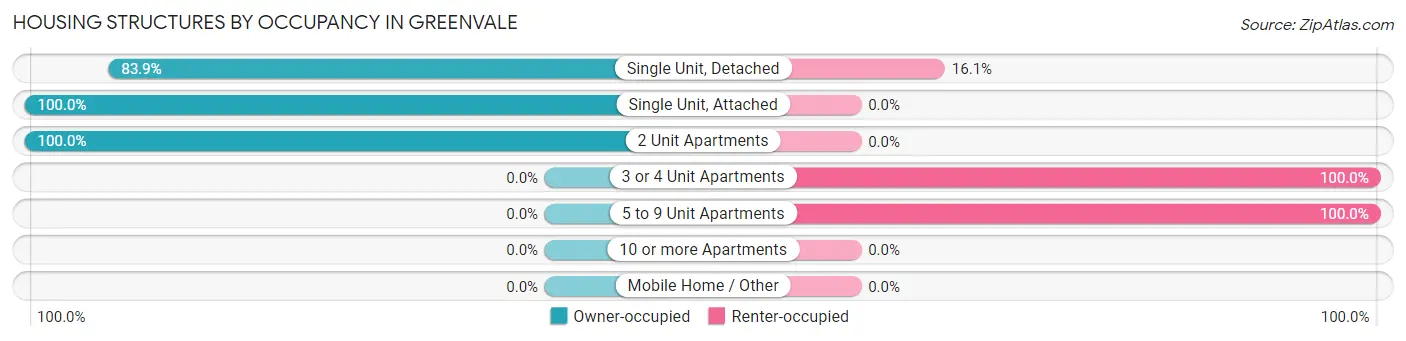
| Structure Type | Owner-occupied | Renter-occupied |
| Single Unit, Detached | 281 (83.9%) | 54 (16.1%) |
| Single Unit, Attached | 5 (100.0%) | 0 (0.0%) |
| 2 Unit Apartments | 30 (100.0%) | 0 (0.0%) |
| 3 or 4 Unit Apartments | 0 (0.0%) | 9 (100.0%) |
| 5 to 9 Unit Apartments | 0 (0.0%) | 10 (100.0%) |
| 10 or more Apartments | 0 (0.0%) | 0 (0.0%) |
| Mobile Home / Other | 0 (0.0%) | 0 (0.0%) |
| Total | 316 (81.2%) | 73 (18.8%) |
Housing Structures by Number of Rooms in Greenvale
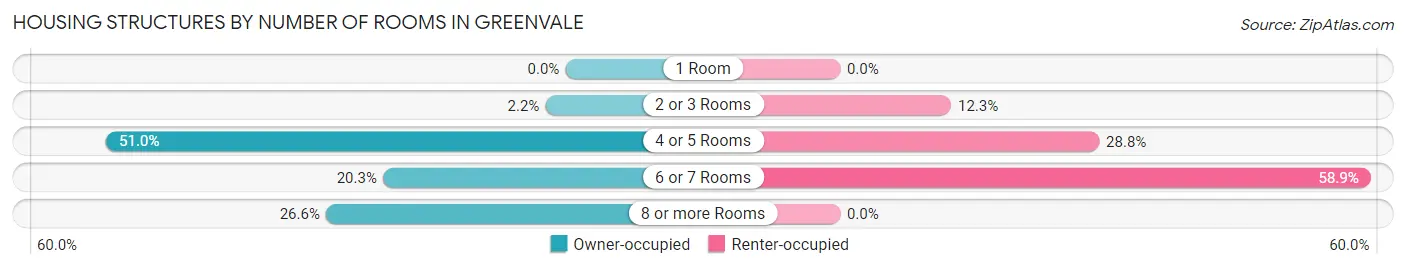
| Number of Rooms | Owner-occupied | Renter-occupied |
| 1 Room | 0 (0.0%) | 0 (0.0%) |
| 2 or 3 Rooms | 7 (2.2%) | 9 (12.3%) |
| 4 or 5 Rooms | 161 (50.9%) | 21 (28.8%) |
| 6 or 7 Rooms | 64 (20.3%) | 43 (58.9%) |
| 8 or more Rooms | 84 (26.6%) | 0 (0.0%) |
| Total | 316 (100.0%) | 73 (100.0%) |
Housing Structure by Heating Type in Greenvale
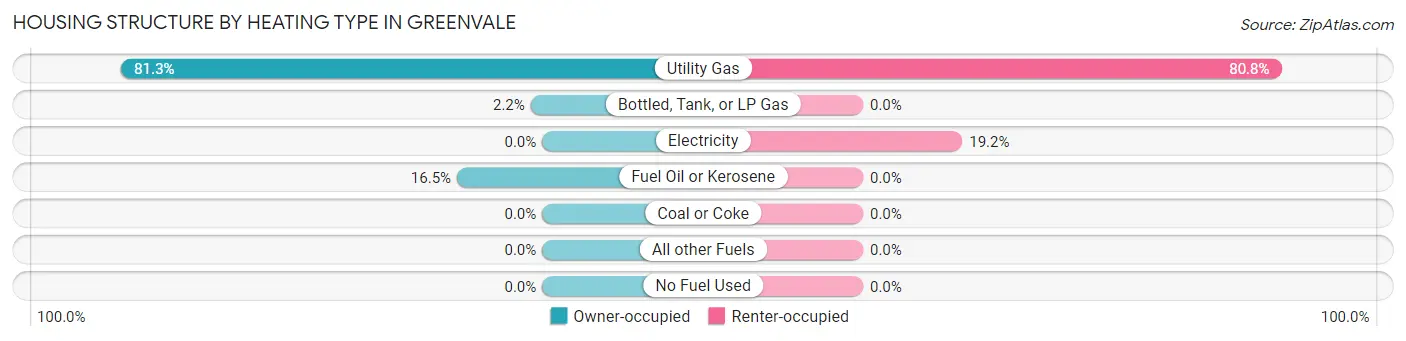
| Heating Type | Owner-occupied | Renter-occupied |
| Utility Gas | 257 (81.3%) | 59 (80.8%) |
| Bottled, Tank, or LP Gas | 7 (2.2%) | 0 (0.0%) |
| Electricity | 0 (0.0%) | 14 (19.2%) |
| Fuel Oil or Kerosene | 52 (16.5%) | 0 (0.0%) |
| Coal or Coke | 0 (0.0%) | 0 (0.0%) |
| All other Fuels | 0 (0.0%) | 0 (0.0%) |
| No Fuel Used | 0 (0.0%) | 0 (0.0%) |
| Total | 316 (100.0%) | 73 (100.0%) |
Household Vehicle Usage in Greenvale
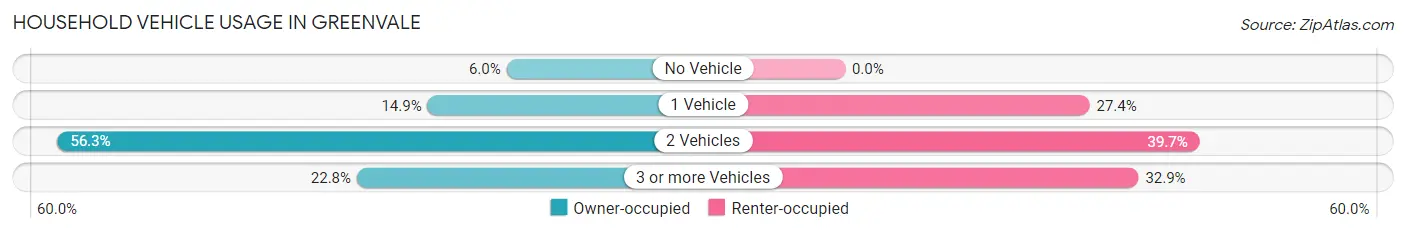
| Vehicles per Household | Owner-occupied | Renter-occupied |
| No Vehicle | 19 (6.0%) | 0 (0.0%) |
| 1 Vehicle | 47 (14.9%) | 20 (27.4%) |
| 2 Vehicles | 178 (56.3%) | 29 (39.7%) |
| 3 or more Vehicles | 72 (22.8%) | 24 (32.9%) |
| Total | 316 (100.0%) | 73 (100.0%) |
Real Estate & Mortgages in Greenvale
Real Estate and Mortgage Overview in Greenvale
| Characteristic | Without Mortgage | With Mortgage |
| Housing Units | 167 | 149 |
| Median Property Value | $596,700 | $669,300 |
| Median Household Income | - | - |
| Monthly Housing Costs | $1,501 | $104 |
| Real Estate Taxes | $10,001 | $7 |
Property Value by Mortgage Status in Greenvale
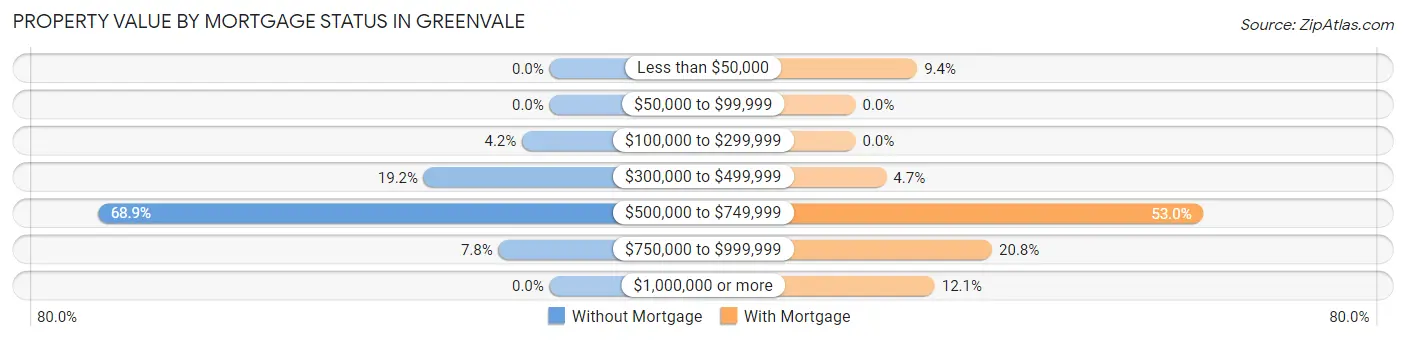
| Property Value | Without Mortgage | With Mortgage |
| Less than $50,000 | 0 (0.0%) | 14 (9.4%) |
| $50,000 to $99,999 | 0 (0.0%) | 0 (0.0%) |
| $100,000 to $299,999 | 7 (4.2%) | 0 (0.0%) |
| $300,000 to $499,999 | 32 (19.2%) | 7 (4.7%) |
| $500,000 to $749,999 | 115 (68.9%) | 79 (53.0%) |
| $750,000 to $999,999 | 13 (7.8%) | 31 (20.8%) |
| $1,000,000 or more | 0 (0.0%) | 18 (12.1%) |
| Total | 167 (100.0%) | 149 (100.0%) |
Household Income by Mortgage Status in Greenvale
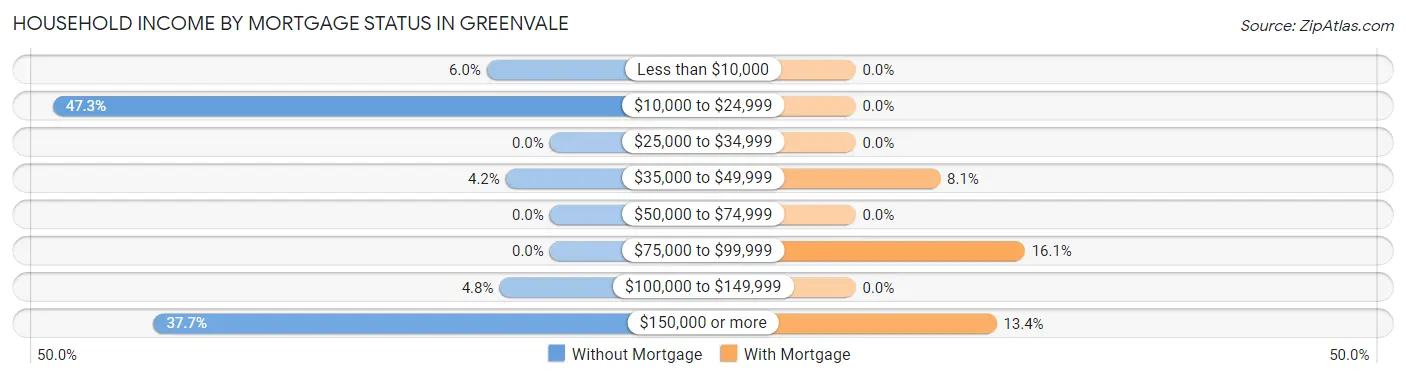
| Household Income | Without Mortgage | With Mortgage |
| Less than $10,000 | 10 (6.0%) | 0 (0.0%) |
| $10,000 to $24,999 | 79 (47.3%) | 0 (0.0%) |
| $25,000 to $34,999 | 0 (0.0%) | 0 (0.0%) |
| $35,000 to $49,999 | 7 (4.2%) | 12 (8.1%) |
| $50,000 to $74,999 | 0 (0.0%) | 0 (0.0%) |
| $75,000 to $99,999 | 0 (0.0%) | 24 (16.1%) |
| $100,000 to $149,999 | 8 (4.8%) | 0 (0.0%) |
| $150,000 or more | 63 (37.7%) | 20 (13.4%) |
| Total | 167 (100.0%) | 149 (100.0%) |
Property Value to Household Income Ratio in Greenvale
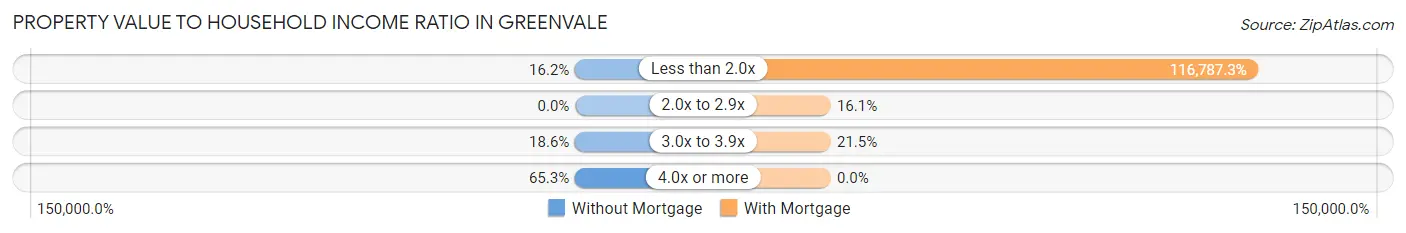
| Value-to-Income Ratio | Without Mortgage | With Mortgage |
| Less than 2.0x | 27 (16.2%) | 174,013 (116,787.2%) |
| 2.0x to 2.9x | 0 (0.0%) | 24 (16.1%) |
| 3.0x to 3.9x | 31 (18.6%) | 32 (21.5%) |
| 4.0x or more | 109 (65.3%) | 0 (0.0%) |
| Total | 167 (100.0%) | 149 (100.0%) |
Real Estate Taxes by Mortgage Status in Greenvale
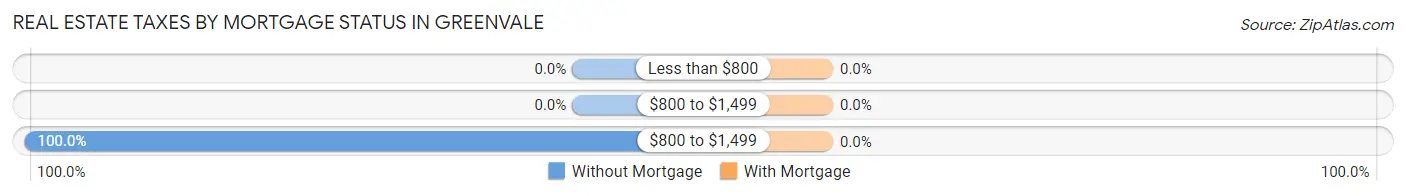
| Property Taxes | Without Mortgage | With Mortgage |
| Less than $800 | 0 (0.0%) | 0 (0.0%) |
| $800 to $1,499 | 0 (0.0%) | 0 (0.0%) |
| $800 to $1,499 | 167 (100.0%) | 0 (0.0%) |
| Total | 167 (100.0%) | 149 (100.0%) |
Health & Disability in Greenvale
Health Insurance Coverage by Age in Greenvale
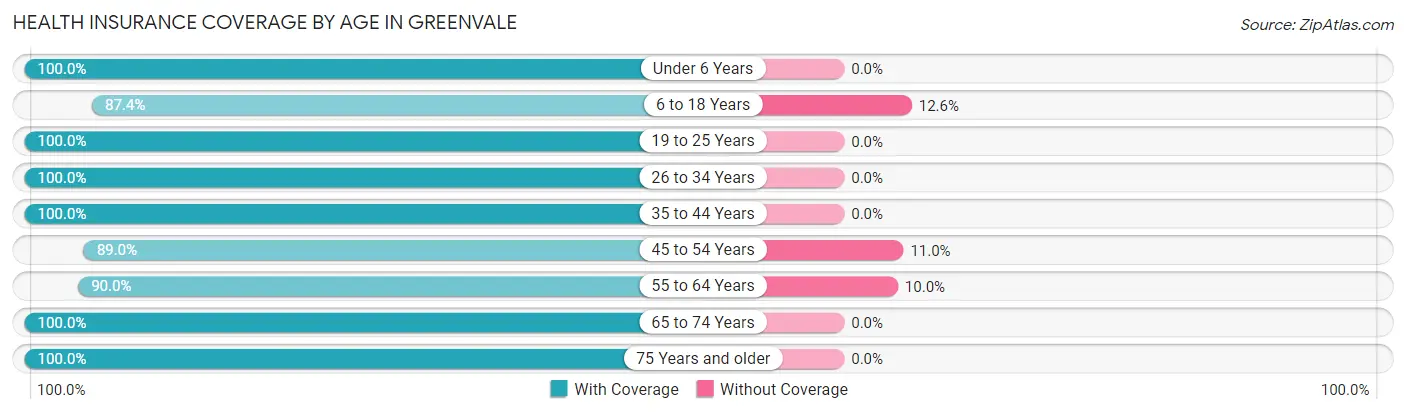
| Age Bracket | With Coverage | Without Coverage |
| Under 6 Years | 11 (100.0%) | 0 (0.0%) |
| 6 to 18 Years | 125 (87.4%) | 18 (12.6%) |
| 19 to 25 Years | 119 (100.0%) | 0 (0.0%) |
| 26 to 34 Years | 158 (100.0%) | 0 (0.0%) |
| 35 to 44 Years | 109 (100.0%) | 0 (0.0%) |
| 45 to 54 Years | 129 (89.0%) | 16 (11.0%) |
| 55 to 64 Years | 108 (90.0%) | 12 (10.0%) |
| 65 to 74 Years | 231 (100.0%) | 0 (0.0%) |
| 75 Years and older | 128 (100.0%) | 0 (0.0%) |
| Total | 1,118 (96.1%) | 46 (4.0%) |
Health Insurance Coverage by Citizenship Status in Greenvale
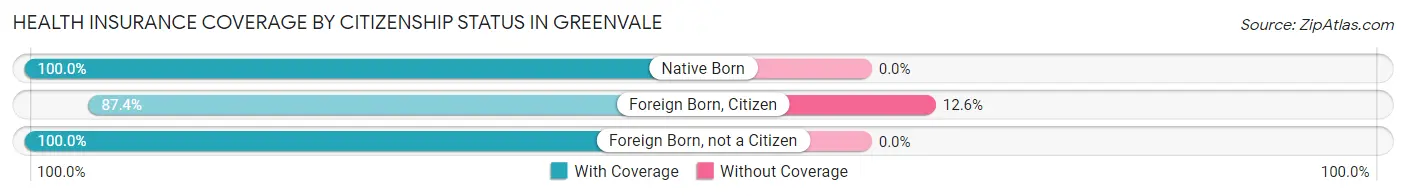
| Citizenship Status | With Coverage | Without Coverage |
| Native Born | 11 (100.0%) | 0 (0.0%) |
| Foreign Born, Citizen | 125 (87.4%) | 18 (12.6%) |
| Foreign Born, not a Citizen | 119 (100.0%) | 0 (0.0%) |
Health Insurance Coverage by Household Income in Greenvale
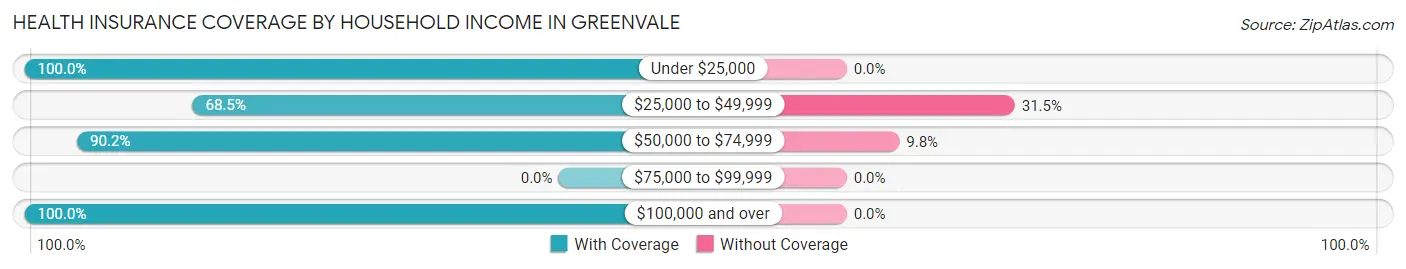
| Household Income | With Coverage | Without Coverage |
| Under $25,000 | 259 (100.0%) | 0 (0.0%) |
| $25,000 to $49,999 | 74 (68.5%) | 34 (31.5%) |
| $50,000 to $74,999 | 110 (90.2%) | 12 (9.8%) |
| $75,000 to $99,999 | 0 (0.0%) | 0 (0.0%) |
| $100,000 and over | 675 (100.0%) | 0 (0.0%) |
Public vs Private Health Insurance Coverage by Age in Greenvale
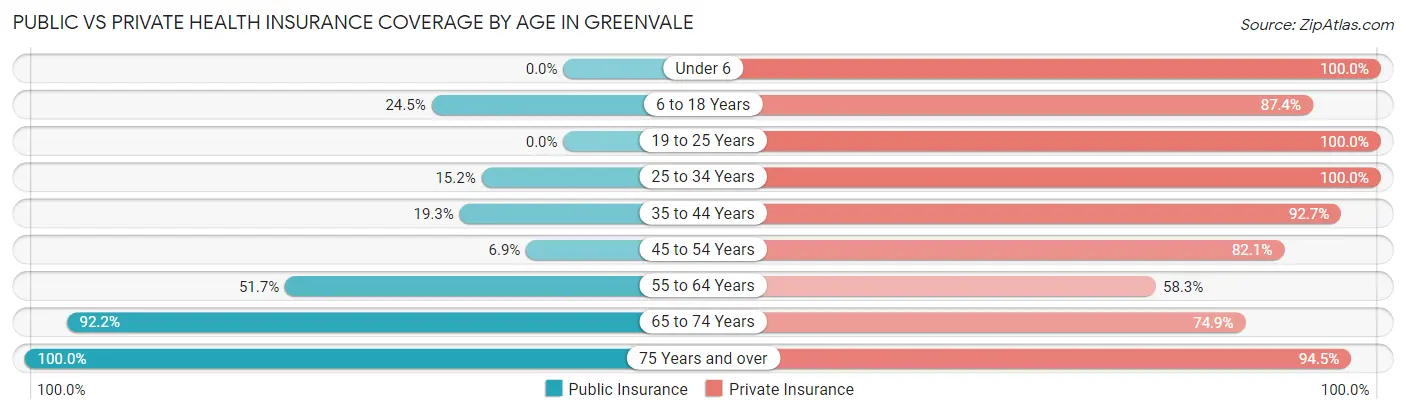
| Age Bracket | Public Insurance | Private Insurance |
| Under 6 | 0 (0.0%) | 11 (100.0%) |
| 6 to 18 Years | 35 (24.5%) | 125 (87.4%) |
| 19 to 25 Years | 0 (0.0%) | 119 (100.0%) |
| 25 to 34 Years | 24 (15.2%) | 158 (100.0%) |
| 35 to 44 Years | 21 (19.3%) | 101 (92.7%) |
| 45 to 54 Years | 10 (6.9%) | 119 (82.1%) |
| 55 to 64 Years | 62 (51.7%) | 70 (58.3%) |
| 65 to 74 Years | 213 (92.2%) | 173 (74.9%) |
| 75 Years and over | 128 (100.0%) | 121 (94.5%) |
| Total | 493 (42.3%) | 997 (85.7%) |
Disability Status by Sex by Age in Greenvale
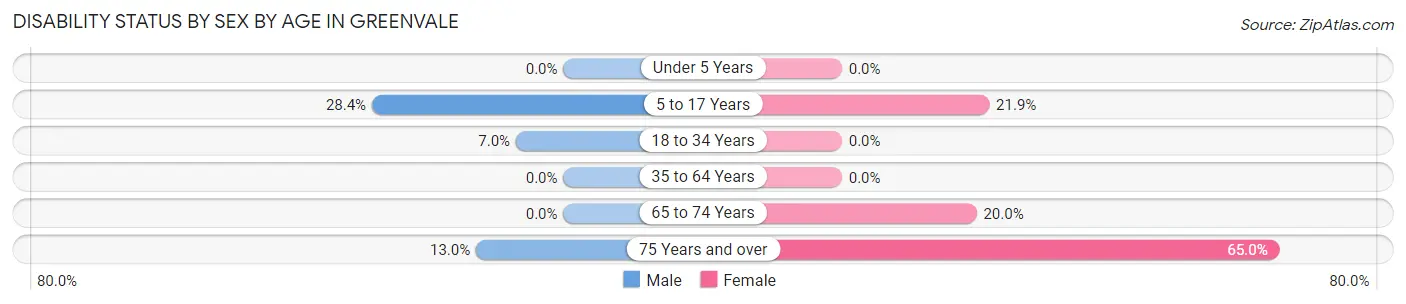
| Age Bracket | Male | Female |
| Under 5 Years | 0 (0.0%) | 0 (0.0%) |
| 5 to 17 Years | 27 (28.4%) | 7 (21.9%) |
| 18 to 34 Years | 15 (7.0%) | 0 (0.0%) |
| 35 to 64 Years | 0 (0.0%) | 0 (0.0%) |
| 65 to 74 Years | 0 (0.0%) | 34 (20.0%) |
| 75 Years and over | 14 (13.0%) | 13 (65.0%) |
Disability Class by Sex by Age in Greenvale
Disability Class: Hearing Difficulty
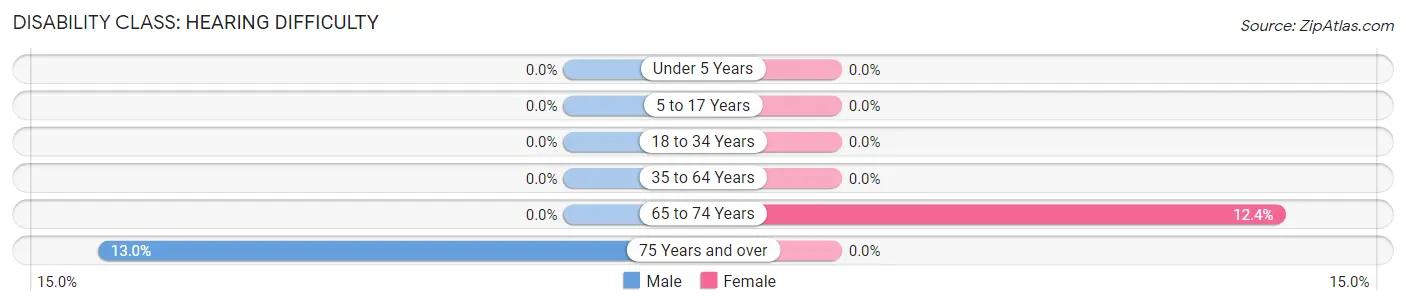
| Age Bracket | Male | Female |
| Under 5 Years | 0 (0.0%) | 0 (0.0%) |
| 5 to 17 Years | 0 (0.0%) | 0 (0.0%) |
| 18 to 34 Years | 0 (0.0%) | 0 (0.0%) |
| 35 to 64 Years | 0 (0.0%) | 0 (0.0%) |
| 65 to 74 Years | 0 (0.0%) | 21 (12.3%) |
| 75 Years and over | 14 (13.0%) | 0 (0.0%) |
Disability Class: Vision Difficulty
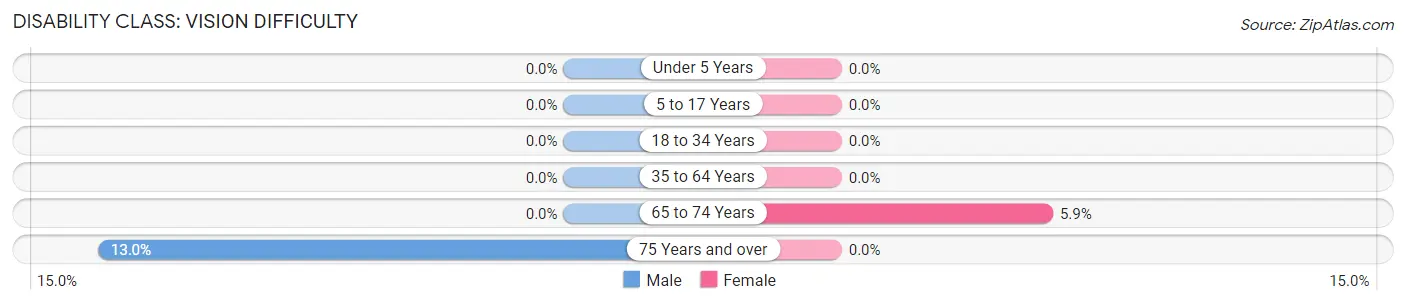
| Age Bracket | Male | Female |
| Under 5 Years | 0 (0.0%) | 0 (0.0%) |
| 5 to 17 Years | 0 (0.0%) | 0 (0.0%) |
| 18 to 34 Years | 0 (0.0%) | 0 (0.0%) |
| 35 to 64 Years | 0 (0.0%) | 0 (0.0%) |
| 65 to 74 Years | 0 (0.0%) | 10 (5.9%) |
| 75 Years and over | 14 (13.0%) | 0 (0.0%) |
Disability Class: Cognitive Difficulty
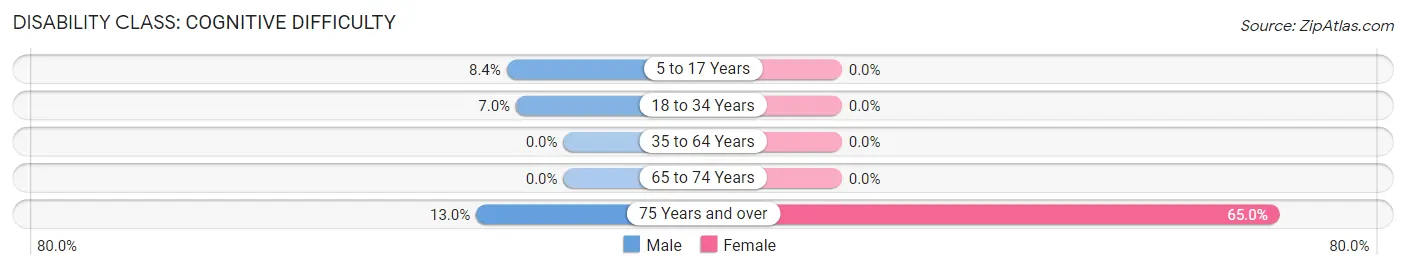
| Age Bracket | Male | Female |
| 5 to 17 Years | 8 (8.4%) | 0 (0.0%) |
| 18 to 34 Years | 15 (7.0%) | 0 (0.0%) |
| 35 to 64 Years | 0 (0.0%) | 0 (0.0%) |
| 65 to 74 Years | 0 (0.0%) | 0 (0.0%) |
| 75 Years and over | 14 (13.0%) | 13 (65.0%) |
Disability Class: Ambulatory Difficulty
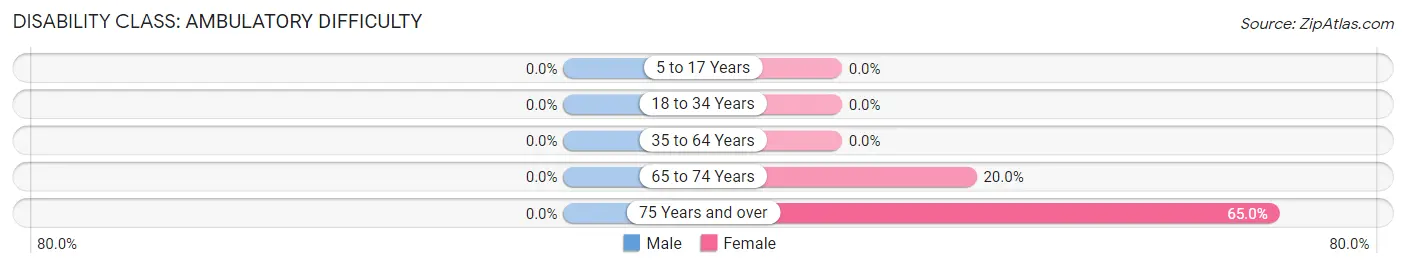
| Age Bracket | Male | Female |
| 5 to 17 Years | 0 (0.0%) | 0 (0.0%) |
| 18 to 34 Years | 0 (0.0%) | 0 (0.0%) |
| 35 to 64 Years | 0 (0.0%) | 0 (0.0%) |
| 65 to 74 Years | 0 (0.0%) | 34 (20.0%) |
| 75 Years and over | 0 (0.0%) | 13 (65.0%) |
Disability Class: Self-Care Difficulty
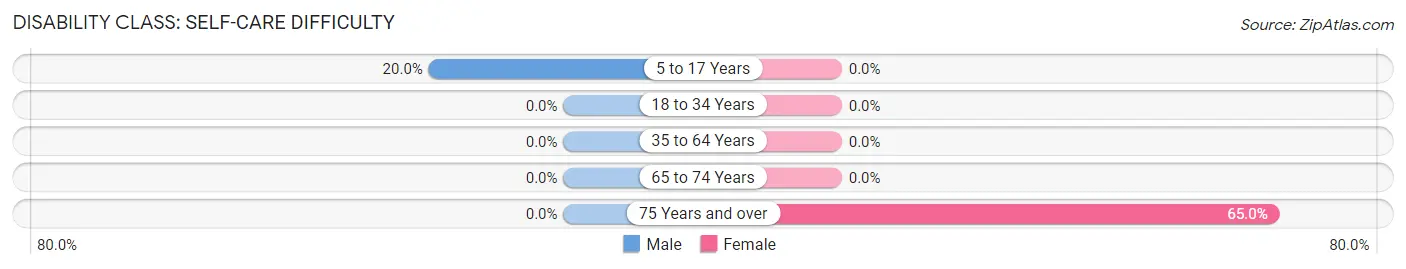
| Age Bracket | Male | Female |
| 5 to 17 Years | 19 (20.0%) | 0 (0.0%) |
| 18 to 34 Years | 0 (0.0%) | 0 (0.0%) |
| 35 to 64 Years | 0 (0.0%) | 0 (0.0%) |
| 65 to 74 Years | 0 (0.0%) | 0 (0.0%) |
| 75 Years and over | 0 (0.0%) | 13 (65.0%) |
Technology Access in Greenvale
Computing Device Access in Greenvale
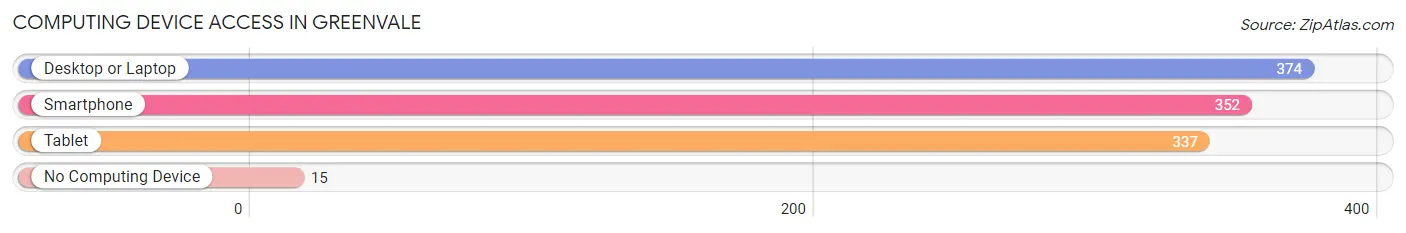
| Device Type | # Households | % Households |
| Desktop or Laptop | 374 | 96.1% |
| Smartphone | 352 | 90.5% |
| Tablet | 337 | 86.6% |
| No Computing Device | 15 | 3.9% |
| Total | 389 | 100.0% |
Internet Access in Greenvale
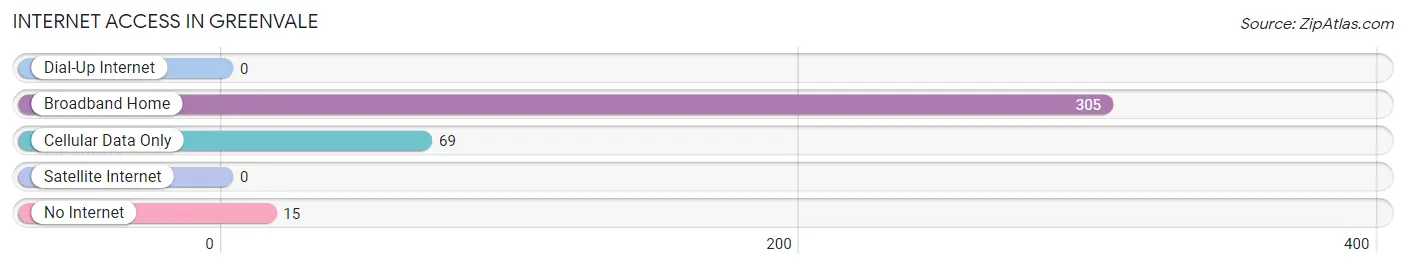
| Internet Type | # Households | % Households |
| Dial-Up Internet | 0 | 0.0% |
| Broadband Home | 305 | 78.4% |
| Cellular Data Only | 69 | 17.7% |
| Satellite Internet | 0 | 0.0% |
| No Internet | 15 | 3.9% |
| Total | 389 | 100.0% |
Greenvale Summary
History
Greenvale, New York is a small hamlet located in the Town of North Hempstead in Nassau County, New York. It is situated on the north shore of Long Island, approximately 25 miles east of Manhattan. The hamlet was originally part of the Matinecock Native American tribe’s land, and was first settled by Europeans in the late 1600s. The area was known as “Little Cow Neck” until the mid-1800s, when it was renamed Greenvale.
The hamlet was originally a farming community, with many of the original settlers being of Dutch and English descent. The area was known for its dairy farms, and the local economy was largely based on agriculture. In the late 1800s, the hamlet began to grow as a summer resort destination, with many wealthy New Yorkers building large estates in the area. This growth continued into the early 1900s, and by the 1920s, Greenvale had become a popular destination for wealthy New Yorkers looking to escape the hustle and bustle of the city.
The hamlet experienced a period of decline in the mid-1900s, as many of the wealthy residents moved away and the local economy shifted away from agriculture. However, in recent years, Greenvale has seen a resurgence in popularity, with many new residents moving to the area and businesses opening up.
Geography
Greenvale is located in the Town of North Hempstead in Nassau County, New York. It is situated on the north shore of Long Island, approximately 25 miles east of Manhattan. The hamlet is bordered by the villages of Great Neck and Manhasset to the west, and the hamlets of Roslyn and East Hills to the east.
The hamlet is situated on a small peninsula, with the Long Island Sound to the north and Hempstead Harbor to the south. The area is mostly flat, with some low hills in the western part of the hamlet. The climate in Greenvale is temperate, with mild winters and warm summers.
Economy
Greenvale’s economy is largely based on service industries, with many businesses located in the hamlet. These include restaurants, retail stores, professional services, and medical offices. The hamlet is also home to several corporate offices, including a regional office of the New York Stock Exchange.
The hamlet is also home to several educational institutions, including the Greenvale School District, which serves the hamlet and the surrounding area. The hamlet is also home to the Greenvale Country Club, which offers golf, tennis, and swimming facilities.
Demographics
As of the 2010 census, the population of Greenvale was 5,717. The racial makeup of the hamlet was 87.3% White, 5.2% Asian, 3.2% African American, and 2.3% Hispanic or Latino. The median household income was $117,917, and the median home value was $1,072,000.
The hamlet is home to a diverse population, with many different ethnic and religious backgrounds represented. The hamlet is also home to a large Jewish population, with many synagogues located in the area.
Conclusion
Greenvale, New York is a small hamlet located in the Town of North Hempstead in Nassau County, New York. It is situated on the north shore of Long Island, approximately 25 miles east of Manhattan. The hamlet was originally part of the Matinecock Native American tribe’s land, and was first settled by Europeans in the late 1600s. The area was known as “Little Cow Neck” until the mid-1800s, when it was renamed Greenvale. The hamlet has experienced a resurgence in popularity in recent years, with many new residents moving to the area and businesses opening up. The economy of Greenvale is largely based on service industries, with many businesses located in the hamlet. The hamlet is also home to a diverse population, with many different ethnic and religious backgrounds represented.
Common Questions
What is the Total Population of Greenvale?
Total Population of Greenvale is 1,164.
What is the Total Male Population of Greenvale?
Total Male Population of Greenvale is 680.
What is the Total Female Population of Greenvale?
Total Female Population of Greenvale is 484.
What is the Ratio of Males per 100 Females in Greenvale?
There are 140.50 Males per 100 Females in Greenvale.
What is the Ratio of Females per 100 Males in Greenvale?
There are 71.18 Females per 100 Males in Greenvale.
What is the Median Population Age in Greenvale?
Median Population Age in Greenvale is 47.6 Years.
What is the Average Family Size in Greenvale
Average Family Size in Greenvale is 3.2 People.
What is the Average Household Size in Greenvale
Average Household Size in Greenvale is 3.0 People.
What is Per Capita Income in Greenvale?
Per Capita income in Greenvale is $49,620.
What is the Median Family Income in Greenvale?
Median Family Income in Greenvale is $151,250.
What is Income or Wage Gap in Greenvale?
Income or Wage Gap in Greenvale is 47.8%.
Women in Greenvale earn 52.2 cents for every dollar earned by a man.
What is Inequality or Gini Index in Greenvale?
Inequality or Gini Index in Greenvale is 0.57.
How Large is the Labor Force in Greenvale?
There are 506 People in the Labor Forcein in Greenvale.
What is the Percentage of People in the Labor Force in Greenvale?
48.1% of People are in the Labor Force in Greenvale.
What is the Unemployment Rate in Greenvale?
Unemployment Rate in Greenvale is 11.1%.